Production Capabilities Decision Making: Biopharama, Inc...
9
International Journal of Humanities and Social Science Vol. 3 No. 16 [Special Issue – August 2013] 241 Production Capabilities Decision Making: Biopharama, Inc, Study Case Dr. S. Rick Fernandez Center for Innovation and Knowledge Management School of Management Shanghai University 99 Shangda Road, Shanghai 200444, China Dr. J. Pablo Betancur School of Management Science & Engineering TSinghua University Qinghua West Road, Haidian100084, Beijing, China Abstract This paper considers two enterprises at different countries that engage in joint production to reduce several costs. The prospect of repeated integration of simulated introduces dynamics, in that actions that enterprises take today influence the costliness and effectiveness of different actions in the close future. Repeated interaction also facilitates the use of informal agreements, but by the ongoing value system of the strategic network relationship. Authors characterize the optimal network agreement in this dynamic commercial platform. Authors show that an optimal commercial platform has a simple form that does not depend on the last period. The optimal commercial platform may require that the enterprises terminate their network with positive probability following poor performance. Authors show how process visibility, which allows the enterprises to better assess that is at fault, can substantially improve commercial network performance. The degree to which process visibility eliminates the prohibit regulation on the nature of the dynamics: If the buyer's action does not influence the dynamics, the need for termination is eliminated; otherwise, termination may be required a commercial integration. Keywords: Production, Biopharma, Network, Decision Making, Capacity. 1. Background Description, Problem Settings And Assumptions 1.1 Background Description (for complete version see Appendix A) In 2005, Biopharma Inc. had experienced a steep decline in profits and very high costs at its plants in Germany and Japan. The president of the company for worldwide operation knew the demand for the company products was stable across the globe, as result the surplus capacity in his global network looked like luxury that he can’t longer affordBrunsson, Nils (1982). Any improvement in financial performance was dependent on having the most efficient network in place because revenues were unlikely to grow. Biopharma is global manufacturers of bulk chemicals used in pharmaceutical industry. The company holds patent on two chemicals that are called Highcal and Relax internally. The chemicals are used internally and are also sold to others drug manufacturers. .
Transcript of Production Capabilities Decision Making: Biopharama, Inc...

International Journal of Humanities and Social Science Vol. 3 No. 16 [Special Issue – August 2013]
241
Production Capabilities Decision Making: Biopharama, Inc, Study Case
Dr. S. Rick Fernandez
Center for Innovation and Knowledge Management School of Management
Shanghai University 99 Shangda Road, Shanghai 200444, China
Dr. J. Pablo Betancur
School of Management Science & Engineering TSinghua University
Qinghua West Road, Haidian100084, Beijing, China Abstract
This paper considers two enterprises at different countries that engage in joint production to reduce several costs. The prospect of repeated integration of simulated introduces dynamics, in that actions that enterprises take today influence the costliness and effectiveness of different actions in the close future. Repeated interaction also facilitates the use of informal agreements, but by the ongoing value system of the strategic network relationship. Authors characterize the optimal network agreement in this dynamic commercial platform. Authors show that an optimal commercial platform has a simple form that does not depend on the last period. The optimal commercial platform may require that the enterprises terminate their network with positive probability following poor performance. Authors show how process visibility, which allows the enterprises to better assess that is at fault, can substantially improve commercial network performance. The degree to which process visibility eliminates the prohibit regulation on the nature of the dynamics: If the buyer's action does not influence the dynamics, the need for termination is eliminated; otherwise, termination may be required a commercial integration.
Keywords: Production, Biopharma, Network, Decision Making, Capacity.
1. Background Description, Problem Settings And Assumptions
1.1 Background Description (for complete version see Appendix A)
In 2005, Biopharma Inc. had experienced a steep decline in profits and very high costs at its plants in Germany and Japan. The president of the company for worldwide operation knew the demand for the company products was stable across the globe, as result the surplus capacity in his global network looked like luxury that he can’t longer affordBrunsson, Nils (1982). Any improvement in financial performance was dependent on having the most efficient network in place because revenues were unlikely to grow. Biopharma is global manufacturers of bulk chemicals used in pharmaceutical industry. The company holds patent on two chemicals that are called Highcal and Relax internally. The chemicals are used internally and are also sold to others drug manufacturers. .
The Special Issue on Commerce and Social Science © Center for Promoting Ideas, USA www.ijhssnet.com
242
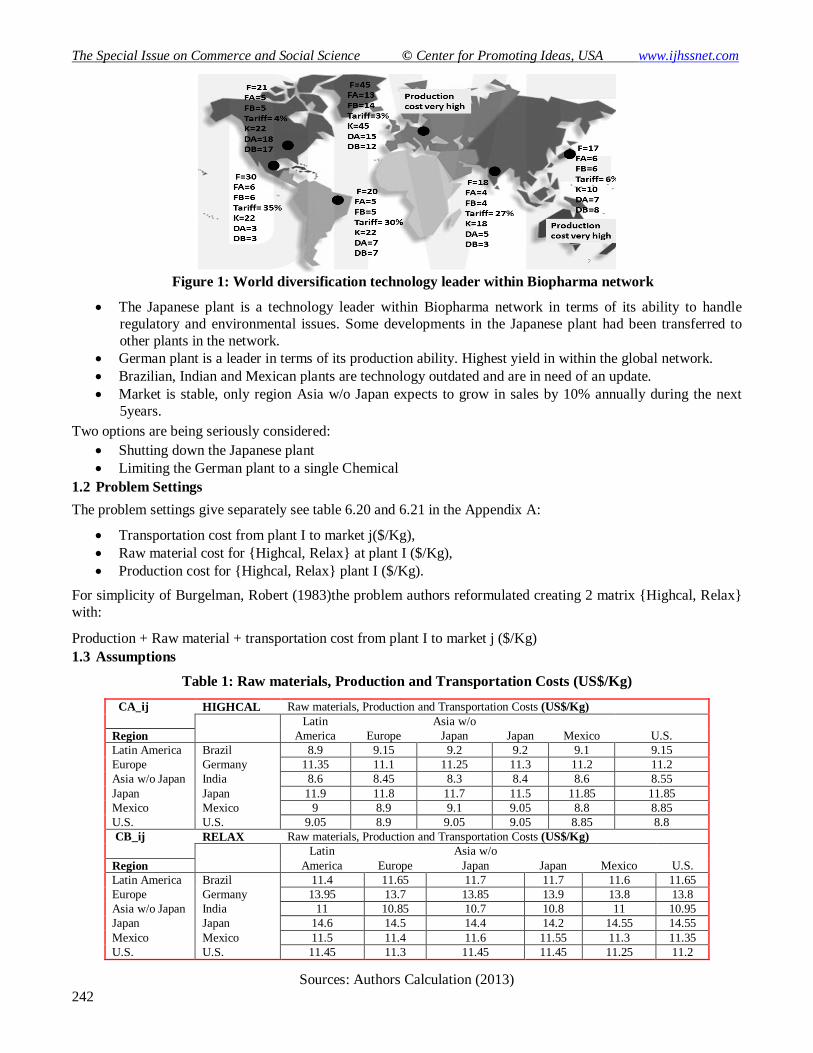
Figure 1: World diversification technology leader within Biopharma network
The Japanese plant is a technology leader within Biopharma network in terms of its ability to handle regulatory and environmental issues. Some developments in the Japanese plant had been transferred to other plants in the network.
German plant is a leader in terms of its production ability. Highest yield in within the global network. Brazilian, Indian and Mexican plants are technology outdated and are in need of an update. Market is stable, only region Asia w/o Japan expects to grow in sales by 10% annually during the next
5years.
Two options are being seriously considered:
Shutting down the Japanese plant Limiting the German plant to a single Chemical
1.2 Problem Settings
The problem settings give separately see table 6.20 and 6.21 in the Appendix A:
Transportation cost from plant I to market j($/Kg), Raw material cost for {Highcal, Relax} at plant I ($/Kg), Production cost for {Highcal, Relax} plant I ($/Kg).
For simplicity of Burgelman, Robert (1983)the problem authors reformulated creating 2 matrix {Highcal, Relax} with:
Production + Raw material + transportation cost from plant I to market j ($/Kg)
1.3 Assumptions
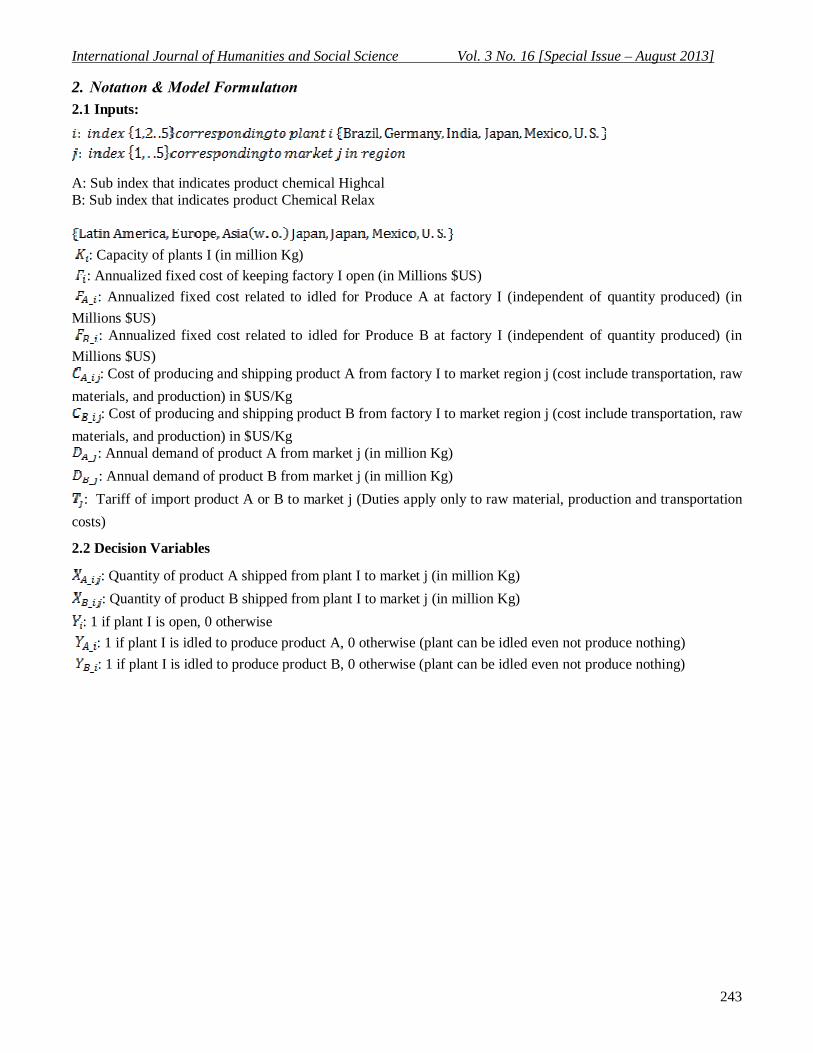
Table 1: Raw materials, Production and Transportation Costs (US$/Kg)
CA_ij HIGHCAL Raw materials, Production and Transportation Costs (US$/Kg) Latin Asia w/o Region America Europe Japan Japan Mexico U.S. Latin America Brazil 8.9 9.15 9.2 9.2 9.1 9.15 Europe Germany 11.35 11.1 11.25 11.3 11.2 11.2 Asia w/o Japan India 8.6 8.45 8.3 8.4 8.6 8.55 Japan Japan 11.9 11.8 11.7 11.5 11.85 11.85 Mexico Mexico 9 8.9 9.1 9.05 8.8 8.85 U.S. U.S. 9.05 8.9 9.05 9.05 8.85 8.8 CB_ij RELAX Raw materials, Production and Transportation Costs (US$/Kg) Latin Asia w/o Region America Europe Japan Japan Mexico U.S. Latin America Brazil 11.4 11.65 11.7 11.7 11.6 11.65 Europe Germany 13.95 13.7 13.85 13.9 13.8 13.8 Asia w/o Japan India 11 10.85 10.7 10.8 11 10.95 Japan Japan 14.6 14.5 14.4 14.2 14.55 14.55 Mexico Mexico 11.5 11.4 11.6 11.55 11.3 11.35 U.S. U.S. 11.45 11.3 11.45 11.45 11.25 11.2
Sources: Authors Calculation (2013)
International Journal of Humanities and Social Science Vol. 3 No. 16 [Special Issue – August 2013]
243
2. Notatıon & Model Formulatıon
2.1 Inputs:
A: Sub index that indicates product chemical Highcal B: Sub index that indicates product Chemical Relax
: Capacity of plants I (in million Kg) : Annualized fixed cost of keeping factory I open (in Millions $US)
: Annualized fixed cost related to idled for Produce A at factory I (independent of quantity produced) (in Millions $US)
: Annualized fixed cost related to idled for Produce B at factory I (independent of quantity produced) (in Millions $US)
: Cost of producing and shipping product A from factory I to market region j (cost include transportation, raw materials, and production) in $US/Kg
: Cost of producing and shipping product B from factory I to market region j (cost include transportation, raw materials, and production) in $US/Kg
: Annual demand of product A from market j (in million Kg) : Annual demand of product B from market j (in million Kg)
: Tariff of import product A or B to market j (Duties apply only to raw material, production and transportation costs)
2.2 Decision Variables
: Quantity of product A shipped from plant I to market j (in million Kg) : Quantity of product B shipped from plant I to market j (in million Kg)
: 1 if plant I is open, 0 otherwise : 1 if plant I is idled to produce product A, 0 otherwise (plant can be idled even not produce nothing) : 1 if plant I is idled to produce product B, 0 otherwise (plant can be idled even not produce nothing)
The Special Issue on Commerce and Social Science © Center for Promoting Ideas, USA www.ijhssnet.com
244
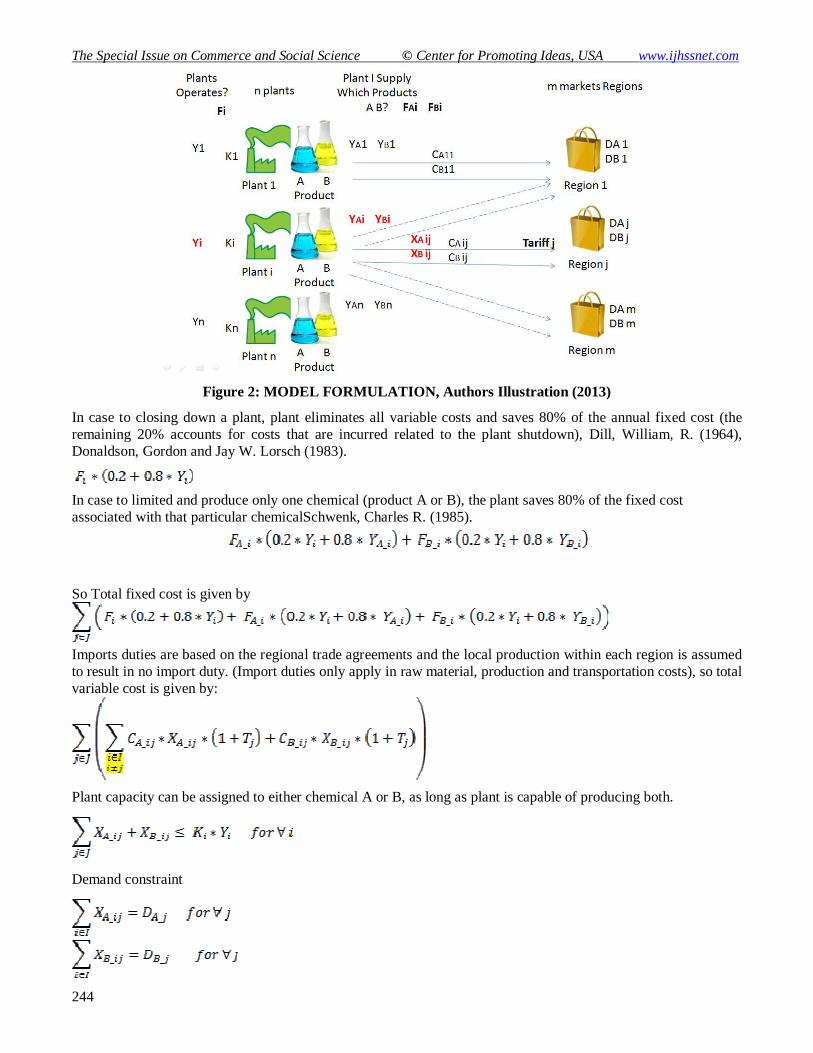
Figure 2: MODEL FORMULATION, Authors Illustration (2013)
In case to closing down a plant, plant eliminates all variable costs and saves 80% of the annual fixed cost (the remaining 20% accounts for costs that are incurred related to the plant shutdown), Dill, William, R. (1964), Donaldson, Gordon and Jay W. Lorsch (1983).
In case to limited and produce only one chemical (product A or B), the plant saves 80% of the fixed cost associated with that particular chemicalSchwenk, Charles R. (1985).
So Total fixed cost is given by
Imports duties are based on the regional trade agreements and the local production within each region is assumed to result in no import duty. (Import duties only apply in raw material, production and transportation costs), so total variable cost is given by:
Plant capacity can be assigned to either chemical A or B, as long as plant is capable of producing both.
Demand constraint
International Journal of Humanities and Social Science Vol. 3 No. 16 [Special Issue – August 2013]
245
For secure XAij to be 0 when YAi=0, and secure XBij to be 0 when YBi=0
More constraints
2.3 Model completed
2.3.1 Objective Function: Minimize Z: (total cost) (in million $US)
Subject to:
See appendix Biopharma.xlsx the Excel file Sheet “LP_model”
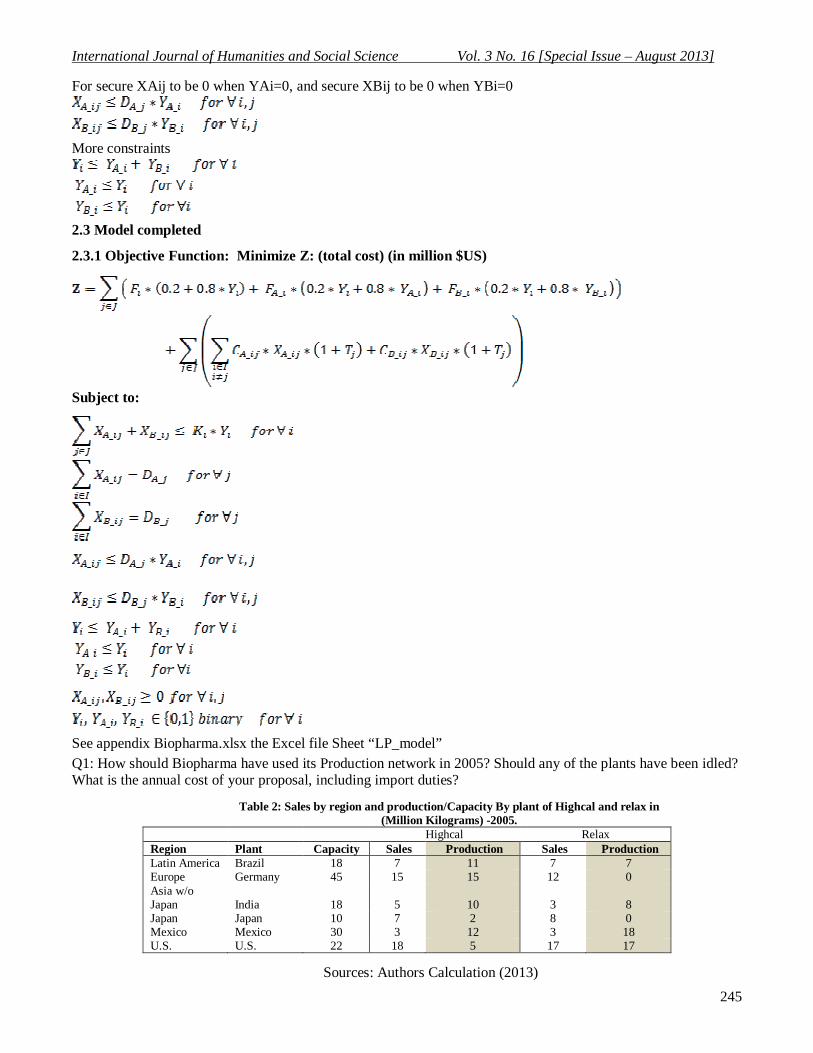
Q1: How should Biopharma have used its Production network in 2005? Should any of the plants have been idled? What is the annual cost of your proposal, including import duties?
Table 2: Sales by region and production/Capacity By plant of Highcal and relax in
(Million Kilograms) -2005. Highcal Relax
Region Plant Capacity Sales Production Sales Production Latin America Brazil 18 7 11 7 7 Europe Germany 45 15 15 12 0 Asia w/o Japan India 18 5 10 3 8 Japan Japan 10 7 2 8 0 Mexico Mexico 30 3 12 3 18 U.S. U.S. 22 18 5 17 17
Sources: Authors Calculation (2013)

The Special Issue on Commerce and Social Science © Center for Promoting Ideas, USA www.ijhssnet.com
246
With a Given Production the model add two more constraints
: Production of product A at plants I (in million Kg) : Production of product B at plants I (in million Kg)
A1: See appendix Biopharma.xlsx the Excel file Sheet “LP_model_Q1”
3. Solutıon Methods & Results
How should Biopharma have used its Production network in 2005?
Table 3: XA_ij, Production network
XA_ij in million Kg
Latin Asia w/o In million Kg America Europe Japan Japan Mexico U.S. production Yi YA_i Brazil 7 0 0 0 0 4 11 1 1 Germany 0 15 0 0 0 0 15 1 1 India 0 0 5 5 0 0 10 1 1 Japan 0 0 0 2 0 0 2 1 1 Mexico 0 0 0 0 3 9 12 1 1 U.S. 0 0 0 0 0 5 5 1 1 DA_j 7 15 5 7 3 18 55
Sources: Authors Calculation (2013)
Table 4: XB_ij, Production network
XB_ij in million Kg
Latin Asia w/o
in million Kg
America Europe Japan Japan Mexico U.S. Produc-
tion Yi YB_i Brazil 7 0 0 0 0 0 7 1 1 Germany 0 0 0 0 0 0 0 1 0 India 0 0 3 5 0 0 8 1 1 Japan 0 0 0 0 0 0 0 1 0 Mexico 0 12 0 3 3 0 18 1 1 U.S. 0 0 0 0 0 17 17 1 1 DB_j 7 12 3 8 3 17 50
Sources: Authors Calculation (2013)
German plant Limited to produce only A Japanese plant Limited to produce only A The German plant has enough capacityMcNamara, G., P. Bromiley. 1997 to supply Europe Market product A, but production, raw material cost are too high. For product B, European market is supply by the Mexican plant.
The Japanese plant, for product A and B always received supplies from India, but plant in India has low capacity so can’t supply Japanese market.
Should any of the plants have been idled?
• Two options are being seriously considered: – Shutting down the Japanese plant – Limiting the German plant to a single Chemical
• Market is stable, only region Asia w/o Japan expects to grow in sales by 10% annually during the next 5years.

International Journal of Humanities and Social Science Vol. 3 No. 16 [Special Issue – August 2013]
247
Table 5: Plant Capacity
in million Kg PRODUCTION Plant Capacity Extra PA PB
Brazil 18 0 11 7 Germany 45 30 15 0
India 18 0 10 8 Japan 10 8 2 0
Mexico 30 0 12 18 U.S. 22 0 5 17
Totals 143 38 55 50
Sources: Authors Calculation (2013)
Surplus capacity is noted only in Japan and Germany, and the only market expected to grow 10% (0.3) is Asia w/o Japan, IncreaseRyan, A. M., L. McFarland, H. Baron, R. Page. 1999 capacity at Indian plant is an option for future. Indian plant supplies great percent of Japan Market.
Table 6: Raw materials, Production and Transportation Costs
RELAX Raw materials, Production and Transportation Costs (US$/Kg) Plant Highcal Relax
CB_ij Latin Asia w/o Fixed Cost
Fixed Cost
Fixed Cost
America Europe Japan Japan Mexico U.S. Fi FA_i FB_i Brazil 11.4 11.65 11.7 11.7 11.6 11.65 20 5 5 Germany 13.95 13.7 13.85 13.9 13.8 13.8 45 13 14 India 11 10.85 10.7 10.8 11 10.95 18 4 4 Japan 14.6 14.5 14.4 14.2 14.55 14.55 17 6 6 Mexico 11.5 11.4 11.6 11.55 11.3 11.35 30 6 6 U.S. 11.45 11.3 11.45 11.45 11.25 11.2 21 5 5
Sources: Authors Calculation (2013)
Fixed cost for Product B in Japanese Plant is lower than in German plant, so Japan plant will be idled for product B, and German plant will be limited to produce only product ASutcliffe KM, McNamara G. 2001. What is the annual cost of your proposal, including import duties? Adding the idled for product B at Japanese plant the Total cost is given by (in million $US):
Table 7: annual cost of the proposal
With idled Japanese plant product B
VarCost 1100.193 1100.193 Fixed Cost 214 + 4.8 = 218.8
(0.8*FB_Japan)
Total Cost 1314.193 1318.993 Sources: Authors Calculation (2013)
4. Conclusıon
As authors reviewed the decision analysis on this issue that have appeared in Supply Chain Management, authors have been impressed with the depth, quality, and result of decision analysis research that has supported by several in the journal. In highlighting the problem of the Supply Chain Management book, have omitted many important articles that appeared in Management Supply Chain but did not fit clearly into the research solution streams that authors chose to emphasize, as well as many important contributions published elsewhere. My choice of topics was intended to make a methods solution on decision-making research builds on the foundations of normative and descriptive research on decision-making.
In million $ US

The Special Issue on Commerce and Social Science © Center for Promoting Ideas, USA www.ijhssnet.com
248
References
Brunsson, Nils (1982), "The Irrationality of Action and Action Ratio- nality: Decisions, Ideologies and Organizational Actions," Jour- nal of Management Studies, 19, 30-43.
Burgelman, Robert (1983), "A Process Model of Internal Corporate Venturing in the Diversified Major Firm," Administrative Science Quarterly, 28, 223-244.
Dill, William, R. (1964), "Varieties of Administrative Decisions," in H. A. Leavitt and L. R. Pondy (Eds.), Readings in Managerial Psychology, Chicago, IL: University of Chicago Press, 457-473.
Donaldson, Gordon and Jay W. Lorsch (1983), Decision Making at the Top: The Shaping of Strategic Direction, New York: Basic Books.
Schwenk, Charles R. (1985), "The Use of Participant Recollection in the Modeling of Organizational Decision Processes," Academy of Management Review, 10, 496-503.
McNamara, G., P. Bromiley. 1997. Decision making in an organiza- tional setting: Cognitive and organizational influences on risk as- sessment in commercial lending. Acad. Management J. 40(5) 1063-1088.
Ryan, A. M., L. McFarland, H. Baron, R. Page. 1999. An international look at selection practices: Nation and culture as explanations for variability in practice. Personnel Psych. 52(2) 359-391.
Sutcliffe KM, McNamara G. 2001. Controlling decision making practice in organizations. Organization Science 12: 484-501.
Schilling, M. A., H. K. Steensma. 2001. The use of modular organi- zational forms: An industry-level analysis. Acad. Management J. 44 1149-1168.
Romme, A. G. L. 2003. Making a difference: Organization as design. Organ. Sci. 14 558-573. Perlow, L. A., G. A. Okhuysen, N. P. Repenning. 2002. The speed trap: Exploring the relationship between
decision making and temporal context. Acad. Management J. 45 931-955. Appendıx A: Data Tables
Table 8: Sales by region and production/Capacity By plant of Highcal and relax in (Million Kilograms) -2005
Highcal Relax Region Plant Capacity Sales Production Sales Production Latin America Brazil 18 7 11 7 7 Europe Germany 45 15 15 12 0 Asia w/o Japan India 18 5 10 3 8 Japan Japan 10 7 2 8 0 Mexico Mexico 30 3 12 3 18 U.S. U.S. 22 18 5 17 17
Sources: Authors Calculation (2013)
Table 9: Fixed and variable Production cost at each Biopharma Plant in 2005(US$)
Plant Highcal Relax Highcal Relax
Fixed Cost Fixed Cost Fixed Cost Raw
Material Production
cost Raw
Material Production
cost
(milliions
$) (milliions
$) (milliions $) ($/Kg) ($/Kg) ($/Kg) ($/Kg) Brazil 20 5 5 3.6 5.1 4.6 6.6 Germany 45 13 14 3.9 7 5 8.5 India 18 4 4 3.6 4.5 4.5 6 Japan 17 6 6 3.9 7.5 5.1 9 Mexico 30 6 6 3.6 5 4.6 6.5 U.S. 21 5 5 3.6 5 4.5 6.5
Sources: Authors Calculation (2013)

International Journal of Humanities and Social Science Vol. 3 No. 16 [Special Issue – August 2013]
249
Table 10: Transportation Costs from plants to markets (US$/Kg)
Latin Asia w/o America Europe Japan Japan Mexico U.S. Brazil 0.2 0.45 0.5 0.5 0.4 0.45 Germany 0.45 0.2 0.35 0.4 0.3 0.3 India 0.5 0.35 0.2 0.3 0.5 0.45 Japan 0.5 0.4 0.3 0.1 0.45 0.45 Mexico 0.4 0.3 0.5 0.45 0.2 0.25 U.S. 0.45 0.3 0.45 0.45 0.25 0.2
Sources: Authors Calculation (2013)
Table 11: Import Tariffs (Percent of Values of Product Imported, Including Transportation)
Latin Asia w/o America Europe Japan Japan Mexico U.S.
30% 3% 27% 6% 35% 4%
Sources: Authors Calculation (2013)
Table 12: History of Exchange Rates in Currency/US$1(at the Beginning of each year)
Brazilian Indian Japanese Mexican U.S, real Euro Rupee Yen Peso Dollar
2005 2.7 0.74 43.47 103.11 11.21 1 2004 2.9 0.8 45.6 107 11.22 1 2003 3.5 0.96 48 119.25 10.38 1 2002 2.3 1.11 48.27 131.76 9.12 1 2001 1.95 1.06 46.75 114.76 9.72 1 2000 1.81 0.99 43.55 102.33 9.48 1
Sources: Authors Calculation (2013)