Ruminants´ production within Agroforestry systems in rural Rwanda

PRODUCTION AND MARKETING SYSTEMS OF SMALL RUMINANTS IN
GOMA DISTRICT OF JIMMA ZONE, WESTERN ETHIOPIA
M. Sc. Thesis
BELETE SHENKUTE GEMEDA
Hawassa University, Awassa
APRIL, 2009

PRODUCTION AND MARKETING SYSTEMS OF SMALL RUMINANTS IN
GOMA DISTRICT OF JIMMA ZONE, WESTERN ETHIOPIA
BELETE SHENKUTE GEMEDA
A THESIS SUBMITTED TO THE
DEPARTMENT OF ANIMAL AND RANGE SCIENCES,
COLLEGE OF AGRICULTURE, SCHOOL OF GRADUATE STUDIES
HAWASSA UNIVERSITY
AWASSA, ETHIOPIA
IN PARTIAL FULFILLMENT OF THE
REQUIREMENTS FOR
THE DEGREE OF
MASTER OF SCIENCE IN ANIMAL AND RANGE SCIENCES
(SPECIALIZATION: ANIMAL PRODUCTION)
APRIL, 2009

iii
APPROVAL SHEET 1 OF THE THESIS
SCHOOL OF GRADUATE STUDIES
HAWASSA UNIVERSITY
This is to certify that the thesis entitled Production and Marketing Systems of Small
Ruminants in Goma District of Jimma Zone, Western Ethiopia, submitted in partial fulfillment
of the requirements for the degree of Master of Sciences in Animal and Range Sciences with
specialization in Animal Production of the graduate program of the Department of Animal and
Range Sciences, College of Agriculture, and is a record of original research carried out by
Belete Shenkute Gemeda ID No AWR/0034/00 under my supervision, and no part of the
thesis has been submitted for any other degree or diploma.
The assistance and help received during the course of this investigation have been duly
acknowledged. Therefore, I recommend that it be accepted as fulfilling the thesis
requirements.
Dr. Getahun Legesse ------------------------------- -------------------
Name of major advisor Signature Date
Dr. Azage Tegegne --------------------------------- -------------------
Name of co-advisor Signature Date
iv
APPROVAL SHEET 2 OF THE THESIS
SCHOOL OF GRADUATES STUDIES
HAWASSA UNIVERSITY
We, the undersigned members of the Board of Examiners of the final open defense, by Belete
Shenkute Gemeda have read and evaluated his thesis entitled “Production and Marketing
Systems of Small Ruminants in Goma District of Jimma Zone, Western Ethiopia” and
examined the candidate. This is therefore to certify that the thesis has been accepted in partial
fulfillment of the requirements for the degree of: Master of Science in Animal Sciences with
specialization in Animal Production, College of Agriculture.
__________________________ _________________ _____________
Name of Chairman, Signature Date
__________________________ _________________ _____________
Name of Major Advisor Signature Date
__________________________ _________________ _____________
Name of Co-advisor Signature Date
__________________________ _________________ _____________
Name of Internal Examiner Signature Date
__________________________ _________________ _____________
Name of External Examiner Signature Date
Final approval and acceptance of the thesis is contingent upon the submission of the final copy
of the thesis to the Council of Graduate Studies (CGS) through the Departmental Graduate
Committee (DGC) of the candidate’s major department.

iii
ACKNOWLEDGEMENTS First and for most, I would like to express my sincere gratitude to my research advisors, Dr.
Getahun Legesse and Dr. Azage Tegegne for their invaluable comments and professional
guidance. I express my deepest and heart-felt gratitude to my major advisor, Dr. Getahun
Legesse for his utmost cooperation, concrete suggestions, valuable criticism and assistance.
His dedication and scientific commitment taught me a lot. God bless him so much. I express
my deepest and heart-felt gratitude to Dr. Azage Tegegne, my ILRI supervisor. I would also
like to extend my sincere gratitude to Dr. Girma Abebe for proper guidance during the project
design and fieldwork.
I like to express my gratitude to the Goma small ruminant owners for allowing me to use the
required number of sheep and goat for my monitoring work and for devoting their precious
time in providing the required information through the designed questionnaire. Indeed, their
cooperation was critical and this work would not have been possible without their
willingness.
My thanks also go to Improving Productivity and Market Success (IPMS/ILRI) project for the
financial and facility supports to the study.
My sincere thanks are also extended to Adami Tullu Agricultural Research Center, Oromia
Agricultural Research Institute for offering me with the opportunity to study.

iv
Goma Woreda Oromia agricultural and rural development office and Goma Pilot Learning
Woreda IPMS project provided supports during the field data collection and are duly
acknowledged.
I would like to pass my heartfelt thanks for Dr. Abule Ebro for his kind help from inception
of this work to completion. His valuable advice encouraged me a lot.
My thank goes to Muluhiwot Getachew and Birke Enyew of IPMS for their understanding
and settlement of budget and logistics.
I would like to express my heart felt thanks to Yishak Beredo, Habtamu Tiruneh, Fikiru
Abdisa, Endale Ayele, Gemechu Tekle, Bedri Tamam, Kedir Habib, Abedela Abbafita,
Hussen Abbamacaa, Anuwer Mohamod Nur, Mekonen Bekele and Yeshi Mengistu for their
cooperation and assistance in data collection.
I would express my most profound appreciation to my wife, Yenenesh Gizachew, for her
love, prayer, continuous encouragement and support throughout my study period.
Above all for all my achievements and coming to this end, I give glory to Savior Lord.

v
DEDICATION
To my father Shenkute Gemeda and my mother Britukan Tilaye.

vi
DECLARATION
I declare that this thesis is my original work and that all sources of material that are used for
this thesis have been duly acknowledged. This thesis is submitted in partial fulfillment of the
requirements for an MSc degree at Hawassa University and is deposited at the university
library to be made available to borrowers under rules of the library. I solemnly declare that
this thesis is not submitted to any other institution anywhere for the awards of any academic
degree, diploma, or certificate.
Brief quotations from this thesis are allowable without special permission provided that
accurate acknowledgment of source is made. Request for this manuscript in whole or in part
may be granted by the head of the major department or the Dean of the School of Graduate
Studies when in his or her judgment the proposed use of the material is in the interest of
scholarship. In all other instances, however, permission must be obtained from the Author.

vii
LIST OF ABBREVATIONS
ANOVA Analysis of Variances
ADG Average daily gains
CSA Central Statistical Authority
DA Development Agents
EARO Ethiopian Agricultural Research Organization
FAO Food and Agriculture Organization of the United Nations
GOs Governmental Organizations
Ha Hectare
HHs Households
ILCA International Livestock Center for Africa
ILRI International Livestock Research Institute
IPMS Improving Productivity and Market Success of Ethiopian Farmers
Kg Kilogram
M a.s.l. Meters above sea level
NGOs Non Governmental Organizations
OoARD Office of Agriculture and Rural Development
SNNPRS Southern Nations Nationalities and Peoples Regional State
SPSS Statistical Package for Social Sciences

viii
TABLE OF CONTENTS PAGE ACKNOWLEDGEMENTS ...................................................................................................... iii
LIST OF ABBREVATIONS ................................................................................................... vii
ABSTRACT ............................................................................................................................ xiii
1. INTRODUCTION .................................................................................................................. 1
2. LITERATURE REVIEW ....................................................................................................... 5
2.1 Genetic diversity and distribution of small ruminant in Ethiopia ..................................... 5
2.2 Role of small ruminant in livelihoods of small holder farmers in Ethiopia ..................... 7
2.3 Small ruminant production systems in Ethiopia ............................................................... 9
2.4 Reproductive and growth performance of small ruminant in Ethiopia .......................... 10
2.4.1 Age at first parturition (AFP) .................................................................................. 11
2.4.2 Parturition interval ................................................................................................... 13
2.4.3 Litter size ................................................................................................................. 14
2.4.4 Growth performances .............................................................................................. 15
2.5 Small ruminant marketing in Ethiopia ............................................................................ 18
2.6 Small ruminant production constraints ........................................................................... 21
2.6.1 Feed shortage ........................................................................................................... 21
2.6.2 Health constraints .................................................................................................... 22
2.6.3 Water shortage ......................................................................................................... 22
2.6.4 Marketing constraints .............................................................................................. 23
3. MATERIALS AND METHODS.......................................................................................... 24
3.1. Description of the Study Area ........................................................................................ 24
3.1.1. Geographical location ............................................................................................ 24
3.1.2 The natural resource base ........................................................................................ 24
3.1.3. Agro-ecology .......................................................................................................... 26
3.1.4 Farming systems ...................................................................................................... 27
3.1.5. Demographic structure ............................................................................................ 28
3.2. Reaserch desigh,sampling and data collection……...…………………………………28
3.3 Data analysis ................................................................................................................... 30

ix
4. RESULTS AND DISCUSSON ............................................................................................ 32
4.1 Socio-economic characteristics of the households .......................................................... 32
4.1.1 Household characteristics……………………………….…………………….......37
4.1.2 Land holding and its allocation ............................................................................... 37
4.1.3 Household ownership of different livestock species ............................................... 37
4.2 Small ruminant production system .................................................................................. 38
4.2.1 Flock structure and production objectives .............................................................. 38
4.2.2 Feeds and feeding systems ...................................................................................... 41
4.2.3 Reasons for tethering sheep and goats .................................................................... 41
4.2.4 Feed shortage ........................................................................................................... 41
4.2.5 Water sources and utilization .................................................................................. 53
4.2.6 Small ruminant management and husbandry .......................................................... 56
4.2.7. Consumption of small ruminant and their products ................................................ 64
4.2.8 Productive performances of small ruminants .......................................................... 66
4.2.9 Small ruminant health and diseases ........................................................................ 77
4.3 Marketing of small ruminants .......................................................................................... 83
4.3.1. Market places ........................................................................................................ 83
4.3.2 Market participants ................................................................................................. 85
4.3.3 Small ruminants marketing channels and routes .................................................... 87
4.3.4 Small ruminant fattening and marketing ................................................................ 90
4.3.5 Mode of marketing and price setting ...................................................................... 97
4.4 Extension, cooperatives and credit services for small ruminant production ................... 98
4.5 Gender and labor allocation in sheep and goat management ........................................... 99
4.6 Constraints and opportunities of small ruminant production and marketing ................. 102
5. SUMMARY AND CONCLUSIONS ................................................................................. 106
REFERENCES ....................................................................................................................... 113
APPENDICES ........................................................................................................................ 129

x
LISTS OF TABLES PAGES
Table 1. Age at first parturition of some breeds of Ethiopian sheep and goats. ....................... 12
Table 2. Parturition interval (PI) of some breeds of Ethiopian sheep and goats. .................... 14
Table 3. Litter size of some breeds of Ethiopian sheep and goats ............................................ 15
Table 4. The birth weight, weaning weight and average daily gains of some selected breeds. 17
Table 5. Some socio-economic characteristics of the studied household heads shown by small
ruminant density group. . ............................................................................................... 33
Table 6. Distribution of the studied household members by age, sex, and educational status. .34
Table 7.Mean (standard error) for land holding and its distribution for grazing and crop
by small ruminant density groups ................................................................................. 38
Table 8. Mean (standard error) number of livestock holding/household in the three areas
categorized according to small ruminant density. ......................................................... 38
Table 9. Purpose of keeping the small ruminants and ranked by owners in the study area. .... 41
Table 10.Grazing management of sheep and goats by small ruminant density groups. ........... 46
Table 11. Season and frequency of supplementation of small ruminants in three areas. . ....... 49
Table 12. Reasons for tether feeding of sheep and goats reported by households . ................. 50
Table 13. The relative importance of various reasons for the prevailing feed shortage as
suggested by households in the three studied areas classified according to the density
of small ruminants. ....................................................................................................... 52
Table 14. Watering frequency of sheep and goats in three areas classified by small ruminant
density groups. ............................................................................................................... 55
Table 15. Reasons of housing small ruminants by households . .............................................. 57
Table 16.Types of houses where small ruminants are confined during night for protection .. 58
Table 17. Reasons for culling sheep and goats by household in the study area. ...................... 59
Table 18. Reasons for castration criteria used in selecting rams and bucks and mean age of
castration in three areas. ................................................................................................ 61
Table 19. Method of castration and feeding of castrates by households in the study area. ...... 62
Table 20. Routes of flock entry and exit . ................................................................................. 64

xi
Table 21. Occasions when households consume small ruminant meat in the three areas
classified according to small ruminant density. ............................................................ 65
Table 22. Mean (Standard deviation) of birth weights of lambs and kids. ............................... 69
Table 23. Mean (Standard Error) of weaning weight of lambs. ............................................... 70
Table 24 Mean (Standard Error) for weaning weight of kids. .................................................. 71
Table 25. Mean (Standard Error) of some reproductive traits of sheep and goats. .................. 74
Table 26. Desirable characteristics for selecting breeding male sheep and goat for mating. ... 76
Table 27. Analysis of the six month off take of sheep and goat based on flock monitoring . .. 77
Table 28. Mean (Standard Error) number per household of sheep and goats died during a
period of the last 12 months. ......................................................................................... 78
Table 29. Death rate by age structure of sheep and goats as reported by respondent
households. .................................................................................................................... 79
Table. 30 Common sighs for causes of death of small ruminants as reported by households. 81
Table 31. Major reported causes of health problems by households. ....................................... 83
Table 32. Place of marketing where households sell and purchase sheep and goats. .............. 84
Table 33. Marketing seasons targeted for fattening . ................................................................ 90
Table 34. Preference of households for selling small ruminants by age groups in times of
immediate cash need . ................................................................................................... 92
Table 35. Reasons for selling sheep and goats by households during the last 12 months. ....... 93
Table 36. Ranking reasons of sell for selling small ruminants. ................................................ 94
Table 37. Reasons of purchasing small ruminants by households by density group. ............... 95
Table 38. Reasons of eye-ball price setting and sources of information in small ruminant
marketing by households ............................................................................................... 97
Table 39. Division of labor by households in small ruminant production ............................. 100
Table 40. Future plan and reasons for expansion of sheep and goat production ................... 101
Table 41. Major constraints reported by households in small ruminant production by small
ruminant density groups . ............................................................................................ 102
Table 42. Marketing constraints in small ruminant production reported by household ......... 104
xii
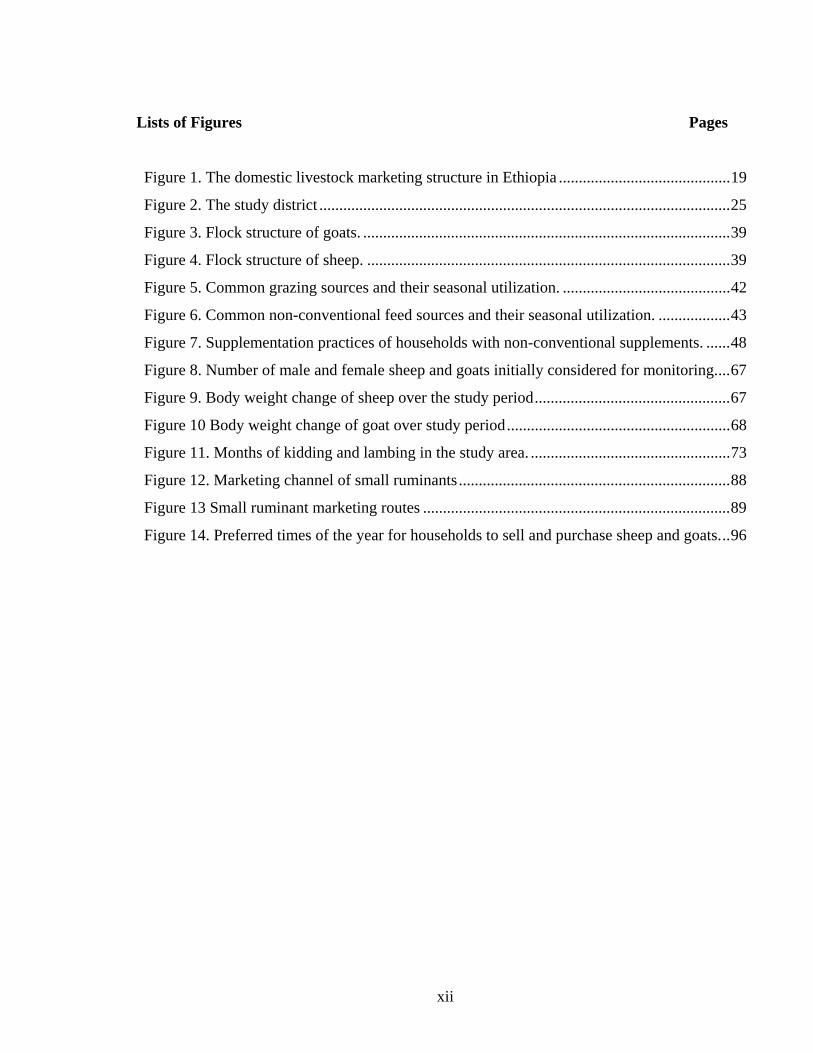
Lists of Figures Pages
Figure 1. The domestic livestock marketing structure in Ethiopia ........................................... 19
Figure 2. The study district ....................................................................................................... 25
Figure 3. Flock structure of goats. ............................................................................................ 39
Figure 4. Flock structure of sheep. ........................................................................................... 39
Figure 5. Common grazing sources and their seasonal utilization. .......................................... 42
Figure 6. Common non-conventional feed sources and their seasonal utilization. .................. 43
Figure 7. Supplementation practices of households with non-conventional supplements. ...... 48
Figure 8. Number of male and female sheep and goats initially considered for monitoring. ... 67
Figure 9. Body weight change of sheep over the study period ................................................. 67
Figure 10 Body weight change of goat over study period ........................................................ 68
Figure 11. Months of kidding and lambing in the study area. .................................................. 73
Figure 12. Marketing channel of small ruminants .................................................................... 88
Figure 13 Small ruminant marketing routes ............................................................................. 89
Figure 14. Preferred times of the year for households to sell and purchase sheep and goats. .. 96

xiii
PRODUCTION AND MARKETING SYSTEMS OF SMALL RUMINANTS IN GOMA DISTRICT OF JIMMA ZONE, ETHIOPIA
By Belete Shenkute Gemeda
Major Advisor Getahun Legesse, PhD, Hawassa University Co-Advisor Azage Tegegne, PhD, International Livestock Research Institute (ILRI)
ABSTRACT
The study was conducted in Goma district of Jimma Zone of Ethiopia with objectives of generating baseline information and identifying challenges and opportunities of small ruminant production and marketing. Results are based on diagnostic survey of 160 sample households, group discussions, monitoring of 36 flocks and rapid appraisal of major sheep and goat markets. The study district was stratified into three groups based on flock distribution as: sheep dominating, goat dominating and mixed flock sites. The average land holding per household was 1.93 ha. On average, a household owned 3.6 cattle, 3.6 sheep, 2.1 goats, 0.2 equines and 2.7 chickens. In Goma where coffee and chat are the major cash sources for farmers, small ruminant are mainly kept for cash generation and saving in time of coffee failure. About 94% of the small ruminant owners reported to keep them for income generation. The second main reason for keeping small ruminant in the study area was for saving purpose. Keeping small ruminant for manure purpose was the third important reason. Other important reasons included for meat production and for risk distribution. Farmers kept larger proportion of female animals than male animals and it was rare to find male of advanced age as they were sold or slaughtered at early age. Fattening small ruminants is commonly practiced by most farmers and nowadays getting more attention due to high market demand and better prices. From the interviewed households, 59.4%, 32.1, 23.5%, and 19.4% of them utilize communal grazing, after math grazing, roadside grazing, and riverside grazing, respectively. Most small ruminants are either tethered or herded all the seasons due to the cultivation of perennial crops and predators. All small ruminants are housed for protection from adverse weather conditions and predators. Most lambings and kiddings occurred in the main rainy season. The average litter size, birth weight (kg), and weaning weight (kg) of sheep were found to be: 1.37, 2.86 and 11.59, respectively. The corresponding values for goats were 1.6, 2.76, and 9, respectively. There are five towns where small ruminants were marketed in addition to many villages that were used as primary market sources for small ruminants. Farmers, traders, brokers, restaurant/hotel owners, butchers are the major market participants. There is one main market route i.e., from Agaro to Addis. The major problems for small ruminant production and marketing were: feed and grazing land shortage, lack of input, predators, diseases and parasites and marketing problems. In order to utilize the current growing demand of small ruminant meat at local and international markets, identification of alternative feed resources and strategic feeding management, identification of causes of diseases and their control methods as well as improving marketing efficiency through appropriate policy and provision of information are areas of interventions.
1
1. INTRODUCTION
Small ruminants are integral part of livestock keeping in Sub-Saharan Africa (SSA) that are
mainly kept for immediate cash sources, milk, meat, wool, manure, and saving or risk
distribution (Kosgey, 2004). Small ruminants also have various social and cultural functions
that vary among different cultures, socio-economies, agro-ecologies, and locations in tropical
and sub tropical Africa.
Ethiopia has a large livestock resource than most countries in Africa. It is estimated that 84%
of the 70 million people live in rural areas and depend on agriculture for their livelihoods and
the sector contributes 41.4% of the Gross Domestic Product of the country (World Bank,
2006).
There are about 26.1 million and 21.7 million sheep and goats population heads in the
Ethiopia respectively (CSA, 2008). They are important components of the livestock sub-
sector and are sources of cash income and play a vital role as sources of meat, milk and wool
for smallholder keepers in different farming systems and agro-ecologcal zones of the country
(Tekelye and Kasali, 1992; EARO, 2000; Workneh, 2000; Ehui et al., 2003; Kassahun, 2004;
Markos, 2006; Endeshaw, 2007; Getahun, 2008; FAO, 2009). They are also sources of foreign
currency (Asfaw, 1997; Berhanu et al., 2006). Moreover, due to their high fertility, short
generation interval, adaptation in harsh environment and their ability to produce in limited
feed resource they are considered as investment and insurance (Asfaw, 1997; Tsedeke, 2007).
Unlike the large potential of small ruminants in the country their productivity is low. There are

2
various factors that contribute for low productivity: health constraints, feed shortage both in
quality and quantity, poor feeding and health management (Bayou, 1998; Markos, 2006;
Sisay, 2006; Tsedeke, 2007; Getahun, 2008). Other contributing factors also include low
genetic potential; policy issues (Zinash et al., 2001) market and institutional problems and
problem of credit facilities and others (Berhanu et al., 2006).
Although various research and development activities have been carried out in the past, no
significant increase in productivity was achieved. Therefore, improvement programs are
necessary to increase productivity and sustainable development of small ruminants in different
farming systems of the country in innovative approach so as to meet the demands of the
human population. However, such development achievement for sheep and goats will only be
successful when accompanied by a good understanding of the different farming systems and
when simultaneously addressing several constraints: feeding, health control, general
management, as well as cost and availability of credit and marketing infrastructure (Workneh
et al., 2003; Baker and Gray, 2004).
Similarly, many small ruminant genetic improvement programs in developing countries have
not been very successful may be due to failure to perceive the multidirectional aspect of the
problem; for example implementing genetic improvement programs without taking into
consideration other vital needs of the farmers (Sölkner et al., 1998; Rewe et al., 2002; Wollny
et al., 2002; Kosgey et al., 2006). In addition, poor performance of imported breeds from the
temperate developed world under sub optimal management conditions, which prevail in most

3
tropical countries, has created a negative image for genetic improvement programs (Rewe et
al., 2002; Workneh et al., 2003).
Production without access to market is also a problem for many livestock producers in tropical
countries (Lightfoot et al., 2005). According to Delgado et al. (1999) “livestock revolution”
can be expected to allow the rural poor in developing countries to contribute to the growing
market. In Ethiopia small ruminant production lack reliable marketing outlets that could
provide the full benefits of indigenous small ruminant resources, to be captured by small scale
producers, pastoralists and the consumers (AIS, 2003). To achieve these benefits it is
necessary to address the constraints within different production systems. Thus, reconsidering
government policies and how supportive they are of small scale and pastoral production is
important (Conroy, 2004). One outstanding aspect of the livestock revolution is the implied
change of production from traditional subsistence to a market-oriented industry, making
livestock marketing a significant factor in the development of the Ethiopian economy
(Delgado et al., 1999; McPeak, 2003).
In coffee shaded and cereal /livestock farming of Goma district, sheep and goats are important
components of the farming system which benefit small holder farmers in generating cash
income during the seasons of coffee failure (IPMS, 2007). In these farming systems, small
ruminant keeping and fattening is nowadays becoming a common practice even among young
landless men and women due to ever-increasing prices. Despite their potential in the area,
productivity of sheep and goat remained quite low presumably due to such factors as feed
shortage and lack of veterinary services. Therefore it is crucial to systematically describe the

4
production and marketing systems in order to plan and design appropriate research and
development interventions that are relevant to the specific systems. The general objective of
the thesis was, therefore, to generate baseline information on sheep and goat production
systems and marketing in Goma district of Oromia Regional State.
The specific objectives of the study were;
• To asses productive and reproductive performance of small ruminants in Goma
district;
• To asses market information and related socio-economic situation of small ruminant
keepers in Goma district.
• To identify challenges of and opportunities for small ruminant production and
marketing in Goma district.

5
2. LITERATURE REVIEW
2.1 Genetic diversity and distribution of small ruminant in Ethiopia
Domestic sheep (Ovis aries) and goats (Capra hiricus) were the first ruminants to be
domesticated in southwestern Asia (Iran and Iraq) between 10,000 and 6,000 BC and
distributed in various ecological niches of the world. Ethiopia, a country recognized as
gateway for Africa to small ruminant from Asia (IBC, 2004), has about 11 phenotypically
distinct indigenous goats (FARM Africa, 1996) and 14 sheep (IBC, 2004; Workneh et al.,
2004) populations that have been identified based on a combination of their morphological
appearance and management systems.
According to report of FARM Africa (1996), Ethiopian and Eritrean goat types are
categorized under four broad families that represent type and geographic locations there are
the Nubian family that includes Nubian and Barka, the Rift Valley family that includes Wore,
Abergalle, Afar, Arsi -Bale and Woyito-Guji, the Somali family that includes Hararghe
Highland, short-eared Somali and long-eared Somali; and the Small East African family that
includes Central Highland, Western Highland and Kaffa. Other report indicated the
identification of four sheep types (Adal, Blackhead Somali, Menz and Horro) and two goat
types (Adal and highland goat) type were identified (Zinash et al., 2001). Molecular
characterization based on the traditionally recognized populations using micro-satellite
exhibited eight goats (Tesfaye et al., 2006) and nine sheep (Solomon, 2006) with separate
genetic entities or breeds.
6
Indigenous sheep and goat genetic resources have developed specific adaptations to survive
and produce under adverse local environmental conditions and to perform better under low
input system. As a result, they are suitable to be used in the traditional, low-external-input
production system (IBC, 2004; Markos, 2006).
The sheep and goats inhabited to the target area of this study belong to Bonga and Kaffa
respectively (FARM Africa, 1996; Solomon, 2006; Tesfaye, 2006). Almost all sheep and
goats found in study area are indigenous (99.9%) for both species (CSA, 2008).
According to Solomon (2006), there is a need for exhaustive characterization of the existing
genetic resource as the presence of sizeable genetic diversity in the country. Past within breed
improvement appears to be impeded by failure in identifying genetically superior animals and
due to lack of adequate flock size. On station studies, where few indigenous breeds were
crossed with exotic breeds, have shown a promising improvement in productivity over the
local breeds. However, on-farm observation seems contrary to what is realized on station.
In addition to highland agro-ecological zones, small ruminants are also widely distributed in
middle altitude and lowland areas. A report by Akililu et al., (2005) indicated that sheep are
distributed in the lowlands in similar proportion to the highlands that deviates from previous
reports of larger distribution of small ruminants in the highlands (Workneh, 2000).

7
2.2 Role of small ruminant in livelihoods of small holder farmers in Ethiopia
The production system in which sheep and goats are kept is differing markedly. Differences
exist not only in production systems but also in relative importance and potential for increased
production. Variations arise due to differences in resource endowment, climate, population,
disease incidence, level of economic development, research support and government
economic policies (Beets, 1990).
According recent studies in southern part of Ethiopia, Getahun (2008) found out that
smallholder farmers in crop-livestock mixed systems kept small ruminants mainly for cash
generation. In Alaba and Dale districts of Southern Nations Nationalities and Peoples Region
(SNNPR), small ruminants are also primarily kept for cash generation purpose (Endashew,
2007; Tsedeke, 2007). In central Rift Valley of Ethiopia, where uncertainly of rainfall is
observed, women and children are involved in owning and keeping small ruminants for
immediate income generation (Abule, 1998). It is likely that smallholder farmers are mainly
targeting small ruminant for market rather than using for meat purpose which nowadays
restricted to holidays or especial occasions.
According to a recent report by Central Statistics Authority of Ethiopia, about five million
small ruminants were slaughtered in the year 2007/2008 in the country which indicates their
potential for meat production (CSA,2008).. The milk of small ruminants has also been
consumed by many farming communities although there is variation among farming systems,
cultural and socio-economic conditions of the society. In Kofele district, of the Oromia
8
Regional State of Ethiopia, sheep milk is commonly utilized by the household members to
whiten coffee (Getahun, 2008). In central rift valley, in eastern, south-eastern and north-
eastern part of the country, goat milk is consumed by farming community (Abule, 1998;
Workneh et al., 2004).
It was reported that a total 14 million sheep and 13 million goat skins produced annually from
which 95% of the sheep and 70% of the goatskin is recovered at the market (Zewdu, 1998;
Ahmed, 2000). During 1995-1996 the export value of sheep/lamb skins amounted to be about
82 million US$ (EARO, 2000). Live animals are also exported to middle east countries and
sources for foreign currency; for example, between 1995-1996 an estimated amount of 4.6
million US$ was derived from the export of small ruminant (EARO, 2000).
There are also other benefits of small ruminants such as manure which is used as fertilizer and
household fuel (EARO, 2000); farmers also use small ruminants as savings at time of crop
failure or drought (Workneh et al., 2003; Tsedeke, 2007; Getahun, 2008). They are also
considered as investment and insurance to provide cash sources for purchase of farm inputs
and house expenses. In recent years, landless farmers and young men are involved in small
ruminant fattening due to incentive prices and farmers add value of their animals by fattening
with local feeds and in some cases concentrate feeds in order to get higher prices.
For many smallholder farmers, livestock are the only ready source of cash to buy inputs for
crop production, such as seeds, fertilizers and pesticides. However, the middle and high
altitudinal areas are under threat because of shrinking cultivated areas per household, reduced

9
feed availability and land fragmentation. Results of recent studies in sub-humid highlands of
southern Ethiopia showed higher feed scarcity thereby difficulty of sustaining large ruminants
(Aune et al., 2001; Desta & Oba, 2004), indicating further comparative advantages of small
ruminants pertaining to their lower nutrient requirements. As population increases further and
land holding decreases, the role of cattle as compared to small ruminants may be reduced
(Jahnke, 1982).
2.3 Small ruminant production systems in Ethiopia
Ethiopia is a country endowed with diversified fauna and flora that are found in various agro-
ecologies. These agro-ecologies can be further categorized into sub-agro-ecologies and macro
and micro niches which are the home of differently adapted animal and plant species. These
life forms are dependent and interdependent on each other forming biological systems. In the
agricultural systems, there are various integrated and interrelated systems among which crop
farming and livestock keeping are important components. Livestock production system varies
due to differences in livestock species, resource endowment, climatic condition, human and
livestock population, level of economic development, research support and government
economic policies. Moreover, soil condition and crop farming also contribute for variation of
livestock production systems.
There are various factors that should be considered to categorize small ruminant production
systems in Ethiopia. In mixed crop-livestock production system which mainly seen in central
highland of the country, small ruminant production is characterized by low productivity due to

10
nutritional stress and internal and external parasites. The Pastoral and agro-pastoral systems
which are found in the lowlands are characterized by extensive production based largely on
the rangeland (Tembely, 1998; EARO, 2000). The existence of private commercial and
parastal production systems on limited scope were also reported by Markos (2006).They are
forms of modern small ruminant production systems.
Based on prevalence of agricultural activity Getahun (2008) has classified traditional small
ruminant production system into:
1. Small ruminant in annual crop-based system; located in northern, north western, and
central highlands.
2. Small ruminant in perennial crop-based; mostly found in southern and south-western
highlands.
3. Small ruminants in cattle based systems; these systems usually exist in agro-pastoral
and semi arid-areas.
4. Small ruminant dominated systems; found in pastoral and arid areas of eastern and
north-eastern Ethiopia, in which system sheep and goats are the dominant livestock
species.
2.4 Reproductive and growth performance of small ruminant in Ethiopia
The reproductive and growth performances of small ruminants are important factors
influencing flock productivity. All forms of output including milk, meat, wool and skins
depend on these factors. The factors vary mostly between breeds and even within flocks in a

11
given population (ILCA, 1990). Considering reproductive parameters in selection and cross-
breeding programs will directly influence the efficiency of milk and meat production and the
rate of genetic progress (Mukasa-Mugerwa and Azage, 1991), and the size of the crop for
replacement (Kiwuwa et al., 1983).
These factors are influenced by many factors including genotype, nutrition, diseases and other
management practices. In addition, these performance parameters are not a single trait each
but the combination of other several traits that determine their expression.
2.4.1 Age at first parturition (AFP)
In small ruminants, it is an economically important trait because it determines rate of genetic
progress and population turnover rate. However, many factors affecting pubertal development
would also affect age at first parturition. Genetic and environmental factors especially
nutrition determine pre-pubertal growth rate, reproductive development, onset of puberty and
subsequent fertility (Mukasa-Mugerwa and Azage, 1991) and type of birth (Wilson and
Murayi, 1988); number of progenies (lambs) born with multiple litters attained age at first
lambing later than their single born counterparts (Wilson, 1986).
Under most traditional systems, where small ruminants breeding males are available in the
flocks, age at first parturition is a good indicator of early sexual maturity in does and ewes.
Otte and Chilonda (2002) reported the mean ages at first parturition of 17.5 and 16.4 months
in traditional systems of SSA for sheep and goats respectively. Horro ewe lambs could attain

12
puberty at seven months of age weighing 21 kg and produce viable lambs (Solomon et al.,
1995) without any adverse effect on their subsequent growth and reproductive performance
while Menz sheep in Ethiopian highlands can attain puberty (first estrus) at 10 months of age
and 16.9 kg mean weight or 56 percent of their mature body weight (Mukasa-Mugerwa et al.,
1994). According to a recent study in southern Ethiopia, age at first lambing for kofele ewes
was found to be 11.8 months and for Adilo was 14.6 months (Getahun, 2008). Another study
conducted in central highland indicated the average age at first parturition to be of 17.0 and
13.2 months for sheep and goats respectively (Samuel, 2005). Some of the reported age at first
parturition for indigenous breeds is presented in Table 1.
Table 1. Age at first parturition of some breeds of Ethiopian sheep and goats.
Species Breed Management type Age (days) Source
Sheep Arsi-Bale Traditional (Kofele) 354 Getahun, 2008
Arsi-Bale Traditional (Adilo) 438 Getahun, 2008
Arsi-Bale Traditional 510 Samuel, 2005
Arsi-Bale Traditional 381 Tsedeke,2007
Menz Traditional 390-540 Mukasa-Mugerwa et al.,1986
Menz Traditional 485 Agyemang et al,1985
Menz Traditional 477-547 Niftalem,1990
Menz Station 459 Demeke et al., 1995
Menz Traditional 443 Dibissa, 2000
Menz Station 523 Mukasa-Mugerwa and lahlou-
kassi, 1995
Goat Arsi-Bale Traditional 396 Samuel, 2005
Arsi-Bale Traditional 242 Tatek et al.,2004
Arsi-Bale Traditional 363 Tsedeke, 2007
Unspecified Traditional 363 Mukasa-Mugerwa et al.,1986

13
2.4.2 Parturition Interval
Lambing or kidding interval is the interval between two parturitions that determines
reproductive efficiency in small ruminant production. The doe/ewe with long kidding/lambing
interval has lower reproductive efficiency (Ibrahim, 1998). Extended kidding/lambing
intervals commonly arise from long post-partum anoestrus intervals, repeated cycles of service
intervals without conception, embryo death or abortion (Gatenby, 1986; Ibrahim, 1998).
According to Wilson (1989), lambing intervals in Africa ranged from 230 to 437 day. A
research carried out on Menz sheep showed that ewes had lambing interval of 262 days and
about 65 percent of Menz sheep in the Ethiopian highlands have a lambing interval of eight
months and are capable of three lambings in two years except when mating is controlled
(Tekelye et al. 1993). Similar studies of on-farm monitoring of goats by Tatek et al (2004)
indicated parturition interval of 8.1 months. Samuel (2005) on his study of yerer water shade
and Adaa districts reported parturition interval of 12.1 and 11.5 months in sheep and goats,
respectively. Summaries of parturition interval of some Ethiopian small ruminants breeds was
given in Table 2.
14
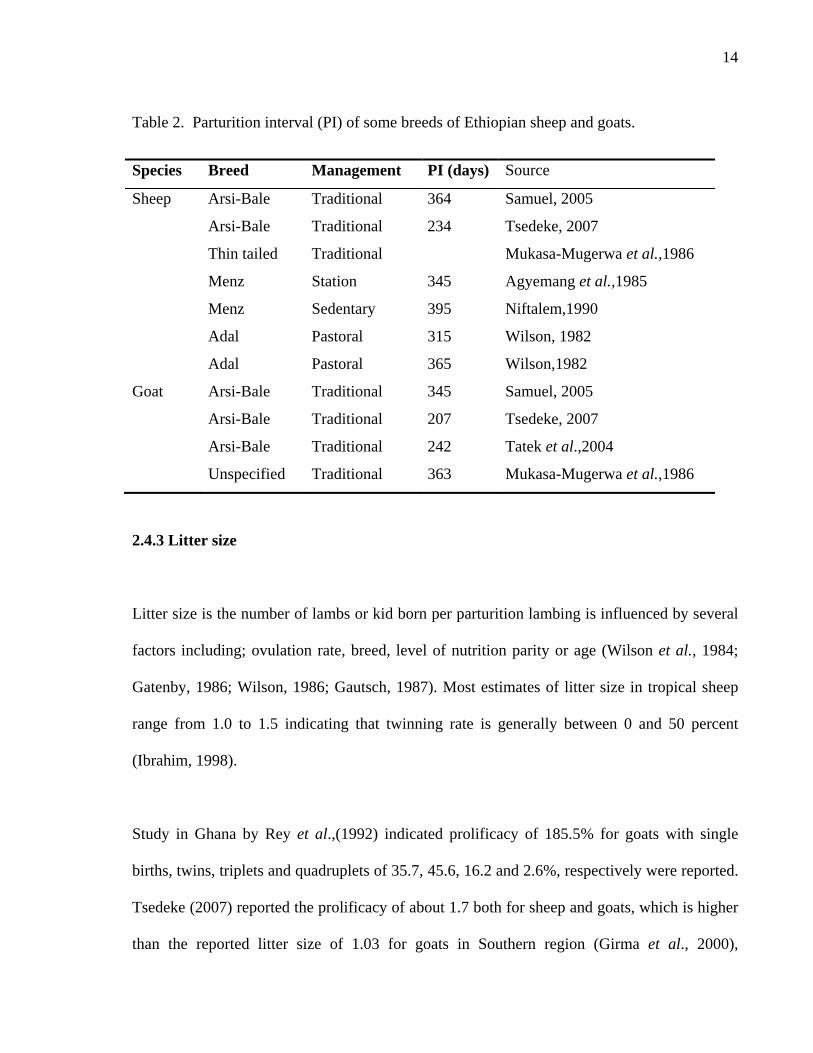
Table 2. Parturition interval (PI) of some breeds of Ethiopian sheep and goats.
Species Breed Management PI (days) Source
Sheep Arsi-Bale Traditional 364 Samuel, 2005
Arsi-Bale Traditional 234 Tsedeke, 2007
Thin tailed Traditional Mukasa-Mugerwa et al.,1986
Menz Station 345 Agyemang et al.,1985
Menz Sedentary 395 Niftalem,1990
Adal Pastoral 315 Wilson, 1982
Adal Pastoral 365 Wilson,1982
Goat Arsi-Bale Traditional 345 Samuel, 2005
Arsi-Bale Traditional 207 Tsedeke, 2007
Arsi-Bale Traditional 242 Tatek et al.,2004
Unspecified Traditional 363 Mukasa-Mugerwa et al.,1986
2.4.3 Litter size
Litter size is the number of lambs or kid born per parturition lambing is influenced by several
factors including; ovulation rate, breed, level of nutrition parity or age (Wilson et al., 1984;
Gatenby, 1986; Wilson, 1986; Gautsch, 1987). Most estimates of litter size in tropical sheep
range from 1.0 to 1.5 indicating that twinning rate is generally between 0 and 50 percent
(Ibrahim, 1998).
Study in Ghana by Rey et al.,(1992) indicated prolificacy of 185.5% for goats with single
births, twins, triplets and quadruplets of 35.7, 45.6, 16.2 and 2.6%, respectively were reported.
Tsedeke (2007) reported the prolificacy of about 1.7 both for sheep and goats, which is higher
than the reported litter size of 1.03 for goats in Southern region (Girma et al., 2000),
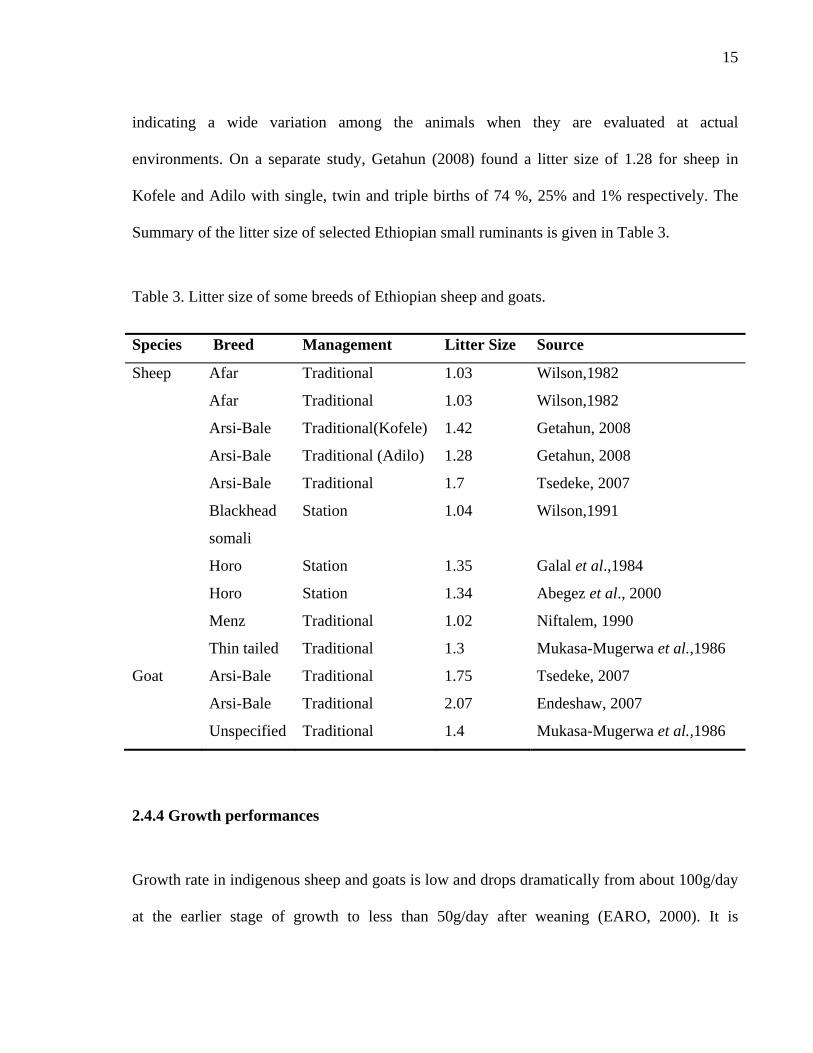
15
indicating a wide variation among the animals when they are evaluated at actual
environments. On a separate study, Getahun (2008) found a litter size of 1.28 for sheep in
Kofele and Adilo with single, twin and triple births of 74 %, 25% and 1% respectively. The
Summary of the litter size of selected Ethiopian small ruminants is given in Table 3.
Table 3. Litter size of some breeds of Ethiopian sheep and goats.
Species Breed Management Litter Size Source
Sheep Afar Traditional 1.03 Wilson,1982
Afar Traditional 1.03 Wilson,1982
Arsi-Bale Traditional(Kofele) 1.42 Getahun, 2008
Arsi-Bale Traditional (Adilo) 1.28 Getahun, 2008
Arsi-Bale Traditional 1.7 Tsedeke, 2007
Blackhead
somali
Station 1.04 Wilson,1991
Horo Station 1.35 Galal et al.,1984
Horo Station 1.34 Abegez et al., 2000
Menz Traditional 1.02 Niftalem, 1990
Thin tailed Traditional 1.3 Mukasa-Mugerwa et al.,1986
Goat Arsi-Bale Traditional 1.75 Tsedeke, 2007
Arsi-Bale Traditional 2.07 Endeshaw, 2007
Unspecified Traditional 1.4 Mukasa-Mugerwa et al.,1986
2.4.4 Growth performances
Growth rate in indigenous sheep and goats is low and drops dramatically from about 100g/day
at the earlier stage of growth to less than 50g/day after weaning (EARO, 2000). It is
16
influenced by several factors like genotype, sex of lamb, birth type, and seasons of birth, age
of dam, nutritional condition, and production systems (Wilson, 1991; Mukasa-Mugerwa et al.,
1994; Awgichew, 2004; Demeke et al., 2004; Berhane and Eik, 2006; Getahun, 2008).The
summary of birth weight, weaning weights and average daily gain (ADG) of some selected
breeds of small ruminants is given on Table 4.

17
Table 4. The birth weight, weaning weight and average daily gains of some selected breeds.
Species Breed Management Birth
Weight
Weaning
Weight
ADG Source
Sheep Afar Station 2.5 13.0 116.7 Galal, 1983
Arsi-Bale Traditional(Kofele) 2.89 12.23 102.01 Getahun, 2008
Arsi-Bale Traditional(Adilo) 2.29 11.18 98.77 Getahun, 2008
Arsi-Bale Station 2.8 13.5 - Brannang et al.,1987
Blackhead
Somali
Station 2.7 14.2 127.8 Galal, 1983
Horro Station 2.7 11.8 100 Abegaz et al.,2000
Horro Station 2.43 8.21 89.25 Awgichew,2000
Horro Station 2.8 11.0 92.6 Tibbo,2006
Menz Station 2.5 8.03 89 Awgichew,2000
Menz Station 2.5 9.5 78 Demeke et al.,2004
Menz Station 2 8.6 Mukasa-Mugerwa
and Lahlou-Kassi,
1995
Menz Station 2.4 10.1 84.9 Tibbo,2006
Unspecified Traditional 2.3 13.5 124 Mukasa-Mugerwa et
al.,1986
Goat Abegelle Station 2.6-3.4 6.0-8.9 33-35 Berhane and
Eik,2006
Arsi-Bale Station 2.28 8.39 72.21 Tatek et al.,2004
Begait Station 3.0-3.7 8.0-10.8 55-59 Berhane and
Eik,2006
Somlali Station 3.05 10.01 76 Abebe, 1986
Somali Station 3.19 11.67 61.25 Zeleke, 2007
Unspecified Traditional 2.5 11.9 104 Mukasa-Mugerwa et
al.,1986

18
2.5 Small Ruminant marketing in Ethiopia
Ethiopia adopted an Agricultural Development-led Industrialization (ADLI) strategy, which
initially focused on food crops and more recently, the country has added market orientation to
this strategy (Berhanu et al., 2006). Increased availability and utilization of appropriate
technologies, an effective and efficient service delivery system and, sustained demand for the
agricultural outputs are critical in such market-oriented agricultural development efforts.
However, the infrastructural development is also rather limited which is a major bottleneck,
only 17% of the rural population lives within 2 km of an all season road and only 0.4% has
access to electricity (World Bank 2006).
There is an increase in demand of Ethiopian small ruminants both for local and export markets
(Azage et al., 2006). Recent studies showed that smallholder farmers mainly keep small
ruminant as a source of income (Markos, 2006; Endeshaw, 2007; Tsedeke, 2007; Getahun,
2008) which may indicate higher demand for small ruminants. According to Ayele et al.
(2003), the domestic livestock marketing structure of Ethiopia follows a four tier system
(Figure 1). The main actors of the 1st tier are local farmers and rural traders/rural assemblers
who transact at farm level. Those small traders from different corners bring their animals to
the local market (2nd tier). Traders/wholesalers purchase a few large animals or a fairly large
number of small animals for selling to the secondary markets. In the secondary market (3rd
tier), both smaller and larger traders operate and traders (wholesalers or retailers) and butchers
from terminal markets come to buy animals. In the terminal markets (4th tier), big traders and
butcher (wholesalers or retailers) transact larger number of mainly slaughter type animals.

19
Source: Ayele et al. (2003)
Figure 1. The domestic livestock marketing structure in Ethiopia
Although there has been fluctuating demand of Ethiopian small ruminants in importing
countries due to disease, sanitary and phyio-sanitory reasons in current days past few years
Farm gate sales Players: farmers and rural traders Animals: Cattle, Goat, Sheep Volume: Nominal: Usually 1-2, typically 5 Location: Usually 1-2, typically 5
Local Primary Markets Players: farmers and local traders Animals: Heifers, young bulls, replacement
for breeding, and draft animals Volume: <500 heads/week Location: Market centers in rural areas :
Secondary Markets Players: Small traders and farmers (Sellers) Big traders and butcheries (buyers) Animals: Slaughter, breeding, and draft stocks Volume: 500-1000 heads/week Location: Regional towns
Terminal Markets Players: Big traders (sellers) Volume: Butchers (Buyers) Animals: Slaughter types, culled for age oxen
and barren cows Volume: >1000 heads/week Location: Principal town

20
there was progressive increase in demand was reported in the past few years (Azage et al.,
2006; Berhanu et al., 2007).
Ethiopia exports chilled goat meat to five countries and mutton to the Gulf States of Saudi
Arabia and United Arab Emirates which are the largest recipients (Solomon et al., 2005), but
there is very high degree of inter-annual variation in traded volume, both within and across
species. Similar author reported that high annual volumes in recent years are especially
apparent for mutton and lamb (2003) and goat meat (2003-4), confirming that export market
options for Ethiopia have recently expanded. It is also important to note, however, that these
figures do not include “unofficial” transactions. Large numbers of Ethiopian animals are
unofficially traded to Gulf States via the borders of Somaliland and Djibouti and Sudan
(Workneh, 2006; Asfaw et al., 2008). It was observed that the net commercial off-take rate is
very low over different time periods for sheep and goat for smallholder farmers and
pastoralists in Ethiopia (Workneh, 2006; Asfaw and Jabbar, 2008). Similar report indicated
that in 1999/2000, the average net commercial off-take rates of sheep and goats for
smallholder farmers in the highland areas of Amhara, Oromia and Tigray is 22 and 18%,
respectively while in 2004/05, the average net commercial off-take rate sheep and goats for
smallholder farmers in highland and lowland areas of Ethiopia were 7 and 8%, respectively
(Workneh, 2006). In the case of Borana pastoral production system, the average net
commercial off-take rate of sheep and goats for the three years period (2003–05) for cattle and
small ruminants were 6 and 7%, respectively (Asfaw and Jabbar, 2008).

21
2.6 Small ruminant production constraints
2.6.1 Feed shortage
Lack of adequate feed resources as the main constraint to animal production is more
pronounced in the mixed crop-livestock systems, where most of the cultivated areas and high
human population are located (Sisay, 2006). The problem of good quality and quantity feeds
observed in lowlands where pastureland seems relatively abundant. There is a great seasonal
variation of quality and quantity of feed resources in most part of the country. According to
Alemayahu (1998), there is excessive supply of feed during the rainy season which is usually
followed by a deficit in grazing in the following dry season. On the other hand, the allocation
of more land for crop production resulted in availability of crop residues as alternative feed,
particularly in the smallholder livestock production system. In central rift valley, feed shortage
was reported as one of the limiting factors in small ruminant productivity (Abule, 1998). In
these areas where there are few rainy months with limited rainfall of erratic nature feed
production for small ruminants is inadquate however. However, goats thrive due to their
browsing nature. In southern part of the country, although the degree of shortage varies within
farming systems/agro-ecologies feed shortage is reported as a major constraint for small
ruminant production (Endeshaw, 2007; Tsedeke, 2007; Getahun, 2008)

22
2.6.2 Health constraints
Another serious constraint for small ruminant production in Ethiopia has been the high
prevalence of diseases and parasites. This causes high mortality amongst kids and lambs,
diminishing the benefits of their high reproductive performance (Solomon et al., 1995;
Yohannes et al., 1995; Solomon and Gemeda, 2000; Markos, 2006). Tsetse flies, with the
highest infestation in the humid and sub humid zones, are also a major problems in these
areas. Further losses are caused by abortions and stillbirths (Getahun, 2008; Markos, 2006).
Other diseases that have limited the productivity of small ruminants in Ethiopia include
pneumonia, Contagious Caprine Pleuropneumonia, Ecthyma, Caseous Lymphadenitis and
Brucellosis. Individually, these diseases might not constitute serious problems, but
combinations of them or their occurrence under marginal conditions could result in serious
losses(Markos, 2006; Tsedeke, 2007).
2.6.3 Water shortage
Water shortage is also reported as limiting factor in most lowland areas to a limited extent in
mid altitudes. In eastern, north-eastern and south-eastern part of the country there is critical
shortage of water; however, small ruminants are somehow adapted to these agro-ecologies
through their physiological adaptation mechanisms.
23
2.6.4 Marketing constraints
The indigenous sheep and goat are year round breeders and mating is not controlled. However,
the current off take rate is very low (Markos, 2006); with an average carcass weight of about
10kg, which is the second lowest amongst Sub-Saharan African countries (FAO, 2004). In
Ethiopia, the marketing of livestock and livestock products is underdeveloped. The major
problems are the traditional management systems which are not market oriented,
underdeveloped marketing systems and poor infrastructure, poor financial facility, and
presence of cross-border trade (Azage et al., 2006, Berhanu et al., 2007).
24
3. MATERIALS AND METHODS
3.1. Description of the Study Area
3.1.1. Geographical location
This study was carried out in Goma district of the Jima administrative zone of the Oromia
Regional State (Figure 2). Jima zone is one of the 12 administrative zones in Oromia Regional
State. Goma district is one of the 13 districts in Jima zone known for its predominant coffee
cultivation. It is located 390 km south west of Addis Ababa and about 50 km west of the Jima
Zone capital i.e. Jima. One of the coffee biodiversity centers in Ethiopia is found in this
district.
3.1.2 The Natural Resource Base
3.1.2.1 Climate
Goma district, which is situated in south-western Ethiopia, has well distributed annual rainfall
with very low seasonal and area- wise variability (IPMS, 2007). Based on 15 years weather
data obtained from Goma district, the average annual rainfall was 1524 mm with bi-modal
distribution. The small rains are from March to April and the main rainy season extends from
June to October; and it was also indicated that there are about 7 rainfall months in the district
(IMPS, 2007). The mean monthly temperature varies between 12.670 C- 29.10 C. Crop and

25
livestock production is not constrained by the amount and distribution of rainfall as in the
other parts of the country.
Figure 2. The study district
26
3.1.2.2 Vegetation
The district has relatively high forest cover that serves as a source of livestock feed, habitat for
different wild life and potential area for apiculture. Major forest tree species in the area
include Albizia lebbeck, Milita ferruginea, Juniperus procera, Cordia africana, Croton
macrostachys, Acacia spp., Podocarpus gracilior (IPMS, 2007). The forest area holds wild
animals like leopard, hyena, monkey, fox which are a potential treat for small ruminant
production.
3.1.2.3. Soils
The Eutric Vertisols, Humic alisols and Humic Nitosols are the three dominant soil types in
Goma with Nitosols being the most abundant soil type (about 90%) of the district. These soils
are generally acidic soils with PH values ranging between 4.5 and 5.5 (IPMS, 2007).
3.1.3. Agro-ecology
Agro-ecologically, Goma district is classified as 96% wet Weina Dega (wet midland) and 4%
kolla (lowland). Altitude in Goma ranges from 1387 to 2870 metres above sea level (m asl).
Most parts of the district lay between 1387 and 1643; and 1849 and 2067 m asl. However, few
of the areas in the district have altitudes ranging from 2229 to 2870 m asl (IPMS, 2007)
27
3.1.4 Farming systems
3.1.4.1. Coffee/livestock farming system
Thirty-two kebeles with more than 92% of the people in Goma are categorized under this
farming system. The major cash crop commodities in this farming system include; coffee, chat
(Catha edulis), tropical and sub tropical fruits (mango, avocado, papaya, banana, orange,
pineapple) and spices (mainly ginger and Ethiopian cardamom). Among cereals, maize, teff,
barely are grown in the area; amongst of which, maize is the dominant cereal crop in the
farming system. Livestock commodities include; cattle, small ruminants (sheep and goat)
apiculture, poultry and equines. Sheep are larger in number than goats in this farming systems.
In general, as altitude increases the goat population reduces.
3.1.4.2 Cereal/livestock farming system
Four rural kebeles are categorized into this farming system (IPMS, 2007). Although the
productivity is low, coffee and tropical fruit are also produced in these kebeles. Relatively
higher flock densities of cattle and goats with limited sheep population were found in these
farming systems. Maize is the dominant cereal crop in this farming system.

28
3.1.5. Demographic Structure
There are 36 rural kebeles∗ and 3 urban kebeles in Goma district. The number of agricultural
households in the district is 45,567 from which 35,533 are male headed and 10,034, female
headed (IPMS, 2007). The total population of the district was 216,662 from which 110,448 are
males and 106,174 females (CSA, 2008). Goma is the second most densely populated district
in the zone with the total area 96,361.72 ha (96.4 km2) including the two coffee state farms
which cover an area of 2704 ha (IPMS, 2007).
3.2. Research Design, Sampling and Data Collection
Initially discussions were held with district livestock experts; secondary data were collected;
published and unpublished information were assessed; in addition, the woreda was visited to
better understanding of agriculture in general and small ruminant production in particular.
Then, based on this information, the 36 kebeles were stratified into small ruminant density
zones based on the proportion of sheep and goats. Accordingly, 26, 6 and 4 kebeles were
found to be sheep dominant, mixed flock (almost similar proportion of sheep and goats) and
goat dominant, respectively. From these strata of kebeles, 4, 2 and 2 kebeles were selected
from sheep dominant, goat dominant and mixed flock zones, respectively.
Households that have at least 2 small ruminant or landless farmers who are involved in
fattening and have a minimum of one year experience in small ruminant production and/or ∗Kebele is the lowest administrative unit in rural Ethiopia and normally consists of small number of villages and hundreds or thousands of households.

29
fattening were randomly selected. Accordingly, 20 households from each kebeles (a total of
160 households) were randomly selected to participate in production system and marketing
study. Structured questionnaire was used to collect information on the following variables:
socio-economic characteristics of households purposes of keeping sheep and goats, inventory
of sheep and goats, feeds and feeding, breeding systems and reproductive performance of
sheep and goat, problems and constraints, housing, diseases and parasites, veterinary services,
input in sheep and goat production, labor and its distribution in sheep and goat production,
fattening practices, technologies and interventions (Appendix 2). The questionnaire was then
translated into Amharic and technical words were translated into Oromiffa. Development
agents (DAs) and supervisors who were working in the district and who speak the local
Oromiffa language were recruited, trained and collected the data under close supervision.
Group discussions were held with 7-12 key informants once in each study area in order to gain
an in-depth insight about the topics covered during the structured interview and to check
whether patterns found in the households were validated by focus groups.
Productive performance and flock dynamics of sheep and goats were studied on 36
purposively selected households (18 from sheep dominating and 18 from goat dominating site)
who had already been involved in production system and marketing study. These households
were selected based on their interest, proximity to the main road and ownership of a minimum
of three sheep and/or goats. They were monitored using continuous surveying method. Data
on productive performance: birth weight and weaning weight as well as flock dynamics; entry
ways (birth, gift, purchases, and share) and exits (death, sale, theft, and predator) from the

30
flock were monitored on bi-weekly basis from November 2008 to April 2009. Data sheets
were prepared and data were collected by trained enumerators during the study period.
The marketing system study was carried out using the technique called Rapid Marketing
Appraisal (RMA). Following this technique, information was collected by interviewing
experts, extension workers, local traders, export traders as well as hotel and restaurant owners.
The five towns in the area namely; Agaro, Chago, Gembe, Limu Shayi, Bashasha were visited
and discussion were made with informants. Physical facilities were also visited.
3.3 Data analysis
The data were organized, summarized and analyzed using SPSS statistical package (SPSS
13.0, 2003). For data involving frequencies, descriptive statistics were employed and Pearson
chi-square were used to compare variables across the small ruminant density groups, where as
quantitative variables were analyzed using analysis of variance procedure and Tukey test was
used to separate group means when the F test declared significant differences.
In describing results of analysis wherever appropriate, the numbers of households providing
data are included in each table. Whenever the data analyzed are based on single responses to
questions the percentage values should add up to 100%. In multiple answers percentages will
not add up to 100%. Percentage units (%) are shown alongside the levels of one of the
classification variables, either along the top or down the side, to indicate how the contents of
the tables are to be interpreted and in which direction the percentage values are to be summed.
31
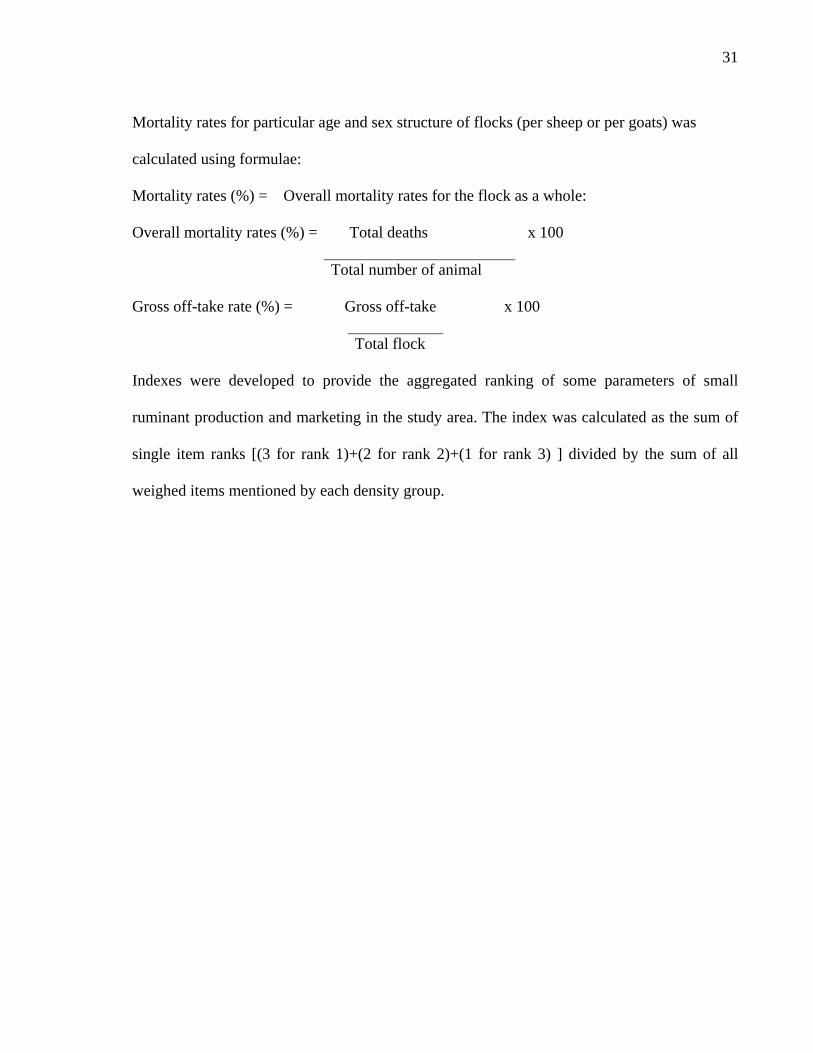
Mortality rates for particular age and sex structure of flocks (per sheep or per goats) was
calculated using formulae:
Mortality rates (%) = Overall mortality rates for the flock as a whole:
Overall mortality rates (%) = Total deaths x 100
Total number of animal
Gross off-take rate (%) = Gross off-take x 100
Total flock
Indexes were developed to provide the aggregated ranking of some parameters of small
ruminant production and marketing in the study area. The index was calculated as the sum of
single item ranks [(3 for rank 1)+(2 for rank 2)+(1 for rank 3) ] divided by the sum of all
weighed items mentioned by each density group.

32
4. RESULTS AND DISCUSSON
4.1 Socio-economic characteristics of the households
4.1.1 Household characteristics
In the study area, the majority of the small ruminants owning households were male headed
(94.4%) while only small proportions (5.6%) were headed by females (Table 5). The
proportion of landless young was (6.3%). According to key informants the number of landless
young people involved in small ruminant fattening has been growing from time to time may
be due to the market demand and high market profit. About 94% of the interviewed household
heads belong to Oromo ethnic group while heads from other ethnic groups constitute only 6%
of the sampled household heads and most of them were found in sheep dominant areas.
The majority of the households were Muslims (91%) followed by Orthodox Christians (8%)
and Evangelical Christians (1%).

33
Table 5. Some socio-economic characteristics of the studied household heads shown by small
ruminant density group. Values in the body are percentages of the households under the
respective category.
Descriptor
Group
Overall Sheep
Dominant
Goat
Dominant
Mixed
Flock
No. of households 80 40 40 160
Gender of HH heads
Male 96.2 92.5 92.5 94.4
Female 3.8 7.5 7.5 5.6
Marital status of HH heads
Married 91.3 75 95 88.1
Single 5 15 0 6.3
Widow 3.7 10 5 5.6
Religion of HH heads
Muslim 91. 3 82.5 100 91.2
Orthodox 7.5 15 0 7.5
Evangelical 1.2 2.5 0 1.3
Ethnicity of HH heads
Oromo 88.75 97.50 100 93.7
Others 11.25 2.5 0 6.3
Education level of HH heads
Illiterate 36.3 27.5 20 30
Literate 63.7 72.5 80 70
The age, sex structure and education of household members are given in Table 6. The average
the age of household head was 42.2 years while the age of the spouse was 34.4 years.

34
Table 6. Distribution of the studied household members by age, sex, and educational status.
Numbers in the body are mean (standard error) values of age (years for spouses) and number
of household members/family in the respective category.
Descriptors
Group
Overall Sheep
Dominant
Goat
Dominant
Mixed
Flock
Age of household head (yrs) 41.88(1.28) 43.03(1.78) 42.08(1.85) 42.21(0.90)
Age of wife (yrs) 33.86(1.04) 35(1.35) 34.22(1.58) 34.38(0.39)
Number of HH members/family
<15 years 2.68(0.20) 2.9(0.32) 2.85(0.27) 2.27(0.14)
15-65 years 2.59(0.12) 2.63(0.18) 2.88(0.20) 2.67(0.88)
> 65 years 0.05(0.03) 0.03(0.25) 0.05(0.05) 0.04(0.02)
Total 5.35(0.22) 5.55(0.34) 5.9(0.36) 5.54(0.16)
Female members of the HH 2.49(0.15) 2.65(0.26) 2.38(0.26) 2.5(0.12)
Male members of the HH 2.58(0.17) 2.83(0.20) 2.85(0.25) 2.71(0.12)
Female HH members
Between grade 1 to 6 1.29(0.114) 1.70(0.22) 1.48(0.25) 1.44(0.10)
Between in grade 7 to 12 0.20(0.05) 0.3(0.1) 0.08(0.04) 0.19(0.06)
Males HH members
Between grade 1 to 6 1.38(0.12) 1.63(0.17) 1.50(0.19) 1.47(0.09)
Between in grade 7 to 12 0.30(0.68)b 0.58(.12)a 0.2(0.82)c 0.341(0.05)
Means with the different superscript across rows are significantly different (p<0.05)
There were 5.5 household members in the house from which 2.3, 2.8 and 0.04 are 0 to 14, 15
to 65 and above 65 years, respectively. According to the report of CSA (2008), the average
household member in the region is 5.0 which is comparable with the current results. There
were on average 2.5 females and 2.71 males in the house. The ratio of male to female for the

35
studied household is almost similar to the value given for the region i.e. 50.4:49.6 (CSA,
2008)
The majorities (70%) of the interviewed household heads were literate while 30% of them
were illiterate and there was higher in mixed flock area (80%), followed by goat dominated
(72.5%) and it was fairly lower (64%) sheep dominated zones (Table 5). The literacy rate was
higher than most reports: 36.3% in Metama area of Amhara region (Tesfaye, 2008); 65% in
Alaba district of SNNPR (Tsedeke, 2007); 63% in central highlands of Ethiopia (Addisu et al.,
1998); this could be as a result of the preference of the youngsters in the study area to settle
with their families after completing their elementary and/or high schools. The endowment of
the Goma district to grow valuable cash crops and rear various livestock species may also
indirectly contribute for that decision. The number of household members who were in
primary and secondary schools was 1.44 and 0.19 for females and 1.47 and 0.34 for males
respectively. Considering both sexes, it is slightly higher than half of household members.
4.1.2 Land holding and its allocation
The average land holding per household in the study area was 1.93 ha. Coffee and cereals
occupy about 0.85 ha each (Table 7). There was no significant (p<0.05) difference in land
allocation for various purposes among the three sheep and goat density groups. The total land
holding in Goma is greater than the value reported for Debark district of Gondar 1.66ha
(Sisay, 2006); and Yerer district (1 to 1.5ha) for majority of Households (Samuel, 2005);
where as smaller than Layarmacho (2.03) and Metama (6.17) (Sisay, 2006). It was also

36
smaller than total land holding in Alaba of SNNPR (Tsedeke, 2007) and Bale high lands of
Oromia (Teshome, 2006).
Table 7. Mean (standard error) for land holding and its distribution for grazing and crop
by small ruminant density groups.
Land allocation
Groups
Overall Sheep
Dominant
Goat
Dominant
Mixed
Flock
Total land holding (ha) 1.8 (0.2) 2.3( 0.3) 2(0.3) 1.9(0.1)
Land for cereal (ha) 0.9(0.1) 1(0.2) 1(0.2) 0.8(0.1)
Land for coffee (ha) 0.8(0.3) 1.1(0.2) 0.7(0.1) 0.9(0.1)
Land for spice (ha) 0.1(0.0) 0.1(0.1) 0.1(0.0) 0.1(0.0)
Land for forage (ha ) 0.003 (0.01) 0.005(0.03) 0.015(0.05) 0.005(0.01)
Land for pasture (ha) 0.03(0.04) 0.08(0.01) 0.05(0.06) 0.05(0.03)
Fallow land (ha) 0.03(0.0) 0.05(0.2) 0.08(0.1) 0.05(0.1)
Land for man made forest
(ha)
0.03(0.0) 0.03(0.0) 0.03(0.1) 0.03(0.0)
The farmers in the study area allocate larger proportion of their land for coffee which is the
main cash crop. According to key informants, there is indirect relationship between small
ruminant holding and amount of land allocated for coffee. As the farmer allocates more land
for coffee he/she tends to have less number of small ruminants or not at all. The main reason is
if they graze/browse in the coffee farm, there will be a higher probability of destroying the
flowering part of the plant resulting in reduction of coffee production. The farmers generally
do not allow goat to browse in coffee plantation. The lands allocated for cultivated forage and

37
grazing pasture by house hold were 0.005 and 0.05 ha, respectively. This allocation of very
small land for livestock feed may be due to communal grazing areas commonly used for
grazing. Fallow land which can also be a sources source of grazing constitutes only about 0.05
ha.
4.1.3 Household ownership of different livestock species
The mean and the standard deviation of livestock holding in the study area are given in Table
8. On average, a household owned 3.6 cattle; 3.6 sheep; 2.1 goats; 0.2 equines and 2.7
chickens. There was significant (p<0.05) differences among areas classified by the small
ruminant density groups of the study area in holding different species of livestock. Farmers in
goat dominant areas own significantly higher number of cattle per HH; this may be due to
relatively larger land holdings and more land covered by cereal crop in the lowlands of Goma.
Farmers have larger cultivable land allocation for cereal crops in these areas. Significantly
(p<0.05) higher proportion of sheep were observed in highlands which are already categorized
as sheep dominant area. Less proportion of sheep was observed in lowland as these areas
dominated by goats. According to key informants, lowland areas of Goma are not suitable for
sheep because of diseases; and farmers usually consider sheep as highland animals. The
critical limitation for sheep in the lowland is acute deaths mainly due to respiratory diseases.
The lowland areas, which are represented by four kebeles, had higher concentrations of goat
population. According to key informants, in lowland areas of Goma, goats are more adapted
and productive than sheep because they are more resistant to diseases. Unlike most lowland
areas of the country, Goma lowlands are endowed with varieties of trees and shrubs that goats

38
can utilize. The rainfall is also much higher than most lowland areas of the country so that
better quantity and quality of forage is available throughout the year.
Table 8. Mean (standard error) number of livestock holding/household in the three areas
categorized according to small ruminant density.
Species
Group
Overall Sheep
Dominant
Goat
Dominant
Mixed
Flock
Cattle 3.3(0.3)b 4.8(0.6)a 3.1(0.5)b 3.6(0.3)
Sheep 4.7(0.3)a 2.3(0.3)c 2.8(0.4)b 3.6(0.2)
Goat 1.1(0.2)c 3.6(0.5)a 2.5(0.5)b 2.1(0.2)
Equines 0.3(0.0)a 0.2(0.5)b 0.03(0.0)c 0.2(0.0)
Chicken 2.1(0.4)b 5.5(0.7)a 1.1 (0.4)c 2.7(0.3)
Superscripts with different letters across the rows differ significantly (p<0.05)
4.2 Small Ruminant production system
4.2.1 Flock structure and production objectives
The age distribution of sheep and goat is presented by Figures 3 and 4 .The distribution by age
almost follow similar trend for both sheep and goats except for age 3-6 months and breeding
males. Breeding females represent larger proportion while suckling age are the second largest
age group in the flock; and the castrates represent the lowest proportion in the flock for both
species. From the sheep flock, 33.9%, 18.6%, 13.1%, 12.8%, 11.2% and 10.7% are
represented by ewes, lambs, rams, ram lambs (3-6months), ewe lambs (3-6 months) and
castrates, respectively. There are 35.1%, 25.9%, 12.5%, 11.7%, 9.8% and 5.0% does, kids, doe
kids (3-6month), buck kids (3-6 month), bucks and castrates, respectively.
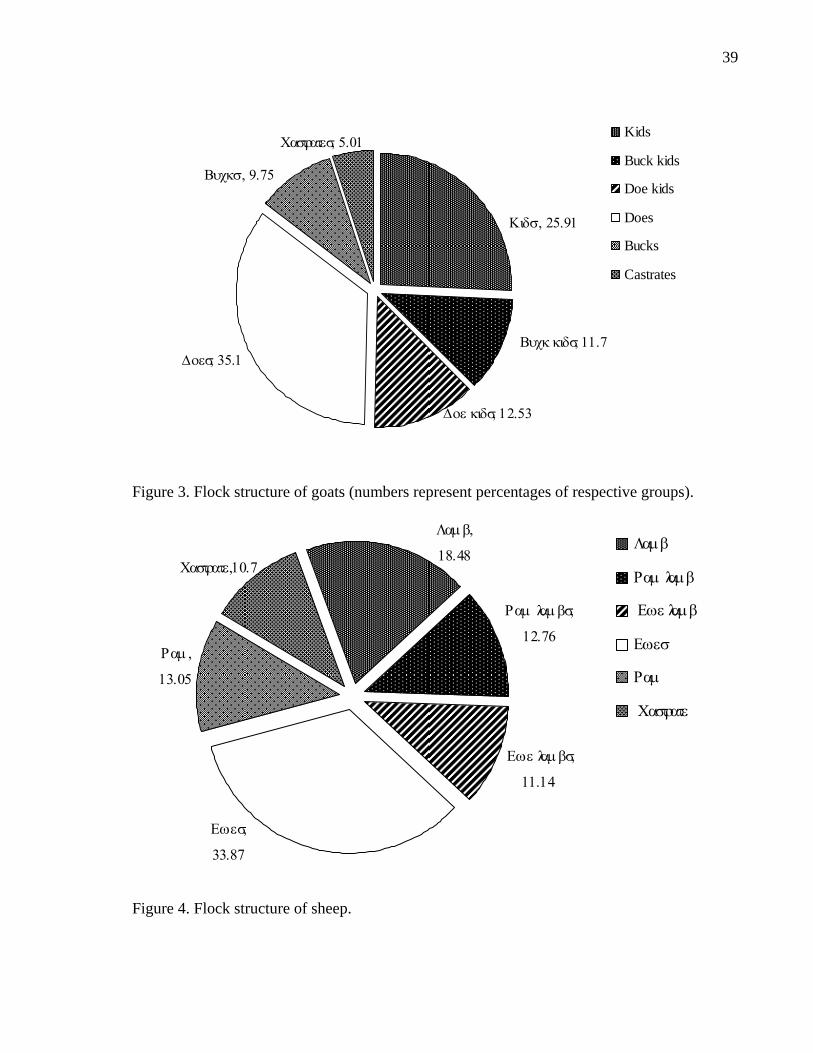
39
∆οε κιδσ, 12.53
Χαστρατεσ, 5.01
Βυχκ κιδσ, 11.7∆οεσ, 35.1
Κιδσ , 25.91
Βυχκσ , 9.75
Kids
Buck kids
Doe kids
Does
Bucks
Castrates
Figure 3. Flock structure of goats (numbers represent percentages of respective groups).
Ραµ ,
13.05
Εωεσ,
33.87
Λαµ β,
18.48
Ραµ λαµ βσ,
12.76
Χαστρατε,10.7
Εωε λαµ βσ,
11.14
Λαµβ
Ραµ λαµβ
Εωε λαµβ
Εωεσ
Ραµ
Χαστρατε
Figure 4. Flock structure of sheep.
40
The higher proportion of females may be attributed to the prevalent practice of retaining
females for breeding while males are either castrated in order to fetch higher price or sold
when they reach market age. The higher proportion of breeding females in the flock followed
by suckling age group for both species was in agreement with report from Alaba (Tsedeke
2007); and CSA (2008) stated higher proportion of females than males in national small
ruminant structure.
In Goma district, small ruminants are kept for different purposes (Table 9). About 94% of the
small ruminant keepers keep them mainly for income generation. Similar to this finding, small
ruminants are rear in many parts of the country mainly for income generation (Markos, 2006;
Sisay, 2006; Endeshaw, 2007; Tsedeke 2007; Getahun, 2008).
The second main reason for keeping small ruminant in the study area is for saving purpose.
According to group discussion participants and key informants in the area, coffee is the main
cash crop followed by chat. For most farmers, however, their economic profitability is highly
limited by various factors. In most cases, there is fluctuation of coffee yield; so farmers
nowadays keep small ruminants as saving and insurance. Keeping small ruminant for meat
and manure purposes were ranked as third and fourth important reason. Although its amount is
small, in most households farmers prefer small ruminant manure to cattle manure. Other
important reasons include for risk distribution, sacrifice and social heritages.
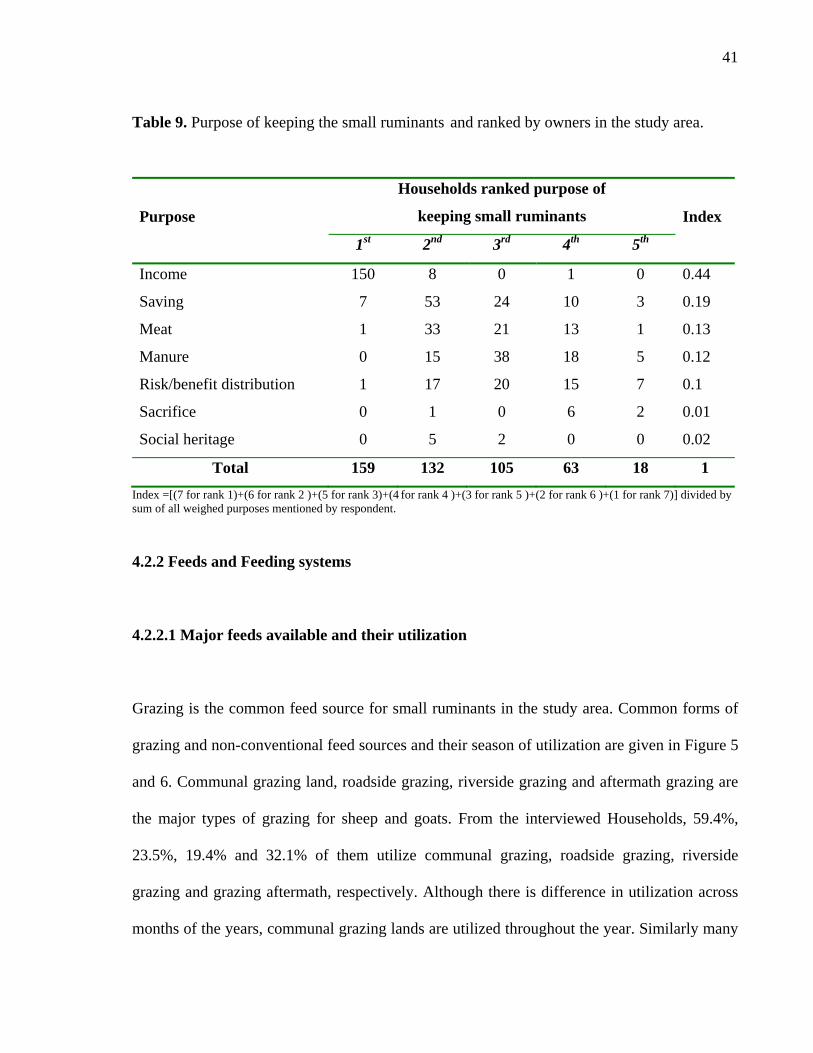
41
Table 9. Purpose of keeping the small ruminants and ranked by owners in the study area.
Purpose
Households ranked purpose of
keeping small ruminants Index
1st 2nd 3rd 4th 5th
Income 150 8 0 1 0 0.44
Saving 7 53 24 10 3 0.19
Meat 1 33 21 13 1 0.13
Manure 0 15 38 18 5 0.12
Risk/benefit distribution 1 17 20 15 7 0.1
Sacrifice 0 1 0 6 2 0.01
Social heritage 0 5 2 0 0 0.02
Total 159 132 105 63 18 1 Index =[(7 for rank 1)+(6 for rank 2 )+(5 for rank 3)+(4 for rank 4 )+(3 for rank 5 )+(2 for rank 6 )+(1 for rank 7)] divided by sum of all weighed purposes mentioned by respondent.
4.2.2 Feeds and Feeding systems
4.2.2.1 Major feeds available and their utilization
Grazing is the common feed source for small ruminants in the study area. Common forms of
grazing and non-conventional feed sources and their season of utilization are given in Figure 5
and 6. Communal grazing land, roadside grazing, riverside grazing and aftermath grazing are
the major types of grazing for sheep and goats. From the interviewed Households, 59.4%,
23.5%, 19.4% and 32.1% of them utilize communal grazing, roadside grazing, riverside
grazing and grazing aftermath, respectively. Although there is difference in utilization across
months of the years, communal grazing lands are utilized throughout the year. Similarly many

42
reports (Abule 2003; Teshome, 2006; Tsedeke, 2007; Tesfaye, 2008) indicated that natural
pasture is the main feed resource for small ruminants and cattle. The availability and quality of
forages are not favorable and uniform in nutrient quality all year round. As a result, for animal
that is not supplemented the gains made in the wet season is totally or partially lost in the dry
season (Alemayehu, 2003). Indigenous browses are other sources of feed in the study area
especially for goats while concentrates are not common. Similar to this finding, Yeshitila
(2007) also reported the utilization of indigenous browses as feed resources in Alaba district
of SNNPR.
0
10
20
30
40
50
60
70
80
Sep Oct Nov Dec Jan Feb Mar Apr May Jun Jul Aug
Months
Perc
ent o
f HH
communal land
Road side grazing
Grazing aftermath
Grazing riverside
Indegenous browses
crop residues
Figure 5. Common grazing sources and their seasonal utilization.

43
0
20
40
60
80
100
Sep Oct Nov Dec Jan Feb Mar Apr May Jun Jul Aug
Months
Perc
enta
ge o
f HH
Chat leftover Cofffe pulpcrop tillers and fillersweedsFruit leftover
Figure 6. Common non-conventional feed sources and their seasonal utilization.
The trend of feed utilization is described in Figures 5 and 6. Grazing river side is utilized in
dry season and short rainy seasons while intensity of its utilization then declines until October.
This may be due to the utilization of communal grazing lands in wet months. During the rainy
seasons farmers do not cut browses to feed small ruminants cut-and-carry is much common
during the dry season. Grazing aftermath is an important source of sheep and goat feed from
the start of the dry season to the start of the short rainy season after which their importance
declines. Indigenous browses are important sources animal feed from October to May when
other sources of feeds are becoming course and low in quality.
In Goma there is a wide utilization of non-conventional feed sources such as chat left over,
home left over, fruit left over, enset and banana parts, weeds and crop tillers and fillers. From
the interviewed households, 83.5% fed their animals (particularly castrates) with chat and
home left-over. According to group discussion participants, after being utilized by family
members chat is not dropped rather collected and put for small ruminants. So its utilization
was throughout the year for most of the households.

44
Weeds and crop tillers of maize and sorghum are also other common feed sources for sheep
and goats. Similarly other reports indicated that farmers use crop fillers and tiller during wet
season in Alaba of SNNPR (Tsedeke, 2007; Yeshitila, 2007). When the farmers move to crop
field for weeding they take their animals with them and feed them. However, their sources
limited to rainy seasons although small number of farmers have access to irrigation and then
weed their crop during other times of the year too.
Gazing lands are communally owned while some households have small private grazing areas
locally called kallo between their cropping fields. While working on their cropland they keep
their animal with them in these small grazing areas.
In the current study area sheep and goats sped most of their time being sheltered in the house.
On average they only spent about 6 hours in days grazing/browsing during the day time. They
are under close supervision through out the day and in all seasons of the year to prevent them
from damaging crop cultivation and to protect them from predators. In the highlands where
sheep are dominant there is small grazing time; small ruminants are protected from cropland
(coffee cultivation and fruit plantation) and from predators especially leopard and hyena. In
lowlands areas, where goats are dominating and grazing lands are relatively larger they are
also protected from damaging cropland and to be protected from wild animals like leopard,
hyena and monkey. Monkeys were treat for kids/lambs; according to key informants, they take
out the eye of kids/lambs first, then kill them to predate. There is no significant (p<0.05)
variation across the three areas classified according to small ruminant density in allowing

45
grazing or browsing time for sheep and goats; however, according to group discussion there a
is difference in allowable grazing time between the two species with more restriction to goats.
From the interviewed households 53.8% of them herd sheep alone, 12.5 % goat alone, 22.5%
sheep and goats together and 11.2% keep small ruminants with large ruminants while grazing.
The tendency of keeping small ruminants with large ruminant is lower, this because of their
feeding behavior. According to group discussion with participants, farmers prefer feeding
goats alone instead of gazing/browsing them with sheep. This may be due to the fact that the
goats have the ability to browsing many plant species within short period and less time is
required to fill their gut than sheep.
In wet seasons of the year when the major feed source is communal grazing, 79.4% of
households use herded grazing system so that sheep and goats do not go into crop fields as
herders are closely following. In this time road-side grazing and private grazing are also were
used though the size is much smaller. About 13% of household uses both herd grazing and
tethered grazing (i.e herded grazing then tether or vice versa). Tethering and cut and carry
methods were practiced in wet season.
In dry seasons, majority oh households (54.4%) tether their animals while 25.6% of
households use cut and carry methods and only few of them herd (12.5%) their flock.
Although the intensity and the purpose differs similar practices were also reported by different
authors; Tesfaye (2008) reported tethering of goat in wet season in Metama district of Amhara
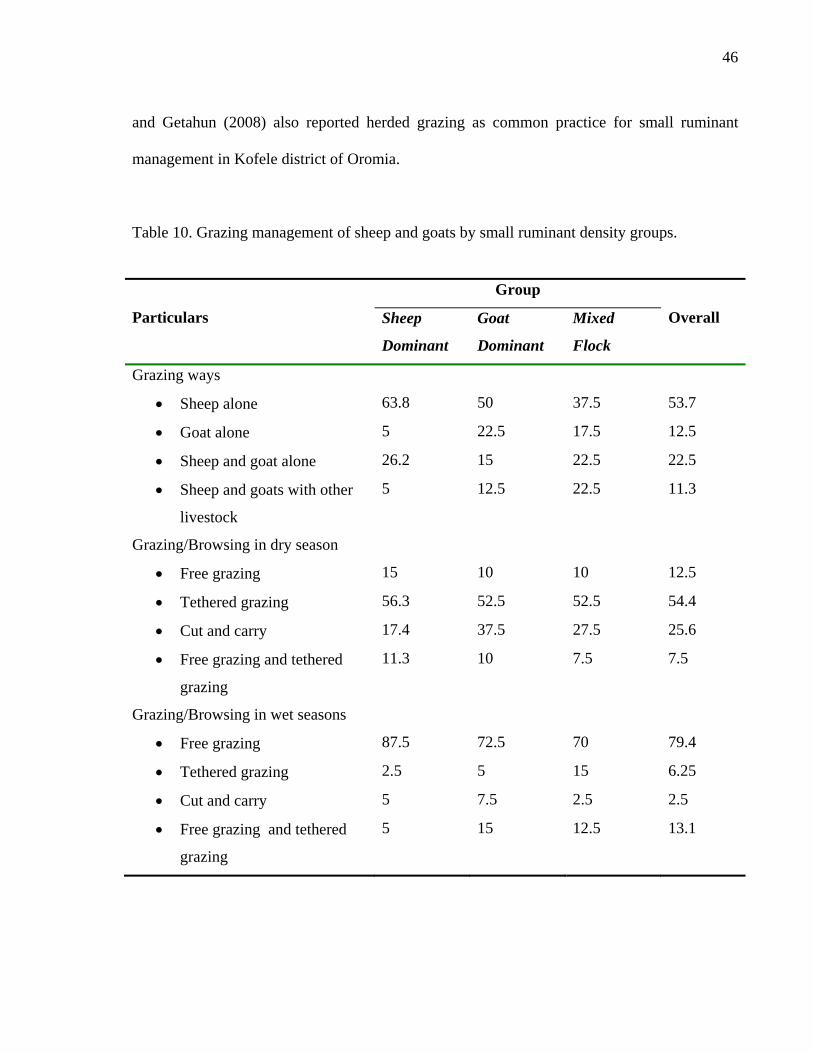
46
and Getahun (2008) also reported herded grazing as common practice for small ruminant
management in Kofele district of Oromia.
Table 10. Grazing management of sheep and goats by small ruminant density groups.
Particulars
Group
Overall Sheep
Dominant
Goat
Dominant
Mixed
Flock
Grazing ways
• Sheep alone 63.8 50 37.5 53.7
• Goat alone 5 22.5 17.5 12.5
• Sheep and goat alone 26.2 15 22.5 22.5
• Sheep and goats with other
livestock
5 12.5 22.5 11.3
Grazing/Browsing in dry season
• Free grazing 15 10 10 12.5
• Tethered grazing 56.3 52.5 52.5 54.4
• Cut and carry 17.4 37.5 27.5 25.6
• Free grazing and tethered
grazing
11.3 10 7.5 7.5
Grazing/Browsing in wet seasons
• Free grazing 87.5 72.5 70 79.4
• Tethered grazing 2.5 5 15 6.25
• Cut and carry 5 7.5 2.5 2.5
• Free grazing and tethered
grazing
5 15 12.5 13.1

47
According to key informants, higher proportions of households tether their animals during dry
season because in dry season there is limited grazing potential. As a result sheep and goats
tend to wonder long distance and damage annual and perennial crops. They can also be
attacked by wild animals.
Although the practice of supplementing sheep and goats with concentrates is not common,
farmers supplement their sheep and goats with non-conventional supplements. During dry
season about 92% of the households supplement their animals from which two-third of them
supplement in both seasons of the year. Similar finding was also reported by Getahun (2008);
small ruminants are supplemented in two farming systems of southern Ethiopia by the
majority of farmers. In goat dominating and mixed flock areas of the current study farmers, do
not supplement during the wet season.
Figure 7 presents the supplemented group by age and supplemental feeds. In Goma, the
majority of farmers usually supplements breeding females and castrates. This may be because
the farmers in study area have few animals in which they do not separately supplement
specific group. Almost all castrates targeted for fattening were supplemented. Farmers
supplement salt, chat left-over, food-leftover, fruit left-over for all age. Similar finding was
also reported by Yeshitila (2007) in Alaba, the utilization of non-conventional feeds for
animal supplementation (chat left over, brewers recipes and fruit leftovers).

48
77
54
23
41
77
54
38
41
51
34
18
26
57
34
32
32
81
61
48
49
97
66
44
53
0 20 40 60 80 100 120
Ewe
Castrate Sheep
Does
Castrate Goat
Shee
p an
d go
at b
y ag
e
Number of HH supplementing
Maize grain Oil seed cakes Fruit leftoverHome made breweries Food left over Salt
Figure 7. Supplementation practices of households.
Majority of the farmers supplemented small ruminant during both seasons (55.1%) followed
by dry season (37.4%) than wet season (7.5%) (Table 11). According to key informants, in

49
these sites relatively better feeds are available in wet season and farmers who tether their
animals and fatten are supplementing their animals in both seasons. In most cases, the farmers
supplement sheep and goats when the feed is available; but farmers who practice tethering are
supplementing their animal’s once (23.1%) or twice (11%) a day.
Table 11. Season and frequency of supplementation of small ruminants in three areas. Body of
the table gives percentage of households under the respective category.
Particulars
Group
Overall Sheep
Dominant
Goat
Dominant
Mixed
Flock
Season of Supplementation
Dry season 32 48.7 36.4 37.4
Wet season 14.7 7.5
Both 53.3 51.3 63.6 55.1
Frequency of supplementation
Daily 29.3 12.8 21.2 23.1
Twice a day 9.3 27.3 10.9
When ever available 61.3 87.2 51.5 66
4.2.3 Reasons for tethering sheep and goats
The majority (86.3%) of the interviewed households are accustomed to tether their animals in
the study area. The major reasons includes: avoid crop and vegetation damage (93.5%),
protect from predator (53.6%) to save labor (50%) and to reduce aggressiveness in case of
male animals (1.45%) and to utilize marginal land (1.45%) (Table 12). Tsedeke (2007) also
reported the importance of tethering animals mainly to avoid crop damage and to save labor.
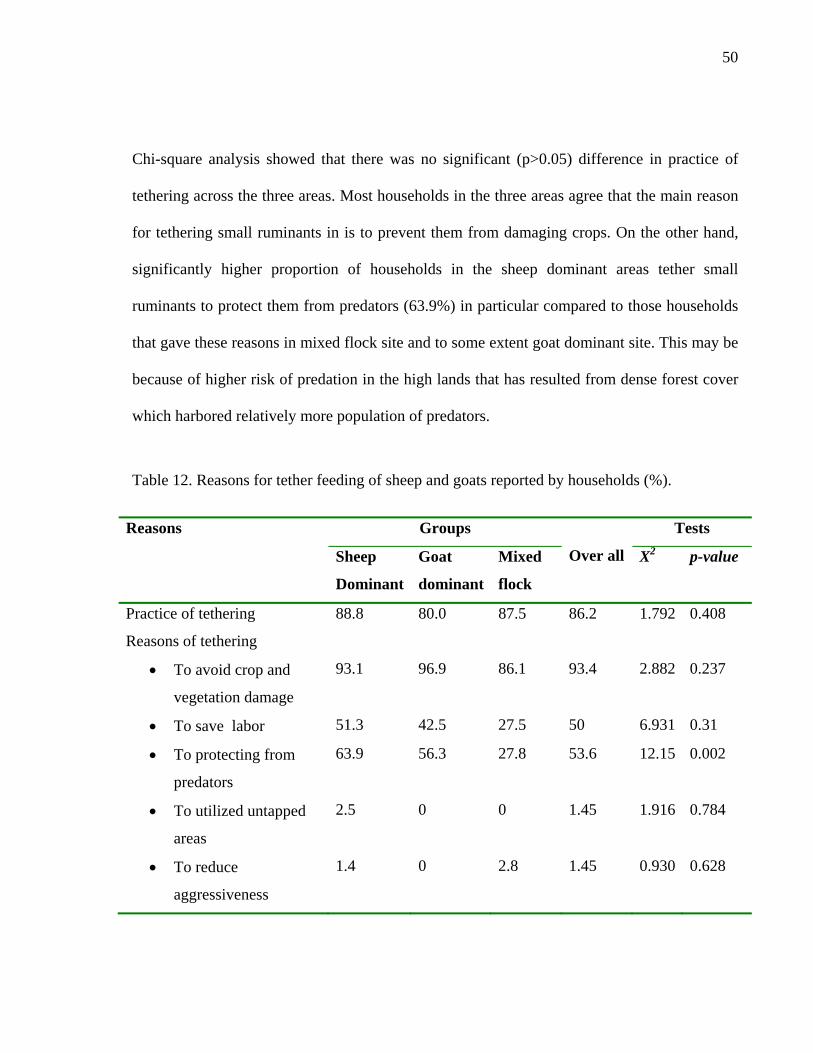
50
Chi-square analysis showed that there was no significant (p>0.05) difference in practice of
tethering across the three areas. Most households in the three areas agree that the main reason
for tethering small ruminants in is to prevent them from damaging crops. On the other hand,
significantly higher proportion of households in the sheep dominant areas tether small
ruminants to protect them from predators (63.9%) in particular compared to those households
that gave these reasons in mixed flock site and to some extent goat dominant site. This may be
because of higher risk of predation in the high lands that has resulted from dense forest cover
which harbored relatively more population of predators.
Table 12. Reasons for tether feeding of sheep and goats reported by households (%).
Reasons Groups
Over all
Tests
Sheep
Dominant
Goat
dominant
Mixed
flock
X2 p-value
Practice of tethering 88.8 80.0 87.5 86.2 1.792 0.408
Reasons of tethering
• To avoid crop and
vegetation damage
93.1 96.9 86.1 93.4 2.882 0.237
• To save labor 51.3 42.5 27.5 50 6.931 0.31
• To protecting from
predators
63.9 56.3 27.8 53.6 12.15 0.002
• To utilized untapped
areas
2.5 0 0 1.45 1.916 0.784
• To reduce
aggressiveness
1.4 0 2.8 1.45 0.930 0.628

51
4.2.4 Feed shortage
Feed shortage is one of the limitations for small ruminant production in the area. From the
interviewed households, 86.3% of the respondents reported feed shortage in the area. Chi-
square analysis showed that there is variation within the district with higher intensity of feed
shortage in highland areas where sheep dominates. Although the shortage is indicated across
all seasons of the year higher percentage (47.1%) was reported for dry season, while 33.3%
and 19.6% were also reported for wet and both seasons, respectively. The higher feed shortage
during the dry season may be due to the majority of farmers use communal grazing land which
provides little forage in dry season; as most lands are covered by perennial crop, the animal
are not allowed to move freely. The reasons for higher intensity of feed shortage in the high
lands may be associated with the higher intensity of annual and perennial crops cultivation and
corresponding shrinkage of grazing lands.
Feed shortage as a constraint for small production is similarly reported by many authors in
different parts of the country (Abule, 2003; Kedija, 2006; Teshome, 2006; Endeshaw, 2007;
Getahun, 2008; Tesfaye, 2008).
Various reasons have been viewed by respondents for the prevailing feed shortage in the area
(Table 13). Most households (95%) in the study area agreed that the main reason for feed
shortage in the area was expansion of arable farming and increase allocation of land for
perennial crops particularly for coffee cultivation which in turn reduced grazing lands.
According to the information obtained from OoARD office of the district (Ato Serawit
Hailemariam; personal communication), several millions of coffee seedlings have been
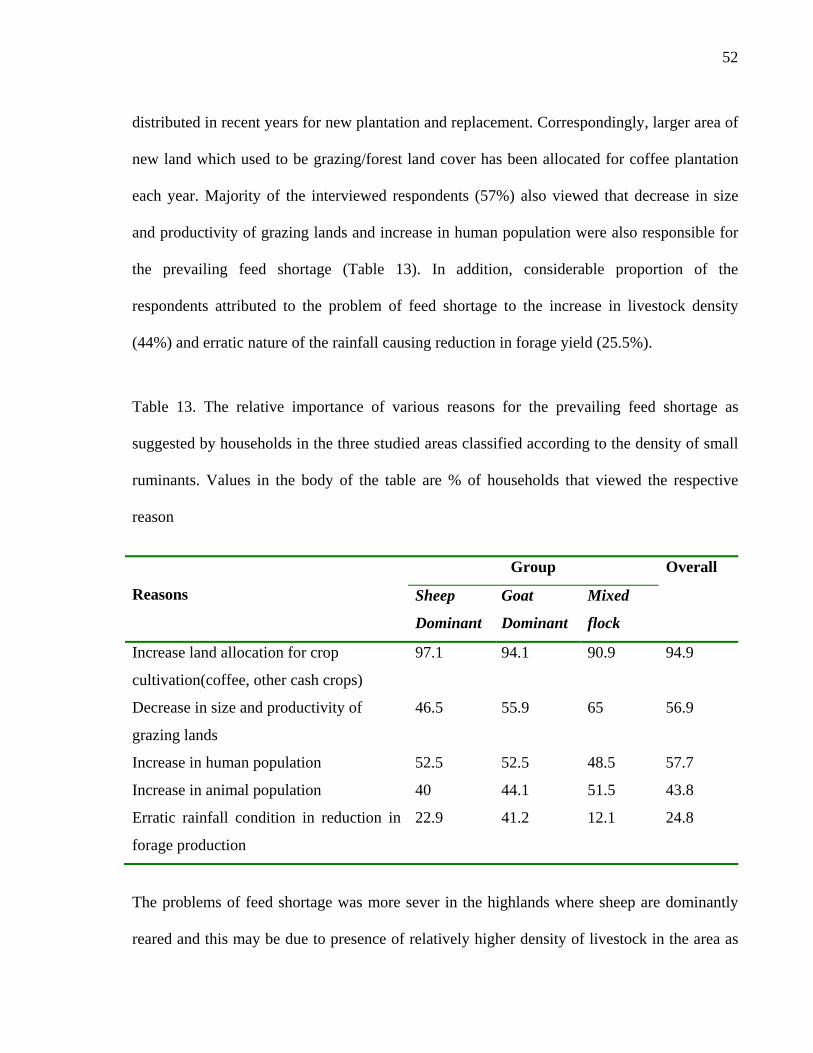
52
distributed in recent years for new plantation and replacement. Correspondingly, larger area of
new land which used to be grazing/forest land cover has been allocated for coffee plantation
each year. Majority of the interviewed respondents (57%) also viewed that decrease in size
and productivity of grazing lands and increase in human population were also responsible for
the prevailing feed shortage (Table 13). In addition, considerable proportion of the
respondents attributed to the problem of feed shortage to the increase in livestock density
(44%) and erratic nature of the rainfall causing reduction in forage yield (25.5%).
Table 13. The relative importance of various reasons for the prevailing feed shortage as
suggested by households in the three studied areas classified according to the density of small
ruminants. Values in the body of the table are % of households that viewed the respective
reason
The problems of feed shortage was more sever in the highlands where sheep are dominantly
reared and this may be due to presence of relatively higher density of livestock in the area as
Reasons
Group Overall
Sheep
Dominant
Goat
Dominant
Mixed
flock
Increase land allocation for crop
cultivation(coffee, other cash crops)
97.1 94.1 90.9 94.9
Decrease in size and productivity of
grazing lands
46.5 55.9 65 56.9
Increase in human population 52.5 52.5 48.5 57.7
Increase in animal population 40 44.1 51.5 43.8
Erratic rainfall condition in reduction in
forage production
22.9 41.2 12.1 24.8

53
well as high intensity of annual and perennial crop cultivation which in turn causes shrinkage
of grazing lands. In low land areas where goats are dominant relatively higher proportion of
households reported the problem of rainfall shortage as a limitation for low fodder production.
This may be due to low and erratic nature of rainfall in lowlands than in relatively wetter
highlands.
Farmers in study area have limited practice of feed conservation. Only about 13% of the
interviewed households reported for practicing feed conservation in the form of hay while
other feed conservation methods like silage are not known in the area. The major reason for
not practicing feed conservation techniques were lack of awareness, skill and experience
(85%) and absence of surplus feed to be conserved feed (56.1%). According to key
informants, the farmers in the area have no experience of conserving feed. During the old
days, the district had more forest cover and receives better rainfall almost throughout the year;
as a result the animals used to graze all year round. Nowadays the grazing lands are limited
and almost there is no grass/legume to be conserved.
4.2.5 Water sources and utilization
River water was reported to be the major water source (56.9%) for small ruminants in the
study area. Other water sources include ponds, deep well, pipe water and rain water during
rainy season consist 6.8%, 5.6%, 4.4% and 6.9%, respectively while others (19.4%) do not
take sheep and goats to watering points rather supply at homestead. There are bigger and
smaller rivers which are water sources during entire year in Goma. The district also receives
54
relatively higher rainfall amount across periods of the year than most part of the country
(IPMS, 2007). Similar result was also reported by Tesfaye (2008) that water was not a limiting
factor in small ruminant production in Metama district. However, Abule (1998) reported river
was the major water source in mid rift valley area for small ruminants especially for goats and
water was limiting factor. For Kereyu pastoralists Abule (2003) also indicated that water is a
limiting factor in livestock production. Relatively smaller time (on average 9 minutes) was
reported for traveling to main water in the area and 7.7 minute travel to ponds in the study
area.
The watering frequencies of sheep and goat in dry and wet seasons are shown in Table 14.
Shorter watering frequencies were used to water sheep and goats in the study area. This may
be due to easy accessibility of watering points in close distances in most part of the district. In
dry season one-third of households watered goats once a day. The proportion of households
that water their goats once a day and twice in a day are 79.4% and 15.6%, respectively.
Watering with more than a day frequency is very minimal. Sheep in the area are watered once
a day (46.3%) and twice a day (50%) in the dry season. Similarly, watering frequency of more
than once in a day is small.

55
Table 14. Watering frequency (%) of sheep and goats in three areas classified by small
ruminant density groups.
Frequencies
Group
Overall Sheep
Dominant
Goat
Dominant
Mixed
Flock
Goat dry season
Any time 2.5 0 12.5 4.38
Once a day 77.5 92.5 70 79.36
Twice a day 20 7.5 15 15.63
Ever other day 0 0 2.5 0.63
Sheep Dry season
Any time 1.3 2.5 5 2.5
Once a day 52.7 50 30 46.25
Twice a day 43.5 47.5 65 50
Ever other day 2.5 0 0 1.25
Goat wet season
Any time required 1.3 2.5 30 20
Once a day 17.5 7.5 15 14.36
Twice a day 3.8 0 5 3.13
Ever other day 1.3 40 0 4.38
Ever three day
No watering
3.8
72.3
2.5
47.5
5
45
13.75
44.38
Sheep wet season
Any time required 1.3 22 10 8.75
Once a day 37.5 60 35 42.5
Twice a day 8.8 0 37.5 13.75
Ever other day 0 7.5 0 1.88
Ever three day
No watering
3.8
48.6
0
10.5
2.5
15
2.5
30.6

56
In wet season, there is no shortage of water so the majority of households do not water sheep
and goats. Sheep and goats utilize rain water on land surfaces so about 20% of households
watered goat water anytime required. While about 42.5% of households watered sheep once a
day. The shorter watering frequencies reported in study area may be due to ample water
resources and most of households water their flock from what they consume; as most of them
tethered in most part of the year.
From the interviewed households, only 8.1% reported water shortage. More households
(12.5%) responded water shortage in mixed flock site. According to key informants, there are
coffee processing plants in mixed flock zones that use excessive water that has negatively
influenced its utilization by livestock. So the source of problem is not natural; it can be
resolved by proper policy on utilization of water resource by different community groups.
4.2.6 Small ruminant management and husbandry
4.2.6.1 Small ruminant housing
All farmers in Goma district shelter their animals during the night to protect them from
predators and adverse climatic conditions. From the interviewed households, 95.6%, 98.3%
and 4.4% shelter their sheep and goats for reasons of protecting from bad weather, predators
and to provide supplement in the evening respectively (Table 15). Small ruminant are
sheltered for protection in most rural communities such as, southern part of Ethiopia
(Endeshew, 2007; Tsedeke, 2007); in central rift valley (Abule, 1998; Samuel, 2006); and in

57
Metama district of Amhara region (Tesfaye, 2008). However, places of sheltering and type of
house vary.
Table 15. Reasons of housing small ruminants by households (%).
Particulars
Group
Overall Sheep
Dominant
Goat
Dominant
Mixed
Flock
Bad weather 93.8 95 100 95.6
Predator 96.3 100 100 98.1
Supplementation 3.8 0 10 4.38
Sheep and goat sheltered in most cases in separate house. Places of confinements are given in
Table 16. From the interviewed households, 39.4%, 38.2% and 22.5% of households shelter
their animals in adjoin house, separately constructed house and main house with a family
respectively. In sheep dominant sites, the number of sheep and goats owned is smaller than
goat dominant sites, so the farmers may use part of their house for sheep and goat
confinement. Places of sheltering varies in different places; small ruminant are sheltered in
main house with a family (Tsedeke, 2007) in Alaba of SNNPR while Coppock (1994)
reported corrals used for adults while family house used for lamb/kids in Borena pastoralist.
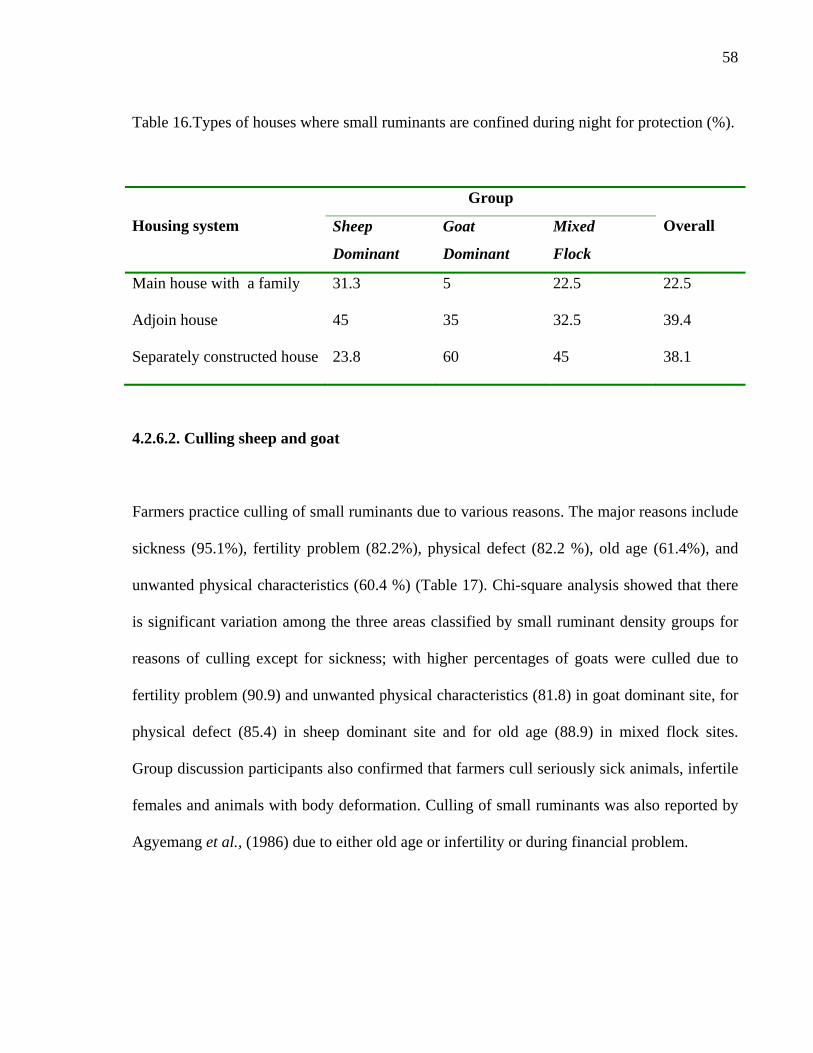
58
Table 16.Types of houses where small ruminants are confined during night for protection (%).
Housing system
Group
Overall Sheep
Dominant
Goat
Dominant
Mixed
Flock
Main house with a family 31.3 5 22.5 22.5
Adjoin house 45 35 32.5 39.4
Separately constructed house 23.8 60 45 38.1
4.2.6.2. Culling sheep and goat
Farmers practice culling of small ruminants due to various reasons. The major reasons include
sickness (95.1%), fertility problem (82.2%), physical defect (82.2 %), old age (61.4%), and
unwanted physical characteristics (60.4 %) (Table 17). Chi-square analysis showed that there
is significant variation among the three areas classified by small ruminant density groups for
reasons of culling except for sickness; with higher percentages of goats were culled due to
fertility problem (90.9) and unwanted physical characteristics (81.8) in goat dominant site, for
physical defect (85.4) in sheep dominant site and for old age (88.9) in mixed flock sites.
Group discussion participants also confirmed that farmers cull seriously sick animals, infertile
females and animals with body deformation. Culling of small ruminants was also reported by
Agyemang et al., (1986) due to either old age or infertility or during financial problem.

59
Table 17. Reasons for culling sheep and goats by household in the study area (%).
4.2.6.3 Small ruminant castration and fattening practices
Castration of young male animals before selling is practiced by majority of households in
Goma district (Table 18). Three fourth of households from sheep dominant and mixed flock
sites and all households in goat dominant areas castrated their animals before market in order
to fetch higher prices. Other main reasons for castration were to receive higher price, to reduce
aggressiveness and to avoid mating. In agreement with the present results, the practice of
castration has been reported in different parts of the county mainly to fatten and to obtain
more prices (Agyemang k. et al., 1986; Takele et al., 2006; Tsedeke, 2007).
Body confirmation, age and physical characteristics were major characteristics used to select
for small ruminant for castration in the district. Almost all households mentioned body
confirmation as characteristics to select animals to be castrated. Age and physical
Particulars Group
Overall
Tests
Sheep dominant
Goat Dominant
Mixed flock
X2 p-value
Old age
32.5
75.8
88.9
61.4 6.91 0.032
Health problem
100.0
93.9
88.9
95.1 2.17 0.33
Infertility
82.9
90.9
67.9
82.2 9.26 0.010
Physical defect
85.4
84.8
70.4
82.2 6.064 0.048
Unwanted characteristics
46.3
81.8
55.6
60.40 14.136 0.007

60
characteristics were also reported by 80.8% and 70.8% of households, respectively while
breed was given least priority by the farmers. Selecting animals with good body confirmation
by most farmers may be they usually have notice-able muscle development and fat deposition
that make them attractive in the market after they are fed. Age is important during castration
because very young animals can’t recover easily and go to the fattening stage (fat deposition).
Therefore, farmers select stronger animals with good body confirmation.
According to group discussion with participants, physical characteristics like body length and
height were given priority when selecting sheep and goats for castration, while tail size and
width are also preferred trends for sheep. This may be due to its relation with local market
demand as it is area of fat deposition which is the interest of local consumers. In most cases,
brown, white or mixture of the two are the dominant colors in the area; so color is not given
special attention in the study area for sheep. Although some colors are preferred for some
ritual ceremonies, there is no such a specific preference of color for fattened goats.
Age has been one of the criteria in selecting small ruminants for castration. The average age
for castrating sheep is about one year while the average age for goats is slightly higher (13
months). However, a larger range of age (min 6 and max 24) was observed for both species in
the study area.
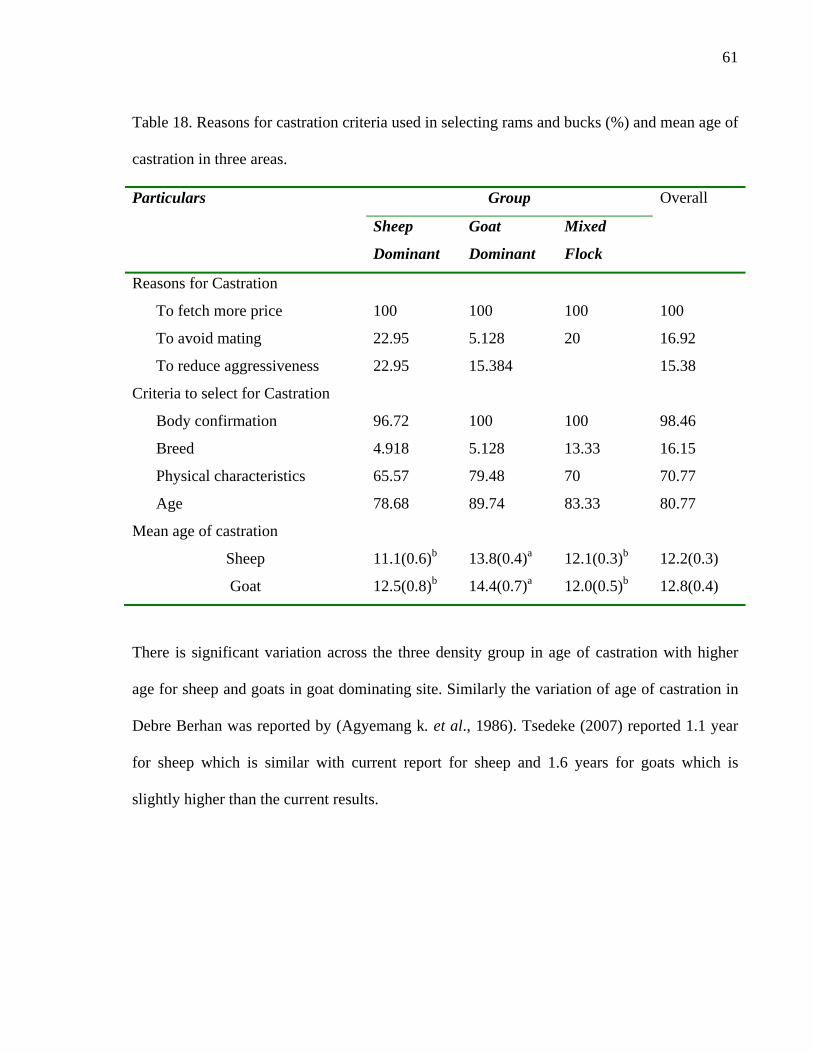
61
Table 18. Reasons for castration criteria used in selecting rams and bucks (%) and mean age of
castration in three areas.
Particulars Group Overall
Sheep
Dominant
Goat
Dominant
Mixed
Flock
Reasons for Castration
To fetch more price 100 100 100 100
To avoid mating 22.95 5.128 20 16.92
To reduce aggressiveness 22.95 15.384 15.38
Criteria to select for Castration
Body confirmation 96.72 100 100 98.46
Breed 4.918 5.128 13.33 16.15
Physical characteristics 65.57 79.48 70 70.77
Age 78.68 89.74 83.33 80.77
Mean age of castration
Sheep 11.1(0.6)b 13.8(0.4)a 12.1(0.3)b 12.2(0.3)
Goat 12.5(0.8)b 14.4(0.7)a 12.0(0.5)b 12.8(0.4)
There is significant variation across the three density group in age of castration with higher
age for sheep and goats in goat dominating site. Similarly the variation of age of castration in
Debre Berhan was reported by (Agyemang k. et al., 1986). Tsedeke (2007) reported 1.1 year
for sheep which is similar with current report for sheep and 1.6 years for goats which is
slightly higher than the current results.
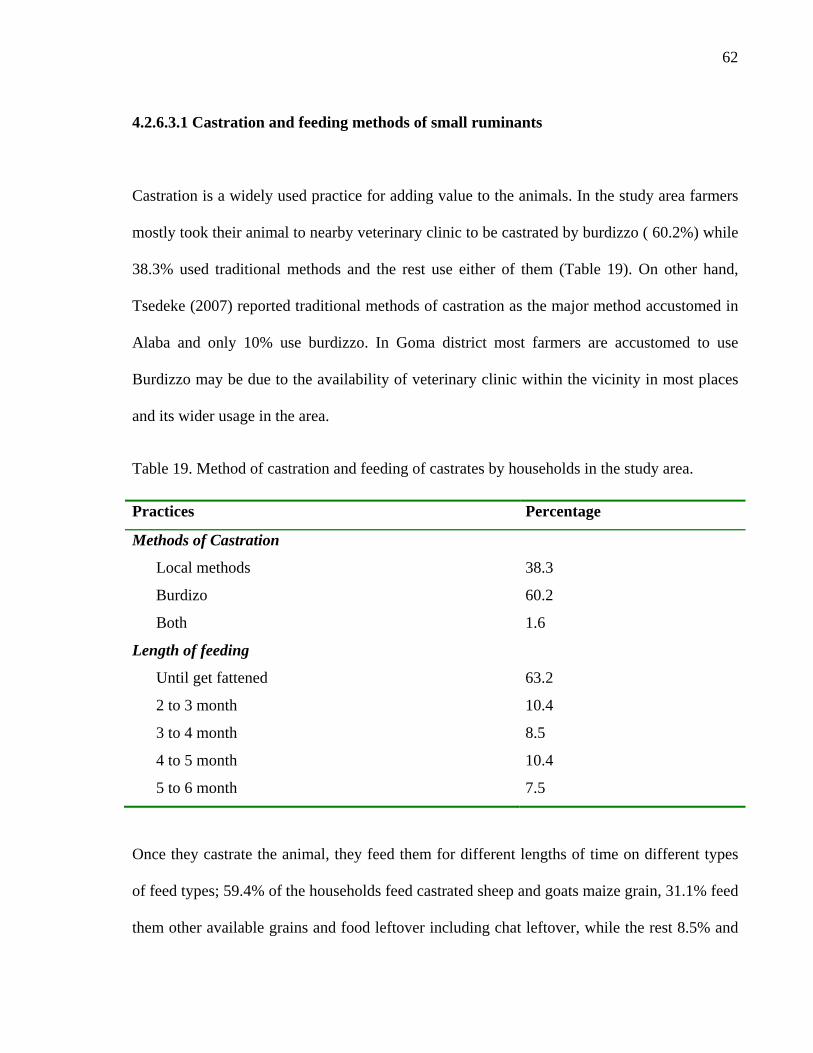
62
4.2.6.3.1 Castration and feeding methods of small ruminants
Castration is a widely used practice for adding value to the animals. In the study area farmers
mostly took their animal to nearby veterinary clinic to be castrated by burdizzo ( 60.2%) while
38.3% used traditional methods and the rest use either of them (Table 19). On other hand,
Tsedeke (2007) reported traditional methods of castration as the major method accustomed in
Alaba and only 10% use burdizzo. In Goma district most farmers are accustomed to use
Burdizzo may be due to the availability of veterinary clinic within the vicinity in most places
and its wider usage in the area.
Table 19. Method of castration and feeding of castrates by households in the study area. Practices Percentage
Methods of Castration
Local methods 38.3
Burdizo 60.2
Both 1.6
Length of feeding
Until get fattened 63.2
2 to 3 month 10.4
3 to 4 month 8.5
4 to 5 month 10.4
5 to 6 month 7.5
Once they castrate the animal, they feed them for different lengths of time on different types
of feed types; 59.4% of the households feed castrated sheep and goats maize grain, 31.1% feed
them other available grains and food leftover including chat leftover, while the rest 8.5% and

63
0.91% feed beans and mill house wastes by products, respectively. About three fourth of
fatteners feed until they get fattened while, 10.4% keep 2 to 3 months, and 8.5% keep 3 to 4
months and 10.4% 4 to 5 months while 7.5% keep 5 to 6 months(Table 19).
4.2.6.4 Entry and Exit of small ruminant flock of households
In the study area sheep and goat enter and leave the farmers flock through a number of ways
(Table 20). Sheep and goats enter to flocks through births, purchases, and sharing
arrangements in 56.9%, 26.9%, and 1.9% of the households, respectively. Chi-square analysis
showed that there is no significant (p<0.05) variation across the three flock density areas
except for home born entry in which significantly higher proportion (62.5%) was found in
goat dominant site.
The flock exit of sheep and goats included sale (69.4%), death (46.3%), slaughter (28.8%),
predator (33.3%), theft (5.63%) and share arrangements (3.13%). The overall figure shows
that sale accounts for the major way of exit, followed by death and predator. However, Chi-
square analysis showed that, there is no significant (p<0.05) differences across the study sites
except for loss by death and predators. Significantly higher proportion (54.4%) of households
reported for loss by death in sheep dominating site than the rest and 50% of households
reported lose by predators in goat dominating site. According to group discussion participants
and key informants these are one of the limitations in small ruminant production in the district
and most disease causes are acute; their causes and treatments are not generally known. In
addition, there is a vast forest cover in the area where wild animals are inhabited that can be a

64
threat for small ruminants especially the suckling age groups. The entry and exit of small
ruminants through similar routes was also reported in southern and other parts of the country
(Endashew, 2007; Tsedeke, 2007; Tesfaye, 2008).
Table 20. Routes of flock entry and exit (%).
Routes
Group
Overall
Tests
Sheep
dominant
Goat
dominant
Mixed
flock
X2 p-value
Exit Ways
Sale 71.25 72.5 62.5 69.38 4.091 0.129
Death 54.43 30 47.5 46.25 6.390 0.041
Slaughter 36.25 15 27.5 28.75 4.211 0.122
Theft 7.5 0 7.5 5.625 5.957 0.051
Predator 32.5 50 17.5 33.125 16.645 0.000
Gift 2.5 0 2.5 1.875 1.028 0.598
Share arrangements 1.25 5 5 3.125 0.604 0.739
Entry ways
Home Born 60 62.5 45 56.875 6.931 0.031
Share arrangement 1.25 2.5 2.5 1.875 3.028 0.220
Purchase 30 10 37.5 26.875 1.635 0.441
Not Replacing 23.75 22.5 27.5 24.375 8.618 0.013
4.2.7. Consumption of small ruminant and their products
In Goma district, small ruminant meat was consumed during various occasions. However, the
time is mostly restricted to holidays and some occasions like weeding, births in a family,
funerals and during coffee harvest (Table 21). The majority (90.7%) of households consume

65
meat during festival times while 25 % of households consume small ruminant meat during
coffee harvest season. According to group discussions, slaughtering small ruminants when
coffee is to harvest is a common among farmers in area in “good coffee years’’. Weeding time
(23.1%) is also a time when small ruminants are slaughtered. Other reasons include birth in
family (8.2%), during hosting guests (7.5%) and circumcision (6.7%) and funerals (10.6).
However, the former three are becoming very rare these days while the later one is common.
Table 21. Occasions when households consume small ruminant meat in the three areas
classified according to small ruminant density.
Occasions
Group
Overall Sheep
Dominant
Goat
Dominant
Mixed
Flock
Holidays 90.0 95.0 87.5 90.6
weeding 27.5 22.5 15.0 23.1
when animal available 17.5 7.5 15.0 14.4
Births in family 12.5 0 7.5 8.1
Guests 10.0 5.0 5.0 7.5
Circumcise 3.8 5.0 15.0 6.9
Funerals 15.0 2.5 10.0 10.6
Crop(coffee) harvest 36.7 7.5 20.0 25
There is no report of small ruminant milk utilization in Goma farming community. However,
other reports showed the utilization of sheep and goat milk in different parts of the country
(Workneh, 2003; Tsedeke, 2007; Getahun, 2008). According to group discussion held with
farmers and key informants, Goma community do not utilize small ruminant milk; may be due
to the smaller number of small ruminants and their utilization of cows as a primary sources of

66
milk and its products reared and their preference for black coffee. Moreover, before some
decades they were even reared by the majority of farmers in the area.
All interviewed farmers reported they sell the skin of small ruminants after slaughter. This
may be due to higher price for the skin. Farmers sell skin to any agent in nearby town within a
day time. No farmer responded as preserving small ruminant skin immediately after flaring.
According to key informants, farmers in the area also use small ruminant skin in making
equine saddle for transportation of both agricultural products and family members during
market days. Currently, the use equine for transportation is becoming limited as most of the
kebeles can be accessed by vehicles especially during the dry seasons.
4.2.8 Productive performances of small ruminants
The number of small ruminants at the beginning of the flock monitoring (by species and and
gender) is indicated on Figure 8 while the body weight changes during the study period are
given by Figure 9 for sheep and Figure 10 for goats.
A total of 109 sheep out of which 72 (66.1%) females and 37 (33.9%) males and 76 goats out
of which 53 (69.7%) females and 23 (30.3%) males were monitored during the study period
(Figure 8). From both species there are no male animal observed greater than 2 years (Figure 8
and 10) this may be due to young weaned ram and buck are either directly sold/slaughter or
castrated to be fattened and sold.

67
The monitoring activities were carried out for the period of six months (October 2008 to
March 2009). During this period, the body weight of older age groups decreased except for the
0-1 age groups which showed increase in both species (Figure 9 and 10). While there was
slightly maintenance of the initial body weight for the 1-2 years group for both species.
37
72
23
53
01020304050607080
Number
Male Female Male Female
Sheep Goat
Species by sex
Figure 8. Number of male and female sheep and goats initially considered for monitoring.
0
5
10
15
20
25
30
35
0-0.99 1.0-1.99 2.0-2.99 3 3.0-3.99 >4 0.0-0.99 1.00-2.00
Female Male
Sex and age (years) category
Bod
y W
t in
kg
Initial WtFinal Wt
Figure 9. Body weight change of sheep over the study period

68
In the rest age groups, the body condition had declined implying feed shortage in the area in
terms of both feed quantity and quality. In dry season, small ruminants are not freely allowed
to graze or browse in crop aftermaths or in gazing area. Since greater proportion of the land is
covered by permanent perennial crops and forest; small ruminants are restricted from free
grazing across all seasons of the year. Therefore, the cumulative effects, the restriction in
browsing and grazing with lower quality (i.e the higher fiber content and lower digestibility)
reduce the nutrient supply.
0
5
10
15
20
25
30
0-0.99 1.0-1.99 2.00-2.99
3 3.01-3.99
> 4 0-0.99 1.0-2
Female Male
Sex and age (years) catagory
Bod
y W
t in
kg
Initial Body WtFinal Body Wt
Figure 10 Body weight change of goat over study period
On the other hand, the increase in the 0-1 year age group may be due to the additional
management and supplementation by family members as all suckling age groups are in this
category. They are maintained around homestead for protection. As a result, there is a greater
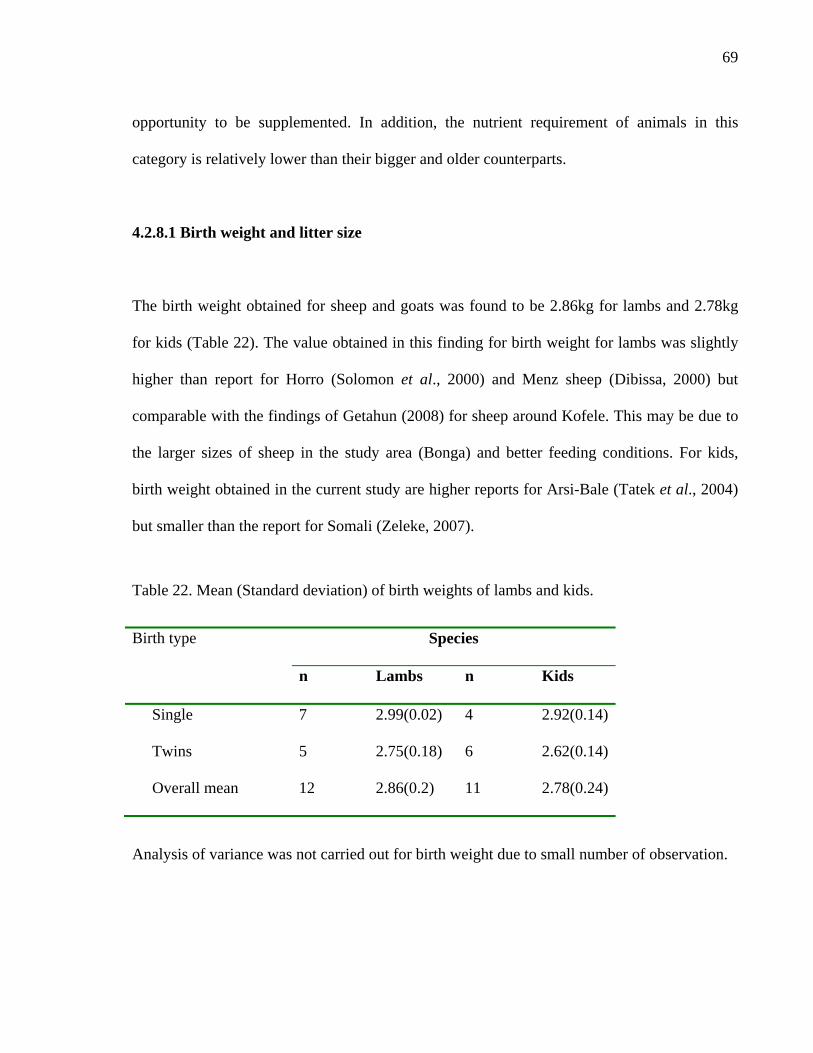
69
opportunity to be supplemented. In addition, the nutrient requirement of animals in this
category is relatively lower than their bigger and older counterparts.
4.2.8.1 Birth weight and litter size
The birth weight obtained for sheep and goats was found to be 2.86kg for lambs and 2.78kg
for kids (Table 22). The value obtained in this finding for birth weight for lambs was slightly
higher than report for Horro (Solomon et al., 2000) and Menz sheep (Dibissa, 2000) but
comparable with the findings of Getahun (2008) for sheep around Kofele. This may be due to
the larger sizes of sheep in the study area (Bonga) and better feeding conditions. For kids,
birth weight obtained in the current study are higher reports for Arsi-Bale (Tatek et al., 2004)
but smaller than the report for Somali (Zeleke, 2007).
Table 22. Mean (Standard deviation) of birth weights of lambs and kids.
Birth type
Species
n Lambs n Kids
Single 7 2.99(0.02) 4 2.92(0.14)
Twins 5 2.75(0.18) 6 2.62(0.14)
Overall mean 12 2.86(0.2) 11 2.78(0.24)
Analysis of variance was not carried out for birth weight due to small number of observation.

70
Table 23. Mean (Standard Error) of weaning weight of lambs.
Effect Weaning Weight (kg)
n Mean(SE)
Sex
Male 19 11.8(0.6)
Female 20 11.4( 0.7)
Parity
1 6 11.4(0.6)
2 9 12.7(0.80)
3 18 11.3 (0.9)
>4 6 11.0(0.4)
Birth type
Single 24 12(0.3)
Twins 15 11(0.2)
The litter sizes found by monitoring the flocks were 1.6 for goats 1.37 sheep, while the values
found out by the diagnostic survey were 1.74 for goats and 1.4 for sheep (Table 25). Although
the values are comparable, the sample size was too small to reveal the true picture in
monitoring.
4.2.8.2 Weaning weight
The weaning weights of lambs were presented in Table 23. The weaning weights for male and
female lambs were found to be 11.8 and 11.4kg, respectively. The weaning weights for single
and twin born lambs were 12 and 11kg, respectively.

71
The weaning weights of lambs from ewes of 1st, 2nd, 3rd and > 4th parities were 11.4, 12.7, 11.3
and 11.00 kg, respectively. There were no significance differences between sex, parity and
birth types this may be due to smaller sample sizes used for analysis. The weaning weight
obtained by this study were in agreement with the values of Getahun (2008) for Kofele lambs
but higher than the values reported for Horro (Abegaz et al., 2000) and Menz lambs (Tibbo,
2006).
Table 24 Mean (Standard Error) for weaning weight of kids.
Effect Weaning Weight (kg)
n Mean (SE)
Sex
Male 16 8.9 (0.3)
Female 15 9.1(0.6)
Parity
1 4 8.3(0.8)
2 7 8.7(0.4)
3 12 9.1(0.5)
>4 8 9.4(0.3)
Birth type
Single 19 9.6(0.6)
Twins 12 8.04(0.7)
The weaning weight of kids is shown on Table 24. The weaning weights (kg) for kids were 8.9
for males and 9 for females. The weaning weight for single born kids were 9.6 and it is
slightly higher than the twin born kids (8.0) but the difference was not significantly (p>0.05).
The weaning weights of kids from does of 1st, 2nd, 3rd and above 4th parities were 8.2, 8.7, 9.1
72
and 9.4kg, respectively. There were no significance differences between sex, parity and birth
types, this may be due to smaller sample sizes used for analysis. The values obtained by this
study for weaning weights for kids were greater than reports for Aris-Bale(Tatek et al., 2004)
and Somali kids (Zeleke, 2007). This may be attributed to better feeding condition in the area
as feeding has, an indirect effect on weaning weight. The milk production of ewes/does is
highly dependent on the quality and quantity of feeds. The milk production in turn affects the
pre-weaning growth.
4.2.8.3. Months of kidding/lambing
Months of parturitions based on the information collected through questionnaires are shown
by Figure 11. There is increase in kidding/lambing starting from April to October while
decrease was observed starting from October to February. It is observed those months of
parturition follows similar trends for both species. This indicated that the majority of
ewes/does gives birth during the rainy season. This may be attributed to the quality of forage
and its fluctuation in different times of the year. The higher percentages of partitions for
ewes/does were also reported (Mukasa-Mugerewa, 1996; Mukasa-Mugerewa et al., 2002).
Ewes/does that mated in higher fertility due to body reserve from previous wet season give
birth in rainy seasons.

73
0
5
10
15
20
25
30
35
40
45
Months
Perc
enta
ge o
f hou
seho
lds
Kiding Lambing
Kiding 34.59 32.58 18.94 10.61 6.82 6.06 9.85 9.85 10.61 17.42 29.55 31.06
Lambing 38.9 37.9 30.3 17.2 15.2 20.7 21.4 23.4 25.5 35.2 38.6 40.7
Sep Oct Nov Dec Jan Feb Mar Apr May Jun Jul Aug
Figure 11. Months of kidding and lambing in the study area.
4.2.8.4 Age at first parturition
Age at first parturition in the study area was reported to be 12.97 and 12.46 months for sheep
and goats respectively (Table 25). This report is in agreement with Solomon et al. (1995) for
Horro ewe that comes to first estrus at 7 months and values reported by Getahun (2008) in the
southern highlands. It is smaller than those reported by Samuel (2005); 17.01 for sheep and
13.18 for goats.
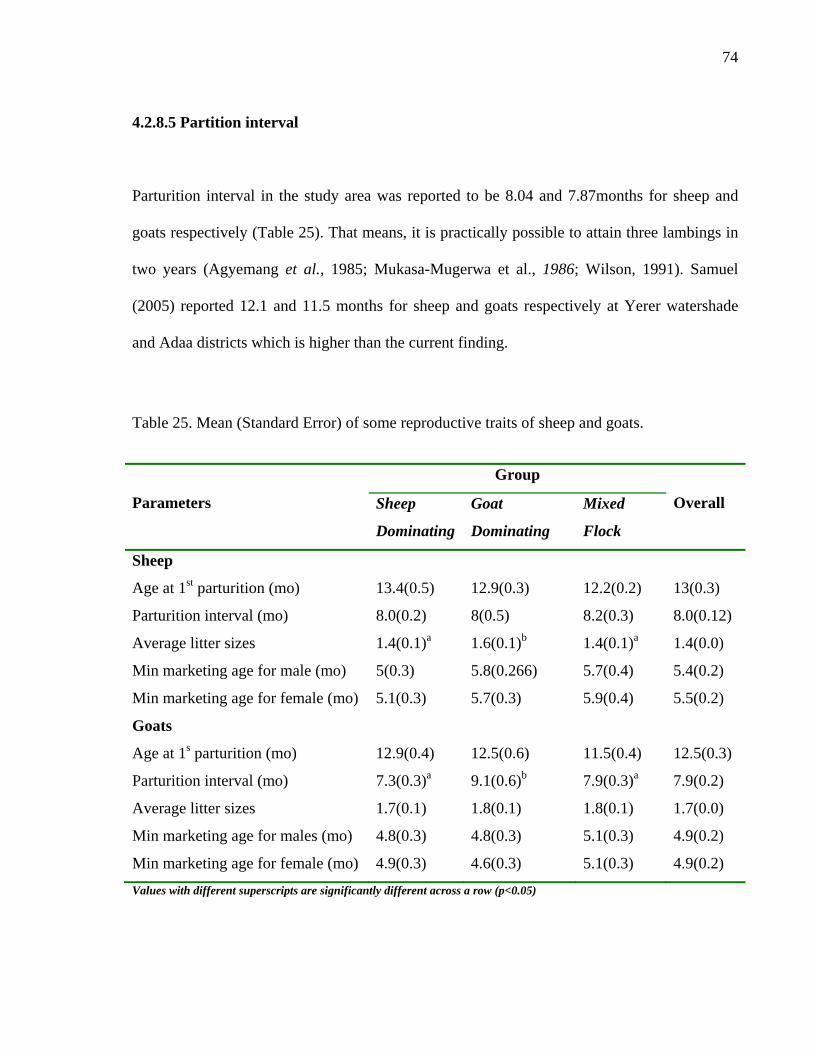
74
4.2.8.5 Partition interval
Parturition interval in the study area was reported to be 8.04 and 7.87months for sheep and
goats respectively (Table 25). That means, it is practically possible to attain three lambings in
two years (Agyemang et al., 1985; Mukasa-Mugerwa et al., 1986; Wilson, 1991). Samuel
(2005) reported 12.1 and 11.5 months for sheep and goats respectively at Yerer watershade
and Adaa districts which is higher than the current finding.
Table 25. Mean (Standard Error) of some reproductive traits of sheep and goats.
Parameters
Group
Overall Sheep
Dominating
Goat
Dominating
Mixed
Flock
Sheep
Age at 1st parturition (mo) 13.4(0.5) 12.9(0.3) 12.2(0.2) 13(0.3)
Parturition interval (mo) 8.0(0.2) 8(0.5) 8.2(0.3) 8.0(0.12)
Average litter sizes 1.4(0.1)a 1.6(0.1)b 1.4(0.1)a 1.4(0.0)
Min marketing age for male (mo) 5(0.3) 5.8(0.266) 5.7(0.4) 5.4(0.2)
Min marketing age for female (mo) 5.1(0.3) 5.7(0.3) 5.9(0.4) 5.5(0.2)
Goats
Age at 1s parturition (mo) 12.9(0.4) 12.5(0.6) 11.5(0.4) 12.5(0.3)
Parturition interval (mo) 7.3(0.3)a 9.1(0.6)b 7.9(0.3)a 7.9(0.2)
Average litter sizes 1.7(0.1) 1.8(0.1) 1.8(0.1) 1.7(0.0)
Min marketing age for males (mo) 4.8(0.3) 4.8(0.3) 5.1(0.3) 4.9(0.2)
Min marketing age for female (mo) 4.9(0.3) 4.6(0.3) 5.1(0.3) 4.9(0.2) Values with different superscripts are significantly different across a row (p<0.05)

75
4.2.8.6 Sources of breeding male and selection
In the study area, majority of the households do not have their own breeding male. As a result
they use their neighbors’. Only 26.9% of interviewed households owned breeding ram while
20.2% of households own breeding buck. According to key informants, the limited attention
for breeding males is attributed to small size of their flock. If the male animals grow they are
castrated to add market value.
Although there is little intention to keep male animals intact farmers in the study area select
rams to mate their females (Table 26). The characteristics used in selecting breeding ram are
based on body confirmation (94.5%), performance history (20.9%) and color (14.7%). Ram
selection using performance history is significantly different across small ruminant density
groups with sheep dominant site having higher percentage (33.8) than other groups. Body
confirmation is given higher priority may be due to its phenotypic expression in offspring and
its economic importance. While performance history is given least priority may be due to the
small flock size in most households as a result they use limited animals for mating. Color has
been given little attention may be due to the presence of few dominant colors (red, white,
white and red in different proportion of mixtures) in the study area.
In buck selection, higher priority is given to body confirmation followed by performance
history while color is given the least priority. Chi-square analysis showed that, there is
significant variation across small ruminant densities in using body confirmation and
performance history as a characteristic for sire selection for goats. Small ruminant breeding
male selection is given less attention than larger ruminants. Wider practices have not reported

76
yet in the country. However, Tsedeke (2007) reported the selection of sire by farmers for
breeding purposes in Alaba district of SNNPR.
Table 26. Desirable characteristics for selecting breeding male sheep and goat for mating.
4.1.8.8 Off-take
The off-take of small ruminants in the study area during the monitoring period is given by
Table 27. It was calculated for a period of six months as sum of the percentages of sold,
slaughtered and gifted/shared out. Sales accounted for 27.5% and 19.7% of the off-take for
sheep and goats, respectively. It was the major off-take for both species while slaughtering
during festivals and other reasons accounted for 26.6% and 15.8% of the off-take for sheep
and goats, respectively. Gift accounted the least and it was not observed for goats.
Selection Group Overall
Sheep
Dominating
Goat
Dominating
Mixed
Flock
No households 65 34 30 129
Ram
Body conformation (%) 92.3 97 96.7 94.5
Performance history (%) 33.8 1 13.3 20.9
Color (%) 20 0 20 14.7
Buck
Body confirmation (%) 66.2 41.2 76.66 62
Performance history (%) 29.2 0 6 16.3
Color (%) 13.8 1 13.3 10.9

77
The off-take rate of sheep through sales in the current study was lower than the finding of
Getahun (2008) in two mixed farming system of Ethiopia i.e. 104% for Kofele and 64% for
Adilo. This may be partly due to farmers in Goma district mainly depend on coffee and chat as
a cash income generation. The time frame during which the monitoring carried out could be
another reason since important markets like the Ethiopian New year and Easter did not fall in
the study period.
Table 27. Analysis of the six month off take of sheep and goat based on flock monitoring (%).
Species Total number of
animal at start
Sold Slaughtered Gift/share
out
Total off-
take
Sheep 109 27.52 26.61 1.83 55.96
Goat 76 19.73 15.79 0 35.53
Total 185 18.92 22.16 108 47.57
4.2.9 Small ruminant health and diseases
4.2.9.1 Small ruminant mortality
One of the limiting factors in small ruminant production and marketing in the Goma district
are diseases and parasites. Deaths reported by households over the last 12 months are shown
in Table 28 and 29. Higher death for both species was reported for suckling age groups
followed by 3 to 6 months age group while the least was reported for castrates. There was
significant (p<0.05) variation among the three areas that differs in flock density mortalities of
suckling group for both species. Significantly higher values were found for lambs (0.39) and

78
kids (0.29) in sheep dominating groups; Kids between 3 and 6 months also exhibited
significantly higher deaths.
Table 28. Mean (Standard Error) number per household of sheep and goats died during a
period of the last 12 months.
Structure by age
Group
Overall Sheep
Dominant
Goat
Dominant
Mixed
Flock
Sheep
Lambs (less than 3 months) 0.39(0.09)b 0.03(0.03)a 0.23(0.1)b 0.26(0.1)
Lambs (3 to 6 months) 0.16(.049) 0.25(.086) 0.36(.145) 0.23(0.05)
Ewes 0.18(0.05) 0.38(0.19) 0.13(0.05) 0.21(0.06)
Rams 0.14(0.05) 0.05(0.04) 0.23(0.1) 0.14(0.04)
Castrates 0.01(0.01) 0.08(0.08) 0.0(0.0) 0.03(0.02)
Goat
Kids(less than 3 months) 0.3(0.07)c 0.03(0.03)a 0.08(0.08)b 0.17(0.04)
Kids(3 to 6 months) 0.23(0.07)b 0.0(0.0)a 0.10(.05)b 0.14(0.04)
Does 0.09(0.04) 0.0(0.0) 0.05(0.04) 0.06(0.02)
Bucks 0.08(0.04) 0.03(0.03) 0.03(0.03) 0.05(0.02)
Castrates 0.0(0.0) 0.0(0.0) 0.0(0.0) 0.0(0.0)
The morality rate of suckling(less than 3 months) age group was found to be the highest for
both species followed by weaning age group (3-6months). The mortality rate of suckling age
groups 20.9% and 22.6% for sheep and goat, respectively while for the post - weaning age
group has 18.1% and 15.5% for sheep and goat, respectively (Table 29). The higher mortality
among young animals is probably due to the susceptibility of these age group to diseases and
parasites, decline in the condition of their dams as a result of parasitic burden that leads to
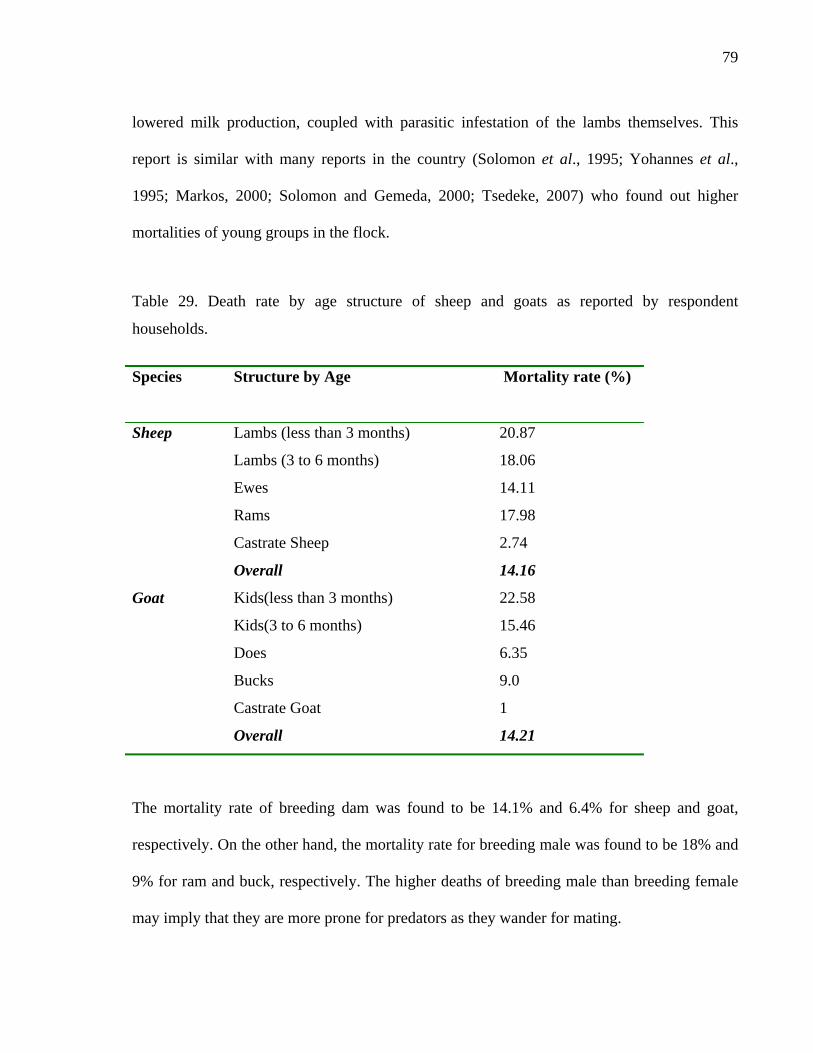
79
lowered milk production, coupled with parasitic infestation of the lambs themselves. This
report is similar with many reports in the country (Solomon et al., 1995; Yohannes et al.,
1995; Markos, 2000; Solomon and Gemeda, 2000; Tsedeke, 2007) who found out higher
mortalities of young groups in the flock.
Table 29. Death rate by age structure of sheep and goats as reported by respondent
households.
Species Structure by Age
Mortality rate (%)
Sheep Lambs (less than 3 months) 20.87
Lambs (3 to 6 months) 18.06
Ewes 14.11
Rams 17.98
Castrate Sheep 2.74
Overall 14.16
Goat Kids(less than 3 months) 22.58
Kids(3 to 6 months) 15.46
Does 6.35
Bucks 9.0
Castrate Goat 1
Overall 14.21
The mortality rate of breeding dam was found to be 14.1% and 6.4% for sheep and goat,
respectively. On the other hand, the mortality rate for breeding male was found to be 18% and
9% for ram and buck, respectively. The higher deaths of breeding male than breeding female
may imply that they are more prone for predators as they wander for mating.

80
It was found that the mortality rate of castrates was the least, this may be due to de-worming
and intensive care castrates get. An overall mortality rate for sheep and goats in the study area
was found to be 14.2%. In general mortalities for older age groups (breeding and castrates),
the values in this study was smaller than the report of Tsedeke (2007) who found out 20.5%
and 30.4%, mortalities for breeding males in sheep and goats, respectively. Similar author
reported 8.7% and 8.6% mortalities for castrates and fattened sheep and goats, respectively.
4.2.9.2 Causes for deaths
Many causes of mortality were reported by the interviewed households. The signs for the
disease that causes death in the area were: emaciation (22.6%), coughing (16.6 %), swelling
around neck (13%), depression and loss of appetite (18.1%), and abnormal breezing with
auscultation (14.8%), sudden death with bleeding in openings (4.5%) (Table 30). Previous
reports indicated majority of deaths of small ruminants in Goma were due to diseases like
Black leg, Pastureolosis, Anthrax, Fascioliasis and Trypanosomiasis (IPMS, 2007). Parasitic
problems, ticks, mites, lice and insect flies are also prevalent in the area and cause weight
losses. During the study period, farmers report sign of disease rather than a disease itself as
some disease have some common symptoms it was beyond this study to clearly identify all the
prevalent diseases in the area. Therefore, there should be a well planned project that can
identify all disease types, their epidemiology, etiology and recommend for further
interventions.

81
The prevalence of parasitic diseases may be due to the marshy nature of grazing areas. The
higher humidity associated with warmer temperature in the area created favorable
environment for diseases causing organisms and higher parasitic load that were responsible
factors for the wide spread and dissemination of diseases in the area. The prevalence of
parasitic diseases were also reported in other part of the country (Gemeda et al., 2005;
Markos, 2006; Tsedeke, 2007)
Table. 30 Common sighs for causes of death of small ruminants as reported by households.
Common reported signs Percentage of households
Emaciation 22.6
Depressions and loss of appetite 18.1
Coughing 16.6
Abnormal breezing with auscultation 14.8
Swelling (around the neck, tongue) 13
Discharge fluid from nose 10.5
Sudden death with bleeding in openings 4.51
4.2.9.3 Treatments of sick animals
There is a common practice of farmers in the study area to treat their sick animals with ethno-
veterinary (traditional) medicines. From the interviewed households, 31.8% use traditional
medicine. Others took sick animals to nearby veterinary clinics (24.7%). Slaughtering sick
82
animals was also practiced (18 %) if they consider the disease can not make any harm to
human health. The use of drugs from illegal sources was also reported by 15.3% of
interviewed. The Ethno-veterinary treatment in the area includes different parts of some plant
species. Branding was also reported by 26.3% of households to be as a means of curing
animals against some diseases although its limitation on skin quality was recognized.
About three fourth of households reported that they have access to veterinary services. The
Oromia Office of Agriculture and Rural Development (OoARD) is the major (86.9) source of
veterinary services. However, the services were provided by payment and farmers complain
for higher price they pay to treat sick animals. Vaccinating their animal was also reported by
43.1% of households. It is mostly given by OoARD after report of the diseases and it was free
of charge.
Health problems of small ruminant reported in the study areas are given in Table 31. Among
the interviewed households, 65.6% reported the spread of disease and parasites causing
serious problem. Shortage of diagnostic laboratories and medicaments (61.9%) is another
critical limitation in providing efficient veterinary services for the farmers. Shortage of
veterinary services, high prices of medicines and veterinary services, lack of veterinarians
indicated by 55%, 48.1% and (41.3%) of the households, respectively. Inadequate nutrition
was also reported by 26.3% of the households as a cause of small ruminant health problems.

83
Table 31. Major reported causes of health problems by households.
Major constraints Percentages of
households
Wide spread of disease and parasite 65.6
Shortages of medicaments 61.9
Shortage of Veterinary services 55
High prices of medicaments and veterinary services 48.1
Lack of veterinarians (health experts) 41.3
Shortage of feed increases susceptibility to diseases 26.3
4.3 Marketing of small ruminants
4.3.1. Market places
In Gomma district, there are five permanent market places namely Agaro, Bashasha, Limu
Shayi and Gembe. Four of them function one day per week while Agaro gives services for two
days per week. In addition, the consumers in the town and restaurant owners can buy sheep
and goats throughout the week from Agaro town; because, in addition to two days of
marketing there are temporary places (Gulit) that cater small number of animals but they do
not give services during regular market days. The market places and percent of their services
are given in Table 32. The distribution of these market places in the district is Agaro at the
center while the other towns are situated north east (Chago), north west(Limu Shayi), south

84
east(Bashasha) and west (Gembe) their distance from Agaro differs Gembe being the nearest
(about 10kms) while Limu Shayi is the remotest (about 20km).
Table 32. Place of marketing where households sell and purchase sheep and goats.
Market places Percentage of HHs
Purchase
Percentage of HHs
Sale
Within the village 5.66 19.53
In the nearby villages 11.32 7.81
Agaro Town 33.02 32.81
Bashasha Town 15.09 10.16
Limu shayi Town 11.32 10.17
Gembe Town 9.43 9.38
Chago Town 14.15 9.38
Farmers in Goma sell and/or purchase their sheep and goats either in villages or take to the
nearby towns. Out of interviewed households, (27.3%) and (72.7%) sale their animals in
villages and towns, respectively while 17% and 83% purchase from villages and towns
respectively. Farmers prefer selling in town due to higher prices. There are also small traders
who take animal from villages to primary markets. Agaro town is central and the biggest
market for the district. So more volume of buyers with better purchasing power can be found.
According to key informants, most purchasers would like to purchase from these small towns
and to sale in Agaro town due to lower cost in smaller towns and better price in Agaro.

85
4.3.2 Market participants
4.3.2.1. Farmers
Farmers raise small ruminants and sell in times of cash need. Landless farmers and other,
farmers during dry seasons or when prices cash crops (chat and coffee) fail will buy small
ruminants for a reduced price. They then fatten them and sell during holidays or in coffee
harvesting times. In addition, some farmers buy small ruminant at villages and take to towns.
4.3.2.2. Small traders (Amateur Traders)
Small traders are those who buy small ruminant from small towns like Gembe, Chago, Limu
Shayi, Bashasha and sell them in Agaro or to bigger traders who transport to central markets.
Usually they buy and sell small number of animals, not more than 20 animals. These traders
also use other market days (gulit) in Agaro to sell their animals. They may or may not be
engaged in other activities. According to Solomon (2004), these types of traders participate in
trading business at the time of high margins (New Year, and religious festivals).
4.3.2.3. Permanent traders (bigger traders)
These traders buy small ruminants from farmers, small traders and supply to other bigger
towns like Jimma and Addis Ababa. In most cases they use brokers to buy large number of
animals and are actively involved in marketing throughout the year. Similar market
participation was also reported from pastoral areas of Borena (Solomon, 2004).

86
4.3.2.4. Butchers/Hotel/Restaurant owners
In Agaro town, butchers also sell sheep and goat meat to consumers. Nowadays the trend to
sell small ruminant meat has been increasing in other small towns in Goma district.
Hotel/restaurant owners also buy small ruminant from farmers, small traders/larger traders and
make local delicacies like Misto, Tibis, Dullet, Mofo, Key wot, Minchet, Kikil.
4.3.2.5 Brokers/Delalas
Brokers locally called Delalas are also major participants in marketing of small ruminates in
the study area. According to key informants, without their involvement no animal can be sold.
The role of brokers in marketing small ruminants in the area has two views; One group
describes them favorably as they facilitate transaction between buyers and sellers while others
see them as problems in marketing as they are the ones who mainly decide on the price. The
fee they collect is also described by some as exorbitaul and unnecessary a as one can negotiate
the price his/her animal with the buyers/sellers. In agreement with this report, the role of
brokers is also described by other reports ( Endeshaw, 2007; Tsedeke, 2007; Deniel, 2008)

87
4.3.3 Small ruminants marketing channels and routes
In the study area, different small ruminant marketing channels (Figure 12) were identified
through discussions with key informants from producers and consumers. The major channels
identified were:
1. Farmers- consumers;
2. Farmers- butchers/Restaurants/Hotels-consumers;
3. Farmers- small/medium traders- Restaurants/Hotels-consumers;
4. Farmers-small/medium traders- Larger traders-Restaurants/Hotels –consumers;
5. Farmers- agents for exporters –Export Market;
6. Farmers-small/medium traders- agents for exporters –Export Market;
7. Farmers- small/medium traders - Larger traders -export market;
8. Farmers- Larger traders-export market;

88
ROLE TYPE OF MARKET
Figure 12. Marketing Channel of Small Ruminants
Source: Own Data
FARMERS (PRODUCERS)
Small Traders
Larger Traders
Export Agents
Butcheries
Hotels/Restaurants
Local Market Export Market
CONSUMERS
Farm Gate
Primary Market
Secondary Market
Terminal Market
Production
Utilization
Collection
Value addition

89
Source: Own data Figure 13 Small ruminant marketing routes
Regarding the marketing route, there is one main small ruminant marketing routes in the
study area. It starts from Agaro to Jimma then to Addis Ababa where there is relatively better
demand and higher prices (Figure 13). However, according to key informants the volume of
animals transported through this route varies across times of year mainly affected by harvest
Agaro (Secondary Market )
Limu Shayi (Primary Market)
Chago (Primary Market) Bashasha
(Primary Market)
Farmers from border district (Gera, Mokko)
Farmers within Goma (Nearby Bashasha)
Farmers within Goma (Nearby chago)
Farmers within Goma (Nearby)
Gembe (Primary Market)
Farmers within Goma
Jimma (Secondary market)
Addis Ababa (Terminal Market)
Farmers from border districts (Toba)

90
of coffee i.e. when high production of coffee the local demand become high so that the price
increases and traders do not take large volumes of animal.
4.3.4 Small ruminant fattening and marketing
In Goma district, majority of households fatten their castrated animals to sale during holidays.
The target seasons in the study area was given in Table 33. Arafa (66.9%) is the most
important target time of marketing for fattened castrates. As the majority of Goma inhabitants
are Muslims, Arafa is one of the holidays when almost all Muslims consume meat either by
slaughtering within the household or share with other neighbors. There is no variation
(p<0.05) across small ruminant density groups for Arafa targeted marketing.
Table 33. Marketing seasons targeted for fattening (%).
Festival
Groups
Overall
Tests
Sheep
Dominant
Goat
Dominant
Mixed
flock
X2 p-Value
New year 60 75 30 58.1 28.91 0.000
Ester 55 62.5 32.5 51.3 7.533 0.023
Christmas 33.8 57.8 15 35 12.661 0.002
Meskel 35 40 15 31.3 5.709 0.058
Ed Al fetir 40 35 17.5 33.1 6.776 0.034
Arafa 65 80 57.5 66.9 1.632 0.442
New Year, Easter, Christmas, Meskel and Ed al Fetir are also targeted by 58.1%, 51.3%, 35%,
33.1%, and 66.9% of households respectively. Chi-square analysis showed that there is

91
significant (p<0.05) variation across small ruminant density groups in targeting New Year,
Easter, Christmas and Ed al Fetir, as a time of sale. This may be due to differences in the
religion categories of the inhabitants in specific area. The lower percentages of targeting
Christian holidays may be due to the small proportion of rural inhabitants who consume small
ruminant meat during these holidays. According to key informants, in Goma unlike other parts
of the country the proportion of small ruminant that goes to secondary and terminal markets
are small. This is presumably due to the purchasing power of rural community and higher
prices of the animal. It may not be profitable to take them to Addis Ababa and abattoirs.
During the study period, there were no agents for abattoirs from Agaro but some traders went
as far as Chago and Bashasha to transport animals to Addis and other towns. These markets
were also preferred in times when coffee is not harvested. This situation, however, is only true
for small ruminant. For cattle larger volume is supplemented to secondary and terminal
markets. Targeting holiday markets for fattened small ruminants was also reported by different
authors in other parts of Ethiopia (Jabbar, 1998; Ehui, 2000; Tsedeke, 2007).
Farmers’ sell their animals in time of cash need but the age category determined for selling
will depend on the need of the cash and its urgency. In Goma, farmers first sought cash from
sale of coffee and chat but when there is no coffee to be sold; selling small ruminants is the
next alternative. From the interviewed households, the majority sell the post weaning (rams
and bucks)(41.3%) age group followed by castrates (36.7%) while the suckling age groups are
the least targeted (6.2%)(Table 34). Suckling animals are mostly sold with their dams; this
occurs during a time of serious problems and/or when own only breeding animals. They may
also be sold when the farmer need to change the species (in most cases from goat to sheep).

92
When observed by density groups in goat dominant areas castrates are likely to be sold to
meet the cash needs than in other category where rams and bucks will be the first to be sold.
Table 34. Preference of households for selling small ruminants by age groups in times of
immediate cash need (%).
Animals to be sold
Group
Overall Sheep
Dominant
Goat
Dominant
Mixed
Flock
Lambs and kids 5.4 1.69 14.6 6.21
Rams and bucks 52.7 40.9 48.9 41.2
Ewes and Does 1.35 11.9 17.1 15.8
Castrates 40.54 45.8 19.51 36.7
The reasons of selling small ruminants are shown in Table 35. From the interviewed
households 80% had sold small ruminant last year (2007/2008) for different reasons. The
major reasons include: school expenses for children, purchase of farm inputs (fertilizer, seed,
farm items) and purchase of food, expenses for health and to pay back credit 46.1%, 37.5%,
31.3%, 28.1%, respectively.

93
Table 35. Reasons for selling sheep and goats by households during the last 12 months(%).
The interviewed households were also asked to rank reasons for selling of small ruminants.
Accordingly, purchase of food, purchase of farm inputs (fertilizer, seed, and farm items),
expenses for health, school expenses for children and to pay back credit and shortage of feed
ranked 1st, 2nd, 3rd, 4th and 5th, respectively (Table 36).
Festival Group Overall
Sheep
Dominant
Goat
Dominant
Mixed
Flock
No. of Households 67 34 27 128
Reasons of sell
Children school free 59.7 41.2 18.5 46.1
Farm inputs 34.3 41.2 40.7 37.5
Purchase foods 62.7 82.4 51.9 37.5
Health related expense 49.3 29.4 40.7 31.3
To pay back credit 26.9 32.4 25.9 28.1
Shortage of feeds 8.95 14.7 14.8 11.7
Sell for replacement 5.90 2.90 11.1 6.25
Problem of predator 5.90 2.90 7.40 5.47
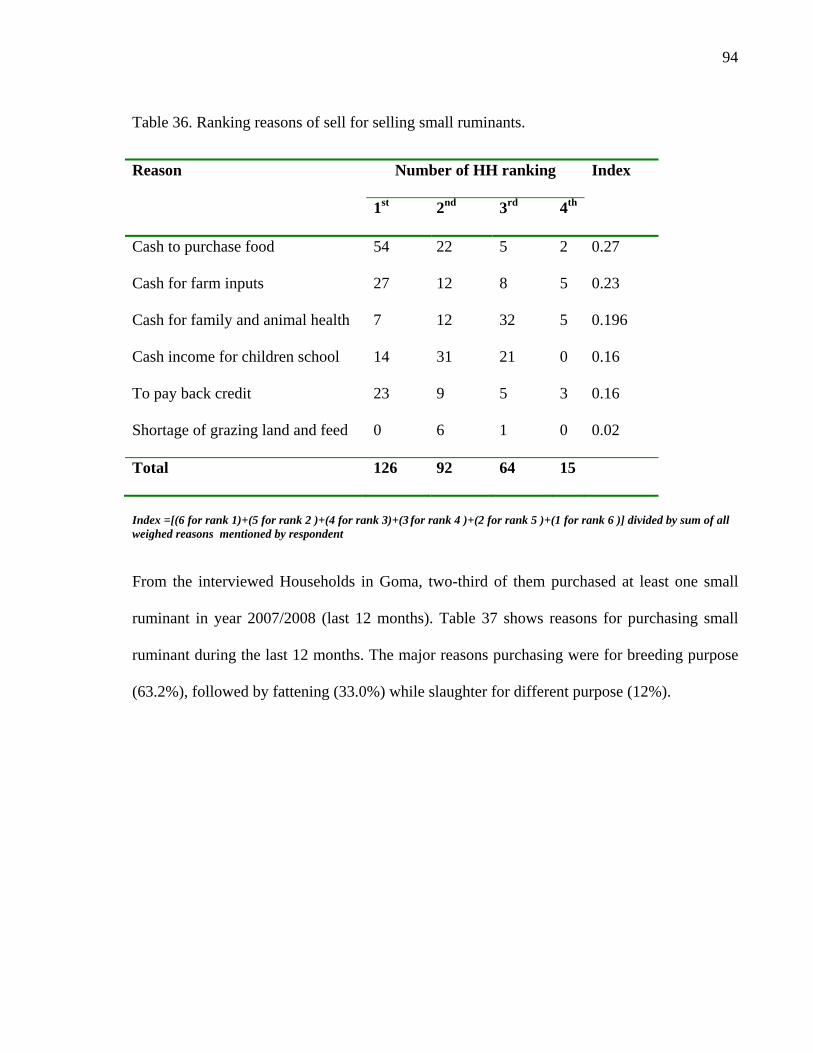
94
Table 36. Ranking reasons of sell for selling small ruminants.
Reason Number of HH ranking Index
1st 2nd 3rd 4th
Cash to purchase food 54 22 5 2 0.27
Cash for farm inputs 27 12 8 5 0.23
Cash for family and animal health 7 12 32 5 0.196
Cash income for children school 14 31 21 0 0.16
To pay back credit 23 9 5 3 0.16
Shortage of grazing land and feed 0 6 1 0 0.02
Total 126 92 64 15
Index =[(6 for rank 1)+(5 for rank 2 )+(4 for rank 3)+(3 for rank 4 )+(2 for rank 5 )+(1 for rank 6 )] divided by sum of all weighed reasons mentioned by respondent
From the interviewed Households in Goma, two-third of them purchased at least one small
ruminant in year 2007/2008 (last 12 months). Table 37 shows reasons for purchasing small
ruminant during the last 12 months. The major reasons purchasing were for breeding purpose
(63.2%), followed by fattening (33.0%) while slaughter for different purpose (12%).

95
Table 37. Reasons of purchasing small ruminants by households by density group(%).
The preferred times for sells and purchases of small ruminants in the area was shown on
Figure (14).There was similar trends for both species in selling and purchasing times during
periods of the year. About two-third of the farmers sell small ruminants, respectively in
holidays while the proportion of farmers who purchase during the same time was 2.3% and
7.3% for sheep and goats, respectively. During crop planting, 24% and 21.9% of the farmers
sell sheep and goats, respectively while during the same time 41.8% and 39.5% of farmers
purchase sheep and goats, respectively. In times of crop harvesting, 16.5% and 16% sale sheep
and goats respectively while the proportion of farmers who purchase during crop harvesting as
high as 50.9% for sheep and 53.2% for goats.
In general higher proportions of farmers sell sheep and goat in holidays followed by crop
planting. This may be due to higher prices during holidays. In spite of the lowest prices during
crop planting period, shortages of feed may force farmers to sell their small ruminants. On the
other hand, high percentage of farmers purchases small ruminants during crop harvesting.
Reasons
Group
Overall
Sheep
Dominant
Goat
Dominant
Mixed
Flock
No of Households. 54 25 27 106
Reasons
Slaughter for holidays 18.5 16 11.1 10.4
Slaughter for social ceremonies 1.85 4 0 1.9
Breeding 64.8 56 66.7 63.2
Fattening 38.9 12 40.7 33.0

96
During this season, coffee can be harvested and the purchasing power of farmers increase. In
addition, farmers slaughter small ruminants when they start harvesting coffee and it was
evidenced by larger volumes of skin sold in the time of coffee harvest.
0
10
20
30
40
50
60
70
80
Hol
iday
s
Cro
ppl
antin
g
Cro
pha
rves
ting
Hol
iday
s
Cro
pha
rves
ting
Cro
ppl
antin
g
Hol
iday
s
Cro
pha
rves
ting
Cro
ppl
antin
g
Hol
iday
s
Cro
ppl
antin
g
Cro
pha
rves
ting
Sale Purchase Sale Purchase
Sheep Goat
Times of selling and purchasing
Perc
enta
ge o
f hou
seho
lds
Figure 14. Preferred times of the year for households to sell and purchase sheep and goats.
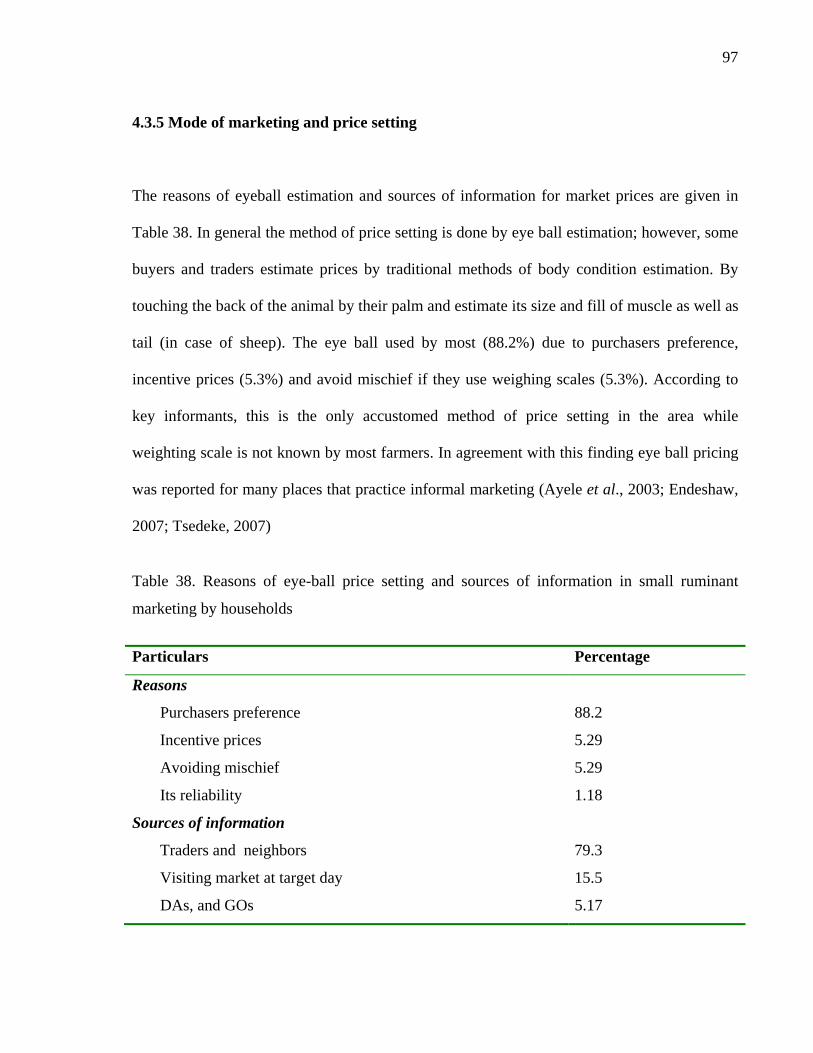
97
4.3.5 Mode of marketing and price setting
The reasons of eyeball estimation and sources of information for market prices are given in
Table 38. In general the method of price setting is done by eye ball estimation; however, some
buyers and traders estimate prices by traditional methods of body condition estimation. By
touching the back of the animal by their palm and estimate its size and fill of muscle as well as
tail (in case of sheep). The eye ball used by most (88.2%) due to purchasers preference,
incentive prices (5.3%) and avoid mischief if they use weighing scales (5.3%). According to
key informants, this is the only accustomed method of price setting in the area while
weighting scale is not known by most farmers. In agreement with this finding eye ball pricing
was reported for many places that practice informal marketing (Ayele et al., 2003; Endeshaw,
2007; Tsedeke, 2007)
Table 38. Reasons of eye-ball price setting and sources of information in small ruminant
marketing by households
Particulars Percentage
Reasons
Purchasers preference 88.2
Incentive prices 5.29
Avoiding mischief 5.29
Its reliability 1.18
Sources of information
Traders and neighbors 79.3
Visiting market at target day 15.5
DAs, and GOs 5.17

98
Among the interviewed households, 72.5% had access to information from development
agents, some governmental organizations, traders and neighbors and by visiting market at
target days. However, the majority (79.3%) of households get information from traders and
neighbors who sell small ruminants (Table 38). Visiting market at target days (15.5%) is the
second source of information while small proportion (5.2%) of them got information from
development agents and some governmental organizations. In price setting and marketing
brokers have the greatest role according to key informants which was one of the problem of
marketing stated by farmers. Due to this problem and taxation some farmers sell their animals
outside of catering areas or on road side during marketing days.
4.4 Extension, cooperatives and credit services for small ruminant production
In spite of extension activities in various aspect of agriculture, there has not been any specific
extension package for small ruminants provided by NGOs or GOs in the district. The major
focal areas in Goma include coffee production, distribution of improved seedling, grafting
methods, seed collection and processing, tropical fruit production, improved seed distribution
and management. Goma being a potential area for apiculture, there were also efforts to
distribute hives.
Only one-fifth of interviewed households were members of different types of cooperatives.
There are NGOs and GOs that provide credit in the Goma district. Their focus is mainly on
coffee processing, small ruminant and cattle fattening. They usually give credits for the group

99
that forms cooperatives. Except the fattening activities, the role of credit services and
cooperatives is limited in small ruminant production.
4.5 Gender and labor allocation in sheep and goat management
For the majority (61.3%) of the households, labor shortage was not a limitation for small
ruminant production and marketing. From households who reported faced labor shortage,
herding and tethering were the major tasks (37.4%) followed by taking care of sick animals
(32%). Looking after lambs and kids, construction of shelter and watering were reported by
15.6%, 8.8%, and 6.1% of the respondents, respectively as important tasks.
The division of activities by different members of households in the area is shown in Figure
39. All family members are engaged in almost all activities of small ruminant production.
However, husband, spouse and boys take larger share in almost all activities while hired labor
took the least.
Herding is mainly undertaken by boys (37.7%) followed by husbands (29.6%). Hired labors
share the least (0.6%) in herding. Husbands, spouses and boys took 31.1%, 30.1% and 29.4%
of feeding activity respectively.
Activities that can be carried out around homestead are mainly handled by spouses. Shelter
cleaning (63.9%) and taking care of suckling age groups (52.6%) took place around

100
homestead so the spouses are the ones primarily responsible for such tasks. Girls also share
25.5% of shelter cleaning and 12.6% of looking after and caring suckling age groups.
Husbands are primarily responsible for feeding, taking care of sick animals fattening, shelter
construction and much of marketing tasks. Women do cleaning of barns and taking care of
lambs and kids while children do herding and watering (Table 39).
Table 39. Division of labor by households in small ruminant production (%)
Activities Share of tasks by Households Members
Husband Spouse Boys Girls Hired labor
Herding 29.6 20.8 37.7 9.5 1
Feeding 31.1 30.1 29.4 7.8 1.7
Watering 19.2 31.1 36.9 10.4 2.3
Shelter Cleaning 1.85 63.9 7.4 25.5 1.4
Taking care of
lambs/kids
20.4 52.6 11.7 12.6 2.6
Taking care of sick
animals
45.8 34.2 11.7 6.3 2.1
Fattening activities 48.2 31.2 15 4.45 1.21
Shelter construction 79.7 3.57 14.9 1 1.19
Marketing activities 63.8 21.7 12.6 0.97 1
Future plan of the households on small ruminant production is shown in Table 40. Nearly
ninety four percent of the interviewed households showed future interest to continue and/or
expand small ruminant production although there are some constraints. Except in lowland
areas farmers in general are more interested in sheep than goats.

101
Table 40. Future plan and reasons for expansion of sheep and goat production of the
respondents
Attributes Percentage
No. of Households 150
Sheep
High market demand 71.3
Increasing market price 73.5
Easy to manage and keep 72.2
Distribute benefit and losses 68.9
Immediate returns 67.3
Appropriate for slaughter 61.7
Goat
High market demand 43.7
Increasing market price 47.7
Easy to manage and keep 28.5
Distribute benefit and losses 44.4
Immediate returns 40.7
Appropriate for slaughter 37.6
The reason for expanding sheep production includes high market demand, increasing prices,
distribution of benefit and losses and immediate return. Among these reasons market demand
and high prices are the most appreciated issues currently. In case of goats, these reasons are
given by less than half of households. Due to management and feeding reasons it was
observed that some farmers divert to sheep production and fattening.

102
4.6 Constraints and opportunities of small ruminant production and marketing
4.6.1 Constrains in small ruminant production
The major constraints in small ruminant production in the area are given in Table 41. Feed and
grazing land shortage the most limiting constraint (74.4%) in small ruminant production in the
study area. Feed shortage in both seasons (dry and wet) limits productivity of small ruminants
and it was further worsened due to the absence of awareness and practice of feed conservation
techniques. Moreover, forage development has been given less attention. There is a significant
difference among small ruminant density groups with pronounced problem in sheep dominant
sites (highland and mid altitudes); this may be due to more land is covered by perennial crops
than left for grazing.
Water shortage and drought were reported by 20% and 27.5%, respectively in goat dominant
sites this may be due to these areas receives relatively smaller rainfall and has shortaer rainy
seasons than their counterparts. Yet water shortage is not a critical problem that hinders small
ruminant production in the area this may due to higher rainfall distribution and the existence
of many rivers. Only 7.5% and 10% of the households who reported water shortage and
drought as constraints.
Diseases and parasites hamper small ruminant production by causing high mortalities
especially among suckling animals. From interviewed households, 60.6% indicated that
diseases and parasites among the major constraints for small ruminant production in the area.

103
Almost all interviewed households lost one or more small ruminants during the last 12
months.
Table 41. Major constraints reported by households in small ruminant production by small
ruminant density groups (%).
Problems
Group
Overall Sheep
Dominant
Goat
Dominant
Mixed
Flock
Feed/ land Shortage 72.5 90 62.5 74.4
Lack of Input 62.5 90 70 71.3
Predators 70 80 52.5 68.1
Disease & Parasites 52.5 90 47.5 60.63
Lack of Credit 48.75 90 60 61.9
Marketing Problems 8.75 82.5 25 31.3
Labor Shortage 30 32.5 17.5 27.5
Drought 3.75 27.5 5 10
Water Shortage 2.5 20 5 7.5
The loss of small ruminants by predators is a common phenomenon in the study area and
68.1% of the interviewed households indicated its limitation for small ruminant production.
Problems of input supply, credit services and appropriate extension services constitute 71.3%,
61.9% and 21.3% of the constraints of the interviewed households

104
4.6.2 Marketing Constraints
The marketing constraints in small ruminant production in the study area are shown on Table
42. The major problems of marketing as reported by respondents are seasonality of market
price(71.9%), brokers (66.7%), and lack of market price information (65%).
Table 42. Marketing constraints in small ruminant production reported by household(%)
Problems Percentage
No. of Households 114
Reasons
Tax burden 40.4
Brokers 66.7
Seasonality of market Price 71.9
Lack of road 10.5
Lack market and price information 65.8
4.6.3 Opportunity of small ruminant production and marketing
Goma is one of the districts in Oromia that is known for coffee production. However, the
productivity and the price of coffee has been highly variable. So farmers face income shortage
during times of coffee failure. The integration of small ruminant production is important as
they can be intermediate cash sources during coffee failure time. Moreover, their high turn

105
over rate, easy to be managed by children and women are advantages to be integrated with
crop production.
Goma is also highly endowed with natural forests and various annual and perennial plants that
can be potential feed sources for small ruminant. The vegetation is endowed with spicy herbs
that give demandable aesthetic property of the meat which may be valued for export markets.
Moreover, the area receives enough amount of rainfall that can be used to develop various
types of grasses, legumes and browses through different production strategies.
Landless youth and farmers, retired people and other members of society can be engaged in
fattening activities that make them benefited as result of high market demand and higher
prices.
High demand of the small ruminants in the local market as a result of population increase,
urbanization, and increase in income (even within a district) can be considered as an
opportunity for the small ruminant producers. It is evident that there was high consumption of
meat during crop (coffee) harvest and less volume of animal were taken out of Goma.
The need for young males is also opportunity for the producers. Nowadays, many abattoirs
flourish in the country; so agents and assemblers purchase small ruminant even at farm gate.

106
5 SUMMARY AND CONCLUSIONS
Small Ruminants are integral part of livestock keeping in Ethiopian farming and pastoral
community and they are mainly kept for immediate cash sources, milk, meat, wool, manure,
and saving or risk distribution. They also play important role as sources of foreign currency
through export of live animals or their products. In Ethiopia small ruminant production lack
reliable marketing outlets that could provide the full benefits of indigenous small ruminant
resources. Various constraints limit small ruminant production in Ethiopia that needs to be
addressed by systematically describing the production and marketing systems thereby
planning and designing appropriate research and development activities that will be relevant to
specific systems.
The major purpose of this study was to generate baseline information on small ruminant
production and marketing and the associated challenges and opportunities in Goma district,
western Ethiopia. Goma is one of the districts in Oromia known for coffee production
receiving reliable rainfall throughout the year; as a result agricultural activity has not been
limited by rainfall.
The study was conducted in two phases in order to generate information on sheep and goat
production and marketing. Based on secondary information sources and discussion with
experts, the 36 kebeles were stratified in to small ruminants density groups according to their
proportion of sheep and goats kept by household. Accordingly, 26, 6, 4 kebeles were found to
be sheep dominant, mixed flock (almost similar proportion of sheep and goats) and Goat

107
dominant respectively. From these strata of kebeles 4, 2 and 2 kebeles were selected from
sheep dominant, goat dominant and mixed flock groups respectively. Households that have a
least 2 small ruminant or landless farmers who involved in fattening and has a minimum of
one year experience in small ruminant production and/or fattening were randomly selected to
participate in production system and marketing study between October 2008 and Jan 2009.
Structured and semi-structured questionnaires were used to collect information on different
aspects of production system and PRA tools were employed to collect marketing information.
Group discussion with key informants was also done to understand problems in depth. The
productive performances of small ruminant were conducted on 36 selected households who
were continuously monitored for period of about six months. The statistical tools employed
include: descriptive statistics, chi-square tests and analysis of variance using the statistical
software called SPSS (version 13).
In Goma, where coffee and chat are the major cash sources for farmers small ruminant are
mainly kept for cash generation and saving in time coffee failure. In general sheep are the
dominant and most preferred species than goats by farmers and it was observed that most
farmers who has larger perennial crop land do not choose to have small ruminants especially
goats. These farmers who rear small ruminants kept larger proportion of female animals than
male animals and it is rare to find males of advanced age because sold/ slaughtered or fattened
and sold earlier.
The principal feed sources in the study area were grazing land (communal, road side), crop
aftermaths, browse species and home leftover (Chat and food leftovers). Commercial

108
concentrates are not known by farmers except flour mills. Majority of the farmers
supplemented small ruminant during both dry and wet seasons. Most small ruminants are
either tethered or herded all the seasons due to perennial crops and predators. The major
reasons for tethering animals include: to avoid crop and vegetation damage, to protect them
from predators, to save labor and to reduce aggressiveness (in case of male animals) and to
utilize marginal lands. All small ruminants are housed for protection from adverse weather
condition and predators.
River water was reported to be the major water source for small ruminants in the study area.
Other water sources include ponds, deep well, pipe water and rain water (during rainy season).
Farmers practice culling of small ruminants due to various reasons. The major reasons include
sickness, fertility problem, physical defect, old age, and unwanted physical characteristics.
Fattening is a common practice by most farmers and nowadays getting higher attention due to
high market demand and associated market prices. To castrate farmers mostly took their
animal to nearby veterinary clinic to be castrated by burdizzo while some of them use
traditional methods.
Sheep and goats enter to flocks through births, purchases, and sharing arrangements while
leave the flock through sale, death, slaughter, predator, theft and share arrangements.
The main lambing and kidding periods were in the main rainy seasons. The average litter size,
birth weights (kg), and weaning weights (kg) were found to be: 1.4, 2.9, 11.6 for sheep and
1.6, 2.8, 9.0 for goats respectively.
109
Although there is little intention to keep male animals intact farmers in the study area select
rams to mate their females. The characteristics used in selecting breeding ram are based on
body confirmation, performance history and color.
One of the limiting factors in small ruminant production and marketing in the Goma district
are diseases and parasites. Deaths of small ruminants were reported by households over the
last 12 months. Higher death for both species was reported for suckling age groups followed
by 3 to 6 months age group while the least was reported for castrates. The signs for the disease
that causes death in the area were: emaciation, coughing, swelling around neck, depression
and loss of appetite, and abnormal breezing with auscultation, sudden death with bleeding in
openings.
There are five towns in the district where small ruminants are marketed. In addition, villages
are also places of marketing for small ruminants. Farmers, traders, brokers, restaurant/hotel
owners, butcheries are the major market participants. There is one main market route; from
Agaro to Addis Ababa. Market information sources, prices fluctuations and brokers are the
major marketing problems.
Farmers in Goma target marketing in holidays. Arafa is the most important target time of
marketing for fattened castrates. As the majority of Goma inhabitants are Muslims, Arafa is
one of the holidays when almost all Muslims consume meat either by slaughtering within the

110
household or share with other neighbors. Other targeted holidays include new year, Meskel,
Ed al fetir ans Easter.
In Goma district, small ruminant meat was consumed during various occasions. However, the
time is mostly restricted to holidays and some occasions like weeding, births in a family,
funerals and during coffee harvest. On the other hand there is no report of small ruminant milk
utilization in Goma farming community.
In spite of extension activities in various aspect of agriculture, there has not been any specific
extension package for small ruminants provided by NGOs or GOs in the district.
Husbands are primarily responsible for feeding, taking care of sick animals fattening, shelter
construction and much of marketing tasks. Women do cleaning of barns and taking care of
lambs and kids while children do herding and watering
The major problems in small ruminant production and marketing were, feed and grazing land
shortage, diseases and parasites; predators; marketing problems; inadequate extension support.
Therefore, relevant development programs that participates the farming community under the
prevailing farming system should be planned and effectively executed. In general;
• Feed development projects should be planned and implemented as the rainfall pattern
and soil fertility can enable most annual and perennial forage crops plantation

111
effective. Moreover, integration of improved forage species by different strategies
should also be area of intervention and then the issue of feed quality can be resolved.
• Diseases and parasites which are the major constraint in small ruminant production
should be studied in depth and microbial causes should be identified; Epidemiology
should also be clearly indicated and appropriate development intervention should be
planned.
• Fattening is the emerging opportunity for land owning and landless farmers and other
urban and per-urban communities; however, there are limited efforts in providing
profitable feeding packages and so appropriate technologies should be generated and
disseminated for the stakeholders.
• The reproductive performance of small ruminants in the area should be studied in
depth involving larger sample size and longer time as this study has only covered 36
households and period of around six months.
• Minimizing the involvement of brokers in marketing processes, providing reliable and
timely market prices information can solve the identified marketing problems. Barriers
to local and export markets should minimize and small ruminant producers should be
encouraged.
• Quantitative aspects of marketing (supply, demand, prices, producer and consumer
behavior) require further study to provide complete marketing information.
• An extension package that is intended to improve the economic contribution and
productivity of small ruminants should also be designed.

112
REFERENCES
Abegaz S., Fikiru T., Ulfina G. and Gemeda D. 2000. Growth performance and carcass
characteristics of Horro lambs castrated at different ages. ESAP (Ethiopian Society of
Animal Production). In proceedings of 8th annual conference of the ESAP. pp. 185-
191.
Abule E. 1998. Role and decision making power of women in livestock production around
Adami Tulu. ESAP (Ethiopian Society of Animal Production). Proceedings of 6th
annual conference of the ESAP held in Addis Ababa, Ethiopia, August 14-15 May
1998. pp 95-102.
Abule E. 2003. Rangeland evaluation in relation to pastoralists perceptions in the middle
Awash valley of Ethiopia. A Doctoral dissertation, Bloemfontein, and South Africa.
297p.
Addisu T., Teklu T., Wilfred M., and Hugo V. 1998. Gender differentials in smallholder
livestock production in the central highlands of Ethiopia. ESAP (Ethiopian Society of
Animal Production). Proceedings of 6th Annual Conference of the ESAP held in Addis
Ababa, Ethiopia, August 14-15 May 1998.pp19-27
Agyemang k., Negussie A., Voorthuizen K.and Anderson F.M. 1985. A rapid survey of sheep
production in the traditional sector of Debre Berhan, Ethiopian Highlands.
http://www.fao.org/Wairdocs/ILRI/x5464B/x5464b10.htm (Accessed on January 15,
2009).
Ahmed M. 2000. Development potential and constraints of hides and skins marketing in
Ethiopia. In: The opportunities and challenges of enhancing goat production in East

113
Africa. Proceeding of a conference. Markel, R.C. ,Abebe, G. and Goetsch, A.L.
(eds.)113-117. Langston Univ., OK (USA). E(Kika) da la Garza Inst. for Goat
Research; Debub Univ. Awassa (Ethiopia). College of Agriculture, 10-12 Nov. 2000,
Awassa, Ethiopia.
AIS (Agriculture Investment Sourcebook). 2003. Kenya: Community-Based Drought
Management. Innovative Activity Profile. The World Bank Group http://www-
esd.worldbank.org/ais/index (Accessed on December 20, 2008).
Aklilu, Y., Hawkes, P., King, A. & Sallivan, G. 2005. Sanitary and phytosanitory standards
(SPS) and livestock meat marketing assessment for Ethiopia. Consultancy Report for a
project funded under the RAISE IQC for sanitary and phytosanitiry standards (SPS) of
USAID in Washington, D.C. USAID/ Ethiopia and EDAT office of
USAID/Washington.
Aklowegw N. and Workneh A. 2004. Observation on the Effect of Levels of Salt and Stocking
Periods on Putrefaction in Preserving Sheep skin at Three Altitudes in Ethiopia. in
Asfaw Yimegnuhal and Tamrat Degefa (Eds). Proceedings of the 11th Annual
conference of the Ethiopian Society of Animal Production (ESAP) held in Addis
Ababa, Ethiopia, August 28-30, 2003. ESAP, Addis Ababa. pp121-127.
Alemayehu M. 1998. The Borana and the 1991-92 Drought: A Rangeland and Livestock
Resource Study. Institute of Sustainable Development, Addis Ababa, Ethiopia. pp.102.
Alemayehu M. 2003. Country pasture/Forage resources profiles: Ethiopia. Food and
Agriculture Organization of the United Nations (FAO). Web site:
http://www.fao.org/ag/agp/agpc/doc/counprof/ ethiopia/ethiopia.htm (Accessed on
January 30, 2008)
114
Asfaw N. and Jabbar M. 2008. Livestock ownership, commercial off-take rates and their
determinants in Ethiopia. Research Report 9. ILRI (International Livestock Research
Institute), Nairobi, Kenya. 52 pp.
Asfaw. W. 1997.Country report: Ethiopia, Proceedings of a Seminar on Livestock
Development Policies in Eastern and Southern Africa 28th July–1st August 1997,
Mbabany, Organized by CTA, OAU/IBAR, The Ministry of Agriculture, Cooperative,
Swaziland (1997).
Aune J.B.Buss M.T., Asfaw F.G. and Ayele A.A. 2001. The ox ploughing system in Ethiopia:
can it be sustained? Outlook on Agriculture. 30:275-280
Ayele S., Assegid W., Jabbar M.A., Ahmed M.M and Belachew H. 2003. Livestock marketing
in Ethiopia: A review of structure, performance and development initiatives. Socio-
economics and Policy Research Working Paper 52.ILRI (International Livestock
Research Institute), Nairobi, Kenya.
Azage T., Berhanu G. and Dirk H. 2006. ESAP (Ethiopian Society of Animal Production)
2006. Institutional arrangements and challenges in market-oriented livestock
agriculture in Ethiopia: Proceedings of the 14th annual conference of the Ethiopian
Society of Animal Production (ESAP) held in Addis Ababa, Ethiopia, September 5–7,
2006. ESAP, Addis Ababa. (1-20) pp.
Baker, R.L., Gray, G.D. 2004. Appropriate breeds and breeding schemes for sheep and goats
in the tropics. In: Sani, R.A., Gray, G.D., Baker, R.L. (Eds.), Worm Control for Small
Ruminants in Tropical Asia, Monograph, No. 113. Australian Centre for
InternationalAgricultural Research (ACIAR), pp. 63–95 http://www.ilri.org or from
http://www.worminfo.org (Accessed on February 12, 2009).

115
Baker R.L., Rege J.E.O. 1994. Genetic resistance to diseases and other stresses in
improvement of ruminant livestock in the tropics. In: Proceedings of the Fifth World
Congress on Genetics Applied to Livestock Production, vol. 20, University of Guelph,
Canada,August 7–12, 1994, pp. 405–412.
Bayou K.1998. Control of sheep and goatskin diseases. In: B.C. Ian and B. Bayou, editors,
Proceedings of Control of Sheep and Goatskin Diseases for Improved Quality of
Hides and Skin 13–14 February 1998, FAO, Addis Ababa (1998).
Berhanu G., D. Hoekstra and Azege T. 2006. Improving the Competitiveness of Agricultural
Input Markets in Ethiopia: Experiences since 1991. Paper presented at the Symposium
on Seed-fertilizer Technology, Cereal productivity and Pro-Poor Growth in Africa:
time for New Thinking 26th Triennial Conference of the International Association of
Agricultural Economics (IAAE), August 12 – 18, 2006, Gold Coast, Australia
Berhane G. and Eilk L.O.2006. Effect of Vetch(Vicia sativa) hay supplementation to Begait
and Abergelle goats in northern Ethiopia II. Reproduction and growth rate. Small
Ruminant Research.64:233-240.
Brännäng, E., Mohammed Y. Kurtu and Demissie Ido. 1987. Preliminary report on
performance of local and crossbred sheep at Assela research Station, 1972-1985. In:
Proceedings of the first national livestock improvement conference, 11-13 February
1987, Addis Abeba, Ethiopia. IAR, Addis Abeba. pp.81-85.
CACC (Central Agricultural Census Commission). 2008. Ethiopian Agricultural Sample
Enumeration, 2007/08. Results at country level. Statistical report on socio-economic
characteristics of the population in agricultural household, land use, and area and
production of crops. Part I. (December 2008) Addis Ababa, Ethiopia.

116
CIMMYT. 2000. Improving the Productivity of Crop Livestock Production in Wheat-based
Farming Systems in Ethiopia, Addis Ababa, Ethiopia, 10-11 Oct. 2000.Mexico
City.Mexico.
Combellas, J. 1980. Production and reproduction parameters of tropical sheep breeds in
improved production systems. Tropical Animal Production, 1980 5:3.
Conroy, C. 2004. Livestock Sector Growth and Poverty, with particular reference to India.
Natural Resource Institute (RIS) http://dfid-agriculture-
consultation.nri.org/keypapers/livestockrevolution (Accessed on March 9, 2009).
Coppock D Layne (ed.). 1994. The Borana Plateau of Southern Ethiopia: Synthesis of pastoral
research, development and change, 1980-91. ILCA (International Livestock Centre for
Africa), Addis Ababa, Ethiopia. 393 pp.
Delgado, C., Rosegrant , M., Steinfeld, H., Ehui, S., and Courbois, C. 1999. Livestock to
2020: the next food revolution. Food, Agriculture, and the Environment Discussion
Paper 28. IFPRI, FAO and ILRI. IFPRI, Washington, D.C.72 pp
Daniel T. 2008. Beef cattle production system and opportunities for market orientation in
borena zone, southern Ethiopia. MSc Thesis. Haramaya University, Haramaya.
Devendra, C. 2007. Small ruminants in Asia; Contribution to food security, poverty alleviation
and opportunities for productivity enhancement.
http://www.mekarn.org/procsr/Devendra.pdf (Accessed on February 27, 2007).
Devendra, C. and Burns, M. 1983. Goat Production in the Tropics. Common wealth
Agricultural Bureaux (CAB). Farnham Royal, UK. 184pp.
Dibissa N. 2000. Sheep production on small holder farmers in the Ethiopian High lands-a
farming system Approach. Ph.D. dissertation. Humboldt University, Berlin, Germany.
117
EARO (Ethiopian Agricultural Research Organization). 2000. National Small Ruminants
Research Strategy Document. EARO, Addis Ababa, Ethiopia.
Ehui S.K., Benin S. and Nega G. 2000. Factors affecting urban demand for live sheep: The
case of Addis Ababa, Ethiopia. Socio-economics and Policy Research. Working Paper
31. ILRI (International Livestock Research Institute), Nairobi, Kenya. 32 pp
Ehui S.K., Ahmed M.M, Berhanu Gebremedhin, Benin S.E., Nin Pratt A. and Lapar Ma.L.
2003. 10 years of Livestock Policy Analysis. Policies for improving productivity,
competitiveness and sustainable livelihoods of smallholder livestock producers. ILRI
(International Livestock Research Institute), Nairobi, Kenya. 118 pp.
Endeshaw A. 2007. Assessment on production system and marketing of goats at Dale district
(Sidama Zone). MSc Thesis. Hawassa University, Awassa, Ethiopia.
FAO (Food and Agricultural Organizations of the United States). 2009. FAOSTAT data
http://faostat.fao.org/faostat/collections?subset=agricuture (Accessed on March 29, 2008).
FARM-Africa. 1996. Goat Types of Ethiopia and Eritrea. Physical description and
management systems. Published jointly by FARM-Africa, London, UK, and ILRI
(International Livestock Research Institute), Nairobi, Kenya. 76 pp.
Galal, E.S.E. 1983. Sheep germ plasm in Ethiopia. Animal genetic resource information.
UNEP/FAO, Animal genetic resource news letter. 1:4-12.
Galal, E.S.E., J. Yohannes, T. Demissie and W.G. Kasshun, 1984. Characterization of some
Ethiopian breeds of sheep and goats: 1. Horro sheep. Agricultural research conference
organized by Institute of Agricultural Research (IAR). Addis Ababa, Ethiopia, 19-21
Apr. 1981, Institute of Agricultural Research (IAR).

118
Gatenby, R.M. 1986. Sheep production in the Tropics and Sub-Tropics. Tropical Agricultural
Series, Long man group limited. New York, USA. 351p.
Gautsch, K.D., 1987. Comparative productivity of indigenous sheep in the highland of
Ethiopia and Rwanda. SRCG Working document, No. 14. ILCA (International
Livestock Center for Africa), Addis Ababa, Ethiopia.
Gemeda D., Takele K., Ulfina G., Solomon A. and Gebregziabher G.2005. Mortality and
Reported Clinical Signs in Horro Sheep at Smallholder Farms in East Wollega and
West Shoa Zones,Ethiopia. Eth. J. Anim. Prod. 5(1)- 2005: 33-42
Getachew T. 1995.Parasites of small ruminants. In: G.D. Gray and G. Uilenberg, Editors,
Parasitological Research in Africa. Proceedings of International conference, Bobo
Dioulasso, Burkina Faso (1995).
Getahun L. 2008. Productive and Economic performance of Small Ruminant production in
production system of the Highlands of Ethiopia. Ph.D.dissertation. University of
Hohenheim, Stuttgart-Hoheinheim, Germany.
Girma A. , Merkel, R. C. and Sahlu, T. 2000. Enhancing food security and income generation
potential of families in Southern Ethiopia through improved goat production and
extension: A progress report of an ALO-funded project. In: The opportunities and
challenges of enhancing goat production in East Africa. Proceeding of a conference.
Markel, R.C., Abebe, G. and Goetsch, A.L. (eds.) 113-117. Langston Univ., OK
(USA). E (Kika) da la Garza Inst. for Goat Research; Debub Univ. Awassa(Ethiopia).
College of Agriculture, 10-12 Nov. 2000, Awassa, Ethiopia.

119
IBC (Institute of Biodiversity Conservation). 2004. The State of Ethiopia’s Farm animal
Genetic Resources: Country Report. A Contribution to the First Report on the Stat of
the World’s Animal Genetic Resources. IBC, May 2004. Addis Ababa, Ethiopia.
Ibrahim H. 1998. Small Ruminant Production Techniques. ILRI Manual 3. ILRI (International
Livestock Research Institute), Nairobi, Kenya. 207 pp.
IFPRI (International Food Policy Research Institute), Washington, DC, USA. 72 pp.
ILCA (International Livestock Center for Africa). 1991. A hand Book of African Livestock
Statistics. Working Document No. 15. August 1991. A. Ababa, Ethiopia.
ILCA. 1993. ILCA’s Long term strategy, 1993-2010. ILCA, Addis Ababa, Ethiopia, pp.102.
ILCA., 1990. Livestock system research manual, ILCA Working Paper No. 1, Volume 1.
International Livestock Centre for Africa (ILCA), Addis Ababa, Ethiopia. 287p.
ILRI. 2000. Livestock strategy to 2010: Making the livestock revolution work for the poor.
ILRI (International Livestock Research Institute), Nairobi, Kenya. 112 pp.
IPMS (Improving productivity and Market Success of Ethiopian farmers). 2007. Goma Pilot
Learning Wereda diagnosis and program design. IPMS, International livestock
research institute, Addis Ababa, Ethiopia. Unpublished Report
Jabbar, M.A., Tambi, E. and Mullins, G. 1997. A methodology for characterizing dairy
marketing systems. Market-Oriented Smallholder Dairying Research Working
Document 3. International Livestock Research Institute (ILRI), Nairobi, Kenya.
Jahnke H.E. 1982. Livestock production systems and livestock development in tropical Africa.
Kieler Wissenschaftsverlag Vauk, kiel, Germany. 273pp.
Kassahun A. 2004. The State of Ethiopia's Farm Animal Genetic Resources-Country Report:
A Contribution to the First Report on the State of the World's Animal Genetic

120
Resources. ESAP (Ethiopian Society of Animal Production) Newsletter. Issue No. 10,
2004.
Kebede, Z. 1995. Skin and hides production and marketing in Ethiopia. In: proceedings of
Annual Conference of the Ethiopian Society of Animal Production (ESAP), 26-27
May 1993. Addis Ababa, Ethiopia.
Kedija H. 2007. Characterization of milk production system andopportunity for market
orientation: a case study of mieso district, oromia region, Ethiopia. MSc Thesis.
Haramaya University, Haramaya
Kiwuwa, G.H., J.C.M. Trail, M.K. Yousef, G. Worku, F.M. Anderson and J.W. Durkin 1983.
Crossbred dairy cattle productivity in Arsi region, Ethiopia. Arsi Rural Development
Unit, Assela (Ethiopia). ILCA Research Report No. 11. International Livestock Centre
for Africa (ILCA), Addis Ababa, Ethiopia. 29p.
Kosgey, I.S., 2004. Breeding Objectives and Breeding Strategies for Small Ruminants in the
Tropics. Ph.D. Thesis. Wageningen University, The Netherlands, 272 pp.
Lightfoot, C., Dennig, A., Cook, J. 2005. Proceedings workshop on Market Linkages 8-10
June 2005. International Support Group (ISP) http://www.isglink.org (Accessed on
March 14, 2009)
Mack S D. 1983. Evaluation of the productivities of West African Dwarf sheep and goats in
southwest Nigeria. Humid Zone Programme Document 7. ILCA (International
Livestock Centre for Africa), Ibadan, Nigeria. 39 pp.
Markos T. 2006. Productivity and Health of indigenous sheep Breeds and Crossbreds in the
Central Ethiopian Highlands. Faculty of Medicine and Animal Science department of

121
Animal Breeding and Genetics. Ph.D.dissertation. Swedish University of Agricultural
Sciences, Uppsala, Sweden
McPeack, J. 2003. Livestock Marketing in Kenya and Ethiopia: Proceedings of a workshop
held at Safari Park Hotel, Nairobi Kenya, Aug 11-13, 2003. Global Livestock
Collaborative Research Support Program (GL-CRSP).
Mukasa-Mugerwa, E. and Azage T. 1991. Reproduction performance in Ethiopian Zebu (Bos
indicus) cattle: constraint and impact on production. pp. 16-28. An invited paper
presented at fourth national livestock improvement conference. Addis Ababa, Ethiopia,
13- 15 Nov. 1991, Institute of Agricultural Research (IAR).
Mukasa-Mugerwa, E., A.N. Said, A. Lahlou-Kassi, J. Sherington and E.R. Mutiga, 1994. Birth
weight as risk factors for perinatal ewe supplementation and gestation weight gain in
Ethiopian Menz sheep. Preventive Veterinary Medicine. 19: 45-56
Mukasa-Mugerwa, E., Anindo, D., Sovani, S., Lahlou-Kassi, A., Tebely, S., Rege, J.E.O. and
Baker, R.L. 2002. Reproductive performance and productivity of Menz and Horro
sheep lambing in the wet and dry seasons in the highlands of Ethiopia. Small Ruminant
Research 45 (2002) 261-271.
Mukasa-Mugerwa, E., Ephreim B. and Taddesse T. 1986. Productivity of indigenous sheep
and goats in the Ada district of Ethiopian highlands. pp. 81-87. In: K.O. Adeniji and
J.A. Kategile (eds.). Proceedings of the workshop on the improvement of Small
Ruminants in Eastern and Southern Africa. Nairobi, Kenya, 18-22 Aug. 1986.
Niftalem D.1990. Sheep production on smallholder farms in the Ethiopian highlands - a
farming system approach. A PhD. Dissertation presented to the Humboldt University,
Berlin, Germany. 131p.

122
Nin Pratt A., Bonnet P., Jabbar M.A., Ehui S. and de Haan C. 2005. Benefits and costs of
compliance of sanitary regulations in livestock markets: The case of Rift Valley fever
in the Somali Region of Ethiopia. ILRI (International Livestock Research Institute),
Nairobi, Kenya. 70 pp.
Otte, M.J. and P. Chilonda. 2002. Cattle and small ruminant production systems in sub-
Saharan Africa: A systematic review. Livestock information, sector analysis and policy
branch, Food and Agriculture Organization of the United Nations (FAO), Rome, Italy.
98p.
Rewe, T.O., Ogore, P.B., Kahi, A.K. 2002. Integrated goat projects in Kenya: impact on
genetic improvement. In: Proceedings of the SeventhWorld Congress on Genetics
Applied to Livestock Production, vol. 33, Montpellier, France, August 19–23, 2002,
pp. 385–387.NSW.
Sölkner, J., Nakimbugwe, H.,Valle Zarate, A. 1998. Analysis of determinants for success and
failure of village breeding programmes. In: Proceedings of the Sixth World Congress
on Genetics Applied to Livestock Production, vol. 25, Armidale, Rege, J.E.O., 1994.
Indigenous African small ruminants: a case for Characterization and improvement. In:
Proceedings of the Second Biennial Conference of the African Small Ruminant
Research Network, UICC, Kampala, Uganda, December 5–9, 1994, pp.293–295.
Samuel M. 2005. Characterization of livestock production system: of East Showa, Ethiopia;
MSc. Thesis. 2005. Alemaya University. Alemaya.
Sisay A. 2006. Livestock production systems and available feed resources in different agro-
ecologies of north Gonder zone, Ethiopia. M.sc. Thesis. Alemaya University. Alemaya
SPSS. Version 13.0. 2003. Software Package for Social Sciences for Window.
123
Solomon A. and Gemeda D. 2000. Genetic and phenotypic parameters of growth, reproductive
and survival performance of Horro sheep at Bako Research Center. Research
fellowship report. International Livestock Research Institute (ILRI), Addis Ababa,
Ethiopia.
Solomon G. G. 2006. Genetic diversity and conservation priorities for Ethiopian sheep.
Proceedings of a workshop on Sheep Breeding Strategies for Ethiopia held at ILRI,
Addis Ababa, Ethiopia on 21 November 2006. ILRI (International Livestock Research
Institute), Nairobi, Kenya.
Solomon G., Solomon A., and Yohannes G. 1995. Factors affecting pre-weaning survival of
Horro lambs at Bako Research Center. In: Proceedings of the 3rd Annual Conference
of Ethiopian Society of Animal Production (ESAP), 27-29 April 1995, Addis Ababa,
Ethiopia. Pp. 140 - 145.
Takele K. , Gemeda D., Fikru T., Ulfina G., and Yohannes G. 2006. Study on Sexual and
Fattening Performance of Partially Castrated Horro Rams. Ethiopian Journal of Animal
production. 6(2) - 2006: 29-36.
Tatek W., Hailu D., Mieso G. and Dadi G. 2004. Productivity of Arsi Bale goat types under
farmers’ management condition: a case of Arsi Negelle. Proceedings of the 13th
Annual conference of the Ethiopian Society of Animal Production (ESAP) held in
Addis Ababa, Ethiopia, August 25-27, 2004. ESAP, Addis Ababa. pp67-71.
Tekelye, B., E. Bruns, O.B. Kasali and E.R. Mutiga. 1993. The effects of endoparasites on the
reproductive performance of on-farm sheep in Ethiopian highlands. Indian J. of Anim.
Sci. 63:8-12.
124
Tekelye B., Kasali, O.B. 1992. The effect of endoparasites on the productivity of Ethiopian
highland sheep. Rey B., Lebbie S.H.B., and Reynolds L. (eds). 1992. Small ruminant
research and development in Africa. Proceedings of the First Biennial Conference of
the African Small Ruminant Research Network, ILRAD, ILCA Nairobi,Kenya, 10-14
December 1990.
Tembely, S. 1998. Small Ruminant Production in Ethiopia: Prospects for Improving
Productivity. Proceeding of 5th Conference of ESAP. p.82-90
Tesfaye A.T., Yadav, B. R, Hanotte, O. and Jianlin, H. 2006. Genetic characterization of
indigenous goat populations of Ethiopia using microsatellite DNA markers.
Proceedings of a workshop on Sheep Breeding Strategies for Ethiopia held at ILRI,
Addis Ababa, Ethiopia on 21 November 2006. ILRI (International Livestock Research
Institute), Nairobi, Kenya.
Tesfaye D. 2008. Assessment of feed resources and rangeland condition in Metema district of
north Gondar zone, Ethiopia. Msc. Thesis. Haramaya University, Haramaya, Ethiopia
Teshome A. 2006. Traditional utilization practices and condition assessment of the rangelands
in rayitu district of bale zone, Ethiopia. MSc Thesis. Haramaya University, Haramaya,
Ethiopia/
Tiffen, M. 2004. Population pressure, migration and urbanization: Impacts on crop-livestock
systems development in West Africa. Williams T.O., Tarawali S.A., Hienaux and
Fernandez-Rivera S (eds). 2004. Proceeding of an international conference held at then
International institute of Tropical Agriculture (IITA), Ibadan, Nigeria, 19-22
November2001. ILRI (International Livestock Research Institute), Nairobi, Kenya and

125
CTA (Technical Centre for Agriculture and Rural Cooperation, ACP-EC),
Wageningen, The Netherlands. pp3-27.
Tsedeke K. 2007. Production and marketing of sheep and goats in Alaba, SNNPR. Msc
thesis.Hawassa University. Awassa, Ethiopia
Wilson, R.T. and Th. Murayi, 1988. Production characteristics of African long-fat-tailed sheep
in Rwanda. Small Ruminant Research. 1:3-17. World Bank 2006 a. Enhancing
Agricultural Innovation: How to go beyond the strengthening of Research systems.
Washington D.C.
Wilson, R.T., 1982. Husbandry, nutrition and productivity of goats and sheep in Tropical
Africa. pp. 61-75. In: R.M. Gatenby and J.C.M. Trail (eds.). Small Ruminant Breed
Productivity in Africa. International Livestock Centre for Africa (ILCA). Addis
Ababa, Ethiopia
Wilson, R.T., 1986. Livestock production in the central Mali: Long-term studies on cattle and
small ruminants in the agropastoral system. ILCA Research Report No. 14.
Wilson, R.T., 1989. Reproductive performance of African indigenous small ruminants under
various management systems: A review. Animal Reproduction Science. 20:265-286.
Wilson, R.T., 1991. Small ruminant production and the small ruminant genetic resource in
Tropical Africa. Animal production and Health paper. Food and Agriculture
Organization of the United Nations (FAO), Italy, Rome. 88: 20-28.
Winrock International. 1976. Proceedings of a Workshop on the Role of Sheep and Goats in
Agricultural Development held at Winrock International Center, Morrilton, Arkansas,
USA, 15-17 November 1976. Winrock International Livestock Research and Training
Centre, Morrilton, Arkansas, USA. 43 pp.

126
Wollny, C.B.A., Banda, J.W., Mlewah, T.F.T., Phoya, R.K.D., 2002. The lessons of livestock
improvement failure: revising breeding strategies for indigenous Malawi sheep? In:
Proceedings of the Seventh World Congress on Genetics Applied to Livestock
Production,vol. 33, Montpellier, France, August 19–23, 2002, pp.345–348.
Workneh A. 2000. Do smallholder farmers benefit more from crossbred (Somali x Anglo-
Nubian) than from indigenous goats? PhD Thesis. Georg-August University of
Goettingen, Goettingen, Germany. Cuvillier Verlag, Goettingen.
Workneh A. 2006. Getting the incentives right: concerns associated with expansion of cattle
export markets in Ethiopia. Ethiopian Journal Animal production. 6(2) - 2006: 99-103.
Workneh A. and Rowlands J. (eds). 2004. Design, execution and analysis of the livestock
breed survey in Oromiya Regional State, Ethiopia. OADB (Oromiya Agricultural
Development Bureau), Addis Ababa, Ethiopia, and ILRI (International Livestock
Research Institute), Nairobi, Kenya. 260 pp.
Workneh A., Ephrem G., Markos T., Yetnayet M., and J.E.O. Rege. 2004. Current state of
knowledge on characterization of farm animal genetic resources in Ethiopia. ESAP
(Ethiopian Society of Animal Production).
Workneh A., Rischkowsky, B., King, J.M., Bruns, E., 2003. Crossbreds did not create
more net benefits than indigenous goats in Ethiopian smallholdings. Agric. Sys. 76,
1137–1156.
World Bank 2006 . Africa Development Indicators 2006. Washington D.C
Yeshitila A. 2007. Efficiency of livestock feed resources utilization and forage development in
Alaba woreda, southern Ethiopia. MSc Thesis. Haramaya University, Haramaya,
Ethiopia.
127
Yohannes G., Solomon G., Thwaites, C.J. and Kassahun A. 1995. Influence of birth weight
and postpartum age on lamb mortality in Ethiopian Horro sheep. In: Proceedings of the
3rd Annual Conference of Ethiopian Society of Animal Production (ESAP), 27-29
April 1995, Addis Ababa, Ethiopia. Pp 219 -222.
Zewdu K. 1998. Marketing of Sheep and Goat Skins in Ethiopia. Proceeding of conference.
Phase II. Ministry of Agriculture, Addis Ababa, Ethiopia and Technical Cooperation
Programme, FAO, Italy, Rome: MoA Conference on In-Service Training Exercise on
Hides and Skins Improvement, Addis Ababa (Ethiopia), 9-12 Feb 1998.
Zinash S., Aschalew T., Alemu Y. and Azage T. 2001. Status of Livestock Research and
Development in the Highlands of Ethiopia. In: P.C.Wall (ed.). Wheat and Weed: Food
and Feed. Proceedings of Two Stockholders Workshop.

128
APPENDICES
Source: IPMS ATLAS 2007
Appendix 1. Location of Goma

129
QUESTIONNAIRE
1. Enumerator’s Name ____________________________________
2. Date of Interview _____________________
3. Kebele Name __________________________________________
Section One: General information
1. Name of the interviewee __________________________
2. Sex of the interviewee
Male _______ Female_____________
3. Position in House hold:______________
Head ____________ spouse __________
4. Religion :________________________
5. Family size
a. Children(<15 years): Females __________Males_______________
b. Adults (15-65):Females _____________Males__________________
c. Adults(>):Females _____________Males__________________
6. Educational level of Family members.
6.1. Illiterate
6.2. Grade 1-6____________
6.3 Grade 6-12___________
6.4. Higher education ______
Land holding and land use systems 1. What is the size of your total land holding? __________ timad
2. How much is your land allocated for the followings?
1 Creal crop cultivation _________________timad
2. Coffee cultivation _________________timad
3. Tropical fruit _________________timad
4. Spice cultivation _________________timad
5. Forage cultivation _________________timad

130
6. Grazing/pasture land _________________timad
7. Fallow land _________________timad
8. Natural wood land_________________timad
9. Man-made wood land_________________timad
10. Others, specify _________________timad
Purpose of keeping Sheep and Goats (Rank them) 1. Income source (sale) 2.Meat 3.Milk
4. Manure 5.Sacrifice/rituals 6.Social/cultural function
7. Saving (Insurance) 8. Risk/Benefit Distribution with other animals
9. Other reasons____________________________

131
Compositions, structures and ownership of household livestock (in past 12 months) 1. How many of the following animals you keep?
S N
Structure Number Owned
Ownership Origin Own Share
Ribi Family Home
born Purchased Gift
Cattle herd 1 Cows 2 Bulls 3 Heifers 4 Male calves 5 Female calves 6 Oxen (draft) 7 Oxen (fatten) Sheep flock 1 Lambs <6 months 2 Males 6-12 months 3 Females 6-12 months 4 Ewes 5 Rams (intact) 6 Castrates Goat flock 1 Kids <6 months 2 Males 6-12 months 3 Females 6-12 months 4 Does 5 Bucks 6 Castrates Equines 1 Stallion /male horses 2 Mare/female horses 3 Female donkey 4 Male donkey 5 Mules Chicken 1 Total in the
household

132
Section Two: Sheep and goats production A. Feed and water resources, seasonal calendars and feeding managements 1. What are the major basal feeds sources available for sheep and goats & their availability?
No
Feed types and water
sources
Seasonal availability Sep Oct Nov Dec Jan Feb Mar Apr Ma Jun Jly Aug
1 Communal grazing land
2 Road side grazing 3 Grazing aftermath 4 Grazing in riverside 5 Private grazing land
(kalloo)
6 Crop residues 7 Conserved feeds(hay ,
ect)
8 Indigenous browses 9 Fodder
leaves/improved forages
10 Enset and banana corms, leaves, stem
11 Root crops tubers, leaves, corms
12 Home leftover foods and drinks
13 Coffee pulp/haul 14 Fruit leftover 15 Concentrates 16 Weeds 17 Crop tillers and fillers 18 Others, specify 2. Do you graze your sheep and goats? 1=Yes 2=No
3. If yes, for how long?_______________days in a week _______________hours a day
4. How sheep and goat graze? 1= Sheep alone 2=Goat alone 3= Sheep + Goat
4=Together with other livestock
5. How you practiced grazing your sheep and goats in the dry season?
1=Free grazing 2=tethered grazing 3= cut and carry
6. How you practiced grazing your sheep and goats in the wet season?
1=Free grazing 2=tethered grazing 3= cut and carry

133
7. Do you usually provide your sheep and goats with supplementary feeds in addition to
grazing? 1=Yes 2=No
8. If yes, what type of feed and others?
No
Feed types Sheep Goats Lambs Ewe(Lactatin) Ram castrates Kids Doe
s Buck Castrate
s 1 Wheat bran 2 Maize grain 3 Oil
cakes/meals
4 Fruit leftover 5 Food
leftovers
6 Home made brewers recipes(atela)
7 Salt/local mineral sources
8 Cultivated Fodder leaves
9. When do you usually offer your sheep and goats with supplements?
1=Dry season 2=Wet season 3=Both
10. How often do you offer supplements to your sheep and goats?
1=Daily 2=Twice a day 3=Whenever available4=Others, specify
11. If you not provide with supplements, why?
1=Not accessible 2=Expensive 3=Not want to offer sheep and goats 4=Others,
specify
12.Is there any time in the year during which feeds for sheep, goat and other livestock
available surplus in you areas?
1=Yes 2=No
13. If yes, in what months? No Surplus feed
type Months
Sep Oct Nov Dec Jan Feb Mar Apr May Jun July Aug 1 2 3 4

134
14. Do you conserve feed? 1=Yes 2=No
15. If yes in what form? 1=Hay 2=Silage 3=Others
16. If not why?1=Not skilled and experienced 2=Shortage of grasses/fodder
3=Labor shortage 4=others, specify
17. Do you practiced tether feeding of sheep and goats 1=Yes 2=No
18. If yes, why? 1=To avoid crop and vegetation damages 2=Save labor
3=Protect from predators 4=Utilize marginal land and hillsides
5= control breeding 6=Others, specify
19. Is there feed shortage or constraint for your sheep and goats? 1=Yes 2=No
20. If yes, when? 1=Dry season 2=Wet season 3=Both
21. If feed shortage in your locality, why? (rank)
1=Shrinking and decline in productivity of grazing lands
2=Increase of animal population
3=Cultivation, settlement and protection on grazing lands
4=Drought
5=Increase of human population
6=Others, specify
22. What are the common water sources of sheep and goat in this area?
No Sources of water Estimated distance(1hr=5kms) Rainy season Wet season 1 River 2 Pond 3 Rain water 4 Water harvest 5 Deep well 6 Pipe 7 Any other sources

135
23. In what intervals you offer sheep and goats with water? No Frequency Sheep Goat
Dry season Wet season Dry season Wet season 1 Any time required 2 Once a day 3 Twice a day 4 Every other day 5 Every three day 6 Others, specify 24. Is there any water shortage or problem to sheep and goats? 1=Yes 2=No
25. If yes, when? 1=Dry season 2=Wet season 3=Both
26. Why shortage of water?1=Drying of water sources
2=Far distant from water sources 3=Not
allowed to use sources
4=Provide other livestock than sheep and goats
5=others, specify
B. Sheep and goats health management 1.What are the common diseases and parasites that affect health and production of sheep and goats No Local name Affect Symptoms Seasons/months
Sheep Goat Both 1 2 3 4 5 2. What would you do when your sheep and goats sick? 1=Treat with ethno veterinary practices 2=Sales immediately 3=Slaughters immediately 4=Takes to veterinary center 5=Take to or treat with treatments of local traders 6=Others, specify 3. Are you accessible to veterinary services in your locality/near distance? 1=Yes 2=No 4. If yes, how far? __________Km 5. From where you usually obtain veterinary services? 1=OoARD 2=DA offices 3=NGOs 4=Private institutions 5=Open markets 6. How you obtain services in these institutions? 1=Free of charge 2=Payment 3=Credit 4=Others, specify 7. Did your sheep and goats vaccinated? 1=Yes 2=No 8. If yes, how? 1=After report of disease cases 2=After certain animals died 3=Others, specify

136
9. Do you uses medicines and drugs from illegal traders/open markets for sheep and goats? 1=Yes 2=No 10. If yes, yes why? 1=Cheap 2=Not accessible to veterinary center 3=Not want to use veterinary center 4=Others 11. If not use, why? 1=Not cures 2=DAs and health experts advised not to use 3=Expensive 4=Not accessible 5=Others 12. Do you cut and/or brand with hot iron your sheep and goats? 1=Yes 2=No 13. If yes, why? 1= Ethno veterinary treatment to sick animals 2=Identify/tag the animals 3=Others, specify 14. If not, why?1=Learnt that it affects quality of skin 2= Reduce price of skin 3=Others, specify ________ 15. Has there been any death of sheep and goats over the last 12 months?1=yes 2=No 16. If yes,(specify the number) No
Sheep Goats
Structure Died Structure Died 1 < 3months < 3months 2 3-6 months 3-6 months 3 Ewes Does 4 Rams Bucks 5 Castrates/fattening Castrates/fattening
17. What are the common problems of sheep and goats health management in this area?
1=Widespread of diseases and parasites 2=Shortage of feeds and water in the area
3=Lack/shortage of veterinary institutions 4=Lack of animal health professions
5=Lack/shortage of drugs and medicines 5=Unaffordable prices for services
6=Drought in the area 6=Others, specify
C. Sheep and goats breeding and reproductive managements
1. Do you select your male animals for breeding purpose?1=Yes 2=No
2. What are the criteria for sire(Ram) selection?1=color 2= body conformation3=pedigree
3. What are the criteria for sire(buck) selection?1=color 2= body conformation3=pedigree
4. Do you have your own breeding male animals (ram & buck)? 1=Yes 2=No
5. What are common sources of breeding males fro your flocks?
No Sources of breeding males Ram Bucks 1 Own 2 Neighbors 3 Others, Specify 6. When (season/months) during the year you observe intensive lambing & kidding?

137
No Species Intense breeding and conception months Sep Oct Nov Dec Jan Feb Mar Apr May Jun Jul Aug
1 Lambing 2 Kidding 7. How is the reproductive performance of sheep and goats in your farm?
S N
PARTICULARS SHEEP GOATS Male Female Male Female
1 Age at first parturition (months) 2 Parturition interval (months) 3 Average litter sizes(single, twin, triplets) 4 Infertile 5 Slaughter age (months)/marketing age D. Lamb and kid rearing, castration and culling 1. Do you provide lambs and kids any feed in addition to their mother’s milk until they begin
grazing? 1=Yes 2=No 2. If yes, what types of feed resources and feeding?
Feed types Feeding systems Lambs _________________ _________________________________ Kids _________________ ________________________________
3. Do you practice weaning lams and kids? 1=Yes 2=No 4. If yes, when? Lambs__________ months Kids ___________ months 5. Do practice castration of sheep and goats? 1=Yes 2=No 6. If yes, why?1=To fetch more price (by fattening) 2=To avoid mate their flock with these males 3=Others, specify ________________________ 7. At what age you castrate? Sheep __________ months Goat ___________ months 8. How you select sheep and goats for castration and fattening?(rank) 1=Conformation (height, length and appearance) 2=Breed (known local ecotypes) 3=Physical characteristics (color, horn, tail length and width, ear etc) 4=Age 5=Others, specify __________________________________ 9. If you practices to select with physical characteristics, rank each 1=Color 2=Horn 3=Ear 4=Tail 5=body Length and height 6=Others 10. Do offer specific feeding and other management practices for castrated sheep and goats?
1=Yes 2=No 11. If yes, what and for how long? Feed types Duration
Castrate sheep______________________ _______________________ Castrate Goat ______________________ ________________________ 12. What is the common ways of castrating your sheep and goats?

138
1=Local methods (stone, stick, metal, others) 2= Burdizo (OoARD) 3=others 13. Do you practice fattening of sheep and goats for target market seasons and market places?
1=Yes 2=No 14. If yes, which season/months and rank? 1=New Year festival 2=Ester 3=Christmas 4=Meskel 5=Ed al Fetir 6=Others, specify ____________ 15. Is there and emerging opportunity of increased demand and incentive price for fattened
sheep and goats? 1=Yes 2=No 16. Do you practice culling of sheep and goats from flock? 1=Yes 2=No 17. If yes, why (rank)? 1=Oldage 2=Sickness 3=Lambing and kidding problems
4=Physical defect 5=Unwanted physical characteristics 7=Others, specify _____________________________
18. How do sheep and goats left from your flock over the last 12 months? 1=Sale 2=Death 3=Slaughter for home consumption 4=Theft 5=Predator 6=Gift
7=Share arrangements 8=Others, specify _________________________ 19.How do you replace/own sheep and goats left the household flock in various ways? 1=home born 2=share arrangements 3=gift 4=purchase 5=Not replace 6=others, specify 20. If you sale sheep and goats for urgent income needs, which do you prefer to sale? 1=Lambs and kids 2=Rams and bucks 3=Ewes and doe 4=Castrates 5=Others, specify 21. How you sale young male sheep and goats? 1=Sale all when reach to marketing age 2=Sale holding some for breeding 3=Sale holding some to castrate and fattening 4=Others, specify _______________ 22. Do you cut tail of female sheep/ewe? 1=Yes 2=No 23. If yes, why and when (age, months)?___________________________________ E. Housing of sheep and goats 1. Where you confine sheep and goats? 1=Main house 2=Adjoin house(in the house) 3=Separate constructed house 4=Grazing area (open kraals) 5=Others, specify _____________________ 2. How you confine house sheep and goats? 1=Sheep alone 2=Goats alone 3=Sheep and goats alone 4=Sheep, goats and all other animals together 5=Others, specify _________ 3. Why you provide sheep and goats with shelter? 1=Protect from sun, rain and frost 2=Protect from predator 3=Provide convenient climatic condition 4=To provide supplement 5=Others, specify _______________

139
G. Sheep, goats and their products utilizations 1. If you slaughter sheep and goats for home consumption, usually when? 1=For festivals 2=weeding 3=Whenever slaughter age animals available
4=Briths in a family 5=for guests 6=circumcise 7=At funeral ends 8=Others, specify _______________
2. Which sex of sheep and goats you usually slaughter? 1 Sheep 1=Male 2=Female 3= Both 2 Goats 1=Male 2=Female 3=Both
3. Is milking and use of milk and milk products from sheep and goats common in your area?1=Yes 2=No 4. If yes, which animals? 1=Sheep 2=Goats 3=Both 5. If no, why? 1=Cultural taboo 2=Religious taboo 3=Not common in the area 4=Others, specify ___ 6. For what purposes you usually use the milk? 1=Children consumption 2=Adult consumption 3=Processing 4=Medicine 5=Others, specify ______________ 7. who in the family is given priority for consume milk? 1=children 2=sick 3=old people 4=all 5=others SECTION THREE Marketing of sheep and goats, their products and by-products 1. Have you sold sheep and/or goats in the past 12 months? 1=Yes 2=No 2. If yes, why?(rank)
1= Obtain cash for farm inputs (fertilizer, seed, others) 2= Obtain cash income for children school 3= Obtain cash for family and animal health treatments 4= Shortage of grazing land and feeds 5= Cash to purchase foods 6=To pay back credit 7= Others, specify___________________________________________________
3. Where you sell your animals? 1= Farmers in the same village 2= Farmers in nearby village 3= Agaro 4=others small towns specify
4. Have you purchased sheep and/or goats in the last 12 months?1= Yes 2= No 5. Why did you purchas sheep and goats? 1=slaughter for festivals 2=slaughter for ceremonies/rituals 3=Breeding 4=fattening 5=others 6. If yes, from where did you purchased?
1= Farmers in the same village 2= Farmers in nearby village 3= agaro 4=other towns specify

140
7. How many sheep and goats have you sold and purchased in the past 12 months and how much? S N
CLASSES OF ANIMALS
SOLD PURCHASED Number When/
Months Unit Price
Total price
Number When/ months
Unit Price
Total price
Sheep 1 Ewe 2 Ram 3 Male lamb 4 Female lamb 5 Castrate Goat 1 Doe 2 Buck 3 Male kid 4 Female kid 5 Castrate/fatten 8. When in the year you prefers to sale or purchase sheep and/or goats? No WHEN SHEEP GOATS
Sale Purchase Sale Purchase 1 During festivals (specify) 2 During crop planting 3 During crop harvesting 4 Others, specify
9. How you sales or purchases your animals? 1= Live weight basis 2= ‘Eye ball’ Estimation 3=Both
10. Why you prefer this mode of marketing? 1= Incentive prices 2= Traders make mischief with weighing scale 3= Purchasers like this it 4= Reliable and saves my time 5= Other, specify
11. Did you ever get animal price and market information? 1= Yes 2= No
12. If yes, from where? 1= DAs 2= Governmental organizations, specify 3= NGOs 4= Others, specify
13. Do you face any problem in marketing of your animals? 1= Yes 2= No 14. If yes, what? 1= Tax burden 2= Unwanted broker disorder and high commission fees 3= Seasonality of market demand and prices 4= Lack of market road from my areas 5= Lack of market and price information 6= Others, specify 15. Do your family sales milk products from sheep and goats?1= Yes 2= No 16. If yes, what is the price per your local unit (approximated in kg?)_________ Birr 17. If not market your products, why not?
1= Not produce at all 2= Produce but consume at home 3= Not fetches reasonable price 4= Don’t have any market demand in my locality 5= Others, specify ______________________
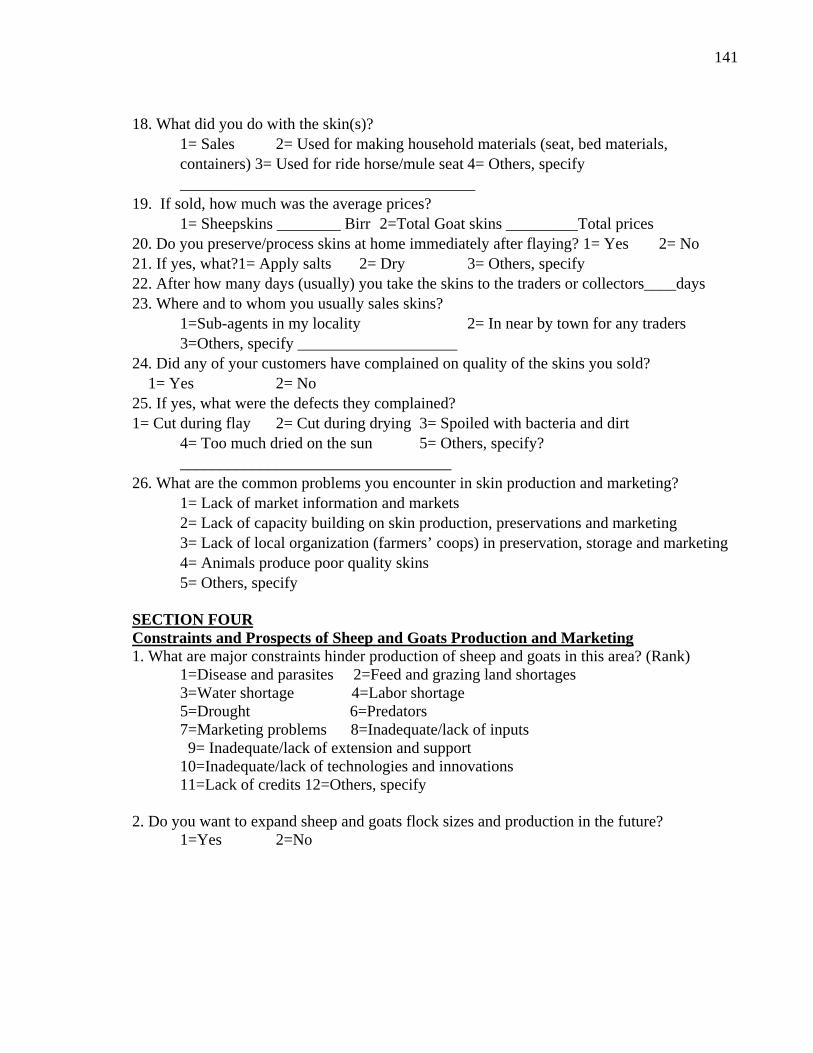
141
18. What did you do with the skin(s)? 1= Sales 2= Used for making household materials (seat, bed materials, containers) 3= Used for ride horse/mule seat 4= Others, specify _____________________________________
19. If sold, how much was the average prices? 1= Sheepskins ________ Birr 2=Total Goat skins _________Total prices 20. Do you preserve/process skins at home immediately after flaying? 1= Yes 2= No 21. If yes, what?1= Apply salts 2= Dry 3= Others, specify 22. After how many days (usually) you take the skins to the traders or collectors____days 23. Where and to whom you usually sales skins?
1=Sub-agents in my locality 2= In near by town for any traders 3=Others, specify ____________________
24. Did any of your customers have complained on quality of the skins you sold? 1= Yes 2= No 25. If yes, what were the defects they complained? 1= Cut during flay 2= Cut during drying 3= Spoiled with bacteria and dirt
4= Too much dried on the sun 5= Others, specify? __________________________________
26. What are the common problems you encounter in skin production and marketing? 1= Lack of market information and markets 2= Lack of capacity building on skin production, preservations and marketing 3= Lack of local organization (farmers’ coops) in preservation, storage and marketing 4= Animals produce poor quality skins 5= Others, specify
SECTION FOUR Constraints and Prospects of Sheep and Goats Production and Marketing 1. What are major constraints hinder production of sheep and goats in this area? (Rank) 1=Disease and parasites 2=Feed and grazing land shortages 3=Water shortage 4=Labor shortage 5=Drought 6=Predators 7=Marketing problems 8=Inadequate/lack of inputs 9= Inadequate/lack of extension and support
10=Inadequate/lack of technologies and innovations 11=Lack of credits 12=Others, specify
2. Do you want to expand sheep and goats flock sizes and production in the future? 1=Yes 2=No

142
3. If yes, No Reasons for expansion Sheep Goats Both sheep and goats 1 High market demand 2 Incentive market price 3 Easy to manage and keep 4 Distribute benefits and losses 5 Immediate returns 6 Appropriate for slaughter and home consumption 7 Others, specify 4. If no, why? 1=Shortage of grazing lands and feeds 2=Shortage of labor 3=Prefer another animal species 4=Marketing problem 5=Lack of capital to purchase animals and inputs 6=Others, specify SRCTION: FIVE LABOUR,EXTENSION and SOCIO_ECONOMIC A. Gender, labor allocation and decision on benefits from sheep and goats 1. Do you encounter labor shortage in sheep and goat production aspects? 1=Yes 2=No 2. For what major tasks you face labor shortage? 1=Herding and tethering 2=Watering 3=Looking after lambs and kids
4=Construction of shelter 5=Take care of sick animals 6=Others,specify________ 3. How you overcome the labor shortage? 1=Hire laborer 2= use family labour 3=use fence 4=keep turn by turn with neighbor 5=Others specify 4. Who do the different tasks and decides on benefits obtained from sheep and goats? S. N
Particulars Husband Spouse Boys Girls Hired Labor
Others, Specify
1 Herd and/or tether 2 Feeding animals 3 Take to water points 4 Clean sheep and goat barns 5 Take care of lambs and kids 6 Take care of sick animals 7 Fattening managements 8 Construction of shelter 9 Milk 10 Process milk 11 Sale animals 12 Decides on use of income and benefits 13 Owns sheep and goats in the family 5. Is there any cultural, traditional and religious taboo in the area that prohibits use of sheep
and goat products and by-products in your areas? 1=Yes 2=No 6. Is there any tradition or culture that exceptionally prefer/requires certain sheep and goat color in the area. 1=Yes 2=No

143
7. Do you sacrifices sheep/goats for any religious or traditional occasions 1=Yes 2=No B: Institutions and innovations in development of sheep and goats production 1. Did you receive credit in recent years? 1=Yes 2=No 2. If yes in what form? 1=Cash 2=Kind 3=Both 3.if you received what is the source 1=micro-finances 2=Private banks 3=Credit
institutions 4=Governmental offices (OoARD, etc) 5=NGOs 6=Cooperatives 7=Others, specify 4. what do you do with it? 1=for crop production 2=cattle and small ruminant fattening 3=trading 4=other 5.Who receive credit in your family?1=Husband 2=Wife 3=young boys 4=young girls 6. How you made credit arrangements?________________________________ 7. Are you satisfied with the lending regulations and terms to repay the credit?
1=Yes 2=No 8. Did you receive sheep and goats from any source 1=Yes 2=No 9. If yes, from which sources?
1=Credit 2=Gift from NGOs 3=Gift from GOs (safety net, credit, revolving funds) 5=Share arrangements 6=Exchange (crop, other livestock, inputs, etc)
10. If you received sheep and goats for share arrangements, why? 1=To keep or allocate labor 2=To House 3=To Fatten 4=To Breed 5=Others, specify ______________ 11. How share agreements made? 1=Share incomes from sale of animals received 2=Share new born animals 3=Share the original animals after certain years (___ years) 4=Others, specify 12. Is there any cooperative in your area? 1=Yes 2=No 13. If yes, in what sector 1=Crop production (storage, marketing, deliver inputs to members, etc) 2=Livestock (Marketing, deliver inputs, assemble products, etc) 3=Inputs (deliver different inputs, credits, insurance, etc) 4=Others, species

Appendices ________________________________________________________________________
144
BIOGRAPHICAL SKETCH
The author was born in Arsi, Digalu on Jan 12, 1976 GC. He attended elementary and junior
schools in Digalu elementary and junior school. He had completed his secondary high school
education in Bekoji High School. He successfully passed the Ethiopian School Leaving
Certificate Examination (ESLCE), and joined the Awassa College of Agriculture (now
Hawassa University) in 1997. After four years of rigorous study, he graduated with a BSc
degree in Agriculture (Animal Production and Rangeland Management) in July 2000.
After graduation, in 2001, he was employed as Junior Research Officer at Adami Tulu
Agricultural Research Center of Oromia Region Agricultural Research Institute (OARI) in
East Showa Zone of Oromia Region. In September 2008, after 6 years of experience, he joined
the School of Graduate Studies of the Hawassa University, Department of Animal and Range
Sciences as a candidate for the Masters of Science degree in Animal production.