Production and cross-sectional ... - core.ac.uk · were obtained from Sigma Aldrich (Dorset, UK)...
30
A publishers version of this paper can be found at doi:10.1016/j.matchar.2015.09.010 1 Production and cross-sectional characterization of aligned co-electrospun hollow microfibrous bulk assemblies Feng-Lei Zhou a,b,c , Geoff J.M. Parker a,c,* , Stephen J. Eichhorn d , and Penny L. Hubbard Cristinacce a, e a Centre for Imaging Sciences, The University of Manchester, Manchester M13 9PT, UK b The School of Materials, The University of Manchester, Manchester M13 9PL, UK c CRUK-EPSRC Cancer Imaging Centre in Cambridge and Manchester, UK d College of Engineering, Mathematics and Physical Sciences, University of Exeter, Exeter EX4 4QF, UK e School of Psychological Sciences, University of Manchester, Manchester M13 9PT, UK Corresponding author *Tel.: +44 275 5731. Fax: +44 161 275 5145. E-mail address: [email protected] . Abstract The development of co-electrospun (co-ES) hollow microfibrous assemblies of an appreciable thickness is critical for many practical applications, including filtration membranes and tissue-mimicking scaffolds. In this study, thick uniaxially aligned hollow microfibrous assemblies forming fiber bundles and strips were prepared by co-ES of polycaprolactone (PCL) and polyethylene oxide (PEO) as shell and core materials, respectively. Hollow microfiber bundles were deposited on a fixed rotating disc, which resulted in non-controllable cross-sectional shape on a macroscopic scale. In comparison, fiber strips were produced with tuneable thickness and width by additionally employing an x- y translation stage in co-ES. Scanning electron microscopy (SEM) images of cross-sections of fiber assemblies were analyzed to investigate the effects of production time (from 0.5h to 12h), core flow rate (from 0.8mL/h to 2.0mL/h) and/or translation speed (from 0.2mm/s to 5mm/s) on the pores and porosity. We observed significant changes in pore size and shape with core flow rate but the influence of production time varied; five strips produced under the same condition had reasonably good size and porosity reproducibility; pore sizes didn't vary significantly from strip bottom to surface, although the porosity gradually decreased and then returned to the initial level. Keywords: Co-electrospinning; Hollow microfibers; SEM; Cross-section; Production time
Transcript of Production and cross-sectional ... - core.ac.uk · were obtained from Sigma Aldrich (Dorset, UK)...

A publishers version of this paper can be found at doi:10.1016/j.matchar.2015.09.010
1
Production and cross-sectional characterization of aligned co-electrospun hollow
microfibrous bulk assemblies
Feng-Lei Zhou a,b,c, Geoff J.M. Parker a,c,*, Stephen J. Eichhorn d, and Penny L. Hubbard
Cristinacce a, e
aCentre for Imaging Sciences, The University of Manchester, Manchester M13 9PT, UK
bThe School of Materials, The University of Manchester, Manchester M13 9PL, UK
cCRUK-EPSRC Cancer Imaging Centre in Cambridge and Manchester, UK
dCollege of Engineering, Mathematics and Physical Sciences, University of Exeter, Exeter
EX4 4QF, UK
eSchool of Psychological Sciences, University of Manchester, Manchester M13 9PT, UK
Corresponding author
*Tel.: +44 275 5731. Fax: +44 161 275 5145. E-mail address:
Abstract
The development of co-electrospun (co-ES) hollow microfibrous assemblies of an
appreciable thickness is critical for many practical applications, including filtration
membranes and tissue-mimicking scaffolds. In this study, thick uniaxially aligned hollow
microfibrous assemblies forming fiber bundles and strips were prepared by co-ES of
polycaprolactone (PCL) and polyethylene oxide (PEO) as shell and core materials,
respectively. Hollow microfiber bundles were deposited on a fixed rotating disc, which
resulted in non-controllable cross-sectional shape on a macroscopic scale. In comparison,
fiber strips were produced with tuneable thickness and width by additionally employing an x-
y translation stage in co-ES. Scanning electron microscopy (SEM) images of cross-sections
of fiber assemblies were analyzed to investigate the effects of production time (from 0.5h to
12h), core flow rate (from 0.8mL/h to 2.0mL/h) and/or translation speed (from 0.2mm/s to
5mm/s) on the pores and porosity. We observed significant changes in pore size and shape
with core flow rate but the influence of production time varied; five strips produced under the
same condition had reasonably good size and porosity reproducibility; pore sizes didn't vary
significantly from strip bottom to surface, although the porosity gradually decreased and then
returned to the initial level.
Keywords: Co-electrospinning; Hollow microfibers; SEM; Cross-section; Production time

A publishers version of this paper can be found at doi:10.1016/j.matchar.2015.09.010
2
1 Introduction
Nanofibers produced by electrospinning often have diameters of a few orders of magnitude
smaller than those in conventional hollow fiber membranes.1 Electrospun (ES) nanofibers for
membrane applications2 are also solid and are often produced in the form of nonwoven
meshes. Recently core/shell3 or hollow4 polymeric fibers having diameters of only a few
microns or less have been produced by coaxial electrospinning (co-ES) for different
applications, ranging from superhydrophobic and oleophobic fibers,5 self-healing coatings,6
self-cleaning textiles,7 multi-agent or drug delivery,8-9 and liquid filtration media.10-11 In these
applications, co-ES microfibrous assemblies often have to be of millimeter thickness. This
amount of material can take a lab-scale setup a few hours or more to produce, due to low
mass throughputs.11-12
The production and reproducibility of millimeter-thick co-ES microfibrous structures has
scarcely been explored. There have been only a few reports on aligned thick co-ES hollow
microfiber membranes, which have application as, for example, anisotropic nerve and
vascular scaffolds,13 ultrafiltration membranes10 and biomimetic fibrous membranes,14-15
which could be processed into woven or knitted protective fabrics where hollow microfiber
membranes are often sandwiched between two layers of fabrics16. Recently we have shown
that co-ES microfibers can be used to mimic cell structures and provide materials that can be
imaged using diffusion magnetic resonance imaging (MRI) to provide signals that resemble
brain tissue to provide MRI scanning performance information.14, 17 The growth in the
number of applications for bulk samples of co-ES microfibers indicates that a study is needed
to optimize co-ES process parameters that determine the formation of structurally
reproducible mm-thick microfibrous membranes.

A publishers version of this paper can be found at doi:10.1016/j.matchar.2015.09.010
3
In order to obtain fibrous assemblies with sufficient thickness for easy handling and for
applications such as those described above, ES18-20 and co-ES processes14, 21-23 have to be
operated for long periods of time. To date, there have been no reports on the effect of
production times on the structure of co-ES microfibers, though a few studies have been
published on the effect of production time on fiber alignment,18 drug release,24 porosity and
mechanical properties of ES nanofiber meshes.19-20 In the aforementioned report of aligned
co-ES fiber bundles used to mimic brain white matter structures,14, 21 Zhou et al.14 presented
the results of aligned bundles of co-ES hollow microfibers, which were prepared for around
35min and were used for the validation of diffusion MRI. Aligned co-ES core-shell fibers
with tuneable mechanical and chemical properties were also produced for around 45min by
Rao et al.21 as white matter-mimicking scaffolds for examining migration of cells associated
with malignant brain tumors. However, the limited thickness of co-ES microfiber structures
poses assembly problems for practical applications. For example, the tissue-mimicking
prototypes developed to date have to be composed of several layers of fiber bundles, which is
likely to result in the partial loss of structural integrity and performance. A similar problem
exists for hollow fiber filtration modules in which sheets of co-ES fibers prepared for 2.5hs
still had to be layered or rolled up into a cylinder shape to form a thick enough construct.10-11
The low structural integrity of developed filtration modules could compromise the filtration
efficiency of co-ES fibers due to the use of epoxy glue to connect separate layers of fibers.
In addition to the production challenges, cross-sectional characterization on the macroscopic
and microscopic scale of millimeter-thick co-ES hollow microfiber assemblies also remains
challenging. ES fiber diameters25 and co-ES fiber inner and outer diameters14, 21, 26 are often
measured manually via off-the-shelf software packages, for instance using ImageJ's
(http://imagej.nih.gov/ij) line-drawing feature. However, these larger samples may require
A publishers version of this paper can be found at doi:10.1016/j.matchar.2015.09.010
4
more automated methods of measurement. The pore size and porosity of ES random fiber
meshes can be measured by using the ‘thresholding’ feature of this software.27 This feature
will be adopted here to measure the cross-sectional pore size and porosity of aligned co-ES
microfibers.
In the present study, co-ES hollow PCL microfibers were produced in aligned assemblies
over longer production times than those previously reported in other studies. Fiber bundles
were produced over time scales of between 0.5 and 2h and fiber strips between 6 and 12h.
The cross-sections of the resultant co-ES microfiber assemblies were cleaved using a freeze
fracture technique and microstructural images were acquired using scanning electron
microscopy (SEM). SEM images were processed and analyzed using ImageJ to determine the
cross-sectional pore sizes and porosities. The effect of core flow rate, production time and
translation speed on the cross-sections of co-ES microfibers was also investigated. The cross-
sectional reproducibility and variation of the co-ES fiber strips was assessed using SEM from
five samples produced using the same experimental conditions. Finally, the effects of
production time on sample microstructure were assessed by dividing a cross-sectional image
into ten sections corresponding to regions deposited during different periods of the overall
production time.
2. Experimental
2.1 Materials
Polycaprolactone (PCL, number-average molecular weight Mn = 70,00090,000g/mol) and
polyethylene oxide (PEO, with an average viscosity molecular weight Mv=900,000g/mol)
were obtained from Sigma Aldrich (Dorset, UK) and used as received. The solvents

A publishers version of this paper can be found at doi:10.1016/j.matchar.2015.09.010
5
chloroform and N,N-dimethyl-formamide (DMF) were also purchased from Sigma Aldrich
(Dorset, UK). Deionized water was used to dissolve PEO.
2.2 Coaxial electrospinning of hollow microfiber assemblies
Co-ES was performed on a lab-scale setup (see details in ref. 28). All experiments were
conducted in a fume cupboard under ambient conditions. In a typical procedure for co-ES,
10wt% PCL in chloroform/DMF (80/20, wt%) and 4wt% PEO in deionized water were used
as the shell and core polymer solutions, respectively. These two polymer solutions were fed
at constant flow rates, independently controlled by two syringe pumps. The flow rate for the
PCL solution was set at 3mL/h; for the PEO solution, the flow rate was varied from 0.8mL/h
through 1.0mL/h to 1.4mL/h. The applied voltage was set at 9kV and the working distance
between the coaxial spinneret and the fiber collector was 5cm. To investigate the effect of the
production time on cross-sections, PCL hollow microfibers were produced in the form of
aligned bundles on a rotating disc over a period between 0.5h and 2h. For the reproducibility
study, aligned PCL hollow microfiber strips were also produced on a rotating drum mounted
on an x-y stage over a 6h period using core flow rates of 0.8mL/h, 1.4mL/h and 2.0mL/h. The
width of the strips was set at 30 mm and the resultant thickness was 0.5-0.8mm, as measured
by a digital micrometer. A schematic of the production of aligned co-ES hollow microfiber
bundles and strips is shown in Fig. 1.
2.3 Freeze fracture and SEM characterization
Freeze fracture has been used to prepare cross-sections of hollow fiber polymeric membranes
for microfiltration29 and co-ES microfibers10 for visualization using SEM. Co-ES fiber
bundles/strips were firstly removed from the collector and then immersed in a liquid nitrogen

A publishers version of this paper can be found at doi:10.1016/j.matchar.2015.09.010
6
bath until the sample was completely frozen. Sharp scissors and scalpels were then cooled in
the bath, and used to quickly cut the fiber bundles and strips in one step. The cross-sections
of co-ES fibers were observed using a Phenom G2 pro desktop SEM (Phenom-World). The
co-ES fiber specimens were coated with a thin gold film to increase their conductivity.
Typical examples of the fractured cross-sections of co-ES microfiber bundles and strips with
a common feature of a porous microstructure are shown in Fig.2a-c and Fig. 2d-f,
respectively. SEM images taken with an acceleration voltage of 5kV and various
magnifications were used for further image processing. Cleaving hollow fibers in liquid
nitrogen could still result in significant mechanical deformation in some samples (e.g. Fig.
2f). In addition, because of the nature of the method, there is a practical upper limit to the size
of the sample that can be prepared (i.e. it has to be no more than a few millimeters thick).
2.4 Pore diameter and porosity quantification
The porous structure is the main geometrical microstructural feature of the cross-sections of
co-ES aligned microfiber bundles and strips. Therefore, measurement parameters including
pore size and porosity were determined from representative SEM images of these materials.
Pores of microfiltration membranes were categorized into two types to define their structures,
namely separated and connected, as previously reported.30 As shown in Fig. 3a, three
categories of pores were observed on representative SEM images of the cross-sections of co-
ES microfiber bundles: (I) intrafiber pores derived from hollow microfibers, usually well-
defined and with diameters from a few microns of individual fibers to tens of microns of two
neighbouring fibers that have lost their separating walls (see ellipse in grey); (II) interfiber
pores defined by the merged walls of neighbouring hollow microfibers, also well-defined but
generally smaller in size than those in category I; (III) void pores, usually having the largest
sizes (these can be considered extreme examples of type II pores but justify their separate

A publishers version of this paper can be found at doi:10.1016/j.matchar.2015.09.010
7
classification due to the potentially large sizes of these features). Among these pores (Fig. 3a),
category I are controllable by co-ES parameters, for example, the core flow rate, whereas
other types of pores were formed randomly, independent of the co-ES process, at least under
ambient conditions.
A number of ways to characterize pore sizes, including number-averaged, area-averaged, and
volume-averaged, have been proposed to calculate an equivalent representative unimodal
diameter in filters composed of fibers with a bimodal (or multimodal) fiber diameter
distribution.31-32 The cross-sections of co-ES fiber assemblies (Fig.2c, f and Fig.3a) exhibited
a wide range of pore sizes from about 1μm in category II to about 10 μm or larger in
categories I and III. Only area-averaged and number-averaged pore sizes could be used for
the cross-sections of co-ES fiber bundles/strips, since 2D SEM images cannot be used to get
volume-averaged pores.
The cross-sectional porosity of co-ES microfiber bundles and strips was calculated using
ImageJ software by converting an SEM image (e.g. Fig.3a) to a binary image and
thresholding. The pore area was then calculated by using the ImageJ ‘Analyse Particles’
feature. Fig.3b and c show typical binary-converted and thresholded images, respectively.
The numbers reported in the zoomed-in inset in Fig.3d are the sequential index of the
identified pores. The percentage of the white or red area relative to the total area in each
image was defined as the percent porosity according to the equation:
∅ =∑ 𝐴𝑖𝑛𝑖=1
𝐴 (1)
where Ai and A are the pore area of each ith measured pore and total area of the measured
image.

A publishers version of this paper can be found at doi:10.1016/j.matchar.2015.09.010
8
The automatic measurements of each pore area (Ai) were converted into the corresponding
pore diameter (di) assuming that the cross-section pore is circular:
𝑑𝑖 = 2√𝐴𝑖𝜋
(2)
where di is the diameter of each ith measured pore.
Not only the amount of porosity but also the pore geometry, affects the physical properties of
co-electrospun hollow fibers, as shown in applications such as brain-mimicking phantoms for
diffusion magnetic resonance imaging. In this study, we also introduce a dimensionless
parameter (γ)33, indicating pore shape, the ratio of pore perimeter (P) to the square root of
pore area (A), which becomes 1 for a circle:
γ =𝑃𝑖
2√𝜋𝐴𝑖 (3)
2.5 Statistical analysis
All the data were analysed regarding skewness and kurtosis (SPSS version 22, Chicago, IL,
USA) to determine if the data were normally or non-normally distributed. Data with a
skewness value close to zero (less than twice its standard error) and a kurtosis value also
close to zero were considered normal. The data on pore size and pore shape parameter were
not normally distributed and were analyzed using Kruskal-Wallis ANOVA (SPSS). Statistical
significance was accepted at p < 0.05.
3. Results and discussion
3.1 Effect of production time on cross-sections of co-ES fiber bundles
There have been a limited number of studies on the effect of production time on ES
nanofibers. 18-20 For instance, Katta et al.18 reported that increasing the production time from

A publishers version of this paper can be found at doi:10.1016/j.matchar.2015.09.010
9
5min to 2.5h resulted in the loss of fiber alignment in thicker electrospun nylon-6 mats. More
recently, it has been reported by Han et al.24 that an increase in the production time could
result in longer and more linear release of hydrophilic drugs encapsulated in ES hydrogel
composite fibers. Essalhi et al.19-20 found that the production time had no effect on the
diameter and surface wettability of ES PVDF fibers produced for 1 to 4h. However, there was
a significant decrease in the pore size and a slight increase in porosity of ES fibrous meshes.19
In order to investigate the potential effect of production time on porosity, here aligned fiber
bundles were produced over different periods of time ranging from 30min to 2h. Some
representative SEM images of fibers produced using this method are shown in Fig. 4.
Despite the simplicity of the one-step formation of hollow microfibers by co-ES4, if the “right”
combination of applied voltage and core/shell flow rate for a specific core/shell solution pair
is not used, this poses a challenge for the formation of mm-scale thickness assemblies and to
the stability of co-ES process. The parameters used in this study were optimized from our
previous study,14 which allows a stable operation of the co-ES process over a period of a few
hours. It should be noted that the 5cm working distance used in this study was much smaller
than those previously reported, for example, 16-20cm,4 resulting in a significantly different
jet behaviour. Using a 5cm working distance, fiber deposition was controlled by a linear
straight jet, as the bending instability which usually occurs in conventional ES was
suppressed.28 The suppression of the bending instability, however, may lead to fiber
accumulation and build-up at one position on the rotating collector, as reported by Ou et al.13.
As a result, we found that the process was only stable for a limited period of time because the
increasing height of fiber layers led to an interruption of the jet. During the production of
fiber bundles, it was observed that the maximum operation time that allowed the straight

A publishers version of this paper can be found at doi:10.1016/j.matchar.2015.09.010
10
stable jet to deposit on the collector, was around 2hs. Therefore, fiber bundles used to
investigate the effect of operation time were produced for up to 2h.
The cross-sections of resultant fiber bundles were prepared using the freeze fracture method
and imaged using SEM. As shown in representative SEM images in Fig.4, the two dominant
characteristic structural features of each bundle produced using times of 0.5h, 1h and 2h are
the porous cross sections and the merging of neighbouring hollow microfibers. Clearly the
majority of microsized pores were formed by co-ES hollow microfibers. However, most
hollow fibers became merged, possibly due to incomplete solvent evaporation and/or parallel
alignment of fibers, resulting in a significant decrease in interfiber spacings. There were also
relatively large pores (category III) between hollow microfibers, which resulted in poor fiber
packing in localized areas within aligned bundles.
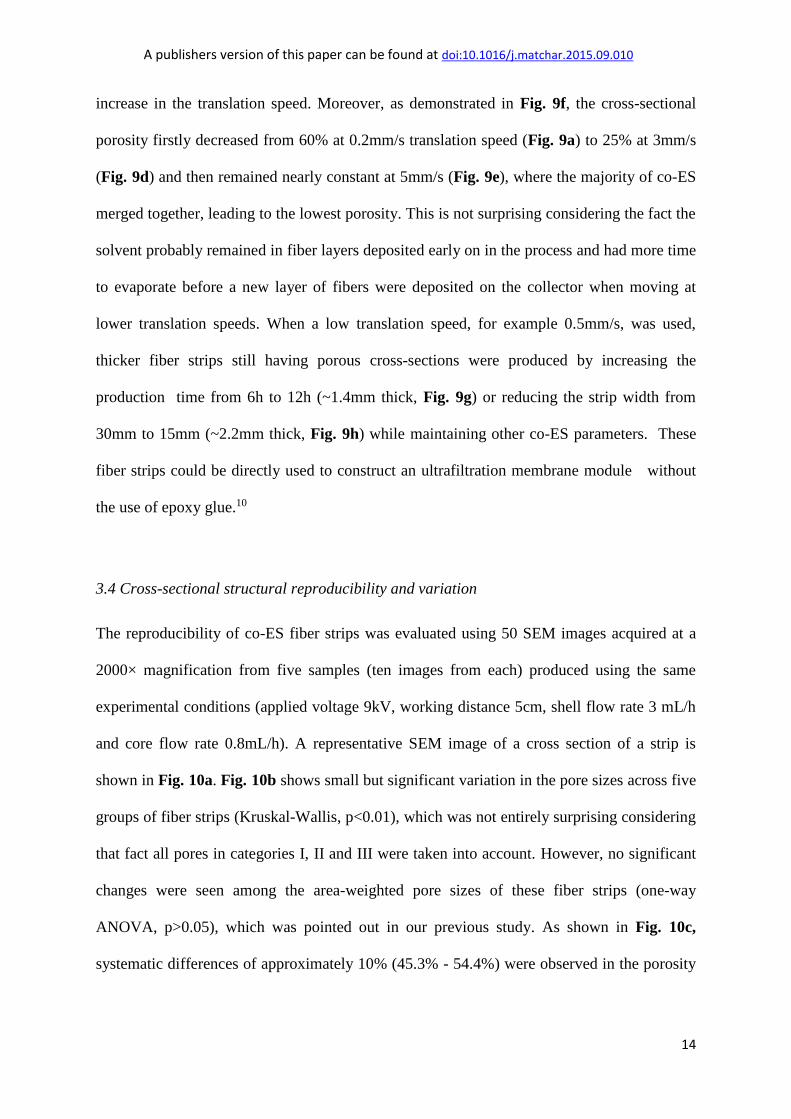
Fig. 5 reports box-and-whisker plots showing the median and interquartile range of pore sizes
of fiber bundles produced using the various combinations of production time and core flow
rate, and also demonstrating the differences among fiber bundles. Individual plots of pore
size show there were wider variations with increasing core flow rate (Fig.5a); but the
variation was less with increasing production time (Fig.5b). The pore size of fiber bundles
increased with core flow rate, but with production time first declined and then increased by a
small amount. However, these changes in pore size with both flow rate and production time
were significant (Kruskal-Wallis, p<0.01). Spearman’s rho correlation further suggests that
there was a significant correlation between flow rate and pore diameter (rho=0.193; p<0.01,
2-tailed) but not between production time and pore diameter (rho=0.002; p=0.928, 2-tailed).
Therefore, the implication is that there is a small amount of variability between co-ES
experiments but that for production time this variability is non-linear or unpredictable,
A publishers version of this paper can be found at doi:10.1016/j.matchar.2015.09.010
11
whereas with flow rate there is a weak ability to predict an increase in pore size with
increasing flow rate. A large number of outliers and extremes were observed for those
converted pore sizes from measured pore areas indicating that category III void pores were
present in most of the nine fiber strips, which contributes to the variability between co-ES
experiments.
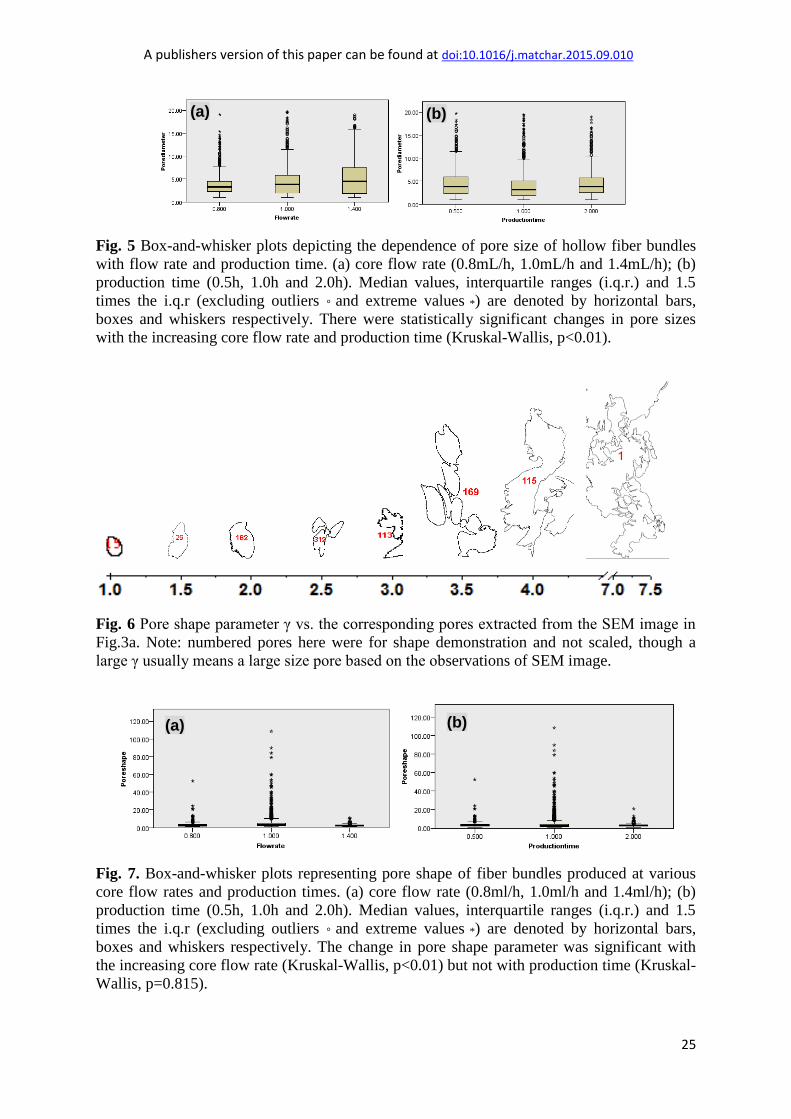
The main goal of pore shape characterization was to determine how the core flow rate and
production time affect pore geometry of co-ES fiber bundles. The SEM images of these
samples were analyzed according to the described methodology to calculate the pore shape
parameter (γ). As shown in Fig.6, the pore geometry became increasingly complex with the
increasing value of pore shape parameter. For example, when γ≤2.0, the numbered pores for
example, no.15, no.29 and no.182 (same pore numbers as in Fig.3d), could each represent a
single pore belonging to either category I or II, depending on pore sizes; when γ≥2.5, the pore
geometries (no.312, no.113 and no.169) could be formed by a few merging pores in category
I or II, or if the boundary among them was not well-defined in the binary images; when γ≥4.0,
void pores in category III could be included together with pores in category I and/or II
forming the complex geometries (no.115 and no.1).
As shown in Fig.7, there were wide variations in pore shape parameter γ with flow rates; but
the variation was less with production times. The change in γ was significant with flow rate
(Kruskal-Wallis, p<0.01) but not with production time (Kruskal-Wallis, p=0.815). Outliers
and extremes were observed in all fiber bundles, among of which 1.0mL/h and 1.0h bundles
were more obvious than others, indicating that there were more pores with complex shape in
the binary images, for instance Fig.4e. Those geometrically complex pores (usually having
large sizes) did contribute to the variation in the porosity of fiber bundles, as shown in Table

A publishers version of this paper can be found at doi:10.1016/j.matchar.2015.09.010
12
I. For example, the porosity changed only 6.3% at 1.4 mL/h, while it was 15.9% at 0.8mL/h
or 20.9% at 1.0mL/h. Spearman’s rho correlation further reveals that there is a significant
correlation between flow rate and pore shape (rho=-0.08; p<0.01, 2-tailed) but not between
production time and pore shape (rho=-0.009; p=0.654, 2-tailed). The effect of flow rate and
production time on pore shape of fiber bundles is totally unpredictable.
It is worth noting that the cross-sections of co-ES bundles are likely to be affected by
mechanical cuts perpendicular to the bundles using sharp scissors, which can severely distort
the fine structures of co-ES fiber bundles. In most cases, relatively clean cross-sections were
obtained. Considerable care was taken to minimize the effect of mechanical cuts on the
hollow microfibers. Considering the fact that the freeze fracture method often resulted in
elliptical shapes to the pores, there are also inevitable errors with the calculated diameters.
3.2 Cross-sectional and longitudinal characterizations of co-ES microfiber strips
During the production of aligned fibers, the accumulating fiber deposition resulted in a
building up of the fiber layer on the collector which interrupted the jet stability and thus
placed limits on the thickness of the resultant fiber bundles. A method for collecting aligned
co-ES microfibers in a strip a few centimeters wide was therefore used to prevent this. This
involved the use of a rotating circular drum mounted onto an x-y translation stage. We found
it easier to assemble wider and more uniform structures using these strips, which is an
advantage over fiber bundles.
As shown in Fig. 8a-c, pores and merged fibers were observed on the cross-section of all
three fiber strips. In particular, the increase in the core flow rate caused increasingly serious
fiber merging, resulting in thick walls between pores as evidenced by Fig. 8c. Fig. 8d-f
A publishers version of this paper can be found at doi:10.1016/j.matchar.2015.09.010
13
shows the top surface morphology along the longitudinal direction of three strips. Individual
microfibers on the strip top surface were still distinguishable, but were often merged with
neighbouring fibers. They also adopted a wavy appearance, while the overall fiber alignment
was retained. However, the bottom surface morphology did not show any individual fibers
due to a merging into a thin layer of polymer at the point of contact with the collector.
It was also found that the cross-sections were not as well-defined as the porous structure of
the fiber bundles, even when the same core flow rate (1.4mL/h) was used, as seen in Fig. 8b
and g. Longitudinal sections (Fig. 8h) further revealed the alignment and fusion between co-
ES fibers. Fiber strips made at 0.8mL/h, 1.4mL/h and 2.0mL/h core flow rate displayed
significant variations (Kruskal-Wallis, p<0.01) in pore sizes and pore shape (Fig. 8j-k).
However, there was only 1.7% change in porosity when the core flow rate increased from
0.8mL/h to 1.4mL/h (52.7% vs 53.6%), but an 18% decrease at 2.0mL/h (43.9%).
Spearman’s rho correlation shows that there were very weak correlations between flow rate
and pore diameter (rho=0.141; p<0.01, 2-tailed) and also between flow rate and pore shape
(rho=0.278; p=0.654, 2-tailed). Therefore, the effect of flow rate and production time on pore
shape of fiber strips is also largely unpredictable.
3.3 Effect of x-y translation speed on cross-sections of fiber strips
As mentioned in section 3.2, co-ES fiber strips were deposited wet on the rotating drum
collector and consequently merged with other fibers that had previously been deposited. It is
expected that the transition speed may affect fiber deposition and thus the merging of fibers.
In order to investigate these effects the translation speed of the x-y stage was varied from
0.2mm/s to 5mm/s during the co-ES process (1mm/s used in section 3.2). As shown in Fig.
9a-e, fiber merging occurred in all five strips but became much more pronounced with an
A publishers version of this paper can be found at doi:10.1016/j.matchar.2015.09.010
14
increase in the translation speed. Moreover, as demonstrated in Fig. 9f, the cross-sectional
porosity firstly decreased from 60% at 0.2mm/s translation speed (Fig. 9a) to 25% at 3mm/s
(Fig. 9d) and then remained nearly constant at 5mm/s (Fig. 9e), where the majority of co-ES
merged together, leading to the lowest porosity. This is not surprising considering the fact the
solvent probably remained in fiber layers deposited early on in the process and had more time
to evaporate before a new layer of fibers were deposited on the collector when moving at
lower translation speeds. When a low translation speed, for example 0.5mm/s, was used,
thicker fiber strips still having porous cross-sections were produced by increasing the
production time from 6h to 12h (~1.4mm thick, Fig. 9g) or reducing the strip width from
30mm to 15mm (~2.2mm thick, Fig. 9h) while maintaining other co-ES parameters. These
fiber strips could be directly used to construct an ultrafiltration membrane module without
the use of epoxy glue.10
3.4 Cross-sectional structural reproducibility and variation
The reproducibility of co-ES fiber strips was evaluated using 50 SEM images acquired at a
2000× magnification from five samples (ten images from each) produced using the same
experimental conditions (applied voltage 9kV, working distance 5cm, shell flow rate 3 mL/h
and core flow rate 0.8mL/h). A representative SEM image of a cross section of a strip is
shown in Fig. 10a. Fig. 10b shows small but significant variation in the pore sizes across five
groups of fiber strips (Kruskal-Wallis, p<0.01), which was not entirely surprising considering
that fact all pores in categories I, II and III were taken into account. However, no significant
changes were seen among the area-weighted pore sizes of these fiber strips (one-way
ANOVA, p>0.05), which was pointed out in our previous study. As shown in Fig. 10c,
systematic differences of approximately 10% (45.3% - 54.4%) were observed in the porosity

A publishers version of this paper can be found at doi:10.1016/j.matchar.2015.09.010
15
between the strips, indicating that the reproducibility of porosity was found to be reasonably
good.
SEM images (500× magnification) of the whole cross-section of co-ES strips were also
acquired, which was used to observe the variation of pore size and porosity across the
sample’s thickness. As shown in Fig. 11a, the cross-sectional image was equally divided into
10 spaced regions of interest, where pore size and porosity was measured. There were no
significant variations (Kruskal-Wallis, p>0.05, pairwise comparisons) in pore sizes between
any two neighbouring slices from slice 1 to 10 (Fig. 11b). These pores on the top of fiber
strip (slice 1) did not differ significantly from those in the middle (slice 5) and bottom (slice
10) of fiber strip. However, as shown in Fig. 11c, with an increasing thickness of fiber strip
the porosity across the slices gradually decreased from 56.9% on slice 10 to 42.7% on slice 3,
and then increased to 56.8% on slice 1 (adjacent to fiber strip surface), which was almost the
same level as the bottom slice (slice 10). This can be understood in terms of rapid
evaporation of the core solvent (in the order of tens of seconds 10) for thin strips and on strip
surface during the collection of PCL microfibers on the rotating drum. That is to say, the
reduced core solvent evaporation inside fiber strips can result in a higher packing density of
hollow microfibers thus reducing porosity.
4. Conclusions
In this work uniaxially aligned hollow microfiber bundles and strips with thicknesses of up to
~2mm were produced by co-ES and characterized bySEM. Porous cross-sectional structures
were confirmed by SEM images obtained after freeze fracturing co-ES microfibers. SEM
images were processed using ImageJ software tools to obtain cross-sectional pore sizes and
porosities of co-ES bundles and strips. The effect of production time, core flow rate and

A publishers version of this paper can be found at doi:10.1016/j.matchar.2015.09.010
16
translation speed on the cross-sections of co-ES fibers were studied. The results of Kruskal-
Wallis ANOVA tests show that core flow rate had a significant effect on both pore size and
pore shape parameter of fiber bundles and strips; however, the effect of production time on
pore shape was less significant than fiber shape parameter. Fiber strips, which were
controllable in thickness and width, had different cross-sectional structures from fiber
bundles, even when produced under similar conditions. It was also found that fiber strips
were more prone to merge together with an increasing translation speed of the fiber collector,
resulting in a dramatic decrease in the cross-sectional porosity. An optimized low translation
speed (i.e. less than 1mm/s) when co-ES parameters were maintained in the same condition
as described in this study allowed us to produce thicker strips still having porous cross
sections. Cross-sectional structures of five fiber strips produced in the same experiment
settings had reasonably good reproducibility, due to the fact that the amount of variations in
pore size and porosity between samples are very small, even if it is statistically significant.
For a fiber strip with its cross section equally sectioned into 10 slices, there weren’t
significant changes in pore sizes between neighbouring slices from top to bottom of the strip;
the porosity of these slices decreased with the increasing thickness but returned to a similar
value at the slice adjunct to the strip surface. These findings have implications for the process
control and product quality of scaled up quantity production of co-ES hollow microfibrous
assemblies.

A publishers version of this paper can be found at doi:10.1016/j.matchar.2015.09.010
17
Acknowledgments:
This work was supported by the project “CONNECT” and acknowledges the financial
support of the Future and Emerging Technologies (FET) Program within the Seventh
Framework Program for Research of the European Commission, under FET-Open grant
number: 238292. This is a contribution from the Cancer Imaging Centre in Cambridge &
Manchester, which is funded by the EPSRC and Cancer Research UK (C8742/A18097). The
authors are grateful to Prof. William Sampson for his suggestion on analyzing cross-sectional
pore data.
Notes
The authors declare no competing financial interest.
References
1. Feng, C. Y.; Khulbe, K. C.; Matsuura, T.; Ismail, A. F., Recent progresses in
polymeric hollow fiber membrane preparation, characterization and applications. Sep. Purif.
Technol. 2013, 111, 43-71.
2. Tijing, L. D.; Choi, J.-S.; Lee, S.; Kim, S.-H.; Shon, H. K., Recent progress of
membrane distillation using electrospun nanofibrous membrane. J. Membr. Sci. 2014, 453,
435-462.
3. Zhang, Y.; Huang, Z.-M.; Xu, X.; Lim, C. T.; Ramakrishna, S., Preparation of
Core−Shell Structured PCL-r-Gelatin Bi-Component Nanofibers by Coaxial Electrospinning.
Chem. Mater. 2004, 16, 3406-3409.
4. Dror, Y.; Salalha, W.; Avrahami, R.; Zussman, E.; Yarin, A. L.; Dersch, R.; Greiner,
A.; Wendorff, J. H., One-Step Production of Polymeric Microtubes by Co-electrospinning.
Small 2007, 3, 1064-1073.
5. Han, D.; Steckl, A. J., Superhydrophobic and Oleophobic Fibers by Coaxial
Electrospinning. Langmuir 2009, 25, 9454-9462.
6. Park, J.-H.; Braun, P. V., Coaxial Electrospinning of Self-Healing Coatings. Adv.
Mater. 2010, 22, 496-499.
7. Bedford, N. M.; Steckl, A. J., Photocatalytic Self Cleaning Textile Fibers by Coaxial
Electrospinning. ACS Appl. Mater.iInterfaces 2010, 2, 2448-2455.

A publishers version of this paper can be found at doi:10.1016/j.matchar.2015.09.010
18
8. Jo, E.; Lee, S.; Kim, K. T.; Won, Y. S.; Kim, H.-S.; Cho, E. C.; Jeong, U., Core-
Sheath Nanofibers Containing Colloidal Arrays in the Core for Programmable Multi-Agent
Delivery. Adv. Mater. 2009, 21, 968-972.
9. Tiwari, S. K.; Tzezana, R.; Zussman, E.; Venkatraman, S. S., Optimizing partition-
controlled drug release from electrospun core–shell fibers. Int. J. Pharm. 2010, 392, 209-217.
10. Halaui, R.; Moldavsky, A.; Cohen, Y.; Semiat, R.; Zussman, E., Development of
micro-scale hollow fiber ultrafiltration membranes. J. Membr. Sci. 2011, 379, 370-377.
11. Anka, F. H.; Balkus, K. J., Novel Nanofiltration Hollow Fiber Membrane Produced
via Electrospinning. Ind. Eng. Chem. Res. 2013, 52, 3473-3480.
12. Zhou, F.-L.; Gong, R.-H.; Porat, I., Mass production of nanofibre assemblies by
electrostatic spinning. Polym. Int. 2009, 58, 331-342.
13. Ou, K.-L.; Chen, C.-S.; Lin, L.-H.; Lu, J.-C.; Shu, Y.-C.; Tseng, W.-C.; Yang, J.-C.;
Lee, S.-Y.; Chen, C.-C., Membranes of epitaxial-like packed, super aligned electrospun
micron hollow poly(l-lactic acid) (PLLA) fibers. Eur. Polym. J. 2011, 47, 882-892.
14. Zhou, F.-L.; Hubbard, P. L.; Eichhorn, S. J.; Parker, G. J. M., Coaxially Electrospun
Axon-Mimicking Fibers for Diffusion Magnetic Resonance Imaging. ACS Appl.
Mater.iInterfaces 2012, 4, 6311-6316.
15. Hubbard, P. L.; Zhou, F.-L.; Eichhorn, S. J.; Parker, G. J. M., Biomimetic phantom
for the validation of magnetic resonance imaging. Magn. Reson. Med. 2015, 446, 299-305.
16. Gugliuzza, A.; Drioli, E., A review on membrane engineering for innovation in
wearable fabrics and protective textiles. J. Membr. Sci. 2013, 446, 350-375.
17. Ye, A. Q.; Hubbard Cristinacce, P. L.; Feng-Lei, Z.; Ziying, Y.; Parker, G. J. M.;
Magin, R. L. In Diffusion tensor MRI phantom exhibits anomalous diffusion, Engineering in
Medicine and Biology Society (EMBC), 36th Annual International Conference of the IEEE,
26-30 Aug. 2014; 2014; pp 746-749.
18. Katta, P.; Alessandro, M.; Ramsier, R. D.; Chase, G. G., Continuous Electrospinning
of Aligned Polymer Nanofibers onto a Wire Drum Collector. Nano Lett. 2004, 4, 2215-2218.
19. Essalhi, M.; Khayet, M., Self-sustained webs of polyvinylidene fluoride electrospun
nanofibers at different electrospinning times: 1. Desalination by direct contact membrane
distillation. J. Membr. Sci. 2013, 433, 167-179.
20. Essalhi, M.; Khayet, M., Self-sustained webs of polyvinylidene fluoride electrospun
nanofibers at different electrospinning times: 2. Theoretical analysis, polarization effects and
thermal efficiency. J. Membr. Sci. 2013, 433, 180-191.
21. Rao, S. S.; Nelson, M. T.; Xue, R.; DeJesus, J. K.; Viapiano, M. S.; Lannutti, J. J.;
Sarkar, A.; Winter, J. O., Mimicking white matter tract topography using core–shell
electrospun nanofibers to examine migration of malignant brain tumors. Biomaterials 2013,
34, 5181-5190.

A publishers version of this paper can be found at doi:10.1016/j.matchar.2015.09.010
19
22. Chen, R.; Huang, C.; Ke, Q.; He, C.; Wang, H.; Mo, X., Preparation and
characterization of coaxial electrospun thermoplastic polyurethane/collagen compound
nanofibers for tissue engineering applications. Colloids Surf., B: 2010, 79, 315-325.
23. Wang, N.; Burugapalli, K.; Wijesuriya, S.; Far, M. Y.; Song, W.; Moussy, F.; Zheng,
Y.; Ma, Y.; Wu, Z.; Li, K., Electrospun polyurethane-core and gelatin-shell coaxial fibre
coatings for miniature implantable biosensors. Biofabrication 2014, 6, 015002.
24. Han, N.; Bradley, P. A.; Johnson, J.; Parikh, K. S.; Hissong, A.; Calhoun, M. A.;
Lannutti, J. J.; Winter, J. O., Effects of hydrophobicity and mat thickness on release from
hydrogel-electrospun fiber mat composites. J Biomater Sci Polym Ed 2013, 24, 2018-30.
25. Huang, Z.-M.; Zhang, Y. Z.; Ramakrishna, S.; Lim, C. T., Electrospinning and
mechanical characterization of gelatin nanofibers. Polymer 2004, 45, 5361-5368.
26. Forward, K. M.; Flores, A.; Rutledge, G. C., Production of core/shell fibers by
electrospinning from a free surface. Chem. Eng. Sci. 2013, 104, 250-259.
27. Rnjak-Kovacina, J.; Wise, S. G.; Li, Z.; Maitz, P. K. M.; Young, C. J.; Wang, Y.;
Weiss, A. S., Tailoring the porosity and pore size of electrospun synthetic human elastin
scaffolds for dermal tissue engineering. Biomaterials 2011, 32, 6729-6736.
28. Zhou, F.-L.; Hubbard, P. L.; Eichhorn, S. J.; Parker, G. J. M., Jet deposition in near-
field electrospinning of patterned polycaprolactone and sugar-polycaprolactone core–shell
fibres. Polymer 2011, 52, 3603-3610.
29. Ferlita, R. R.; Phipps, D.; Safarik, J.; Yeh, D. H., Cryo-snap: A simple modified
freeze-fracture method for SEM imaging of membrane cross-sections. Environ. Prog. 2008,
27, 204-209.
30. Ziel, R.; Haus, A.; Tulke, A., Quantification of the pore size distribution (porosity
profiles) in microfiltration membranes by SEM, TEM and computer image analysis. J.
Membr. Sci. 2008, 323, 241-246.
31. Brown, R. C.; Thorpe, A., Glass-fibre filters with bimodal fibre size distributions.
Powder Technol. 2001, 118, 3-9.
32. Jaganathan, S.; Vahedi Tafreshi, H.; Pourdeyhimi, B., On the pressure drop prediction
of filter media composed of fibers with bimodal diameter distributions. Powder Technol.
2008, 181, 89-95.
33. Flavio S. Anselmetti; Stefan Luthi; Eberli, G. P., Quantitative Characterization of
Carbonate Pore Systems by Digital Image Analysis. AAPG Bull. 1998, 82, 1815-1836.

A publishers version of this paper can be found at doi:10.1016/j.matchar.2015.09.010
20

A publishers version of this paper can be found at doi:10.1016/j.matchar.2015.09.010
21
Table I Porosity of fiber bundles.
0.5 h 1.0 h 2.0 h
0.8 ml/L 48.1 % 55.7 % 57.2 %
1.0 mL/h 58.3 % 46.1 % 49.6 %
1.4 mL/h 54.1 % 51.7 % 55.2 %

A publishers version of this paper can be found at doi:10.1016/j.matchar.2015.09.010
22
Fig. 1 Schematics of co-ES for the production of (a) microfiber bundle on a rotatingdisc; and
(b) microfiber strip on a rotating drum mounted on x-y translation stage.
Fig. 2 Typical SEM images of the cross-sections of (a-c) one co-ES microfiber bundle and
(d-f) one strip with ×500, ×1000, and ×2,000 magnifications. Note - the apparent deformation
of the ends of the fibers along the plane of the cut of the strips (d-f).
(b) (a)
60 µm 130 µm 260 µm
(c) (b) (a)
60 µm 130 µm 260 µm
(f) (e) (d)

A publishers version of this paper can be found at doi:10.1016/j.matchar.2015.09.010
23
Fig. 3 (a) SEM image of a representative co-ES fiber bundle cross-section; (b) the
corresponding binary converted image of (a), with fiber walls depicted in white; (c) area
porosity (65.7%) indicated in red after image thresholding; (d) a zoomed-in view of the
identified pores, denoted by their unique index number in red. (For interpretation of the
references to color in this figure legend, the reader is referred to the web version of this
article)
Category I Intrafiber pore
Category III
Void pore
Category II-
Interfiber pore
60 µm
(b) (a)
(d) (c)

A publishers version of this paper can be found at doi:10.1016/j.matchar.2015.09.010
24
Fig. 4. SEM images of cross-sections of co-ES fiber bundles produced at different
combinations of core flow rate-production time. (a-c) 0.8mL/h - 0.5h , 1h, 2h; (d-f) 1.0mL/h -
0.5h, 1h, 2h; (g-i) 1.4mL/h - 0.5h, 1h, 2h.
60 µm 60 µm 60 µm
(c) (b) (a)
60 µm 60 µm 60 µm
(f) (e) (d)
(i) (h) (g)
60 µm 60 µm 60 µm
A publishers version of this paper can be found at doi:10.1016/j.matchar.2015.09.010
25
Fig. 5 Box-and-whisker plots depicting the dependence of pore size of hollow fiber bundles
with flow rate and production time. (a) core flow rate (0.8mL/h, 1.0mL/h and 1.4mL/h); (b)
production time (0.5h, 1.0h and 2.0h). Median values, interquartile ranges (i.q.r.) and 1.5
times the i.q.r (excluding outliers ° and extreme values *) are denoted by horizontal bars,
boxes and whiskers respectively. There were statistically significant changes in pore sizes
with the increasing core flow rate and production time (Kruskal-Wallis, p<0.01).
Fig. 6 Pore shape parameter γ vs. the corresponding pores extracted from the SEM image in
Fig.3a. Note: numbered pores here were for shape demonstration and not scaled, though a
large γ usually means a large size pore based on the observations of SEM image.
Fig. 7. Box-and-whisker plots representing pore shape of fiber bundles produced at various
core flow rates and production times. (a) core flow rate (0.8ml/h, 1.0ml/h and 1.4ml/h); (b)
production time (0.5h, 1.0h and 2.0h). Median values, interquartile ranges (i.q.r.) and 1.5
times the i.q.r (excluding outliers ° and extreme values *) are denoted by horizontal bars,
boxes and whiskers respectively. The change in pore shape parameter was significant with
the increasing core flow rate (Kruskal-Wallis, p<0.01) but not with production time (Kruskal-
Wallis, p=0.815).
(b) (a)
(b) (a)

A publishers version of this paper can be found at doi:10.1016/j.matchar.2015.09.010
26
Fig. 8 SEM images of (a-c) cross-sections; and (d-f) top surface of three co-ES strips
produced at the core flow rate of 0.8mL/h, 1.4mL/h and 2.0mL/h; (g) cross-section of
1.4mL/h fiber bundle; (h) longitudinal section of 1.4mL/h fiber strip; (i-j) box-and-whisker
plots representing pore size (dn) and pore shape parameter (γ) against core flow rate. Median
values, interquartile ranges (i.q.r.) and 1.5 times the i.q.r (excluding outliers ° and extreme
values *) are denoted by horizontal bars, boxes and whiskers respectively. The changes in
60 µm 60 µm 60 µm
(c) (b) (a)
670 µm 670 µm 670 µm
(f) (e) (d)
60 µm 30 µm
(h) (g)
(i) (j)

A publishers version of this paper can be found at doi:10.1016/j.matchar.2015.09.010
27
pore size and pore shape were significant with the increasing core flow rate (Kruskal-Wallis,
p<0.01).
Fig. 9. SEM images of co-ES fiber strips using various translation speeds of (a) 0.2mm/s; (b)
0.5mm/s; (c) 1mm/s; (d) 3mm/s; and (e) 5mm/s at the core flow rate of 0.8mL/h; (f) cross-
sectional porosity; (g) a 30mm wide fiber strip produced using 0.5mm/s and 12h; (h) a 15mm
wide strip produced using 0.5mm/s and 6h.
60 µm 60 µm 60 µm
(c) (b) (a)
60 µm 60 µm
(f)
(e) (d)
60 µm 60 µm
(h) (g)

A publishers version of this paper can be found at doi:10.1016/j.matchar.2015.09.010
28
Fig. 10 (a) A representative SEM image (2000× magnification) of a cross-section of a strip
created using 0.8mL/h core flow rate; (b) Box-and-whisker plots representing pore size (dn)
of five fiber strips. Median values, interquartile ranges (i.q.r.) and 1.5 times the i.q.r
(excluding outliers ° and extreme values *) are denoted by horizontal bars, boxes and
whiskers respectively. The variations in pore sizes were small but significant (Kruskal-Wallis,
p<0.01); (c) Plot of porosity for each of five strips.
60 µm
(c)
(a) (b)

A publishers version of this paper can be found at doi:10.1016/j.matchar.2015.09.010
29
Fig. 11 (a) SEM image (500× magnification) showing whole cross section of a strip and ten
non-overlapping sliced areas for porosity measurement (only 3 slices shown, slices not
scaled); (b) Box-and-whisker plots representing pore size (dn) against slice number. Median
values, interquartile ranges (i.q.r.) and 1.5 times the i.q.r (excluding outliers ° and extreme
values *) are denoted by horizontal bars, boxes and whiskers respectively. The change in pore
sizes from top to bottom of the strip wasn’t significant (Kruskal-Wallis, p>0.05, pairwise
comparisons); (c) plot of porosity (Φ) against slice number from the top to the bottom of a
strip.
(b) (a) 260 µm
(c)

A publishers version of this paper can be found at doi:10.1016/j.matchar.2015.09.010
30
TOC graphic