Production and Consumption of Ozone Depleting Substances ...
79
Production and Consumption of Ozone Depleting Substances under the Montreal Protocol 1986 – 2004 UNEP Ozone Secretariat UNEP November 2005
Transcript of Production and Consumption of Ozone Depleting Substances ...
Production and Consumption of Ozone Depleting Substances under
the Montreal Protocol
1986 – 2004
UNEP Ozone Secretariat
UNEP November 2005
ii Production and Consumption of Ozone Depleting Substances: 1986 - 2004
Published: November 2005
by Secretariat for The Vienna Convention for the Protection of the Ozone Layer & The Montreal Protocol on Substances that Deplete the Ozone Layer
United Nations Environment Programme PO Box 30552 Nairobi - 00100 Kenya
Web site: http://www.unep.org/ozone or http://www.unep.ch/ozone
Cover design by UNON Printshop
Third Edition
Preparation: Gerald Mutisya, Database Manager, Ozone Secretariat

Production and Consumption of Ozone Depleting Substances: 1986 - 2004 iii
Table of Contents
Introduction _______________________________________________________________1
List of Controlled Substances under the Montreal Protocol _________________________3 Annex A: Controlled substances ____________________________________________________ 3 Annex B: Controlled substances ____________________________________________________ 3 Annex C: Controlled substances ____________________________________________________ 4 Annex E: Controlled substance_____________________________________________________ 5
Summary of Control Measures under the Montreal Protocol ________________________7 Article 5 Parties Summary of Control Measures ________________________________________ 7 Non-Article 5 Parties Summary of Control Measures ____________________________________ 7
Production and Consumption trends ___________________________________________9
Production and Consumption Tables __________________________________________17 Table 1: Data on Production of CFCs (Annex A, Group I) _______________________________ 18
Maximum BDN production allowance for Parties that have reported pursuant to Article 2A, paragraphs 6-9__________________________________________________________18
Information on CFC Production Sector Agreements with the Multilateral Fund _________________19
Table 2: Data on Production of Halons (Annex A, Group II) _____________________________ 20 Maximum BDN production allowance for Parties that have reported pursuant to Article 2B,
paragraphs 3-4__________________________________________________________20
Table 3: Data on Production of Other Fully Halogenated CFCs (Annex B, Group I) ___________ 22 Table 4: Data on Production of Carbon Tetrachloride (Annex B, Group II) __________________ 24 Table 5: Data on Production of Methyl Chloroform (Annex B, Group III) ___________________ 26 Table 6: Data on Production of HCFCs (Annex C, Group I) ______________________________ 28 Table 7: Data on Production of HBFCs (Annex C, Group II) _____________________________ 30 Table 8: Data on Production of Methyl Bromide (Annex E, Group I) _______________________ 32
Maximum BDN production allowance for Parties that have reported pursuant to Article 2H, paragraphs 5bis and 5ter__________________________________________________32
Table 9: Data on Consumption of CFCs (Annex A, Group I) _____________________________ 34 Table 10: Data on Consumption of Halons (Annex A, Group II) __________________________ 40 Table 11: Data on Consumption of Other Fully Halogenated CFCs (Annex B, Group I) ________ 46 Table 12: Data on Consumption of Carbon Tetrachloride (Annex B, Group II) _______________ 48 Table 13: Data on Consumption of Methyl Chloroform (Annex B, Group III) ________________ 54 Table 14: Data on Consumption of HCFCs (Annex C, Group I) ___________________________ 60 Table 15: Data on Consumption of HBFCs (Annex C, Group II) __________________________ 66 Table 16: Data on Consumption of Methyl Bromide (Annex E, Group I) ____________________ 68 Table 17: Data on Consumption of Bromochloromethane (Annex C, Group III) ______________ 74
Total Summary Data on Production of All Controlled ODSs (All Annex Groups) ________________74 Total Summary Data on Consumption of All Controlled ODSs (All Annex Groups) ______________74


Production and Consumption of Ozone Depleting Substances: 1986 - 2004 1
Introduction 1. This report summarizes data on production and consumption of ozone-depleting substances as of
31 October 2005, reported by the Parties to the Montreal Protocol on Substances that Deplete the Ozone Layer under Article 7 of the Protocol.
2. The first edition of this report was issued in 1997, on the occasion of the 10th anniversary of the adoption of the Montreal Protocol. An updated version was published in 2002 containing data reported by the Parties for the period 1986 to 2000. The present report contains additional and updated data on the production and consumption of ozone-depleting substances (ODS), as reported to the Secretariat during the period 1986-2004, by 188 of the 189 Parties to the Montreal Protocol. The Secretariat has arranged the data provided by the Parties into groups for which control measures are prescribed in the Protocol.
3. The substances subject to reporting requirements and control measures are as follows:
(a) Annex A, Group I: chlorofluorocarbons (CFCs) and Group II: halons (reporting obligations and control measures introduced in the original Montreal Protocol, 1987);
(b) Annex B, Group I: other fully halogenated CFCs, Group II: carbon tetrachloride and Group III: methyl chloroform (reporting obligations and control measures introduced in the London Amendment to the Montreal Protocol, 1990);
(c) Annex C, Group I: hydrochlorofluorocarbons (HCFCs) (reporting obligations introduced in the London Amendment to the Montreal Protocol, 1990, but to control measures introduced by the Copenhagen Amendment to the Montreal Protocol, 1992);
(d) Annex C, Group II: hydrobromofluorocarbons (HBFCs) (reporting obligations and control measures introduced in the Copenhagen Amendment to the Montreal Protocol, 1992);
(e) Annex C, Group III: bromochloromethane (BCM) (reporting obligations and control measures introduced in the Beijing Amendment to the Montreal Protocol, 1999);
(f) Annex E, Group I: methyl bromide (MBr) (reporting obligations and control measures introduced in the Copenhagen Amendment to the Montreal Protocol, 1992).
4. The list of controlled substances under the Montreal Protocol, as well as the summary of the control measures applicable at the time of preparing this report follow this introduction. However, for an authoritative interpretation of the control measures, please refer to the relevant provisions of the Montreal Protocol.
5. Depending on the dates of ratification for the Protocol and Amendments, Article 7 of the Montreal protocol requires each Party to report data for the base year of the specific annex and for each year beginning with the year in which the Protocol or the Amendment entered into force for that Party. The ratification of amendments has proceeded steadily and by 31 October 2005, 189 Parties have ratified the Montreal Protocol, 179 the London Amendment, 168 the Copenhagen Amendment, 134 the Montreal Amendment and 97 the Beijing Amendment. The definition of a state not Party to the Montreal Protocol is contained in Article 4, paragraph 9 of the Protocol.
6. In the tables of the report, not all groups of controlled substances will have figures for each country for the different years. One reason is that Parties are required to report, and are bound by the control measures, for only those substances controlled by the Protocol and/or Amendments that they have ratified. Further, the obligation to report data starts from the year in which a particular ratification enters into force for a Party.
7. In the data presented in the annexes of this report, a hyphen (–) has been used where Parties have not reported and are not required to report data while the abbreviation N.R. (not reported) is used where Parties are required to report but have not done so.

Introduction
2 Production and Consumption of Ozone Depleting Substances: 1986 - 2004
8. Only Parties that have reported production of a certain substance or group of substances, or a Party with a non-zero calculated production for a given group of substances, will show up in the respective production table in this report. The tables of the report include, for each Party, the date of ratification of the Montreal Protocol and/or the relevant Amendment of the Protocol. The tables also include subtotals for Article 5 Parties (developing countries) and Non-Article 5 Parties (developed countries), as well as totals, for each year for each annex group.
9. The calculated production and consumption figures are based on formulae derived by applying the provisions of the Montreal Protocol. To calculate the figures for each group, the quantities in metric tonnes reported by the Parties for each substance in the group are multiplied by the ozone-depleting potential (ODP) of that substance and added together, after which adjustments are made based on the Protocol. All the data in this report is therefore presented in ODP tonnes.
10. Some of the calculated production or consumption figures may be negative. Production has been defined under Article 1(5) of the Protocol as production minus the amount destroyed minus the amount entirely used as feedstock in the manufacture of other chemicals. Process agent applications are treated in a manner similar to feedstock applications for non-Article 5 Parties, hence they are also deducted (decisions VII/10 and X/14 of the Meeting of the Parties). Calculated production may therefore be negative in cases where the destroyed amounts exceed the production. Since the figures are for each calendar year, it is quite possible that in some years the feedstock figure may exceed the production figure of that year, if the feedstock use is from a carry-over stock. The calculated production could be negative in such cases.
11. Consumption is defined as production plus imports minus exports of controlled substances (Article 1(6) of the Montreal Protocol). For reasons similar to those for calculated production, such as the case of exports from carry-over stock, the consumption could also be negative.
12. The Ninth Meeting of the Parties approved new formats for reporting data under Article 7 of the Protocol. The old data formats used by the Parties to report data were replaced, and beginning 1997 onwards, the revised formats have been used. To assist the Parties in providing the data as required by the revised formats, the Handbook on Data Reporting under the Montreal Protocol was prepared and distributed to all Parties by United Nations Environment Programme – Division of Technology, Industry and Economics (UNEP-TIE). This handbook is also available on the web at the address http://www.uneptie.org/ozonaction.
13. The Secretariat hopes that this publication will be of interest to many readers and would be grateful for any suggestions on ways of improving the format of the presentation or for any corrections. The Secretariat will prepare an update of this publication periodically, taking into account any suggestions received.
Marco González Executive Secretary Ozone Secretariat
United Nations Environment Programme November 2005
Production and Consumption of Ozone Depleting Substances: 1986 - 2004 3
List of Controlled Substances under the Montreal Protocol
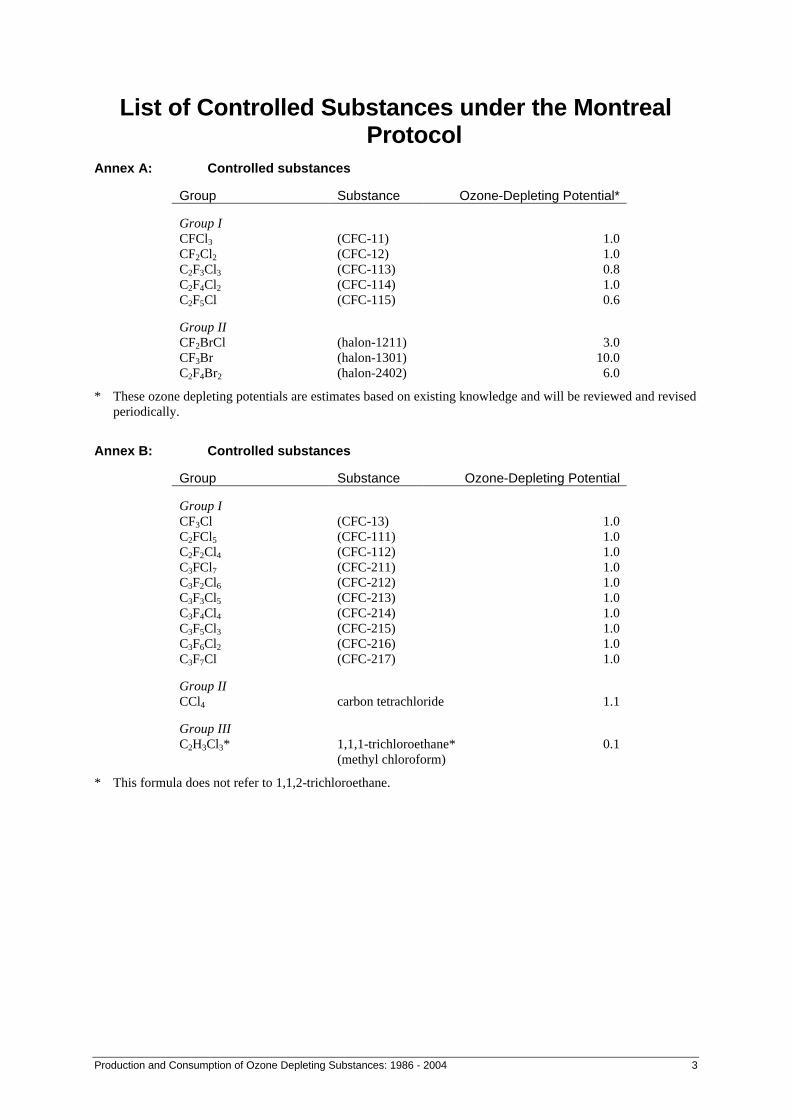
Annex A: Controlled substances
Group Substance Ozone-Depleting Potential*
Group I
CFCl3 (CFC-11) 1.0 CF2Cl2 (CFC-12) 1.0 C2F3Cl3 (CFC-113) 0.8 C2F4Cl2 (CFC-114) 1.0 C2F5Cl (CFC-115) 0.6
Group II
CF2BrCl (halon-1211) 3.0 CF3Br (halon-1301) 10.0 C2F4Br2 (halon-2402) 6.0
* These ozone depleting potentials are estimates based on existing knowledge and will be reviewed and revised periodically.
Annex B: Controlled substances
Group Substance Ozone-Depleting Potential
Group I
CF3Cl (CFC-13) 1.0 C2FCl5 (CFC-111) 1.0 C2F2Cl4 (CFC-112) 1.0 C3FCl7 (CFC-211) 1.0 C3F2Cl6 (CFC-212) 1.0 C3F3Cl5 (CFC-213) 1.0 C3F4Cl4 (CFC-214) 1.0 C3F5Cl3 (CFC-215) 1.0 C3F6Cl2 (CFC-216) 1.0 C3F7Cl (CFC-217) 1.0
Group II
CCl4 carbon tetrachloride 1.1
Group III
C2H3Cl3* 1,1,1-trichloroethane*
(methyl chloroform) 0.1
* This formula does not refer to 1,1,2-trichloroethane.
List of Controlled Substances under the Montreal Protocol
4 Production and Consumption of Ozone Depleting Substances: 1986 - 2004
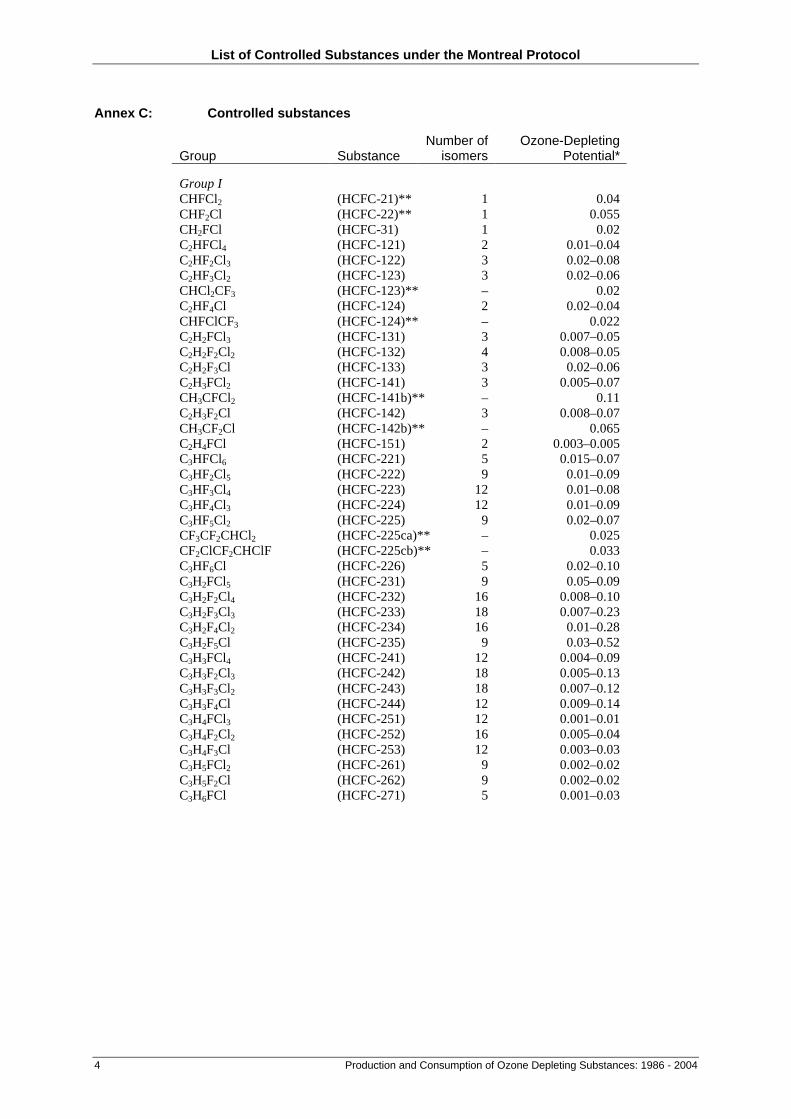
Annex C: Controlled substances
Group Substance Number of
isomers Ozone-Depleting
Potential*
Group I
CHFCl2 (HCFC-21)** 1 0.04 CHF2Cl (HCFC-22)** 1 0.055 CH2FCl (HCFC-31) 1 0.02 C2HFCl4 (HCFC-121) 2 0.01–0.04 C2HF2Cl3 (HCFC-122) 3 0.02–0.08 C2HF3Cl2 (HCFC-123) 3 0.02–0.06 CHCl2CF3 (HCFC-123)** – 0.02 C2HF4Cl (HCFC-124) 2 0.02–0.04 CHFClCF3 (HCFC-124)** – 0.022 C2H2FCl3 (HCFC-131) 3 0.007–0.05 C2H2F2Cl2 (HCFC-132) 4 0.008–0.05 C2H2F3Cl (HCFC-133) 3 0.02–0.06 C2H3FCl2 (HCFC-141) 3 0.005–0.07 CH3CFCl2 (HCFC-141b)** – 0.11 C2H3F2Cl (HCFC-142) 3 0.008–0.07 CH3CF2Cl (HCFC-142b)** – 0.065 C2H4FCl (HCFC-151) 2 0.003–0.005 C3HFCl6 (HCFC-221) 5 0.015–0.07 C3HF2Cl5 (HCFC-222) 9 0.01–0.09 C3HF3Cl4 (HCFC-223) 12 0.01–0.08 C3HF4Cl3 (HCFC-224) 12 0.01–0.09 C3HF5Cl2 (HCFC-225) 9 0.02–0.07 CF3CF2CHCl2 (HCFC-225ca)** – 0.025 CF2ClCF2CHClF (HCFC-225cb)** – 0.033 C3HF6Cl (HCFC-226) 5 0.02–0.10 C3H2FCl5 (HCFC-231) 9 0.05–0.09 C3H2F2Cl4 (HCFC-232) 16 0.008–0.10 C3H2F3Cl3 (HCFC-233) 18 0.007–0.23 C3H2F4Cl2 (HCFC-234) 16 0.01–0.28 C3H2F5Cl (HCFC-235) 9 0.03–0.52 C3H3FCl4 (HCFC-241) 12 0.004–0.09 C3H3F2Cl3 (HCFC-242) 18 0.005–0.13 C3H3F3Cl2 (HCFC-243) 18 0.007–0.12 C3H3F4Cl (HCFC-244) 12 0.009–0.14 C3H4FCl3 (HCFC-251) 12 0.001–0.01 C3H4F2Cl2 (HCFC-252) 16 0.005–0.04 C3H4F3Cl (HCFC-253) 12 0.003–0.03 C3H5FCl2 (HCFC-261) 9 0.002–0.02 C3H5F2Cl (HCFC-262) 9 0.002–0.02 C3H6FCl (HCFC-271) 5 0.001–0.03
List of Controlled Substances under the Montreal Protocol
Production and Consumption of Ozone Depleting Substances: 1986 – 2004 5
Group Substance Number of
isomers Ozone-Depleting
Potential*
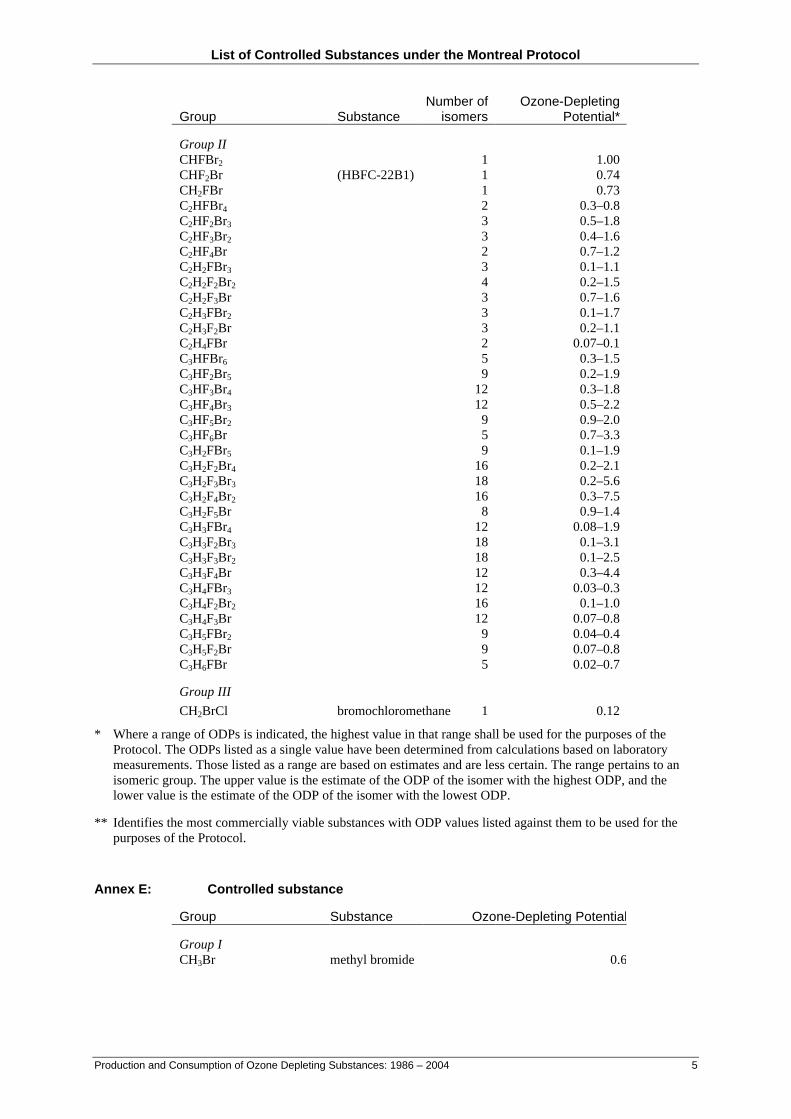
Group II
CHFBr2 1 1.00 CHF2Br (HBFC-22B1) 1 0.74 CH2FBr 1 0.73 C2HFBr4 2 0.3–0.8 C2HF2Br3 3 0.5–1.8 C2HF3Br2 3 0.4–1.6 C2HF4Br 2 0.7–1.2 C2H2FBr3 3 0.1–1.1 C2H2F2Br2 4 0.2–1.5 C2H2F3Br 3 0.7–1.6 C2H3FBr2 3 0.1–1.7 C2H3F2Br 3 0.2–1.1 C2H4FBr 2 0.07–0.1 C3HFBr6 5 0.3–1.5 C3HF2Br5 9 0.2–1.9 C3HF3Br4 12 0.3–1.8 C3HF4Br3 12 0.5–2.2 C3HF5Br2 9 0.9–2.0 C3HF6Br 5 0.7–3.3 C3H2FBr5 9 0.1–1.9 C3H2F2Br4 16 0.2–2.1 C3H2F3Br3 18 0.2–5.6 C3H2F4Br2 16 0.3–7.5 C3H2F5Br 8 0.9–1.4 C3H3FBr4 12 0.08–1.9 C3H3F2Br3 18 0.1–3.1 C3H3F3Br2 18 0.1–2.5 C3H3F4Br 12 0.3–4.4 C3H4FBr3 12 0.03–0.3 C3H4F2Br2 16 0.1–1.0 C3H4F3Br 12 0.07–0.8 C3H5FBr2 9 0.04–0.4 C3H5F2Br 9 0.07–0.8 C3H6FBr 5 0.02–0.7
Group III CH2BrCl bromochloromethane 1 0.12
* Where a range of ODPs is indicated, the highest value in that range shall be used for the purposes of the Protocol. The ODPs listed as a single value have been determined from calculations based on laboratory measurements. Those listed as a range are based on estimates and are less certain. The range pertains to an isomeric group. The upper value is the estimate of the ODP of the isomer with the highest ODP, and the lower value is the estimate of the ODP of the isomer with the lowest ODP.
** Identifies the most commercially viable substances with ODP values listed against them to be used for the purposes of the Protocol.
Annex E: Controlled substance
Group Substance Ozone-Depleting Potential
Group I
CH3Br methyl bromide 0.6

Pro
duct
ion
and
Con
sum
ptio
n of
Ozo
ne D
eple
ting
Sub
stan
ces:
198
6 -
2004
7
Sum
mar
y of
Con
trol
Mea
sure
s un
der
the
Mon
trea
l Pro
toco
l
Art
icle
5 P
arti
es S
um
mar
y o
f C
on
tro
l Mea
sure
s Y
ears
an
d t
he
app
licab
le c
on
tro
l mea
sure
s (%
ch
ang
e is
rel
ativ
e to
co
rres
po
nd
ing
bas
elin
e*)
Su
bst
ance
s G
rou
p
Ann
ex
Gro
up
19
99
2000
20
01
2002
20
03
2004
20
05
2006
20
07
2008
20
09
2010
20
11
2012
20
13
2014
20
15
2016
20
40
CF
Cs
A/I
Fre
eze
-50%
-8
5%
-100
% (
Pha
se-o
ut)
Hal
ons
A/II
Fre
eze
-50%
-1
00%
(P
hase
-out
) O
ther
CF
Cs
B/I
-2
0%
-85%
-1
00%
(P
hase
-out
) C
Cl 4
(CT
C)
B/II
-85%
-1
00%
(P
hase
-out
) M
ethy
l Chl
orof
orm
B
/III
F
reez
e -3
0%
-70%
-1
00%
(P
hase
-out
) H
CF
Cs
Con
sum
ptio
n C
/I
Fre
eze
-100
%
HC
FC
s P
rodu
ctio
n C
/I
Fre
eze
H
BF
Cs
C/II
P
hase
d ou
t in
1996
B
CM
C
/III
-1
00%
(P
hase
-out
) M
ethy
l Bro
mid
e E
/I
Fre
eze
-20%
-1
00%
(P
hase
-out
)
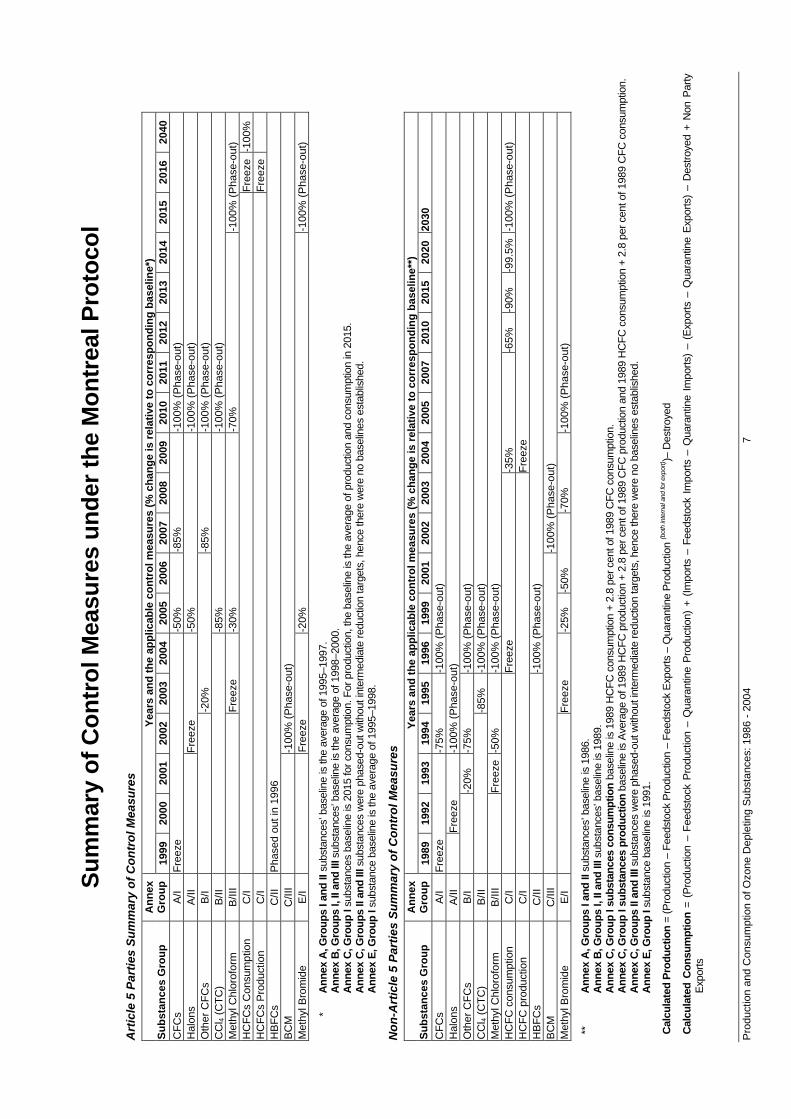
* A
nnex
A, G
roup
s I a
nd II
sub
stan
ces’
bas
elin
e is
the
aver
age
of 1
995–
1997
. A
nnex
B, G
roup
s I,
II an
d III
sub
stan
ces’
bas
elin
e is
the
aver
age
of 1
998–
2000
. A
nnex
C, G
roup
I su
bsta
nces
bas
elin
e is
201
5 fo
r con
sum
ptio
n. F
or p
rodu
ctio
n, th
e ba
selin
e is
the
aver
age
of p
rodu
ctio
n an
d co
nsum
ptio
n in
201
5.
Ann
ex C
, Gro
ups
II an
d III
sub
stan
ces
wer
e ph
ased
-out
with
out i
nter
med
iate
redu
ctio
n ta
rget
s, h
ence
ther
e w
ere
no b
asel
ines
est
ablis
hed.
A
nnex
E, G
roup
I su
bsta
nce
base
line
is th
e av
erag
e of
199
5–19
98.
No
n-A
rtic
le 5
Par
ties
Su
mm
ary
of
Co
ntr
ol M
easu
res
Yea
rs a
nd
th
e ap
plic
able
co
ntr
ol m
easu
res
(% c
han
ge
is r
elat
ive
to c
orr
esp
on
din
g b
asel
ine*
*)
Su
bst
ance
s G
rou
p
Ann
ex
Gro
up
19
89
1992
19
93
1994
19
95
1996
19
99
2001
20
02
2003
20
04
2005
20
07
2010
20
15
2020
20
30
CF
Cs
A/I
Fre
eze
-75%
-1
00%
(P
hase
-out
) H
alon
s A
/II
F
reez
e -1
00%
(P
hase
-out
) O
ther
CF
Cs
B/I
-2
0%
-75%
-1
00%
(P
hase
-out
) C
Cl 4
(CT
C)
B/II
-85%
-1
00%
(P
hase
-out
) M
ethy
l Chl
orof
orm
B
/III
F
reez
e -5
0%
-100
% (
Pha
se-o
ut)
HC
FC
con
sum
ptio
n C
/I
Fre
eze
-35%
-6
5%
-90%
-9
9.5%
-1
00%
(P
hase
-out
) H
CF
C p
rodu
ctio
n C
/I
Fre
eze
HB
FC
s C
/II
-1
00%
(P
hase
-out
) B
CM
C
/III
-1
00%
(P
hase
-out
) M
ethy
l Bro
mid
e E
/I
Fre
eze
-25%
-5
0%
-70%
-1
00%
(P
hase
-out
)
**
Ann
ex A
, Gro
ups
I and
II s
ubst
ance
s’ b
asel
ine
is 1
986.
A
nnex
B, G
roup
s I,
II an
d III
sub
stan
ces’
bas
elin
e is
198
9.
Ann
ex C
, Gro
up I
subs
tanc
es c
onsu
mpt
ion
base
line
is 1
989
HC
FC c
onsu
mpt
ion
+ 2.
8 pe
r cen
t of 1
989
CFC
con
sum
ptio
n.
Ann
ex C
, Gro
up I
subs
tanc
es p
rodu
ctio
n ba
selin
e is
Ave
rage
of 1
989
HC
FC p
rodu
ctio
n +
2.8
per c
ent o
f 198
9 C
FC p
rodu
ctio
n an
d 19
89 H
CFC
con
sum
ptio
n +
2.8
per c
ent o
f 198
9 C
FC c
onsu
mpt
ion.
A
nnex
C, G
roup
s II
and
III s
ubst
ance
s w
ere
phas
ed-o
ut w
ithou
t int
erm
edia
te re
duct
ion
targ
ets,
hen
ce th
ere
wer
e no
bas
elin
es e
stab
lishe
d.
Ann
ex E
, Gro
up I
subs
tanc
e ba
selin
e is
199
1.
Cal
cula
ted
Pro
duct
ion
= (P
rodu
ctio
n –
Feed
stoc
k P
rodu
ctio
n –
Feed
stoc
k E
xpor
ts –
Qua
rant
ine
Pro
duct
ion
(bot
h in
tern
al a
nd fo
r exp
ort) )–
Des
troye
d
Cal
cula
ted
Con
sum
ptio
n =
(Pro
duct
ion
– Fe
edst
ock
Pro
duct
ion
– Q
uara
ntin
e P
rodu
ctio
n) +
(Im
ports
– F
eeds
tock
Im
ports
– Q
uara
ntin
e Im
ports
) –
(Exp
orts
– Q
uara
ntin
e E
xpor
ts)
– D
estro
yed
+ N
on P
arty
E
xpor
ts


Production and Consumption of Ozone Depleting Substances: 1986 - 2004 9
Production and Consumption trends
CFCs (Annex A/I) Production
0
200
400
600
800
1,000
1,200
1986 1987 1988 1989 1990 1991 1992 1993 1994 1995 1996 1997 1998 1999 2000 2001 2002 2003 2004
Year
Pro
du
ctio
n (
000s
OD
P t
on
nes
)
0%
20%
40%
60%
80%
100%
Per
cen
tag
e o
f T
ota
l Bas
elin
e
Article 5 PartiesNon-Article 5 Parties
6.2%
CFCs (Annex A/I) Consumption
0
200
400
600
800
1,000
1,200
1986 1987 1988 1989 1990 1991 1992 1993 1994 1995 1996 1997 1998 1999 2000 2001 2002 2003 2004
Year
Co
nsu
mp
tio
n (
000s
OD
P t
on
nes
)
0%
20%
40%
60%
80%
100%
Per
cen
tag
e o
f T
ota
l Bas
elin
e
Article 5 PartiesNon-Article 5 Parties
5.8%
Production and Consumption trends
10 Production and Consumption of Ozone Depleting Substances: 1986 - 2004
Halons (Annex A/II) Production
0
50
100
150
200
250
1986 1987 1988 1989 1990 1991 1992 1993 1994* 1995 1996 1997 1998 1999 2000 2001 2002 2003 2004
Year
Pro
du
ctio
n (
000s
OD
P t
on
nes
)
0%
20%
40%
60%
80%
100%
Per
cen
tag
e o
f T
ota
l Bas
elin
e
Article 5 PartiesNon-Article 5 Parties
0.9%
*
Halons (Annex A/II) Consumption
0
50
100
150
200
250
1986 1987 1988 1989 1990 1991 1992 1993 1994* 1995 1996 1997 1998 1999 2000 2001 2002 2003 2004
Year
Co
nsu
mp
tio
n (
000s
OD
P t
on
nes
)
0%
20%
40%
60%
80%
100%
Per
cen
tag
e o
f T
ota
l Bas
elin
e
Article 5 PartiesNon-Article 5 Parties
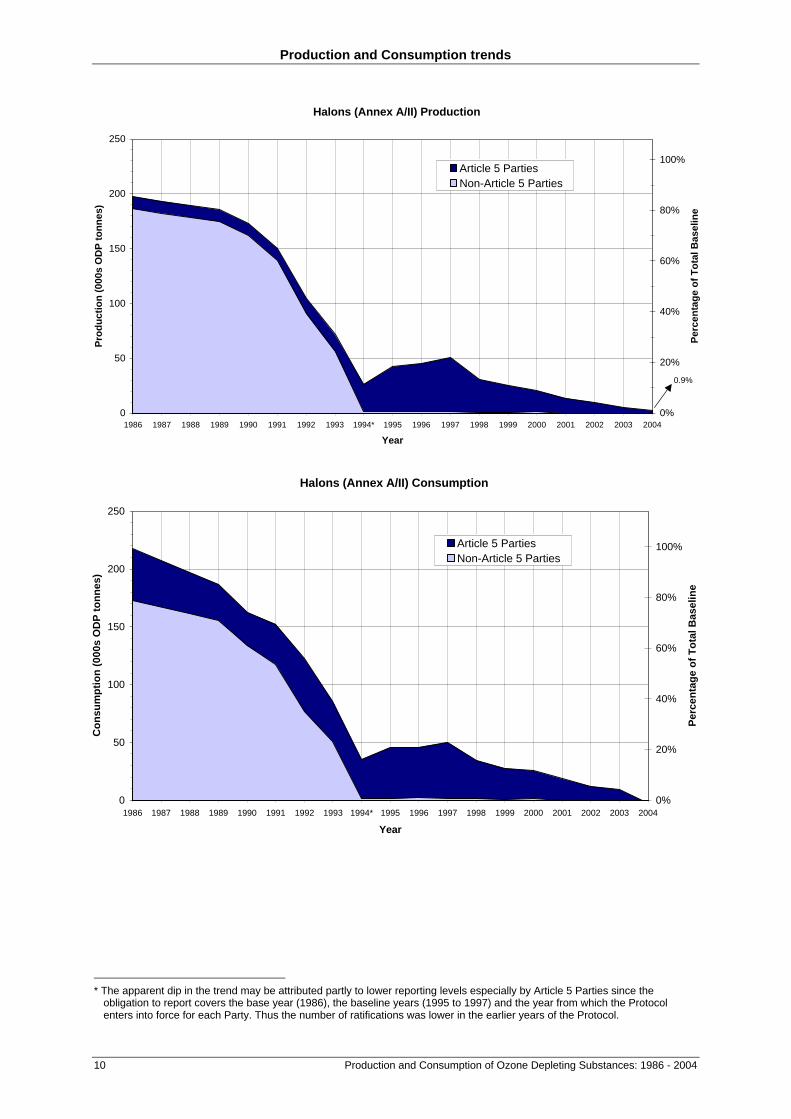
* The apparent dip in the trend may be attributed partly to lower reporting levels especially by Article 5 Parties since the
obligation to report covers the base year (1986), the baseline years (1995 to 1997) and the year from which the Protocol enters into force for each Party. Thus the number of ratifications was lower in the earlier years of the Protocol.
Production and Consumption trends
Production and Consumption of Ozone Depleting Substances: 1986 – 2004 11
Other Fully Halogenated CFCs (Annex B/I) Production
0
500
1,000
1,500
2,000
2,500
3,000
3,500
1989 1990 1991 1992 1993 1994 1995 1996 1997 1998 1999 2000 2001 2002 2003 2004
Year
Pro
du
ctio
n (
OD
P t
on
nes
)
0%
20%
40%
60%
80%
100%
Per
cen
tag
e o
f T
ota
l Bas
elin
e
Article 5 PartiesNon-Article 5 Parties
Other Fully Halogenated CFCs (Annex B/I) Consumption
0
500
1,000
1,500
2,000
2,500
3,000
3,500
4,000
4,500
5,000
1989 1990 1991 1992 1993* 1994 1995 1996 1997 1998 1999 2000 2001 2002 2003 2004
Year
Co
nsu
mp
tio
n (
OD
P t
on
nes
)
0%
20%
40%
60%
80%
100%
120%
140%
Per
cen
tag
e o
f T
ota
l Bas
elin
e
Article 5 PartiesNon-Article 5 Parties
*
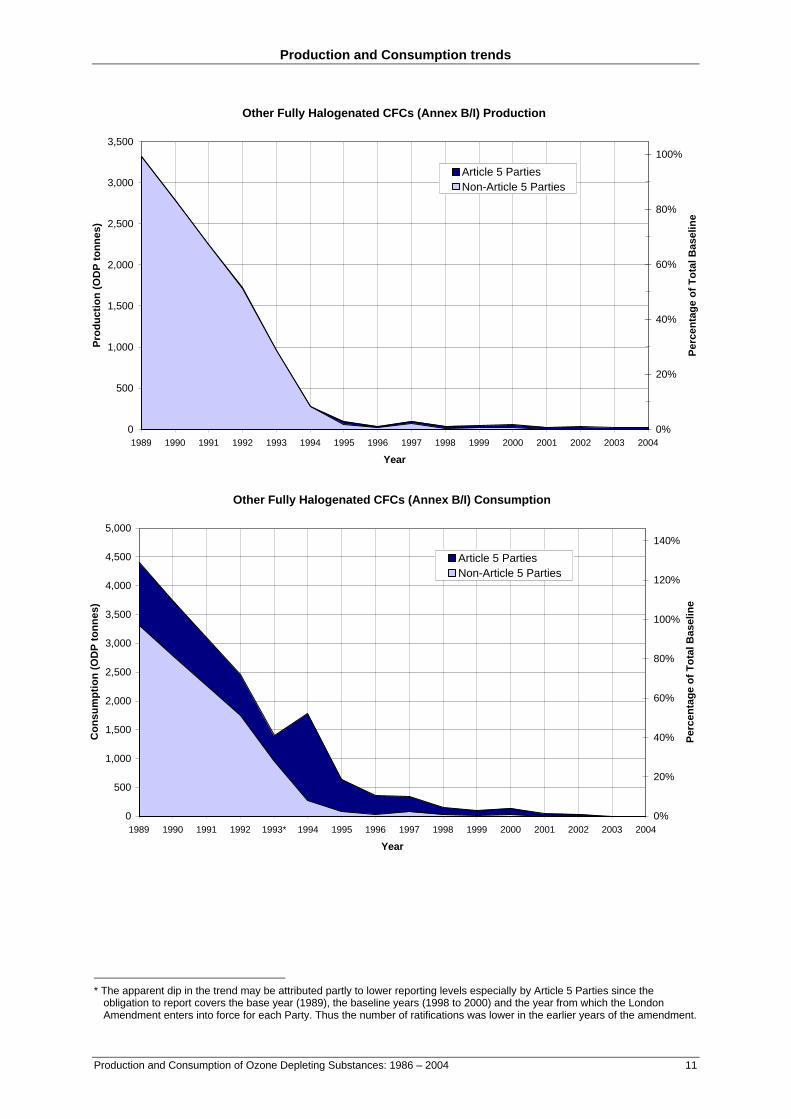
* The apparent dip in the trend may be attributed partly to lower reporting levels especially by Article 5 Parties since the
obligation to report covers the base year (1989), the baseline years (1998 to 2000) and the year from which the London Amendment enters into force for each Party. Thus the number of ratifications was lower in the earlier years of the amendment.

Production and Consumption trends
12 Production and Consumption of Ozone Depleting Substances: 1986 - 2004
Carbon tetrachloride (Annex B/II) Production
0
50
100
150
200
250
300
350
400
450
500
1989 1990 1991 1992 1993 1994 1995 1996 1997 1998 1999 2000 2001 2002 2003 2004
Year
Pro
du
ctio
n (
000s
OD
P t
on
nes
)
0%
20%
40%
60%
80%
100%
120%
Per
cen
tag
e o
f T
ota
l Bas
elin
e
Article 5 PartiesNon-Article 5 Parties
3.2%
Carbon tetrachloride (Annex B/II) Consumption
0
50
100
150
200
250
300
350
400
1989 1990 1991 1992* 1993 1994 1995 1996 1997 1998 1999 2000 2001 2002 2003 2004
Year
Co
nsu
mp
tio
n (
000s
OD
P t
on
nes
)
0%
20%
40%
60%
80%
100%
120%
Per
cen
tag
e o
f T
ota
l Bas
elin
e
Article 5 PartiesNon-Article 5 Parties
4.6%
*
* The apparent dip in the trend may be attributed partly to lower reporting levels especially by Article 5 Parties since the
obligation to report covers the base year (1989), the baseline years (1998 to 2000) and the year from which the London Amendment enters into force for each Party. Thus the number of ratifications was lower in the earlier years of the amendment.

Production and Consumption trends
Production and Consumption of Ozone Depleting Substances: 1986 – 2004 13
Methyl Chloroform (Annex B/III) Production
0
10
20
30
40
50
60
70
80
1989 1990 1991 1992 1993 1994* 1995 1996 1997 1998 1999 2000 2001 2002 2003 2004
Year
Pro
du
ctio
n (
000s
OD
P t
on
nes
)
0%
20%
40%
60%
80%
100%
Per
cen
tag
e o
f T
ota
l Bas
elin
e
Article 5 PartiesNon-Article 5 Parties
0.5%
Methyl Chloroform (Annex B/III) Consumption
0
10
20
30
40
50
60
70
1989 1990 1991 1992 1993 1994* 1995 1996 1997 1998 1999 2000 2001 2002 2003 2004
Year
Co
nsu
mp
tio
n (
000s
OD
P t
on
nes
)
0%
20%
40%
60%
80%
100%
Per
cen
tag
e o
f T
ota
l Bas
elin
e
Article 5 PartiesNon-Article 5 Parties
1.2%
*
* The apparent dip in the trend may be attributed partly to lower reporting levels especially by Article 5 Parties since the
obligation to report covers the base year (1989), the baseline years (1998 to 2000) and the year from which the London Amendment enters into force for each Party. Thus the number of ratifications was lower in the earlier years of the amendment.

Production and Consumption trends
14 Production and Consumption of Ozone Depleting Substances: 1986 - 2004
HCFCs (Annex C/I) Production
0
5
10
15
20
25
30
35
40
1989 1990 1991 1992 1993 1994 1995 1996 1997 1998 1999 2000 2001 2002 2003 2004
Year
Pro
du
ctio
n (
000s
OD
P t
on
nes
)
0%
20%
40%
60%
80%
100%
120%
140%
Per
cen
tag
e o
f B
asel
ine
of
No
n-A
rtic
le 5
P
arti
es
Article 5 PartiesNon-Article 5 Parties
53%
HCFCs (Annex C/I) Consumption
0
5
10
15
20
25
30
35
40
45
1989 1990 1991 1992 1993 1994 1995 1996 1997 1998 1999 2000 2001 2002 2003 2004
Year
Co
nsu
mp
tio
n (
000s
OD
P t
on
nes
)
0%
20%
40%
60%
80%
100%
120%
Per
cen
tag
e o
f B
asel
ine
of
No
n-A
rtic
le 5
P
arti
es
Article 5 PartiesNon-Article 5 Parties
28%

Production and Consumption trends
Production and Consumption of Ozone Depleting Substances: 1986 – 2004 15
Methyl Bromide (Annex E/I) Production
0
5
10
15
20
25
30
35
40
45
1991 1992 1993 1994* 1995 1996 1997 1998 1999 2000 2001 2002 2003 2004
Year
Pro
du
ctio
n (
000s
OD
P t
on
nes
)
0%
20%
40%
60%
80%
100%
Per
cen
tag
e o
f T
ota
l Bas
elin
e
Article 5 PartiesNon-Article 5 Parties
36%
*
Methyl Bromide (Annex E/I) Consumption
0
5
10
15
20
25
30
35
40
45
1991 1992 1993 1994* 1995 1996 1997 1998 1999 2000 2001 2002 2003 2004
Year
Co
nsu
mp
tio
n (
000s
OD
P t
on
nes
)
0%
20%
40%
60%
80%
100%
Per
cen
tag
e o
f T
ota
l Bas
elin
e
Article 5 PartiesNon-Article 5 Parties
26%
* The apparent dip in the trend may be attributed partly to lower reporting levels especially by Article 5 Parties since the
obligation to report covers the base year (1991), the baseline years (1995 to 1998) and the year from which the Copenhagen Amendment enters into force for each Party. Thus the number of ratifications was lower in the earlier years of the amendment.
Production and Consumption trends
16 Production and Consumption of Ozone Depleting Substances: 1986 - 2004
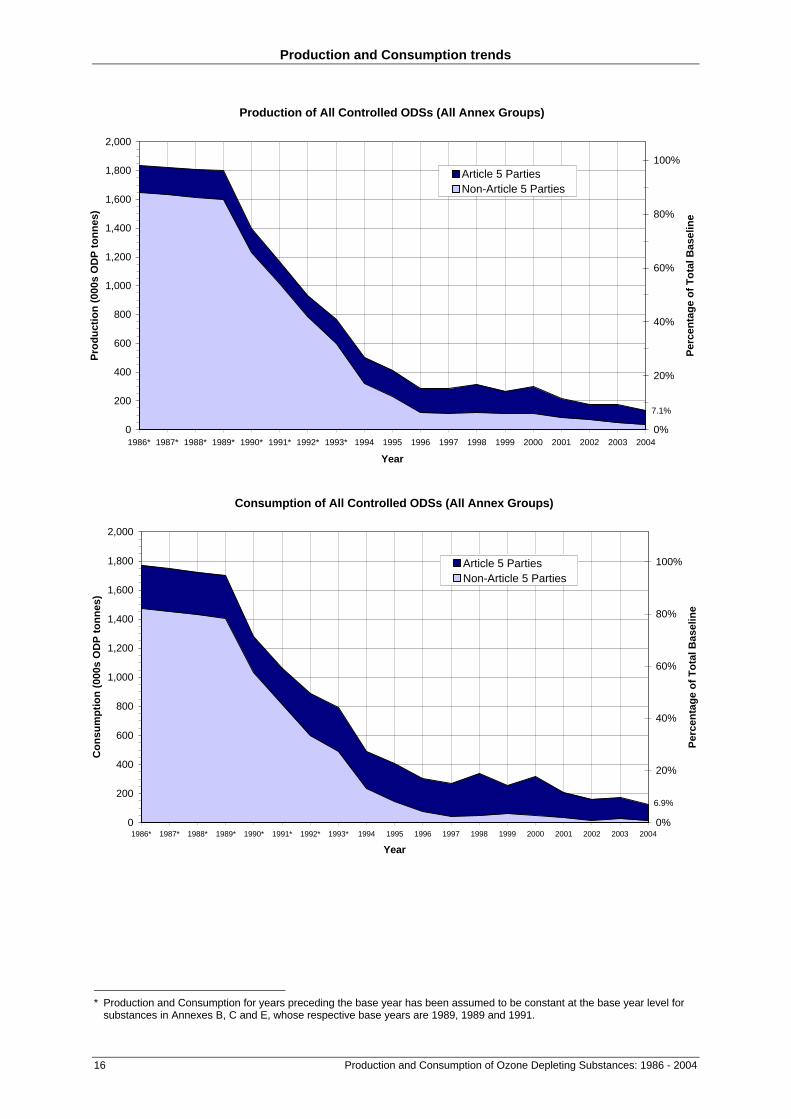
Production of All Controlled ODSs (All Annex Groups)
0
200
400
600
800
1,000
1,200
1,400
1,600
1,800
2,000
1986* 1987* 1988* 1989* 1990* 1991* 1992* 1993* 1994 1995 1996 1997 1998 1999 2000 2001 2002 2003 2004
Year
Pro
du
ctio
n (
000s
OD
P t
on
nes
)
0%
20%
40%
60%
80%
100%
Per
cen
tag
e o
f T
ota
l Bas
elin
e
Article 5 PartiesNon-Article 5 Parties
7.1%
*
Consumption of All Controlled ODSs (All Annex Groups)
0
200
400
600
800
1,000
1,200
1,400
1,600
1,800
2,000
1986* 1987* 1988* 1989* 1990* 1991* 1992* 1993* 1994 1995 1996 1997 1998 1999 2000 2001 2002 2003 2004
Year
Co
nsu
mp
tio
n (
000s
OD
P t
on
nes
)
0%
20%
40%
60%
80%
100%
Per
cen
tag
e o
f T
ota
l Bas
elin
e
Article 5 PartiesNon-Article 5 Parties
6.9%
* Production and Consumption for years preceding the base year has been assumed to be constant at the base year level for
substances in Annexes B, C and E, whose respective base years are 1989, 1989 and 1991.
Production and Consumption of Ozone Depleting Substances: 1986 - 2004 17
Production and Consumption Tables

Table 1: Data on Production of CFCs (Annex A, Group I) ODP tonnes
N.R. Not reported: is used where Parties are required to report but have not done so. AFR = Africa ASIA = Asia EEUR = Eastern Europe CEIT = Country with Economy in Transition – Hyphen: is used where Parties have not reported and are not required to report. LAC = Latin America and the Caribbean WEUR = Western Europe and Others EC = Member of the European Community NB: Figures are rounded to a uniform number of decimal places.
18 Production and Consumption of Ozone Depleting Substances: 1986 - 2004 Production and Consumption of Ozone Depleting Substances: 1986 – 2004 19
Table 1: Data on Production of CFCs (Annex A, Group I) ODP tonnes
Non-Article 5 Parties Ratification date:
Montreal ProtocolBase Year
1986 1989 1990 1991 1992 1993 1994 1995 1996 1997 1998 1999 2000 2001 2002 2003 2004Baselevel
Australia (WEUR) 19-May-1989 15,385.4 17,613.0 8,263.0 7,485.4 6,752.6 6,644.0 4,452.4 3,849.9 0.0 0.0 0.0 0.0 -3.0 -3.4 0.0 0.0 -11.8 15,385.4Belgium* (WEUR EC) 30-Dec-1988 0.0 0.0 0.0 0.0 0.0 0.0 0.0 0.0 0.0 -17.6 -37.6 0.0 0.0 0.0 0.0 0.0 0.0 0.0Canada (WEUR) 30-Jun-1988 19,104.2 17,895.4 11,959.2 8,330.0 13,694.0 1,135.0 0.0 0.0 0.0 0.0 0.0 0.0 0.0 0.0 -12.6 -0.2 0.0 19,104.2Czech Republic (EEUR CEIT EC) 1-Jan-1993 1,977.6 2,122.2 - - - 897.3 231.3 320.0 7.0 12.1 6.1 11.2 4.8 0.0 0.0 -10.7 -0.8 1,977.6Denmark* (WEUR EC) 16-Dec-1988 0.0 0.0 0.0 0.0 0.0 0.0 0.0 0.0 0.0 0.0 -39.0 -21.0 -60.0 -24.2 0.0 -22.1 0.0 0.0Finland* (WEUR EC) 23-Dec-1988 0.0 0.0 0.0 0.0 0.0 0.0 0.0 0.0 -8.0 -3.0 -6.0 -11.0 -21.0 -22.5 -24.0 -30.9 -78.7 0.0France (WEUR EC) 28-Dec-1988 71,018.4 55,205.6 38,988.8 22,896.0 3,756.8 3,061.2 3,687.8 244.4 0.0 0.0 -131.0 0.0 0.0 0.0 0.0 0.0 -4.3 71,018.4Germany (WEUR EC) 16-Dec-1988 123,652.8 104,095.8 78,470.0 63,400.6 57,698.0 51,258.4 15,997.2 0.0 0.0 0.0 0.0 100.8 -53.2 -662.6 -58.6 118.8 -1,584.6 123,652.8Greece (WEUR EC) 29-Dec-1988 14,045.0 12,372.0 8,559.0 11,397.0 12,635.0 11,667.0 3,505.0 2,453.0 1,450.0 1,530.0 765.0 1,210.0 1,828.0 1,460.0 1,440.0 1,168.0 2,793.0 14,045.0Hungary* (EEUR CEIT EC) 20-Apr-1989 0.0 0.0 0.0 0.0 0.0 0.0 0.0 0.0 0.0 0.0 0.0 0.0 0.0 0.0 0.0 -1.3 0.0 0.0Italy (WEUR EC) 16-Dec-1988 56,656.4 48,840.2 36,394.8 35,087.4 40,996.8 36,035.6 9,842.2 6,192.6 8,474.8 7,011.4 7,578.2 6,422.8 7,081.2 8,421.8 9,131.3 7,294.4 0.0 56,656.4Japan (ASIA) 30-Sep-1988 119,997.8 146,744.2 109,311.4 99,361.6 65,670.0 51,213.8 21,593.2 29,757.4 704.8 164.6 -59.0 0.0 0.0 0.0 0.0 0.0 0.0 119,997.8Liechtenstein* (WEUR) 8-Feb-1989 0.0 0.0 0.0 0.0 0.0 0.0 0.0 0.0 0.0 0.0 -0.2 -0.2 -0.2 -0.2 -0.2 -0.1 N.R. 0.0Netherlands (WEUR EC) 16-Dec-1988 42,330.8 41,293.6 33,288.0 22,432.0 30,777.2 34,712.6 21,013.0 12,245.0 13,293.0 14,844.0 15,049.0 15,721.0 12,235.2 9,635.0 9,213.5 2,816.2 1,452.2 42,330.8Norway* (WEUR) 24-Jun-1988 0.0 0.0 0.0 0.0 0.0 0.0 0.0 0.0 0.0 0.0 -19.0 -62.5 -41.6 -50.4 -74.8 -65.6 -54.6 0.0Russian Federation (EEUR CEIT) 10-Nov-1988 105,296.0 105,046.0 103,696.0 84,289.0 62,127.4 40,580.4 42,526.0 39,322.4 16,770.0 14,731.7 13,807.6 18,416.7 25,535.9 0.0 0.0 0.0 N.R. 105,296.0Spain (WEUR EC) 16-Dec-1988 33,728.0 30,833.4 23,596.4 25,292.2 30,752.0 27,172.6 18,729.0 5,435.0 5,424.0 6,405.0 5,570.0 5,839.0 5,439.0 6,836.0 6,491.0 4,901.0 4,390.0 33,728.0Switzerland* (WEUR) 28-Dec-1988 0.0 0.0 0.0 0.0 0.0 0.0 0.0 0.0 -49.1 -54.0 -58.0 -58.3 -51.0 -54.0 -45.0 -30.0 -20.0 0.0United Kingdom of Great Britain and Northern Ireland (WEUR EC) 16-Dec-1988 102,014.4 74,177.6 58,080.6 54,360.0 42,815.0 25,730.8 7,090.8 4,029.0 4,098.3 3,707.5 3,316.0 1,417.0 0.0 0.0 0.0 0.0 486.0 102,014.4
United States of America (WEUR) 21-Apr-1988 311,021.2 320,436.2 199,696.6 172,164.2 152,730.0 127,711.8 78,208.4 34,727.6 675.6 739.0 191.2 436.2 461.4 495.2 593.2 570.2 699.3 311,021.2Uzbekistan* (EEUR CEIT) 18-May-1993 0.0 0.0 - - - 0.0 0.0 0.0 0.0 0.0 0.0 0.0 0.0 0.0 0.0 0.0 -0.3 0.0Subtotal (Non-Article 5 - Annex A, Group I) 1,016,228.0 976,675.2 710,303.8 606,495.4 520,404.8 417,820.5 226,876.3 138,576.3 50,840.4 49,070.7 45,933.3 49,421.7 52,355.5 26,030.7 26,653.8 16,707.7 8,065.4 1,016,228.0
Article 5 Baseline YearsArticle 5 Parties
Ratification date: Montreal Protocol
Base Year 1986 1989 1990 1991 1992 1993 1994 1995 1996 1997 1998 1999 2000 2001 2002 2003 2004
Baselevel
Argentina (LAC) 18-Sep-1990 5,574.0 2,960.0 3,201.0 3,257.0 1,650.0 1,536.0 1,260.0 2,800.0 2,632.0 2,804.0 2,954.0 3,101.0 3,027.0 2,899.0 3,015.0 3,018.0 3,016.0 2,745.3Brazil (LAC) 19-Mar-1990 10,218.0 9,109.7 8,538.8 9,551.4 9,345.0 13,012.0 11,860.2 11,750.5 9,434.0 9,362.0 7,986.0 11,286.0 0.0 0.0 0.0 0.0 0.0 10,182.2China (ASIA) 14-Jun-1991 11,540.0 20,700.0 20,687.6 26,017.8 24,941.0 31,658.0 50,809.0 46,671.6 44,016.2 50,323.8 55,401.8 44,739.4 39,962.8 36,167.2 32,269.0 29,964.4 25,264.0 47,003.9Democratic People's Republic of Korea (ASIA) 24-Jan-1995 930.0 930.0 - - - - - 765.0 242.0 203.0 112.0 106.0 77.0 290.8 299.0 587.4 0.0 403.3
India (ASIA) 19-Jun-1992 2,202.0 4,317.0 0.0 0.0 6,096.8 11,438.8 16,646.0 21,779.6 22,459.6 23,658.0 20,012.8 22,498.6 20,403.8 18,689.2 16,883.7 15,008.2 13,047.3 22,632.4Mexico (LAC) 31-Mar-1988 8,609.0 9,346.0 10,576.0 9,784.0 9,964.0 12,525.0 15,417.0 15,737.0 8,959.0 8,431.0 5,252.0 5,530.0 7,546.0 6,636.0 5,653.0 8,694.0 8,044.0 11,042.3Republic of Korea (ASIA) 27-Feb-1992 1,405.0 8,249.0 - - 9,686.0 8,507.0 8,836.0 9,746.0 8,621.0 9,239.0 5,528.0 7,238.0 7,388.0 7,526.0 7,507.0 6,838.0 9,152.0 9,202.0Romania (EEUR) 27-Jan-1993 0.0 - - - - 508.1 191.0 30.0 0.0 0.0 0.0 0.0 0.0 0.0 0.0 0.0 0.0 10.0South Africa (AFR) 15-Jan-1990 10,800.0 9,500.0 6,639.0 4,748.0 3,437.0 3,722.0 1,947.0 1,627.0 0.0 0.0 0.0 0.0 0.0 0.0 0.0 -1.0 0.0 542.3Venezuela (Bolivarian Republic of) (LAC) 6-Feb-1989 4,789.8 4,211.2 4,337.8 4,456.8 5,284.5 5,303.1 4,619.9 4,284.9 4,412.8 5,663.0 3,652.0 2,859.1 2,281.0 2,721.7 1,637.4 1,994.4 3,564.7 4,786.9
Subtotal (Article 5 - Annex A, Group I) 56,067.8 69,322.9 53,980.2 57,815.0 70,404.3 88,210.0 111,586.1 115,191.6 100,776.6 109,683.8 100,898.6 97,358.1 80,685.6 74,929.9 67,264.1 66,103.4 62,088.0 108,550.6
TOTAL (Annex A, Group I) 1,072,295.8 1,045,998.1 764,284.0 664,310.4 590,809.1 506,030.5 338,462.4 253,767.9 151,617.0 158,754.5 146,831.9 146,779.8 133,041.1 100,960.6 93,917.9 82,811.1 70,153.4 1,124,778.6
* Party has never reported production but its calculated production is non-zero for one or more years.
Maximum BDN production allowance for Parties that have reported pursuant to Article 2A, paragraphs 6-9*
Non-Article 5 Parties 2005 2006 2007 2008 2009 2010Canada (WEUR) 166.7 166.7 50.0 50.0 50.0 0.0France (WEUR EC) 166.7 166.7 50.0 50.0 50.0 0.0Greece (WEUR EC) 730.0 730.0 219.0 219.0 219.0 0.0Italy (WEUR EC) 3,205.7 3,205.7 961.7 961.7 961.7 0.0Japan (ASIA) 1,673.5 1,673.5 502.1 502.1 502.1 0.0Netherlands (WEUR EC) 4,879.2 4,879.2 1,463.8 1,463.8 1,463.8 0.0Russian Federation (EEUR CEIT) 648.8 648.8 194.6 194.6 194.6 0.0Spain (WEUR EC) 5,528.0 5,528.0 1,658.4 1,658.4 1,658.4 0.0United Kingdom of Great Britain and Northern Ireland (WEUR EC) 6,176.8 6,176.8 1,853.0 1,853.0 1,853.0 0.0
United States of America (WEUR) 11,704.8 11,704.8 3,511.4 3,511.4 3,511.4 0.0Subtotal (Non-Article 5 - Annex A, Group I) 34,880.2 34,880.2 10,464.0 10,464.0 10,464.0 0.0* This information is being provided for the assistance of the Parties because it could not be derived from other data included in this
report.
Information on CFC Production Sector Agreements with the Multilateral Fund The following table includes information taken from Executive Committee agreements as included in reports of the Executive Committee. The information outlines the agreement of related countries to limit their production of CFCs to the levels indicated in the table in the specified years. This table is provided for information only, and is current to October 2005.
Article 5 Parties 2005 2006 2007 2008 2009 2010 Argentina (LAC) 1,647 1,647 686 686 686 0* China (ASIA) 18,750 13,500 7,400** 550 550 0* Democratic People's Republic of Korea (ASIA) 0 0 0 0 0 0 India (ASIA) 11,294 7,342 3,389 2,259 1,130 0* Mexico (LAC) 5,262*** 0 0 0 0 0* Venezuela (Bolivarian Republic of) (LAC) 2,913 2,913 0 0 0 0 Subtotal (Article 5 - Annex A, Group I) 39,866 25,402 11,475 3,495 2,366 0 * Save for any CFC production that might be agreed by the parties to meet essential uses for the stated Party. ** Production level based on Montreal Protocol plus 10% allowed for basic domestic needs. *** In its agreement with the Executive Committee, Mexico agreed to produce not more then 22,000 ODP tonnes of CFCs during the
years 2003, 2004, and 2005 combined, In fact, Mexico closed its CFC production facility in September of 2005 - and the 5,262 included in the table for 2005 above is indicative only, and represents the maximum remaining production allowable in 2005 consistent with the agreement.
NB: Production in Brazil ceased in 2000 without assistance from the Multilateral Fund.
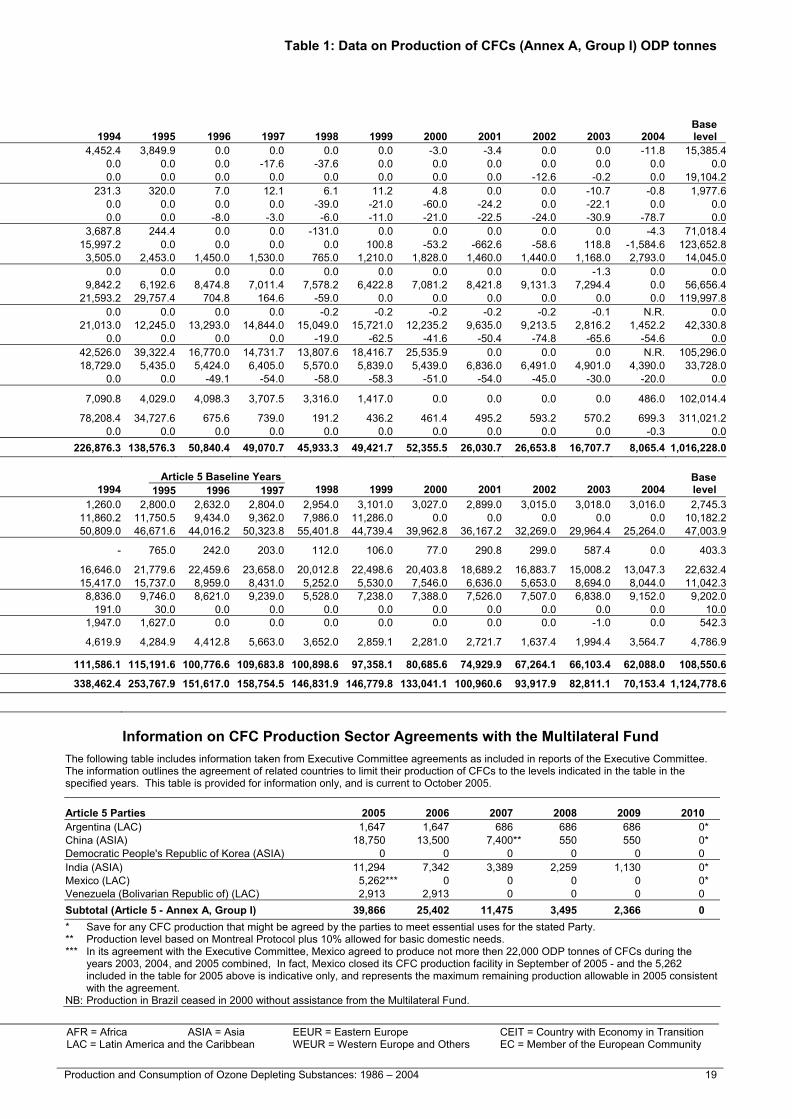
Table 1: Data on Production of CFCs (Annex A, Group I) ODP tonnes
N.R. Not reported: is used where Parties are required to report but have not done so. AFR = Africa ASIA = Asia EEUR = Eastern Europe CEIT = Country with Economy in Transition – Hyphen: is used where Parties have not reported and are not required to report. LAC = Latin America and the Caribbean WEUR = Western Europe and Others EC = Member of the European Community NB: Figures are rounded to a uniform number of decimal places.
18 Production and Consumption of Ozone Depleting Substances: 1986 - 2004 Production and Consumption of Ozone Depleting Substances: 1986 – 2004 19
Table 1: Data on Production of CFCs (Annex A, Group I) ODP tonnes
Non-Article 5 Parties Ratification date:
Montreal ProtocolBase Year
1986 1989 1990 1991 1992 1993 1994 1995 1996 1997 1998 1999 2000 2001 2002 2003 2004Baselevel
Australia (WEUR) 19-May-1989 15,385.4 17,613.0 8,263.0 7,485.4 6,752.6 6,644.0 4,452.4 3,849.9 0.0 0.0 0.0 0.0 -3.0 -3.4 0.0 0.0 -11.8 15,385.4Belgium* (WEUR EC) 30-Dec-1988 0.0 0.0 0.0 0.0 0.0 0.0 0.0 0.0 0.0 -17.6 -37.6 0.0 0.0 0.0 0.0 0.0 0.0 0.0Canada (WEUR) 30-Jun-1988 19,104.2 17,895.4 11,959.2 8,330.0 13,694.0 1,135.0 0.0 0.0 0.0 0.0 0.0 0.0 0.0 0.0 -12.6 -0.2 0.0 19,104.2Czech Republic (EEUR CEIT EC) 1-Jan-1993 1,977.6 2,122.2 - - - 897.3 231.3 320.0 7.0 12.1 6.1 11.2 4.8 0.0 0.0 -10.7 -0.8 1,977.6Denmark* (WEUR EC) 16-Dec-1988 0.0 0.0 0.0 0.0 0.0 0.0 0.0 0.0 0.0 0.0 -39.0 -21.0 -60.0 -24.2 0.0 -22.1 0.0 0.0Finland* (WEUR EC) 23-Dec-1988 0.0 0.0 0.0 0.0 0.0 0.0 0.0 0.0 -8.0 -3.0 -6.0 -11.0 -21.0 -22.5 -24.0 -30.9 -78.7 0.0France (WEUR EC) 28-Dec-1988 71,018.4 55,205.6 38,988.8 22,896.0 3,756.8 3,061.2 3,687.8 244.4 0.0 0.0 -131.0 0.0 0.0 0.0 0.0 0.0 -4.3 71,018.4Germany (WEUR EC) 16-Dec-1988 123,652.8 104,095.8 78,470.0 63,400.6 57,698.0 51,258.4 15,997.2 0.0 0.0 0.0 0.0 100.8 -53.2 -662.6 -58.6 118.8 -1,584.6 123,652.8Greece (WEUR EC) 29-Dec-1988 14,045.0 12,372.0 8,559.0 11,397.0 12,635.0 11,667.0 3,505.0 2,453.0 1,450.0 1,530.0 765.0 1,210.0 1,828.0 1,460.0 1,440.0 1,168.0 2,793.0 14,045.0Hungary* (EEUR CEIT EC) 20-Apr-1989 0.0 0.0 0.0 0.0 0.0 0.0 0.0 0.0 0.0 0.0 0.0 0.0 0.0 0.0 0.0 -1.3 0.0 0.0Italy (WEUR EC) 16-Dec-1988 56,656.4 48,840.2 36,394.8 35,087.4 40,996.8 36,035.6 9,842.2 6,192.6 8,474.8 7,011.4 7,578.2 6,422.8 7,081.2 8,421.8 9,131.3 7,294.4 0.0 56,656.4Japan (ASIA) 30-Sep-1988 119,997.8 146,744.2 109,311.4 99,361.6 65,670.0 51,213.8 21,593.2 29,757.4 704.8 164.6 -59.0 0.0 0.0 0.0 0.0 0.0 0.0 119,997.8Liechtenstein* (WEUR) 8-Feb-1989 0.0 0.0 0.0 0.0 0.0 0.0 0.0 0.0 0.0 0.0 -0.2 -0.2 -0.2 -0.2 -0.2 -0.1 N.R. 0.0Netherlands (WEUR EC) 16-Dec-1988 42,330.8 41,293.6 33,288.0 22,432.0 30,777.2 34,712.6 21,013.0 12,245.0 13,293.0 14,844.0 15,049.0 15,721.0 12,235.2 9,635.0 9,213.5 2,816.2 1,452.2 42,330.8Norway* (WEUR) 24-Jun-1988 0.0 0.0 0.0 0.0 0.0 0.0 0.0 0.0 0.0 0.0 -19.0 -62.5 -41.6 -50.4 -74.8 -65.6 -54.6 0.0Russian Federation (EEUR CEIT) 10-Nov-1988 105,296.0 105,046.0 103,696.0 84,289.0 62,127.4 40,580.4 42,526.0 39,322.4 16,770.0 14,731.7 13,807.6 18,416.7 25,535.9 0.0 0.0 0.0 N.R. 105,296.0Spain (WEUR EC) 16-Dec-1988 33,728.0 30,833.4 23,596.4 25,292.2 30,752.0 27,172.6 18,729.0 5,435.0 5,424.0 6,405.0 5,570.0 5,839.0 5,439.0 6,836.0 6,491.0 4,901.0 4,390.0 33,728.0Switzerland* (WEUR) 28-Dec-1988 0.0 0.0 0.0 0.0 0.0 0.0 0.0 0.0 -49.1 -54.0 -58.0 -58.3 -51.0 -54.0 -45.0 -30.0 -20.0 0.0United Kingdom of Great Britain and Northern Ireland (WEUR EC) 16-Dec-1988 102,014.4 74,177.6 58,080.6 54,360.0 42,815.0 25,730.8 7,090.8 4,029.0 4,098.3 3,707.5 3,316.0 1,417.0 0.0 0.0 0.0 0.0 486.0 102,014.4
United States of America (WEUR) 21-Apr-1988 311,021.2 320,436.2 199,696.6 172,164.2 152,730.0 127,711.8 78,208.4 34,727.6 675.6 739.0 191.2 436.2 461.4 495.2 593.2 570.2 699.3 311,021.2Uzbekistan* (EEUR CEIT) 18-May-1993 0.0 0.0 - - - 0.0 0.0 0.0 0.0 0.0 0.0 0.0 0.0 0.0 0.0 0.0 -0.3 0.0Subtotal (Non-Article 5 - Annex A, Group I) 1,016,228.0 976,675.2 710,303.8 606,495.4 520,404.8 417,820.5 226,876.3 138,576.3 50,840.4 49,070.7 45,933.3 49,421.7 52,355.5 26,030.7 26,653.8 16,707.7 8,065.4 1,016,228.0
Article 5 Baseline YearsArticle 5 Parties
Ratification date: Montreal Protocol
Base Year 1986 1989 1990 1991 1992 1993 1994 1995 1996 1997 1998 1999 2000 2001 2002 2003 2004
Baselevel
Argentina (LAC) 18-Sep-1990 5,574.0 2,960.0 3,201.0 3,257.0 1,650.0 1,536.0 1,260.0 2,800.0 2,632.0 2,804.0 2,954.0 3,101.0 3,027.0 2,899.0 3,015.0 3,018.0 3,016.0 2,745.3Brazil (LAC) 19-Mar-1990 10,218.0 9,109.7 8,538.8 9,551.4 9,345.0 13,012.0 11,860.2 11,750.5 9,434.0 9,362.0 7,986.0 11,286.0 0.0 0.0 0.0 0.0 0.0 10,182.2China (ASIA) 14-Jun-1991 11,540.0 20,700.0 20,687.6 26,017.8 24,941.0 31,658.0 50,809.0 46,671.6 44,016.2 50,323.8 55,401.8 44,739.4 39,962.8 36,167.2 32,269.0 29,964.4 25,264.0 47,003.9Democratic People's Republic of Korea (ASIA) 24-Jan-1995 930.0 930.0 - - - - - 765.0 242.0 203.0 112.0 106.0 77.0 290.8 299.0 587.4 0.0 403.3
India (ASIA) 19-Jun-1992 2,202.0 4,317.0 0.0 0.0 6,096.8 11,438.8 16,646.0 21,779.6 22,459.6 23,658.0 20,012.8 22,498.6 20,403.8 18,689.2 16,883.7 15,008.2 13,047.3 22,632.4Mexico (LAC) 31-Mar-1988 8,609.0 9,346.0 10,576.0 9,784.0 9,964.0 12,525.0 15,417.0 15,737.0 8,959.0 8,431.0 5,252.0 5,530.0 7,546.0 6,636.0 5,653.0 8,694.0 8,044.0 11,042.3Republic of Korea (ASIA) 27-Feb-1992 1,405.0 8,249.0 - - 9,686.0 8,507.0 8,836.0 9,746.0 8,621.0 9,239.0 5,528.0 7,238.0 7,388.0 7,526.0 7,507.0 6,838.0 9,152.0 9,202.0Romania (EEUR) 27-Jan-1993 0.0 - - - - 508.1 191.0 30.0 0.0 0.0 0.0 0.0 0.0 0.0 0.0 0.0 0.0 10.0South Africa (AFR) 15-Jan-1990 10,800.0 9,500.0 6,639.0 4,748.0 3,437.0 3,722.0 1,947.0 1,627.0 0.0 0.0 0.0 0.0 0.0 0.0 0.0 -1.0 0.0 542.3Venezuela (Bolivarian Republic of) (LAC) 6-Feb-1989 4,789.8 4,211.2 4,337.8 4,456.8 5,284.5 5,303.1 4,619.9 4,284.9 4,412.8 5,663.0 3,652.0 2,859.1 2,281.0 2,721.7 1,637.4 1,994.4 3,564.7 4,786.9
Subtotal (Article 5 - Annex A, Group I) 56,067.8 69,322.9 53,980.2 57,815.0 70,404.3 88,210.0 111,586.1 115,191.6 100,776.6 109,683.8 100,898.6 97,358.1 80,685.6 74,929.9 67,264.1 66,103.4 62,088.0 108,550.6
TOTAL (Annex A, Group I) 1,072,295.8 1,045,998.1 764,284.0 664,310.4 590,809.1 506,030.5 338,462.4 253,767.9 151,617.0 158,754.5 146,831.9 146,779.8 133,041.1 100,960.6 93,917.9 82,811.1 70,153.4 1,124,778.6
* Party has never reported production but its calculated production is non-zero for one or more years.
Maximum BDN production allowance for Parties that have reported pursuant to Article 2A, paragraphs 6-9*
Non-Article 5 Parties 2005 2006 2007 2008 2009 2010Canada (WEUR) 166.7 166.7 50.0 50.0 50.0 0.0France (WEUR EC) 166.7 166.7 50.0 50.0 50.0 0.0Greece (WEUR EC) 730.0 730.0 219.0 219.0 219.0 0.0Italy (WEUR EC) 3,205.7 3,205.7 961.7 961.7 961.7 0.0Japan (ASIA) 1,673.5 1,673.5 502.1 502.1 502.1 0.0Netherlands (WEUR EC) 4,879.2 4,879.2 1,463.8 1,463.8 1,463.8 0.0Russian Federation (EEUR CEIT) 648.8 648.8 194.6 194.6 194.6 0.0Spain (WEUR EC) 5,528.0 5,528.0 1,658.4 1,658.4 1,658.4 0.0United Kingdom of Great Britain and Northern Ireland (WEUR EC) 6,176.8 6,176.8 1,853.0 1,853.0 1,853.0 0.0
United States of America (WEUR) 11,704.8 11,704.8 3,511.4 3,511.4 3,511.4 0.0Subtotal (Non-Article 5 - Annex A, Group I) 34,880.2 34,880.2 10,464.0 10,464.0 10,464.0 0.0* This information is being provided for the assistance of the Parties because it could not be derived from other data included in this
report.
Information on CFC Production Sector Agreements with the Multilateral Fund The following table includes information taken from Executive Committee agreements as included in reports of the Executive Committee. The information outlines the agreement of related countries to limit their production of CFCs to the levels indicated in the table in the specified years. This table is provided for information only, and is current to October 2005.
Article 5 Parties 2005 2006 2007 2008 2009 2010 Argentina (LAC) 1,647 1,647 686 686 686 0* China (ASIA) 18,750 13,500 7,400** 550 550 0* Democratic People's Republic of Korea (ASIA) 0 0 0 0 0 0 India (ASIA) 11,294 7,342 3,389 2,259 1,130 0* Mexico (LAC) 5,262*** 0 0 0 0 0* Venezuela (Bolivarian Republic of) (LAC) 2,913 2,913 0 0 0 0 Subtotal (Article 5 - Annex A, Group I) 39,866 25,402 11,475 3,495 2,366 0 * Save for any CFC production that might be agreed by the parties to meet essential uses for the stated Party. ** Production level based on Montreal Protocol plus 10% allowed for basic domestic needs. *** In its agreement with the Executive Committee, Mexico agreed to produce not more then 22,000 ODP tonnes of CFCs during the
years 2003, 2004, and 2005 combined, In fact, Mexico closed its CFC production facility in September of 2005 - and the 5,262 included in the table for 2005 above is indicative only, and represents the maximum remaining production allowable in 2005 consistent with the agreement.
NB: Production in Brazil ceased in 2000 without assistance from the Multilateral Fund.

Table 2: Data on Production of Halons (Annex A, Group II) ODP tonnes
N.R. Not reported: is used where Parties are required to report but have not done so. AFR = Africa ASIA = Asia EEUR = Eastern Europe CEIT = Country with Economy in Transition – Hyphen: is used where Parties have not reported and are not required to report. LAC = Latin America and the Caribbean WEUR = Western Europe and Others EC = Member of the European Community NB: Figures are rounded to a uniform number of decimal places.
20 Production and Consumption of Ozone Depleting Substances: 1986 - 2004 Production and Consumption of Ozone Depleting Substances: 1986 – 2004 21
Table 2: Data on Production of Halons (Annex A, Group II) ODP tonnes
Non-Article 5 Parties Ratification date:
Montreal ProtocolBase Year
1986 1989 1990 1991 1992 1993 1994 1995 1996 1997 1998 1999 2000 2001 2002 2003 2004Baselevel
Australia* (WEUR) 19-May-1989 0.0 0.0 0.0 0.0 0.0 0.0 0.0 0.0 0.0 0.0 -19.5 0.0 -11.7 -3.3 -3.9 0.0 -33.0 0.0Belgium* (WEUR EC) 30-Dec-1988 0.0 0.0 0.0 0.0 0.0 0.0 0.0 0.0 0.0 0.0 -7.4 0.0 0.0 0.0 0.0 0.0 0.0 0.0Finland* (WEUR EC) 23-Dec-1988 0.0 0.0 0.0 0.0 0.0 0.0 0.0 0.0 -3.0 -60.0 -30.0 -290.0 -500.0 -220.0 -84.0 -12.0 -25.0 0.0France (WEUR EC) 28-Dec-1988 34,465.0 38,443.0 23,776.0 32,248.0 23,216.0 20,840.0 0.0 0.0 0.0 0.0 0.0 0.0 0.0 0.0 0.0 0.0 0.0 34,465.0Germany (WEUR EC) 16-Dec-1988 18,134.0 17,803.0 15,910.0 12,551.0 0.0 0.0 0.0 0.0 0.0 0.0 0.0 0.0 0.0 0.0 0.0 0.0 0.0 18,134.0Italy (WEUR EC) 16-Dec-1988 2,094.0 0.0 0.0 0.0 0.0 0.0 0.0 0.0 0.0 0.0 0.0 0.0 0.0 0.0 0.0 0.0 0.0 2,094.0Japan (ASIA) 30-Sep-1988 28,419.0 26,556.0 28,131.0 30,470.0 20,140.0 9,290.0 0.0 0.0 0.0 0.0 0.0 0.0 0.0 0.0 0.0 0.0 0.0 28,419.0Netherlands* (WEUR EC) 16-Dec-1988 0.0 0.0 0.0 0.0 0.0 0.0 0.0 0.0 0.0 0.0 0.0 0.0 0.0 0.0 0.0 -2,814.8 -2,582.0 0.0Norway* (WEUR) 24-Jun-1988 0.0 0.0 0.0 0.0 0.0 0.0 0.0 0.0 0.0 0.0 0.0 0.0 0.0 0.0 0.0 -13.0 -20.6 0.0Russian Federation (EEUR CEIT) 10-Nov-1988 27,800.0 15,240.0 27,800.0 11,450.0 8,996.0 2,550.0 1,446.0 1,086.0 912.0 1,152.6 534.7 553.8 1,782.0 0.0 0.0 0.0 N.R. 27,800.0United Kingdom of Great Britain and Northern Ireland (WEUR EC) 16-Dec-1988 16,500.0 15,291.0 15,036.0 11,205.0 12,402.0 4,182.0 0.0 0.0 0.0 0.0 0.0 0.0 0.0 0.0 0.0 0.0 0.0 16,500.0
United States of America (WEUR) 21-Apr-1988 58,756.0 61,229.0 51,401.0 41,565.0 25,843.0 18,915.0 0.0 0.0 0.0 0.0 0.0 0.0 0.0 0.0 0.0 0.0 0.0 58,756.0Subtotal (Non-Article 5 - Annex A, Group II) 186,168.0 174,562.0 162,054.0 139,489.0 90,597.0 55,777.0 1,446.0 1,086.0 909.0 1,092.6 477.8 263.8 1,270.3 -223.3 -87.9 -2,839.8 -2660.6 186,168.0
Article 5 Baseline YearsArticle 5 Parties
Ratification date: Montreal Protocol
Base Year 1986 1989 1990 1991 1992 1993 1994 1995 1996 1997 1998 1999 2000 2001 2002 2003 2004
Baselevel
China (ASIA) 14-Jun-1991 11,200.0 10,600.0 10,800.0 10,800.0 11,000.0 12,400.0 21,550.0 37,514.0 40,269.0 45,196.0 28,020.0 22,732.0 16,214.0 11,484.0 7,408.1 5,653.4 3,423.6 40,993.0Democratic People's Republic of Korea (ASIA) 24-Jan-1995 90.0 90.0 - - - - - 0.0 0.0 0.0 0.0 0.0 0.0 0.0 0.0 0.0 0.0 0.0
India (ASIA) 19-Jun-1992 0.0 - 0.0 0.0 348.0 261.0 396.0 241.0 305.0 320.5 0.0 0.0 0.0 0.0 0.0 0.0 0.0 288.8Republic of Korea (ASIA) 27-Feb-1992 0.0 - - - 3,050.0 2,751.0 3,074.0 3,400.0 3,684.0 3,950.0 2,162.0 2,196.0 2,861.0 2,399.0 2,187.0 2,260.0 1,408.0 3,678.0Subtotal (Article 5 - Annex A, Group II) 11,290.0 10,690.0 10,800.0 10,800.0 14,398.0 15,412.0 25,020.0 41,155.0 44,258.0 49,466.5 30,182.0 24,928.0 19,075.0 13,883.0 9,595.1 7,913.4 4,831.6 44,959.8
TOTAL (Annex A, Group II) 197,458.0 185,252.0 172,854.0 150,289.0 104,995.0 71,189.0 26,466.0 42,241.0 45,167.0 50,559.1 30,659.8 25,191.8 20,345.3 13,659.7 9,507.2 5,073.6 2,171.0 231,127.8
* Party has never reported production but its calculated production is non-zero for one or more years.
Maximum BDN production allowance for Parties that have reported pursuant to Article 2B, paragraphs 3-4*
Non-Article 5 Parties 2005 2006 2007 2008 2009 2010Russian Federation (EEUR CEIT) 39.0 39.0 39.0 39.0 39.0 0.0* This information is being provided for the assistance of the Parties because it could not be derived from other data included in this
report.

Table 2: Data on Production of Halons (Annex A, Group II) ODP tonnes
N.R. Not reported: is used where Parties are required to report but have not done so. AFR = Africa ASIA = Asia EEUR = Eastern Europe CEIT = Country with Economy in Transition – Hyphen: is used where Parties have not reported and are not required to report. LAC = Latin America and the Caribbean WEUR = Western Europe and Others EC = Member of the European Community NB: Figures are rounded to a uniform number of decimal places.
20 Production and Consumption of Ozone Depleting Substances: 1986 - 2004 Production and Consumption of Ozone Depleting Substances: 1986 – 2004 21
Table 2: Data on Production of Halons (Annex A, Group II) ODP tonnes
Non-Article 5 Parties Ratification date:
Montreal ProtocolBase Year
1986 1989 1990 1991 1992 1993 1994 1995 1996 1997 1998 1999 2000 2001 2002 2003 2004Baselevel
Australia* (WEUR) 19-May-1989 0.0 0.0 0.0 0.0 0.0 0.0 0.0 0.0 0.0 0.0 -19.5 0.0 -11.7 -3.3 -3.9 0.0 -33.0 0.0Belgium* (WEUR EC) 30-Dec-1988 0.0 0.0 0.0 0.0 0.0 0.0 0.0 0.0 0.0 0.0 -7.4 0.0 0.0 0.0 0.0 0.0 0.0 0.0Finland* (WEUR EC) 23-Dec-1988 0.0 0.0 0.0 0.0 0.0 0.0 0.0 0.0 -3.0 -60.0 -30.0 -290.0 -500.0 -220.0 -84.0 -12.0 -25.0 0.0France (WEUR EC) 28-Dec-1988 34,465.0 38,443.0 23,776.0 32,248.0 23,216.0 20,840.0 0.0 0.0 0.0 0.0 0.0 0.0 0.0 0.0 0.0 0.0 0.0 34,465.0Germany (WEUR EC) 16-Dec-1988 18,134.0 17,803.0 15,910.0 12,551.0 0.0 0.0 0.0 0.0 0.0 0.0 0.0 0.0 0.0 0.0 0.0 0.0 0.0 18,134.0Italy (WEUR EC) 16-Dec-1988 2,094.0 0.0 0.0 0.0 0.0 0.0 0.0 0.0 0.0 0.0 0.0 0.0 0.0 0.0 0.0 0.0 0.0 2,094.0Japan (ASIA) 30-Sep-1988 28,419.0 26,556.0 28,131.0 30,470.0 20,140.0 9,290.0 0.0 0.0 0.0 0.0 0.0 0.0 0.0 0.0 0.0 0.0 0.0 28,419.0Netherlands* (WEUR EC) 16-Dec-1988 0.0 0.0 0.0 0.0 0.0 0.0 0.0 0.0 0.0 0.0 0.0 0.0 0.0 0.0 0.0 -2,814.8 -2,582.0 0.0Norway* (WEUR) 24-Jun-1988 0.0 0.0 0.0 0.0 0.0 0.0 0.0 0.0 0.0 0.0 0.0 0.0 0.0 0.0 0.0 -13.0 -20.6 0.0Russian Federation (EEUR CEIT) 10-Nov-1988 27,800.0 15,240.0 27,800.0 11,450.0 8,996.0 2,550.0 1,446.0 1,086.0 912.0 1,152.6 534.7 553.8 1,782.0 0.0 0.0 0.0 N.R. 27,800.0United Kingdom of Great Britain and Northern Ireland (WEUR EC) 16-Dec-1988 16,500.0 15,291.0 15,036.0 11,205.0 12,402.0 4,182.0 0.0 0.0 0.0 0.0 0.0 0.0 0.0 0.0 0.0 0.0 0.0 16,500.0
United States of America (WEUR) 21-Apr-1988 58,756.0 61,229.0 51,401.0 41,565.0 25,843.0 18,915.0 0.0 0.0 0.0 0.0 0.0 0.0 0.0 0.0 0.0 0.0 0.0 58,756.0Subtotal (Non-Article 5 - Annex A, Group II) 186,168.0 174,562.0 162,054.0 139,489.0 90,597.0 55,777.0 1,446.0 1,086.0 909.0 1,092.6 477.8 263.8 1,270.3 -223.3 -87.9 -2,839.8 -2660.6 186,168.0
Article 5 Baseline YearsArticle 5 Parties
Ratification date: Montreal Protocol
Base Year 1986 1989 1990 1991 1992 1993 1994 1995 1996 1997 1998 1999 2000 2001 2002 2003 2004
Baselevel
China (ASIA) 14-Jun-1991 11,200.0 10,600.0 10,800.0 10,800.0 11,000.0 12,400.0 21,550.0 37,514.0 40,269.0 45,196.0 28,020.0 22,732.0 16,214.0 11,484.0 7,408.1 5,653.4 3,423.6 40,993.0Democratic People's Republic of Korea (ASIA) 24-Jan-1995 90.0 90.0 - - - - - 0.0 0.0 0.0 0.0 0.0 0.0 0.0 0.0 0.0 0.0 0.0
India (ASIA) 19-Jun-1992 0.0 - 0.0 0.0 348.0 261.0 396.0 241.0 305.0 320.5 0.0 0.0 0.0 0.0 0.0 0.0 0.0 288.8Republic of Korea (ASIA) 27-Feb-1992 0.0 - - - 3,050.0 2,751.0 3,074.0 3,400.0 3,684.0 3,950.0 2,162.0 2,196.0 2,861.0 2,399.0 2,187.0 2,260.0 1,408.0 3,678.0Subtotal (Article 5 - Annex A, Group II) 11,290.0 10,690.0 10,800.0 10,800.0 14,398.0 15,412.0 25,020.0 41,155.0 44,258.0 49,466.5 30,182.0 24,928.0 19,075.0 13,883.0 9,595.1 7,913.4 4,831.6 44,959.8
TOTAL (Annex A, Group II) 197,458.0 185,252.0 172,854.0 150,289.0 104,995.0 71,189.0 26,466.0 42,241.0 45,167.0 50,559.1 30,659.8 25,191.8 20,345.3 13,659.7 9,507.2 5,073.6 2,171.0 231,127.8
* Party has never reported production but its calculated production is non-zero for one or more years.
Maximum BDN production allowance for Parties that have reported pursuant to Article 2B, paragraphs 3-4*
Non-Article 5 Parties 2005 2006 2007 2008 2009 2010Russian Federation (EEUR CEIT) 39.0 39.0 39.0 39.0 39.0 0.0* This information is being provided for the assistance of the Parties because it could not be derived from other data included in this
report.

Table 3: Data on Production of Other Fully Halogenated CFCs (Annex B, Group I) ODP tonnes
N.R. Not reported: is used where Parties are required to report but have not done so. AFR = Africa ASIA = Asia EEUR = Eastern Europe CEIT = Country with Economy in Transition – Hyphen: is used where Parties have not reported and are not required to report. LAC = Latin America and the Caribbean WEUR = Western Europe and Others EC = Member of the European Community NB: Figures are rounded to a uniform number of decimal places.
22 Production and Consumption of Ozone Depleting Substances: 1986 - 2004 Production and Consumption of Ozone Depleting Substances: 1986 – 2004 23
Table 3: Data on Production of Other Fully Halogenated CFCs (Annex B, Group I) ODP tonnes
Ratification dates
Non-Article 5 Parties Montreal Protocol
London Amendment
Base Year 1989 1992 1993 1994 1995 1996 1997 1998 1999 2000 2001 2002 2003 2004
Baselevel
Germany (WEUR EC) 16-Dec-1988 27-Dec-1991 61.0 20.0 32.0 13.0 0.0 0.0 0.0 0.0 0.0 0.0 0.0 0.0 0.0 0.0 61.0Italy (WEUR EC) 16-Dec-1988 21-Feb-1992 0.0 0.0 0.0 0.0 0.0 0.0 0.0 0.0 0.0 0.0 0.0 0.0 0.0 0.0 0.0Japan (ASIA) 30-Sep-1988 4-Sep-1991 2,342.0 1,600.0 808.0 136.0 0.0 0.0 0.0 0.0 0.0 0.0 0.0 0.0 0.0 0.0 2,342.0Netherlands (WEUR EC) 16-Dec-1988 20-Dec-1991 23.0 0.0 19.0 0.5 0.0 0.0 0.0 0.0 0.0 0.0 0.0 3.0 -3.0 2.0 23.0Norway* (WEUR) 24-Jun-1988 18-Nov-1991 0.0 0.0 0.0 0.0 0.0 0.0 0.0 0.0 0.0 0.0 -0.1 -1.0 0.0 0.0 0.0Russian Federation (EEUR CEIT) 10-Nov-1988 13-Jan-1992 300.0 17.0 0.6 25.0 25.0 20.0 75.0 13.1 16.5 27.1 0.0 0.0 0.0 N.R. 300.0United Kingdom of Great Britain and Northern Ireland (WEUR EC) 16-Dec-1988 20-Dec-1991 15.0 0.0 0.0 0.0 0.0 0.0 0.0 0.0 0.0 0.0 0.0 0.0 0.0 0.0 15.0
United States of America (WEUR) 21-Apr-1988 18-Dec-1991 577.0 75.0 106.0 101.0 39.0 0.0 0.0 0.0 0.0 0.0 0.0 -1.0 0.0 0.0 577.0Subtotal (Non-Article 5 - Annex B, Group I) 3,318.0 1,712.0 965.6 275.5 64.0 20.0 75.0 13.1 16.5 27.1 -0.1 1.0 -3.0 2.0 3,318.0NB: None of these producers reported any production to meet the basic domestic needs of Article 5 Parties for the base level period, hence
the maximum BDN production allowance is zero for these Parties pursuant to Article 2C, paragraphs 3-5
Ratification dates Article 5 Baseline Years
Article 5 Parties Montreal Protocol
London Amendment
Base Year 1989 1992 1993 1994 1995 1996 1997 1998 1999 2000 2001 2002 2003 2004
Baselevel
Argentina (LAC) 18-Sep-1990 4-Dec-1992 0.0 10.8 0.0 0.0 0.0 0.0 0.0 0.0 0.0 0.0 0.0 0.0 0.0 0.0 0.0China (ASIA) 14-Jun-1991 14-Jun-1991 0.0 0.0 0.0 0.0 35.0 17.0 27.0 26.0 27.0 27.0 27.0 27.0 21.3 20.8 26.7Subtotal (Article 5 - Annex B, Group I) 0.0 10.8 0.0 0.0 35.0 17.0 27.0 26.0 27.0 27.0 27.0 27.0 21.3 20.8 26.7
TOTAL (Annex B, Group I) 3,318.0 1,722.8 965.6 275.5 99.0 37.0 102.0 39.1 43.5 54.1 26.9 28.0 18.3 22.8 3,344.7

Table 3: Data on Production of Other Fully Halogenated CFCs (Annex B, Group I) ODP tonnes
N.R. Not reported: is used where Parties are required to report but have not done so. AFR = Africa ASIA = Asia EEUR = Eastern Europe CEIT = Country with Economy in Transition – Hyphen: is used where Parties have not reported and are not required to report. LAC = Latin America and the Caribbean WEUR = Western Europe and Others EC = Member of the European Community NB: Figures are rounded to a uniform number of decimal places.
22 Production and Consumption of Ozone Depleting Substances: 1986 - 2004 Production and Consumption of Ozone Depleting Substances: 1986 – 2004 23
Table 3: Data on Production of Other Fully Halogenated CFCs (Annex B, Group I) ODP tonnes
Ratification dates
Non-Article 5 Parties Montreal Protocol
London Amendment
Base Year 1989 1992 1993 1994 1995 1996 1997 1998 1999 2000 2001 2002 2003 2004
Baselevel
Germany (WEUR EC) 16-Dec-1988 27-Dec-1991 61.0 20.0 32.0 13.0 0.0 0.0 0.0 0.0 0.0 0.0 0.0 0.0 0.0 0.0 61.0Italy (WEUR EC) 16-Dec-1988 21-Feb-1992 0.0 0.0 0.0 0.0 0.0 0.0 0.0 0.0 0.0 0.0 0.0 0.0 0.0 0.0 0.0Japan (ASIA) 30-Sep-1988 4-Sep-1991 2,342.0 1,600.0 808.0 136.0 0.0 0.0 0.0 0.0 0.0 0.0 0.0 0.0 0.0 0.0 2,342.0Netherlands (WEUR EC) 16-Dec-1988 20-Dec-1991 23.0 0.0 19.0 0.5 0.0 0.0 0.0 0.0 0.0 0.0 0.0 3.0 -3.0 2.0 23.0Norway* (WEUR) 24-Jun-1988 18-Nov-1991 0.0 0.0 0.0 0.0 0.0 0.0 0.0 0.0 0.0 0.0 -0.1 -1.0 0.0 0.0 0.0Russian Federation (EEUR CEIT) 10-Nov-1988 13-Jan-1992 300.0 17.0 0.6 25.0 25.0 20.0 75.0 13.1 16.5 27.1 0.0 0.0 0.0 N.R. 300.0United Kingdom of Great Britain and Northern Ireland (WEUR EC) 16-Dec-1988 20-Dec-1991 15.0 0.0 0.0 0.0 0.0 0.0 0.0 0.0 0.0 0.0 0.0 0.0 0.0 0.0 15.0
United States of America (WEUR) 21-Apr-1988 18-Dec-1991 577.0 75.0 106.0 101.0 39.0 0.0 0.0 0.0 0.0 0.0 0.0 -1.0 0.0 0.0 577.0Subtotal (Non-Article 5 - Annex B, Group I) 3,318.0 1,712.0 965.6 275.5 64.0 20.0 75.0 13.1 16.5 27.1 -0.1 1.0 -3.0 2.0 3,318.0NB: None of these producers reported any production to meet the basic domestic needs of Article 5 Parties for the base level period, hence
the maximum BDN production allowance is zero for these Parties pursuant to Article 2C, paragraphs 3-5
Ratification dates Article 5 Baseline Years
Article 5 Parties Montreal Protocol
London Amendment
Base Year 1989 1992 1993 1994 1995 1996 1997 1998 1999 2000 2001 2002 2003 2004
Baselevel
Argentina (LAC) 18-Sep-1990 4-Dec-1992 0.0 10.8 0.0 0.0 0.0 0.0 0.0 0.0 0.0 0.0 0.0 0.0 0.0 0.0 0.0China (ASIA) 14-Jun-1991 14-Jun-1991 0.0 0.0 0.0 0.0 35.0 17.0 27.0 26.0 27.0 27.0 27.0 27.0 21.3 20.8 26.7Subtotal (Article 5 - Annex B, Group I) 0.0 10.8 0.0 0.0 35.0 17.0 27.0 26.0 27.0 27.0 27.0 27.0 21.3 20.8 26.7
TOTAL (Annex B, Group I) 3,318.0 1,722.8 965.6 275.5 99.0 37.0 102.0 39.1 43.5 54.1 26.9 28.0 18.3 22.8 3,344.7
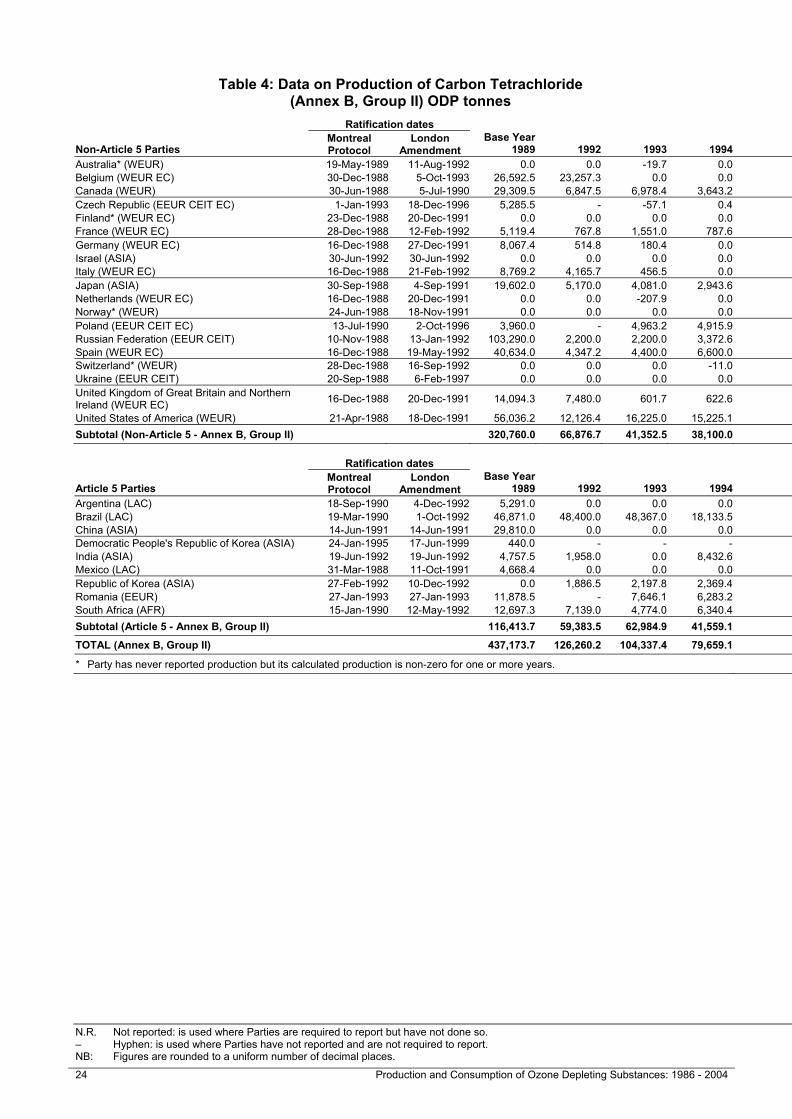
Table 4: Data on Production of Carbon Tetrachloride (Annex B, Group II) ODP tonnes
N.R. Not reported: is used where Parties are required to report but have not done so. AFR = Africa ASIA = Asia EEUR = Eastern Europe CEIT = Country with Economy in Transition – Hyphen: is used where Parties have not reported and are not required to report. LAC = Latin America and the Caribbean WEUR = Western Europe and Others EC = Member of the European Community NB: Figures are rounded to a uniform number of decimal places.
24 Production and Consumption of Ozone Depleting Substances: 1986 - 2004 Production and Consumption of Ozone Depleting Substances: 1986 – 2004 25
Table 4: Data on Production of Carbon Tetrachloride (Annex B, Group II) ODP tonnes
Ratification dates
Non-Article 5 Parties Montreal Protocol
London Amendment
Base Year 1989 1992 1993 1994 1995 1996 1997 1998 1999 2000 2001 2002 2003 2004
Baselevel
Australia* (WEUR) 19-May-1989 11-Aug-1992 0.0 0.0 -19.7 0.0 0.0 0.0 0.0 0.0 0.0 0.0 0.0 0.0 0.0 0.0 0.0Belgium (WEUR EC) 30-Dec-1988 5-Oct-1993 26,592.5 23,257.3 0.0 0.0 0.0 0.0 0.0 0.0 0.0 0.0 0.0 0.0 0.0 0.0 26,592.5Canada (WEUR) 30-Jun-1988 5-Jul-1990 29,309.5 6,847.5 6,978.4 3,643.2 2,553.1 0.0 0.0 0.0 0.0 0.0 0.0 -0.9 -0.2 0.0 29,309.5Czech Republic (EEUR CEIT EC) 1-Jan-1993 18-Dec-1996 5,285.5 - -57.1 0.4 0.6 0.0 6.1 44.4 12.1 -81.4 0.0 132.0 94.6 0.0 5,285.5Finland* (WEUR EC) 23-Dec-1988 20-Dec-1991 0.0 0.0 0.0 0.0 0.0 -14.3 0.0 0.0 0.0 0.0 0.0 0.0 0.0 0.0 0.0France (WEUR EC) 28-Dec-1988 12-Feb-1992 5,119.4 767.8 1,551.0 787.6 983.4 506.0 692.1 737.0 -89.1 1,051.6 -228.8 180.4 147.4 -2,677.4 5,119.4Germany (WEUR EC) 16-Dec-1988 27-Dec-1991 8,067.4 514.8 180.4 0.0 0.0 0.0 -369.6 -576.4 0.0 339.9 548.9 -770.0 105.6 -1,338.7 8,067.4Israel (ASIA) 30-Jun-1992 30-Jun-1992 0.0 0.0 0.0 0.0 0.0 0.0 0.0 0.0 0.0 0.0 0.0 0.0 0.0 0.0 0.0Italy (WEUR EC) 16-Dec-1988 21-Feb-1992 8,769.2 4,165.7 456.5 0.0 0.0 0.0 341.0 0.0 828.3 0.0 0.0 0.0 0.0 0.0 8,769.2Japan (ASIA) 30-Sep-1988 4-Sep-1991 19,602.0 5,170.0 4,081.0 2,943.6 2,462.9 539.0 40.7 34.1 38.5 23.1 35.2 33.0 31.0 20.8 19,602.0Netherlands (WEUR EC) 16-Dec-1988 20-Dec-1991 0.0 0.0 -207.9 0.0 -1,131.9 -1,898.6 158.4 887.7 116.6 64.9 -192.5 155.1 -5.5 -4.4 0.0Norway* (WEUR) 24-Jun-1988 18-Nov-1991 0.0 0.0 0.0 0.0 0.0 0.0 0.0 0.0 0.0 0.0 0.0 0.0 0.0 -28.1 0.0Poland (EEUR CEIT EC) 13-Jul-1990 2-Oct-1996 3,960.0 - 4,963.2 4,915.9 - 9.0 0.0 0.0 0.0 0.0 0.0 0.0 0.0 0.0 3,960.0Russian Federation (EEUR CEIT) 10-Nov-1988 13-Jan-1992 103,290.0 2,200.0 2,200.0 3,372.6 2,735.2 743.6 0.0 33.0 346.6 0.0 0.0 -6.4 40.4 N.R. 103,290.0Spain (WEUR EC) 16-Dec-1988 19-May-1992 40,634.0 4,347.2 4,400.0 6,600.0 0.0 0.0 0.0 0.0 0.0 0.0 8,121.3 867.9 0.0 -297.0 40,634.0Switzerland* (WEUR) 28-Dec-1988 16-Sep-1992 0.0 0.0 0.0 -11.0 -11.0 0.0 0.0 0.0 0.0 0.0 0.0 0.0 0.0 0.0 0.0Ukraine (EEUR CEIT) 20-Sep-1988 6-Feb-1997 0.0 0.0 0.0 0.0 16.5 3.3 -2,178.6 2,820.7 0.0 0.0 0.0 0.0 0.0 0.0 0.0United Kingdom of Great Britain and Northern Ireland (WEUR EC) 16-Dec-1988 20-Dec-1991 14,094.3 7,480.0 601.7 622.6 0.0 7.7 0.0 0.0 0.0 0.0 0.0 0.0 0.0 0.0 14,094.3
United States of America (WEUR) 21-Apr-1988 18-Dec-1991 56,036.2 12,126.4 16,225.0 15,225.1 8,932.0 11.0 14.3 1.1 18.7 2.2 2,798.4 -2,182.4 -568.7 12.0 56,036.2Subtotal (Non-Article 5 - Annex B, Group II) 320,760.0 66,876.7 41,352.5 38,100.0 16,540.8 -93.3 -1,295.6 3,981.6 1,271.7 1,400.3 11,082.5 -1,591.3 -155.4 -4,312.8 320,760.0
Ratification dates Article 5 Baseline Years
Article 5 Parties Montreal Protocol
London Amendment
Base Year 1989 1992 1993 1994 1995 1996 1997 1998 1999 2000 2001 2002 2003 2004
Baselevel
Argentina (LAC) 18-Sep-1990 4-Dec-1992 5,291.0 0.0 0.0 0.0 0.0 0.0 0.0 0.0 0.0 0.0 0.0 0.0 0.0 0.0 0.0Brazil (LAC) 19-Mar-1990 1-Oct-1992 46,871.0 48,400.0 48,367.0 18,133.5 11,462.0 15,646.4 -1,245.2 16,525.3 11,350.9 7,012.5 4,726.8 188.9 3,624.5 3,060.2 11,629.6China (ASIA) 14-Jun-1991 14-Jun-1991 29,810.0 0.0 0.0 0.0 0.0 0.0 0.0 35,090.0 0.0 53,012.3 15,633.2 3,311.0 20,020.3 3,885.8 29,367.4Democratic People's Republic of Korea (ASIA) 24-Jan-1995 17-Jun-1999 440.0 - - - 374.0 1,232.0 1,309.0 1,424.5 1,386.0 1,045.0 2,077.9 2,027.3 1,585.2 2,198.9 1,285.2India (ASIA) 19-Jun-1992 19-Jun-1992 4,757.5 1,958.0 0.0 8,432.6 0.0 0.0 7,876.0 6,614.4 15,896.9 12,147.3 9,318.1 10,461.0 10,778.3 7,459.1 11,552.9Mexico (LAC) 31-Mar-1988 11-Oct-1991 4,668.4 0.0 0.0 0.0 0.0 0.0 0.0 0.0 0.0 0.0 0.0 0.0 0.0 0.0 0.0Republic of Korea (ASIA) 27-Feb-1992 10-Dec-1992 0.0 1,886.5 2,197.8 2,369.4 0.0 0.0 -2,173.6 -564.3 210.1 2,108.7 308.0 2,284.7 796.4 -291.5 584.8Romania (EEUR) 27-Jan-1993 27-Jan-1993 11,878.5 - 7,646.1 6,283.2 4,665.1 2,878.7 -198.6 1,949.2 -684.8 -149.8 36.7 -29.8 200.0 176.0 371.5South Africa (AFR) 15-Jan-1990 12-May-1992 12,697.3 7,139.0 4,774.0 6,340.4 4,931.3 0.0 0.0 0.0 0.0 0.0 0.0 0.0 0.0 0.0 0.0Subtotal (Article 5 - Annex B, Group II) 116,413.7 59,383.5 62,984.9 41,559.1 21,432.4 19,757.1 5,567.6 61,039.1 28,159.1 75,176.0 32,100.7 18,243.1 37,004.7 16,488.5 54,791.4
TOTAL (Annex B, Group II) 437,173.7 126,260.2 104,337.4 79,659.1 37,973.2 19,663.8 4,272.0 65,020.7 29,430.8 76,576.3 43,183.2 16,651.8 36,849.3 12,175.7 375,551.4
* Party has never reported production but its calculated production is non-zero for one or more years.
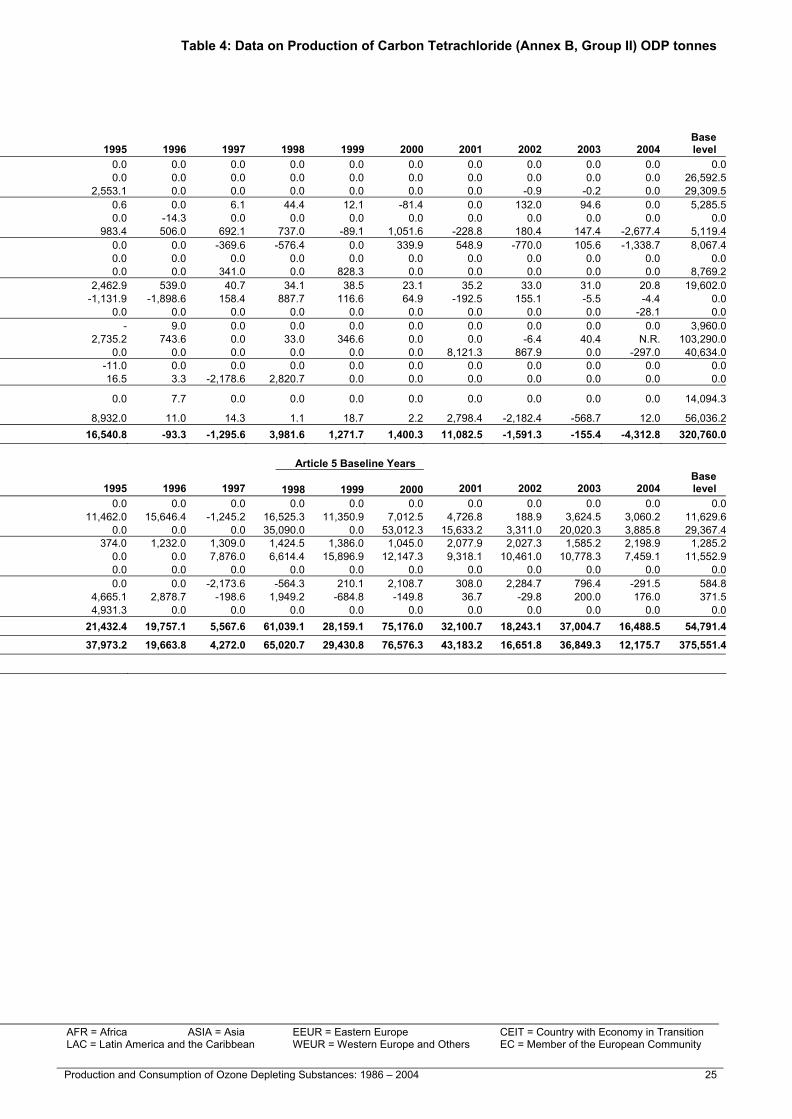
Table 4: Data on Production of Carbon Tetrachloride (Annex B, Group II) ODP tonnes
N.R. Not reported: is used where Parties are required to report but have not done so. AFR = Africa ASIA = Asia EEUR = Eastern Europe CEIT = Country with Economy in Transition – Hyphen: is used where Parties have not reported and are not required to report. LAC = Latin America and the Caribbean WEUR = Western Europe and Others EC = Member of the European Community NB: Figures are rounded to a uniform number of decimal places.
24 Production and Consumption of Ozone Depleting Substances: 1986 - 2004 Production and Consumption of Ozone Depleting Substances: 1986 – 2004 25
Table 4: Data on Production of Carbon Tetrachloride (Annex B, Group II) ODP tonnes
Ratification dates
Non-Article 5 Parties Montreal Protocol
London Amendment
Base Year 1989 1992 1993 1994 1995 1996 1997 1998 1999 2000 2001 2002 2003 2004
Baselevel
Australia* (WEUR) 19-May-1989 11-Aug-1992 0.0 0.0 -19.7 0.0 0.0 0.0 0.0 0.0 0.0 0.0 0.0 0.0 0.0 0.0 0.0Belgium (WEUR EC) 30-Dec-1988 5-Oct-1993 26,592.5 23,257.3 0.0 0.0 0.0 0.0 0.0 0.0 0.0 0.0 0.0 0.0 0.0 0.0 26,592.5Canada (WEUR) 30-Jun-1988 5-Jul-1990 29,309.5 6,847.5 6,978.4 3,643.2 2,553.1 0.0 0.0 0.0 0.0 0.0 0.0 -0.9 -0.2 0.0 29,309.5Czech Republic (EEUR CEIT EC) 1-Jan-1993 18-Dec-1996 5,285.5 - -57.1 0.4 0.6 0.0 6.1 44.4 12.1 -81.4 0.0 132.0 94.6 0.0 5,285.5Finland* (WEUR EC) 23-Dec-1988 20-Dec-1991 0.0 0.0 0.0 0.0 0.0 -14.3 0.0 0.0 0.0 0.0 0.0 0.0 0.0 0.0 0.0France (WEUR EC) 28-Dec-1988 12-Feb-1992 5,119.4 767.8 1,551.0 787.6 983.4 506.0 692.1 737.0 -89.1 1,051.6 -228.8 180.4 147.4 -2,677.4 5,119.4Germany (WEUR EC) 16-Dec-1988 27-Dec-1991 8,067.4 514.8 180.4 0.0 0.0 0.0 -369.6 -576.4 0.0 339.9 548.9 -770.0 105.6 -1,338.7 8,067.4Israel (ASIA) 30-Jun-1992 30-Jun-1992 0.0 0.0 0.0 0.0 0.0 0.0 0.0 0.0 0.0 0.0 0.0 0.0 0.0 0.0 0.0Italy (WEUR EC) 16-Dec-1988 21-Feb-1992 8,769.2 4,165.7 456.5 0.0 0.0 0.0 341.0 0.0 828.3 0.0 0.0 0.0 0.0 0.0 8,769.2Japan (ASIA) 30-Sep-1988 4-Sep-1991 19,602.0 5,170.0 4,081.0 2,943.6 2,462.9 539.0 40.7 34.1 38.5 23.1 35.2 33.0 31.0 20.8 19,602.0Netherlands (WEUR EC) 16-Dec-1988 20-Dec-1991 0.0 0.0 -207.9 0.0 -1,131.9 -1,898.6 158.4 887.7 116.6 64.9 -192.5 155.1 -5.5 -4.4 0.0Norway* (WEUR) 24-Jun-1988 18-Nov-1991 0.0 0.0 0.0 0.0 0.0 0.0 0.0 0.0 0.0 0.0 0.0 0.0 0.0 -28.1 0.0Poland (EEUR CEIT EC) 13-Jul-1990 2-Oct-1996 3,960.0 - 4,963.2 4,915.9 - 9.0 0.0 0.0 0.0 0.0 0.0 0.0 0.0 0.0 3,960.0Russian Federation (EEUR CEIT) 10-Nov-1988 13-Jan-1992 103,290.0 2,200.0 2,200.0 3,372.6 2,735.2 743.6 0.0 33.0 346.6 0.0 0.0 -6.4 40.4 N.R. 103,290.0Spain (WEUR EC) 16-Dec-1988 19-May-1992 40,634.0 4,347.2 4,400.0 6,600.0 0.0 0.0 0.0 0.0 0.0 0.0 8,121.3 867.9 0.0 -297.0 40,634.0Switzerland* (WEUR) 28-Dec-1988 16-Sep-1992 0.0 0.0 0.0 -11.0 -11.0 0.0 0.0 0.0 0.0 0.0 0.0 0.0 0.0 0.0 0.0Ukraine (EEUR CEIT) 20-Sep-1988 6-Feb-1997 0.0 0.0 0.0 0.0 16.5 3.3 -2,178.6 2,820.7 0.0 0.0 0.0 0.0 0.0 0.0 0.0United Kingdom of Great Britain and Northern Ireland (WEUR EC) 16-Dec-1988 20-Dec-1991 14,094.3 7,480.0 601.7 622.6 0.0 7.7 0.0 0.0 0.0 0.0 0.0 0.0 0.0 0.0 14,094.3
United States of America (WEUR) 21-Apr-1988 18-Dec-1991 56,036.2 12,126.4 16,225.0 15,225.1 8,932.0 11.0 14.3 1.1 18.7 2.2 2,798.4 -2,182.4 -568.7 12.0 56,036.2Subtotal (Non-Article 5 - Annex B, Group II) 320,760.0 66,876.7 41,352.5 38,100.0 16,540.8 -93.3 -1,295.6 3,981.6 1,271.7 1,400.3 11,082.5 -1,591.3 -155.4 -4,312.8 320,760.0
Ratification dates Article 5 Baseline Years
Article 5 Parties Montreal Protocol
London Amendment
Base Year 1989 1992 1993 1994 1995 1996 1997 1998 1999 2000 2001 2002 2003 2004
Baselevel
Argentina (LAC) 18-Sep-1990 4-Dec-1992 5,291.0 0.0 0.0 0.0 0.0 0.0 0.0 0.0 0.0 0.0 0.0 0.0 0.0 0.0 0.0Brazil (LAC) 19-Mar-1990 1-Oct-1992 46,871.0 48,400.0 48,367.0 18,133.5 11,462.0 15,646.4 -1,245.2 16,525.3 11,350.9 7,012.5 4,726.8 188.9 3,624.5 3,060.2 11,629.6China (ASIA) 14-Jun-1991 14-Jun-1991 29,810.0 0.0 0.0 0.0 0.0 0.0 0.0 35,090.0 0.0 53,012.3 15,633.2 3,311.0 20,020.3 3,885.8 29,367.4Democratic People's Republic of Korea (ASIA) 24-Jan-1995 17-Jun-1999 440.0 - - - 374.0 1,232.0 1,309.0 1,424.5 1,386.0 1,045.0 2,077.9 2,027.3 1,585.2 2,198.9 1,285.2India (ASIA) 19-Jun-1992 19-Jun-1992 4,757.5 1,958.0 0.0 8,432.6 0.0 0.0 7,876.0 6,614.4 15,896.9 12,147.3 9,318.1 10,461.0 10,778.3 7,459.1 11,552.9Mexico (LAC) 31-Mar-1988 11-Oct-1991 4,668.4 0.0 0.0 0.0 0.0 0.0 0.0 0.0 0.0 0.0 0.0 0.0 0.0 0.0 0.0Republic of Korea (ASIA) 27-Feb-1992 10-Dec-1992 0.0 1,886.5 2,197.8 2,369.4 0.0 0.0 -2,173.6 -564.3 210.1 2,108.7 308.0 2,284.7 796.4 -291.5 584.8Romania (EEUR) 27-Jan-1993 27-Jan-1993 11,878.5 - 7,646.1 6,283.2 4,665.1 2,878.7 -198.6 1,949.2 -684.8 -149.8 36.7 -29.8 200.0 176.0 371.5South Africa (AFR) 15-Jan-1990 12-May-1992 12,697.3 7,139.0 4,774.0 6,340.4 4,931.3 0.0 0.0 0.0 0.0 0.0 0.0 0.0 0.0 0.0 0.0Subtotal (Article 5 - Annex B, Group II) 116,413.7 59,383.5 62,984.9 41,559.1 21,432.4 19,757.1 5,567.6 61,039.1 28,159.1 75,176.0 32,100.7 18,243.1 37,004.7 16,488.5 54,791.4
TOTAL (Annex B, Group II) 437,173.7 126,260.2 104,337.4 79,659.1 37,973.2 19,663.8 4,272.0 65,020.7 29,430.8 76,576.3 43,183.2 16,651.8 36,849.3 12,175.7 375,551.4
* Party has never reported production but its calculated production is non-zero for one or more years.

Table 5: Data on Production of Methyl Chloroform (Annex B, Group III) ODP tonnes
N.R. Not reported: is used where Parties are required to report but have not done so. AFR = Africa ASIA = Asia EEUR = Eastern Europe CEIT = Country with Economy in Transition – Hyphen: is used where Parties have not reported and are not required to report. LAC = Latin America and the Caribbean WEUR = Western Europe and Others EC = Member of the European Community NB: Figures are rounded to a uniform number of decimal places.
26 Production and Consumption of Ozone Depleting Substances: 1986 - 2004 Production and Consumption of Ozone Depleting Substances: 1986 – 2004 27
Table 5: Data on Production of Methyl Chloroform (Annex B, Group III) ODP tonnes
Ratification dates
Non-Article 5 Parties Montreal Protocol
London Amendment
Base Year 1989 1992 1993 1994 1995 1996 1997 1998 1999 2000 2001 2002 2003 2004
Baselevel
Canada (WEUR) 30-Jun-1988 5-Jul-1990 1,132.1 0.0 0.0 0.0 0.0 0.0 0.0 0.0 0.0 0.0 0.0 -0.1 -0.0 0.0 1,132.1Czech Republic* (EEUR CEIT EC) 1-Jan-1993 18-Dec-1996 0.0 - 0.0 0.0 0.0 0.0 0.0 0.0 0.0 -0.1 0.0 0.0 0.0 0.0 0.0Finland* (WEUR EC) 23-Dec-1988 20-Dec-1991 0.0 0.0 0.0 0.0 0.0 0.0 0.0 0.0 0.0 0.0 0.0 0.0 0.0 0.0 0.0France (WEUR EC) 28-Dec-1988 12-Feb-1992 6,169.5 5,427.2 2,422.4 1,704.5 1,439.0 71.0 223.0 184.3 172.9 143.1 64.1 0.1 69.7 37.1 6,169.5Germany (WEUR EC) 16-Dec-1988 27-Dec-1991 6,895.2 5,534.2 3,005.9 1,135.6 0.0 0.0 0.0 0.0 0.0 0.0 0.0 0.0 0.0 0.0 6,895.2Italy (WEUR EC) 16-Dec-1988 21-Feb-1992 0.0 0.0 0.0 0.0 0.0 0.0 0.0 0.0 0.0 0.0 0.0 0.0 0.0 0.0 0.0Japan (ASIA) 30-Sep-1988 4-Sep-1991 15,636.4 15,705.4 7,146.0 463.7 5,248.0 867.6 1,078.7 898.8 1,047.8 876.4 734.6 1,249.7 569.1 61.4 15,636.4Russian Federation (EEUR CEIT) 10-Nov-1988 13-Jan-1992 330.0 400.0 100.0 196.6 202.9 0.0 0.0 0.0 0.0 0.0 0.0 0.0 0.0 N.R. 330.0Switzerland* (WEUR) 28-Dec-1988 16-Sep-1992 0.0 0.0 0.0 0.0 0.0 -4.0 0.0 0.0 -0.1 0.0 0.0 0.0 0.0 0.0 0.0United Kingdom of Great Britain and Northern Ireland (WEUR EC) 16-Dec-1988 20-Dec-1991 7,810.3 7,275.7 5,370.9 5,519.5 0.0 0.0 0.0 0.0 0.0 0.0 0.0 0.0 0.0 0.0 7,810.3
United States of America (WEUR) 21-Apr-1988 18-Dec-1991 31,517.0 25,722.6 20,637.1 5,794.6 4,598.6 447.5 437.3 262.3 245.8 300.4 197.1 2.4 1.9 124.8 31,517.0Subtotal (Non-Article 5 - Annex B, Group III) 69,490.5 60,065.1 38,682.3 14,814.5 11,488.5 1,382.1 1,739.0 1,345.4 1,466.4 1,319.8 995.8 1,252.1 640.7 223.3 69,490.5
Ratification dates Article 5 Baseline Years
Article 5 Parties Montreal Protocol
London Amendment
Base Year 1989 1992 1993 1994 1995 1996 1997 1998 1999 2000 2001 2002 2003 2004
Baselevel
Brazil (LAC) 19-Mar-1990 1-Oct-1992 1,130.0 750.0 764.0 39.2 0.0 0.0 0.0 0.0 97.2 0.0 0.0 0.0 0.0 0.0 32.4China (ASIA) 14-Jun-1991 14-Jun-1991 0.0 20.0 19.5 0.0 0.0 99.4 104.4 134.9 122.5 80.9 39.0 120.6 86.8 105.6 112.8Democratic People's Republic of Korea (ASIA) 24-Jan-1995 17-Jun-1999 15.0 - - - 10.0 10.0 10.0 9.0 9.0 5.1 7.0 0.0 0.0 0.0 7.7India (ASIA) 19-Jun-1992 19-Jun-1992 46.7 48.3 55.9 0.0 0.0 0.0 0.0 0.0 0.0 0.0 0.0 0.0 0.0 0.0 0.0Romania (EEUR) 27-Jan-1993 27-Jan-1993 27.2 - 9.9 7.8 6.1 12.9 2.9 0.0 0.0 0.0 0.0 0.0 0.0 0.0 0.0Subtotal (Article 5 - Annex B, Group III) 1,218.9 818.3 849.3 47.0 16.1 122.3 117.3 143.9 228.7 86.0 46.0 120.6 86.8 105.6 152.9
TOTAL (Annex B, Group III) 70,709.4 60,883.4 39,531.6 14,861.5 11,504.6 1,504.4 1,856.3 1,489.3 1,695.1 1,405.8 1,041.8 1,372.7 727.5 328.9 69,643.4
* Party has never reported production but its calculated production is non-zero for one or more years.

Table 6: Data on Production of HCFCs (Annex C, Group I) ODP tonnes
N.R. Not reported: is used where Parties are required to report but have not done so. AFR = Africa ASIA = Asia EEUR = Eastern Europe CEIT = Country with Economy in Transition – Hyphen: is used where Parties have not reported and are not required to report. LAC = Latin America and the Caribbean WEUR = Western Europe and Others EC = Member of the European Community NB: Figures are rounded to a uniform number of decimal places.
28 Production and Consumption of Ozone Depleting Substances: 1986 - 2004 Production and Consumption of Ozone Depleting Substances: 1986 – 2004 29
Table 6: Data on Production of HCFCs (Annex C, Group I) ODP tonnes
Ratification dates
Non-Article 5 Parties Montreal Protocol
London Amendment
Base Year 1989 1992 1993 1994 1995 1996 1997 1998 1999 2000 2001 2002 2003 2004
Baselevel
Australia (WEUR) 19-May-1989 11-Aug-1992 132.4 123.9 170.0 95.4 84.5 0.0 0.0 0.0 0.0 0.0 0.0 0.0 0.0 0.0 587.1Canada (WEUR) 30-Jun-1988 5-Jul-1990 245.9 96.6 42.5 76.8 59.0 64.8 66.7 57.9 79.6 79.9 108.1 53.0 74.7 91.1 819.6Czech Republic* (EEUR CEIT EC) 1-Jan-1993 18-Dec-1996 0.0 - 0.0 0.0 0.0 0.0 0.0 0.0 0.0 0.0 0.0 0.0 -0.3 -0.3 107.6Denmark* (WEUR EC) 16-Dec-1988 20-Dec-1991 0.0 0.0 0.0 0.0 0.0 0.0 0.0 0.0 0.0 0.0 -0.9 0.0 -0.3 0.0Finland* (WEUR EC) 23-Dec-1988 20-Dec-1991 0.0 0.0 0.0 0.0 0.0 -0.4 0.0 0.0 0.0 0.0 0.0 0.0 0.0 0.0 36.5France (WEUR EC) 28-Dec-1988 12-Feb-1992 791.7 2,046.1 2,889.8 4,723.8 5,797.7 5,672.8 5,334.7 6,314.0 6,299.4 6,567.0 6,429.9 6,131.5 5,080.0 3,417.9 Germany (WEUR EC) 16-Dec-1988 27-Dec-1991 510.9 594.7 479.7 610.3 641.5 793.7 804.9 681.9 528.5 1,750.7 435.1 429.1 226.7 255.4 Greece (WEUR EC) 29-Dec-1988 11-May-1993 75.4 115.0 188.8 252.0 376.8 440.3 465.4 512.4 590.3 439.0 0.4 368.5 312.7 299.8 Italy (WEUR EC) 16-Dec-1988 21-Feb-1992 336.6 450.1 496.0 550.8 464.4 769.8 629.2 690.0 750.2 465.8 485.2 388.9 216.1 90.9 Japan (ASIA) 30-Sep-1988 4-Sep-1991 1,627.0 2,570.3 4,493.2 3,347.1 6,296.2 4,377.4 4,194.9 3,965.9 4,607.6 3,928.1 3,768.2 3,195.3 3,152.8 1,925.1 5,645.4Liechtenstein* (WEUR) 8-Feb-1989 24-Mar-1994 0.0 0.0 0.0 0.0 0.0 0.0 0.0 0.0 0.0 0.0 0.0 0.0 0.0 N.R. 0.3Netherlands (WEUR EC) 16-Dec-1988 20-Dec-1991 508.4 699.2 822.3 882.9 844.7 975.4 926.7 1,144.6 984.4 995.3 826.4 845.5 704.0 900.2 Norway* (WEUR) 24-Jun-1988 18-Nov-1991 0.0 0.0 0.0 0.0 0.0 0.0 0.0 0.0 -0.3 -0.5 -0.6 -1.0 -0.5 -0.5 38.0Russian Federation (EEUR CEIT) 10-Nov-1988 13-Jan-1992 1,194.0 267.2 172.0 198.1 184.2 74.4 72.3 67.1 146.3 168.9 684.3 219.4 326.8 N.R. 4,066.1Spain (WEUR EC) 16-Dec-1988 19-May-1992 482.2 399.9 412.5 97.7 741.2 249.4 948.6 915.4 916.4 354.6 214.1 0.0 188.0 47.4 Switzerland* (WEUR) 28-Dec-1988 16-Sep-1992 0.0 0.0 0.0 0.0 0.0 0.0 0.0 0.0 0.0 0.0 -3.3 -2.8 -0.6 -0.6 65.3United Kingdom of Great Britain and Northern Ireland (WEUR EC) 16-Dec-1988 20-Dec-1991 678.8 779.0 587.2 1,198.3 1,367.6 1,244.8 1,183.2 1,314.0 1,194.2 942.4 948.5 1,244.8 1,312.2 745.7
United States of America (WEUR) 21-Apr-1988 18-Dec-1991 6,558.7 5,559.9 7,127.2 12,317.4 14,810.3 12,508.4 12,487.6 15,297.6 14,450.8 14,290.7 12,279.6 12,399.4 5,503.0 6,151.4 15,389.6Subtotal (Non-Article 5 - Annex C, Group I) 13,142.0 13,701.9 17,881.2 24,350.6 31,668.1 27,170.8 27,114.2 30,960.8 30,547.4 29,981.9 26,175.0 25,271.6 17,095.3 13,923.5 26,755.5
Subtotal for base level excluding non-producers = 26,507.8
Ratification dates
Article 5 Parties Montreal Protocol
London Amendment
Base Year 1989 1992 1993 1994 1995 1996 1997 1998 1999 2000 2001 2002 2003 2004
Baselevel
Argentina (LAC) 18-Sep-1990 4-Dec-1992 26.7 0.0 9.0 10.5 0.0 0.0 0.0 0.0 0.0 5.6 5.4 0.0 0.0 31.0 -Brazil (LAC) 19-Mar-1990 1-Oct-1992 184.0 220.0 235.0 232.0 210.4 122.4 131.1 133.6 17.9 0.0 0.0 0.0 0.0 0.0 -China (ASIA) 14-Jun-1991 14-Jun-1991 621.5 305.8 698.6 1,308.0 687.5 896.5 1,526.3 971.6 4,044.0 5,939.8 7,022.0 8,650.5 11,745.2 15,447.1 -India (ASIA) 19-Jun-1992 19-Jun-1992 118.9 205.8 265.0 266.0 314.2 280.4 346.6 582.3 583.7 773.3 817.7 803.3 1,056.9 1,356.9 -Mexico (LAC) 31-Mar-1988 11-Oct-1991 208.5 103.0 158.1 126.4 117.8 296.7 303.3 238.5 329.0 237.1 176.2 272.1 281.4 281.4 -Republic of Korea (ASIA) 27-Feb-1992 10-Dec-1992 129.6 219.3 247.5 266.4 306.7 511.0 602.8 550.0 969.2 780.9 395.7 729.1 520.9 417.4 -South Africa (AFR) 15-Jan-1990 12-May-1992 0.0 56.5 84.5 87.0 56.8 0.0 0.0 0.0 0.0 0.0 0.0 0.0 0.0 0.0 -Venezuela (Bolivarian Republic of) (LAC) 6-Feb-1989 29-Jul-1993 80.3 112.8 113.0 84.2 87.2 85.9 89.0 66.4 25.1 31.3 42.5 27.1 24.4 54.7 -Subtotal (Article 5 - Annex C, Group I) 1,369.5 1,223.2 1,810.7 2,380.5 1,780.6 2,192.9 2,999.1 2,542.4 5,968.9 7,768.0 8,459.5 10,482.1 13,628.8 17,588.5 -
TOTAL (Annex C, Group I) 14,511.5 14,925.1 19,691.9 26,731.1 33,448.7 29,363.7 30,113.3 33,503.2 36,516.3 37,749.9 34,634.5 35,753.7 30,724.1 31,512.0 26,755.5
* Party has never reported production but its calculated production is non-zero for one or more years.
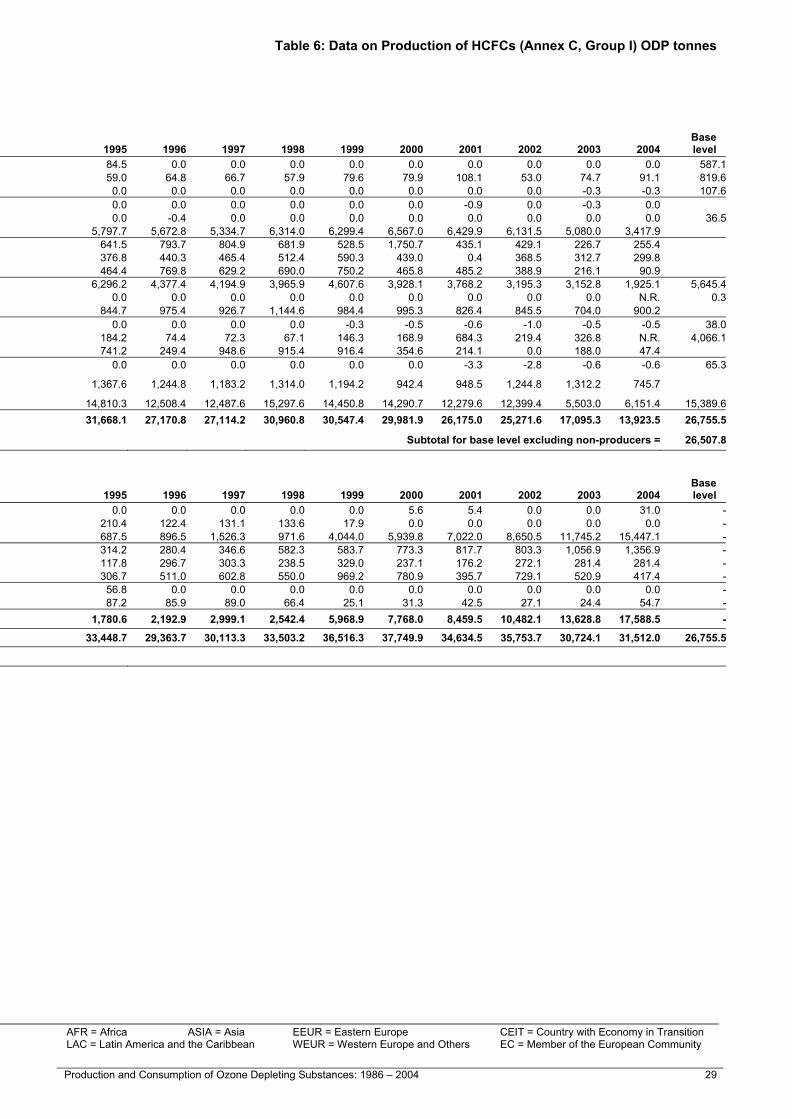
Table 6: Data on Production of HCFCs (Annex C, Group I) ODP tonnes
N.R. Not reported: is used where Parties are required to report but have not done so. AFR = Africa ASIA = Asia EEUR = Eastern Europe CEIT = Country with Economy in Transition – Hyphen: is used where Parties have not reported and are not required to report. LAC = Latin America and the Caribbean WEUR = Western Europe and Others EC = Member of the European Community NB: Figures are rounded to a uniform number of decimal places.
28 Production and Consumption of Ozone Depleting Substances: 1986 - 2004 Production and Consumption of Ozone Depleting Substances: 1986 – 2004 29
Table 6: Data on Production of HCFCs (Annex C, Group I) ODP tonnes
Ratification dates
Non-Article 5 Parties Montreal Protocol
London Amendment
Base Year 1989 1992 1993 1994 1995 1996 1997 1998 1999 2000 2001 2002 2003 2004
Baselevel
Australia (WEUR) 19-May-1989 11-Aug-1992 132.4 123.9 170.0 95.4 84.5 0.0 0.0 0.0 0.0 0.0 0.0 0.0 0.0 0.0 587.1Canada (WEUR) 30-Jun-1988 5-Jul-1990 245.9 96.6 42.5 76.8 59.0 64.8 66.7 57.9 79.6 79.9 108.1 53.0 74.7 91.1 819.6Czech Republic* (EEUR CEIT EC) 1-Jan-1993 18-Dec-1996 0.0 - 0.0 0.0 0.0 0.0 0.0 0.0 0.0 0.0 0.0 0.0 -0.3 -0.3 107.6Denmark* (WEUR EC) 16-Dec-1988 20-Dec-1991 0.0 0.0 0.0 0.0 0.0 0.0 0.0 0.0 0.0 0.0 -0.9 0.0 -0.3 0.0Finland* (WEUR EC) 23-Dec-1988 20-Dec-1991 0.0 0.0 0.0 0.0 0.0 -0.4 0.0 0.0 0.0 0.0 0.0 0.0 0.0 0.0 36.5France (WEUR EC) 28-Dec-1988 12-Feb-1992 791.7 2,046.1 2,889.8 4,723.8 5,797.7 5,672.8 5,334.7 6,314.0 6,299.4 6,567.0 6,429.9 6,131.5 5,080.0 3,417.9 Germany (WEUR EC) 16-Dec-1988 27-Dec-1991 510.9 594.7 479.7 610.3 641.5 793.7 804.9 681.9 528.5 1,750.7 435.1 429.1 226.7 255.4 Greece (WEUR EC) 29-Dec-1988 11-May-1993 75.4 115.0 188.8 252.0 376.8 440.3 465.4 512.4 590.3 439.0 0.4 368.5 312.7 299.8 Italy (WEUR EC) 16-Dec-1988 21-Feb-1992 336.6 450.1 496.0 550.8 464.4 769.8 629.2 690.0 750.2 465.8 485.2 388.9 216.1 90.9 Japan (ASIA) 30-Sep-1988 4-Sep-1991 1,627.0 2,570.3 4,493.2 3,347.1 6,296.2 4,377.4 4,194.9 3,965.9 4,607.6 3,928.1 3,768.2 3,195.3 3,152.8 1,925.1 5,645.4Liechtenstein* (WEUR) 8-Feb-1989 24-Mar-1994 0.0 0.0 0.0 0.0 0.0 0.0 0.0 0.0 0.0 0.0 0.0 0.0 0.0 N.R. 0.3Netherlands (WEUR EC) 16-Dec-1988 20-Dec-1991 508.4 699.2 822.3 882.9 844.7 975.4 926.7 1,144.6 984.4 995.3 826.4 845.5 704.0 900.2 Norway* (WEUR) 24-Jun-1988 18-Nov-1991 0.0 0.0 0.0 0.0 0.0 0.0 0.0 0.0 -0.3 -0.5 -0.6 -1.0 -0.5 -0.5 38.0Russian Federation (EEUR CEIT) 10-Nov-1988 13-Jan-1992 1,194.0 267.2 172.0 198.1 184.2 74.4 72.3 67.1 146.3 168.9 684.3 219.4 326.8 N.R. 4,066.1Spain (WEUR EC) 16-Dec-1988 19-May-1992 482.2 399.9 412.5 97.7 741.2 249.4 948.6 915.4 916.4 354.6 214.1 0.0 188.0 47.4 Switzerland* (WEUR) 28-Dec-1988 16-Sep-1992 0.0 0.0 0.0 0.0 0.0 0.0 0.0 0.0 0.0 0.0 -3.3 -2.8 -0.6 -0.6 65.3United Kingdom of Great Britain and Northern Ireland (WEUR EC) 16-Dec-1988 20-Dec-1991 678.8 779.0 587.2 1,198.3 1,367.6 1,244.8 1,183.2 1,314.0 1,194.2 942.4 948.5 1,244.8 1,312.2 745.7
United States of America (WEUR) 21-Apr-1988 18-Dec-1991 6,558.7 5,559.9 7,127.2 12,317.4 14,810.3 12,508.4 12,487.6 15,297.6 14,450.8 14,290.7 12,279.6 12,399.4 5,503.0 6,151.4 15,389.6Subtotal (Non-Article 5 - Annex C, Group I) 13,142.0 13,701.9 17,881.2 24,350.6 31,668.1 27,170.8 27,114.2 30,960.8 30,547.4 29,981.9 26,175.0 25,271.6 17,095.3 13,923.5 26,755.5
Subtotal for base level excluding non-producers = 26,507.8
Ratification dates
Article 5 Parties Montreal Protocol
London Amendment
Base Year 1989 1992 1993 1994 1995 1996 1997 1998 1999 2000 2001 2002 2003 2004
Baselevel
Argentina (LAC) 18-Sep-1990 4-Dec-1992 26.7 0.0 9.0 10.5 0.0 0.0 0.0 0.0 0.0 5.6 5.4 0.0 0.0 31.0 -Brazil (LAC) 19-Mar-1990 1-Oct-1992 184.0 220.0 235.0 232.0 210.4 122.4 131.1 133.6 17.9 0.0 0.0 0.0 0.0 0.0 -China (ASIA) 14-Jun-1991 14-Jun-1991 621.5 305.8 698.6 1,308.0 687.5 896.5 1,526.3 971.6 4,044.0 5,939.8 7,022.0 8,650.5 11,745.2 15,447.1 -India (ASIA) 19-Jun-1992 19-Jun-1992 118.9 205.8 265.0 266.0 314.2 280.4 346.6 582.3 583.7 773.3 817.7 803.3 1,056.9 1,356.9 -Mexico (LAC) 31-Mar-1988 11-Oct-1991 208.5 103.0 158.1 126.4 117.8 296.7 303.3 238.5 329.0 237.1 176.2 272.1 281.4 281.4 -Republic of Korea (ASIA) 27-Feb-1992 10-Dec-1992 129.6 219.3 247.5 266.4 306.7 511.0 602.8 550.0 969.2 780.9 395.7 729.1 520.9 417.4 -South Africa (AFR) 15-Jan-1990 12-May-1992 0.0 56.5 84.5 87.0 56.8 0.0 0.0 0.0 0.0 0.0 0.0 0.0 0.0 0.0 -Venezuela (Bolivarian Republic of) (LAC) 6-Feb-1989 29-Jul-1993 80.3 112.8 113.0 84.2 87.2 85.9 89.0 66.4 25.1 31.3 42.5 27.1 24.4 54.7 -Subtotal (Article 5 - Annex C, Group I) 1,369.5 1,223.2 1,810.7 2,380.5 1,780.6 2,192.9 2,999.1 2,542.4 5,968.9 7,768.0 8,459.5 10,482.1 13,628.8 17,588.5 -
TOTAL (Annex C, Group I) 14,511.5 14,925.1 19,691.9 26,731.1 33,448.7 29,363.7 30,113.3 33,503.2 36,516.3 37,749.9 34,634.5 35,753.7 30,724.1 31,512.0 26,755.5
* Party has never reported production but its calculated production is non-zero for one or more years.

Table 7: Data on Production of HBFCs (Annex C, Group II) ODP tonnes
N.R. Not reported: is used where Parties are required to report but have not done so. AFR = Africa ASIA = Asia EEUR = Eastern Europe CEIT = Country with Economy in Transition – Hyphen: is used where Parties have not reported and are not required to report. LAC = Latin America and the Caribbean WEUR = Western Europe and Others EC = Member of the European Community NB: Figures are rounded to a uniform number of decimal places.
30 Production and Consumption of Ozone Depleting Substances: 1986 - 2004 Production and Consumption of Ozone Depleting Substances: 1986 – 2004 31
Table 7: Data on Production of HBFCs (Annex C, Group II) ODP tonnes
Ratification dates
Non-Article 5 Parties Montreal Protocol
Copenhagen Amendment 1994 1995 1996 1997 1998 1999 2000 2001 2002 2003 2004
United Kingdom of Great Britain and Northern Ireland (WEUR EC) 16-Dec-1988 4-Jan-1995 0.0 0.0 0.06 0.0 0.008 -0.176 0.0 0.0 -0.017 -0.104 -681.7
United States of America (WEUR) 21-Apr-1988 2-Mar-1994 0.0 0.0 0.00 0.0 0.000 0.000 0.0 0.0 0.740 0.000 0.0TOTAL (Annex C, Group II) 0.0 0.0 0.06 0.0 0.008 -0.176 0.0 0.0 0.723 -0.104 -681.7

Table 7: Data on Production of HBFCs (Annex C, Group II) ODP tonnes
N.R. Not reported: is used where Parties are required to report but have not done so. AFR = Africa ASIA = Asia EEUR = Eastern Europe CEIT = Country with Economy in Transition – Hyphen: is used where Parties have not reported and are not required to report. LAC = Latin America and the Caribbean WEUR = Western Europe and Others EC = Member of the European Community NB: Figures are rounded to a uniform number of decimal places.
30 Production and Consumption of Ozone Depleting Substances: 1986 - 2004 Production and Consumption of Ozone Depleting Substances: 1986 – 2004 31
Table 7: Data on Production of HBFCs (Annex C, Group II) ODP tonnes
Ratification dates
Non-Article 5 Parties Montreal Protocol
Copenhagen Amendment 1994 1995 1996 1997 1998 1999 2000 2001 2002 2003 2004
United Kingdom of Great Britain and Northern Ireland (WEUR EC) 16-Dec-1988 4-Jan-1995 0.0 0.0 0.06 0.0 0.008 -0.176 0.0 0.0 -0.017 -0.104 -681.7
United States of America (WEUR) 21-Apr-1988 2-Mar-1994 0.0 0.0 0.00 0.0 0.000 0.000 0.0 0.0 0.740 0.000 0.0TOTAL (Annex C, Group II) 0.0 0.0 0.06 0.0 0.008 -0.176 0.0 0.0 0.723 -0.104 -681.7
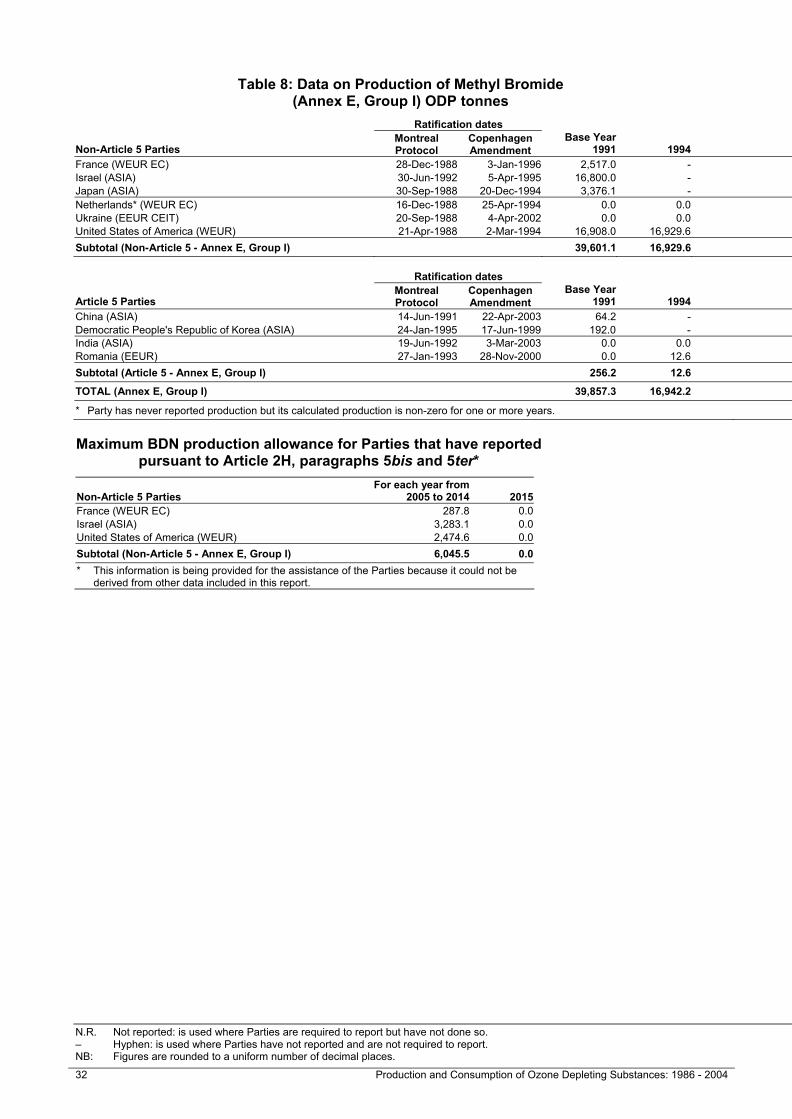
Table 8: Data on Production of Methyl Bromide (Annex E, Group I) ODP tonnes
N.R. Not reported: is used where Parties are required to report but have not done so. AFR = Africa ASIA = Asia EEUR = Eastern Europe CEIT = Country with Economy in Transition – Hyphen: is used where Parties have not reported and are not required to report. LAC = Latin America and the Caribbean WEUR = Western Europe and Others EC = Member of the European Community NB: Figures are rounded to a uniform number of decimal places.
32 Production and Consumption of Ozone Depleting Substances: 1986 - 2004 Production and Consumption of Ozone Depleting Substances: 1986 – 2004 33
Table 8: Data on Production of Methyl Bromide (Annex E, Group I) ODP tonnes
Ratification dates
Non-Article 5 Parties Montreal Protocol
Copenhagen Amendment
Base Year 1991 1994 1995 1996 1997 1998 1999 2000 2001 2002 2003 2004
Baselevel
France (WEUR EC) 28-Dec-1988 3-Jan-1996 2,517.0 - 1,976.4 2,740.2 2,577.6 2,080.2 1,903.2 1,424.4 1,258.2 1,244.9 1,010.0 1,113.9 2,517.0Israel (ASIA) 30-Jun-1992 5-Apr-1995 16,800.0 - 14,026.8 13,703.4 14,475.0 14,372.4 11,332.8 12,088.2 8,014.2 7,531.2 5,127.5 4,730.4 16,800.0Japan (ASIA) 30-Sep-1988 20-Dec-1994 3,376.1 - 3,162.0 3,009.0 2,905.2 2,740.8 2,419.8 2,258.4 1,612.8 1,571.4 882.6 896.8 3,376.1Netherlands* (WEUR EC) 16-Dec-1988 25-Apr-1994 0.0 0.0 0.0 0.0 0.0 0.0 0.0 -43.8 0.0 0.0 -7.8 -276.6 0.0Ukraine (EEUR CEIT) 20-Sep-1988 4-Apr-2002 0.0 0.0 841.2 0.0 0.0 0.0 0.0 0.0 0.0 0.0 0.0 0.0 0.0United States of America (WEUR) 21-Apr-1988 2-Mar-1994 16,908.0 16,929.6 14,364.6 16,119.6 15,981.0 16,424.4 12,602.0 10,360.0 8,345.4 5,901.0 7,727.4 7,718.2 16,908.0Subtotal (Non-Article 5 - Annex E, Group I) 39,601.1 16,929.6 34,371.0 35,572.2 35,938.8 35,617.8 28,257.8 26,087.2 19,230.6 16,248.5 14,739.7 14,182.7 39,601.1
Ratification dates Article 5 Baseline Years
Article 5 Parties Montreal Protocol
Copenhagen Amendment
Base Year 1991 1994 1995 1996 1997 1998 1999 2000 2001 2002 2003 2004
Baselevel
China (ASIA) 14-Jun-1991 22-Apr-2003 64.2 - 171.0 660.0 876.0 1,398.0 876.0 1,438.2 1,391.4 744.0 558.4 316.9 776.3Democratic People's Republic of Korea (ASIA) 24-Jan-1995 17-Jun-1999 192.0 - 120.0 0.0 0.0 0.0 0.0 0.0 0.0 0.0 0.0 0.0 30.0India (ASIA) 19-Jun-1992 3-Mar-2003 0.0 0.0 0.0 0.0 0.0 0.0 0.0 0.0 0.0 0.0 0.0 0.0 0.0Romania (EEUR) 27-Jan-1993 28-Nov-2000 0.0 12.6 21.4 10.8 9.9 31.2 13.2 0.0 18.1 21.4 17.2 5.0 18.3Subtotal (Article 5 - Annex E, Group I) 256.2 12.6 312.4 670.8 885.9 1,429.2 889.2 1,438.2 1,409.5 765.4 575.6 321.9 824.6
TOTAL (Annex E, Group I) 39,857.3 16,942.2 34,683.4 36,243.0 36,824.7 37,047.0 29,147.0 27,525.4 20,640.1 17,013.9 15,315.3 14,504.6 40,425.7
* Party has never reported production but its calculated production is non-zero for one or more years. Maximum BDN production allowance for Parties that have reported
pursuant to Article 2H, paragraphs 5bis and 5ter*
Non-Article 5 Parties For each year from
2005 to 2014 2015 France (WEUR EC) 287.8 0.0 Israel (ASIA) 3,283.1 0.0 United States of America (WEUR) 2,474.6 0.0 Subtotal (Non-Article 5 - Annex E, Group I) 6,045.5 0.0 * This information is being provided for the assistance of the Parties because it could not be
derived from other data included in this report.

Table 8: Data on Production of Methyl Bromide (Annex E, Group I) ODP tonnes
N.R. Not reported: is used where Parties are required to report but have not done so. AFR = Africa ASIA = Asia EEUR = Eastern Europe CEIT = Country with Economy in Transition – Hyphen: is used where Parties have not reported and are not required to report. LAC = Latin America and the Caribbean WEUR = Western Europe and Others EC = Member of the European Community NB: Figures are rounded to a uniform number of decimal places.
32 Production and Consumption of Ozone Depleting Substances: 1986 - 2004 Production and Consumption of Ozone Depleting Substances: 1986 – 2004 33
Table 8: Data on Production of Methyl Bromide (Annex E, Group I) ODP tonnes
Ratification dates
Non-Article 5 Parties Montreal Protocol
Copenhagen Amendment
Base Year 1991 1994 1995 1996 1997 1998 1999 2000 2001 2002 2003 2004
Baselevel
France (WEUR EC) 28-Dec-1988 3-Jan-1996 2,517.0 - 1,976.4 2,740.2 2,577.6 2,080.2 1,903.2 1,424.4 1,258.2 1,244.9 1,010.0 1,113.9 2,517.0Israel (ASIA) 30-Jun-1992 5-Apr-1995 16,800.0 - 14,026.8 13,703.4 14,475.0 14,372.4 11,332.8 12,088.2 8,014.2 7,531.2 5,127.5 4,730.4 16,800.0Japan (ASIA) 30-Sep-1988 20-Dec-1994 3,376.1 - 3,162.0 3,009.0 2,905.2 2,740.8 2,419.8 2,258.4 1,612.8 1,571.4 882.6 896.8 3,376.1Netherlands* (WEUR EC) 16-Dec-1988 25-Apr-1994 0.0 0.0 0.0 0.0 0.0 0.0 0.0 -43.8 0.0 0.0 -7.8 -276.6 0.0Ukraine (EEUR CEIT) 20-Sep-1988 4-Apr-2002 0.0 0.0 841.2 0.0 0.0 0.0 0.0 0.0 0.0 0.0 0.0 0.0 0.0United States of America (WEUR) 21-Apr-1988 2-Mar-1994 16,908.0 16,929.6 14,364.6 16,119.6 15,981.0 16,424.4 12,602.0 10,360.0 8,345.4 5,901.0 7,727.4 7,718.2 16,908.0Subtotal (Non-Article 5 - Annex E, Group I) 39,601.1 16,929.6 34,371.0 35,572.2 35,938.8 35,617.8 28,257.8 26,087.2 19,230.6 16,248.5 14,739.7 14,182.7 39,601.1
Ratification dates Article 5 Baseline Years
Article 5 Parties Montreal Protocol
Copenhagen Amendment
Base Year 1991 1994 1995 1996 1997 1998 1999 2000 2001 2002 2003 2004
Baselevel
China (ASIA) 14-Jun-1991 22-Apr-2003 64.2 - 171.0 660.0 876.0 1,398.0 876.0 1,438.2 1,391.4 744.0 558.4 316.9 776.3Democratic People's Republic of Korea (ASIA) 24-Jan-1995 17-Jun-1999 192.0 - 120.0 0.0 0.0 0.0 0.0 0.0 0.0 0.0 0.0 0.0 30.0India (ASIA) 19-Jun-1992 3-Mar-2003 0.0 0.0 0.0 0.0 0.0 0.0 0.0 0.0 0.0 0.0 0.0 0.0 0.0Romania (EEUR) 27-Jan-1993 28-Nov-2000 0.0 12.6 21.4 10.8 9.9 31.2 13.2 0.0 18.1 21.4 17.2 5.0 18.3Subtotal (Article 5 - Annex E, Group I) 256.2 12.6 312.4 670.8 885.9 1,429.2 889.2 1,438.2 1,409.5 765.4 575.6 321.9 824.6
TOTAL (Annex E, Group I) 39,857.3 16,942.2 34,683.4 36,243.0 36,824.7 37,047.0 29,147.0 27,525.4 20,640.1 17,013.9 15,315.3 14,504.6 40,425.7
* Party has never reported production but its calculated production is non-zero for one or more years. Maximum BDN production allowance for Parties that have reported
pursuant to Article 2H, paragraphs 5bis and 5ter*
Non-Article 5 Parties For each year from
2005 to 2014 2015 France (WEUR EC) 287.8 0.0 Israel (ASIA) 3,283.1 0.0 United States of America (WEUR) 2,474.6 0.0 Subtotal (Non-Article 5 - Annex E, Group I) 6,045.5 0.0 * This information is being provided for the assistance of the Parties because it could not be
derived from other data included in this report.

Table 9: Data on Consumption of CFCs (Annex A, Group I) ODP tonnes
N.R. Not reported: is used where Parties are required to report but have not done so. AFR = Africa ASIA = Asia EEUR = Eastern Europe CEIT = Country with Economy in Transition – Hyphen: is used where Parties have not reported and are not required to report. LAC = Latin America and the Caribbean WEUR = Western Europe and Others EC = Member of the European Community NB: Figures are rounded to a uniform number of decimal places.
34 Production and Consumption of Ozone Depleting Substances: 1986 - 2004 Production and Consumption of Ozone Depleting Substances: 1986 – 2004 35
Table 9: Data on Consumption of CFCs (Annex A, Group I) ODP tonnes
Non-Article 5 Parties Ratification date:
Montreal ProtocolBase Year
1986 1989 1990 1991 1992 1993 1994 1995 1996 1997 1998 1999 2000 2001 2002 2003 2004Baselevel
Australia (WEUR) 19-May-1989 14,290.4 14,292.8 7,416.4 6,811.7 5,556.0 3,409.3 3,894.9 2,584.7 234.2 183.9 195.1 274.1 6.5 6.0 9.8 1.1 -61.8 14,290.4Austria (WEUR EC) 3-May-1989 7,760.0 5,860.0 1,801.9 1,738.3 1,530.5 558.9 922.5 7,760.0Azerbaijan (EEUR CEIT) 12-Jun-1996 480.6 480.6 - - - - - - 456.5 201.2 152.2 99.9 87.8 52.0 12.0 10.2 15.1 480.6Belarus (EEUR CEIT) 31-Oct-1988 2,510.9 1,679.6 1,230.0 1,185.4 914.2 914.2 900.4 578.6 523.5 371.8 256.2 193.7 0.0 0.0 0.0 0.0 0.0 2,510.9Bulgaria (EEUR CEIT) 20-Nov-1990 2,940.0 2,611.8 2,034.0 1,556.0 1,279.0 690.2 684.0 322.4 4.0 0.0 0.0 0.0 0.0 0.0 0.0 0.0 0.0 2,940.0Canada (WEUR) 30-Jun-1988 19,958.2 18,843.0 13,173.6 8,819.4 10,746.8 4,521.0 4,852.8 4,816.4 128.8 136.2 42.2 -4.8 10.1 0.1 -12.6 -0.2 0.0 19,958.2Czech Republic (EEUR CEIT EC) 1-Jan-1993 5,460.9 5,498.0 - - - 1,038.6 403.2 369.2 49.6 11.6 7.9 11.2 5.1 2.9 3.7 -4.4 5,460.9Estonia (EEUR CEIT EC) 17-Oct-1996 188.7 190.0 - - - - - 764.8 -442.2 45.2 69.8 56.3 15.7 -0.4 0.0 0.0 188.7European Community* (WEUR) 16-Dec-1988 301,930.2 225,985.0 170,331.4 150,640.0 126,092.4 107,327.2 44,703.4 310.0 6,010.2 5,636.3 4,341.8 4,745.2 2,165.6 2,136.4 -265.8 293.6 195.8 301,930.2Finland (WEUR EC) 23-Dec-1988 3,301.0 1,886.0 1,859.0 1,198.6 633.8 826.4 508.0 3,301.0Hungary (EEUR CEIT EC) 20-Apr-1989 5,468.0 4,848.0 4,390.0 2,290.0 1,674.8 1,381.4 844.0 566.2 0.0 3.9 1.3 0.6 0.5 0.0 0.3 -1.3 5,468.0Iceland (WEUR) 29-Aug-1989 195.1 139.7 132.7 93.4 65.2 61.9 30.7 0.0 0.0 0.0 0.0 0.0 0.0 0.0 0.0 0.0 0.0 195.1Israel (ASIA) 30-Jun-1992 4,141.6 4,560.2 - - 4,062.6 3,523.6 897.4 1,095.0 7.0 0.0 0.0 0.0 0.0 0.0 0.0 0.0 0.0 4,141.6Japan (ASIA) 30-Sep-1988 118,134.0 146,608.7 97,723.2 88,436.4 58,477.4 47,451.8 19,712.6 23,063.8 -614.4 -113.0 -208.0 23.2 -24.2 -5.5 19.5 4.0 0.0 118,134.0Kazakhstan (ASIA CEIT) 26-Aug-1998 1,206.2 1,394.6 1,214.3 1,205.6 - 2,218.2 - - 825.6 668.8 1,025.5 730.0 523.9 290.0 112.0 30.4 11.2 1,206.2Latvia (EEUR CEIT EC) 28-Apr-1995 6,102.0 4,736.5 - - - - - 664.8 307.0 23.0 25.3 21.6 35.2 0.0 0.0 0.0 6,102.0Liechtenstein (WEUR) 8-Feb-1989 37.2 13.0 3.4 19.0 10.4 6.2 3.6 1.1 0.0 0.0 -0.1 0.0 0.0 0.0 0.0 0.0 N.R. 37.2Lithuania (EEUR CEIT EC) 18-Jan-1995 5,462.1 5,528.0 4,178.9 3,814.2 2,449.9 - 596.3 360.5 288.7 99.9 103.8 85.3 36.5 0.0 0.0 0.0 5,462.1Malta (WEUR EC) 29-Dec-1988 286.7 366.3 179.4 85.2 64.8 61.9 61.2 62.8 70.2 60.1 106.6 97.2 67.6 63.1 10.3 14.0 286.7Monaco (WEUR) 12-Mar-1993 6.2 6.2 - - 6.2 8.5 5.2 0.0 0.0 0.0 0.0 0.0 0.0 0.0 0.0 0.0 0.0 6.2New Zealand (WEUR) 21-Jul-1988 2,088.0 1,184.5 558.4 752.5 651.2 805.5 337.8 188.9 1.6 0.0 0.0 0.0 -2.6 0.0 -4.7 0.0 -1.1 2,088.0Norway (WEUR) 24-Jun-1988 1,313.0 907.6 722.4 414.4 255.1 221.6 172.6 3.2 2.8 2.6 -16.4 -60.2 -39.8 -48.1 -73.5 -65.5 -54.6 1,313.0Poland (EEUR CEIT EC) 13-Jul-1990 4,986.0 4,986.0 4,939.0 2,562.4 2,537.0 2,589.2 1,677.6 1,756.0 549.4 308.3 314.1 187.0 174.8 179.0 201.5 126.3 4,986.0Russian Federation (EEUR CEIT) 10-Nov-1988 100,352.0 100,102.0 98,752.0 38,949.0 36,607.4 30,130.0 23,413.4 20,990.4 12,345.3 10,986.2 11,821.1 14,824.4 23,820.8 0.0 0.0 258.0 N.R. 100,352.0Slovakia (EEUR CEIT EC) 28-May-1993 1,706.4 1,979.2 - - 608.9 986.1 229.4 380.9 0.0 1.2 1.4 1.4 1.7 3.3 0.8 0.6 1,706.4Slovenia (EEUR CEIT EC) 6-Jul-1992 2,718.2 2,391.4 343.4 222.4 1,098.0 594.3 564.2 353.8 1.2 0.4 0.1 0.1 0.3 2.6 0.4 0.6 2,718.2Sweden (WEUR EC) 29-Jun-1988 4,962.0 2,552.2 1,818.0 1,118.7 1,159.6 685.6 215.4 4,962.0Switzerland (WEUR) 28-Dec-1988 7,960.0 4,023.0 2,920.2 2,186.0 1,561.7 1,206.0 741.3 274.8 -43.3 -40.9 -28.1 -4.5 -5.8 -1.6 -3.4 -9.1 -19.0 7,960.0Tajikistan (ASIA CEIT) 7-Jan-1998 211.0 189.4 - 91.3 - - - 31.7 34.9 48.2 56.3 50.7 28.0 28.3 11.8 4.7 0.0 211.0Turkmenistan (ASIA CEIT) 18-Nov-1993 172.4 170.8 140.8 96.6 67.1 61.4 57.0 56.0 29.6 26.4 25.3 18.6 21.0 57.7 10.5 43.4 58.4 172.4Ukraine (EEUR CEIT) 20-Sep-1988 4,725.2 4,518.0 4,518.0 4,518.0 3,432.2 1,703.4 2,420.9 746.3 1,401.0 1,404.7 1,100.7 951.2 838.7 1,076.5 119.7 77.8 80.0 4,725.2United States of America (WEUR) 21-Apr-1988 305,963.6 317,543.0 198,308.2 174,261.8 144,855.8 111,458.8 72,534.4 35,529.6 1,897.2 742.5 2,706.0 2,903.8 2,613.0 2,805.2 1,357.2 1,605.2 1,340.4 305,963.6Uzbekistan (EEUR CEIT) 18-May-1993 1,779.2 2,454.5 - - - 585.3 250.1 293.8 260.3 53.0 119.8 52.8 41.7 15.3 0.0 0.0 0.0 1,779.2Subtotal (Non-Article 5 - Annex A, Group I) 938,797.0 888,529.6 618,688.6 493,066.3 406,398.0 325,026.5 181,634.3 96,165.7 24,328.7 20,861.5 22,219.9 25,258.8 30,422.1 6,662.8 1,509.5 2,389.4 1,564.4 938,797.0
Article 5 Baseline YearsArticle 5 Parties
Ratification date: Montreal Protocol
Base Year 1986 1989 1990 1991 1992 1993 1994 1995 1996 1997 1998 1999 2000 2001 2002 2003 2004
Baselevel
Afghanistan (ASIA) 17-Jun-2004 220.0 - - - - - - 380.0 380.0 380.0 - - - - - - 177.9 380.0Albania (EEUR) 8-Oct-1999 40.3 40.3 - - - - - 40.3 40.1 41.9 46.5 53.1 61.9 68.8 49.9 35.0 36.6 40.8Algeria (AFR) 20-Oct-1992 6,626.8 3,570.2 - - - 2,146.4 2,226.0 2,292.2 2,292.2 1,774.2 1,549.2 1,502.2 1,474.6 1,021.8 1,761.8 1,761.8 1,045.0 2,119.5Angola (AFR) 17-May-2000 115.9 115.9 - - - - - 114.8 114.8 114.8 115.9 - 107.0 114.8 105.0 104.2 75.6 114.8Antigua and Barbuda (LAC) 3-Dec-1992 430.4 428.0 421.3 427.8 429.0 426.1 12.4 11.5 10.3 10.3 26.5 -2.0 5.0 3.1 3.7 1.5 1.9 10.7Argentina (LAC) 18-Sep-1990 5,210.6 3,463.4 2,138.2 2,796.8 4,306.0 1,805.9 4,569.4 6,365.9 4,202.1 3,523.7 3,546.3 4,316.3 2,396.7 3,293.1 2,139.2 2,255.2 2,211.6 4,697.2Armenia (EEUR) 1-Oct-1999 2,384.5 0.0 - 0.0 - - - 201.8 196.5 191.2 185.9 9.0 25.0 162.7 172.7 172.7 110.7 196.5Bahamas (LAC) 4-May-1993 51.1 56.9 - - 0.7 65.8 68.1 69.9 72.0 52.7 54.6 53.8 65.9 63.0 55.0 24.6 18.8 64.9Bahrain (ASIA) 27-Apr-1990 76.4 91.5 107.0 85.3 118.6 111.1 118.1 121.9 137.2 147.2 149.5 129.0 113.1 106.0 94.6 85.8 64.8 135.4Bangladesh (ASIA) 2-Aug-1990 176.7 204.9 195.1 92.9 213.1 226.6 180.6 280.7 628.3 832.2 830.4 800.6 805.0 807.9 328.0 333.0 294.9 581.6Barbados (LAC) 16-Oct-1992 15.8 27.4 20.9 25.4 20.6 29.5 35.3 25.0 22.4 17.2 22.5 16.5 8.1 12.5 9.5 8.6 14.1 21.5Belize (LAC) 9-Jan-1998 15.0 20.0 - - - - - 22.3 24.7 26.1 25.0 25.1 15.5 28.0 21.7 15.1 12.2 24.4Benin (AFR) 1-Jul-1993 14.7 79.3 57.7 37.3 44.3 37.0 37.0 61.8 58.4 59.6 54.2 56.6 54.6 54.0 35.5 17.3 11.5 59.9Bhutan (ASIA) 23-Aug-2004 0.1 0.0 - 0.0 - - - 0.1 0.2 0.2 0.0 0.0 0.0 - - - 0.1 0.2Bolivia (LAC) 3-Oct-1994 34.8 22.6 - 14.4 - - 76.0 81.6 87.1 58.4 74.1 72.2 78.8 76.7 65.5 32.1 42.4 75.7Bosnia and Herzegovina (EEUR) 1-Sep-1993 329.0 218.9 0.0 145.1 19.5 15.0 7.5 3.0 20.6 49.0 45.1 151.0 175.9 199.7 243.6 230.0 187.9 24.2Botswana (AFR) 4-Dec-1991 2.6 6.0 - - 12.0 14.6 8.4 8.4 5.4 6.8 2.6 2.6 2.5 4.0 3.6 5.1 2.7 6.8Brazil (LAC) 19-Mar-1990 10,973.5 9,109.7 8,538.8 8,503.6 8,933.6 9,817.8 10,778.2 10,895.7 10,872.0 9,809.7 9,542.9 11,612.0 9,275.1 6,230.9 3,000.6 3,224.3 1,870.5 10,525.8Brunei Darussalam (ASIA) 27-May-1993 68.8 64.0 - - 58.6 81.2 63.3 64.6 80.1 90.0 63.5 36.7 46.6 31.4 43.4 32.3 N.R. 78.2Burkina Faso (AFR) 20-Jul-1989 22.8 26.5 27.8 29.2 29.2 30.6 33.6 33.6 37.6 37.6 37.0 30.6 25.4 19.6 16.3 13.2 10.5 36.3Burundi (AFR) 6-Jan-1997 32.4 40.3 43.0 45.6 48.2 - - 56.2 58.8 61.9 64.5 59.6 53.8 46.5 19.1 9.2 3.9 59.0Cambodia (ASIA) 27-Jun-2001 94.2 - - - - - - 94.2 94.2 94.2 94.2 94.2 94.2 94.2 94.2 86.7 70.4 94.2
* European Community (EC) figures before 1995 contain data reported for the 12 members of the community at the time, namely Belgium,
Denmark, France, Germany, Greece, Ireland, Italy, Luxembourg, Netherlands, Portugal, Spain and United Kingdom of Great Britain and Northern Ireland. Figures for 1995 to 2003 cover 15 members of the EC, the 3 new members of the EC being Austria, Finland and Sweden that joined the EC in 1995. Figures for 2004 are for 25 members, which include the further 10 new members of the EC (Cyprus, Czech Republic, Estonia, Hungary, Latvia, Lithuania, Malta, Poland, Slovakia and Slovenia) that joined the EC in 2004.
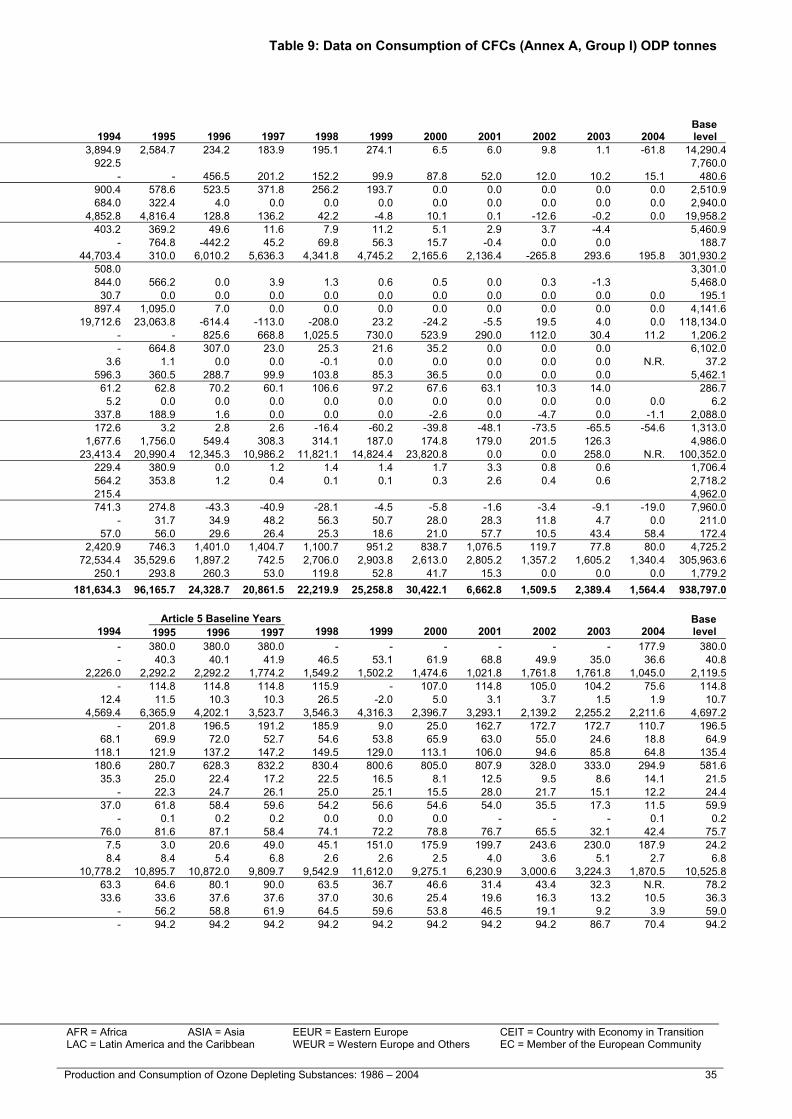
Table 9: Data on Consumption of CFCs (Annex A, Group I) ODP tonnes
N.R. Not reported: is used where Parties are required to report but have not done so. AFR = Africa ASIA = Asia EEUR = Eastern Europe CEIT = Country with Economy in Transition – Hyphen: is used where Parties have not reported and are not required to report. LAC = Latin America and the Caribbean WEUR = Western Europe and Others EC = Member of the European Community NB: Figures are rounded to a uniform number of decimal places.
34 Production and Consumption of Ozone Depleting Substances: 1986 - 2004 Production and Consumption of Ozone Depleting Substances: 1986 – 2004 35
Table 9: Data on Consumption of CFCs (Annex A, Group I) ODP tonnes
Non-Article 5 Parties Ratification date:
Montreal ProtocolBase Year
1986 1989 1990 1991 1992 1993 1994 1995 1996 1997 1998 1999 2000 2001 2002 2003 2004Baselevel
Australia (WEUR) 19-May-1989 14,290.4 14,292.8 7,416.4 6,811.7 5,556.0 3,409.3 3,894.9 2,584.7 234.2 183.9 195.1 274.1 6.5 6.0 9.8 1.1 -61.8 14,290.4Austria (WEUR EC) 3-May-1989 7,760.0 5,860.0 1,801.9 1,738.3 1,530.5 558.9 922.5 7,760.0Azerbaijan (EEUR CEIT) 12-Jun-1996 480.6 480.6 - - - - - - 456.5 201.2 152.2 99.9 87.8 52.0 12.0 10.2 15.1 480.6Belarus (EEUR CEIT) 31-Oct-1988 2,510.9 1,679.6 1,230.0 1,185.4 914.2 914.2 900.4 578.6 523.5 371.8 256.2 193.7 0.0 0.0 0.0 0.0 0.0 2,510.9Bulgaria (EEUR CEIT) 20-Nov-1990 2,940.0 2,611.8 2,034.0 1,556.0 1,279.0 690.2 684.0 322.4 4.0 0.0 0.0 0.0 0.0 0.0 0.0 0.0 0.0 2,940.0Canada (WEUR) 30-Jun-1988 19,958.2 18,843.0 13,173.6 8,819.4 10,746.8 4,521.0 4,852.8 4,816.4 128.8 136.2 42.2 -4.8 10.1 0.1 -12.6 -0.2 0.0 19,958.2Czech Republic (EEUR CEIT EC) 1-Jan-1993 5,460.9 5,498.0 - - - 1,038.6 403.2 369.2 49.6 11.6 7.9 11.2 5.1 2.9 3.7 -4.4 5,460.9Estonia (EEUR CEIT EC) 17-Oct-1996 188.7 190.0 - - - - - 764.8 -442.2 45.2 69.8 56.3 15.7 -0.4 0.0 0.0 188.7European Community* (WEUR) 16-Dec-1988 301,930.2 225,985.0 170,331.4 150,640.0 126,092.4 107,327.2 44,703.4 310.0 6,010.2 5,636.3 4,341.8 4,745.2 2,165.6 2,136.4 -265.8 293.6 195.8 301,930.2Finland (WEUR EC) 23-Dec-1988 3,301.0 1,886.0 1,859.0 1,198.6 633.8 826.4 508.0 3,301.0Hungary (EEUR CEIT EC) 20-Apr-1989 5,468.0 4,848.0 4,390.0 2,290.0 1,674.8 1,381.4 844.0 566.2 0.0 3.9 1.3 0.6 0.5 0.0 0.3 -1.3 5,468.0Iceland (WEUR) 29-Aug-1989 195.1 139.7 132.7 93.4 65.2 61.9 30.7 0.0 0.0 0.0 0.0 0.0 0.0 0.0 0.0 0.0 0.0 195.1Israel (ASIA) 30-Jun-1992 4,141.6 4,560.2 - - 4,062.6 3,523.6 897.4 1,095.0 7.0 0.0 0.0 0.0 0.0 0.0 0.0 0.0 0.0 4,141.6Japan (ASIA) 30-Sep-1988 118,134.0 146,608.7 97,723.2 88,436.4 58,477.4 47,451.8 19,712.6 23,063.8 -614.4 -113.0 -208.0 23.2 -24.2 -5.5 19.5 4.0 0.0 118,134.0Kazakhstan (ASIA CEIT) 26-Aug-1998 1,206.2 1,394.6 1,214.3 1,205.6 - 2,218.2 - - 825.6 668.8 1,025.5 730.0 523.9 290.0 112.0 30.4 11.2 1,206.2Latvia (EEUR CEIT EC) 28-Apr-1995 6,102.0 4,736.5 - - - - - 664.8 307.0 23.0 25.3 21.6 35.2 0.0 0.0 0.0 6,102.0Liechtenstein (WEUR) 8-Feb-1989 37.2 13.0 3.4 19.0 10.4 6.2 3.6 1.1 0.0 0.0 -0.1 0.0 0.0 0.0 0.0 0.0 N.R. 37.2Lithuania (EEUR CEIT EC) 18-Jan-1995 5,462.1 5,528.0 4,178.9 3,814.2 2,449.9 - 596.3 360.5 288.7 99.9 103.8 85.3 36.5 0.0 0.0 0.0 5,462.1Malta (WEUR EC) 29-Dec-1988 286.7 366.3 179.4 85.2 64.8 61.9 61.2 62.8 70.2 60.1 106.6 97.2 67.6 63.1 10.3 14.0 286.7Monaco (WEUR) 12-Mar-1993 6.2 6.2 - - 6.2 8.5 5.2 0.0 0.0 0.0 0.0 0.0 0.0 0.0 0.0 0.0 0.0 6.2New Zealand (WEUR) 21-Jul-1988 2,088.0 1,184.5 558.4 752.5 651.2 805.5 337.8 188.9 1.6 0.0 0.0 0.0 -2.6 0.0 -4.7 0.0 -1.1 2,088.0Norway (WEUR) 24-Jun-1988 1,313.0 907.6 722.4 414.4 255.1 221.6 172.6 3.2 2.8 2.6 -16.4 -60.2 -39.8 -48.1 -73.5 -65.5 -54.6 1,313.0Poland (EEUR CEIT EC) 13-Jul-1990 4,986.0 4,986.0 4,939.0 2,562.4 2,537.0 2,589.2 1,677.6 1,756.0 549.4 308.3 314.1 187.0 174.8 179.0 201.5 126.3 4,986.0Russian Federation (EEUR CEIT) 10-Nov-1988 100,352.0 100,102.0 98,752.0 38,949.0 36,607.4 30,130.0 23,413.4 20,990.4 12,345.3 10,986.2 11,821.1 14,824.4 23,820.8 0.0 0.0 258.0 N.R. 100,352.0Slovakia (EEUR CEIT EC) 28-May-1993 1,706.4 1,979.2 - - 608.9 986.1 229.4 380.9 0.0 1.2 1.4 1.4 1.7 3.3 0.8 0.6 1,706.4Slovenia (EEUR CEIT EC) 6-Jul-1992 2,718.2 2,391.4 343.4 222.4 1,098.0 594.3 564.2 353.8 1.2 0.4 0.1 0.1 0.3 2.6 0.4 0.6 2,718.2Sweden (WEUR EC) 29-Jun-1988 4,962.0 2,552.2 1,818.0 1,118.7 1,159.6 685.6 215.4 4,962.0Switzerland (WEUR) 28-Dec-1988 7,960.0 4,023.0 2,920.2 2,186.0 1,561.7 1,206.0 741.3 274.8 -43.3 -40.9 -28.1 -4.5 -5.8 -1.6 -3.4 -9.1 -19.0 7,960.0Tajikistan (ASIA CEIT) 7-Jan-1998 211.0 189.4 - 91.3 - - - 31.7 34.9 48.2 56.3 50.7 28.0 28.3 11.8 4.7 0.0 211.0Turkmenistan (ASIA CEIT) 18-Nov-1993 172.4 170.8 140.8 96.6 67.1 61.4 57.0 56.0 29.6 26.4 25.3 18.6 21.0 57.7 10.5 43.4 58.4 172.4Ukraine (EEUR CEIT) 20-Sep-1988 4,725.2 4,518.0 4,518.0 4,518.0 3,432.2 1,703.4 2,420.9 746.3 1,401.0 1,404.7 1,100.7 951.2 838.7 1,076.5 119.7 77.8 80.0 4,725.2United States of America (WEUR) 21-Apr-1988 305,963.6 317,543.0 198,308.2 174,261.8 144,855.8 111,458.8 72,534.4 35,529.6 1,897.2 742.5 2,706.0 2,903.8 2,613.0 2,805.2 1,357.2 1,605.2 1,340.4 305,963.6Uzbekistan (EEUR CEIT) 18-May-1993 1,779.2 2,454.5 - - - 585.3 250.1 293.8 260.3 53.0 119.8 52.8 41.7 15.3 0.0 0.0 0.0 1,779.2Subtotal (Non-Article 5 - Annex A, Group I) 938,797.0 888,529.6 618,688.6 493,066.3 406,398.0 325,026.5 181,634.3 96,165.7 24,328.7 20,861.5 22,219.9 25,258.8 30,422.1 6,662.8 1,509.5 2,389.4 1,564.4 938,797.0
Article 5 Baseline YearsArticle 5 Parties
Ratification date: Montreal Protocol
Base Year 1986 1989 1990 1991 1992 1993 1994 1995 1996 1997 1998 1999 2000 2001 2002 2003 2004
Baselevel
Afghanistan (ASIA) 17-Jun-2004 220.0 - - - - - - 380.0 380.0 380.0 - - - - - - 177.9 380.0Albania (EEUR) 8-Oct-1999 40.3 40.3 - - - - - 40.3 40.1 41.9 46.5 53.1 61.9 68.8 49.9 35.0 36.6 40.8Algeria (AFR) 20-Oct-1992 6,626.8 3,570.2 - - - 2,146.4 2,226.0 2,292.2 2,292.2 1,774.2 1,549.2 1,502.2 1,474.6 1,021.8 1,761.8 1,761.8 1,045.0 2,119.5Angola (AFR) 17-May-2000 115.9 115.9 - - - - - 114.8 114.8 114.8 115.9 - 107.0 114.8 105.0 104.2 75.6 114.8Antigua and Barbuda (LAC) 3-Dec-1992 430.4 428.0 421.3 427.8 429.0 426.1 12.4 11.5 10.3 10.3 26.5 -2.0 5.0 3.1 3.7 1.5 1.9 10.7Argentina (LAC) 18-Sep-1990 5,210.6 3,463.4 2,138.2 2,796.8 4,306.0 1,805.9 4,569.4 6,365.9 4,202.1 3,523.7 3,546.3 4,316.3 2,396.7 3,293.1 2,139.2 2,255.2 2,211.6 4,697.2Armenia (EEUR) 1-Oct-1999 2,384.5 0.0 - 0.0 - - - 201.8 196.5 191.2 185.9 9.0 25.0 162.7 172.7 172.7 110.7 196.5Bahamas (LAC) 4-May-1993 51.1 56.9 - - 0.7 65.8 68.1 69.9 72.0 52.7 54.6 53.8 65.9 63.0 55.0 24.6 18.8 64.9Bahrain (ASIA) 27-Apr-1990 76.4 91.5 107.0 85.3 118.6 111.1 118.1 121.9 137.2 147.2 149.5 129.0 113.1 106.0 94.6 85.8 64.8 135.4Bangladesh (ASIA) 2-Aug-1990 176.7 204.9 195.1 92.9 213.1 226.6 180.6 280.7 628.3 832.2 830.4 800.6 805.0 807.9 328.0 333.0 294.9 581.6Barbados (LAC) 16-Oct-1992 15.8 27.4 20.9 25.4 20.6 29.5 35.3 25.0 22.4 17.2 22.5 16.5 8.1 12.5 9.5 8.6 14.1 21.5Belize (LAC) 9-Jan-1998 15.0 20.0 - - - - - 22.3 24.7 26.1 25.0 25.1 15.5 28.0 21.7 15.1 12.2 24.4Benin (AFR) 1-Jul-1993 14.7 79.3 57.7 37.3 44.3 37.0 37.0 61.8 58.4 59.6 54.2 56.6 54.6 54.0 35.5 17.3 11.5 59.9Bhutan (ASIA) 23-Aug-2004 0.1 0.0 - 0.0 - - - 0.1 0.2 0.2 0.0 0.0 0.0 - - - 0.1 0.2Bolivia (LAC) 3-Oct-1994 34.8 22.6 - 14.4 - - 76.0 81.6 87.1 58.4 74.1 72.2 78.8 76.7 65.5 32.1 42.4 75.7Bosnia and Herzegovina (EEUR) 1-Sep-1993 329.0 218.9 0.0 145.1 19.5 15.0 7.5 3.0 20.6 49.0 45.1 151.0 175.9 199.7 243.6 230.0 187.9 24.2Botswana (AFR) 4-Dec-1991 2.6 6.0 - - 12.0 14.6 8.4 8.4 5.4 6.8 2.6 2.6 2.5 4.0 3.6 5.1 2.7 6.8Brazil (LAC) 19-Mar-1990 10,973.5 9,109.7 8,538.8 8,503.6 8,933.6 9,817.8 10,778.2 10,895.7 10,872.0 9,809.7 9,542.9 11,612.0 9,275.1 6,230.9 3,000.6 3,224.3 1,870.5 10,525.8Brunei Darussalam (ASIA) 27-May-1993 68.8 64.0 - - 58.6 81.2 63.3 64.6 80.1 90.0 63.5 36.7 46.6 31.4 43.4 32.3 N.R. 78.2Burkina Faso (AFR) 20-Jul-1989 22.8 26.5 27.8 29.2 29.2 30.6 33.6 33.6 37.6 37.6 37.0 30.6 25.4 19.6 16.3 13.2 10.5 36.3Burundi (AFR) 6-Jan-1997 32.4 40.3 43.0 45.6 48.2 - - 56.2 58.8 61.9 64.5 59.6 53.8 46.5 19.1 9.2 3.9 59.0Cambodia (ASIA) 27-Jun-2001 94.2 - - - - - - 94.2 94.2 94.2 94.2 94.2 94.2 94.2 94.2 86.7 70.4 94.2
* European Community (EC) figures before 1995 contain data reported for the 12 members of the community at the time, namely Belgium,
Denmark, France, Germany, Greece, Ireland, Italy, Luxembourg, Netherlands, Portugal, Spain and United Kingdom of Great Britain and Northern Ireland. Figures for 1995 to 2003 cover 15 members of the EC, the 3 new members of the EC being Austria, Finland and Sweden that joined the EC in 1995. Figures for 2004 are for 25 members, which include the further 10 new members of the EC (Cyprus, Czech Republic, Estonia, Hungary, Latvia, Lithuania, Malta, Poland, Slovakia and Slovenia) that joined the EC in 2004.
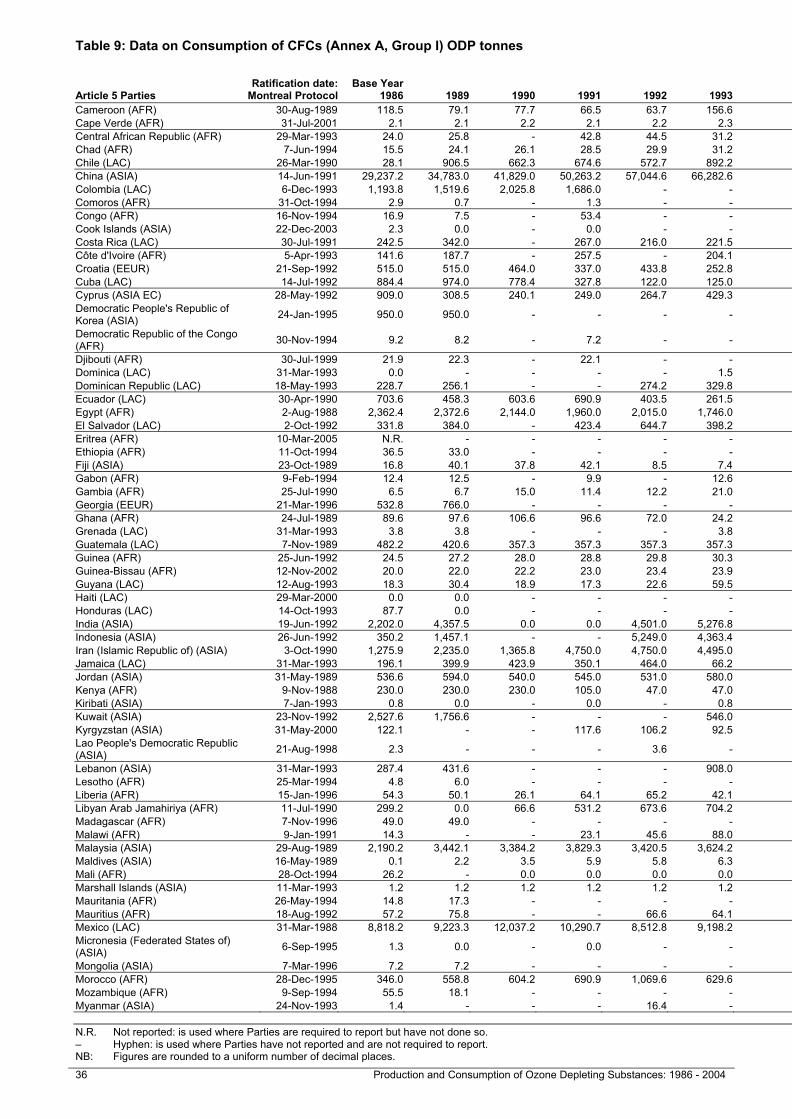
Table 9: Data on Consumption of CFCs (Annex A, Group I) ODP tonnes Table 9: Data on Consumption of CFCs (Annex A, Group I) ODP tonnes
N.R. Not reported: is used where Parties are required to report but have not done so. AFR = Africa ASIA = Asia EEUR = Eastern Europe CEIT = Country with Economy in Transition – Hyphen: is used where Parties have not reported and are not required to report. LAC = Latin America and the Caribbean WEUR = Western Europe and Others EC = Member of the European Community NB: Figures are rounded to a uniform number of decimal places.
36 Production and Consumption of Ozone Depleting Substances: 1986 - 2004 Production and Consumption of Ozone Depleting Substances: 1986 – 2004 37
Article 5 Baseline YearsArticle 5 Parties
Ratification date: Montreal Protocol
Base Year 1986 1989 1990 1991 1992 1993 1994 1995 1996 1997 1998 1999 2000 2001 2002 2003 2004
Baselevel
Cameroon (AFR) 30-Aug-1989 118.5 79.1 77.7 66.5 63.7 156.6 156.6 230.7 280.4 259.5 311.8 361.5 368.7 364.1 226.0 220.5 148.5 256.9Cape Verde (AFR) 31-Jul-2001 2.1 2.1 2.2 2.1 2.2 2.3 2.3 2.4 2.3 2.2 2.1 2.0 1.9 1.9 1.8 1.8 1.5 2.3Central African Republic (AFR) 29-Mar-1993 24.0 25.8 - 42.8 44.5 31.2 31.2 27.3 6.4 0.0 7.0 1.4 4.3 4.0 4.4 4.1 N.R. 11.3Chad (AFR) 7-Jun-1994 15.5 24.1 26.1 28.5 29.9 31.2 31.6 32.8 34.6 36.3 38.1 37.5 36.5 31.6 27.1 22.8 N.R. 34.6Chile (LAC) 26-Mar-1990 28.1 906.5 662.3 674.6 572.7 892.2 852.6 933.5 878.2 674.5 737.9 657.5 576.0 470.2 370.2 424.5 230.8 828.7China (ASIA) 14-Jun-1991 29,237.2 34,783.0 41,829.0 50,263.2 57,044.6 66,282.6 70,778.6 75,290.8 47,089.0 51,076.4 55,414.2 42,983.4 39,123.6 33,922.6 30,621.2 22,808.8 17,902.5 57,818.7Colombia (LAC) 6-Dec-1993 1,193.8 1,519.6 2,025.8 1,686.0 - - 2,114.6 2,156.4 2,301.8 2,166.4 1,224.0 985.5 1,149.3 1,164.8 907.0 1,058.1 898.5 2,208.2Comoros (AFR) 31-Oct-1994 2.9 0.7 - 1.3 - - - 2.3 2.3 2.9 3.6 2.5 2.7 1.9 1.8 1.2 1.1 2.5Congo (AFR) 16-Nov-1994 16.9 7.5 - 53.4 - - 27.1 13.6 12.8 9.2 6.6 9.3 11.4 2.5 5.5 7.0 4.7 11.9Cook Islands (ASIA) 22-Dec-2003 2.3 0.0 - 0.0 - - - 2.3 1.7 1.2 0.5 0.0 0.0 - - 0.0 N.R. 1.7Costa Rica (LAC) 30-Jul-1991 242.5 342.0 - 267.0 216.0 221.5 184.0 158.5 497.2 94.8 -204.2 152.3 105.9 144.6 137.4 142.5 111.5 250.2Côte d'Ivoire (AFR) 5-Apr-1993 141.6 187.7 - 257.5 - 204.1 342.0 354.3 383.9 144.4 267.8 166.2 206.4 148.0 106.5 93.4 79.4 294.2Croatia (EEUR) 21-Sep-1992 515.0 515.0 464.0 337.0 433.8 252.8 314.0 193.5 184.1 280.4 85.7 141.5 171.2 113.8 140.1 88.7 78.2 219.3Cuba (LAC) 14-Jul-1992 884.4 974.0 778.4 327.8 122.0 125.0 150.0 546.2 663.8 665.4 531.4 571.4 533.7 504.0 488.8 481.0 445.1 625.1Cyprus (ASIA EC) 28-May-1992 909.0 308.5 240.1 249.0 264.7 429.3 196.4 164.6 141.0 143.0 81.0 114.9 165.0 137.6 131.8 62.5 149.5Democratic People's Republic of Korea (ASIA) 24-Jan-1995 950.0 950.0 - - - - - 825.0 267.0 233.0 112.0 106.0 77.0 320.8 299.0 587.4 7.3 441.7
Democratic Republic of the Congo (AFR) 30-Nov-1994 9.2 8.2 - 7.2 - - - 793.0 735.0 469.0 688.5 368.1 386.6 639.4 569.4 566.9 329.1 665.7
Djibouti (AFR) 30-Jul-1999 21.9 22.3 - 22.1 - - - 22.7 21.5 18.9 20.6 20.6 20.7 18.0 15.8 12.1 8.8 21.0Dominica (LAC) 31-Mar-1993 0.0 - - - - 1.5 1.5 1.0 1.7 1.7 2.1 1.1 2.1 1.6 3.0 1.4 1.0 1.5Dominican Republic (LAC) 18-May-1993 228.7 256.1 - - 274.2 329.8 433.3 634.0 558.7 426.8 311.4 752.1 401.9 485.8 329.8 266.5 310.4 539.8Ecuador (LAC) 30-Apr-1990 703.6 458.3 603.6 690.9 403.5 261.5 78.4 314.7 269.2 320.4 271.7 153.0 230.5 207.0 229.6 256.3 147.4 301.4Egypt (AFR) 2-Aug-1988 2,362.4 2,372.6 2,144.0 1,960.0 2,015.0 1,746.0 1,870.0 1,640.0 1,732.0 1,632.0 1,540.0 1,373.6 1,267.0 1,334.8 1,294.0 1,102.2 1,047.6 1,668.0El Salvador (LAC) 2-Oct-1992 331.8 384.0 - 423.4 644.7 398.2 255.7 329.7 312.1 277.8 194.6 109.5 99.1 116.9 101.6 97.5 75.6 306.6Eritrea (AFR) 10-Mar-2005 N.R. - - - - - - - - - - - - - - - - N.R.Ethiopia (AFR) 11-Oct-1994 36.5 33.0 - - - - - 32.5 33.8 35.1 38.2 39.2 39.2 34.6 30.0 28.0 16.0 33.8Fiji (ASIA) 23-Oct-1989 16.8 40.1 37.8 42.1 8.5 7.4 0.1 59.8 26.7 13.7 13.1 9.4 0.0 0.0 0.0 0.0 0.0 33.4Gabon (AFR) 9-Feb-1994 12.4 12.5 - 9.9 - 12.6 12.0 7.3 11.5 12.0 12.0 7.8 13.7 6.4 5.0 5.0 4.5 10.3Gambia (AFR) 25-Jul-1990 6.5 6.7 15.0 11.4 12.2 21.0 22.8 22.7 20.6 28.0 10.9 6.9 6.1 5.8 4.7 5.1 0.0 23.8Georgia (EEUR) 21-Mar-1996 532.8 766.0 - - - - 53.2 13.1 23.5 30.9 26.0 21.5 21.5 18.8 15.5 12.6 8.6 22.5Ghana (AFR) 24-Jul-1989 89.6 97.6 106.6 96.6 72.0 24.2 39.3 44.0 14.2 48.7 50.3 46.8 47.0 35.6 21.2 32.0 35.6 35.8Grenada (LAC) 31-Mar-1993 3.8 3.8 - - - 3.8 3.8 6.5 4.9 6.5 3.8 2.9 2.9 1.3 2.1 2.1 1.9 6.0Guatemala (LAC) 7-Nov-1989 482.2 420.6 357.3 357.3 357.3 357.3 269.3 231.0 235.6 207.3 188.7 191.1 187.9 265.0 239.6 147.1 65.4 224.6Guinea (AFR) 25-Jun-1992 24.5 27.2 28.0 28.8 29.8 30.3 32.4 37.4 44.0 45.9 41.8 39.9 37.5 35.4 31.3 25.9 16.7 42.4Guinea-Bissau (AFR) 12-Nov-2002 20.0 22.0 22.2 23.0 23.4 23.9 24.4 25.7 26.3 26.8 27.1 26.0 26.0 26.9 27.2 29.4 25.2 26.3Guyana (LAC) 12-Aug-1993 18.3 30.4 18.9 17.3 22.6 59.5 42.3 90.8 41.0 27.8 29.2 39.9 24.4 19.8 14.3 10.4 11.9 53.2Haiti (LAC) 29-Mar-2000 0.0 0.0 - - - - - 169.0 169.0 169.0 - - 169.0 169.0 181.2 115.9 132.5 169.0Honduras (LAC) 14-Oct-1993 87.7 0.0 - - - - 114.8 117.5 523.3 354.1 157.4 334.8 172.3 121.6 131.2 219.1 167.8 331.6India (ASIA) 19-Jun-1992 2,202.0 4,357.5 0.0 0.0 4,501.0 5,276.8 6,387.0 6,402.4 6,937.4 6,703.3 5,264.7 4,142.9 5,614.3 4,514.3 3,917.7 2,631.5 2,241.6 6,681.0Indonesia (ASIA) 26-Jun-1992 350.2 1,457.1 - - 5,249.0 4,363.4 6,910.0 8,351.2 9,012.0 7,634.8 6,182.8 5,865.8 5,411.1 5,003.3 5,506.3 4,829.3 3,925.5 8,332.7Iran (Islamic Republic of) (ASIA) 3-Oct-1990 1,275.9 2,235.0 1,365.8 4,750.0 4,750.0 4,495.0 4,327.6 4,140.0 3,692.0 5,883.0 5,571.0 4,399.0 4,156.5 4,204.8 4,437.8 4,088.8 3,471.9 4,571.7Jamaica (LAC) 31-Mar-1993 196.1 399.9 423.9 350.1 464.0 66.2 49.2 82.0 91.1 106.6 199.0 210.4 59.8 48.6 31.7 16.2 N.R. 93.2Jordan (ASIA) 31-May-1989 536.6 594.0 540.0 545.0 531.0 580.0 520.0 535.0 627.4 857.4 647.2 398.0 354.0 321.0 90.0 74.4 58.4 673.3Kenya (AFR) 9-Nov-1988 230.0 230.0 230.0 105.0 47.0 47.0 273.0 301.0 166.8 250.6 245.3 241.1 203.3 168.6 152.3 168.6 131.7 239.5Kiribati (ASIA) 7-Jan-1993 0.8 0.0 - 0.0 - 0.8 0.8 0.8 0.7 0.6 0.5 0.0 0.0 0.0 0.0 0.0 0.0 0.7Kuwait (ASIA) 23-Nov-1992 2,527.6 1,756.6 - - - 546.0 600.2 484.6 471.9 484.8 399.2 450.0 419.9 354.2 349.0 247.4 233.0 480.4Kyrgyzstan (ASIA) 31-May-2000 122.1 - - 117.6 106.2 92.5 84.7 81.5 67.4 69.6 56.8 52.4 53.5 53.0 38.0 33.0 22.9 72.8Lao People's Democratic Republic (ASIA) 21-Aug-1998 2.3 - - - 3.6 - - 43.3 43.3 43.3 43.3 44.1 44.6 41.2 42.3 35.3 23.1 43.3
Lebanon (ASIA) 31-Mar-1993 287.4 431.6 - - - 908.0 725.7 819.8 735.3 621.3 475.3 463.4 527.9 533.4 491.7 480.2 347.0 725.5Lesotho (AFR) 25-Mar-1994 4.8 6.0 - - - - 5.1 6.0 5.9 3.5 3.4 2.8 2.4 1.8 1.6 1.4 1.2 5.1Liberia (AFR) 15-Jan-1996 54.3 50.1 26.1 64.1 65.2 42.1 33.1 45.2 67.4 55.7 31.1 18.2 41.4 25.1 32.8 26.3 14.2 56.1Libyan Arab Jamahiriya (AFR) 11-Jul-1990 299.2 0.0 66.6 531.2 673.6 704.2 643.0 772.8 729.8 647.5 659.8 894.0 985.4 985.4 985.4 704.1 459.0 716.7Madagascar (AFR) 7-Nov-1996 49.0 49.0 - - - - - 19.5 20.5 103.6 23.9 26.3 12.4 9.9 7.8 7.2 7.1 47.9Malawi (AFR) 9-Jan-1991 14.3 - - 23.1 45.6 88.0 30.0 61.5 55.9 55.6 56.9 50.4 21.5 19.0 19.0 18.7 11.4 57.7Malaysia (ASIA) 29-Aug-1989 2,190.2 3,442.1 3,384.2 3,829.3 3,420.5 3,624.2 4,729.8 3,426.6 3,038.2 3,348.4 2,333.7 2,010.1 1,979.8 1,946.9 1,605.5 1,174.4 1,128.5 3,271.1Maldives (ASIA) 16-May-1989 0.1 2.2 3.5 5.9 5.8 6.3 7.2 5.9 0.0 7.8 0.9 1.5 4.6 14.0 2.8 0.0 0.0 4.6Mali (AFR) 28-Oct-1994 26.2 - 0.0 0.0 0.0 0.0 0.0 103.9 109.3 111.1 113.1 37.1 29.2 27.0 26.0 26.0 25.0 108.1Marshall Islands (ASIA) 11-Mar-1993 1.2 1.2 1.2 1.2 1.2 1.2 1.2 1.2 1.1 1.1 0.6 1.1 0.5 0.2 0.2 0.2 0.0 1.2Mauritania (AFR) 26-May-1994 14.8 17.3 - - - - 17.3 23.2 7.8 16.0 14.7 13.4 14.2 15.0 14.7 14.3 N.R. 15.7Mauritius (AFR) 18-Aug-1992 57.2 75.8 - - 66.6 64.1 42.3 23.9 36.2 27.3 39.0 18.6 19.1 14.5 7.3 4.0 3.4 29.1Mexico (LAC) 31-Mar-1988 8,818.2 9,223.3 12,037.2 10,290.7 8,512.8 9,198.2 9,652.0 4,858.7 4,858.8 4,157.2 3,482.9 2,837.9 3,059.5 2,223.9 1,946.7 1,983.2 3,208.4 4,624.9Micronesia (Federated States of) (ASIA) 6-Sep-1995 1.3 0.0 - 0.0 - - - 1.3 1.1 1.2 1.2 1.2 1.0 1.1 1.9 1.7 1.5 1.2
Mongolia (ASIA) 7-Mar-1996 7.2 7.2 - - - - - 7.2 12.2 12.5 13.2 12.4 11.2 9.3 6.9 5.7 4.1 10.6Morocco (AFR) 28-Dec-1995 346.0 558.8 604.2 690.9 1,069.6 629.6 756.8 706.8 814.0 886.0 923.6 870.6 564.0 435.2 668.6 474.8 329.0 802.3Mozambique (AFR) 9-Sep-1994 55.5 18.1 - - - - 18.1 20.3 21.7 12.7 3.2 13.8 9.9 8.4 9.9 1.7 N.R. 18.2Myanmar (ASIA) 24-Nov-1993 1.4 - - - 16.4 - 2.1 49.5 58.6 54.8 52.3 30.7 26.3 39.4 43.5 51.6 29.6 54.3
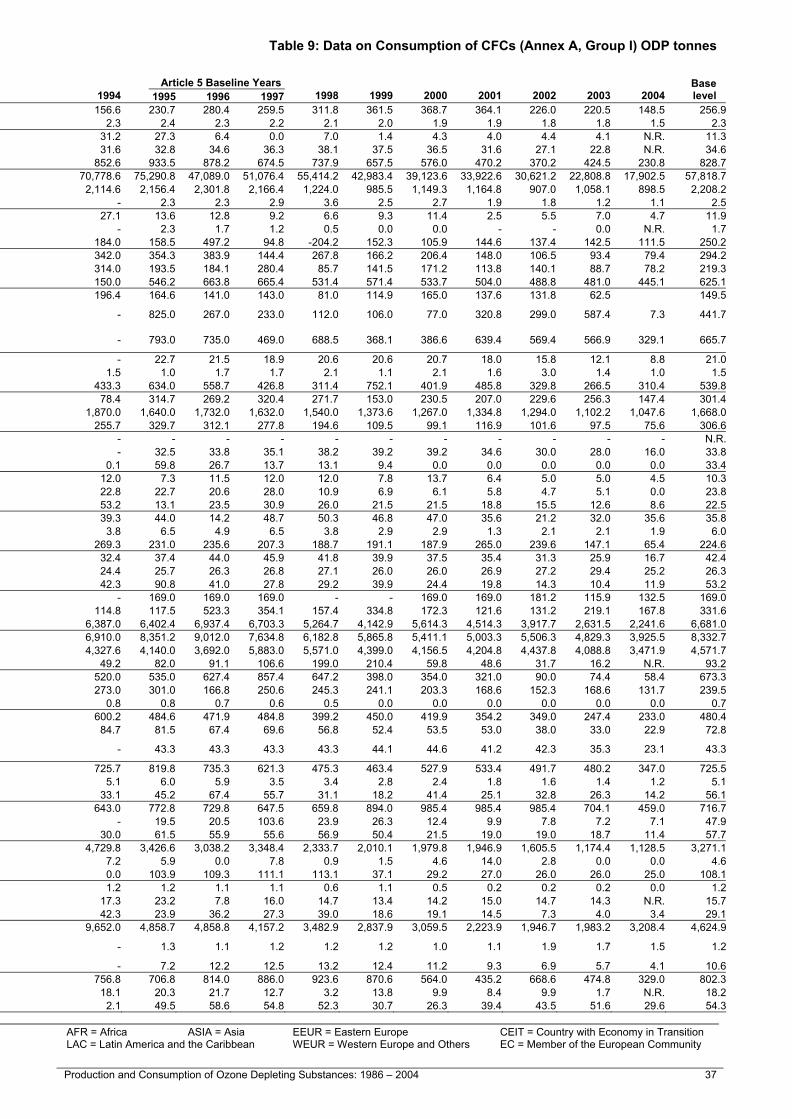
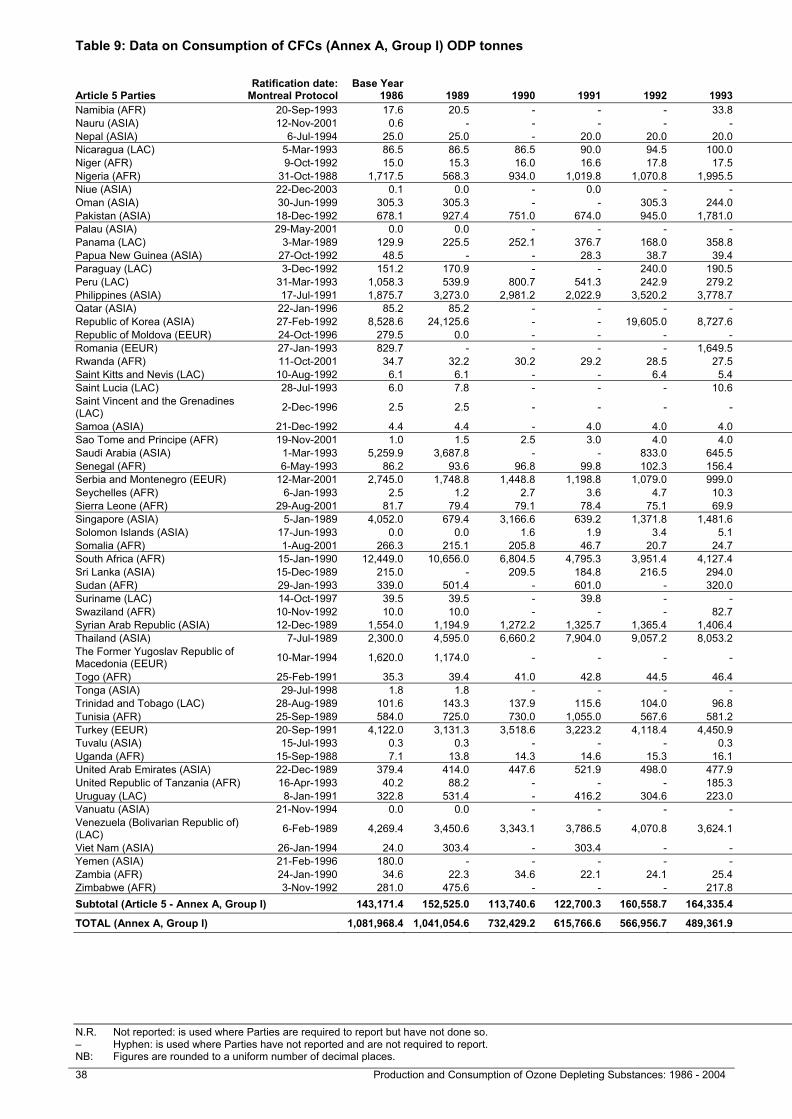
Table 9: Data on Consumption of CFCs (Annex A, Group I) ODP tonnes Table 9: Data on Consumption of CFCs (Annex A, Group I) ODP tonnes
N.R. Not reported: is used where Parties are required to report but have not done so. AFR = Africa ASIA = Asia EEUR = Eastern Europe CEIT = Country with Economy in Transition – Hyphen: is used where Parties have not reported and are not required to report. LAC = Latin America and the Caribbean WEUR = Western Europe and Others EC = Member of the European Community NB: Figures are rounded to a uniform number of decimal places.
38 Production and Consumption of Ozone Depleting Substances: 1986 - 2004 Production and Consumption of Ozone Depleting Substances: 1986 – 2004 39
Article 5 Baseline YearsArticle 5 Parties
Ratification date: Montreal Protocol
Base Year 1986 1989 1990 1991 1992 1993 1994 1995 1996 1997 1998 1999 2000 2001 2002 2003 2004
Baselevel
Namibia (AFR) 20-Sep-1993 17.6 20.5 - - - 33.8 34.6 27.1 19.3 19.3 16.4 16.8 22.1 24.0 20.0 17.2 7.7 21.9Nauru (ASIA) 12-Nov-2001 0.6 - - - - - - 0.6 0.5 0.5 0.5 0.4 0.4 0.4 0.0 0.0 N.R. 0.5Nepal (ASIA) 6-Jul-1994 25.0 25.0 - 20.0 20.0 20.0 20.0 25.0 27.0 29.0 32.9 25.0 94.0 0.0 0.0 0.0 0.0 27.0Nicaragua (LAC) 5-Mar-1993 86.5 86.5 86.5 90.0 94.5 100.0 105.5 110.0 82.7 55.7 37.3 52.6 44.4 35.2 54.9 29.9 48.4 82.8Niger (AFR) 9-Oct-1992 15.0 15.3 16.0 16.6 17.8 17.5 17.5 18.6 18.1 59.4 60.7 58.3 39.9 29.1 26.6 24.5 23.0 32.0Nigeria (AFR) 31-Oct-1988 1,717.5 568.3 934.0 1,019.8 1,070.8 1,995.5 1,794.7 1,535.6 4,548.1 4,866.2 4,761.5 4,286.2 4,094.8 3,665.5 3,286.7 2,662.4 2,116.1 3,650.0Niue (ASIA) 22-Dec-2003 0.1 0.0 - 0.0 - - - 0.1 0.1 0.0 0.0 0.0 0.0 - - 0.0 0.0 0.0Oman (ASIA) 30-Jun-1999 305.3 305.3 - - 305.3 244.0 308.6 229.9 264.9 250.5 261.1 259.6 282.1 207.3 179.5 134.5 98.7 248.4Pakistan (ASIA) 18-Dec-1992 678.1 927.4 751.0 674.0 945.0 1,781.0 1,823.0 2,103.7 1,670.8 1,263.8 1,196.0 1,421.8 1,945.3 1,666.3 1,647.0 1,124.0 805.0 1,679.4Palau (ASIA) 29-May-2001 0.0 0.0 - - - - - 1.7 1.1 2.1 2.1 0.4 0.6 0.6 0.1 1.0 0.9 1.6Panama (LAC) 3-Mar-1989 129.9 225.5 252.1 376.7 168.0 358.8 254.2 439.7 354.8 357.9 346.0 301.1 249.9 180.4 195.3 168.5 134.7 384.2Papua New Guinea (ASIA) 27-Oct-1992 48.5 - - 28.3 38.7 39.4 52.8 9.7 62.7 36.4 45.2 35.5 47.9 15.0 34.6 22.7 17.2 36.3Paraguay (LAC) 3-Dec-1992 151.2 170.9 - - 240.0 190.5 221.0 211.2 180.4 240.1 113.4 345.3 153.5 116.0 96.9 91.8 141.0 210.6Peru (LAC) 31-Mar-1993 1,058.3 539.9 800.7 541.3 242.9 279.2 248.6 366.8 243.0 258.8 326.7 295.6 347.0 189.0 196.5 178.4 145.7 289.5Philippines (ASIA) 17-Jul-1991 1,875.7 3,273.0 2,981.2 2,022.9 3,520.2 3,778.7 3,959.4 3,381.7 3,039.0 2,746.8 2,130.2 2,087.6 2,905.2 2,049.4 1,644.5 1,422.4 1,389.8 3,055.9Qatar (ASIA) 22-Jan-1996 85.2 85.2 - - - - - 90.9 102.4 111.0 120.8 89.0 85.8 85.4 86.7 95.1 63.7 101.4Republic of Korea (ASIA) 27-Feb-1992 8,528.6 24,125.6 - - 19,605.0 8,727.6 10,069.6 10,039.0 8,220.2 9,220.2 5,298.8 7,402.6 7,395.4 6,802.2 6,646.6 5,171.6 5,012.2 9,159.8Republic of Moldova (EEUR) 24-Oct-1996 279.5 0.0 - - - - - 85.4 51.5 83.1 40.5 11.1 31.7 23.5 29.6 18.9 20.0 73.3Romania (EEUR) 27-Jan-1993 829.7 - - - - 1,649.5 960.2 544.0 762.8 720.5 582.0 338.2 360.6 185.7 359.4 362.1 116.7 675.8Rwanda (AFR) 11-Oct-2001 34.7 32.2 30.2 29.2 28.5 27.5 19.8 26.5 30.2 34.4 37.7 30.1 30.1 30.1 30.1 30.1 27.1 30.4Saint Kitts and Nevis (LAC) 10-Aug-1992 6.1 6.1 - - 6.4 5.4 4.7 4.1 3.4 3.6 1.6 2.6 7.0 6.6 5.3 2.8 3.3 3.7Saint Lucia (LAC) 28-Jul-1993 6.0 7.8 - - - 10.6 7.7 8.1 8.3 8.5 6.3 3.2 4.2 4.1 7.6 2.5 0.8 8.3Saint Vincent and the Grenadines (LAC) 2-Dec-1996 2.5 2.5 - - - - - 2.3 0.8 2.2 2.3 10.0 6.0 6.9 6.0 3.1 2.1 1.8
Samoa (ASIA) 21-Dec-1992 4.4 4.4 - 4.0 4.0 4.0 4.0 4.4 4.5 4.5 2.6 6.1 0.6 2.0 2.2 0.0 N.R. 4.5Sao Tome and Principe (AFR) 19-Nov-2001 1.0 1.5 2.5 3.0 4.0 4.0 4.0 4.8 4.2 5.2 3.8 3.4 3.9 4.1 4.3 4.6 4.0 4.7Saudi Arabia (ASIA) 1-Mar-1993 5,259.9 3,687.8 - - 833.0 645.5 2,081.5 1,828.4 1,668.2 1,899.0 1,921.8 1,710.4 1,593.6 1,593.0 1,531.0 1,300.0 N.R. 1,798.5Senegal (AFR) 6-May-1993 86.2 93.6 96.8 99.8 102.3 156.4 117.7 151.0 178.4 138.1 128.5 121.1 116.5 98.0 71.9 51.0 40.0 155.8Serbia and Montenegro (EEUR) 12-Mar-2001 2,745.0 1,748.8 1,448.8 1,198.8 1,079.0 999.0 868.0 819.6 895.6 832.5 519.4 548.6 309.7 263.3 371.7 412.0 282.8 849.2Seychelles (AFR) 6-Jan-1993 2.5 1.2 2.7 3.6 4.7 10.3 3.7 3.9 2.2 2.5 2.0 1.1 0.8 0.7 1.5 0.6 0.0 2.8Sierra Leone (AFR) 29-Aug-2001 81.7 79.4 79.1 78.4 75.1 69.9 68.5 67.1 86.7 81.9 81.0 75.9 75.9 92.9 80.8 66.3 64.5 78.6Singapore (ASIA) 5-Jan-1989 4,052.0 679.4 3,166.6 639.2 1,371.8 1,481.6 791.6 773.6 36.8 -178.9 16.7 24.1 21.7 21.6 0.9 11.1 6.6 210.5Solomon Islands (ASIA) 17-Jun-1993 0.0 0.0 1.6 1.9 3.4 5.1 0.2 2.1 2.0 2.3 0.8 6.2 0.3 0.6 0.5 0.8 1.1 2.0Somalia (AFR) 1-Aug-2001 266.3 215.1 205.8 46.7 20.7 24.7 28.3 241.1 241.3 241.7 246.9 48.6 65.6 86.9 98.5 108.2 97.2 241.4South Africa (AFR) 15-Jan-1990 12,449.0 10,656.0 6,804.5 4,795.3 3,951.4 4,127.4 2,416.6 1,679.6 0.0 98.3 155.1 117.3 80.5 16.0 86.6 60.8 61.8 592.6Sri Lanka (ASIA) 15-Dec-1989 215.0 - 209.5 184.8 216.5 294.0 346.6 520.5 497.8 318.5 250.4 216.4 220.3 190.4 185.0 179.9 155.7 445.6Sudan (AFR) 29-Jan-1993 339.0 501.4 - 601.0 - 320.0 338.0 635.0 429.5 306.0 294.5 294.5 291.5 266.0 253.0 216.0 203.0 456.8Suriname (LAC) 14-Oct-1997 39.5 39.5 - 39.8 - - - 41.0 41.0 42.0 42.0 43.0 44.0 46.0 46.0 12.3 9.2 41.3Swaziland (AFR) 10-Nov-1992 10.0 10.0 - - - 82.7 82.7 35.4 22.1 16.3 2.2 2.1 0.1 1.3 1.2 1.9 3.1 24.6Syrian Arab Republic (ASIA) 12-Dec-1989 1,554.0 1,194.9 1,272.2 1,325.7 1,365.4 1,406.4 2,380.0 2,370.2 2,260.0 2,043.7 1,245.6 1,280.7 1,174.7 1,392.2 1,201.6 1,124.6 928.3 2,224.6Thailand (ASIA) 7-Jul-1989 2,300.0 4,595.0 6,660.2 7,904.0 9,057.2 8,053.2 6,865.2 8,248.0 5,550.2 4,448.0 3,783.0 3,610.6 3,568.3 3,375.1 2,177.3 1,857.0 1,358.3 6,082.1The Former Yugoslav Republic of Macedonia (EEUR) 10-Mar-1994 1,620.0 1,174.0 - - - - 206.0 558.0 514.0 487.1 62.8 191.9 49.5 46.7 34.1 49.3 8.8 519.7
Togo (AFR) 25-Feb-1991 35.3 39.4 41.0 42.8 44.5 46.4 48.3 50.4 33.7 35.2 36.7 41.7 37.5 34.7 35.3 33.7 26.4 39.8Tonga (ASIA) 29-Jul-1998 1.8 1.8 - - - - - 1.8 0.9 1.2 0.0 83.4 0.5 0.7 0.8 0.3 0.0 1.3Trinidad and Tobago (LAC) 28-Aug-1989 101.6 143.3 137.9 115.6 104.0 96.8 108.6 111.3 114.1 134.6 155.6 81.7 101.3 79.2 63.6 62.5 35.0 120.0Tunisia (AFR) 25-Sep-1989 584.0 725.0 730.0 1,055.0 567.6 581.2 508.1 758.0 882.0 970.2 790.6 566.0 555.0 570.0 465.8 362.5 271.0 870.1Turkey (EEUR) 20-Sep-1991 4,122.0 3,131.3 3,518.6 3,223.2 4,118.4 4,450.9 2,660.8 3,788.8 3,758.8 3,869.6 3,985.0 1,791.1 820.2 731.2 698.9 440.9 257.6 3,805.7Tuvalu (ASIA) 15-Jul-1993 0.3 0.3 - - - 0.3 0.3 0.3 0.4 0.3 0.3 0.2 0.0 0.0 0.0 0.0 0.0 0.3Uganda (AFR) 15-Sep-1988 7.1 13.8 14.3 14.6 15.3 16.1 9.2 11.8 12.8 13.9 11.4 12.2 12.7 13.4 12.7 4.1 0.2 12.8United Arab Emirates (ASIA) 22-Dec-1989 379.4 414.0 447.6 521.9 498.0 477.9 425.0 513.8 511.2 562.8 737.4 529.2 476.2 423.4 370.4 317.5 291.0 529.3United Republic of Tanzania (AFR) 16-Apr-1993 40.2 88.2 - - - 185.3 262.9 280.4 293.6 187.7 131.5 88.9 215.5 131.2 71.5 148.2 98.8 253.9Uruguay (LAC) 8-Jan-1991 322.8 531.4 - 416.2 304.6 223.0 311.8 232.0 172.1 193.1 194.0 111.4 106.8 102.3 75.2 111.4 90.9 199.1Vanuatu (ASIA) 21-Nov-1994 0.0 0.0 - - - - - 0.0 0.0 0.0 0.0 0.0 0.0 0.0 0.0 0.0 0.0 0.0Venezuela (Bolivarian Republic of) (LAC) 6-Feb-1989 4,269.4 3,450.6 3,343.1 3,786.5 4,070.8 3,624.1 3,092.9 3,220.0 3,040.9 3,703.9 3,213.9 1,922.1 2,705.9 2,546.2 1,552.8 1,313.5 2,944.6 3,322.4
Viet Nam (ASIA) 26-Jan-1994 24.0 303.4 - 303.4 - - 380.0 480.0 520.0 500.0 392.0 293.9 220.0 243.0 235.5 243.7 241.0 500.0Yemen (ASIA) 21-Feb-1996 180.0 - - - - - - 2,350.2 1,673.7 1,364.4 1,060.8 1,040.7 1,045.0 1,023.4 959.9 758.6 746.4 1,796.1Zambia (AFR) 24-Jan-1990 34.6 22.3 34.6 22.1 24.1 25.4 37.8 23.0 30.4 28.7 26.7 24.3 23.3 11.8 10.6 10.4 10.0 27.4Zimbabwe (AFR) 3-Nov-1992 281.0 475.6 - - - 217.8 475.6 462.1 456.6 435.4 390.2 229.1 145.0 259.4 129.1 117.5 112.9 451.4Subtotal (Article 5 - Annex A, Group I) 143,171.4 152,525.0 113,740.6 122,700.3 160,558.7 164,335.4 177,290.2 187,656.5 152,297.7 152,637.9 140,921.1 124,154.3 116,431.3 103,322.7 90,799.5 75,432.2 62,780.9 164,199.5
TOTAL (Annex A, Group I) 1,081,968.4 1,041,054.6 732,429.2 615,766.6 566,956.7 489,361.9 358,924.5 283,822.2 176,626.4 173,499.4 163,141.0 149,413.1 146,853.4 109,985.5 92,309.0 77,821.6 64,345.3 1,102,996.5
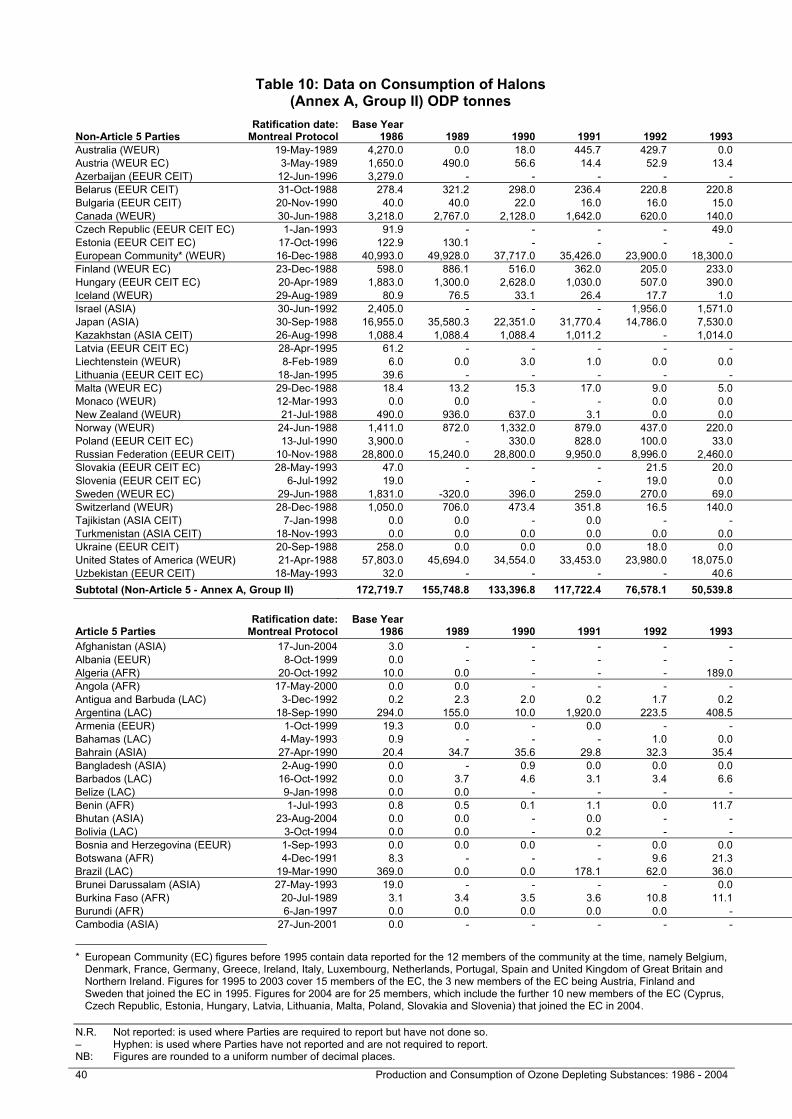
Table 10: Data on Consumption of Halons (Annex A, Group II) ODP tonnes
N.R. Not reported: is used where Parties are required to report but have not done so. AFR = Africa ASIA = Asia EEUR = Eastern Europe CEIT = Country with Economy in Transition – Hyphen: is used where Parties have not reported and are not required to report. LAC = Latin America and the Caribbean WEUR = Western Europe and Others EC = Member of the European Community NB: Figures are rounded to a uniform number of decimal places.
40 Production and Consumption of Ozone Depleting Substances: 1986 - 2004 Production and Consumption of Ozone Depleting Substances: 1986 – 2004 41
Table 10: Data on Consumption of Halons (Annex A, Group II) ODP tonnes
Non-Article 5 Parties Ratification date:
Montreal ProtocolBase Year
1986 1989 1990 1991 1992 1993 1994 1995 1996 1997 1998 1999 2000 2001 2002 2003 2004Baselevel
Australia (WEUR) 19-May-1989 4,270.0 0.0 18.0 445.7 429.7 0.0 0.0 0.0 0.0 0.0 -19.5 0.0 -11.7 -3.3 -3.9 0.0 -33.0 4,270.0Austria (WEUR EC) 3-May-1989 1,650.0 490.0 56.6 14.4 52.9 13.4 14.5 1,650.0Azerbaijan (EEUR CEIT) 12-Jun-1996 3,279.0 - - - - - - - 501.2 25.8 0.0 0.0 0.0 0.0 0.0 0.0 0.0 3,279.0Belarus (EEUR CEIT) 31-Oct-1988 278.4 321.2 298.0 236.4 220.8 220.8 92.4 0.0 23.9 26.8 19.4 9.7 0.0 0.0 0.0 0.0 0.0 278.4Bulgaria (EEUR CEIT) 20-Nov-1990 40.0 40.0 22.0 16.0 16.0 15.0 16.0 16.0 1.6 1.6 0.0 0.0 0.0 0.0 0.0 0.0 0.0 40.0Canada (WEUR) 30-Jun-1988 3,218.0 2,767.0 2,128.0 1,642.0 620.0 140.0 0.0 0.0 0.0 0.0 -25.8 0.0 0.0 0.0 0.0 0.0 0.0 3,218.0Czech Republic (EEUR CEIT EC) 1-Jan-1993 91.9 - - - - 49.0 113.0 3.0 0.0 0.0 0.0 0.0 0.0 0.0 0.0 0.0 91.9Estonia (EEUR CEIT EC) 17-Oct-1996 122.9 130.1 - - - - - 0.0 0.0 0.0 -16.2 0.0 -0.3 0.0 0.0 0.0 122.9European Community* (WEUR) 16-Dec-1988 40,993.0 49,928.0 37,717.0 35,426.0 23,900.0 18,300.0 -78.0 0.0 0.0 0.0 0.0 0.0 0.0 -403.0 -1,609.0 0.0 -7,834.0 40,993.0Finland (WEUR EC) 23-Dec-1988 598.0 886.1 516.0 362.0 205.0 233.0 0.0 598.0Hungary (EEUR CEIT EC) 20-Apr-1989 1,883.0 1,300.0 2,628.0 1,030.0 507.0 390.0 0.0 0.0 0.0 0.0 0.0 0.0 0.0 0.0 0.0 0.0 1,883.0Iceland (WEUR) 29-Aug-1989 80.9 76.5 33.1 26.4 17.7 1.0 0.0 0.0 0.0 0.0 0.0 0.0 0.0 0.0 0.0 0.0 0.0 80.9Israel (ASIA) 30-Jun-1992 2,405.0 - - - 1,956.0 1,571.0 0.0 0.0 0.0 0.0 0.0 0.0 0.0 0.0 0.0 0.0 0.0 2,405.0Japan (ASIA) 30-Sep-1988 16,955.0 35,580.3 22,351.0 31,770.4 14,786.0 7,530.0 0.0 0.0 -20.0 0.0 0.0 0.0 0.0 0.0 0.0 0.0 0.0 16,955.0Kazakhstan (ASIA CEIT) 26-Aug-1998 1,088.4 1,088.4 1,088.4 1,011.2 - 1,014.0 - - 878.4 838.2 905.7 76.2 13.2 7.2 2.4 0.0 0.0 1,088.4Latvia (EEUR CEIT EC) 28-Apr-1995 61.2 - - - - - - 30.0 0.0 0.0 0.0 0.0 0.0 0.0 0.0 0.0 61.2Liechtenstein (WEUR) 8-Feb-1989 6.0 0.0 3.0 1.0 0.0 0.0 0.0 0.0 0.0 0.0 0.0 0.0 0.0 0.0 0.0 0.0 N.R. 6.0Lithuania (EEUR CEIT EC) 18-Jan-1995 39.6 - - - - - 0.0 0.0 0.9 14.7 0.0 0.0 0.0 0.0 0.0 0.0 39.6Malta (WEUR EC) 29-Dec-1988 18.4 13.2 15.3 17.0 9.0 5.0 0.0 0.0 0.0 0.0 0.0 130.0 0.0 0.0 0.0 0.0 18.4Monaco (WEUR) 12-Mar-1993 0.0 0.0 - - 0.0 0.0 0.0 0.0 0.0 0.0 0.0 0.0 0.0 0.0 0.0 0.0 0.0 0.0New Zealand (WEUR) 21-Jul-1988 490.0 936.0 637.0 3.1 0.0 0.0 0.0 0.0 0.0 0.0 0.0 0.0 -43.0 0.0 0.0 0.0 0.0 490.0Norway (WEUR) 24-Jun-1988 1,411.0 872.0 1,332.0 879.0 437.0 220.0 0.0 0.0 0.0 0.0 0.0 0.0 0.0 0.0 0.0 -13.0 -20.6 1,411.0Poland (EEUR CEIT EC) 13-Jul-1990 3,900.0 - 330.0 828.0 100.0 33.0 0.0 0.0 0.0 0.0 0.0 0.0 0.0 0.0 0.0 0.0 3,900.0Russian Federation (EEUR CEIT) 10-Nov-1988 28,800.0 15,240.0 28,800.0 9,950.0 8,996.0 2,460.0 1,258.1 1,085.2 926.0 896.8 469.7 370.2 1,763.4 0.0 0.0 0.0 N.R. 28,800.0Slovakia (EEUR CEIT EC) 28-May-1993 47.0 - - - 21.5 20.0 0.0 0.0 0.0 0.0 0.0 0.0 0.0 0.0 0.0 0.0 47.0Slovenia (EEUR CEIT EC) 6-Jul-1992 19.0 - - - 19.0 0.0 -9.0 0.0 0.0 0.0 0.0 0.0 0.0 0.0 0.0 0.0 19.0Sweden (WEUR EC) 29-Jun-1988 1,831.0 -320.0 396.0 259.0 270.0 69.0 6.0 1,831.0Switzerland (WEUR) 28-Dec-1988 1,050.0 706.0 473.4 351.8 16.5 140.0 42.0 20.0 0.0 0.0 0.0 0.0 0.0 0.0 0.0 0.0 0.0 1,050.0Tajikistan (ASIA CEIT) 7-Jan-1998 0.0 0.0 - 0.0 - - - 0.0 0.0 0.0 0.0 0.0 0.0 0.0 0.0 0.0 0.0 0.0Turkmenistan (ASIA CEIT) 18-Nov-1993 0.0 0.0 0.0 0.0 0.0 0.0 0.0 0.0 0.0 0.0 0.0 0.0 0.0 0.0 0.0 0.0 0.0 0.0Ukraine (EEUR CEIT) 20-Sep-1988 258.0 0.0 0.0 0.0 18.0 0.0 0.0 0.0 63.6 0.0 0.0 0.0 0.0 0.0 0.0 0.0 0.0 258.0United States of America (WEUR) 21-Apr-1988 57,803.0 45,694.0 34,554.0 33,453.0 23,980.0 18,075.0 0.0 0.0 0.0 0.0 0.0 0.0 0.0 0.0 0.0 0.0 0.0 57,803.0Uzbekistan (EEUR CEIT) 18-May-1993 32.0 - - - - 40.6 0.0 0.0 0.0 0.0 0.0 0.0 0.0 0.0 0.0 0.0 0.0 32.0Subtotal (Non-Article 5 - Annex A, Group II) 172,719.7 155,748.8 133,396.8 117,722.4 76,578.1 50,539.8 1,455.0 1,154.2 2,375.6 1,803.9 1,333.3 586.1 1,721.6 -399.1 -1,610.5 -13.0 -7,887.6 172,719.7
Article 5 Baseline YearsArticle 5 Parties
Ratification date: Montreal Protocol
Base Year 1986 1989 1990 1991 1992 1993 1994 1995 1996 1997 1998 1999 2000 2001 2002 2003 2004
Baselevel
Afghanistan (ASIA) 17-Jun-2004 3.0 - - - - - - 1.9 1.9 1.9 - - - - - - 0.1 1.9Albania (EEUR) 8-Oct-1999 0.0 - - - - - - 0.0 0.0 0.0 0.0 0.0 0.0 0.0 0.0 0.0 0.0 0.0Algeria (AFR) 20-Oct-1992 10.0 0.0 - - - 189.0 83.0 195.0 322.0 195.0 195.0 195.0 195.0 169.0 169.0 169.0 80.0 237.3Angola (AFR) 17-May-2000 0.0 0.0 - - - - - 0.0 0.0 0.0 0.0 - 0.0 0.0 0.0 0.0 0.0 0.0Antigua and Barbuda (LAC) 3-Dec-1992 0.2 2.3 2.0 0.2 1.7 0.2 0.5 0.4 0.4 0.0 0.0 0.0 0.0 0.0 0.0 0.0 0.0 0.3Argentina (LAC) 18-Sep-1990 294.0 155.0 10.0 1,920.0 223.5 408.5 383.3 360.0 143.4 0.0 -1.0 0.0 0.0 0.0 0.0 0.0 0.0 167.8Armenia (EEUR) 1-Oct-1999 19.3 0.0 - 0.0 - - - 0.0 0.0 0.0 0.0 0.0 0.0 0.0 0.0 0.0 0.0 0.0Bahamas (LAC) 4-May-1993 0.9 - - - 1.0 0.0 0.0 0.0 0.0 0.0 0.0 0.0 0.0 0.0 0.0 0.0 0.0 0.0Bahrain (ASIA) 27-Apr-1990 20.4 34.7 35.6 29.8 32.3 35.4 41.4 43.5 38.1 35.0 12.5 17.5 16.0 5.0 0.0 4.4 0.0 38.9Bangladesh (ASIA) 2-Aug-1990 0.0 - 0.9 0.0 0.0 0.0 3.5 0.0 0.0 0.0 0.0 0.0 0.0 0.0 0.0 0.0 0.0 0.0Barbados (LAC) 16-Oct-1992 0.0 3.7 4.6 3.1 3.4 6.6 0.0 0.0 0.0 0.0 0.0 0.0 0.0 0.0 0.0 0.0 0.0 0.0Belize (LAC) 9-Jan-1998 0.0 0.0 - - - - - 0.0 0.0 0.0 0.0 26.2 0.0 0.0 0.0 0.0 0.0 0.0Benin (AFR) 1-Jul-1993 0.8 0.5 0.1 1.1 0.0 11.7 11.7 11.7 0.0 0.0 0.0 0.0 0.0 0.0 0.0 0.0 0.0 3.9Bhutan (ASIA) 23-Aug-2004 0.0 0.0 - 0.0 - - - 0.0 0.0 0.8 0.0 0.0 0.0 - - - 0.0 0.3Bolivia (LAC) 3-Oct-1994 0.0 0.0 - 0.2 - - 0.3 0.0 0.0 0.0 0.0 0.0 0.0 0.0 0.0 0.0 0.0 0.0Bosnia and Herzegovina (EEUR) 1-Sep-1993 0.0 0.0 0.0 - 0.0 0.0 0.0 4.1 4.1 4.1 0.0 0.0 0.0 0.0 0.0 4.1 4.1 4.1Botswana (AFR) 4-Dec-1991 8.3 - - - 9.6 21.3 1.9 6.3 0.3 9.0 0.0 0.0 2.2 4.5 4.2 0.6 0.6 5.2Brazil (LAC) 19-Mar-1990 369.0 0.0 0.0 178.1 62.0 36.0 20.0 20.0 22.0 22.0 10.0 3.0 0.0 4.6 20.0 2.1 9.0 21.3Brunei Darussalam (ASIA) 27-May-1993 19.0 - - - - 0.0 0.0 0.0 0.0 0.0 0.0 0.0 0.0 0.0 0.0 0.0 N.R. 0.0Burkina Faso (AFR) 20-Jul-1989 3.1 3.4 3.5 3.6 10.8 11.1 3.9 11.7 4.2 0.0 0.0 0.0 0.0 0.0 0.0 0.0 0.0 5.3Burundi (AFR) 6-Jan-1997 0.0 0.0 0.0 0.0 0.0 - - 0.0 0.0 0.0 0.0 0.0 0.0 0.0 0.0 0.0 0.0 0.0Cambodia (ASIA) 27-Jun-2001 0.0 - - - - - - 0.0 0.0 0.0 0.0 0.0 0.0 0.0 0.0 0.0 0.0 0.0
* European Community (EC) figures before 1995 contain data reported for the 12 members of the community at the time, namely Belgium,
Denmark, France, Germany, Greece, Ireland, Italy, Luxembourg, Netherlands, Portugal, Spain and United Kingdom of Great Britain and Northern Ireland. Figures for 1995 to 2003 cover 15 members of the EC, the 3 new members of the EC being Austria, Finland and Sweden that joined the EC in 1995. Figures for 2004 are for 25 members, which include the further 10 new members of the EC (Cyprus, Czech Republic, Estonia, Hungary, Latvia, Lithuania, Malta, Poland, Slovakia and Slovenia) that joined the EC in 2004.
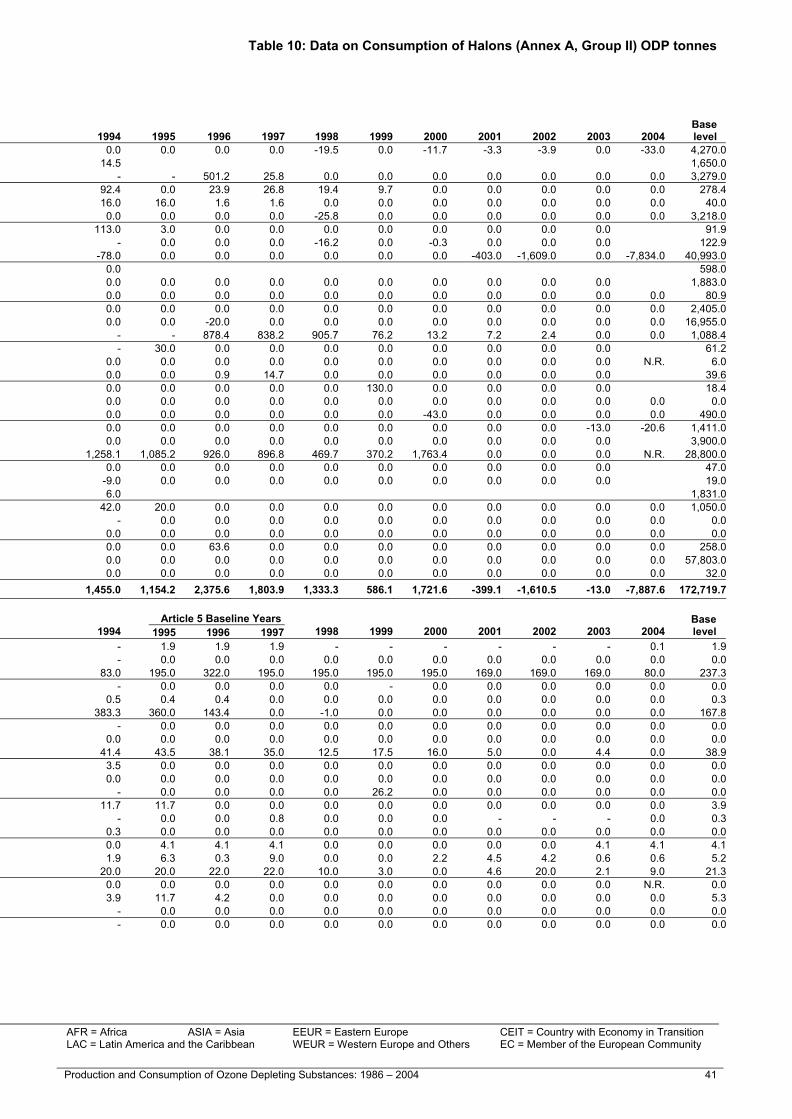
Table 10: Data on Consumption of Halons (Annex A, Group II) ODP tonnes
N.R. Not reported: is used where Parties are required to report but have not done so. AFR = Africa ASIA = Asia EEUR = Eastern Europe CEIT = Country with Economy in Transition – Hyphen: is used where Parties have not reported and are not required to report. LAC = Latin America and the Caribbean WEUR = Western Europe and Others EC = Member of the European Community NB: Figures are rounded to a uniform number of decimal places.
40 Production and Consumption of Ozone Depleting Substances: 1986 - 2004 Production and Consumption of Ozone Depleting Substances: 1986 – 2004 41
Table 10: Data on Consumption of Halons (Annex A, Group II) ODP tonnes
Non-Article 5 Parties Ratification date:
Montreal ProtocolBase Year
1986 1989 1990 1991 1992 1993 1994 1995 1996 1997 1998 1999 2000 2001 2002 2003 2004Baselevel
Australia (WEUR) 19-May-1989 4,270.0 0.0 18.0 445.7 429.7 0.0 0.0 0.0 0.0 0.0 -19.5 0.0 -11.7 -3.3 -3.9 0.0 -33.0 4,270.0Austria (WEUR EC) 3-May-1989 1,650.0 490.0 56.6 14.4 52.9 13.4 14.5 1,650.0Azerbaijan (EEUR CEIT) 12-Jun-1996 3,279.0 - - - - - - - 501.2 25.8 0.0 0.0 0.0 0.0 0.0 0.0 0.0 3,279.0Belarus (EEUR CEIT) 31-Oct-1988 278.4 321.2 298.0 236.4 220.8 220.8 92.4 0.0 23.9 26.8 19.4 9.7 0.0 0.0 0.0 0.0 0.0 278.4Bulgaria (EEUR CEIT) 20-Nov-1990 40.0 40.0 22.0 16.0 16.0 15.0 16.0 16.0 1.6 1.6 0.0 0.0 0.0 0.0 0.0 0.0 0.0 40.0Canada (WEUR) 30-Jun-1988 3,218.0 2,767.0 2,128.0 1,642.0 620.0 140.0 0.0 0.0 0.0 0.0 -25.8 0.0 0.0 0.0 0.0 0.0 0.0 3,218.0Czech Republic (EEUR CEIT EC) 1-Jan-1993 91.9 - - - - 49.0 113.0 3.0 0.0 0.0 0.0 0.0 0.0 0.0 0.0 0.0 91.9Estonia (EEUR CEIT EC) 17-Oct-1996 122.9 130.1 - - - - - 0.0 0.0 0.0 -16.2 0.0 -0.3 0.0 0.0 0.0 122.9European Community* (WEUR) 16-Dec-1988 40,993.0 49,928.0 37,717.0 35,426.0 23,900.0 18,300.0 -78.0 0.0 0.0 0.0 0.0 0.0 0.0 -403.0 -1,609.0 0.0 -7,834.0 40,993.0Finland (WEUR EC) 23-Dec-1988 598.0 886.1 516.0 362.0 205.0 233.0 0.0 598.0Hungary (EEUR CEIT EC) 20-Apr-1989 1,883.0 1,300.0 2,628.0 1,030.0 507.0 390.0 0.0 0.0 0.0 0.0 0.0 0.0 0.0 0.0 0.0 0.0 1,883.0Iceland (WEUR) 29-Aug-1989 80.9 76.5 33.1 26.4 17.7 1.0 0.0 0.0 0.0 0.0 0.0 0.0 0.0 0.0 0.0 0.0 0.0 80.9Israel (ASIA) 30-Jun-1992 2,405.0 - - - 1,956.0 1,571.0 0.0 0.0 0.0 0.0 0.0 0.0 0.0 0.0 0.0 0.0 0.0 2,405.0Japan (ASIA) 30-Sep-1988 16,955.0 35,580.3 22,351.0 31,770.4 14,786.0 7,530.0 0.0 0.0 -20.0 0.0 0.0 0.0 0.0 0.0 0.0 0.0 0.0 16,955.0Kazakhstan (ASIA CEIT) 26-Aug-1998 1,088.4 1,088.4 1,088.4 1,011.2 - 1,014.0 - - 878.4 838.2 905.7 76.2 13.2 7.2 2.4 0.0 0.0 1,088.4Latvia (EEUR CEIT EC) 28-Apr-1995 61.2 - - - - - - 30.0 0.0 0.0 0.0 0.0 0.0 0.0 0.0 0.0 61.2Liechtenstein (WEUR) 8-Feb-1989 6.0 0.0 3.0 1.0 0.0 0.0 0.0 0.0 0.0 0.0 0.0 0.0 0.0 0.0 0.0 0.0 N.R. 6.0Lithuania (EEUR CEIT EC) 18-Jan-1995 39.6 - - - - - 0.0 0.0 0.9 14.7 0.0 0.0 0.0 0.0 0.0 0.0 39.6Malta (WEUR EC) 29-Dec-1988 18.4 13.2 15.3 17.0 9.0 5.0 0.0 0.0 0.0 0.0 0.0 130.0 0.0 0.0 0.0 0.0 18.4Monaco (WEUR) 12-Mar-1993 0.0 0.0 - - 0.0 0.0 0.0 0.0 0.0 0.0 0.0 0.0 0.0 0.0 0.0 0.0 0.0 0.0New Zealand (WEUR) 21-Jul-1988 490.0 936.0 637.0 3.1 0.0 0.0 0.0 0.0 0.0 0.0 0.0 0.0 -43.0 0.0 0.0 0.0 0.0 490.0Norway (WEUR) 24-Jun-1988 1,411.0 872.0 1,332.0 879.0 437.0 220.0 0.0 0.0 0.0 0.0 0.0 0.0 0.0 0.0 0.0 -13.0 -20.6 1,411.0Poland (EEUR CEIT EC) 13-Jul-1990 3,900.0 - 330.0 828.0 100.0 33.0 0.0 0.0 0.0 0.0 0.0 0.0 0.0 0.0 0.0 0.0 3,900.0Russian Federation (EEUR CEIT) 10-Nov-1988 28,800.0 15,240.0 28,800.0 9,950.0 8,996.0 2,460.0 1,258.1 1,085.2 926.0 896.8 469.7 370.2 1,763.4 0.0 0.0 0.0 N.R. 28,800.0Slovakia (EEUR CEIT EC) 28-May-1993 47.0 - - - 21.5 20.0 0.0 0.0 0.0 0.0 0.0 0.0 0.0 0.0 0.0 0.0 47.0Slovenia (EEUR CEIT EC) 6-Jul-1992 19.0 - - - 19.0 0.0 -9.0 0.0 0.0 0.0 0.0 0.0 0.0 0.0 0.0 0.0 19.0Sweden (WEUR EC) 29-Jun-1988 1,831.0 -320.0 396.0 259.0 270.0 69.0 6.0 1,831.0Switzerland (WEUR) 28-Dec-1988 1,050.0 706.0 473.4 351.8 16.5 140.0 42.0 20.0 0.0 0.0 0.0 0.0 0.0 0.0 0.0 0.0 0.0 1,050.0Tajikistan (ASIA CEIT) 7-Jan-1998 0.0 0.0 - 0.0 - - - 0.0 0.0 0.0 0.0 0.0 0.0 0.0 0.0 0.0 0.0 0.0Turkmenistan (ASIA CEIT) 18-Nov-1993 0.0 0.0 0.0 0.0 0.0 0.0 0.0 0.0 0.0 0.0 0.0 0.0 0.0 0.0 0.0 0.0 0.0 0.0Ukraine (EEUR CEIT) 20-Sep-1988 258.0 0.0 0.0 0.0 18.0 0.0 0.0 0.0 63.6 0.0 0.0 0.0 0.0 0.0 0.0 0.0 0.0 258.0United States of America (WEUR) 21-Apr-1988 57,803.0 45,694.0 34,554.0 33,453.0 23,980.0 18,075.0 0.0 0.0 0.0 0.0 0.0 0.0 0.0 0.0 0.0 0.0 0.0 57,803.0Uzbekistan (EEUR CEIT) 18-May-1993 32.0 - - - - 40.6 0.0 0.0 0.0 0.0 0.0 0.0 0.0 0.0 0.0 0.0 0.0 32.0Subtotal (Non-Article 5 - Annex A, Group II) 172,719.7 155,748.8 133,396.8 117,722.4 76,578.1 50,539.8 1,455.0 1,154.2 2,375.6 1,803.9 1,333.3 586.1 1,721.6 -399.1 -1,610.5 -13.0 -7,887.6 172,719.7
Article 5 Baseline YearsArticle 5 Parties
Ratification date: Montreal Protocol
Base Year 1986 1989 1990 1991 1992 1993 1994 1995 1996 1997 1998 1999 2000 2001 2002 2003 2004
Baselevel
Afghanistan (ASIA) 17-Jun-2004 3.0 - - - - - - 1.9 1.9 1.9 - - - - - - 0.1 1.9Albania (EEUR) 8-Oct-1999 0.0 - - - - - - 0.0 0.0 0.0 0.0 0.0 0.0 0.0 0.0 0.0 0.0 0.0Algeria (AFR) 20-Oct-1992 10.0 0.0 - - - 189.0 83.0 195.0 322.0 195.0 195.0 195.0 195.0 169.0 169.0 169.0 80.0 237.3Angola (AFR) 17-May-2000 0.0 0.0 - - - - - 0.0 0.0 0.0 0.0 - 0.0 0.0 0.0 0.0 0.0 0.0Antigua and Barbuda (LAC) 3-Dec-1992 0.2 2.3 2.0 0.2 1.7 0.2 0.5 0.4 0.4 0.0 0.0 0.0 0.0 0.0 0.0 0.0 0.0 0.3Argentina (LAC) 18-Sep-1990 294.0 155.0 10.0 1,920.0 223.5 408.5 383.3 360.0 143.4 0.0 -1.0 0.0 0.0 0.0 0.0 0.0 0.0 167.8Armenia (EEUR) 1-Oct-1999 19.3 0.0 - 0.0 - - - 0.0 0.0 0.0 0.0 0.0 0.0 0.0 0.0 0.0 0.0 0.0Bahamas (LAC) 4-May-1993 0.9 - - - 1.0 0.0 0.0 0.0 0.0 0.0 0.0 0.0 0.0 0.0 0.0 0.0 0.0 0.0Bahrain (ASIA) 27-Apr-1990 20.4 34.7 35.6 29.8 32.3 35.4 41.4 43.5 38.1 35.0 12.5 17.5 16.0 5.0 0.0 4.4 0.0 38.9Bangladesh (ASIA) 2-Aug-1990 0.0 - 0.9 0.0 0.0 0.0 3.5 0.0 0.0 0.0 0.0 0.0 0.0 0.0 0.0 0.0 0.0 0.0Barbados (LAC) 16-Oct-1992 0.0 3.7 4.6 3.1 3.4 6.6 0.0 0.0 0.0 0.0 0.0 0.0 0.0 0.0 0.0 0.0 0.0 0.0Belize (LAC) 9-Jan-1998 0.0 0.0 - - - - - 0.0 0.0 0.0 0.0 26.2 0.0 0.0 0.0 0.0 0.0 0.0Benin (AFR) 1-Jul-1993 0.8 0.5 0.1 1.1 0.0 11.7 11.7 11.7 0.0 0.0 0.0 0.0 0.0 0.0 0.0 0.0 0.0 3.9Bhutan (ASIA) 23-Aug-2004 0.0 0.0 - 0.0 - - - 0.0 0.0 0.8 0.0 0.0 0.0 - - - 0.0 0.3Bolivia (LAC) 3-Oct-1994 0.0 0.0 - 0.2 - - 0.3 0.0 0.0 0.0 0.0 0.0 0.0 0.0 0.0 0.0 0.0 0.0Bosnia and Herzegovina (EEUR) 1-Sep-1993 0.0 0.0 0.0 - 0.0 0.0 0.0 4.1 4.1 4.1 0.0 0.0 0.0 0.0 0.0 4.1 4.1 4.1Botswana (AFR) 4-Dec-1991 8.3 - - - 9.6 21.3 1.9 6.3 0.3 9.0 0.0 0.0 2.2 4.5 4.2 0.6 0.6 5.2Brazil (LAC) 19-Mar-1990 369.0 0.0 0.0 178.1 62.0 36.0 20.0 20.0 22.0 22.0 10.0 3.0 0.0 4.6 20.0 2.1 9.0 21.3Brunei Darussalam (ASIA) 27-May-1993 19.0 - - - - 0.0 0.0 0.0 0.0 0.0 0.0 0.0 0.0 0.0 0.0 0.0 N.R. 0.0Burkina Faso (AFR) 20-Jul-1989 3.1 3.4 3.5 3.6 10.8 11.1 3.9 11.7 4.2 0.0 0.0 0.0 0.0 0.0 0.0 0.0 0.0 5.3Burundi (AFR) 6-Jan-1997 0.0 0.0 0.0 0.0 0.0 - - 0.0 0.0 0.0 0.0 0.0 0.0 0.0 0.0 0.0 0.0 0.0Cambodia (ASIA) 27-Jun-2001 0.0 - - - - - - 0.0 0.0 0.0 0.0 0.0 0.0 0.0 0.0 0.0 0.0 0.0
* European Community (EC) figures before 1995 contain data reported for the 12 members of the community at the time, namely Belgium,
Denmark, France, Germany, Greece, Ireland, Italy, Luxembourg, Netherlands, Portugal, Spain and United Kingdom of Great Britain and Northern Ireland. Figures for 1995 to 2003 cover 15 members of the EC, the 3 new members of the EC being Austria, Finland and Sweden that joined the EC in 1995. Figures for 2004 are for 25 members, which include the further 10 new members of the EC (Cyprus, Czech Republic, Estonia, Hungary, Latvia, Lithuania, Malta, Poland, Slovakia and Slovenia) that joined the EC in 2004.
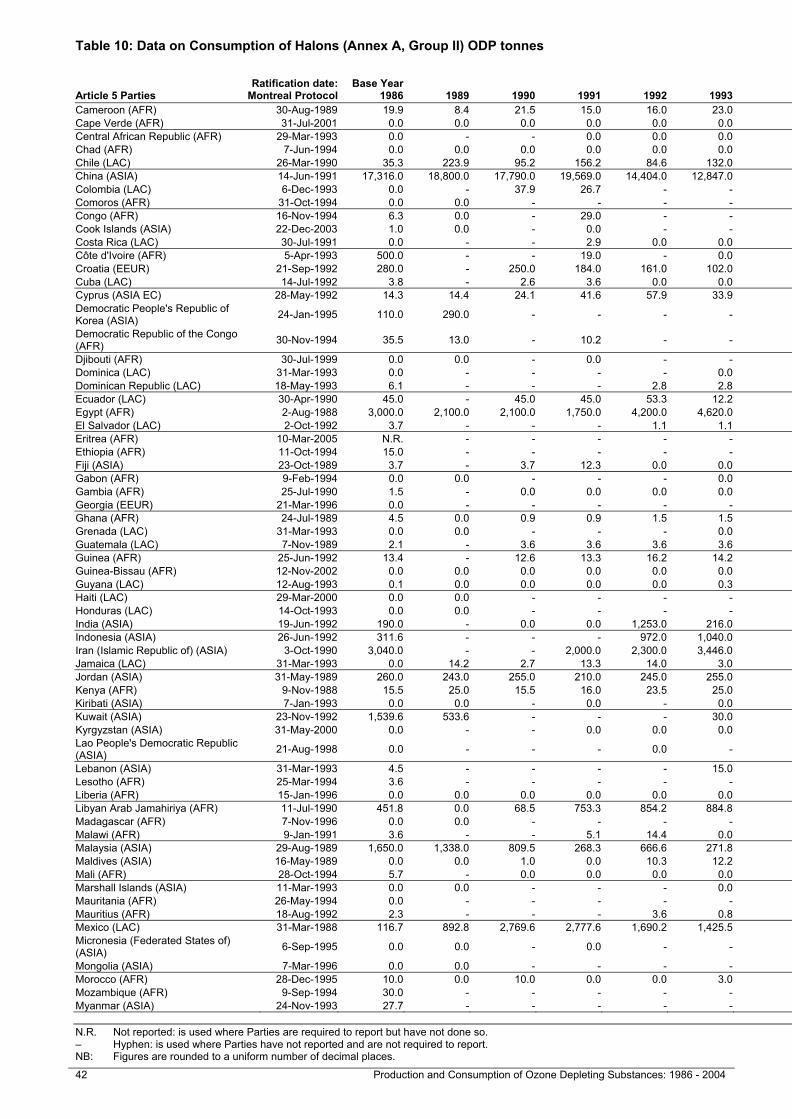
Table 10: Data on Consumption of Halons (Annex A, Group II) ODP tonnes Table 10: Data on Consumption of Halons (Annex A, Group II) ODP tonnes
N.R. Not reported: is used where Parties are required to report but have not done so. AFR = Africa ASIA = Asia EEUR = Eastern Europe CEIT = Country with Economy in Transition – Hyphen: is used where Parties have not reported and are not required to report. LAC = Latin America and the Caribbean WEUR = Western Europe and Others EC = Member of the European Community NB: Figures are rounded to a uniform number of decimal places.
42 Production and Consumption of Ozone Depleting Substances: 1986 - 2004 Production and Consumption of Ozone Depleting Substances: 1986 – 2004 43
Article 5 Baseline YearsArticle 5 Parties
Ratification date: Montreal Protocol
Base Year 1986 1989 1990 1991 1992 1993 1994 1995 1996 1997 1998 1999 2000 2001 2002 2003 2004
Baselevel
Cameroon (AFR) 30-Aug-1989 19.9 8.4 21.5 15.0 16.0 23.0 23.0 6.5 0.3 0.3 0.3 8.1 8.1 7.8 9.0 2.0 1.2 2.4Cape Verde (AFR) 31-Jul-2001 0.0 0.0 0.0 0.0 0.0 0.0 0.0 0.0 0.0 0.0 0.0 0.0 0.0 0.0 0.0 0.0 0.0 0.0Central African Republic (AFR) 29-Mar-1993 0.0 - - 0.0 0.0 0.0 0.0 0.0 0.0 0.0 0.0 0.0 0.0 0.0 0.0 0.0 N.R. 0.0Chad (AFR) 7-Jun-1994 0.0 0.0 0.0 0.0 0.0 0.0 0.0 0.0 0.0 0.0 0.0 0.0 0.0 0.0 0.0 0.0 N.R. 0.0Chile (LAC) 26-Mar-1990 35.3 223.9 95.2 156.2 84.6 132.0 47.4 9.8 15.8 0.0 0.0 0.0 0.0 0.9 0.0 0.0 0.0 8.5China (ASIA) 14-Jun-1991 17,316.0 18,800.0 17,790.0 19,569.0 14,404.0 12,847.0 20,150.0 33,714.0 33,115.0 35,731.0 22,207.0 18,602.0 14,780.0 10,409.0 6,604.2 4,959.2 2,238.9 34,186.7Colombia (LAC) 6-Dec-1993 0.0 - 37.9 26.7 - - 26.5 292.0 271.0 0.0 0.0 0.0 5.9 0.0 4.4 0.0 0.0 187.7Comoros (AFR) 31-Oct-1994 0.0 0.0 - - - - - 0.0 0.0 0.0 0.0 0.0 0.0 0.0 0.0 0.0 0.0 0.0Congo (AFR) 16-Nov-1994 6.3 0.0 - 29.0 - - 0.0 5.0 5.0 5.0 5.0 5.0 8.0 8.0 0.0 0.0 0.0 5.0Cook Islands (ASIA) 22-Dec-2003 1.0 0.0 - 0.0 - - - 0.0 0.0 0.0 0.0 0.0 0.0 - - 0.0 N.R. 0.0Costa Rica (LAC) 30-Jul-1991 0.0 - - 2.9 0.0 0.0 0.0 0.0 0.0 0.0 0.0 0.0 0.0 0.0 0.0 0.0 0.0 0.0Côte d'Ivoire (AFR) 5-Apr-1993 500.0 - - 19.0 - 0.0 0.0 0.0 0.0 0.0 0.0 0.0 0.0 0.0 0.0 0.0 0.0 0.0Croatia (EEUR) 21-Sep-1992 280.0 - 250.0 184.0 161.0 102.0 50.0 20.0 32.0 0.0 13.3 3.0 0.0 10.0 26.0 5.0 0.8 30.1Cuba (LAC) 14-Jul-1992 3.8 - 2.6 3.6 0.0 0.0 0.0 0.0 0.0 0.0 0.0 0.0 0.0 0.0 0.0 0.0 0.0 0.0Cyprus (ASIA EC) 28-May-1992 14.3 14.4 24.1 41.6 57.9 33.9 14.1 19.2 1.8 17.4 48.6 39.0 129.0 26.8 0.0 0.0 12.8Democratic People's Republic of Korea (ASIA) 24-Jan-1995 110.0 290.0 - - - - - 0.0 0.0 0.0 0.0 0.0 0.0 0.0 0.0 0.0 0.0 0.0
Democratic Republic of the Congo (AFR) 30-Nov-1994 35.5 13.0 - 10.2 - - - 380.0 190.0 86.0 184.4 33.3 48.0 492.0 492.0 27.9 22.9 218.7
Djibouti (AFR) 30-Jul-1999 0.0 0.0 - 0.0 - - - 0.0 0.0 0.0 0.0 0.0 0.0 0.0 0.0 0.0 0.0 0.0Dominica (LAC) 31-Mar-1993 0.0 - - - - 0.0 0.0 0.0 0.0 0.0 0.0 0.0 0.0 0.0 0.0 0.0 0.0 0.0Dominican Republic (LAC) 18-May-1993 6.1 - - - 2.8 2.8 5.0 3.1 5.4 4.2 5.4 6.0 6.6 3.0 0.0 0.0 0.0 4.2Ecuador (LAC) 30-Apr-1990 45.0 - 45.0 45.0 53.3 12.2 15.4 16.5 0.0 0.0 0.0 0.0 0.0 0.0 0.0 0.0 0.0 5.5Egypt (AFR) 2-Aug-1988 3,000.0 2,100.0 2,100.0 1,750.0 4,200.0 4,620.0 680.0 720.0 705.0 690.0 860.0 810.0 860.0 790.0 230.0 180.0 193.0 705.0El Salvador (LAC) 2-Oct-1992 3.7 - - - 1.1 1.1 1.1 1.1 1.1 0.0 0.0 0.0 0.0 0.0 0.0 0.0 0.0 0.7Eritrea (AFR) 10-Mar-2005 N.R. - - - - - - - - - - - - - - - - N.R.Ethiopia (AFR) 11-Oct-1994 15.0 - - - - - - 3.0 0.2 0.1 0.0 0.9 0.9 0.9 0.9 0.9 0.5 1.1Fiji (ASIA) 23-Oct-1989 3.7 - 3.7 12.3 0.0 0.0 0.0 0.0 0.0 0.0 0.0 0.0 0.0 0.0 0.0 0.0 0.0 0.0Gabon (AFR) 9-Feb-1994 0.0 0.0 - - - 0.0 0.0 0.0 0.0 0.0 0.0 0.0 0.0 0.0 0.0 0.0 0.0 0.0Gambia (AFR) 25-Jul-1990 1.5 - 0.0 0.0 0.0 0.0 0.0 0.0 0.0 0.0 0.0 0.0 0.0 0.0 0.0 0.0 0.0 0.0Georgia (EEUR) 21-Mar-1996 0.0 - - - - - 0.0 43.5 40.6 43.5 34.8 30.4 30.4 37.7 37.4 37.4 36.2 42.5Ghana (AFR) 24-Jul-1989 4.5 0.0 0.9 0.9 1.5 1.5 0.0 0.0 0.0 0.0 0.0 0.0 0.0 0.0 0.0 0.0 0.0 0.0Grenada (LAC) 31-Mar-1993 0.0 0.0 - - - 0.0 0.0 0.0 0.0 0.0 0.0 0.0 0.0 0.0 0.0 0.0 0.0 0.0Guatemala (LAC) 7-Nov-1989 2.1 - 3.6 3.6 3.6 3.6 1.2 0.6 0.0 0.0 0.0 0.0 0.0 0.0 0.0 0.0 0.0 0.2Guinea (AFR) 25-Jun-1992 13.4 - 12.6 13.3 16.2 14.2 12.1 11.1 8.4 6.3 0.2 0.1 0.1 0.1 0.1 1.6 0.0 8.6Guinea-Bissau (AFR) 12-Nov-2002 0.0 0.0 0.0 0.0 0.0 0.0 0.0 0.0 0.0 0.0 0.0 0.0 0.0 0.0 0.0 0.0 0.0 0.0Guyana (LAC) 12-Aug-1993 0.1 0.0 0.0 0.0 0.0 0.3 0.3 0.0 0.2 0.2 0.2 0.2 0.2 0.1 0.0 0.0 0.0 0.2Haiti (LAC) 29-Mar-2000 0.0 0.0 - - - - - 1.5 1.5 1.5 - - 1.5 1.5 0.0 1.5 0.0 1.5Honduras (LAC) 14-Oct-1993 0.0 0.0 - - - - 0.0 0.0 0.0 0.0 0.0 0.0 0.0 0.0 0.0 0.0 0.0 0.0India (ASIA) 19-Jun-1992 190.0 - 0.0 0.0 1,253.0 216.0 610.0 478.3 630.4 236.5 202.0 789.8 556.0 280.0 317.2 0.0 0.0 1,249.4Indonesia (ASIA) 26-Jun-1992 311.6 - - - 972.0 1,040.0 822.0 654.0 258.0 150.0 0.0 0.0 0.0 0.0 0.0 0.0 0.0 354.0Iran (Islamic Republic of) (ASIA) 3-Oct-1990 3,040.0 - - 2,000.0 2,300.0 3,446.0 2,434.0 500.0 0.0 3,760.0 3,170.0 1,420.0 1,420.0 1,420.0 1,420.0 0.0 0.0 1,420.0Jamaica (LAC) 31-Mar-1993 0.0 14.2 2.7 13.3 14.0 3.0 31.7 0.0 3.0 0.0 0.0 0.0 0.0 0.0 0.0 0.0 N.R. 1.0Jordan (ASIA) 31-May-1989 260.0 243.0 255.0 210.0 245.0 255.0 240.0 225.0 210.0 195.0 245.0 255.0 170.0 125.0 44.0 35.0 32.0 210.0Kenya (AFR) 9-Nov-1988 15.5 25.0 15.5 16.0 23.5 25.0 22.0 16.0 0.0 0.0 0.0 0.0 0.0 0.0 0.0 0.0 0.0 5.3Kiribati (ASIA) 7-Jan-1993 0.0 0.0 - 0.0 - 0.0 0.0 0.0 0.0 0.0 0.0 0.0 0.0 0.0 0.0 0.0 0.0 0.0Kuwait (ASIA) 23-Nov-1992 1,539.6 533.6 - - - 30.0 0.0 9.0 0.0 0.0 0.0 0.0 0.0 0.0 0.0 0.0 0.0 3.0Kyrgyzstan (ASIA) 31-May-2000 0.0 - - 0.0 0.0 0.0 0.0 0.0 0.0 0.0 0.0 0.0 0.0 0.0 0.0 0.0 2.4 0.0Lao People's Democratic Republic (ASIA) 21-Aug-1998 0.0 - - - 0.0 - - 0.0 0.0 0.0 0.0 0.0 0.0 0.0 0.0 0.0 0.0 0.0
Lebanon (ASIA) 31-Mar-1993 4.5 - - - - 15.0 0.0 0.0 0.0 0.0 0.0 0.0 0.0 0.0 0.0 0.0 0.0 0.0Lesotho (AFR) 25-Mar-1994 3.6 - - - - - 0.5 0.3 0.3 0.0 0.0 0.0 0.0 1.2 1.8 1.0 0.0 0.2Liberia (AFR) 15-Jan-1996 0.0 0.0 0.0 0.0 0.0 0.0 0.0 19.5 19.5 19.5 0.0 0.0 0.0 0.0 19.5 0.0 0.0 19.5Libyan Arab Jamahiriya (AFR) 11-Jul-1990 451.8 0.0 68.5 753.3 854.2 884.8 833.6 660.8 651.9 586.5 1,404.5 504.5 532.7 532.7 532.7 714.5 714.5 633.1Madagascar (AFR) 7-Nov-1996 0.0 0.0 - - - - - 0.0 0.0 0.0 0.0 0.0 0.0 0.0 0.0 0.0 0.0 0.0Malawi (AFR) 9-Jan-1991 3.6 - - 5.1 14.4 0.0 0.0 0.0 0.0 0.0 0.0 0.0 0.0 0.0 0.0 0.0 0.0 0.0Malaysia (ASIA) 29-Aug-1989 1,650.0 1,338.0 809.5 268.3 666.6 271.8 33.0 24.0 0.0 0.0 0.0 0.0 0.0 0.0 0.0 0.0 0.0 8.0Maldives (ASIA) 16-May-1989 0.0 0.0 1.0 0.0 10.3 12.2 16.6 0.0 0.0 0.0 0.0 0.0 0.0 0.0 0.0 0.0 0.0 0.0Mali (AFR) 28-Oct-1994 5.7 - 0.0 0.0 0.0 0.0 0.0 0.0 0.0 0.0 0.0 0.0 0.0 0.0 0.0 0.0 0.0 0.0Marshall Islands (ASIA) 11-Mar-1993 0.0 0.0 - - - 0.0 0.0 0.0 0.0 0.0 0.0 0.0 0.0 0.0 0.0 0.0 0.0 0.0Mauritania (AFR) 26-May-1994 0.0 - - - - - 0.0 0.0 0.0 0.0 0.0 0.0 0.0 0.0 0.0 0.0 N.R. 0.0Mauritius (AFR) 18-Aug-1992 2.3 - - - 3.6 0.8 0.2 0.0 0.0 0.0 0.0 0.0 0.0 0.0 0.0 0.0 0.0 0.0Mexico (LAC) 31-Mar-1988 116.7 892.8 2,769.6 2,777.6 1,690.2 1,425.5 1,122.0 0.0 89.1 284.6 212.8 141.0 230.4 140.4 147.3 103.8 105.6 124.6Micronesia (Federated States of) (ASIA) 6-Sep-1995 0.0 0.0 - 0.0 - - - 0.0 0.0 0.0 0.0 0.0 0.0 0.0 0.0 0.0 0.0 0.0
Mongolia (ASIA) 7-Mar-1996 0.0 0.0 - - - - - 0.0 0.0 0.0 0.0 0.0 0.0 0.0 0.0 0.0 0.0 0.0Morocco (AFR) 28-Dec-1995 10.0 0.0 10.0 0.0 0.0 3.0 0.0 21.0 0.0 0.0 0.0 0.0 0.0 0.0 3.9 0.0 0.0 7.0Mozambique (AFR) 9-Sep-1994 30.0 - - - - - 4.9 1.4 1.4 0.0 0.0 0.0 0.0 0.0 0.0 0.0 N.R. 0.9Myanmar (ASIA) 24-Nov-1993 27.7 - - - - - 0.0 0.0 0.0 0.0 0.0 0.0 0.0 0.0 0.0 0.0 0.0 0.0
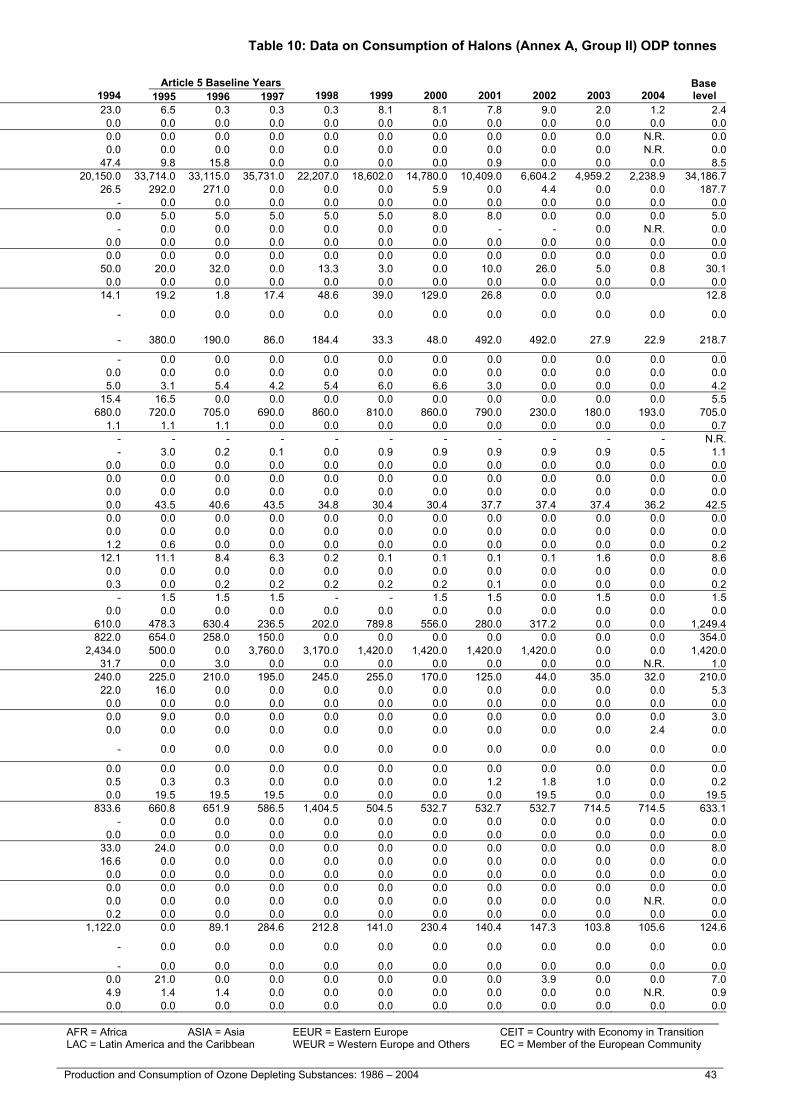

Table 10: Data on Consumption of Halons (Annex A, Group II) ODP tonnes Table 10: Data on Consumption of Halons (Annex A, Group II) ODP tonnes
N.R. Not reported: is used where Parties are required to report but have not done so. AFR = Africa ASIA = Asia EEUR = Eastern Europe CEIT = Country with Economy in Transition – Hyphen: is used where Parties have not reported and are not required to report. LAC = Latin America and the Caribbean WEUR = Western Europe and Others EC = Member of the European Community NB: Figures are rounded to a uniform number of decimal places.
44 Production and Consumption of Ozone Depleting Substances: 1986 - 2004 Production and Consumption of Ozone Depleting Substances: 1986 – 2004 45
Article 5 Baseline YearsArticle 5 Parties
Ratification date: Montreal Protocol
Base Year 1986 1989 1990 1991 1992 1993 1994 1995 1996 1997 1998 1999 2000 2001 2002 2003 2004
Baselevel
Namibia (AFR) 20-Sep-1993 7.4 - - - - 9.9 11.2 10.2 7.3 7.3 6.7 7.7 0.0 0.0 0.0 0.0 0.0 8.3Nauru (ASIA) 12-Nov-2001 0.0 - - - - - - 0.0 0.0 0.0 0.0 0.0 0.0 0.0 0.0 0.0 N.R. 0.0Nepal (ASIA) 6-Jul-1994 0.0 0.0 - 3.0 3.0 3.0 3.0 3.0 3.0 0.0 0.0 0.0 0.0 0.0 0.0 0.0 0.0 2.0Nicaragua (LAC) 5-Mar-1993 0.0 0.0 0.0 0.0 0.0 0.0 0.0 0.0 0.0 0.0 0.0 0.0 0.0 0.0 0.0 0.0 0.0 0.0Niger (AFR) 9-Oct-1992 0.0 0.0 0.0 0.2 0.4 0.6 0.0 0.0 0.0 0.0 0.0 0.0 0.0 0.0 0.0 0.0 0.0 0.0Nigeria (AFR) 31-Oct-1988 20.0 0.0 0.0 0.0 0.0 33.0 21.0 37.0 390.0 429.0 472.0 450.7 486.7 412.0 412.1 191.2 151.0 285.3Niue (ASIA) 22-Dec-2003 0.0 0.0 - 0.0 - - - 0.0 0.0 0.0 0.0 0.0 0.0 - - 0.0 0.0 0.0Oman (ASIA) 30-Jun-1999 408.7 408.7 - - 136.2 174.8 95.9 14.9 13.9 12.2 9.5 5.5 7.2 5.4 6.2 0.7 0.0 13.7Pakistan (ASIA) 18-Dec-1992 261.2 - 519.0 705.0 405.0 54.0 33.0 21.0 6.0 15.6 15.0 15.0 28.8 28.8 17.0 15.0 7.2 14.2Palau (ASIA) 29-May-2001 0.0 0.0 - - - - - 0.0 0.0 0.0 0.0 0.0 0.0 0.0 0.0 0.0 0.0 0.0Panama (LAC) 3-Mar-1989 13.8 14.3 11.5 6.0 5.9 0.0 0.0 0.0 0.0 0.0 0.0 0.0 0.0 0.0 0.0 0.0 0.0 0.0Papua New Guinea (ASIA) 27-Oct-1992 27.4 - - - - 0.0 3.4 0.0 0.0 0.0 0.0 0.0 0.0 0.0 0.0 0.0 0.0 0.0Paraguay (LAC) 3-Dec-1992 0.0 0.0 - - 0.0 0.0 0.0 0.0 0.0 0.0 0.0 0.0 0.0 0.0 0.0 0.0 0.0 0.0Peru (LAC) 31-Mar-1993 79.3 40.7 56.7 122.2 0.0 0.0 0.0 0.0 0.0 0.0 0.0 0.0 0.0 0.0 0.0 0.0 0.0 0.0Philippines (ASIA) 17-Jul-1991 60.0 185.0 185.0 89.4 95.0 13.1 72.5 100.8 118.2 92.7 46.8 0.0 0.0 0.0 0.0 0.0 0.0 103.9Qatar (ASIA) 22-Jan-1996 3.9 - - - - - - 9.0 9.0 14.0 43.9 41.4 35.2 30.7 13.6 8.3 0.0 10.7Republic of Korea (ASIA) 27-Feb-1992 2,936.0 - - - 7,472.0 2,610.0 3,074.0 3,400.0 3,684.0 3,950.0 2,162.0 2,196.0 2,861.0 2,399.0 2,187.0 2,260.0 1,408.0 3,678.0Republic of Moldova (EEUR) 24-Oct-1996 0.0 0.0 - - - - - 0.0 1.2 0.0 0.0 0.0 0.0 0.0 0.0 0.0 0.0 0.4Romania (EEUR) 27-Jan-1993 0.0 - - - - 12.0 0.3 0.0 0.0 10.5 1.1 0.0 1.8 0.0 0.0 0.0 1.8 3.5Rwanda (AFR) 11-Oct-2001 0.0 0.0 0.0 0.0 0.0 0.0 0.0 0.0 0.0 0.0 0.0 0.0 0.0 0.0 0.0 0.0 0.0 0.0Saint Kitts and Nevis (LAC) 10-Aug-1992 5.0 0.0 - - 0.0 0.0 0.0 0.0 0.0 0.0 0.0 0.0 0.0 0.0 0.0 0.0 0.0 0.0Saint Lucia (LAC) 28-Jul-1993 1.8 - - - - 0.9 0.6 0.0 0.0 0.0 0.0 0.0 0.0 0.0 0.0 0.0 0.0 0.0Saint Vincent and the Grenadines (LAC) 2-Dec-1996 0.0 - - - - - - 0.0 0.0 0.0 0.0 0.0 0.0 0.0 0.0 0.0 0.0 0.0
Samoa (ASIA) 21-Dec-1992 0.0 - - 0.0 0.0 0.0 0.0 0.0 0.0 0.0 0.0 0.0 0.0 0.0 0.0 0.0 N.R. 0.0Sao Tome and Principe (AFR) 19-Nov-2001 0.0 0.0 0.0 0.0 0.0 0.0 0.0 0.0 0.0 0.0 0.0 0.0 0.0 0.0 0.0 0.0 0.0 0.0Saudi Arabia (ASIA) 1-Mar-1993 0.0 - - - 2,454.0 2,533.4 1,450.0 1,450.0 1,180.0 562.0 346.0 244.0 171.0 286.0 257.0 0.0 N.R. 1,064.0Senegal (AFR) 6-May-1993 0.0 - 0.0 0.0 0.0 0.0 0.0 0.0 0.0 0.0 0.0 0.0 0.0 0.0 0.0 0.0 0.0 0.0Serbia and Montenegro (EEUR) 12-Mar-2001 1,170.0 93.0 0.0 0.0 0.0 0.0 0.0 0.0 11.5 0.0 19.5 19.5 0.0 0.0 0.0 0.0 0.0 3.8Seychelles (AFR) 6-Jan-1993 0.5 0.5 0.8 0.8 0.8 0.9 0.0 0.0 0.0 0.0 0.0 0.0 0.0 0.0 0.0 0.0 0.0 0.0Sierra Leone (AFR) 29-Aug-2001 16.8 18.9 16.5 15.0 16.9 16.3 12.6 12.0 18.0 18.0 12.0 12.0 9.9 9.0 0.0 15.0 18.5 16.0Singapore (ASIA) 5-Jan-1989 2,439.0 812.0 1,151.0 1,184.0 983.0 938.0 0.0 0.0 0.0 0.0 0.0 0.0 0.0 0.0 0.0 -21.2 0.0 0.0Solomon Islands (ASIA) 17-Jun-1993 0.0 0.0 0.0 0.0 0.0 0.0 0.0 0.0 0.0 0.0 0.0 0.0 0.0 0.0 0.0 0.0 0.0 0.0Somalia (AFR) 1-Aug-2001 81.0 67.8 61.2 11.4 11.4 13.2 15.0 16.8 17.7 18.6 19.5 20.4 21.3 23.4 24.5 25.7 23.4 17.7South Africa (AFR) 15-Jan-1990 6,222.0 3,807.0 1,264.0 1,121.0 5,372.0 1,059.0 0.0 0.0 0.0 0.0 0.0 0.0 0.0 0.0 0.0 0.0 0.0 0.0Sri Lanka (ASIA) 15-Dec-1989 29.5 - 1.4 2.7 1.7 0.0 0.0 0.0 0.0 0.0 0.0 0.0 0.0 0.0 0.0 0.0 0.0 0.0Sudan (AFR) 29-Jan-1993 25.0 - - 3.0 - 3.0 3.6 0.0 4.5 1.5 0.0 0.0 0.0 0.0 0.0 0.0 0.0 2.0Suriname (LAC) 14-Oct-1997 0.0 0.0 - 0.0 - - - 0.0 0.0 0.0 0.0 0.0 0.0 0.0 0.0 0.0 0.0 0.0Swaziland (AFR) 10-Nov-1992 2.9 2.9 - - - 13.2 0.0 0.0 0.0 0.0 0.0 0.0 0.0 0.0 0.0 0.0 0.0 0.0Syrian Arab Republic (ASIA) 12-Dec-1989 0.0 0.0 0.0 0.0 0.0 0.0 466.5 420.0 410.6 420.0 409.5 412.6 405.5 400.8 389.0 366.2 215.6 416.9Thailand (ASIA) 7-Jul-1989 60.0 120.0 324.0 420.0 388.3 502.0 364.3 293.0 368.0 154.0 154.0 500.0 500.0 500.0 0.0 0.0 0.0 271.7The Former Yugoslav Republic of Macedonia (EEUR) 10-Mar-1994 43.0 - - - - - 40.0 30.0 30.0 36.2 0.0 0.0 0.0 0.0 0.0 0.0 0.0 32.1
Togo (AFR) 25-Feb-1991 0.0 0.0 0.0 0.0 0.0 0.0 0.0 0.0 0.0 0.0 0.0 0.0 0.0 0.0 0.0 0.0 0.0 0.0Tonga (ASIA) 29-Jul-1998 0.0 - - - - - - 0.0 0.0 0.0 0.0 0.0 0.0 0.0 0.0 0.0 0.0 0.0Trinidad and Tobago (LAC) 28-Aug-1989 52.4 61.8 56.6 50.8 30.5 17.2 45.0 46.0 46.9 46.9 46.9 5.0 0.0 0.0 1.1 0.0 0.0 46.6Tunisia (AFR) 25-Sep-1989 3.0 12.0 3.0 20.0 69.0 109.0 0.1 32.0 116.0 165.0 160.0 150.0 42.0 45.0 45.0 42.0 42.0 104.3Turkey (EEUR) 20-Sep-1991 125.0 - 621.9 201.0 164.0 166.0 172.0 88.0 226.0 109.0 203.0 0.0 10.0 147.0 13.0 40.9 22.0 141.0Tuvalu (ASIA) 15-Jul-1993 0.0 0.0 - - - 0.0 0.0 0.0 0.0 0.0 0.0 0.0 0.0 0.0 0.0 0.0 0.0 0.0Uganda (AFR) 15-Sep-1988 0.0 0.0 0.0 0.0 0.5 4.6 0.0 0.0 0.0 0.0 0.0 0.0 0.0 0.0 0.0 0.0 0.0 0.0United Arab Emirates (ASIA) 22-Dec-1989 353.0 392.9 365.5 465.2 520.7 536.0 170.4 147.8 34.0 44.4 51.3 49.0 44.2 39.4 34.6 29.8 26.9 75.4United Republic of Tanzania (AFR) 16-Apr-1993 0.5 - - - - 0.5 0.5 0.5 0.5 0.0 0.0 10.7 0.0 0.0 0.0 0.0 0.0 0.3Uruguay (LAC) 8-Jan-1991 29.8 - - 9.5 3.3 4.5 0.0 0.0 0.0 0.0 0.0 0.0 0.0 0.0 0.0 0.0 0.0 0.0Vanuatu (ASIA) 21-Nov-1994 0.0 0.0 - - - - - 0.0 0.0 0.0 0.0 0.0 0.0 0.0 0.0 0.0 0.0 0.0Venezuela (Bolivarian Republic of) (LAC) 6-Feb-1989 324.0 282.0 166.0 243.9 302.0 50.1 40.0 0.0 0.0 0.0 0.0 0.0 0.0 0.0 0.0 0.0 0.0 0.0
Viet Nam (ASIA) 26-Jan-1994 38.0 24.0 - - - - 12.0 22.0 23.2 66.0 78.0 76.0 33.0 0.0 97.6 0.0 0.0 37.1Yemen (ASIA) 21-Feb-1996 0.0 - - - - - - 142.0 159.0 119.0 116.0 100.5 107.5 92.1 72.2 11.5 5.6 140.0Zambia (AFR) 24-Jan-1990 0.0 0.0 0.0 0.0 0.0 0.0 0.0 0.0 0.0 0.0 0.0 0.0 0.0 0.0 0.0 0.0 0.0 0.0Zimbabwe (AFR) 3-Nov-1992 130.0 - - - - 97.0 36.0 4.5 0.0 0.0 0.0 0.0 0.0 0.0 0.0 0.0 0.1 1.5Subtotal (Article 5 - Annex A, Group II) 44,797.7 31,039.4 29,179.7 34,736.1 45,828.7 35,116.7 33,889.0 44,811.3 43,671.8 48,377.3 33,182.7 27,206.0 23,766.1 18,888.8 13,653.5 9,235.1 5,363.9 46,434.1
TOTAL (Annex A, Group II) 217,517.4 186,788.2 162,576.5 152,458.5 122,406.8 85,656.5 35,344.0 45,965.5 46,047.4 50,181.2 34,516.0 27,792.1 25,487.7 18,489.7 12,043.0 9,222.1 -2,523.7 219,153.8
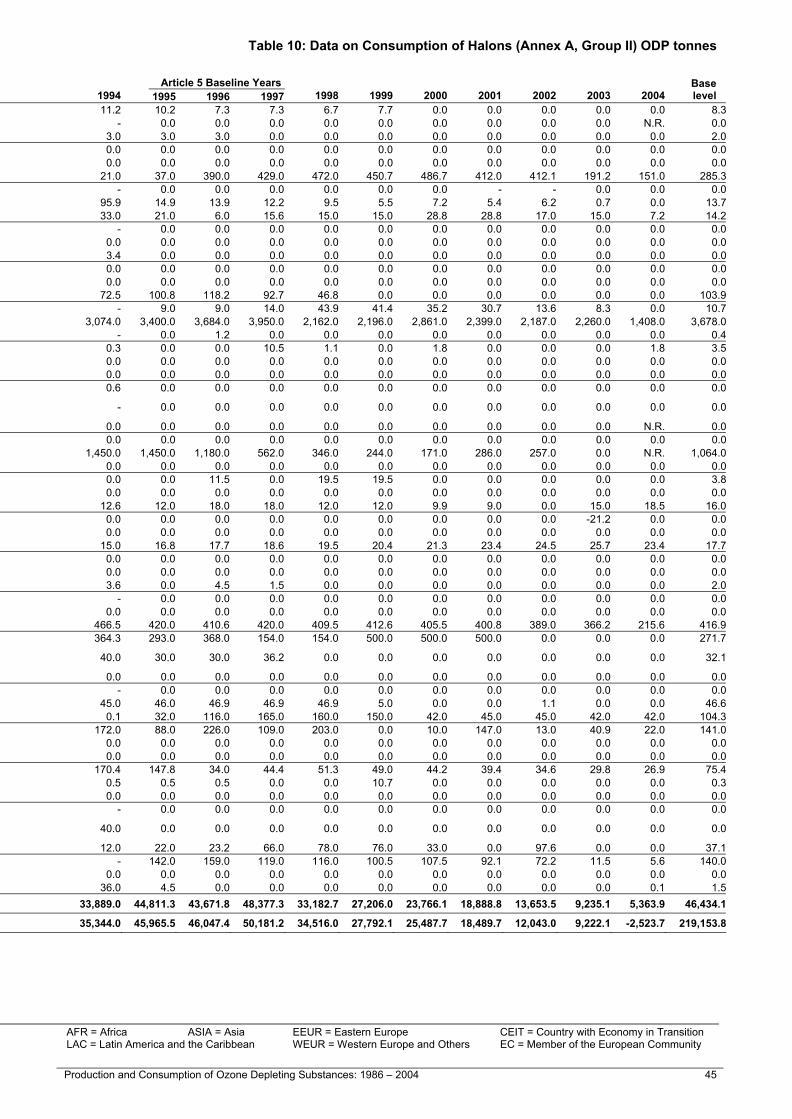

Table 11: Data on Consumption of Other Fully Halogenated CFCs (Annex B, Group I) ODP tonnes
N.R. Not reported: is used where Parties are required to report but have not done so. AFR = Africa ASIA = Asia EEUR = Eastern Europe CEIT = Country with Economy in Transition – Hyphen: is used where Parties have not reported and are not required to report. LAC = Latin America and the Caribbean WEUR = Western Europe and Others EC = Member of the European Community NB: Figures are rounded to a uniform number of decimal places.
46 Production and Consumption of Ozone Depleting Substances: 1986 - 2004 Production and Consumption of Ozone Depleting Substances: 1986 – 2004 47
Table 11: Data on Consumption of Other Fully Halogenated CFCs (Annex B, Group I) ODP tonnes
Ratification dates
Non-Article 5 Parties Montreal Protocol
London Amendment
Base Year 1989 1992 1993 1994 1995 1996 1997 1998 1999 2000 2001 2002 2003 2004
Baselevel
Australia (WEUR) 19-May-1989 11-Aug-1992 1.5 0.0 0.0 0.0 0.4 0.0 0.0 0.0 0.0 0.0 0.0 0.0 0.0 0.0 1.5Austria (WEUR EC) 3-May-1989 11-Dec-1992 0.0 0.0 36.8 4.5 0.0Belarus (EEUR CEIT) 31-Oct-1988 10-Jun-1996 1.6 5.3 5.3 1.4 0.0 0.6 -1.0 0.6 0.1 0.0 0.0 0.0 0.0 0.0 1.6Bulgaria (EEUR CEIT) 20-Nov-1990 28-Apr-1999 20.0 20.0 - 0.0 0.0 0.0 0.0 0.0 0.0 0.0 0.0 0.0 0.0 0.0 20.0Canada (WEUR) 30-Jun-1988 5-Jul-1990 2.0 1.0 1.0 1.0 0.4 0.0 0.0 0.0 0.0 0.0 0.0 0.0 0.0 0.0 2.0Czech Republic (EEUR CEIT EC) 1-Jan-1993 18-Dec-1996 9.3 - 0.0 0.0 0.0 0.0 0.0 0.0 0.0 0.0 0.0 0.0 0.0 9.3Estonia (EEUR CEIT EC) 17-Oct-1996 12-Apr-1999 0.0 - - - 0.0 0.0 0.0 1.2 0.0 0.0 0.0 0.0 0.0 0.0European Community (WEUR) 16-Dec-1988 20-Dec-1991 58.0 35.0 40.0 8.0 0.0 0.0 -1.0 0.0 0.0 0.0 0.0 3.0 -3.0 -1,441.0 58.0Japan (ASIA) 30-Sep-1988 4-Sep-1991 2,331.0 1,600.0 788.0 136.0 0.0 0.0 0.0 0.0 0.0 0.0 0.0 0.0 0.0 0.0 2,331.0Lithuania (EEUR CEIT EC) 18-Jan-1995 3-Feb-1998 0.0 - - 0.3 0.0 0.1 0.0 0.0 0.0 0.0 0.0 0.0 0.0 0.0Malta (WEUR EC) 29-Dec-1988 4-Feb-1994 0.3 0.0 0.2 0.0 0.0 0.0 0.0 0.0 0.0 0.0 0.0 0.0 0.0 0.3New Zealand (WEUR) 21-Jul-1988 1-Oct-1990 0.1 0.0 0.0 0.0 0.0 0.0 0.0 0.0 0.0 0.0 0.0 0.0 0.0 0.0 0.1Norway (WEUR) 24-Jun-1988 18-Nov-1991 1.0 0.0 1.0 1.0 0.0 0.0 0.0 0.0 0.0 0.0 -0.1 -1.0 0.0 0.0 1.0Poland (EEUR CEIT EC) 13-Jul-1990 2-Oct-1996 2.0 - 1.0 - - 19.5 0.0 0.0 0.0 0.0 0.0 0.0 0.0 2.0Russian Federation (EEUR CEIT) 10-Nov-1988 13-Jan-1992 300.0 18.2 0.6 25.0 25.0 13.9 74.5 13.1 16.0 27.1 0.0 0.0 0.0 N.R. 300.0Slovakia (EEUR CEIT EC) 28-May-1993 15-Apr-1994 0.1 - 0.1 0.0 0.0 0.0 0.0 0.0 0.0 0.0 0.0 0.0 0.0 0.1Switzerland (WEUR) 28-Dec-1988 16-Sep-1992 0.9 0.2 0.0 0.1 0.0 0.0 0.0 0.0 0.0 0.0 0.0 0.0 0.0 0.0 0.9Ukraine (EEUR CEIT) 20-Sep-1988 6-Feb-1997 10.0 8.0 3.0 2.0 15.6 0.8 1.8 13.1 3.1 0.3 0.0 0.0 0.0 0.0 10.0United States of America (WEUR) 21-Apr-1988 18-Dec-1991 571.0 64.0 75.0 94.0 39.0 0.0 -0.1 0.0 0.0 0.0 0.0 -1.0 0.0 0.0 571.0Uzbekistan (EEUR CEIT) 18-May-1993 10-Jun-1998 0.1 - 0.1 0.0 0.0 0.0 0.0 0.0 0.0 0.0 0.0 0.0 0.0 0.0 0.1Subtotal (Non-Article 5 - Annex B, Group I) 3,308.9 1,751.7 952.1 273.3 80.4 34.9 74.2 28.0 19.2 27.4 -0.1 1.0 -3.0 -1,441.0 3,308.9
Ratification dates Article 5 Baseline Years
Article 5 Parties Montreal Protocol
London Amendment
Base Year 1989 1992 1993 1994 1995 1996 1997 1998 1999 2000 2001 2002 2003 2004
Baselevel
Algeria (AFR) 20-Oct-1992 20-Oct-1992 0.0 - 0.0 1.0 1.0 1.0 1.0 1.0 1.0 1.0 0.8 0.8 0.8 0.8 1.0Argentina (LAC) 18-Sep-1990 4-Dec-1992 0.5 10.8 0.0 0.0 10.0 0.1 14.6 0.1 0.0 0.0 0.4 0.0 0.0 0.0 0.0Brazil (LAC) 19-Mar-1990 1-Oct-1992 0.0 0.0 0.0 12.0 133.0 27.3 0.0 3.0 5.3 3.0 0.0 0.0 0.0 0.0 3.8Chile (LAC) 26-Mar-1990 9-Apr-1992 0.0 0.0 0.0 0.0 0.0 0.0 0.0 0.0 0.0 0.0 1.2 0.0 0.0 0.0 0.0China (ASIA) 14-Jun-1991 14-Jun-1991 0.0 0.0 0.0 1,272.1 136.0 193.0 50.0 23.0 27.0 27.0 26.9 26.9 20.5 20.5 25.7Colombia (LAC) 6-Dec-1993 6-Dec-1993 0.0 0.0 - 0.0 0.0 0.0 0.0 -0.7 0.0 0.0 0.0 0.0 0.0 0.0 0.0Cyprus (ASIA EC) 28-May-1992 11-Oct-1994 0.0 12.0 54.8 0.0 0.0 18.9 37.2 76.1 0.0 0.0 0.0 0.0 0.0 25.4Ecuador (LAC) 30-Apr-1990 23-Feb-1993 0.0 0.0 0.0 0.0 2.1 0.0 66.8 2.9 0.0 0.0 0.4 0.0 0.0 0.0 1.0Georgia (EEUR) 21-Mar-1996 12-Jul-2000 10.0 - - 0.0 0.0 0.0 0.0 0.0 0.0 0.0 0.0 0.0 0.0 0.0 0.0Honduras (LAC) 14-Oct-1993 24-Jan-2002 0.4 - - - 0.0 0.0 0.0 0.0 0.0 0.0 0.0 0.0 0.0 0.0 0.0India (ASIA) 19-Jun-1992 19-Jun-1992 0.0 0.0 0.0 0.0 0.0 0.0 0.0 0.0 0.0 0.0 0.0 0.0 -28.3 0.0 0.0Jordan (ASIA) 31-May-1989 12-Nov-1993 0.3 0.3 0.3 15.0 15.0 0.0 0.0 0.0 10.0 0.1 0.0 0.0 0.0 0.0 3.4Kuwait (ASIA) 23-Nov-1992 22-Jul-1994 1.0 - - 0.0 0.0 0.0 0.0 0.0 0.0 0.0 0.0 0.0 0.0 0.0 0.0Kyrgyzstan (ASIA) 31-May-2000 13-May-2003 2.0 2.0 2.0 2.0 2.0 2.5 6.0 0.0 0.0 0.1 0.0 0.0 0.0 0.0 0.0Lebanon (ASIA) 31-Mar-1993 31-Mar-1993 0.0 - 0.0 0.0 0.0 0.0 0.0 0.0 0.5 0.0 0.0 0.0 0.0 0.0 0.2Madagascar (AFR) 7-Nov-1996 16-Jan-2002 0.6 - - - 0.0 0.0 0.2 1.1 1.5 0.0 0.0 0.0 0.0 0.0 0.9Malaysia (ASIA) 29-Aug-1989 16-Jun-1993 0.0 - 0.0 1.0 204.1 18.6 39.1 12.2 21.1 0.0 10.6 0.0 0.0 0.0 11.1Mexico (LAC) 31-Mar-1988 11-Oct-1991 0.5 0.0 53.7 2.6 0.8 0.0 0.0 0.0 0.0 0.0 0.0 0.0 0.0 0.0 0.0Morocco (AFR) 28-Dec-1995 28-Dec-1995 0.0 0.0 0.0 0.0 0.0 0.0 0.0 0.0 0.0 0.0 0.0 8.4 0.0 0.0 0.0Nigeria (AFR) 31-Oct-1988 27-Sep-2001 0.0 - 7.2 7.2 7.2 0.0 0.0 0.0 0.0 0.0 0.0 0.0 0.0 0.0 0.0Peru (LAC) 31-Mar-1993 31-Mar-1993 0.0 0.0 0.0 190.7 0.0 0.0 0.0 4.0 8.2 0.0 0.1 0.0 0.0 0.0 4.1Philippines (ASIA) 17-Jul-1991 9-Aug-1993 0.0 7.5 0.7 0.1 0.0 0.0 0.0 0.0 0.0 0.0 0.0 0.0 0.0 0.0 0.0Republic of Korea (ASIA) 27-Feb-1992 10-Dec-1992 352.0 603.0 141.0 1.2 0.0 0.0 0.0 0.0 3.0 0.0 0.0 0.0 0.0 0.0 1.0Romania (EEUR) 27-Jan-1993 27-Jan-1993 0.0 - 0.0 0.0 0.1 0.0 0.4 0.2 0.7 0.0 -0.4 0.0 0.0 0.0 0.3Singapore (ASIA) 5-Jan-1989 2-Mar-1993 1.0 - 0.2 0.1 0.1 0.0 0.0 0.0 0.0 0.0 0.0 0.0 0.0 0.0 0.0South Africa (AFR) 15-Jan-1990 12-May-1992 666.9 0.0 0.0 0.0 0.0 0.0 0.0 0.0 0.0 0.0 0.0 0.0 0.0 0.0 0.0Sri Lanka (ASIA) 15-Dec-1989 16-Jun-1993 0.0 - 0.0 0.0 0.0 5.1 0.0 0.0 0.0 0.0 0.0 0.0 0.0 0.0 0.0Syrian Arab Republic (ASIA) 12-Dec-1989 30-Nov-1999 55.6 62.1 63.9 - 52.4 50.0 48.0 0.0 0.0 0.0 0.0 0.0 0.0 0.0 0.0Thailand (ASIA) 7-Jul-1989 25-Jun-1992 0.0 0.0 1.1 0.0 0.0 0.0 0.0 0.0 0.0 0.0 0.0 0.0 0.0 0.0 0.0The Former Yugoslav Republic of Macedonia (EEUR) 10-Mar-1994 9-Nov-1998 0.0 - - - 0.0 0.0 0.0 0.0 1.4 0.0 0.0 0.0 0.0 0.0 0.5Tunisia (AFR) 25-Sep-1989 15-Jul-1993 0.0 0.0 116.0 0.0 0.0 0.0 0.0 0.0 0.0 0.0 0.0 0.0 0.0 0.0 0.0Turkey (EEUR) 20-Sep-1991 13-Apr-1995 0.0 0.0 0.0 0.8 0.0 0.0 0.0 0.0 0.0 0.0 0.0 0.0 0.0 0.0 0.0Uganda (AFR) 15-Sep-1988 20-Jan-1994 0.0 - 0.0 0.1 0.1 0.1 0.1 0.0 0.1 0.1 0.1 0.1 0.0 0.0 0.1Uruguay (LAC) 8-Jan-1991 16-Nov-1993 0.0 - 0.0 0.7 0.0 0.0 0.0 0.0 0.0 0.0 0.0 0.0 0.0 0.0 0.0Venezuela (Bolivarian Republic of) (LAC) 6-Feb-1989 29-Jul-1993 0.0 0.0 0.0 0.0 0.0 0.0 0.0 0.0 0.0 81.7 0.0 0.0 0.0 0.0 27.2Viet Nam (ASIA) 26-Jan-1994 26-Jan-1994 0.0 - - 0.0 0.0 0.0 0.5 0.5 0.0 0.0 0.0 0.0 0.0 0.0 0.2Subtotal (Article 5 - Annex B, Group I) 1,090.8 697.7 440.9 1,506.6 563.9 316.6 263.9 123.4 79.8 113.0 40.1 36.2 -7.0 21.3 105.9TOTAL (Annex B, Group I) 4,399.7 2,449.4 1,393.0 1,779.9 644.3 351.5 338.1 151.4 99.0 140.4 40.0 37.2 -10.0 -1,419.7 3,414.8
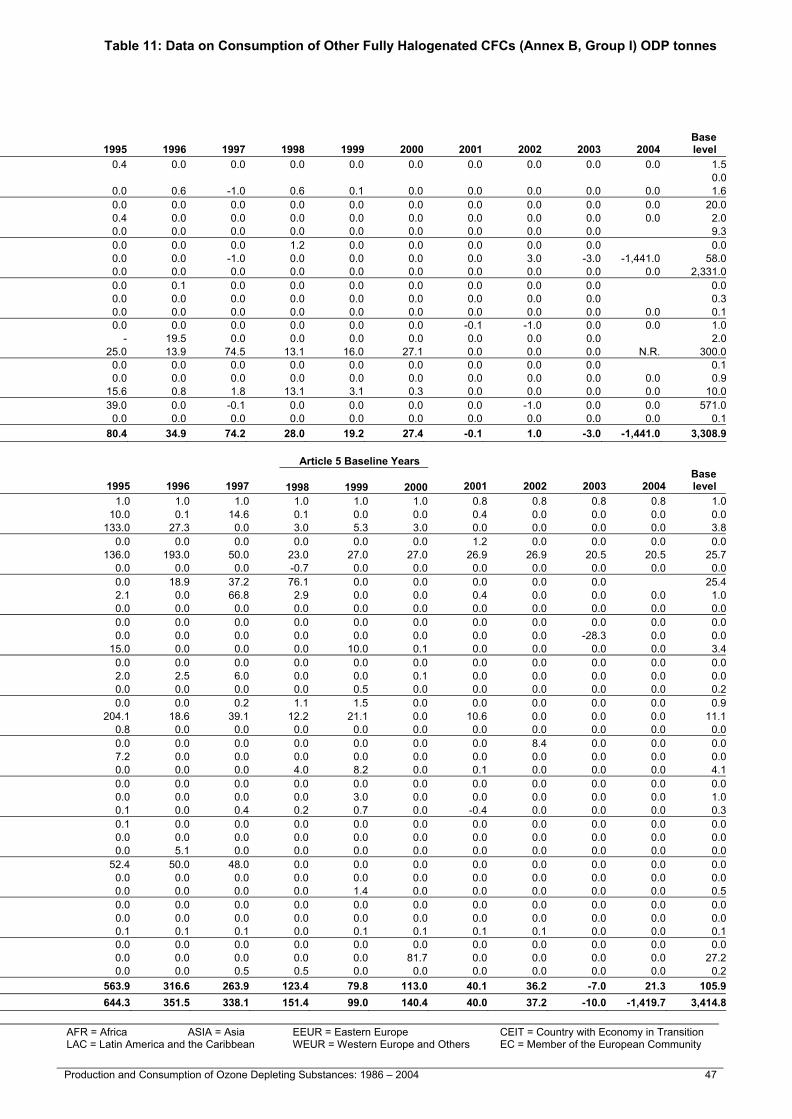
Table 11: Data on Consumption of Other Fully Halogenated CFCs (Annex B, Group I) ODP tonnes
N.R. Not reported: is used where Parties are required to report but have not done so. AFR = Africa ASIA = Asia EEUR = Eastern Europe CEIT = Country with Economy in Transition – Hyphen: is used where Parties have not reported and are not required to report. LAC = Latin America and the Caribbean WEUR = Western Europe and Others EC = Member of the European Community NB: Figures are rounded to a uniform number of decimal places.
46 Production and Consumption of Ozone Depleting Substances: 1986 - 2004 Production and Consumption of Ozone Depleting Substances: 1986 – 2004 47
Table 11: Data on Consumption of Other Fully Halogenated CFCs (Annex B, Group I) ODP tonnes
Ratification dates
Non-Article 5 Parties Montreal Protocol
London Amendment
Base Year 1989 1992 1993 1994 1995 1996 1997 1998 1999 2000 2001 2002 2003 2004
Baselevel
Australia (WEUR) 19-May-1989 11-Aug-1992 1.5 0.0 0.0 0.0 0.4 0.0 0.0 0.0 0.0 0.0 0.0 0.0 0.0 0.0 1.5Austria (WEUR EC) 3-May-1989 11-Dec-1992 0.0 0.0 36.8 4.5 0.0Belarus (EEUR CEIT) 31-Oct-1988 10-Jun-1996 1.6 5.3 5.3 1.4 0.0 0.6 -1.0 0.6 0.1 0.0 0.0 0.0 0.0 0.0 1.6Bulgaria (EEUR CEIT) 20-Nov-1990 28-Apr-1999 20.0 20.0 - 0.0 0.0 0.0 0.0 0.0 0.0 0.0 0.0 0.0 0.0 0.0 20.0Canada (WEUR) 30-Jun-1988 5-Jul-1990 2.0 1.0 1.0 1.0 0.4 0.0 0.0 0.0 0.0 0.0 0.0 0.0 0.0 0.0 2.0Czech Republic (EEUR CEIT EC) 1-Jan-1993 18-Dec-1996 9.3 - 0.0 0.0 0.0 0.0 0.0 0.0 0.0 0.0 0.0 0.0 0.0 9.3Estonia (EEUR CEIT EC) 17-Oct-1996 12-Apr-1999 0.0 - - - 0.0 0.0 0.0 1.2 0.0 0.0 0.0 0.0 0.0 0.0European Community (WEUR) 16-Dec-1988 20-Dec-1991 58.0 35.0 40.0 8.0 0.0 0.0 -1.0 0.0 0.0 0.0 0.0 3.0 -3.0 -1,441.0 58.0Japan (ASIA) 30-Sep-1988 4-Sep-1991 2,331.0 1,600.0 788.0 136.0 0.0 0.0 0.0 0.0 0.0 0.0 0.0 0.0 0.0 0.0 2,331.0Lithuania (EEUR CEIT EC) 18-Jan-1995 3-Feb-1998 0.0 - - 0.3 0.0 0.1 0.0 0.0 0.0 0.0 0.0 0.0 0.0 0.0Malta (WEUR EC) 29-Dec-1988 4-Feb-1994 0.3 0.0 0.2 0.0 0.0 0.0 0.0 0.0 0.0 0.0 0.0 0.0 0.0 0.3New Zealand (WEUR) 21-Jul-1988 1-Oct-1990 0.1 0.0 0.0 0.0 0.0 0.0 0.0 0.0 0.0 0.0 0.0 0.0 0.0 0.0 0.1Norway (WEUR) 24-Jun-1988 18-Nov-1991 1.0 0.0 1.0 1.0 0.0 0.0 0.0 0.0 0.0 0.0 -0.1 -1.0 0.0 0.0 1.0Poland (EEUR CEIT EC) 13-Jul-1990 2-Oct-1996 2.0 - 1.0 - - 19.5 0.0 0.0 0.0 0.0 0.0 0.0 0.0 2.0Russian Federation (EEUR CEIT) 10-Nov-1988 13-Jan-1992 300.0 18.2 0.6 25.0 25.0 13.9 74.5 13.1 16.0 27.1 0.0 0.0 0.0 N.R. 300.0Slovakia (EEUR CEIT EC) 28-May-1993 15-Apr-1994 0.1 - 0.1 0.0 0.0 0.0 0.0 0.0 0.0 0.0 0.0 0.0 0.0 0.1Switzerland (WEUR) 28-Dec-1988 16-Sep-1992 0.9 0.2 0.0 0.1 0.0 0.0 0.0 0.0 0.0 0.0 0.0 0.0 0.0 0.0 0.9Ukraine (EEUR CEIT) 20-Sep-1988 6-Feb-1997 10.0 8.0 3.0 2.0 15.6 0.8 1.8 13.1 3.1 0.3 0.0 0.0 0.0 0.0 10.0United States of America (WEUR) 21-Apr-1988 18-Dec-1991 571.0 64.0 75.0 94.0 39.0 0.0 -0.1 0.0 0.0 0.0 0.0 -1.0 0.0 0.0 571.0Uzbekistan (EEUR CEIT) 18-May-1993 10-Jun-1998 0.1 - 0.1 0.0 0.0 0.0 0.0 0.0 0.0 0.0 0.0 0.0 0.0 0.0 0.1Subtotal (Non-Article 5 - Annex B, Group I) 3,308.9 1,751.7 952.1 273.3 80.4 34.9 74.2 28.0 19.2 27.4 -0.1 1.0 -3.0 -1,441.0 3,308.9
Ratification dates Article 5 Baseline Years
Article 5 Parties Montreal Protocol
London Amendment
Base Year 1989 1992 1993 1994 1995 1996 1997 1998 1999 2000 2001 2002 2003 2004
Baselevel
Algeria (AFR) 20-Oct-1992 20-Oct-1992 0.0 - 0.0 1.0 1.0 1.0 1.0 1.0 1.0 1.0 0.8 0.8 0.8 0.8 1.0Argentina (LAC) 18-Sep-1990 4-Dec-1992 0.5 10.8 0.0 0.0 10.0 0.1 14.6 0.1 0.0 0.0 0.4 0.0 0.0 0.0 0.0Brazil (LAC) 19-Mar-1990 1-Oct-1992 0.0 0.0 0.0 12.0 133.0 27.3 0.0 3.0 5.3 3.0 0.0 0.0 0.0 0.0 3.8Chile (LAC) 26-Mar-1990 9-Apr-1992 0.0 0.0 0.0 0.0 0.0 0.0 0.0 0.0 0.0 0.0 1.2 0.0 0.0 0.0 0.0China (ASIA) 14-Jun-1991 14-Jun-1991 0.0 0.0 0.0 1,272.1 136.0 193.0 50.0 23.0 27.0 27.0 26.9 26.9 20.5 20.5 25.7Colombia (LAC) 6-Dec-1993 6-Dec-1993 0.0 0.0 - 0.0 0.0 0.0 0.0 -0.7 0.0 0.0 0.0 0.0 0.0 0.0 0.0Cyprus (ASIA EC) 28-May-1992 11-Oct-1994 0.0 12.0 54.8 0.0 0.0 18.9 37.2 76.1 0.0 0.0 0.0 0.0 0.0 25.4Ecuador (LAC) 30-Apr-1990 23-Feb-1993 0.0 0.0 0.0 0.0 2.1 0.0 66.8 2.9 0.0 0.0 0.4 0.0 0.0 0.0 1.0Georgia (EEUR) 21-Mar-1996 12-Jul-2000 10.0 - - 0.0 0.0 0.0 0.0 0.0 0.0 0.0 0.0 0.0 0.0 0.0 0.0Honduras (LAC) 14-Oct-1993 24-Jan-2002 0.4 - - - 0.0 0.0 0.0 0.0 0.0 0.0 0.0 0.0 0.0 0.0 0.0India (ASIA) 19-Jun-1992 19-Jun-1992 0.0 0.0 0.0 0.0 0.0 0.0 0.0 0.0 0.0 0.0 0.0 0.0 -28.3 0.0 0.0Jordan (ASIA) 31-May-1989 12-Nov-1993 0.3 0.3 0.3 15.0 15.0 0.0 0.0 0.0 10.0 0.1 0.0 0.0 0.0 0.0 3.4Kuwait (ASIA) 23-Nov-1992 22-Jul-1994 1.0 - - 0.0 0.0 0.0 0.0 0.0 0.0 0.0 0.0 0.0 0.0 0.0 0.0Kyrgyzstan (ASIA) 31-May-2000 13-May-2003 2.0 2.0 2.0 2.0 2.0 2.5 6.0 0.0 0.0 0.1 0.0 0.0 0.0 0.0 0.0Lebanon (ASIA) 31-Mar-1993 31-Mar-1993 0.0 - 0.0 0.0 0.0 0.0 0.0 0.0 0.5 0.0 0.0 0.0 0.0 0.0 0.2Madagascar (AFR) 7-Nov-1996 16-Jan-2002 0.6 - - - 0.0 0.0 0.2 1.1 1.5 0.0 0.0 0.0 0.0 0.0 0.9Malaysia (ASIA) 29-Aug-1989 16-Jun-1993 0.0 - 0.0 1.0 204.1 18.6 39.1 12.2 21.1 0.0 10.6 0.0 0.0 0.0 11.1Mexico (LAC) 31-Mar-1988 11-Oct-1991 0.5 0.0 53.7 2.6 0.8 0.0 0.0 0.0 0.0 0.0 0.0 0.0 0.0 0.0 0.0Morocco (AFR) 28-Dec-1995 28-Dec-1995 0.0 0.0 0.0 0.0 0.0 0.0 0.0 0.0 0.0 0.0 0.0 8.4 0.0 0.0 0.0Nigeria (AFR) 31-Oct-1988 27-Sep-2001 0.0 - 7.2 7.2 7.2 0.0 0.0 0.0 0.0 0.0 0.0 0.0 0.0 0.0 0.0Peru (LAC) 31-Mar-1993 31-Mar-1993 0.0 0.0 0.0 190.7 0.0 0.0 0.0 4.0 8.2 0.0 0.1 0.0 0.0 0.0 4.1Philippines (ASIA) 17-Jul-1991 9-Aug-1993 0.0 7.5 0.7 0.1 0.0 0.0 0.0 0.0 0.0 0.0 0.0 0.0 0.0 0.0 0.0Republic of Korea (ASIA) 27-Feb-1992 10-Dec-1992 352.0 603.0 141.0 1.2 0.0 0.0 0.0 0.0 3.0 0.0 0.0 0.0 0.0 0.0 1.0Romania (EEUR) 27-Jan-1993 27-Jan-1993 0.0 - 0.0 0.0 0.1 0.0 0.4 0.2 0.7 0.0 -0.4 0.0 0.0 0.0 0.3Singapore (ASIA) 5-Jan-1989 2-Mar-1993 1.0 - 0.2 0.1 0.1 0.0 0.0 0.0 0.0 0.0 0.0 0.0 0.0 0.0 0.0South Africa (AFR) 15-Jan-1990 12-May-1992 666.9 0.0 0.0 0.0 0.0 0.0 0.0 0.0 0.0 0.0 0.0 0.0 0.0 0.0 0.0Sri Lanka (ASIA) 15-Dec-1989 16-Jun-1993 0.0 - 0.0 0.0 0.0 5.1 0.0 0.0 0.0 0.0 0.0 0.0 0.0 0.0 0.0Syrian Arab Republic (ASIA) 12-Dec-1989 30-Nov-1999 55.6 62.1 63.9 - 52.4 50.0 48.0 0.0 0.0 0.0 0.0 0.0 0.0 0.0 0.0Thailand (ASIA) 7-Jul-1989 25-Jun-1992 0.0 0.0 1.1 0.0 0.0 0.0 0.0 0.0 0.0 0.0 0.0 0.0 0.0 0.0 0.0The Former Yugoslav Republic of Macedonia (EEUR) 10-Mar-1994 9-Nov-1998 0.0 - - - 0.0 0.0 0.0 0.0 1.4 0.0 0.0 0.0 0.0 0.0 0.5Tunisia (AFR) 25-Sep-1989 15-Jul-1993 0.0 0.0 116.0 0.0 0.0 0.0 0.0 0.0 0.0 0.0 0.0 0.0 0.0 0.0 0.0Turkey (EEUR) 20-Sep-1991 13-Apr-1995 0.0 0.0 0.0 0.8 0.0 0.0 0.0 0.0 0.0 0.0 0.0 0.0 0.0 0.0 0.0Uganda (AFR) 15-Sep-1988 20-Jan-1994 0.0 - 0.0 0.1 0.1 0.1 0.1 0.0 0.1 0.1 0.1 0.1 0.0 0.0 0.1Uruguay (LAC) 8-Jan-1991 16-Nov-1993 0.0 - 0.0 0.7 0.0 0.0 0.0 0.0 0.0 0.0 0.0 0.0 0.0 0.0 0.0Venezuela (Bolivarian Republic of) (LAC) 6-Feb-1989 29-Jul-1993 0.0 0.0 0.0 0.0 0.0 0.0 0.0 0.0 0.0 81.7 0.0 0.0 0.0 0.0 27.2Viet Nam (ASIA) 26-Jan-1994 26-Jan-1994 0.0 - - 0.0 0.0 0.0 0.5 0.5 0.0 0.0 0.0 0.0 0.0 0.0 0.2Subtotal (Article 5 - Annex B, Group I) 1,090.8 697.7 440.9 1,506.6 563.9 316.6 263.9 123.4 79.8 113.0 40.1 36.2 -7.0 21.3 105.9TOTAL (Annex B, Group I) 4,399.7 2,449.4 1,393.0 1,779.9 644.3 351.5 338.1 151.4 99.0 140.4 40.0 37.2 -10.0 -1,419.7 3,414.8
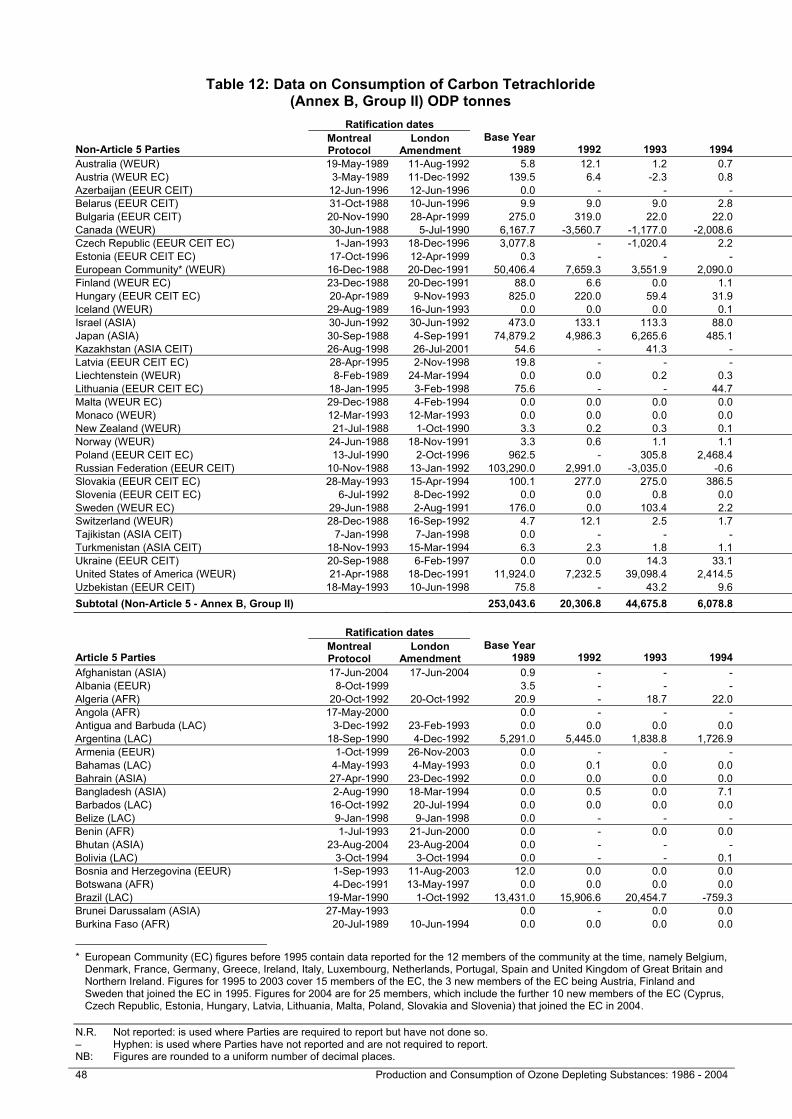
Table 12: Data on Consumption of Carbon Tetrachloride (Annex B, Group II) ODP tonnes
N.R. Not reported: is used where Parties are required to report but have not done so. AFR = Africa ASIA = Asia EEUR = Eastern Europe CEIT = Country with Economy in Transition – Hyphen: is used where Parties have not reported and are not required to report. LAC = Latin America and the Caribbean WEUR = Western Europe and Others EC = Member of the European Community NB: Figures are rounded to a uniform number of decimal places.
48 Production and Consumption of Ozone Depleting Substances: 1986 - 2004 Production and Consumption of Ozone Depleting Substances: 1986 – 2004 49
Table 12: Data on Consumption of Carbon Tetrachloride (Annex B, Group II) ODP tonnes
Ratification dates
Non-Article 5 Parties Montreal Protocol
London Amendment
Base Year 1989 1992 1993 1994 1995 1996 1997 1998 1999 2000 2001 2002 2003 2004
Baselevel
Australia (WEUR) 19-May-1989 11-Aug-1992 5.8 12.1 1.2 0.7 0.2 0.4 0.5 0.2 0.0 0.0 0.0 0.0 0.0 0.0 5.8Austria (WEUR EC) 3-May-1989 11-Dec-1992 139.5 6.4 -2.3 0.8 139.5Azerbaijan (EEUR CEIT) 12-Jun-1996 12-Jun-1996 0.0 - - - - 0.0 0.0 0.0 0.0 0.0 0.0 0.0 0.0 0.0 0.0Belarus (EEUR CEIT) 31-Oct-1988 10-Jun-1996 9.9 9.0 9.0 2.8 0.0 3.1 1.0 -0.4 0.5 0.8 0.0 0.0 0.0 0.0 9.9Bulgaria (EEUR CEIT) 20-Nov-1990 28-Apr-1999 275.0 319.0 22.0 22.0 22.0 5.5 0.0 0.0 0.0 0.0 0.0 0.0 0.0 0.0 275.0Canada (WEUR) 30-Jun-1988 5-Jul-1990 6,167.7 -3,560.7 -1,177.0 -2,008.6 -907.5 0.0 0.0 0.3 0.4 0.6 0.3 -0.4 0.1 0.3 6,167.7Czech Republic (EEUR CEIT EC) 1-Jan-1993 18-Dec-1996 3,077.8 - -1,020.4 2.2 1.7 0.1 0.1 0.0 -85.5 -81.4 0.0 132.0 94.6 3,077.8Estonia (EEUR CEIT EC) 17-Oct-1996 12-Apr-1999 0.3 - - - 0.0 0.0 0.0 0.0 0.2 0.0 0.0 0.0 0.0 0.3European Community* (WEUR) 16-Dec-1988 20-Dec-1991 50,406.4 7,659.3 3,551.9 2,090.0 -3,183.4 463.1 -2,432.1 441.1 -550.0 -4,264.3 -10,900.6 -12,299.8 662.2 -887.7 50,406.4Finland (WEUR EC) 23-Dec-1988 20-Dec-1991 88.0 6.6 0.0 1.1 88.0Hungary (EEUR CEIT EC) 20-Apr-1989 9-Nov-1993 825.0 220.0 59.4 31.9 17.6 0.0 0.0 0.0 0.0 0.0 0.0 0.0 0.0 825.0Iceland (WEUR) 29-Aug-1989 16-Jun-1993 0.0 0.0 0.0 0.1 0.0 0.0 0.0 0.0 0.0 0.0 0.0 0.0 0.0 0.0 0.0Israel (ASIA) 30-Jun-1992 30-Jun-1992 473.0 133.1 113.3 88.0 71.5 68.2 0.0 0.0 0.0 0.0 0.0 0.0 0.0 0.0 473.0Japan (ASIA) 30-Sep-1988 4-Sep-1991 74,879.2 4,986.3 6,265.6 485.1 255.2 -671.0 39.6 33.0 37.4 23.0 34.8 30.4 30.5 19.8 74,879.2Kazakhstan (ASIA CEIT) 26-Aug-1998 26-Jul-2001 54.6 - 41.3 - - 33.0 32.7 20.9 5.5 1.7 0.6 0.0 0.0 0.0 54.6Latvia (EEUR CEIT EC) 28-Apr-1995 2-Nov-1998 19.8 - - - 16.5 16.5 13.2 0.0 0.2 0.0 0.0 0.0 0.0 19.8Liechtenstein (WEUR) 8-Feb-1989 24-Mar-1994 0.0 0.0 0.2 0.3 0.3 0.2 0.0 0.0 0.0 0.0 0.0 0.0 0.0 N.R. 0.0Lithuania (EEUR CEIT EC) 18-Jan-1995 3-Feb-1998 75.6 - - 44.7 10.5 8.3 5.6 4.6 0.0 0.0 -0.7 0.0 0.0 75.6Malta (WEUR EC) 29-Dec-1988 4-Feb-1994 0.0 0.0 0.0 0.0 0.0 0.0 0.0 0.0 0.0 0.0 0.0 0.0 0.0 0.0Monaco (WEUR) 12-Mar-1993 12-Mar-1993 0.0 0.0 0.0 0.0 0.0 0.0 0.0 0.0 0.0 0.0 0.0 0.0 0.0 0.0 0.0New Zealand (WEUR) 21-Jul-1988 1-Oct-1990 3.3 0.2 0.3 0.1 0.1 0.0 0.0 0.0 0.0 0.0 0.0 0.0 0.0 0.0 3.3Norway (WEUR) 24-Jun-1988 18-Nov-1991 3.3 0.6 1.1 1.1 0.5 0.4 0.4 0.2 0.5 0.3 0.1 0.0 0.0 -28.0 3.3Poland (EEUR CEIT EC) 13-Jul-1990 2-Oct-1996 962.5 - 305.8 2,468.4 - 6.3 4.2 7.2 2.8 2.8 2.2 1.1 0.7 962.5Russian Federation (EEUR CEIT) 10-Nov-1988 13-Jan-1992 103,290.0 2,991.0 -3,035.0 -0.6 0.0 542.4 0.0 114.0 0.0 0.0 0.0 -6.4 40.4 N.R. 103,290.0Slovakia (EEUR CEIT EC) 28-May-1993 15-Apr-1994 100.1 277.0 275.0 386.5 0.7 0.0 0.2 0.1 0.1 0.0 0.0 0.0 0.0 100.1Slovenia (EEUR CEIT EC) 6-Jul-1992 8-Dec-1992 0.0 0.0 0.8 0.0 0.1 -0.6 0.0 0.1 0.0 0.2 0.1 0.1 0.2 0.0Sweden (WEUR EC) 29-Jun-1988 2-Aug-1991 176.0 0.0 103.4 2.2 176.0Switzerland (WEUR) 28-Dec-1988 16-Sep-1992 4.7 12.1 2.5 1.7 -11.0 4.0 3.0 1.3 0.0 3.6 2.2 3.3 2.4 2.7 4.7Tajikistan (ASIA CEIT) 7-Jan-1998 7-Jan-1998 0.0 - - - 0.3 0.0 0.1 0.1 0.1 0.0 0.0 0.0 0.0 0.0 0.0Turkmenistan (ASIA CEIT) 18-Nov-1993 15-Mar-1994 6.3 2.3 1.8 1.1 0.2 0.0 0.0 0.0 0.0 0.0 0.0 0.0 0.0 0.0 6.3Ukraine (EEUR CEIT) 20-Sep-1988 6-Feb-1997 0.0 0.0 14.3 33.1 16.5 3.3 -2,178.6 2,820.7 0.7 0.0 0.0 0.0 0.0 0.0 0.0United States of America (WEUR) 21-Apr-1988 18-Dec-1991 11,924.0 7,232.5 39,098.4 2,414.5 -17,922.3 11.0 -27,239.8 -32,358.7 -12,487.2 -18,660.4 818.4 -2,182.4 -568.7 9.4 11,924.0Uzbekistan (EEUR CEIT) 18-May-1993 10-Jun-1998 75.8 - 43.2 9.6 7.9 11.5 2.8 0.0 0.0 0.4 2.2 0.0 0.0 0.0 75.8Subtotal (Non-Article 5 - Annex B, Group II) 253,043.6 20,306.8 44,675.8 6,078.8 -21,602.4 505.7 -31,747.1 -28,915.3 -13,074.3 -22,972.7 -10,040.4 -14,322.1 262.4 -883.5 253,043.6
Ratification dates Article 5 Baseline Years
Article 5 Parties Montreal Protocol
London Amendment
Base Year 1989 1992 1993 1994 1995 1996 1997 1998 1999 2000 2001 2002 2003 2004
Baselevel
Afghanistan (ASIA) 17-Jun-2004 17-Jun-2004 0.9 - - - - - - 0.9 0.9 0.9 - - - 0.3 0.9Albania (EEUR) 8-Oct-1999 3.5 - - - 3.1 3.1 3.1 3.1 3.1 3.1 1.3 0.0 2.9 0.0 3.1Algeria (AFR) 20-Oct-1992 20-Oct-1992 20.9 - 18.7 22.0 20.9 20.9 20.9 20.9 20.9 20.9 18.7 18.7 18.7 2.2 20.9Angola (AFR) 17-May-2000 0.0 - - - - - - 0.0 - 0.0 0.0 0.0 0.0 0.0 -Antigua and Barbuda (LAC) 3-Dec-1992 23-Feb-1993 0.0 0.0 0.0 0.0 0.0 0.0 0.0 0.0 0.0 0.0 0.0 0.0 0.0 0.0 0.0Argentina (LAC) 18-Sep-1990 4-Dec-1992 5,291.0 5,445.0 1,838.8 1,726.9 2,854.5 0.9 194.3 134.5 13.8 413.3 59.3 20.8 58.8 25.9 187.2Armenia (EEUR) 1-Oct-1999 26-Nov-2003 0.0 - - - 0.0 0.0 0.0 0.0 0.0 0.0 0.0 0.0 0.0 0.0 0.0Bahamas (LAC) 4-May-1993 4-May-1993 0.0 0.1 0.0 0.0 0.0 0.0 0.0 0.0 0.0 0.0 0.0 0.3 0.0 0.0 0.0Bahrain (ASIA) 27-Apr-1990 23-Dec-1992 0.0 0.0 0.0 0.0 0.0 0.0 1.3 1.1 0.6 0.6 0.6 1.1 1.0 0.1 0.7Bangladesh (ASIA) 2-Aug-1990 18-Mar-1994 0.0 0.5 0.0 7.1 8.3 2.0 2.2 5.5 6.1 5.5 11.7 13.8 6.7 5.5 5.7Barbados (LAC) 16-Oct-1992 20-Jul-1994 0.0 0.0 0.0 0.0 0.0 0.0 0.0 0.0 0.0 0.0 0.0 0.0 0.0 0.0 0.0Belize (LAC) 9-Jan-1998 9-Jan-1998 0.0 - - - - - 0.0 0.0 0.0 0.0 0.0 0.0 0.0 0.0 0.0Benin (AFR) 1-Jul-1993 21-Jun-2000 0.0 - 0.0 0.0 0.0 0.0 0.0 0.0 0.0 0.0 0.0 0.0 0.0 0.0 0.0Bhutan (ASIA) 23-Aug-2004 23-Aug-2004 0.0 - - - 0.0 0.0 0.0 0.0 0.0 0.0 - - - 0.0 0.0Bolivia (LAC) 3-Oct-1994 3-Oct-1994 0.0 - - 0.1 0.0 0.8 0.1 0.3 0.2 0.4 0.0 0.0 0.0 0.0 0.3Bosnia and Herzegovina (EEUR) 1-Sep-1993 11-Aug-2003 12.0 0.0 0.0 0.0 0.0 0.0 8.3 0.0 0.0 0.0 0.0 0.0 0.0 0.0 0.0Botswana (AFR) 4-Dec-1991 13-May-1997 0.0 0.0 0.0 0.0 0.0 0.0 0.0 0.0 0.0 0.0 0.0 0.0 0.0 0.0 0.0Brazil (LAC) 19-Mar-1990 1-Oct-1992 13,431.0 15,906.6 20,454.7 -759.3 933.0 -647.5 -6,396.7 -194.7 662.2 767.2 163.1 -385.7 274.4 222.1 411.6Brunei Darussalam (ASIA) 27-May-1993 0.0 - 0.0 0.0 0.0 0.0 0.0 0.0 0.0 0.0 0.0 0.0 0.0 - 0.0Burkina Faso (AFR) 20-Jul-1989 10-Jun-1994 0.0 0.0 0.0 0.0 0.0 0.0 0.0 0.0 0.0 0.0 0.0 0.0 0.0 0.0 0.0
* European Community (EC) figures before 1995 contain data reported for the 12 members of the community at the time, namely Belgium,
Denmark, France, Germany, Greece, Ireland, Italy, Luxembourg, Netherlands, Portugal, Spain and United Kingdom of Great Britain and Northern Ireland. Figures for 1995 to 2003 cover 15 members of the EC, the 3 new members of the EC being Austria, Finland and Sweden that joined the EC in 1995. Figures for 2004 are for 25 members, which include the further 10 new members of the EC (Cyprus, Czech Republic, Estonia, Hungary, Latvia, Lithuania, Malta, Poland, Slovakia and Slovenia) that joined the EC in 2004.
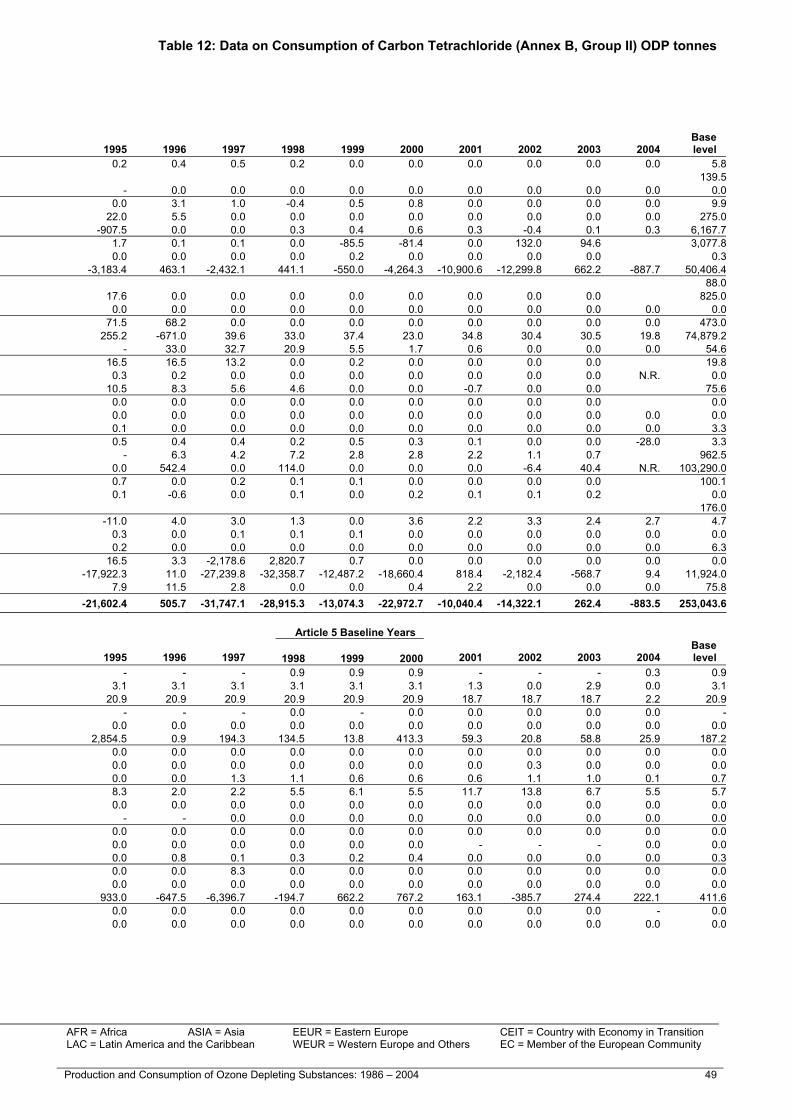
Table 12: Data on Consumption of Carbon Tetrachloride (Annex B, Group II) ODP tonnes
N.R. Not reported: is used where Parties are required to report but have not done so. AFR = Africa ASIA = Asia EEUR = Eastern Europe CEIT = Country with Economy in Transition – Hyphen: is used where Parties have not reported and are not required to report. LAC = Latin America and the Caribbean WEUR = Western Europe and Others EC = Member of the European Community NB: Figures are rounded to a uniform number of decimal places.
48 Production and Consumption of Ozone Depleting Substances: 1986 - 2004 Production and Consumption of Ozone Depleting Substances: 1986 – 2004 49
Table 12: Data on Consumption of Carbon Tetrachloride (Annex B, Group II) ODP tonnes
Ratification dates
Non-Article 5 Parties Montreal Protocol
London Amendment
Base Year 1989 1992 1993 1994 1995 1996 1997 1998 1999 2000 2001 2002 2003 2004
Baselevel
Australia (WEUR) 19-May-1989 11-Aug-1992 5.8 12.1 1.2 0.7 0.2 0.4 0.5 0.2 0.0 0.0 0.0 0.0 0.0 0.0 5.8Austria (WEUR EC) 3-May-1989 11-Dec-1992 139.5 6.4 -2.3 0.8 139.5Azerbaijan (EEUR CEIT) 12-Jun-1996 12-Jun-1996 0.0 - - - - 0.0 0.0 0.0 0.0 0.0 0.0 0.0 0.0 0.0 0.0Belarus (EEUR CEIT) 31-Oct-1988 10-Jun-1996 9.9 9.0 9.0 2.8 0.0 3.1 1.0 -0.4 0.5 0.8 0.0 0.0 0.0 0.0 9.9Bulgaria (EEUR CEIT) 20-Nov-1990 28-Apr-1999 275.0 319.0 22.0 22.0 22.0 5.5 0.0 0.0 0.0 0.0 0.0 0.0 0.0 0.0 275.0Canada (WEUR) 30-Jun-1988 5-Jul-1990 6,167.7 -3,560.7 -1,177.0 -2,008.6 -907.5 0.0 0.0 0.3 0.4 0.6 0.3 -0.4 0.1 0.3 6,167.7Czech Republic (EEUR CEIT EC) 1-Jan-1993 18-Dec-1996 3,077.8 - -1,020.4 2.2 1.7 0.1 0.1 0.0 -85.5 -81.4 0.0 132.0 94.6 3,077.8Estonia (EEUR CEIT EC) 17-Oct-1996 12-Apr-1999 0.3 - - - 0.0 0.0 0.0 0.0 0.2 0.0 0.0 0.0 0.0 0.3European Community* (WEUR) 16-Dec-1988 20-Dec-1991 50,406.4 7,659.3 3,551.9 2,090.0 -3,183.4 463.1 -2,432.1 441.1 -550.0 -4,264.3 -10,900.6 -12,299.8 662.2 -887.7 50,406.4Finland (WEUR EC) 23-Dec-1988 20-Dec-1991 88.0 6.6 0.0 1.1 88.0Hungary (EEUR CEIT EC) 20-Apr-1989 9-Nov-1993 825.0 220.0 59.4 31.9 17.6 0.0 0.0 0.0 0.0 0.0 0.0 0.0 0.0 825.0Iceland (WEUR) 29-Aug-1989 16-Jun-1993 0.0 0.0 0.0 0.1 0.0 0.0 0.0 0.0 0.0 0.0 0.0 0.0 0.0 0.0 0.0Israel (ASIA) 30-Jun-1992 30-Jun-1992 473.0 133.1 113.3 88.0 71.5 68.2 0.0 0.0 0.0 0.0 0.0 0.0 0.0 0.0 473.0Japan (ASIA) 30-Sep-1988 4-Sep-1991 74,879.2 4,986.3 6,265.6 485.1 255.2 -671.0 39.6 33.0 37.4 23.0 34.8 30.4 30.5 19.8 74,879.2Kazakhstan (ASIA CEIT) 26-Aug-1998 26-Jul-2001 54.6 - 41.3 - - 33.0 32.7 20.9 5.5 1.7 0.6 0.0 0.0 0.0 54.6Latvia (EEUR CEIT EC) 28-Apr-1995 2-Nov-1998 19.8 - - - 16.5 16.5 13.2 0.0 0.2 0.0 0.0 0.0 0.0 19.8Liechtenstein (WEUR) 8-Feb-1989 24-Mar-1994 0.0 0.0 0.2 0.3 0.3 0.2 0.0 0.0 0.0 0.0 0.0 0.0 0.0 N.R. 0.0Lithuania (EEUR CEIT EC) 18-Jan-1995 3-Feb-1998 75.6 - - 44.7 10.5 8.3 5.6 4.6 0.0 0.0 -0.7 0.0 0.0 75.6Malta (WEUR EC) 29-Dec-1988 4-Feb-1994 0.0 0.0 0.0 0.0 0.0 0.0 0.0 0.0 0.0 0.0 0.0 0.0 0.0 0.0Monaco (WEUR) 12-Mar-1993 12-Mar-1993 0.0 0.0 0.0 0.0 0.0 0.0 0.0 0.0 0.0 0.0 0.0 0.0 0.0 0.0 0.0New Zealand (WEUR) 21-Jul-1988 1-Oct-1990 3.3 0.2 0.3 0.1 0.1 0.0 0.0 0.0 0.0 0.0 0.0 0.0 0.0 0.0 3.3Norway (WEUR) 24-Jun-1988 18-Nov-1991 3.3 0.6 1.1 1.1 0.5 0.4 0.4 0.2 0.5 0.3 0.1 0.0 0.0 -28.0 3.3Poland (EEUR CEIT EC) 13-Jul-1990 2-Oct-1996 962.5 - 305.8 2,468.4 - 6.3 4.2 7.2 2.8 2.8 2.2 1.1 0.7 962.5Russian Federation (EEUR CEIT) 10-Nov-1988 13-Jan-1992 103,290.0 2,991.0 -3,035.0 -0.6 0.0 542.4 0.0 114.0 0.0 0.0 0.0 -6.4 40.4 N.R. 103,290.0Slovakia (EEUR CEIT EC) 28-May-1993 15-Apr-1994 100.1 277.0 275.0 386.5 0.7 0.0 0.2 0.1 0.1 0.0 0.0 0.0 0.0 100.1Slovenia (EEUR CEIT EC) 6-Jul-1992 8-Dec-1992 0.0 0.0 0.8 0.0 0.1 -0.6 0.0 0.1 0.0 0.2 0.1 0.1 0.2 0.0Sweden (WEUR EC) 29-Jun-1988 2-Aug-1991 176.0 0.0 103.4 2.2 176.0Switzerland (WEUR) 28-Dec-1988 16-Sep-1992 4.7 12.1 2.5 1.7 -11.0 4.0 3.0 1.3 0.0 3.6 2.2 3.3 2.4 2.7 4.7Tajikistan (ASIA CEIT) 7-Jan-1998 7-Jan-1998 0.0 - - - 0.3 0.0 0.1 0.1 0.1 0.0 0.0 0.0 0.0 0.0 0.0Turkmenistan (ASIA CEIT) 18-Nov-1993 15-Mar-1994 6.3 2.3 1.8 1.1 0.2 0.0 0.0 0.0 0.0 0.0 0.0 0.0 0.0 0.0 6.3Ukraine (EEUR CEIT) 20-Sep-1988 6-Feb-1997 0.0 0.0 14.3 33.1 16.5 3.3 -2,178.6 2,820.7 0.7 0.0 0.0 0.0 0.0 0.0 0.0United States of America (WEUR) 21-Apr-1988 18-Dec-1991 11,924.0 7,232.5 39,098.4 2,414.5 -17,922.3 11.0 -27,239.8 -32,358.7 -12,487.2 -18,660.4 818.4 -2,182.4 -568.7 9.4 11,924.0Uzbekistan (EEUR CEIT) 18-May-1993 10-Jun-1998 75.8 - 43.2 9.6 7.9 11.5 2.8 0.0 0.0 0.4 2.2 0.0 0.0 0.0 75.8Subtotal (Non-Article 5 - Annex B, Group II) 253,043.6 20,306.8 44,675.8 6,078.8 -21,602.4 505.7 -31,747.1 -28,915.3 -13,074.3 -22,972.7 -10,040.4 -14,322.1 262.4 -883.5 253,043.6
Ratification dates Article 5 Baseline Years
Article 5 Parties Montreal Protocol
London Amendment
Base Year 1989 1992 1993 1994 1995 1996 1997 1998 1999 2000 2001 2002 2003 2004
Baselevel
Afghanistan (ASIA) 17-Jun-2004 17-Jun-2004 0.9 - - - - - - 0.9 0.9 0.9 - - - 0.3 0.9Albania (EEUR) 8-Oct-1999 3.5 - - - 3.1 3.1 3.1 3.1 3.1 3.1 1.3 0.0 2.9 0.0 3.1Algeria (AFR) 20-Oct-1992 20-Oct-1992 20.9 - 18.7 22.0 20.9 20.9 20.9 20.9 20.9 20.9 18.7 18.7 18.7 2.2 20.9Angola (AFR) 17-May-2000 0.0 - - - - - - 0.0 - 0.0 0.0 0.0 0.0 0.0 -Antigua and Barbuda (LAC) 3-Dec-1992 23-Feb-1993 0.0 0.0 0.0 0.0 0.0 0.0 0.0 0.0 0.0 0.0 0.0 0.0 0.0 0.0 0.0Argentina (LAC) 18-Sep-1990 4-Dec-1992 5,291.0 5,445.0 1,838.8 1,726.9 2,854.5 0.9 194.3 134.5 13.8 413.3 59.3 20.8 58.8 25.9 187.2Armenia (EEUR) 1-Oct-1999 26-Nov-2003 0.0 - - - 0.0 0.0 0.0 0.0 0.0 0.0 0.0 0.0 0.0 0.0 0.0Bahamas (LAC) 4-May-1993 4-May-1993 0.0 0.1 0.0 0.0 0.0 0.0 0.0 0.0 0.0 0.0 0.0 0.3 0.0 0.0 0.0Bahrain (ASIA) 27-Apr-1990 23-Dec-1992 0.0 0.0 0.0 0.0 0.0 0.0 1.3 1.1 0.6 0.6 0.6 1.1 1.0 0.1 0.7Bangladesh (ASIA) 2-Aug-1990 18-Mar-1994 0.0 0.5 0.0 7.1 8.3 2.0 2.2 5.5 6.1 5.5 11.7 13.8 6.7 5.5 5.7Barbados (LAC) 16-Oct-1992 20-Jul-1994 0.0 0.0 0.0 0.0 0.0 0.0 0.0 0.0 0.0 0.0 0.0 0.0 0.0 0.0 0.0Belize (LAC) 9-Jan-1998 9-Jan-1998 0.0 - - - - - 0.0 0.0 0.0 0.0 0.0 0.0 0.0 0.0 0.0Benin (AFR) 1-Jul-1993 21-Jun-2000 0.0 - 0.0 0.0 0.0 0.0 0.0 0.0 0.0 0.0 0.0 0.0 0.0 0.0 0.0Bhutan (ASIA) 23-Aug-2004 23-Aug-2004 0.0 - - - 0.0 0.0 0.0 0.0 0.0 0.0 - - - 0.0 0.0Bolivia (LAC) 3-Oct-1994 3-Oct-1994 0.0 - - 0.1 0.0 0.8 0.1 0.3 0.2 0.4 0.0 0.0 0.0 0.0 0.3Bosnia and Herzegovina (EEUR) 1-Sep-1993 11-Aug-2003 12.0 0.0 0.0 0.0 0.0 0.0 8.3 0.0 0.0 0.0 0.0 0.0 0.0 0.0 0.0Botswana (AFR) 4-Dec-1991 13-May-1997 0.0 0.0 0.0 0.0 0.0 0.0 0.0 0.0 0.0 0.0 0.0 0.0 0.0 0.0 0.0Brazil (LAC) 19-Mar-1990 1-Oct-1992 13,431.0 15,906.6 20,454.7 -759.3 933.0 -647.5 -6,396.7 -194.7 662.2 767.2 163.1 -385.7 274.4 222.1 411.6Brunei Darussalam (ASIA) 27-May-1993 0.0 - 0.0 0.0 0.0 0.0 0.0 0.0 0.0 0.0 0.0 0.0 0.0 - 0.0Burkina Faso (AFR) 20-Jul-1989 10-Jun-1994 0.0 0.0 0.0 0.0 0.0 0.0 0.0 0.0 0.0 0.0 0.0 0.0 0.0 0.0 0.0
* European Community (EC) figures before 1995 contain data reported for the 12 members of the community at the time, namely Belgium,
Denmark, France, Germany, Greece, Ireland, Italy, Luxembourg, Netherlands, Portugal, Spain and United Kingdom of Great Britain and Northern Ireland. Figures for 1995 to 2003 cover 15 members of the EC, the 3 new members of the EC being Austria, Finland and Sweden that joined the EC in 1995. Figures for 2004 are for 25 members, which include the further 10 new members of the EC (Cyprus, Czech Republic, Estonia, Hungary, Latvia, Lithuania, Malta, Poland, Slovakia and Slovenia) that joined the EC in 2004.

Table 12: Data on Consumption of Carbon Tetrachloride (Annex B, Group II) ODP tonnes Table 12: Data on Consumption of Carbon Tetrachloride (Annex B, Group II) ODP tonnes
N.R. Not reported: is used where Parties are required to report but have not done so. AFR = Africa ASIA = Asia EEUR = Eastern Europe CEIT = Country with Economy in Transition – Hyphen: is used where Parties have not reported and are not required to report. LAC = Latin America and the Caribbean WEUR = Western Europe and Others EC = Member of the European Community NB: Figures are rounded to a uniform number of decimal places.
50 Production and Consumption of Ozone Depleting Substances: 1986 - 2004 Production and Consumption of Ozone Depleting Substances: 1986 – 2004 51
Ratification dates Article 5 Baseline Years
Article 5 Parties Montreal Protocol
London Amendment
Base Year 1989 1992 1993 1994 1995 1996 1997 1998 1999 2000 2001 2002 2003 2004
Baselevel
Burundi (AFR) 6-Jan-1997 18-Oct-2001 0.0 0.0 - - 0.0 0.0 0.0 0.0 0.0 0.0 0.0 0.0 0.0 0.0 0.0Cambodia (ASIA) 27-Jun-2001 0.0 - - - 0.0 0.0 0.0 0.0 0.0 0.0 0.0 0.0 0.0 0.0 0.0Cameroon (AFR) 30-Aug-1989 8-Jun-1992 1.1 1.1 1.7 1.7 0.0 0.0 0.0 0.0 0.0 0.0 0.0 0.0 0.0 0.0 0.0Cape Verde (AFR) 31-Jul-2001 31-Jul-2001 0.0 0.0 0.0 0.0 0.0 0.0 0.0 0.0 0.0 0.0 0.0 0.0 0.0 0.0 0.0Central African Republic (AFR) 29-Mar-1993 0.0 - 0.0 0.0 0.0 0.0 0.0 0.0 0.0 0.0 0.0 0.0 0.0 - 0.0Chad (AFR) 7-Jun-1994 30-May-2001 0.0 0.2 0.3 0.3 0.4 0.4 0.0 0.0 0.0 0.0 0.0 0.0 0.0 N.R. 0.0Chile (LAC) 26-Mar-1990 9-Apr-1992 20.1 14.3 6.5 14.6 5.7 2.4 1.5 0.7 0.9 0.2 1.3 0.4 0.8 5.0 0.6China (ASIA) 14-Jun-1991 14-Jun-1991 29,940.9 30,897.9 33,221.1 -503.8 -15.4 -100.1 110.0 85,628.4 110.0 81,935.7 15,305.4 3,294.4 20,019.9 3,885.8 55,891.4Colombia (LAC) 6-Dec-1993 6-Dec-1993 49.0 27.5 - 0.0 0.0 0.0 20.9 6.8 11.0 0.6 13.4 0.9 1.4 0.8 6.1Comoros (AFR) 31-Oct-1994 31-Oct-1994 0.0 - - - 0.0 0.0 0.0 0.0 0.0 0.0 0.0 0.0 0.0 0.0 0.0Congo (AFR) 16-Nov-1994 16-Nov-1994 0.0 - - 0.0 0.0 0.3 0.0 0.0 0.0 1.8 0.0 0.0 0.0 0.0 0.6Cook Islands (ASIA) 22-Dec-2003 22-Dec-2003 0.0 - - - 0.0 0.0 0.0 0.0 0.0 0.0 - - 0.0 N.R. 0.0Costa Rica (LAC) 30-Jul-1991 11-Nov-1998 0.0 0.0 - 0.8 0.6 0.2 0.0 0.0 0.0 0.0 0.0 0.0 0.0 0.0 0.0Côte d'Ivoire (AFR) 5-Apr-1993 18-May-1994 0.0 - 0.0 0.0 0.0 0.0 0.0 0.0 0.0 0.0 0.0 0.0 0.0 0.0 0.0Croatia (EEUR) 21-Sep-1992 15-Oct-1993 333.3 221.1 441.1 177.1 177.1 0.0 6.2 5.7 5.4 0.0 0.2 2.5 2.3 0.6 3.9Cuba (LAC) 14-Jul-1992 19-Oct-1998 86.7 - - - 0.0 6.4 0.0 0.0 0.1 8.0 1.3 3.5 0.1 0.5 2.7Cyprus (ASIA EC) 28-May-1992 11-Oct-1994 49.5 8.8 0.0 0.1 0.0 0.0 0.0 0.0 0.0 0.0 0.1 0.0 0.0 0.0Democratic People's Republic of Korea (ASIA) 24-Jan-1995 17-Jun-1999 440.0 - - - 374.0 1,232.0 1,309.0 1,424.5 1,386.0 1,045.0 2,077.9 2,027.3 1,585.2 2,198.9 1,285.2Democratic Republic of the Congo (AFR) 30-Nov-1994 30-Nov-1994 0.0 - - - 24.2 24.2 11.0 22.0 7.3 16.5 16.5 16.5 11.0 11.0 15.3Djibouti (AFR) 30-Jul-1999 30-Jul-1999 0.0 - - - 0.0 0.0 0.0 0.0 0.0 0.0 0.0 0.0 0.0 0.0 0.0Dominica (LAC) 31-Mar-1993 31-Mar-1993 0.0 - 0.0 0.0 0.0 0.0 0.0 0.0 0.0 0.0 0.0 0.0 0.0 0.0 0.0Dominican Republic (LAC) 18-May-1993 24-Dec-2001 4.2 - 38.3 - 95.7 0.3 66.0 37.4 30.8 18.7 0.0 0.0 0.0 0.0 29.0Ecuador (LAC) 30-Apr-1990 23-Feb-1993 112.2 5.3 199.6 125.9 2.8 1.7 0.0 0.6 0.6 0.3 0.2 0.2 0.1 4.3 0.5Egypt (AFR) 2-Aug-1988 13-Jan-1993 220.0 - 165.0 66.0 220.0 220.0 110.0 55.0 33.0 27.5 11.0 11.0 13.0 12.1 38.5El Salvador (LAC) 2-Oct-1992 8-Dec-2000 0.0 0.0 67.9 - - - 0.0 0.0 0.0 0.0 0.0 0.0 0.0 0.0 0.0Eritrea (AFR) 10-Mar-2005 5-Jul-2005 - - - - - - - - - - - - - - N.R.Ethiopia (AFR) 11-Oct-1994 1.7 - - - 0.0 0.0 0.0 0.0 0.0 0.0 4.4 43.3 0.0 0.0 0.0Fiji (ASIA) 23-Oct-1989 9-Dec-1994 0.2 0.0 0.0 0.0 0.0 0.1 0.0 0.0 0.0 0.0 0.0 0.0 0.0 0.0 0.0Gabon (AFR) 9-Feb-1994 4-Dec-2000 0.0 - - - - - 0.0 0.0 0.0 0.0 0.0 0.0 0.0 0.0 0.0Gambia (AFR) 25-Jul-1990 13-Mar-1995 0.0 0.0 0.0 0.0 0.0 0.0 0.0 0.0 0.0 0.0 0.0 0.0 0.0 0.0 0.0Georgia (EEUR) 21-Mar-1996 12-Jul-2000 0.0 - - 0.0 0.0 0.0 0.0 0.0 0.0 0.0 0.0 0.0 0.0 0.0 0.0Ghana (AFR) 24-Jul-1989 24-Jul-1992 0.0 2.2 0.6 3.2 1.2 0.0 0.0 0.4 0.3 0.4 0.0 0.0 0.4 0.0 0.4Grenada (LAC) 31-Mar-1993 7-Dec-1993 0.0 - 0.0 0.0 0.0 0.0 0.0 0.0 0.0 0.0 0.0 0.0 0.0 0.0 0.0Guatemala (LAC) 7-Nov-1989 21-Jan-2002 0.0 9.2 9.2 15.4 13.4 13.3 16.1 19.5 12.3 0.0 0.0 0.0 0.0 0.0 10.6Guinea (AFR) 25-Jun-1992 25-Jun-1992 0.0 0.0 0.0 0.0 0.0 0.0 0.0 0.0 0.0 0.0 0.0 0.0 0.0 0.0 0.0Guinea-Bissau (AFR) 12-Nov-2002 12-Nov-2002 0.0 0.0 0.0 0.0 0.0 0.0 0.0 0.0 0.0 0.0 0.0 0.0 0.0 0.0 0.0Guyana (LAC) 12-Aug-1993 23-Jul-1999 0.8 0.0 - - 0.3 0.0 0.0 0.0 0.0 0.0 0.0 0.0 0.0 0.0 0.0Haiti (LAC) 29-Mar-2000 29-Mar-2000 0.0 - - - - - - 0.0 0.0 0.0 0.0 0.0 0.0 0.0 0.0Honduras (LAC) 14-Oct-1993 24-Jan-2002 0.3 - - - 0.0 0.0 0.0 0.0 0.0 0.0 0.0 0.0 0.0 0.0 0.0India (ASIA) 19-Jun-1992 19-Jun-1992 4,757.5 5,097.4 10,599.6 8,790.1 3,111.9 8,775.8 7,876.0 6,270.1 16,098.6 12,147.3 9,318.1 10,461.0 10,856.2 7,459.1 11,505.4Indonesia (ASIA) 26-Jun-1992 26-Jun-1992 0.0 126.5 132.0 107.8 88.0 55.0 22.0 0.0 0.0 0.0 0.0 16.5 16.5 16.5 0.0Iran (Islamic Republic of) (ASIA) 3-Oct-1990 4-Aug-1997 0.0 49.5 44.0 22.0 22.0 27.5 132.0 121.0 55.0 55.0 55.0 2,169.2 2,169.2 2,169.2 77.0Jamaica (LAC) 31-Mar-1993 31-Mar-1993 0.0 - 0.0 0.0 0.0 0.0 0.0 8.5 0.0 0.0 0.0 0.0 0.0 N.R. 2.8Jordan (ASIA) 31-May-1989 12-Nov-1993 13.2 0.0 0.0 0.0 0.0 13.2 16.5 33.0 44.0 44.0 7.7 5.5 3.3 2.2 40.3Kenya (AFR) 9-Nov-1988 27-Sep-1994 5.5 66.0 66.0 44.0 40.7 24.8 71.5 69.3 66.0 62.4 59.7 0.6 0.0 0.3 65.9Kiribati (ASIA) 7-Jan-1993 9-Aug-2004 0.0 - 0.0 0.0 0.0 0.0 0.0 0.0 0.0 0.0 0.0 0.0 0.0 0.0 0.0Kuwait (ASIA) 23-Nov-1992 22-Jul-1994 23.1 - - 0.0 0.0 0.0 0.0 0.0 0.0 0.0 0.0 0.0 0.0 0.0 0.0Kyrgyzstan (ASIA) 31-May-2000 13-May-2003 0.0 0.0 0.0 0.0 - - 0.0 0.0 0.0 0.0 0.0 0.0 0.0 0.0 0.0Lao People's Democratic Republic (ASIA) 21-Aug-1998 - 0.0 - - - - 0.0 0.0 0.0 0.0 0.0 0.0 0.0 0.0 0.0Lebanon (ASIA) 31-Mar-1993 31-Mar-1993 0.1 - 0.1 0.0 0.0 0.0 0.0 0.0 0.0 0.1 0.6 0.0 0.0 0.0 0.0Lesotho (AFR) 25-Mar-1994 0.0 - - 0.0 0.0 0.0 0.0 0.0 0.0 0.0 0.0 0.0 0.0 0.0 0.0Liberia (AFR) 15-Jan-1996 15-Jan-1996 0.3 0.1 0.3 0.1 0.7 0.1 0.2 0.2 0.2 0.1 0.3 0.0 0.0 0.0 0.2Libyan Arab Jamahiriya (AFR) 11-Jul-1990 12-Jul-2001 0.0 0.0 0.0 0.0 - - 0.0 0.0 0.0 0.0 0.0 0.0 0.0 0.0 0.0Madagascar (AFR) 7-Nov-1996 16-Jan-2002 0.0 - - - 0.0 0.0 0.0 0.0 0.0 0.0 0.0 0.0 0.0 0.0 0.0Malawi (AFR) 9-Jan-1991 8-Feb-1994 0.0 0.0 0.0 3.3 0.0 0.0 0.0 0.0 0.0 0.0 0.0 0.0 0.0 0.0 0.0Malaysia (ASIA) 29-Aug-1989 16-Jun-1993 0.0 - 0.0 20.9 0.0 0.0 0.4 0.9 0.0 12.7 0.0 0.0 0.0 0.0 4.5Maldives (ASIA) 16-May-1989 31-Jul-1991 0.0 0.0 0.0 0.0 0.0 0.0 0.0 0.0 0.0 0.0 0.0 0.0 0.0 0.0 0.0Mali (AFR) 28-Oct-1994 28-Oct-1994 0.0 0.0 0.0 0.0 0.0 0.0 0.0 0.0 0.0 0.0 0.0 0.0 0.0 0.0 0.0Marshall Islands (ASIA) 11-Mar-1993 11-Mar-1993 0.0 - 0.0 0.0 0.0 0.0 0.0 0.0 0.0 0.0 0.0 0.0 0.2 0.0 0.0Mauritania (AFR) 26-May-1994 22-Jul-2005 0.0 - - 0.0 0.0 0.0 0.0 0.0 0.0 0.0 0.0 0.0 0.0 - 0.0Mauritius (AFR) 18-Aug-1992 20-Oct-1992 0.1 1.0 0.1 0.1 0.1 0.0 0.1 0.0 0.0 0.0 0.0 0.0 0.0 0.0 0.0Mexico (LAC) 31-Mar-1988 11-Oct-1991 18,409.6 602.8 525.8 0.0 0.0 0.0 0.0 0.0 0.0 0.0 0.0 0.8 0.0 0.0 0.0Micronesia (Federated States of) (ASIA) 6-Sep-1995 27-Nov-2001 0.0 - - - 0.0 0.0 0.0 0.0 0.0 0.0 0.0 0.0 0.0 0.0 0.0Mongolia (ASIA) 7-Mar-1996 7-Mar-1996 0.0 - - - 0.0 0.0 0.0 0.0 0.0 0.0 0.0 0.0 0.0 0.0 0.0Morocco (AFR) 28-Dec-1995 28-Dec-1995 5.5 0.0 0.0 1.1 - 0.0 1.1 1.1 1.1 1.1 0.2 0.2 0.1 0.0 1.1Mozambique (AFR) 9-Sep-1994 9-Sep-1994 0.1 - - 0.0 0.0 16.5 0.0 0.0 0.0 0.0 0.0 0.0 0.0 N.R. 0.0Myanmar (ASIA) 24-Nov-1993 24-Nov-1993 0.7 0.0 - 0.0 0.1 0.0 0.0 0.0 0.0 0.0 0.0 0.0 0.0 0.0 0.0Namibia (AFR) 20-Sep-1993 6-Nov-1997 0.0 - 0.0 0.0 0.0 0.0 0.0 0.0 0.0 0.0 0.0 0.0 0.0 0.0 0.0

Table 12: Data on Consumption of Carbon Tetrachloride (Annex B, Group II) ODP tonnes Table 12: Data on Consumption of Carbon Tetrachloride (Annex B, Group II) ODP tonnes
N.R. Not reported: is used where Parties are required to report but have not done so. AFR = Africa ASIA = Asia EEUR = Eastern Europe CEIT = Country with Economy in Transition – Hyphen: is used where Parties have not reported and are not required to report. LAC = Latin America and the Caribbean WEUR = Western Europe and Others EC = Member of the European Community NB: Figures are rounded to a uniform number of decimal places.
52 Production and Consumption of Ozone Depleting Substances: 1986 - 2004 Production and Consumption of Ozone Depleting Substances: 1986 – 2004 53
Ratification dates Article 5 Baseline Years
Article 5 Parties Montreal Protocol
London Amendment
Base Year 1989 1992 1993 1994 1995 1996 1997 1998 1999 2000 2001 2002 2003 2004
Baselevel
Nauru (ASIA) 12-Nov-2001 10-Sep-2004 0.0 - - - 0.0 0.0 0.0 0.0 0.0 0.0 0.0 0.0 0.0 N.R. 0.0Nepal (ASIA) 6-Jul-1994 6-Jul-1994 0.9 1.1 1.1 1.1 1.1 1.1 0.9 0.9 0.9 0.9 0.9 0.9 0.9 0.9 0.9Nicaragua (LAC) 5-Mar-1993 13-Dec-1999 0.0 0.0 0.0 0.0 0.0 0.0 0.0 0.0 0.0 0.0 0.0 0.0 0.0 0.0 0.0Niger (AFR) 9-Oct-1992 11-Jan-1996 0.0 - - 0.0 0.0 0.0 0.0 0.0 0.0 0.0 0.0 0.0 0.0 0.0 0.0Nigeria (AFR) 31-Oct-1988 27-Sep-2001 0.0 - 100.3 105.6 111.2 132.6 145.9 160.4 151.3 146.6 143.0 140.8 166.7 166.7 152.8Niue (ASIA) 22-Dec-2003 22-Dec-2003 0.0 - - - 0.0 0.0 0.0 0.0 0.0 0.0 - - 0.0 0.0 0.0Oman (ASIA) 30-Jun-1999 5-Aug-1999 0.1 - - - 0.1 0.1 0.1 0.1 0.1 0.1 0.6 0.0 0.1 0.0 0.1Pakistan (ASIA) 18-Dec-1992 18-Dec-1992 110.0 411.4 431.2 567.6 614.9 558.8 734.8 110.0 564.3 564.3 655.6 636.9 589.1 752.4 412.9Palau (ASIA) 29-May-2001 29-May-2001 0.0 - - - 0.0 0.0 0.0 0.0 0.0 0.0 0.0 0.0 0.0 0.0 0.0Panama (LAC) 3-Mar-1989 10-Feb-1994 0.0 0.0 0.0 0.0 0.0 0.0 0.0 0.0 0.0 0.0 0.0 0.0 0.0 0.0 0.0Papua New Guinea (ASIA) 27-Oct-1992 4-May-1993 0.0 - 0.0 0.0 0.0 0.0 0.0 0.0 0.0 0.0 0.0 0.0 0.0 0.0 0.0Paraguay (LAC) 3-Dec-1992 3-Dec-1992 0.0 0.0 0.0 0.0 0.8 0.8 0.5 0.0 0.9 0.9 1.0 2.0 2.4 1.2 0.6Peru (LAC) 31-Mar-1993 31-Mar-1993 52.8 40.9 14.7 44.9 47.8 1.3 1.2 1.3 1.0 0.6 0.7 0.0 0.0 0.0 1.0Philippines (ASIA) 17-Jul-1991 9-Aug-1993 220.0 133.3 44.3 134.0 110.9 66.5 0.0 0.0 0.0 0.0 0.0 0.0 0.0 0.0 0.0Qatar (ASIA) 22-Jan-1996 22-Jan-1996 0.2 - - - 0.0 0.0 9.1 0.0 0.0 0.0 0.0 0.0 0.0 0.0 0.0Republic of Korea (ASIA) 27-Feb-1992 10-Dec-1992 10,624.9 12,868.9 12,868.9 11,811.8 59.4 52.8 311.3 190.3 127.6 1,596.1 -555.5 710.6 -57.2 -1,274.9 638.0Republic of Moldova (EEUR) 24-Oct-1996 25-Jun-2001 0.0 - - - - 0.0 0.0 0.0 0.0 0.0 0.0 0.0 0.0 0.0 0.0Romania (EEUR) 27-Jan-1993 27-Jan-1993 2,264.5 - 734.8 3,872.4 -1,584.0 540.1 -198.6 1,949.2 -693.6 -149.8 16.2 -29.8 200.0 176.6 368.6Rwanda (AFR) 11-Oct-2001 7-Jan-2004 0.0 0.0 0.0 0.0 0.0 0.0 0.0 0.0 0.0 0.0 0.0 0.0 0.0 0.0 0.0Saint Kitts and Nevis (LAC) 10-Aug-1992 8-Jul-1998 0.0 0.0 0.0 0.0 0.0 0.0 0.0 0.0 0.0 0.0 0.0 0.0 0.0 0.0 0.0Saint Lucia (LAC) 28-Jul-1993 24-Aug-1999 0.0 - 0.0 0.0 0.0 0.1 0.0 0.0 0.0 0.0 0.0 0.0 0.0 0.0 0.0Saint Vincent and the Grenadines (LAC) 2-Dec-1996 2-Dec-1996 0.1 - - - 0.0 0.0 0.0 0.0 0.0 0.0 0.0 0.0 0.0 0.0 0.0Samoa (ASIA) 21-Dec-1992 4-Oct-2001 0.0 - - - 0.0 0.0 0.0 0.0 0.0 0.0 0.0 0.0 0.0 N.R. 0.0Sao Tome and Principe (AFR) 19-Nov-2001 19-Nov-2001 0.0 0.0 0.0 0.0 0.0 0.0 0.0 0.0 0.0 0.0 0.0 0.0 0.0 0.0 0.0Saudi Arabia (ASIA) 1-Mar-1993 1-Mar-1993 0.0 542.7 266.2 1,320.0 990.0 568.7 326.7 682.0 57.2 38.5 25.3 0.0 0.0 N.R. 259.2Senegal (AFR) 6-May-1993 6-May-1993 607.3 - 489.1 548.1 495.0 98.0 98.6 0.0 0.0 0.0 0.0 0.0 0.0 0.0 0.0Serbia and Montenegro (EEUR) 12-Mar-2001 22-Mar-2005 0.0 - - - - - - - - 33.0 33.0 0.0 0.0 0.0 N.R.Seychelles (AFR) 6-Jan-1993 6-Jan-1993 0.0 0.0 0.0 0.0 0.0 0.0 0.0 0.0 0.0 0.0 0.0 0.0 0.0 0.0 0.0Sierra Leone (AFR) 29-Aug-2001 29-Aug-2001 0.5 0.5 0.6 0.7 0.9 1.1 1.7 4.4 1.7 1.7 0.7 0.2 0.1 2.4 2.6Singapore (ASIA) 5-Jan-1989 2-Mar-1993 25.3 - 59.4 0.0 0.0 0.0 0.0 0.0 0.0 0.0 0.0 0.0 0.0 0.0 0.0Solomon Islands (ASIA) 17-Jun-1993 17-Aug-1999 0.0 0.0 0.0 0.0 0.0 0.0 0.0 0.0 0.0 0.0 0.0 0.0 0.0 0.0 0.0Somalia (AFR) 1-Aug-2001 1-Aug-2001 0.0 0.0 0.0 0.0 0.0 0.0 0.0 0.0 0.0 0.0 0.0 0.0 0.0 0.0 0.0South Africa (AFR) 15-Jan-1990 12-May-1992 8,919.5 82.5 134.2 53.9 0.0 0.0 0.0 0.0 0.0 0.0 0.0 0.0 0.0 0.0 0.0Sri Lanka (ASIA) 15-Dec-1989 16-Jun-1993 0.0 19.3 28.1 21.0 16.4 43.6 14.0 46.3 42.5 16.4 30.1 31.7 23.9 27.4 35.1Sudan (AFR) 29-Jan-1993 2-Jan-2002 4.4 - 1.7 2.2 2.8 2.2 4.3 2.2 2.2 2.2 2.2 2.2 1.1 0.7 2.2Suriname (LAC) 14-Oct-1997 0.0 - - - 0.0 0.0 0.0 0.0 0.0 0.0 0.0 0.0 0.0 0.0 0.0Swaziland (AFR) 10-Nov-1992 0.0 - 0.0 0.0 0.0 0.0 0.0 0.0 0.0 0.0 0.0 0.0 0.0 0.0 0.0Syrian Arab Republic (ASIA) 12-Dec-1989 30-Nov-1999 39.3 1.1 1.1 - 46.9 38.5 40.7 0.0 0.0 0.0 0.0 0.0 0.0 0.0 0.0Thailand (ASIA) 7-Jul-1989 25-Jun-1992 68.2 7.9 7.7 0.0 14.3 6.6 13.2 8.8 6.6 7.2 7.2 0.0 0.0 0.0 7.5The Former Yugoslav Republic of Macedonia (EEUR) 10-Mar-1994 9-Nov-1998 0.0 - - - 0.0 0.0 0.0 0.1 0.1 0.0 0.0 0.0 0.0 0.0 0.1
Togo (AFR) 25-Feb-1991 6-Jul-1998 0.0 - - - 0.0 0.0 0.0 0.0 0.0 0.0 0.0 0.0 0.0 0.0 0.0Tonga (ASIA) 29-Jul-1998 26-Nov-2003 0.0 - - - 0.0 0.0 0.0 0.0 0.0 0.0 0.0 0.0 0.0 0.0 0.0Trinidad and Tobago (LAC) 28-Aug-1989 10-Jun-1999 0.1 0.0 0.0 0.0 0.0 0.0 0.0 0.0 0.0 0.0 0.0 0.0 0.0 0.0 0.0Tunisia (AFR) 25-Sep-1989 15-Jul-1993 11.6 9.9 0.3 3.7 5.5 1.1 2.2 4.4 3.3 1.1 1.1 1.1 0.9 0.4 2.9Turkey (EEUR) 20-Sep-1991 13-Apr-1995 242.0 162.8 303.6 190.3 134.2 110.0 70.4 168.3 90.1 56.9 16.0 13.2 13.2 0.0 105.1Tuvalu (ASIA) 15-Jul-1993 31-Aug-2000 0.0 - 0.0 0.0 0.0 0.0 0.0 0.0 0.0 0.0 0.0 0.0 0.0 0.0 0.0Uganda (AFR) 15-Sep-1988 20-Jan-1994 0.2 - 0.3 0.0 0.0 0.0 0.4 0.4 0.4 0.4 0.4 0.4 0.3 0.0 0.4United Arab Emirates (ASIA) 22-Dec-1989 16-Feb-2005 0.0 0.0 0.0 0.0 0.0 0.0 0.0 0.0 0.0 0.0 0.0 0.0 0.0 0.0 0.0United Republic of Tanzania (AFR) 16-Apr-1993 16-Apr-1993 1.0 - 1.0 1.0 1.0 1.1 37.1 0.3 0.0 0.0 0.0 0.0 0.0 0.0 0.1Uruguay (LAC) 8-Jan-1991 16-Nov-1993 27.5 5.8 0.1 5.5 9.2 0.4 0.4 0.3 0.2 0.6 0.3 0.4 0.3 0.3 0.4Vanuatu (ASIA) 21-Nov-1994 21-Nov-1994 0.0 - - - 0.0 0.0 0.0 0.0 0.0 0.0 0.0 0.0 0.0 0.0 0.0Venezuela (Bolivarian Republic of) (LAC) 6-Feb-1989 29-Jul-1993 62.0 79.0 15.1 22.0 1,707.8 1.1 9.2 0.0 3,321.5 0.0 0.0 0.0 0.0 0.0 1,107.2Viet Nam (ASIA) 26-Jan-1994 26-Jan-1994 0.2 - - 0.4 0.6 0.6 1.3 1.5 1.7 1.7 0.0 0.2 0.0 0.0 1.6Yemen (ASIA) 21-Feb-1996 23-Apr-2001 0.0 - - - 0.0 0.0 0.0 0.0 0.0 0.0 8.3 0.0 0.0 0.0 0.0Zambia (AFR) 24-Jan-1990 15-Apr-1994 0.0 1.5 3.5 0.6 0.1 0.5 1.4 0.5 1.1 0.4 0.2 0.0 0.0 0.0 0.7Zimbabwe (AFR) 3-Nov-1992 3-Jun-1994 0.0 - 0.0 0.0 0.0 0.0 33.6 33.6 0.0 1.1 17.6 10.3 9.1 2.6 11.6Subtotal (Article 5 - Annex B, Group II) 96,517.6 72,851.7 83,338.7 28,594.3 10,770.2 11,922.0 5,264.4 97,042.0 22,251.5 98,910.2 27,532.9 19,243.9 35,993.1 15,879.1 72,724.0
TOTAL (Annex B, Group II) 349,561.2 93,158.5 128,014.5 34,673.1 -10,832.2 12,427.7 -26,482.7 68,126.7 9,177.2 75,937.5 17,492.5 4,921.8 36,255.5 14,995.6 325,767.6
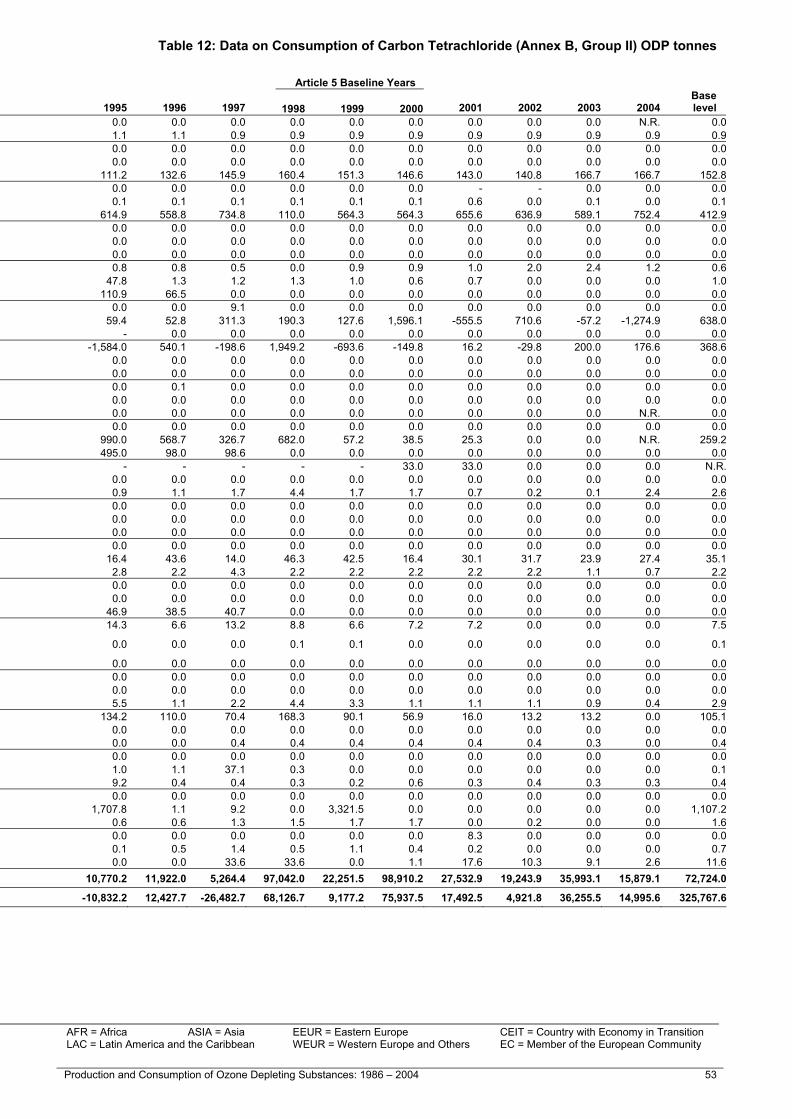
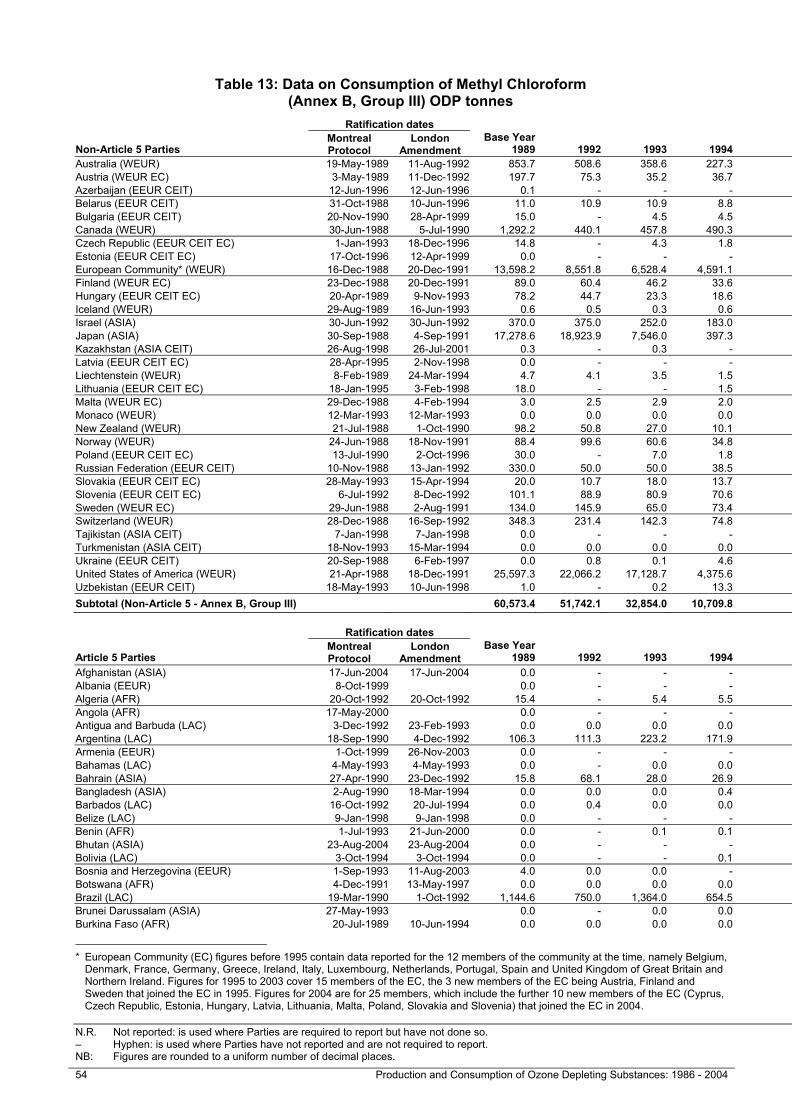
Table 13: Data on Consumption of Methyl Chloroform (Annex B, Group III) ODP tonnes
N.R. Not reported: is used where Parties are required to report but have not done so. AFR = Africa ASIA = Asia EEUR = Eastern Europe CEIT = Country with Economy in Transition – Hyphen: is used where Parties have not reported and are not required to report. LAC = Latin America and the Caribbean WEUR = Western Europe and Others EC = Member of the European Community NB: Figures are rounded to a uniform number of decimal places.
54 Production and Consumption of Ozone Depleting Substances: 1986 - 2004 Production and Consumption of Ozone Depleting Substances: 1986 – 2004 55
Table 13: Data on Consumption of Methyl Chloroform (Annex B, Group III) ODP tonnes
Ratification dates
Non-Article 5 Parties Montreal Protocol
London Amendment
Base Year 1989 1992 1993 1994 1995 1996 1997 1998 1999 2000 2001 2002 2003 2004
Baselevel
Australia (WEUR) 19-May-1989 11-Aug-1992 853.7 508.6 358.6 227.3 84.6 0.0 0.0 0.0 0.0 0.0 0.0 0.0 0.0 0.0 853.7Austria (WEUR EC) 3-May-1989 11-Dec-1992 197.7 75.3 35.2 36.7 197.7Azerbaijan (EEUR CEIT) 12-Jun-1996 12-Jun-1996 0.1 - - - - 0.1 0.0 0.0 0.0 0.0 0.0 0.0 0.0 0.0 0.1Belarus (EEUR CEIT) 31-Oct-1988 10-Jun-1996 11.0 10.9 10.9 8.8 0.4 6.1 2.6 1.0 0.0 0.0 0.0 0.0 0.0 0.0 11.0Bulgaria (EEUR CEIT) 20-Nov-1990 28-Apr-1999 15.0 - 4.5 4.5 4.5 0.1 0.0 0.0 0.0 0.0 0.0 0.0 0.0 0.0 15.0Canada (WEUR) 30-Jun-1988 5-Jul-1990 1,292.2 440.1 457.8 490.3 183.2 0.0 0.0 0.0 0.0 0.0 0.0 -0.1 0.0 0.0 1,292.2Czech Republic (EEUR CEIT EC) 1-Jan-1993 18-Dec-1996 14.8 - 4.3 1.8 3.5 0.0 0.0 0.0 0.0 -0.1 0.0 0.0 0.0 14.8Estonia (EEUR CEIT EC) 17-Oct-1996 12-Apr-1999 0.0 - - - 0.0 0.1 0.0 0.0 0.0 0.0 0.0 0.0 0.0 0.0European Community* (WEUR) 16-Dec-1988 20-Dec-1991 13,598.2 8,551.8 6,528.4 4,591.1 4,303.8 0.2 7.7 1.5 1.3 0.0 0.2 -39.3 0.0 0.2 13,598.2Finland (WEUR EC) 23-Dec-1988 20-Dec-1991 89.0 60.4 46.2 33.6 89.0Hungary (EEUR CEIT EC) 20-Apr-1989 9-Nov-1993 78.2 44.7 23.3 18.6 9.0 0.0 0.0 0.0 0.0 0.0 0.0 0.0 0.0 78.2Iceland (WEUR) 29-Aug-1989 16-Jun-1993 0.6 0.5 0.3 0.6 0.0 0.0 0.0 0.0 0.0 0.0 0.0 0.0 0.0 0.0 0.6Israel (ASIA) 30-Jun-1992 30-Jun-1992 370.0 375.0 252.0 183.0 178.5 121.0 0.0 0.0 0.0 0.0 0.0 0.0 0.0 0.0 370.0Japan (ASIA) 30-Sep-1988 4-Sep-1991 17,278.6 18,923.9 7,546.0 397.3 3,453.3 -48.1 -30.8 -51.9 -37.8 -22.5 -18.2 -2,029.1 -31.8 -541.8 17,278.6Kazakhstan (ASIA CEIT) 26-Aug-1998 26-Jul-2001 0.3 - 0.3 - - 0.3 0.4 0.1 0.0 0.0 0.0 0.0 0.0 0.0 0.3Latvia (EEUR CEIT EC) 28-Apr-1995 2-Nov-1998 0.0 - - - 0.0 0.0 0.0 0.0 0.0 0.0 0.0 0.0 0.0 0.0Liechtenstein (WEUR) 8-Feb-1989 24-Mar-1994 4.7 4.1 3.5 1.5 0.1 0.0 0.0 0.0 0.0 0.0 0.0 0.0 0.0 N.R. 4.7Lithuania (EEUR CEIT EC) 18-Jan-1995 3-Feb-1998 18.0 - - 1.5 0.5 0.5 0.0 0.0 0.0 0.0 0.0 0.0 0.0 18.0Malta (WEUR EC) 29-Dec-1988 4-Feb-1994 3.0 2.5 2.9 2.0 2.1 0.2 0.0 0.0 0.0 0.0 0.0 0.0 0.0 3.0Monaco (WEUR) 12-Mar-1993 12-Mar-1993 0.0 0.0 0.0 0.0 0.0 0.0 0.0 0.0 0.0 0.0 0.0 0.0 0.0 0.0 0.0New Zealand (WEUR) 21-Jul-1988 1-Oct-1990 98.2 50.8 27.0 10.1 16.8 0.0 0.0 0.0 0.0 0.0 0.0 0.0 0.0 0.0 98.2Norway (WEUR) 24-Jun-1988 18-Nov-1991 88.4 99.6 60.6 34.8 30.8 0.0 0.0 0.0 0.0 0.0 0.0 0.0 0.0 0.0 88.4Poland (EEUR CEIT EC) 13-Jul-1990 2-Oct-1996 30.0 - 7.0 1.8 - 2.4 0.0 0.0 0.0 0.0 0.0 0.0 0.0 30.0Russian Federation (EEUR CEIT) 10-Nov-1988 13-Jan-1992 330.0 50.0 50.0 38.5 26.7 -0.8 0.0 0.0 0.0 0.0 0.0 0.0 0.0 N.R. 330.0Slovakia (EEUR CEIT EC) 28-May-1993 15-Apr-1994 20.0 10.7 18.0 13.7 6.9 0.0 0.0 0.0 0.0 0.0 0.0 0.0 0.0 20.0Slovenia (EEUR CEIT EC) 6-Jul-1992 8-Dec-1992 101.1 88.9 80.9 70.6 48.6 0.0 0.0 0.0 0.0 0.0 0.0 0.0 0.0 101.1Sweden (WEUR EC) 29-Jun-1988 2-Aug-1991 134.0 145.9 65.0 73.4 134.0Switzerland (WEUR) 28-Dec-1988 16-Sep-1992 348.3 231.4 142.3 74.8 25.0 -0.4 0.1 0.2 0.1 0.1 0.1 0.0 0.1 0.1 348.3Tajikistan (ASIA CEIT) 7-Jan-1998 7-Jan-1998 0.0 - - - 0.0 0.0 0.0 0.0 0.0 0.0 0.0 0.0 0.0 0.0 0.0Turkmenistan (ASIA CEIT) 18-Nov-1993 15-Mar-1994 0.0 0.0 0.0 0.0 0.0 0.0 0.0 0.0 0.0 0.0 0.0 0.0 0.0 0.0 0.0Ukraine (EEUR CEIT) 20-Sep-1988 6-Feb-1997 0.0 0.8 0.1 4.6 5.8 4.7 0.2 0.0 0.2 0.0 0.0 0.0 0.0 0.0 0.0United States of America (WEUR) 21-Apr-1988 18-Dec-1991 25,597.3 22,066.2 17,128.7 4,375.6 4,448.8 0.5 275.5 -4.4 241.2 288.5 5.9 2.4 1.9 11.1 25,597.3Uzbekistan (EEUR CEIT) 18-May-1993 10-Jun-1998 1.0 - 0.2 13.3 0.0 0.4 0.0 0.0 0.0 0.0 0.0 0.0 0.0 0.0 1.0Subtotal (Non-Article 5 - Annex B, Group III) 60,573.4 51,742.1 32,854.0 10,709.8 12,832.9 87.3 255.7 -53.5 205.0 266.0 -12.0 -2,066.1 -29.8 -530.4 60,573.4
Ratification dates Article 5 Baseline Years
Article 5 Parties Montreal Protocol
London Amendment
Base Year 1989 1992 1993 1994 1995 1996 1997 1998 1999 2000 2001 2002 2003 2004
Baselevel
Afghanistan (ASIA) 17-Jun-2004 17-Jun-2004 0.0 - - - - - - 0.0 0.0 0.0 - - - 0.0 0.0Albania (EEUR) 8-Oct-1999 0.0 - - - 0.0 0.0 0.2 0.0 0.0 0.1 0.1 0.6 0.1 0.0 0.0Algeria (AFR) 20-Oct-1992 20-Oct-1992 15.4 - 5.4 5.5 5.8 5.8 5.8 5.8 5.8 5.8 5.0 5.0 5.0 4.0 5.8Angola (AFR) 17-May-2000 0.0 - - - - - - 0.0 - 0.0 0.0 0.0 0.0 0.0 -Antigua and Barbuda (LAC) 3-Dec-1992 23-Feb-1993 0.0 0.0 0.0 0.0 0.0 0.0 0.0 0.0 0.0 0.0 0.0 0.0 0.0 0.0 0.0Argentina (LAC) 18-Sep-1990 4-Dec-1992 106.3 111.3 223.2 171.9 99.1 105.7 90.5 90.2 52.7 54.3 30.9 12.8 20.9 24.0 65.7Armenia (EEUR) 1-Oct-1999 26-Nov-2003 0.0 - - - 0.0 0.0 0.0 0.0 0.0 0.0 0.0 0.0 0.0 0.0 0.0Bahamas (LAC) 4-May-1993 4-May-1993 0.0 - 0.0 0.0 0.0 0.0 0.0 0.0 0.0 0.0 0.5 0.0 0.0 0.0 0.0Bahrain (ASIA) 27-Apr-1990 23-Dec-1992 15.8 68.1 28.0 26.9 27.7 37.6 53.2 36.0 22.0 10.0 2.5 1.5 0.7 0.6 22.7Bangladesh (ASIA) 2-Aug-1990 18-Mar-1994 0.0 0.0 0.0 0.4 0.2 0.0 0.7 1.0 1.0 0.6 1.5 1.0 0.9 0.6 0.9Barbados (LAC) 16-Oct-1992 20-Jul-1994 0.0 0.4 0.0 0.0 0.0 0.0 0.0 0.0 0.0 0.0 0.0 0.0 0.0 0.0 0.0Belize (LAC) 9-Jan-1998 9-Jan-1998 0.0 - - - 0.0 0.0 0.0 0.0 0.0 0.0 0.0 0.0 0.0 0.0 0.0Benin (AFR) 1-Jul-1993 21-Jun-2000 0.0 - 0.1 0.1 0.0 0.0 0.0 0.0 0.0 0.0 0.0 0.0 0.0 0.0 0.0Bhutan (ASIA) 23-Aug-2004 23-Aug-2004 0.0 - - - 0.0 0.0 0.0 0.0 0.0 0.0 - - - 0.0 0.0Bolivia (LAC) 3-Oct-1994 3-Oct-1994 0.0 - - 0.1 0.0 0.0 0.0 0.0 0.0 0.0 0.0 0.0 0.0 0.0 0.0Bosnia and Herzegovina (EEUR) 1-Sep-1993 11-Aug-2003 4.0 0.0 0.0 - 0.0 0.7 0.0 1.0 1.7 2.0 3.7 3.6 3.6 2.4 1.5Botswana (AFR) 4-Dec-1991 13-May-1997 0.0 0.0 0.0 0.0 0.0 0.0 0.0 0.0 0.0 0.0 0.0 0.0 0.0 0.0 0.0Brazil (LAC) 19-Mar-1990 1-Oct-1992 1,144.6 750.0 1,364.0 654.5 297.0 123.2 4.4 0.0 97.2 0.0 0.0 0.0 0.0 0.0 32.4Brunei Darussalam (ASIA) 27-May-1993 0.0 - 0.0 0.0 0.3 0.0 0.0 0.0 0.0 0.0 0.0 0.0 0.0 - 0.0Burkina Faso (AFR) 20-Jul-1989 10-Jun-1994 0.0 0.0 0.0 0.0 0.0 0.0 0.0 0.0 0.0 0.0 0.0 0.0 0.0 0.0 0.0
* European Community (EC) figures before 1995 contain data reported for the 12 members of the community at the time, namely Belgium,
Denmark, France, Germany, Greece, Ireland, Italy, Luxembourg, Netherlands, Portugal, Spain and United Kingdom of Great Britain and Northern Ireland. Figures for 1995 to 2003 cover 15 members of the EC, the 3 new members of the EC being Austria, Finland and Sweden that joined the EC in 1995. Figures for 2004 are for 25 members, which include the further 10 new members of the EC (Cyprus, Czech Republic, Estonia, Hungary, Latvia, Lithuania, Malta, Poland, Slovakia and Slovenia) that joined the EC in 2004.
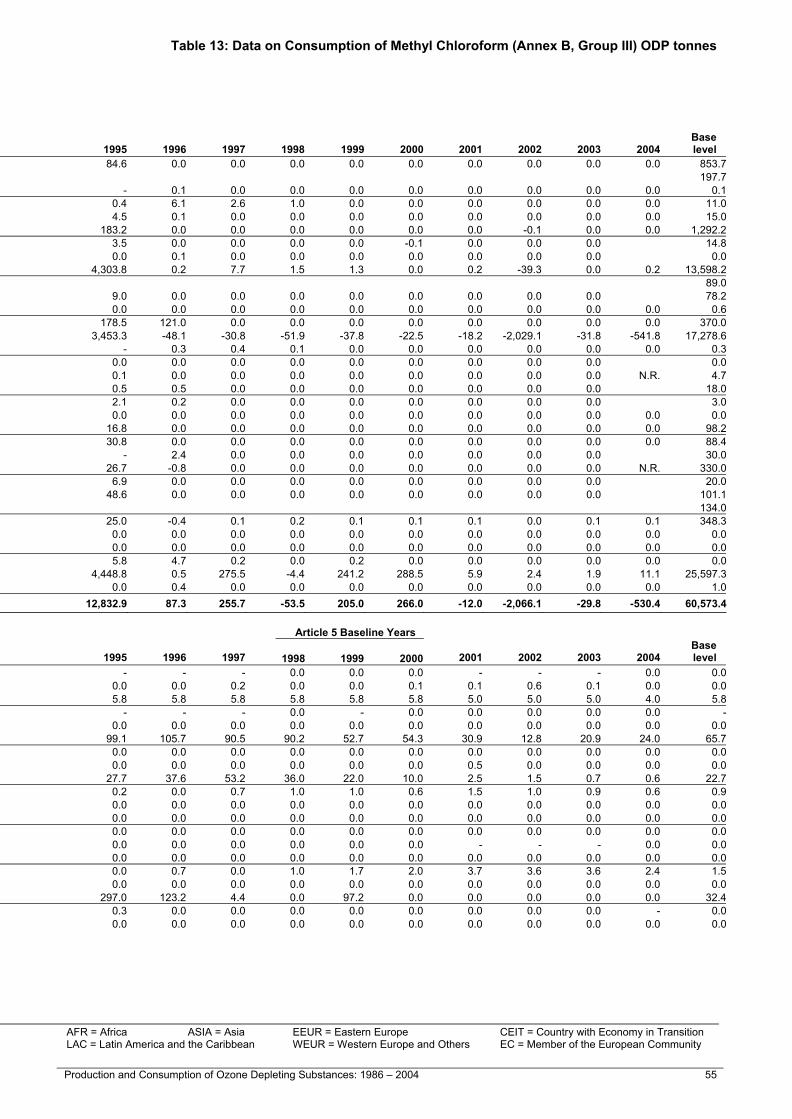
Table 13: Data on Consumption of Methyl Chloroform (Annex B, Group III) ODP tonnes
N.R. Not reported: is used where Parties are required to report but have not done so. AFR = Africa ASIA = Asia EEUR = Eastern Europe CEIT = Country with Economy in Transition – Hyphen: is used where Parties have not reported and are not required to report. LAC = Latin America and the Caribbean WEUR = Western Europe and Others EC = Member of the European Community NB: Figures are rounded to a uniform number of decimal places.
54 Production and Consumption of Ozone Depleting Substances: 1986 - 2004 Production and Consumption of Ozone Depleting Substances: 1986 – 2004 55
Table 13: Data on Consumption of Methyl Chloroform (Annex B, Group III) ODP tonnes
Ratification dates
Non-Article 5 Parties Montreal Protocol
London Amendment
Base Year 1989 1992 1993 1994 1995 1996 1997 1998 1999 2000 2001 2002 2003 2004
Baselevel
Australia (WEUR) 19-May-1989 11-Aug-1992 853.7 508.6 358.6 227.3 84.6 0.0 0.0 0.0 0.0 0.0 0.0 0.0 0.0 0.0 853.7Austria (WEUR EC) 3-May-1989 11-Dec-1992 197.7 75.3 35.2 36.7 197.7Azerbaijan (EEUR CEIT) 12-Jun-1996 12-Jun-1996 0.1 - - - - 0.1 0.0 0.0 0.0 0.0 0.0 0.0 0.0 0.0 0.1Belarus (EEUR CEIT) 31-Oct-1988 10-Jun-1996 11.0 10.9 10.9 8.8 0.4 6.1 2.6 1.0 0.0 0.0 0.0 0.0 0.0 0.0 11.0Bulgaria (EEUR CEIT) 20-Nov-1990 28-Apr-1999 15.0 - 4.5 4.5 4.5 0.1 0.0 0.0 0.0 0.0 0.0 0.0 0.0 0.0 15.0Canada (WEUR) 30-Jun-1988 5-Jul-1990 1,292.2 440.1 457.8 490.3 183.2 0.0 0.0 0.0 0.0 0.0 0.0 -0.1 0.0 0.0 1,292.2Czech Republic (EEUR CEIT EC) 1-Jan-1993 18-Dec-1996 14.8 - 4.3 1.8 3.5 0.0 0.0 0.0 0.0 -0.1 0.0 0.0 0.0 14.8Estonia (EEUR CEIT EC) 17-Oct-1996 12-Apr-1999 0.0 - - - 0.0 0.1 0.0 0.0 0.0 0.0 0.0 0.0 0.0 0.0European Community* (WEUR) 16-Dec-1988 20-Dec-1991 13,598.2 8,551.8 6,528.4 4,591.1 4,303.8 0.2 7.7 1.5 1.3 0.0 0.2 -39.3 0.0 0.2 13,598.2Finland (WEUR EC) 23-Dec-1988 20-Dec-1991 89.0 60.4 46.2 33.6 89.0Hungary (EEUR CEIT EC) 20-Apr-1989 9-Nov-1993 78.2 44.7 23.3 18.6 9.0 0.0 0.0 0.0 0.0 0.0 0.0 0.0 0.0 78.2Iceland (WEUR) 29-Aug-1989 16-Jun-1993 0.6 0.5 0.3 0.6 0.0 0.0 0.0 0.0 0.0 0.0 0.0 0.0 0.0 0.0 0.6Israel (ASIA) 30-Jun-1992 30-Jun-1992 370.0 375.0 252.0 183.0 178.5 121.0 0.0 0.0 0.0 0.0 0.0 0.0 0.0 0.0 370.0Japan (ASIA) 30-Sep-1988 4-Sep-1991 17,278.6 18,923.9 7,546.0 397.3 3,453.3 -48.1 -30.8 -51.9 -37.8 -22.5 -18.2 -2,029.1 -31.8 -541.8 17,278.6Kazakhstan (ASIA CEIT) 26-Aug-1998 26-Jul-2001 0.3 - 0.3 - - 0.3 0.4 0.1 0.0 0.0 0.0 0.0 0.0 0.0 0.3Latvia (EEUR CEIT EC) 28-Apr-1995 2-Nov-1998 0.0 - - - 0.0 0.0 0.0 0.0 0.0 0.0 0.0 0.0 0.0 0.0Liechtenstein (WEUR) 8-Feb-1989 24-Mar-1994 4.7 4.1 3.5 1.5 0.1 0.0 0.0 0.0 0.0 0.0 0.0 0.0 0.0 N.R. 4.7Lithuania (EEUR CEIT EC) 18-Jan-1995 3-Feb-1998 18.0 - - 1.5 0.5 0.5 0.0 0.0 0.0 0.0 0.0 0.0 0.0 18.0Malta (WEUR EC) 29-Dec-1988 4-Feb-1994 3.0 2.5 2.9 2.0 2.1 0.2 0.0 0.0 0.0 0.0 0.0 0.0 0.0 3.0Monaco (WEUR) 12-Mar-1993 12-Mar-1993 0.0 0.0 0.0 0.0 0.0 0.0 0.0 0.0 0.0 0.0 0.0 0.0 0.0 0.0 0.0New Zealand (WEUR) 21-Jul-1988 1-Oct-1990 98.2 50.8 27.0 10.1 16.8 0.0 0.0 0.0 0.0 0.0 0.0 0.0 0.0 0.0 98.2Norway (WEUR) 24-Jun-1988 18-Nov-1991 88.4 99.6 60.6 34.8 30.8 0.0 0.0 0.0 0.0 0.0 0.0 0.0 0.0 0.0 88.4Poland (EEUR CEIT EC) 13-Jul-1990 2-Oct-1996 30.0 - 7.0 1.8 - 2.4 0.0 0.0 0.0 0.0 0.0 0.0 0.0 30.0Russian Federation (EEUR CEIT) 10-Nov-1988 13-Jan-1992 330.0 50.0 50.0 38.5 26.7 -0.8 0.0 0.0 0.0 0.0 0.0 0.0 0.0 N.R. 330.0Slovakia (EEUR CEIT EC) 28-May-1993 15-Apr-1994 20.0 10.7 18.0 13.7 6.9 0.0 0.0 0.0 0.0 0.0 0.0 0.0 0.0 20.0Slovenia (EEUR CEIT EC) 6-Jul-1992 8-Dec-1992 101.1 88.9 80.9 70.6 48.6 0.0 0.0 0.0 0.0 0.0 0.0 0.0 0.0 101.1Sweden (WEUR EC) 29-Jun-1988 2-Aug-1991 134.0 145.9 65.0 73.4 134.0Switzerland (WEUR) 28-Dec-1988 16-Sep-1992 348.3 231.4 142.3 74.8 25.0 -0.4 0.1 0.2 0.1 0.1 0.1 0.0 0.1 0.1 348.3Tajikistan (ASIA CEIT) 7-Jan-1998 7-Jan-1998 0.0 - - - 0.0 0.0 0.0 0.0 0.0 0.0 0.0 0.0 0.0 0.0 0.0Turkmenistan (ASIA CEIT) 18-Nov-1993 15-Mar-1994 0.0 0.0 0.0 0.0 0.0 0.0 0.0 0.0 0.0 0.0 0.0 0.0 0.0 0.0 0.0Ukraine (EEUR CEIT) 20-Sep-1988 6-Feb-1997 0.0 0.8 0.1 4.6 5.8 4.7 0.2 0.0 0.2 0.0 0.0 0.0 0.0 0.0 0.0United States of America (WEUR) 21-Apr-1988 18-Dec-1991 25,597.3 22,066.2 17,128.7 4,375.6 4,448.8 0.5 275.5 -4.4 241.2 288.5 5.9 2.4 1.9 11.1 25,597.3Uzbekistan (EEUR CEIT) 18-May-1993 10-Jun-1998 1.0 - 0.2 13.3 0.0 0.4 0.0 0.0 0.0 0.0 0.0 0.0 0.0 0.0 1.0Subtotal (Non-Article 5 - Annex B, Group III) 60,573.4 51,742.1 32,854.0 10,709.8 12,832.9 87.3 255.7 -53.5 205.0 266.0 -12.0 -2,066.1 -29.8 -530.4 60,573.4
Ratification dates Article 5 Baseline Years
Article 5 Parties Montreal Protocol
London Amendment
Base Year 1989 1992 1993 1994 1995 1996 1997 1998 1999 2000 2001 2002 2003 2004
Baselevel
Afghanistan (ASIA) 17-Jun-2004 17-Jun-2004 0.0 - - - - - - 0.0 0.0 0.0 - - - 0.0 0.0Albania (EEUR) 8-Oct-1999 0.0 - - - 0.0 0.0 0.2 0.0 0.0 0.1 0.1 0.6 0.1 0.0 0.0Algeria (AFR) 20-Oct-1992 20-Oct-1992 15.4 - 5.4 5.5 5.8 5.8 5.8 5.8 5.8 5.8 5.0 5.0 5.0 4.0 5.8Angola (AFR) 17-May-2000 0.0 - - - - - - 0.0 - 0.0 0.0 0.0 0.0 0.0 -Antigua and Barbuda (LAC) 3-Dec-1992 23-Feb-1993 0.0 0.0 0.0 0.0 0.0 0.0 0.0 0.0 0.0 0.0 0.0 0.0 0.0 0.0 0.0Argentina (LAC) 18-Sep-1990 4-Dec-1992 106.3 111.3 223.2 171.9 99.1 105.7 90.5 90.2 52.7 54.3 30.9 12.8 20.9 24.0 65.7Armenia (EEUR) 1-Oct-1999 26-Nov-2003 0.0 - - - 0.0 0.0 0.0 0.0 0.0 0.0 0.0 0.0 0.0 0.0 0.0Bahamas (LAC) 4-May-1993 4-May-1993 0.0 - 0.0 0.0 0.0 0.0 0.0 0.0 0.0 0.0 0.5 0.0 0.0 0.0 0.0Bahrain (ASIA) 27-Apr-1990 23-Dec-1992 15.8 68.1 28.0 26.9 27.7 37.6 53.2 36.0 22.0 10.0 2.5 1.5 0.7 0.6 22.7Bangladesh (ASIA) 2-Aug-1990 18-Mar-1994 0.0 0.0 0.0 0.4 0.2 0.0 0.7 1.0 1.0 0.6 1.5 1.0 0.9 0.6 0.9Barbados (LAC) 16-Oct-1992 20-Jul-1994 0.0 0.4 0.0 0.0 0.0 0.0 0.0 0.0 0.0 0.0 0.0 0.0 0.0 0.0 0.0Belize (LAC) 9-Jan-1998 9-Jan-1998 0.0 - - - 0.0 0.0 0.0 0.0 0.0 0.0 0.0 0.0 0.0 0.0 0.0Benin (AFR) 1-Jul-1993 21-Jun-2000 0.0 - 0.1 0.1 0.0 0.0 0.0 0.0 0.0 0.0 0.0 0.0 0.0 0.0 0.0Bhutan (ASIA) 23-Aug-2004 23-Aug-2004 0.0 - - - 0.0 0.0 0.0 0.0 0.0 0.0 - - - 0.0 0.0Bolivia (LAC) 3-Oct-1994 3-Oct-1994 0.0 - - 0.1 0.0 0.0 0.0 0.0 0.0 0.0 0.0 0.0 0.0 0.0 0.0Bosnia and Herzegovina (EEUR) 1-Sep-1993 11-Aug-2003 4.0 0.0 0.0 - 0.0 0.7 0.0 1.0 1.7 2.0 3.7 3.6 3.6 2.4 1.5Botswana (AFR) 4-Dec-1991 13-May-1997 0.0 0.0 0.0 0.0 0.0 0.0 0.0 0.0 0.0 0.0 0.0 0.0 0.0 0.0 0.0Brazil (LAC) 19-Mar-1990 1-Oct-1992 1,144.6 750.0 1,364.0 654.5 297.0 123.2 4.4 0.0 97.2 0.0 0.0 0.0 0.0 0.0 32.4Brunei Darussalam (ASIA) 27-May-1993 0.0 - 0.0 0.0 0.3 0.0 0.0 0.0 0.0 0.0 0.0 0.0 0.0 - 0.0Burkina Faso (AFR) 20-Jul-1989 10-Jun-1994 0.0 0.0 0.0 0.0 0.0 0.0 0.0 0.0 0.0 0.0 0.0 0.0 0.0 0.0 0.0
* European Community (EC) figures before 1995 contain data reported for the 12 members of the community at the time, namely Belgium,
Denmark, France, Germany, Greece, Ireland, Italy, Luxembourg, Netherlands, Portugal, Spain and United Kingdom of Great Britain and Northern Ireland. Figures for 1995 to 2003 cover 15 members of the EC, the 3 new members of the EC being Austria, Finland and Sweden that joined the EC in 1995. Figures for 2004 are for 25 members, which include the further 10 new members of the EC (Cyprus, Czech Republic, Estonia, Hungary, Latvia, Lithuania, Malta, Poland, Slovakia and Slovenia) that joined the EC in 2004.

Table 13: Data on Consumption of Methyl Chloroform (Annex B, Group III) ODP tonnes Table 13: Data on Consumption of Methyl Chloroform (Annex B, Group III) ODP tonnes
N.R. Not reported: is used where Parties are required to report but have not done so. AFR = Africa ASIA = Asia EEUR = Eastern Europe CEIT = Country with Economy in Transition – Hyphen: is used where Parties have not reported and are not required to report. LAC = Latin America and the Caribbean WEUR = Western Europe and Others EC = Member of the European Community NB: Figures are rounded to a uniform number of decimal places.
56 Production and Consumption of Ozone Depleting Substances: 1986 - 2004 Production and Consumption of Ozone Depleting Substances: 1986 – 2004 57
Ratification dates Article 5 Baseline Years
Article 5 Parties Montreal Protocol
London Amendment
Base Year 1989 1992 1993 1994 1995 1996 1997 1998 1999 2000 2001 2002 2003 2004
Baselevel
Burundi (AFR) 6-Jan-1997 18-Oct-2001 0.0 0.0 - - 0.0 0.0 0.1 0.0 0.1 0.1 0.1 0.1 0.0 0.0 0.1Cambodia (ASIA) 27-Jun-2001 0.5 - - - 0.5 0.5 0.5 0.5 0.5 0.5 0.5 0.5 0.4 0.0 0.5Cameroon (AFR) 30-Aug-1989 8-Jun-1992 22.5 20.5 15.4 15.4 24.4 17.1 12.0 12.0 6.3 6.3 6.2 0.0 0.0 0.0 8.2Cape Verde (AFR) 31-Jul-2001 31-Jul-2001 0.0 0.0 0.0 0.0 0.0 0.0 0.0 0.0 0.0 0.0 0.0 0.0 0.0 0.0 0.0Central African Republic (AFR) 29-Mar-1993 0.0 - 0.0 0.0 0.0 0.0 0.0 0.0 0.0 0.0 0.0 0.0 0.0 - 0.0Chad (AFR) 7-Jun-1994 30-May-2001 0.0 0.0 0.0 0.0 0.0 0.0 0.0 0.0 0.0 0.0 0.0 0.0 0.0 N.R. 0.0Chile (LAC) 26-Mar-1990 9-Apr-1992 21.7 34.5 43.6 46.7 9.8 10.6 2.3 7.1 8.7 3.5 5.2 3.5 7.0 3.7 6.4China (ASIA) 14-Jun-1991 14-Jun-1991 816.6 120.2 503.7 518.7 291.5 544.5 671.7 759.0 647.1 757.6 465.4 380.8 336.8 370.2 721.2Colombia (LAC) 6-Dec-1993 6-Dec-1993 30.0 17.0 - 20.0 10.0 8.0 5.0 1.9 0.0 0.0 0.0 0.0 0.0 0.0 0.6Comoros (AFR) 31-Oct-1994 31-Oct-1994 0.0 - - - 0.0 0.0 0.0 0.0 0.0 0.0 0.0 0.0 0.0 0.0 0.0Congo (AFR) 16-Nov-1994 16-Nov-1994 0.0 - - 0.0 1.7 0.0 0.0 0.0 0.0 0.0 0.0 0.0 0.0 0.0 0.0Cook Islands (ASIA) 22-Dec-2003 22-Dec-2003 0.0 - - - 0.0 0.0 0.0 0.0 0.0 0.0 - - 0.0 N.R. 0.0Costa Rica (LAC) 30-Jul-1991 11-Nov-1998 4.5 0.0 - 0.1 0.0 0.0 0.0 0.0 0.0 0.0 0.0 0.0 0.0 0.0 0.0Côte d'Ivoire (AFR) 5-Apr-1993 18-May-1994 0.0 - 0.0 0.0 0.0 0.0 0.0 0.0 0.0 0.0 0.0 0.0 0.0 0.0 0.0Croatia (EEUR) 21-Sep-1992 15-Oct-1993 84.9 48.0 36.0 28.6 26.0 10.0 4.2 0.0 0.0 0.0 0.0 0.0 0.0 0.0 0.0Cuba (LAC) 14-Jul-1992 19-Oct-1998 0.0 - - - 0.1 0.0 0.0 0.0 0.0 0.0 0.0 0.0 0.0 0.0 0.0Cyprus (ASIA EC) 28-May-1992 11-Oct-1994 0.0 1.3 3.2 1.4 0.0 2.5 0.4 0.7 4.8 0.0 0.0 0.0 0.0 1.8Democratic People's Republic of Korea (ASIA) 24-Jan-1995 17-Jun-1999 15.0 - - - 10.0 10.0 10.0 9.0 9.0 5.1 7.0 0.0 0.0 0.0 7.7Democratic Republic of the Congo (AFR) 30-Nov-1994 30-Nov-1994 0.0 - - - 11.0 10.0 10.1 10.8 1.3 2.1 1.3 1.3 0.6 0.4 4.8Djibouti (AFR) 30-Jul-1999 30-Jul-1999 0.0 - - - 0.0 0.0 0.0 0.0 0.0 0.0 0.0 0.0 0.0 0.0 0.0Dominica (LAC) 31-Mar-1993 31-Mar-1993 0.0 - 0.0 0.0 0.0 0.0 0.0 0.0 0.0 0.0 0.0 0.0 0.0 0.0 0.0Dominican Republic (LAC) 18-May-1993 24-Dec-2001 1.1 1.3 9.0 - 14.3 0.2 9.2 4.7 3.7 2.4 2.4 0.0 0.0 0.0 3.6Ecuador (LAC) 30-Apr-1990 23-Feb-1993 0.5 6.6 1.9 0.6 0.7 0.9 3.1 2.4 1.9 1.7 1.7 2.8 3.5 2.6 2.0Egypt (AFR) 2-Aug-1988 13-Jan-1993 50.0 7.0 10.0 20.0 30.5 38.0 35.0 33.0 25.0 20.0 15.0 19.0 18.0 17.5 26.0El Salvador (LAC) 2-Oct-1992 8-Dec-2000 0.0 0.0 8.2 - - - 0.0 0.0 0.0 0.0 0.0 0.0 0.0 0.0 0.0Eritrea (AFR) 10-Mar-2005 5-Jul-2005 - - - - - - - - - - - - - - N.R.Ethiopia (AFR) 11-Oct-1994 0.7 - - - 0.5 0.5 0.5 0.5 0.5 0.5 0.4 0.4 0.0 0.0 0.5Fiji (ASIA) 23-Oct-1989 9-Dec-1994 0.1 1.3 0.6 0.8 0.4 0.2 0.0 0.0 0.0 0.0 0.0 0.0 0.0 0.0 0.0Gabon (AFR) 9-Feb-1994 4-Dec-2000 0.0 - - - - - 0.0 0.0 0.0 0.0 0.0 0.0 0.0 0.0 0.0Gambia (AFR) 25-Jul-1990 13-Mar-1995 0.0 0.0 0.0 0.0 0.0 0.0 0.0 0.0 0.0 0.0 0.0 0.0 0.0 0.0 0.0Georgia (EEUR) 21-Mar-1996 12-Jul-2000 0.0 - - 0.0 0.0 0.0 0.0 0.0 0.0 0.0 0.0 0.0 0.0 0.0 0.0Ghana (AFR) 24-Jul-1989 24-Jul-1992 6.0 0.1 0.0 0.8 0.0 0.0 0.0 0.0 0.0 0.0 0.0 0.0 0.0 0.0 0.0Grenada (LAC) 31-Mar-1993 7-Dec-1993 0.0 - 0.0 0.0 0.0 0.0 0.0 0.0 0.0 0.0 0.0 0.0 0.0 0.0 0.0Guatemala (LAC) 7-Nov-1989 21-Jan-2002 0.0 0.0 0.0 0.0 0.0 0.0 0.0 0.0 0.0 0.0 0.0 0.0 0.0 0.0 0.0Guinea (AFR) 25-Jun-1992 25-Jun-1992 0.0 0.0 0.0 0.0 0.0 0.0 0.0 0.0 0.0 0.0 0.0 0.0 0.0 0.0 0.0Guinea-Bissau (AFR) 12-Nov-2002 12-Nov-2002 0.0 0.0 0.0 0.0 0.0 0.0 0.0 0.0 0.0 0.0 0.0 0.0 0.0 0.0 0.0Guyana (LAC) 12-Aug-1993 23-Jul-1999 0.0 0.0 - - 0.0 0.0 0.0 0.0 0.0 0.0 0.0 0.0 0.0 0.0 0.0Haiti (LAC) 29-Mar-2000 29-Mar-2000 0.0 - - - - - - 0.2 0.2 0.2 0.2 0.0 0.0 0.0 0.2Honduras (LAC) 14-Oct-1993 24-Jan-2002 0.0 - - - 0.0 0.0 0.0 0.0 0.0 0.0 0.0 0.0 0.0 0.0 0.0India (ASIA) 19-Jun-1992 19-Jun-1992 46.7 48.3 55.9 125.9 135.8 141.5 142.3 132.7 106.5 127.4 0.0 0.0 0.0 0.0 122.2Indonesia (ASIA) 26-Jun-1992 26-Jun-1992 0.0 219.8 24.3 26.7 29.4 32.3 23.5 20.0 20.0 0.0 20.0 8.8 10.7 10.7 13.3Iran (Islamic Republic of) (ASIA) 3-Oct-1990 4-Aug-1997 9.8 0.0 3.5 4.7 1.5 1.0 16.0 14.0 6.0 6.0 6.0 386.8 386.8 386.8 8.7Jamaica (LAC) 31-Mar-1993 31-Mar-1993 0.0 - 0.0 0.0 0.0 0.0 0.0 2.0 0.0 2.2 0.0 0.0 0.0 N.R. 1.4Jordan (ASIA) 31-May-1989 12-Nov-1993 2.0 0.0 0.0 0.0 0.0 2.1 2.0 2.0 2.5 50.0 17.0 8.0 8.0 6.0 18.2Kenya (AFR) 9-Nov-1988 27-Sep-1994 12.0 6.0 6.0 3.0 3.5 2.7 1.2 1.5 1.0 0.9 2.0 5.8 0.0 0.0 1.1Kiribati (ASIA) 7-Jan-1993 9-Aug-2004 0.0 - 0.0 0.0 0.0 0.0 0.0 0.0 0.0 0.0 0.0 0.0 0.0 0.0 0.0Kuwait (ASIA) 23-Nov-1992 22-Jul-1994 19.9 - - 28.0 27.0 0.0 0.0 0.0 0.0 0.0 0.0 0.0 0.0 0.0 0.0Kyrgyzstan (ASIA) 31-May-2000 13-May-2003 0.0 0.0 0.0 0.0 - - 0.0 0.0 0.0 0.0 0.0 0.0 0.0 0.0 0.0Lao People's Democratic Republic (ASIA) 21-Aug-1998 - 0.0 - - - - 0.0 0.0 0.0 0.0 0.0 0.0 0.0 0.0 0.0Lebanon (ASIA) 31-Mar-1993 31-Mar-1993 0.0 - 0.0 0.0 0.0 0.0 0.0 0.0 0.0 0.0 0.0 0.0 0.0 0.0 0.0Lesotho (AFR) 25-Mar-1994 0.0 - - 0.0 0.0 0.0 0.0 0.0 0.0 0.0 0.0 0.0 0.0 0.0 0.0Liberia (AFR) 15-Jan-1996 15-Jan-1996 0.0 0.0 0.0 0.0 0.0 0.0 0.0 0.0 0.0 0.0 0.0 0.0 0.0 0.0 0.0Libyan Arab Jamahiriya (AFR) 11-Jul-1990 12-Jul-2001 0.0 0.0 0.0 0.0 - - 0.0 0.0 0.0 0.0 0.0 0.0 0.0 0.0 0.0Madagascar (AFR) 7-Nov-1996 16-Jan-2002 0.0 - - - 0.0 0.0 0.0 0.0 0.0 0.0 0.0 0.0 0.0 0.0 0.0Malawi (AFR) 9-Jan-1991 8-Feb-1994 0.0 0.0 0.0 0.0 0.0 0.0 0.0 0.0 0.0 0.0 0.0 0.0 0.0 0.0 0.0Malaysia (ASIA) 29-Aug-1989 16-Jun-1993 5.4 282.9 262.0 219.5 39.2 35.1 36.3 21.4 76.1 51.0 35.0 12.9 11.4 11.4 49.5Maldives (ASIA) 16-May-1989 31-Jul-1991 0.0 0.0 0.0 0.0 0.0 0.0 0.0 0.0 0.0 0.0 0.0 0.0 0.0 0.0 0.0Mali (AFR) 28-Oct-1994 28-Oct-1994 0.0 0.0 0.0 0.0 0.0 0.0 0.0 0.0 0.0 0.0 0.0 0.0 0.0 0.0 0.0Marshall Islands (ASIA) 11-Mar-1993 11-Mar-1993 0.0 - 0.0 0.0 0.0 0.0 0.0 0.0 0.0 0.0 0.0 0.0 0.0 0.0 0.0Mauritania (AFR) 26-May-1994 22-Jul-2005 0.0 - - 0.0 0.0 0.0 0.0 0.0 0.0 0.0 0.0 0.0 0.0 - 0.0Mauritius (AFR) 18-Aug-1992 20-Oct-1992 0.0 - 0.0 0.0 0.1 0.4 0.0 0.1 0.1 0.1 0.0 0.0 0.0 0.0 0.1Mexico (LAC) 31-Mar-1988 11-Oct-1991 1.4 11.5 49.2 16.3 135.8 122.6 108.0 76.4 54.2 38.6 30.0 0.0 0.0 0.0 56.4Micronesia (Federated States of) (ASIA) 6-Sep-1995 27-Nov-2001 0.0 - - - 0.0 0.0 0.0 0.0 0.0 0.0 0.0 0.0 0.0 0.0 0.0Mongolia (ASIA) 7-Mar-1996 7-Mar-1996 0.0 - - - 0.0 0.0 0.0 0.0 0.0 0.0 0.0 0.0 0.0 0.0 0.0Morocco (AFR) 28-Dec-1995 28-Dec-1995 3.0 4.0 0.1 0.1 - 0.0 0.1 0.1 0.1 0.0 0.0 0.0 0.0 0.0 0.1Mozambique (AFR) 9-Sep-1994 9-Sep-1994 0.0 - - 0.0 0.0 0.0 0.0 0.0 0.0 0.0 0.0 0.0 0.0 N.R. 0.0Myanmar (ASIA) 24-Nov-1993 24-Nov-1993 0.0 - - 0.0 0.0 0.0 0.0 0.0 0.0 0.0 0.0 0.0 0.0 0.0 0.0Namibia (AFR) 20-Sep-1993 6-Nov-1997 0.0 - 0.0 0.0 0.0 0.0 0.0 0.0 0.0 0.0 0.0 0.0 0.0 0.0 0.0
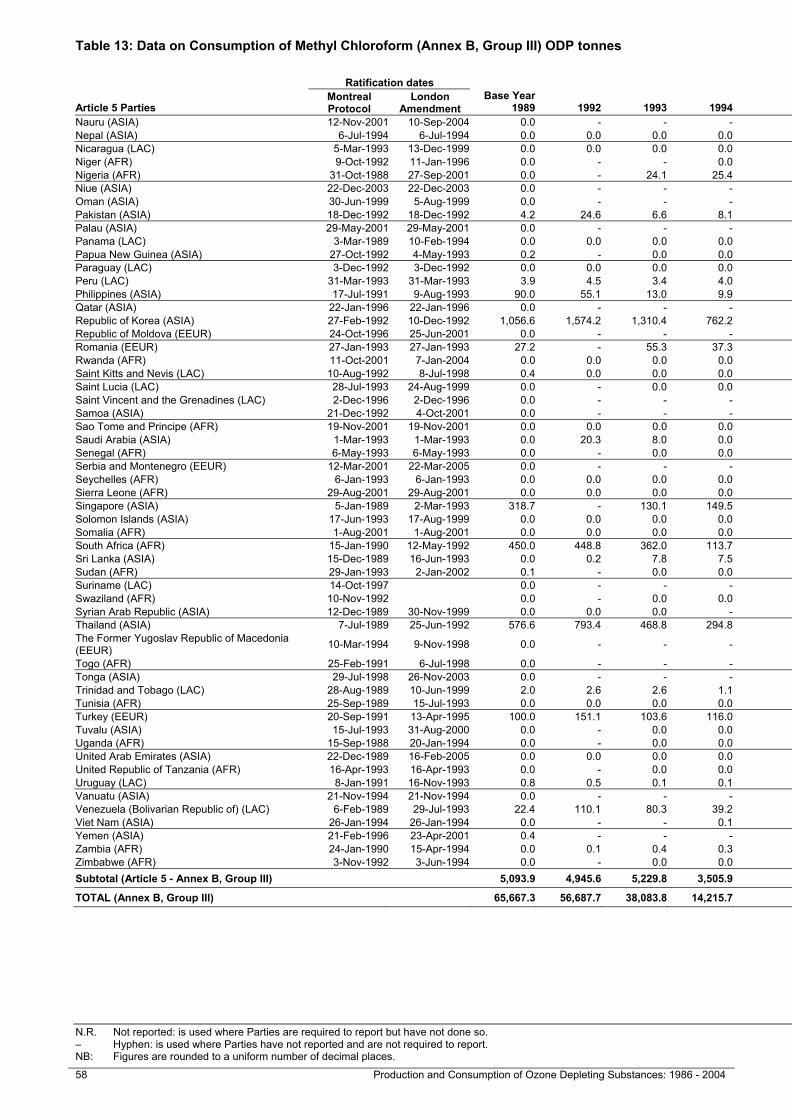
Table 13: Data on Consumption of Methyl Chloroform (Annex B, Group III) ODP tonnes Table 13: Data on Consumption of Methyl Chloroform (Annex B, Group III) ODP tonnes
N.R. Not reported: is used where Parties are required to report but have not done so. AFR = Africa ASIA = Asia EEUR = Eastern Europe CEIT = Country with Economy in Transition – Hyphen: is used where Parties have not reported and are not required to report. LAC = Latin America and the Caribbean WEUR = Western Europe and Others EC = Member of the European Community NB: Figures are rounded to a uniform number of decimal places.
58 Production and Consumption of Ozone Depleting Substances: 1986 - 2004 Production and Consumption of Ozone Depleting Substances: 1986 – 2004 59
Ratification dates Article 5 Baseline Years
Article 5 Parties Montreal Protocol
London Amendment
Base Year 1989 1992 1993 1994 1995 1996 1997 1998 1999 2000 2001 2002 2003 2004
Baselevel
Nauru (ASIA) 12-Nov-2001 10-Sep-2004 0.0 - - - 0.0 0.0 0.0 0.0 0.0 0.0 0.0 0.0 0.0 N.R. 0.0Nepal (ASIA) 6-Jul-1994 6-Jul-1994 0.0 0.0 0.0 0.0 0.0 0.0 0.0 0.0 0.0 0.0 0.0 0.0 0.0 0.0 0.0Nicaragua (LAC) 5-Mar-1993 13-Dec-1999 0.0 0.0 0.0 0.0 0.0 0.0 0.0 0.0 0.0 0.0 0.0 0.0 0.0 0.0 0.0Niger (AFR) 9-Oct-1992 11-Jan-1996 0.0 - - 0.0 0.0 0.0 0.0 0.0 0.0 0.0 0.0 0.0 0.0 0.0 0.0Nigeria (AFR) 31-Oct-1988 27-Sep-2001 0.0 - 24.1 25.4 26.8 24.0 31.0 33.2 32.7 32.7 31.5 31.0 31.3 31.3 32.9Niue (ASIA) 22-Dec-2003 22-Dec-2003 0.0 - - - 0.0 0.0 0.0 0.0 0.0 0.0 - - 0.0 0.0 0.0Oman (ASIA) 30-Jun-1999 5-Aug-1999 0.0 - - - 0.0 0.0 0.0 0.0 0.0 0.0 0.0 0.0 0.0 0.0 0.0Pakistan (ASIA) 18-Dec-1992 18-Dec-1992 4.2 24.6 6.6 8.1 12.8 5.2 2.9 2.0 2.5 2.5 3.5 0.0 0.0 0.0 2.3Palau (ASIA) 29-May-2001 29-May-2001 0.0 - - - 0.0 0.0 0.0 0.0 0.0 0.0 0.0 0.0 0.0 0.0 0.0Panama (LAC) 3-Mar-1989 10-Feb-1994 0.0 0.0 0.0 0.0 0.0 0.0 0.0 0.0 0.0 0.0 0.0 0.0 0.0 0.0 0.0Papua New Guinea (ASIA) 27-Oct-1992 4-May-1993 0.2 - 0.0 0.0 0.0 0.0 0.0 0.0 0.0 0.0 0.0 0.0 0.0 0.0 0.0Paraguay (LAC) 3-Dec-1992 3-Dec-1992 0.0 0.0 0.0 0.0 0.0 0.0 0.3 0.0 0.0 0.1 0.0 0.0 0.0 0.0 0.0Peru (LAC) 31-Mar-1993 31-Mar-1993 3.9 4.5 3.4 4.0 2.6 1.5 0.2 0.0 0.0 0.0 0.0 0.0 0.0 0.0 0.0Philippines (ASIA) 17-Jul-1991 9-Aug-1993 90.0 55.1 13.0 9.9 4.0 3.9 0.0 0.0 0.0 0.0 0.0 0.0 0.0 0.0 0.0Qatar (ASIA) 22-Jan-1996 22-Jan-1996 0.0 - - - 0.0 0.6 0.0 0.0 0.0 0.0 0.0 0.0 0.0 0.0 0.0Republic of Korea (ASIA) 27-Feb-1992 10-Dec-1992 1,056.6 1,574.2 1,310.4 762.2 849.1 895.4 617.0 364.3 600.1 575.4 593.1 563.9 499.0 428.0 513.3Republic of Moldova (EEUR) 24-Oct-1996 25-Jun-2001 0.0 - - - - 0.0 0.0 0.0 0.0 0.0 0.0 0.0 0.0 0.0 0.0Romania (EEUR) 27-Jan-1993 27-Jan-1993 27.2 - 55.3 37.3 30.9 12.9 2.9 0.0 0.0 0.0 0.0 0.0 0.0 0.0 0.0Rwanda (AFR) 11-Oct-2001 7-Jan-2004 0.0 0.0 0.0 0.0 0.0 0.0 0.0 0.0 0.0 0.0 0.0 0.0 0.0 0.0 0.0Saint Kitts and Nevis (LAC) 10-Aug-1992 8-Jul-1998 0.4 0.0 0.0 0.0 0.0 0.0 0.0 0.0 0.0 0.0 0.0 0.0 0.0 0.0 0.0Saint Lucia (LAC) 28-Jul-1993 24-Aug-1999 0.0 - 0.0 0.0 0.0 0.0 0.0 0.0 0.0 0.0 0.0 0.0 0.0 0.0 0.0Saint Vincent and the Grenadines (LAC) 2-Dec-1996 2-Dec-1996 0.0 - - - 0.0 0.0 0.0 0.0 0.0 0.0 0.0 0.0 0.0 0.0 0.0Samoa (ASIA) 21-Dec-1992 4-Oct-2001 0.0 - - - - 0.0 0.0 0.0 0.0 0.0 0.0 0.0 0.0 N.R. 0.0Sao Tome and Principe (AFR) 19-Nov-2001 19-Nov-2001 0.0 0.0 0.0 0.0 0.0 0.0 0.0 0.0 0.0 0.0 0.0 0.0 0.0 0.0 0.0Saudi Arabia (ASIA) 1-Mar-1993 1-Mar-1993 0.0 20.3 8.0 0.0 0.0 0.0 0.0 1.5 62.0 25.8 1.7 0.0 0.0 N.R. 29.8Senegal (AFR) 6-May-1993 6-May-1993 0.0 - 0.0 0.0 0.0 0.0 0.0 0.0 0.0 0.0 0.0 0.0 0.0 0.0 0.0Serbia and Montenegro (EEUR) 12-Mar-2001 22-Mar-2005 0.0 - - - - - - - - 0.0 0.0 0.0 0.0 0.0 N.R.Seychelles (AFR) 6-Jan-1993 6-Jan-1993 0.0 0.0 0.0 0.0 0.0 0.0 0.0 0.0 0.0 0.0 0.0 0.0 0.0 0.0 0.0Sierra Leone (AFR) 29-Aug-2001 29-Aug-2001 0.0 0.0 0.0 0.0 0.0 0.0 0.0 0.0 0.0 0.0 0.0 0.0 0.0 0.0 0.0Singapore (ASIA) 5-Jan-1989 2-Mar-1993 318.7 - 130.1 149.5 14.4 0.3 0.0 0.0 0.0 0.0 0.0 0.0 0.0 0.0 0.0Solomon Islands (ASIA) 17-Jun-1993 17-Aug-1999 0.0 0.0 0.0 0.0 0.0 0.0 0.0 0.0 0.0 0.0 0.0 0.0 0.0 0.0 0.0Somalia (AFR) 1-Aug-2001 1-Aug-2001 0.0 0.0 0.0 0.0 0.0 0.0 0.0 0.0 0.0 0.0 0.0 0.0 0.0 0.0 0.0South Africa (AFR) 15-Jan-1990 12-May-1992 450.0 448.8 362.0 113.7 60.3 0.0 0.0 0.0 0.0 0.0 0.0 0.0 0.0 0.0 0.0Sri Lanka (ASIA) 15-Dec-1989 16-Jun-1993 0.0 0.2 7.8 7.5 4.8 3.7 5.5 3.0 2.0 3.9 0.0 0.0 0.0 0.0 3.0Sudan (AFR) 29-Jan-1993 2-Jan-2002 0.1 - 0.0 0.0 0.0 0.2 0.0 0.0 0.0 0.0 0.0 0.0 0.0 0.0 0.0Suriname (LAC) 14-Oct-1997 0.0 - - - 0.0 0.0 0.0 0.0 0.0 0.0 0.0 0.0 0.0 0.0 0.0Swaziland (AFR) 10-Nov-1992 0.0 - 0.0 0.0 0.0 0.0 0.0 0.0 0.0 0.0 0.0 0.0 0.0 0.0 0.0Syrian Arab Republic (ASIA) 12-Dec-1989 30-Nov-1999 0.0 0.0 0.0 - 0.1 0.2 0.2 0.0 0.0 0.0 0.0 0.0 0.0 0.0 0.0Thailand (ASIA) 7-Jul-1989 25-Jun-1992 576.6 793.4 468.8 294.8 223.6 114.1 104.3 84.7 45.5 33.5 33.5 2.9 2.4 0.0 54.6The Former Yugoslav Republic of Macedonia (EEUR) 10-Mar-1994 9-Nov-1998 0.0 - - - 0.0 0.0 0.0 0.0 0.0 0.0 0.0 0.0 0.0 0.0 0.0
Togo (AFR) 25-Feb-1991 6-Jul-1998 0.0 - - - 0.0 0.0 0.0 0.0 0.0 0.0 0.0 0.0 0.0 0.0 0.0Tonga (ASIA) 29-Jul-1998 26-Nov-2003 0.0 - - - 0.0 0.0 0.0 0.0 0.0 0.0 0.0 0.0 0.0 0.0 0.0Trinidad and Tobago (LAC) 28-Aug-1989 10-Jun-1999 2.0 2.6 2.6 1.1 1.1 1.1 1.1 1.1 1.0 0.0 0.1 0.3 0.0 0.0 0.7Tunisia (AFR) 25-Sep-1989 15-Jul-1993 0.0 0.0 0.0 0.0 0.0 0.0 0.1 0.1 0.1 0.1 0.0 0.0 0.0 0.0 0.1Turkey (EEUR) 20-Sep-1991 13-Apr-1995 100.0 151.1 103.6 116.0 113.6 172.2 8.7 45.8 44.0 22.5 11.4 10.8 10.8 4.0 37.4Tuvalu (ASIA) 15-Jul-1993 31-Aug-2000 0.0 - 0.0 0.0 0.0 0.0 0.0 0.0 0.0 0.0 0.0 0.0 0.0 0.0 0.0Uganda (AFR) 15-Sep-1988 20-Jan-1994 0.0 - 0.0 0.0 0.0 0.0 0.0 0.0 0.0 0.0 0.0 0.0 0.0 0.0 0.0United Arab Emirates (ASIA) 22-Dec-1989 16-Feb-2005 0.0 0.0 0.0 0.0 0.0 0.0 0.0 0.0 0.0 0.0 0.0 0.0 0.0 0.0 0.0United Republic of Tanzania (AFR) 16-Apr-1993 16-Apr-1993 0.0 - 0.0 0.0 0.0 0.0 0.0 0.0 0.0 0.0 0.0 0.0 0.0 0.0 0.0Uruguay (LAC) 8-Jan-1991 16-Nov-1993 0.8 0.5 0.1 0.1 0.0 0.0 0.0 0.0 0.0 0.0 0.0 0.0 0.0 0.0 0.0Vanuatu (ASIA) 21-Nov-1994 21-Nov-1994 0.0 - - - 0.0 0.0 0.0 0.0 0.0 0.0 0.0 0.0 0.0 0.0 0.0Venezuela (Bolivarian Republic of) (LAC) 6-Feb-1989 29-Jul-1993 22.4 110.1 80.3 39.2 43.3 11.7 6.9 3.5 3.5 7.0 0.0 1.7 1.9 0.0 4.6Viet Nam (ASIA) 26-Jan-1994 26-Jan-1994 0.0 - - 0.1 0.1 0.1 0.1 0.1 0.2 0.2 0.0 0.0 0.0 0.0 0.2Yemen (ASIA) 21-Feb-1996 23-Apr-2001 0.4 - - - 0.4 0.5 0.6 0.9 1.0 0.8 0.0 0.8 0.2 0.1 0.9Zambia (AFR) 24-Jan-1990 15-Apr-1994 0.0 0.1 0.4 0.3 0.0 0.2 0.0 0.1 0.1 0.0 0.0 0.0 0.0 0.0 0.1Zimbabwe (AFR) 3-Nov-1992 3-Jun-1994 0.0 - 0.0 0.0 0.0 0.0 0.0 0.0 0.0 0.0 0.1 0.0 0.0 0.0 0.0Subtotal (Article 5 - Annex B, Group III) 5,093.9 4,945.6 5,229.8 3,505.9 2,621.7 2,511.5 2,030.1 1,786.3 1,950.7 1,853.5 1,334.5 1,466.6 1,360.0 1,304.3 1,863.5
TOTAL (Annex B, Group III) 65,667.3 56,687.7 38,083.8 14,215.7 15,454.6 2,598.8 2,285.8 1,732.8 2,155.7 2,119.5 1,322.5 -599.5 1,330.2 773.9 62,436.9
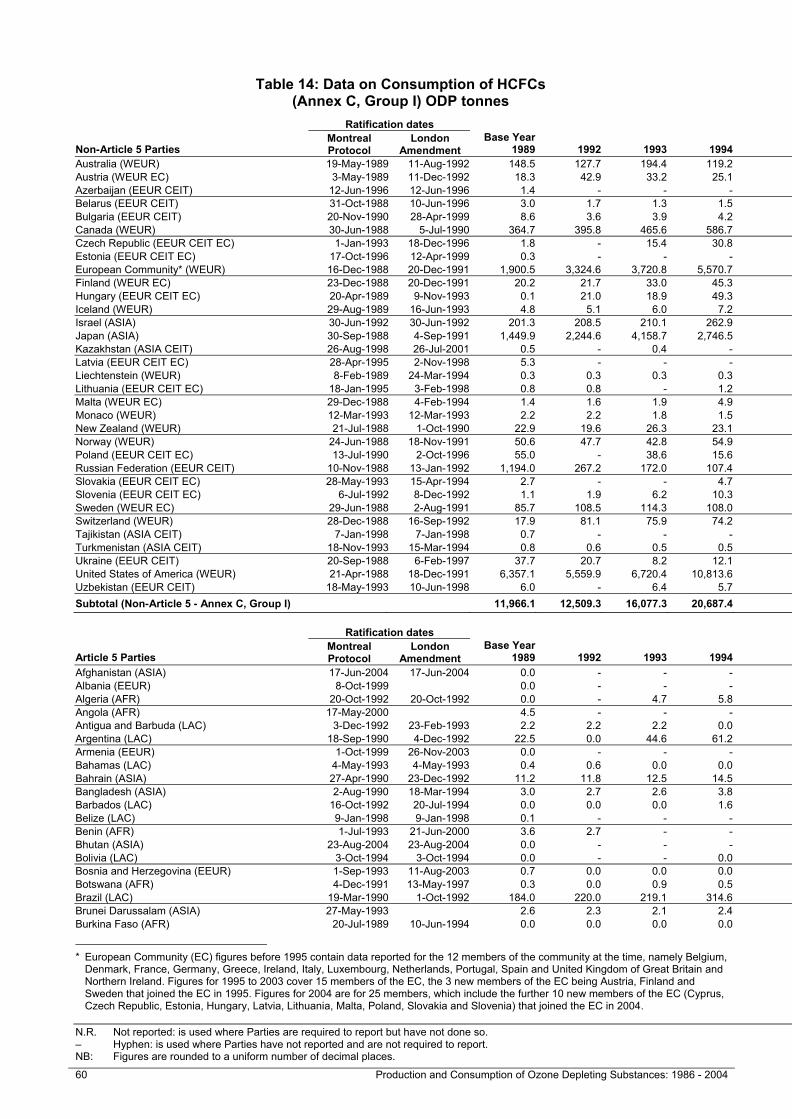
Table 14: Data on Consumption of HCFCs (Annex C, Group I) ODP tonnes
N.R. Not reported: is used where Parties are required to report but have not done so. AFR = Africa ASIA = Asia EEUR = Eastern Europe CEIT = Country with Economy in Transition – Hyphen: is used where Parties have not reported and are not required to report. LAC = Latin America and the Caribbean WEUR = Western Europe and Others EC = Member of the European Community NB: Figures are rounded to a uniform number of decimal places.
60 Production and Consumption of Ozone Depleting Substances: 1986 - 2004 Production and Consumption of Ozone Depleting Substances: 1986 – 2004 61
Table 14: Data on Consumption of HCFCs (Annex C, Group I) ODP tonnes
Ratification dates
Non-Article 5 Parties Montreal Protocol
London Amendment
Base Year 1989 1992 1993 1994 1995 1996 1997 1998 1999 2000 2001 2002 2003 2004
Baselevel
Australia (WEUR) 19-May-1989 11-Aug-1992 148.5 127.7 194.4 119.2 152.7 213.8 222.3 253.2 253.9 219.1 157.6 190.0 168.4 160.5 548.7Austria (WEUR EC) 3-May-1989 11-Dec-1992 18.3 42.9 33.2 25.1 182.4Azerbaijan (EEUR CEIT) 12-Jun-1996 12-Jun-1996 1.4 - - - - 5.1 0.5 0.2 0.8 0.4 0.1 0.1 0.0 0.0 14.8Belarus (EEUR CEIT) 31-Oct-1988 10-Jun-1996 3.0 1.7 1.3 1.5 0.8 5.3 1.2 2.1 4.3 16.0 9.3 2.7 4.5 3.1 50.0Bulgaria (EEUR CEIT) 20-Nov-1990 28-Apr-1999 8.6 3.6 3.9 4.2 0.0 6.5 0.0 0.0 5.8 6.5 6.5 7.6 8.9 16.5 81.8Canada (WEUR) 30-Jun-1988 5-Jul-1990 364.7 395.8 465.6 586.7 641.5 743.7 789.9 851.4 804.0 865.5 872.3 878.4 797.8 567.9 892.3Czech Republic (EEUR CEIT EC) 1-Jan-1993 18-Dec-1996 1.8 - 15.4 30.8 52.9 5.7 11.5 6.4 8.6 8.3 7.7 10.5 3.2 155.8Estonia (EEUR CEIT EC) 17-Oct-1996 12-Apr-1999 0.3 - - - 0.2 0.1 10.8 2.1 1.3 1.6 1.7 1.8 3.8 5.7European Community* (WEUR) 16-Dec-1988 20-Dec-1991 1,900.5 3,324.6 3,720.8 5,570.7 7,588.0 7,317.4 7,544.0 8,003.5 7,695.6 6,855.9 5,412.4 3,272.5 2,683.4 1,450.9 8,228.1Finland (WEUR EC) 23-Dec-1988 20-Dec-1991 20.2 21.7 33.0 45.3 73.0Hungary (EEUR CEIT EC) 20-Apr-1989 9-Nov-1993 0.1 21.0 18.9 49.3 60.1 67.0 81.8 89.0 89.1 72.8 80.5 31.1 26.0 135.9Iceland (WEUR) 29-Aug-1989 16-Jun-1993 4.8 5.1 6.0 7.2 7.6 7.5 8.9 7.0 6.6 6.7 7.1 2.6 2.7 2.0 8.7Israel (ASIA) 30-Jun-1992 30-Jun-1992 201.3 208.5 210.1 262.9 318.5 129.2 134.0 42.4 165.4 122.7 114.9 116.9 115.4 140.5 329.0Japan (ASIA) 30-Sep-1988 4-Sep-1991 1,449.9 2,244.6 4,158.7 2,746.5 5,748.7 4,141.1 4,150.7 3,998.0 4,098.0 3,449.1 3,538.8 2,670.5 2,699.0 1,425.7 5,554.9Kazakhstan (ASIA CEIT) 26-Aug-1998 26-Jul-2001 0.5 - 0.4 - - 0.2 0.3 0.3 4.7 42.2 48.4 32.5 33.6 34.3 39.5Latvia (EEUR CEIT EC) 28-Apr-1995 2-Nov-1998 5.3 - - - 3.6 4.3 7.0 5.5 3.3 2.5 2.6 3.0 2.2 137.9Liechtenstein (WEUR) 8-Feb-1989 24-Mar-1994 0.3 0.3 0.3 0.3 0.3 0.2 0.2 0.1 0.1 0.1 0.1 0.1 0.1 N.R. 0.7Lithuania (EEUR CEIT EC) 18-Jan-1995 3-Feb-1998 0.8 0.8 - 1.2 18.8 2.6 2.1 2.2 2.6 4.4 6.4 8.7 7.0 155.6Malta (WEUR EC) 29-Dec-1988 4-Feb-1994 1.4 1.6 1.9 4.9 7.4 4.6 5.9 15.5 9.9 13.9 15.4 6.9 5.8 11.7Monaco (WEUR) 12-Mar-1993 12-Mar-1993 2.2 2.2 1.8 1.5 0.9 0.0 0.0 0.0 0.0 0.1 0.1 0.1 1.5 0.2 2.4New Zealand (WEUR) 21-Jul-1988 1-Oct-1990 22.9 19.6 26.3 23.1 40.0 38.6 22.3 28.5 28.3 24.8 21.6 21.2 22.8 23.5 56.0Norway (WEUR) 24-Jun-1988 18-Nov-1991 50.6 47.7 42.8 54.9 52.8 62.4 61.9 64.0 56.7 55.1 46.1 29.4 21.4 17.5 76.0Poland (EEUR CEIT EC) 13-Jul-1990 2-Oct-1996 55.0 - 38.6 15.6 0.0 92.6 110.0 87.5 86.9 70.4 91.9 95.7 98.0 194.6Russian Federation (EEUR CEIT) 10-Nov-1988 13-Jan-1992 1,194.0 267.2 172.0 107.4 83.7 72.8 94.2 85.4 146.9 132.8 761.5 898.7 640.0 N.R. 3,996.9Slovakia (EEUR CEIT EC) 28-May-1993 15-Apr-1994 2.7 - - 4.7 2.8 1.2 3.1 5.0 2.2 3.3 3.5 3.7 2.9 58.2Slovenia (EEUR CEIT EC) 6-Jul-1992 8-Dec-1992 1.1 1.9 6.2 10.3 16.2 10.9 8.6 7.3 5.9 7.3 6.6 6.0 5.8 68.1Sweden (WEUR EC) 29-Jun-1988 2-Aug-1991 85.7 108.5 114.3 108.0 157.2Switzerland (WEUR) 28-Dec-1988 16-Sep-1992 17.9 81.1 75.9 74.2 57.5 40.1 38.6 30.8 22.2 16.8 14.5 14.3 16.5 10.9 130.5Tajikistan (ASIA CEIT) 7-Jan-1998 7-Jan-1998 0.7 - - - 0.7 1.2 1.7 1.8 1.6 0.7 1.1 0.8 1.2 3.1 6.0Turkmenistan (ASIA CEIT) 18-Nov-1993 15-Mar-1994 0.8 0.6 0.5 0.5 0.5 1.5 0.8 1.2 1.2 2.6 4.4 0.4 1.0 0.8 5.6Ukraine (EEUR CEIT) 20-Sep-1988 6-Feb-1997 37.7 20.7 8.2 12.1 30.5 21.1 17.4 13.9 4.7 25.4 23.1 25.8 80.4 84.3 164.2United States of America (WEUR) 21-Apr-1988 18-Dec-1991 6,357.1 5,559.9 6,720.4 10,813.6 13,881.1 11,227.9 10,736.0 14,139.9 13,851.9 13,166.5 12,094.9 13,978.5 7,327.3 6,280.2 15,248.4Uzbekistan (EEUR CEIT) 18-May-1993 10-Jun-1998 6.0 - 6.4 5.7 2.7 2.2 2.1 0.3 0.3 2.1 0.6 0.8 2.3 1.8 74.8Subtotal (Non-Article 5 - Annex C, Group I) 11,966.1 12,509.3 16,077.3 20,687.4 28,770.5 24,226.8 24,067.8 27,744.5 27,362.8 25,195.6 23,351.7 22,311.3 14,782.9 10,223.7 36,845.4
Ratification dates
Article 5 Parties Montreal Protocol
London Amendment
Base Year 1989 1992 1993 1994 1995 1996 1997 1998 1999 2000 2001 2002 2003 2004
Baselevel
Afghanistan (ASIA) 17-Jun-2004 17-Jun-2004 0.0 - - - - - - - - - - - - 3.2 -Albania (EEUR) 8-Oct-1999 0.0 - - - 0.0 0.0 0.0 0.0 0.0 0.0 0.0 0.0 0.0 0.0 -Algeria (AFR) 20-Oct-1992 20-Oct-1992 0.0 - 4.7 5.8 5.4 6.6 6.6 6.6 6.6 6.6 6.6 6.6 6.6 6.6 -Angola (AFR) 17-May-2000 4.5 - - - - - - 0.0 - 0.0 5.0 5.0 5.5 6.6 -Antigua and Barbuda (LAC) 3-Dec-1992 23-Feb-1993 2.2 2.2 2.2 0.0 0.0 0.0 0.0 1.2 0.4 0.1 0.2 0.3 0.2 0.7 -Argentina (LAC) 18-Sep-1990 4-Dec-1992 22.5 0.0 44.6 61.2 97.2 87.6 95.5 100.3 106.2 53.1 98.9 44.6 147.5 160.1 -Armenia (EEUR) 1-Oct-1999 26-Nov-2003 0.0 - - - 0.0 0.0 0.0 0.0 0.8 0.7 1.7 1.7 1.7 2.9 -Bahamas (LAC) 4-May-1993 4-May-1993 0.4 0.6 0.0 0.0 0.0 0.0 2.1 4.2 6.2 3.9 5.4 2.7 3.2 5.0 -Bahrain (ASIA) 27-Apr-1990 23-Dec-1992 11.2 11.8 12.5 14.5 16.4 21.3 22.0 22.0 17.3 38.5 35.2 40.9 33.9 19.8 -Bangladesh (ASIA) 2-Aug-1990 18-Mar-1994 3.0 2.7 2.6 3.8 2.1 3.4 5.7 3.7 7.1 5.3 5.8 7.3 0.0 9.1 -Barbados (LAC) 16-Oct-1992 20-Jul-1994 0.0 0.0 0.0 1.6 1.3 1.7 1.8 2.6 2.7 1.1 1.7 2.2 2.9 2.6 -Belize (LAC) 9-Jan-1998 9-Jan-1998 0.1 - - - 0.6 0.3 1.1 0.7 0.2 0.2 0.8 0.0 0.0 0.0 -Benin (AFR) 1-Jul-1993 21-Jun-2000 3.6 2.7 - - 0.0 0.6 0.7 0.7 0.7 0.6 0.5 0.5 0.5 0.3 -Bhutan (ASIA) 23-Aug-2004 23-Aug-2004 0.0 - - - 0.0 0.0 0.0 0.0 0.0 0.0 - - - 0.0 -Bolivia (LAC) 3-Oct-1994 3-Oct-1994 0.0 - - 0.0 0.4 4.3 1.9 1.2 1.2 1.1 2.0 1.6 2.9 3.4 -Bosnia and Herzegovina (EEUR) 1-Sep-1993 11-Aug-2003 0.7 0.0 0.0 0.0 0.0 0.0 0.0 0.0 0.5 0.9 0.9 0.2 0.1 0.1 -Botswana (AFR) 4-Dec-1991 13-May-1997 0.3 0.0 0.9 0.5 0.6 0.8 1.1 0.0 0.0 1.5 1.6 1.8 2.2 2.3 -Brazil (LAC) 19-Mar-1990 1-Oct-1992 184.0 220.0 219.1 314.6 400.8 304.2 372.6 483.2 476.0 902.7 756.0 716.0 766.0 857.6 -Brunei Darussalam (ASIA) 27-May-1993 2.6 2.3 2.1 2.4 2.4 1.7 2.5 1.5 1.0 1.2 1.7 2.9 1.4 - -Burkina Faso (AFR) 20-Jul-1989 10-Jun-1994 0.0 0.0 0.0 0.0 0.0 0.0 0.0 0.0 0.0 0.0 0.0 0.0 0.0 0.0 -
* European Community (EC) figures before 1995 contain data reported for the 12 members of the community at the time, namely Belgium,
Denmark, France, Germany, Greece, Ireland, Italy, Luxembourg, Netherlands, Portugal, Spain and United Kingdom of Great Britain and Northern Ireland. Figures for 1995 to 2003 cover 15 members of the EC, the 3 new members of the EC being Austria, Finland and Sweden that joined the EC in 1995. Figures for 2004 are for 25 members, which include the further 10 new members of the EC (Cyprus, Czech Republic, Estonia, Hungary, Latvia, Lithuania, Malta, Poland, Slovakia and Slovenia) that joined the EC in 2004.

Table 14: Data on Consumption of HCFCs (Annex C, Group I) ODP tonnes
N.R. Not reported: is used where Parties are required to report but have not done so. AFR = Africa ASIA = Asia EEUR = Eastern Europe CEIT = Country with Economy in Transition – Hyphen: is used where Parties have not reported and are not required to report. LAC = Latin America and the Caribbean WEUR = Western Europe and Others EC = Member of the European Community NB: Figures are rounded to a uniform number of decimal places.
60 Production and Consumption of Ozone Depleting Substances: 1986 - 2004 Production and Consumption of Ozone Depleting Substances: 1986 – 2004 61
Table 14: Data on Consumption of HCFCs (Annex C, Group I) ODP tonnes
Ratification dates
Non-Article 5 Parties Montreal Protocol
London Amendment
Base Year 1989 1992 1993 1994 1995 1996 1997 1998 1999 2000 2001 2002 2003 2004
Baselevel
Australia (WEUR) 19-May-1989 11-Aug-1992 148.5 127.7 194.4 119.2 152.7 213.8 222.3 253.2 253.9 219.1 157.6 190.0 168.4 160.5 548.7Austria (WEUR EC) 3-May-1989 11-Dec-1992 18.3 42.9 33.2 25.1 182.4Azerbaijan (EEUR CEIT) 12-Jun-1996 12-Jun-1996 1.4 - - - - 5.1 0.5 0.2 0.8 0.4 0.1 0.1 0.0 0.0 14.8Belarus (EEUR CEIT) 31-Oct-1988 10-Jun-1996 3.0 1.7 1.3 1.5 0.8 5.3 1.2 2.1 4.3 16.0 9.3 2.7 4.5 3.1 50.0Bulgaria (EEUR CEIT) 20-Nov-1990 28-Apr-1999 8.6 3.6 3.9 4.2 0.0 6.5 0.0 0.0 5.8 6.5 6.5 7.6 8.9 16.5 81.8Canada (WEUR) 30-Jun-1988 5-Jul-1990 364.7 395.8 465.6 586.7 641.5 743.7 789.9 851.4 804.0 865.5 872.3 878.4 797.8 567.9 892.3Czech Republic (EEUR CEIT EC) 1-Jan-1993 18-Dec-1996 1.8 - 15.4 30.8 52.9 5.7 11.5 6.4 8.6 8.3 7.7 10.5 3.2 155.8Estonia (EEUR CEIT EC) 17-Oct-1996 12-Apr-1999 0.3 - - - 0.2 0.1 10.8 2.1 1.3 1.6 1.7 1.8 3.8 5.7European Community* (WEUR) 16-Dec-1988 20-Dec-1991 1,900.5 3,324.6 3,720.8 5,570.7 7,588.0 7,317.4 7,544.0 8,003.5 7,695.6 6,855.9 5,412.4 3,272.5 2,683.4 1,450.9 8,228.1Finland (WEUR EC) 23-Dec-1988 20-Dec-1991 20.2 21.7 33.0 45.3 73.0Hungary (EEUR CEIT EC) 20-Apr-1989 9-Nov-1993 0.1 21.0 18.9 49.3 60.1 67.0 81.8 89.0 89.1 72.8 80.5 31.1 26.0 135.9Iceland (WEUR) 29-Aug-1989 16-Jun-1993 4.8 5.1 6.0 7.2 7.6 7.5 8.9 7.0 6.6 6.7 7.1 2.6 2.7 2.0 8.7Israel (ASIA) 30-Jun-1992 30-Jun-1992 201.3 208.5 210.1 262.9 318.5 129.2 134.0 42.4 165.4 122.7 114.9 116.9 115.4 140.5 329.0Japan (ASIA) 30-Sep-1988 4-Sep-1991 1,449.9 2,244.6 4,158.7 2,746.5 5,748.7 4,141.1 4,150.7 3,998.0 4,098.0 3,449.1 3,538.8 2,670.5 2,699.0 1,425.7 5,554.9Kazakhstan (ASIA CEIT) 26-Aug-1998 26-Jul-2001 0.5 - 0.4 - - 0.2 0.3 0.3 4.7 42.2 48.4 32.5 33.6 34.3 39.5Latvia (EEUR CEIT EC) 28-Apr-1995 2-Nov-1998 5.3 - - - 3.6 4.3 7.0 5.5 3.3 2.5 2.6 3.0 2.2 137.9Liechtenstein (WEUR) 8-Feb-1989 24-Mar-1994 0.3 0.3 0.3 0.3 0.3 0.2 0.2 0.1 0.1 0.1 0.1 0.1 0.1 N.R. 0.7Lithuania (EEUR CEIT EC) 18-Jan-1995 3-Feb-1998 0.8 0.8 - 1.2 18.8 2.6 2.1 2.2 2.6 4.4 6.4 8.7 7.0 155.6Malta (WEUR EC) 29-Dec-1988 4-Feb-1994 1.4 1.6 1.9 4.9 7.4 4.6 5.9 15.5 9.9 13.9 15.4 6.9 5.8 11.7Monaco (WEUR) 12-Mar-1993 12-Mar-1993 2.2 2.2 1.8 1.5 0.9 0.0 0.0 0.0 0.0 0.1 0.1 0.1 1.5 0.2 2.4New Zealand (WEUR) 21-Jul-1988 1-Oct-1990 22.9 19.6 26.3 23.1 40.0 38.6 22.3 28.5 28.3 24.8 21.6 21.2 22.8 23.5 56.0Norway (WEUR) 24-Jun-1988 18-Nov-1991 50.6 47.7 42.8 54.9 52.8 62.4 61.9 64.0 56.7 55.1 46.1 29.4 21.4 17.5 76.0Poland (EEUR CEIT EC) 13-Jul-1990 2-Oct-1996 55.0 - 38.6 15.6 0.0 92.6 110.0 87.5 86.9 70.4 91.9 95.7 98.0 194.6Russian Federation (EEUR CEIT) 10-Nov-1988 13-Jan-1992 1,194.0 267.2 172.0 107.4 83.7 72.8 94.2 85.4 146.9 132.8 761.5 898.7 640.0 N.R. 3,996.9Slovakia (EEUR CEIT EC) 28-May-1993 15-Apr-1994 2.7 - - 4.7 2.8 1.2 3.1 5.0 2.2 3.3 3.5 3.7 2.9 58.2Slovenia (EEUR CEIT EC) 6-Jul-1992 8-Dec-1992 1.1 1.9 6.2 10.3 16.2 10.9 8.6 7.3 5.9 7.3 6.6 6.0 5.8 68.1Sweden (WEUR EC) 29-Jun-1988 2-Aug-1991 85.7 108.5 114.3 108.0 157.2Switzerland (WEUR) 28-Dec-1988 16-Sep-1992 17.9 81.1 75.9 74.2 57.5 40.1 38.6 30.8 22.2 16.8 14.5 14.3 16.5 10.9 130.5Tajikistan (ASIA CEIT) 7-Jan-1998 7-Jan-1998 0.7 - - - 0.7 1.2 1.7 1.8 1.6 0.7 1.1 0.8 1.2 3.1 6.0Turkmenistan (ASIA CEIT) 18-Nov-1993 15-Mar-1994 0.8 0.6 0.5 0.5 0.5 1.5 0.8 1.2 1.2 2.6 4.4 0.4 1.0 0.8 5.6Ukraine (EEUR CEIT) 20-Sep-1988 6-Feb-1997 37.7 20.7 8.2 12.1 30.5 21.1 17.4 13.9 4.7 25.4 23.1 25.8 80.4 84.3 164.2United States of America (WEUR) 21-Apr-1988 18-Dec-1991 6,357.1 5,559.9 6,720.4 10,813.6 13,881.1 11,227.9 10,736.0 14,139.9 13,851.9 13,166.5 12,094.9 13,978.5 7,327.3 6,280.2 15,248.4Uzbekistan (EEUR CEIT) 18-May-1993 10-Jun-1998 6.0 - 6.4 5.7 2.7 2.2 2.1 0.3 0.3 2.1 0.6 0.8 2.3 1.8 74.8Subtotal (Non-Article 5 - Annex C, Group I) 11,966.1 12,509.3 16,077.3 20,687.4 28,770.5 24,226.8 24,067.8 27,744.5 27,362.8 25,195.6 23,351.7 22,311.3 14,782.9 10,223.7 36,845.4
Ratification dates
Article 5 Parties Montreal Protocol
London Amendment
Base Year 1989 1992 1993 1994 1995 1996 1997 1998 1999 2000 2001 2002 2003 2004
Baselevel
Afghanistan (ASIA) 17-Jun-2004 17-Jun-2004 0.0 - - - - - - - - - - - - 3.2 -Albania (EEUR) 8-Oct-1999 0.0 - - - 0.0 0.0 0.0 0.0 0.0 0.0 0.0 0.0 0.0 0.0 -Algeria (AFR) 20-Oct-1992 20-Oct-1992 0.0 - 4.7 5.8 5.4 6.6 6.6 6.6 6.6 6.6 6.6 6.6 6.6 6.6 -Angola (AFR) 17-May-2000 4.5 - - - - - - 0.0 - 0.0 5.0 5.0 5.5 6.6 -Antigua and Barbuda (LAC) 3-Dec-1992 23-Feb-1993 2.2 2.2 2.2 0.0 0.0 0.0 0.0 1.2 0.4 0.1 0.2 0.3 0.2 0.7 -Argentina (LAC) 18-Sep-1990 4-Dec-1992 22.5 0.0 44.6 61.2 97.2 87.6 95.5 100.3 106.2 53.1 98.9 44.6 147.5 160.1 -Armenia (EEUR) 1-Oct-1999 26-Nov-2003 0.0 - - - 0.0 0.0 0.0 0.0 0.8 0.7 1.7 1.7 1.7 2.9 -Bahamas (LAC) 4-May-1993 4-May-1993 0.4 0.6 0.0 0.0 0.0 0.0 2.1 4.2 6.2 3.9 5.4 2.7 3.2 5.0 -Bahrain (ASIA) 27-Apr-1990 23-Dec-1992 11.2 11.8 12.5 14.5 16.4 21.3 22.0 22.0 17.3 38.5 35.2 40.9 33.9 19.8 -Bangladesh (ASIA) 2-Aug-1990 18-Mar-1994 3.0 2.7 2.6 3.8 2.1 3.4 5.7 3.7 7.1 5.3 5.8 7.3 0.0 9.1 -Barbados (LAC) 16-Oct-1992 20-Jul-1994 0.0 0.0 0.0 1.6 1.3 1.7 1.8 2.6 2.7 1.1 1.7 2.2 2.9 2.6 -Belize (LAC) 9-Jan-1998 9-Jan-1998 0.1 - - - 0.6 0.3 1.1 0.7 0.2 0.2 0.8 0.0 0.0 0.0 -Benin (AFR) 1-Jul-1993 21-Jun-2000 3.6 2.7 - - 0.0 0.6 0.7 0.7 0.7 0.6 0.5 0.5 0.5 0.3 -Bhutan (ASIA) 23-Aug-2004 23-Aug-2004 0.0 - - - 0.0 0.0 0.0 0.0 0.0 0.0 - - - 0.0 -Bolivia (LAC) 3-Oct-1994 3-Oct-1994 0.0 - - 0.0 0.4 4.3 1.9 1.2 1.2 1.1 2.0 1.6 2.9 3.4 -Bosnia and Herzegovina (EEUR) 1-Sep-1993 11-Aug-2003 0.7 0.0 0.0 0.0 0.0 0.0 0.0 0.0 0.5 0.9 0.9 0.2 0.1 0.1 -Botswana (AFR) 4-Dec-1991 13-May-1997 0.3 0.0 0.9 0.5 0.6 0.8 1.1 0.0 0.0 1.5 1.6 1.8 2.2 2.3 -Brazil (LAC) 19-Mar-1990 1-Oct-1992 184.0 220.0 219.1 314.6 400.8 304.2 372.6 483.2 476.0 902.7 756.0 716.0 766.0 857.6 -Brunei Darussalam (ASIA) 27-May-1993 2.6 2.3 2.1 2.4 2.4 1.7 2.5 1.5 1.0 1.2 1.7 2.9 1.4 - -Burkina Faso (AFR) 20-Jul-1989 10-Jun-1994 0.0 0.0 0.0 0.0 0.0 0.0 0.0 0.0 0.0 0.0 0.0 0.0 0.0 0.0 -
* European Community (EC) figures before 1995 contain data reported for the 12 members of the community at the time, namely Belgium,
Denmark, France, Germany, Greece, Ireland, Italy, Luxembourg, Netherlands, Portugal, Spain and United Kingdom of Great Britain and Northern Ireland. Figures for 1995 to 2003 cover 15 members of the EC, the 3 new members of the EC being Austria, Finland and Sweden that joined the EC in 1995. Figures for 2004 are for 25 members, which include the further 10 new members of the EC (Cyprus, Czech Republic, Estonia, Hungary, Latvia, Lithuania, Malta, Poland, Slovakia and Slovenia) that joined the EC in 2004.

Table 14: Data on Consumption of HCFCs (Annex C, Group I) ODP tonnes Table 14: Data on Consumption of HCFCs (Annex C, Group I) ODP tonnes
N.R. Not reported: is used where Parties are required to report but have not done so. AFR = Africa ASIA = Asia EEUR = Eastern Europe CEIT = Country with Economy in Transition – Hyphen: is used where Parties have not reported and are not required to report. LAC = Latin America and the Caribbean WEUR = Western Europe and Others EC = Member of the European Community NB: Figures are rounded to a uniform number of decimal places.
62 Production and Consumption of Ozone Depleting Substances: 1986 - 2004 Production and Consumption of Ozone Depleting Substances: 1986 – 2004 63
Ratification dates
Article 5 Parties Montreal Protocol
London Amendment
Base Year 1989 1992 1993 1994 1995 1996 1997 1998 1999 2000 2001 2002 2003 2004
Baselevel
Burundi (AFR) 6-Jan-1997 18-Oct-2001 0.0 0.0 - - 0.0 0.0 0.0 0.0 0.0 0.0 0.0 0.0 0.0 1.0 -Cambodia (ASIA) 27-Jun-2001 2.3 - - - 2.3 2.3 2.3 2.3 2.3 2.3 2.3 2.3 2.8 4.2 -Cameroon (AFR) 30-Aug-1989 8-Jun-1992 2.4 1.8 2.8 2.8 5.8 2.5 1.5 1.5 2.3 0.3 0.3 1.3 1.2 1.3 -Cape Verde (AFR) 31-Jul-2001 31-Jul-2001 0.0 0.0 0.0 0.0 0.0 0.0 0.0 0.0 0.0 0.0 0.0 0.0 0.0 0.0 -Central African Republic (AFR) 29-Mar-1993 0.8 - 1.0 1.0 0.9 0.1 0.0 0.3 0.1 0.2 0.2 0.2 0.2 - -Chad (AFR) 7-Jun-1994 30-May-2001 0.0 - - 0.0 0.0 0.0 0.0 0.0 0.1 0.1 0.2 0.2 0.1 N.R. -Chile (LAC) 26-Mar-1990 9-Apr-1992 17.4 25.1 19.9 31.6 28.8 24.2 39.5 45.6 41.6 58.7 52.5 52.6 37.9 70.2 -China (ASIA) 14-Jun-1991 14-Jun-1991 621.5 305.0 853.4 1,475.1 680.2 895.1 1,516.0 999.0 3,612.1 5,165.5 5,126.3 5,788.8 7,808.7 10,379.6 -Colombia (LAC) 6-Dec-1993 6-Dec-1993 14.6 21.5 - 19.8 21.5 21.8 30.7 30.1 25.4 0.0 97.7 89.9 109.2 124.6 -Comoros (AFR) 31-Oct-1994 31-Oct-1994 0.0 - - - 0.0 0.0 0.0 0.0 0.1 0.1 0.1 0.1 0.1 0.1 -Congo (AFR) 16-Nov-1994 16-Nov-1994 0.4 - - 0.6 0.8 0.8 0.8 1.2 0.9 0.9 1.0 1.5 1.7 0.2 -Cook Islands (ASIA) 22-Dec-2003 22-Dec-2003 0.1 - - - 0.1 0.0 0.0 0.0 0.0 0.0 - - 0.0 N.R. -Costa Rica (LAC) 30-Jul-1991 11-Nov-1998 3.9 3.6 - 3.4 0.0 6.8 3.7 6.1 4.0 8.6 7.6 8.0 12.4 9.4 -Côte d'Ivoire (AFR) 5-Apr-1993 18-May-1994 0.0 - 6.7 0.0 8.2 7.7 4.7 8.4 7.8 7.9 7.4 2.7 2.7 3.0 -Croatia (EEUR) 21-Sep-1992 15-Oct-1993 0.1 3.4 2.2 4.7 4.9 4.5 6.7 3.7 3.9 6.4 13.1 4.6 2.0 7.7 -Cuba (LAC) 14-Jul-1992 19-Oct-1998 0.0 5.9 2.2 0.0 12.4 16.2 0.0 9.5 11.7 7.2 10.1 4.6 3.6 6.8 -Cyprus (ASIA EC) 28-May-1992 11-Oct-1994 0.0 0.7 0.0 0.0 1.5 0.0 0.0 0.0 0.0 0.0 1.0 3.9 11.4 -Democratic People's Republic of Korea (ASIA) 24-Jan-1995 17-Jun-1999 0.0 - - - - 0.0 0.0 0.0 0.0 0.0 0.0 0.0 0.0 0.0 -Democratic Republic of the Congo (AFR) 30-Nov-1994 30-Nov-1994 0.0 - - - 0.0 0.0 0.0 0.5 0.0 0.2 0.8 0.8 0.0 0.0 -Djibouti (AFR) 30-Jul-1999 30-Jul-1999 0.0 - - - 0.0 0.0 0.0 0.0 0.0 0.0 0.0 0.0 0.0 0.0 -Dominica (LAC) 31-Mar-1993 31-Mar-1993 0.0 - 0.0 0.0 0.1 0.1 0.1 0.2 0.1 0.2 0.1 0.1 0.1 0.1 -Dominican Republic (LAC) 18-May-1993 24-Dec-2001 9.5 6.9 0.0 11.3 21.8 10.7 6.2 6.7 7.7 17.9 15.6 0.0 12.0 31.8 -Ecuador (LAC) 30-Apr-1990 23-Feb-1993 6.5 8.4 5.4 3.4 8.3 9.9 0.0 0.0 0.0 0.0 0.0 0.0 0.0 13.1 -Egypt (AFR) 2-Aug-1988 13-Jan-1993 0.0 - 11.0 11.0 0.0 59.7 66.0 88.0 99.0 151.8 121.5 120.1 111.5 155.0 -El Salvador (LAC) 2-Oct-1992 8-Dec-2000 4.4 6.0 3.7 2.4 3.1 3.2 5.9 4.1 5.2 8.6 4.3 6.5 7.7 5.5 -Eritrea (AFR) 10-Mar-2005 5-Jul-2005 - - - - - - - - - - - - - - -Ethiopia (AFR) 11-Oct-1994 0.0 - - - 0.0 0.0 0.0 1.5 0.0 0.0 0.0 0.0 0.0 0.0 -Fiji (ASIA) 23-Oct-1989 9-Dec-1994 0.0 0.0 - 0.0 1.1 1.5 0.0 2.4 1.0 1.6 1.3 5.0 0.1 3.9 -Gabon (AFR) 9-Feb-1994 4-Dec-2000 1.4 - 1.6 1.6 2.0 2.0 2.0 2.0 1.9 2.5 2.0 1.9 1.9 1.7 -Gambia (AFR) 25-Jul-1990 13-Mar-1995 0.0 0.2 0.4 0.3 2.0 0.4 0.4 0.2 0.1 0.1 0.1 0.2 0.2 0.0 -Georgia (EEUR) 21-Mar-1996 12-Jul-2000 7.2 - - 0.0 0.2 1.1 1.5 0.7 0.5 0.8 0.8 0.9 0.9 1.1 -Ghana (AFR) 24-Jul-1989 24-Jul-1992 3.3 2.4 1.9 3.4 3.4 1.5 2.8 4.4 3.1 3.0 5.5 2.8 5.3 11.9 -Grenada (LAC) 31-Mar-1993 7-Dec-1993 0.3 - 0.3 0.3 0.4 0.2 0.4 0.4 0.2 0.2 0.0 0.2 0.2 0.5 -Guatemala (LAC) 7-Nov-1989 21-Jan-2002 0.1 0.0 0.0 1.3 1.5 1.1 1.1 2.1 2.2 1.2 3.8 3.5 2.2 6.5 -Guinea (AFR) 25-Jun-1992 25-Jun-1992 0.0 0.0 0.0 0.0 0.0 0.0 0.0 0.0 0.0 0.0 0.0 0.0 0.0 0.0 -Guinea-Bissau (AFR) 12-Nov-2002 12-Nov-2002 0.0 0.0 0.0 0.0 0.0 0.0 0.0 0.0 0.0 0.0 0.0 0.0 0.9 0.0 -Guyana (LAC) 12-Aug-1993 23-Jul-1999 0.2 0.4 - - 0.2 0.5 1.3 1.5 1.0 0.9 0.7 1.3 1.2 1.0 -Haiti (LAC) 29-Mar-2000 29-Mar-2000 0.0 - - - - - - - - 15.0 15.0 16.5 3.6 8.1 -Honduras (LAC) 14-Oct-1993 24-Jan-2002 0.1 - - - 1.8 1.3 2.8 4.3 7.9 6.3 6.8 12.0 5.9 10.9 -India (ASIA) 19-Jun-1992 19-Jun-1992 118.4 141.5 163.9 153.1 158.5 183.4 207.0 384.1 316.8 250.6 257.4 331.0 360.4 449.1 -Indonesia (ASIA) 26-Jun-1992 26-Jun-1992 0.0 0.0 0.0 22.0 31.3 83.1 91.9 89.9 35.4 40.1 130.6 218.0 225.5 276.9 -Iran (Islamic Republic of) (ASIA) 3-Oct-1990 4-Aug-1997 42.5 5.8 8.5 4.7 13.2 11.0 19.3 20.4 13.8 33.6 91.0 153.7 94.4 153.1 -Jamaica (LAC) 31-Mar-1993 31-Mar-1993 7.8 4.5 34.1 1.5 3.9 4.3 4.6 5.1 8.9 6.6 11.3 6.3 5.4 N.R. -Jordan (ASIA) 31-May-1989 12-Nov-1993 3.9 3.0 3.3 3.9 4.1 3.9 3.3 3.3 11.6 23.3 31.4 28.9 27.8 18.2 -Kenya (AFR) 9-Nov-1988 27-Sep-1994 2.8 3.9 4.1 5.5 5.8 12.3 13.3 16.2 19.8 22.2 23.1 24.2 25.7 26.9 -Kiribati (ASIA) 7-Jan-1993 9-Aug-2004 0.0 - 0.0 0.0 0.0 0.1 0.1 0.1 0.0 0.0 0.0 0.0 0.0 0.0 -Kuwait (ASIA) 23-Nov-1992 22-Jul-1994 81.9 - - 53.8 95.3 142.8 130.5 147.3 146.4 175.2 162.5 166.7 203.2 252.8 -Kyrgyzstan (ASIA) 31-May-2000 13-May-2003 0.1 0.1 0.2 0.1 0.1 0.1 0.1 0.2 0.1 0.2 0.2 0.2 0.5 0.7 -Lao People's Democratic Republic (ASIA) 21-Aug-1998 0.3 0.4 - - - - 0.0 0.6 0.6 0.6 0.8 0.6 0.6 0.0 -Lebanon (ASIA) 31-Mar-1993 31-Mar-1993 11.0 - 19.0 0.0 18.9 18.8 16.4 15.8 14.9 15.2 17.1 21.8 20.1 19.0 -Lesotho (AFR) 25-Mar-1994 0.2 - - 0.2 0.2 0.2 0.0 0.0 0.0 0.0 0.9 1.0 0.9 0.9 -Liberia (AFR) 15-Jan-1996 15-Jan-1996 1.1 1.6 1.9 1.7 2.5 2.0 2.1 1.1 1.9 1.3 0.8 1.7 1.5 1.3 -Libyan Arab Jamahiriya (AFR) 11-Jul-1990 12-Jul-2001 2.2 0.0 0.0 0.0 - - 0.0 0.6 0.6 0.6 0.6 0.6 3.0 12.0 -Madagascar (AFR) 7-Nov-1996 16-Jan-2002 1.1 - - - 0.0 0.0 7.7 0.0 0.0 1.1 0.6 0.6 0.6 2.6 -Malawi (AFR) 9-Jan-1991 8-Feb-1994 0.4 1.8 2.7 1.7 0.5 0.6 1.9 1.4 1.1 1.0 1.0 1.0 1.1 0.7 -Malaysia (ASIA) 29-Aug-1989 16-Jun-1993 71.3 99.5 90.8 162.4 216.9 186.9 234.2 269.5 256.3 330.9 320.6 339.1 324.8 333.7 -Maldives (ASIA) 16-May-1989 31-Jul-1991 0.0 0.0 0.0 0.0 0.0 0.0 0.0 0.0 0.0 0.0 1.7 1.2 2.0 2.2 -Mali (AFR) 28-Oct-1994 28-Oct-1994 1.6 0.0 0.0 0.0 2.2 2.3 4.1 3.9 1.9 1.0 1.3 2.3 2.4 2.5 -Marshall Islands (ASIA) 11-Mar-1993 11-Mar-1993 0.1 - 0.1 0.1 0.1 0.1 0.1 0.1 0.1 0.1 0.1 0.1 0.1 0.1 -Mauritania (AFR) 26-May-1994 22-Jul-2005 0.0 - - 0.0 0.0 0.0 0.0 0.0 0.0 1.4 1.6 1.8 0.0 - -Mauritius (AFR) 18-Aug-1992 20-Oct-1992 0.0 - 5.1 1.2 3.6 1.1 2.9 6.3 5.1 8.4 5.5 7.1 12.3 12.3 -Mexico (LAC) 31-Mar-1988 11-Oct-1991 137.0 318.0 325.8 310.4 312.5 347.0 432.3 474.2 1,134.3 1,860.2 1,172.4 792.4 728.3 1,317.8 -Micronesia (Federated States of) (ASIA) 6-Sep-1995 27-Nov-2001 0.3 - - - 0.0 0.0 0.0 0.0 0.0 0.0 0.3 0.3 0.3 0.4 -Mongolia (ASIA) 7-Mar-1996 7-Mar-1996 0.3 - - - 0.3 0.4 0.2 0.2 0.3 0.2 0.6 0.4 0.5 0.4 -Morocco (AFR) 28-Dec-1995 28-Dec-1995 0.0 - - 0.0 0.0 0.0 18.7 18.1 20.5 21.2 21.2 1.9 5.4 40.7 -Mozambique (AFR) 9-Sep-1994 9-Sep-1994 2.0 - - 1.4 1.4 0.1 1.5 0.1 1.9 0.5 0.5 0.0 0.4 N.R. -Myanmar (ASIA) 24-Nov-1993 24-Nov-1993 0.0 0.2 - 1.3 1.6 3.6 2.6 3.0 0.9 0.3 0.0 2.2 2.1 3.4 -Namibia (AFR) 20-Sep-1993 6-Nov-1997 0.5 - 0.0 4.2 4.5 6.7 6.7 7.6 7.6 0.0 0.0 0.0 0.0 0.0 -
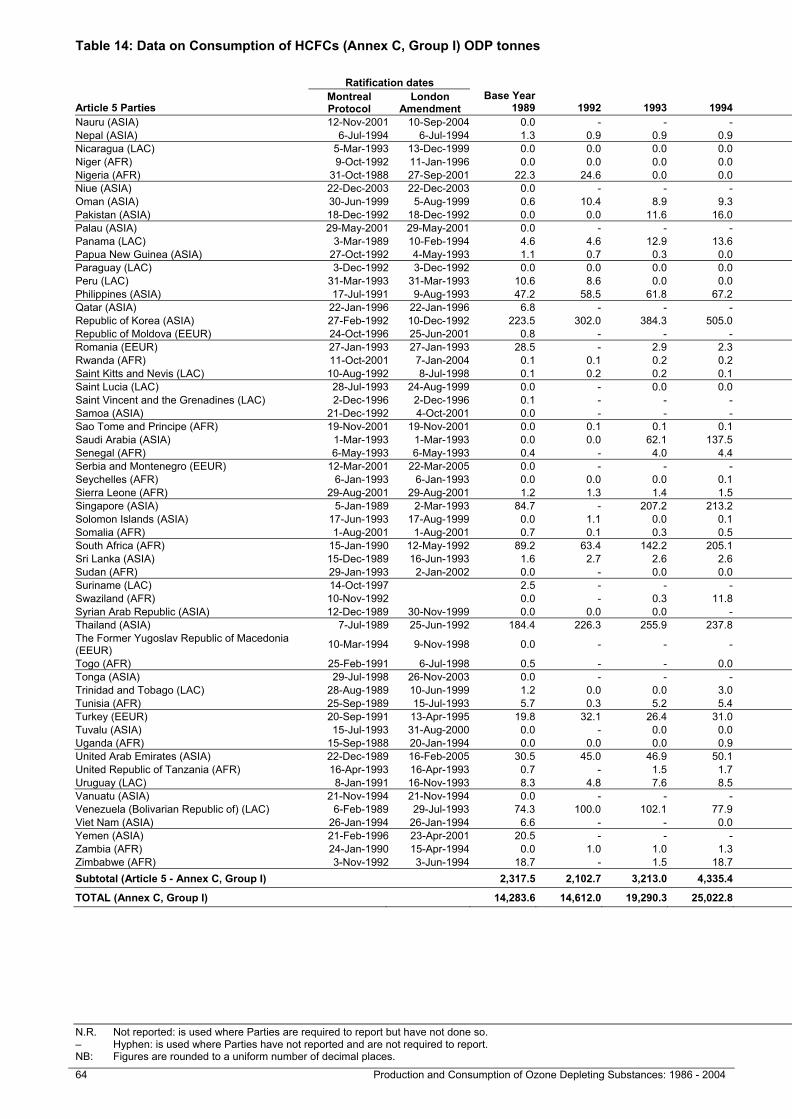
Table 14: Data on Consumption of HCFCs (Annex C, Group I) ODP tonnes Table 14: Data on Consumption of HCFCs (Annex C, Group I) ODP tonnes
N.R. Not reported: is used where Parties are required to report but have not done so. AFR = Africa ASIA = Asia EEUR = Eastern Europe CEIT = Country with Economy in Transition – Hyphen: is used where Parties have not reported and are not required to report. LAC = Latin America and the Caribbean WEUR = Western Europe and Others EC = Member of the European Community NB: Figures are rounded to a uniform number of decimal places.
64 Production and Consumption of Ozone Depleting Substances: 1986 - 2004 Production and Consumption of Ozone Depleting Substances: 1986 – 2004 65
Ratification dates
Article 5 Parties Montreal Protocol
London Amendment
Base Year 1989 1992 1993 1994 1995 1996 1997 1998 1999 2000 2001 2002 2003 2004
Baselevel
Nauru (ASIA) 12-Nov-2001 10-Sep-2004 0.0 - - - 0.0 0.0 0.0 0.0 0.0 0.0 0.0 0.0 0.0 N.R. -Nepal (ASIA) 6-Jul-1994 6-Jul-1994 1.3 0.9 0.9 0.9 1.0 1.2 1.3 1.3 1.3 4.3 1.7 1.7 0.0 0.0 -Nicaragua (LAC) 5-Mar-1993 13-Dec-1999 0.0 0.0 0.0 0.0 1.1 2.1 3.0 3.7 3.4 0.0 2.0 1.8 2.3 2.2 -Niger (AFR) 9-Oct-1992 11-Jan-1996 0.0 0.0 0.0 0.0 0.0 0.0 1.7 1.6 1.5 1.0 1.0 1.0 0.9 0.0 -Nigeria (AFR) 31-Oct-1988 27-Sep-2001 22.3 24.6 0.0 0.0 0.0 13.3 28.4 47.0 47.6 48.0 56.2 60.7 66.2 66.8 -Niue (ASIA) 22-Dec-2003 22-Dec-2003 0.0 - - - 0.0 0.0 0.0 0.0 0.0 0.0 - - 0.0 0.0 -Oman (ASIA) 30-Jun-1999 5-Aug-1999 0.6 10.4 8.9 9.3 16.7 16.8 15.5 18.0 18.7 22.7 15.4 15.8 16.9 20.0 -Pakistan (ASIA) 18-Dec-1992 18-Dec-1992 0.0 0.0 11.6 16.0 18.5 13.5 15.2 26.6 34.5 34.5 34.5 46.3 58.2 14.0 -Palau (ASIA) 29-May-2001 29-May-2001 0.0 - - - - - - 78.3 113.7 70.1 70.1 0.1 0.1 0.1 -Panama (LAC) 3-Mar-1989 10-Feb-1994 4.6 4.6 12.9 13.6 0.4 0.4 12.7 15.3 12.5 11.1 12.3 9.4 16.2 17.8 -Papua New Guinea (ASIA) 27-Oct-1992 4-May-1993 1.1 0.7 0.3 0.0 2.4 1.7 2.6 4.8 2.2 3.9 2.1 3.8 3.6 3.8 -Paraguay (LAC) 3-Dec-1992 3-Dec-1992 0.0 0.0 0.0 0.0 0.0 0.0 3.6 0.0 23.2 21.0 21.0 5.7 6.7 2.7 -Peru (LAC) 31-Mar-1993 31-Mar-1993 10.6 8.6 0.0 0.0 11.2 4.4 11.4 0.8 0.5 8.7 0.0 7.0 12.7 14.9 -Philippines (ASIA) 17-Jul-1991 9-Aug-1993 47.2 58.5 61.8 67.2 100.0 137.2 121.3 124.8 131.3 159.1 130.1 142.8 191.1 171.1 -Qatar (ASIA) 22-Jan-1996 22-Jan-1996 6.8 - - - 3.2 0.5 6.4 10.6 5.0 5.0 4.8 5.1 12.5 12.7 -Republic of Korea (ASIA) 27-Feb-1992 10-Dec-1992 223.5 302.0 384.3 505.0 652.5 1,035.8 1,160.2 749.9 1,248.0 1,318.2 1,143.5 1,637.8 1,573.6 1,607.5 -Republic of Moldova (EEUR) 24-Oct-1996 25-Jun-2001 0.8 - - - - 0.2 0.0 0.0 0.0 0.0 0.0 0.0 0.0 1.5 -Romania (EEUR) 27-Jan-1993 27-Jan-1993 28.5 - 2.9 2.3 13.1 6.2 12.5 34.9 31.5 26.7 11.0 18.1 20.5 20.8 -Rwanda (AFR) 11-Oct-2001 7-Jan-2004 0.1 0.1 0.2 0.2 0.2 0.2 0.2 0.2 0.3 0.3 0.3 0.3 0.3 0.3 -Saint Kitts and Nevis (LAC) 10-Aug-1992 8-Jul-1998 0.1 0.2 0.2 0.1 0.2 0.2 0.1 0.1 0.1 0.5 0.6 0.7 0.4 0.5 -Saint Lucia (LAC) 28-Jul-1993 24-Aug-1999 0.0 - 0.0 0.0 0.0 0.3 0.3 0.5 0.6 0.8 0.3 0.1 0.0 0.1 -Saint Vincent and the Grenadines (LAC) 2-Dec-1996 2-Dec-1996 0.1 - - - 0.2 0.0 0.1 0.2 0.5 0.0 0.0 0.4 0.3 0.8 -Samoa (ASIA) 21-Dec-1992 4-Oct-2001 0.0 - - - 0.0 0.0 0.0 0.1 0.3 0.1 0.3 0.4 0.2 N.R. -Sao Tome and Principe (AFR) 19-Nov-2001 19-Nov-2001 0.0 0.1 0.1 0.1 0.0 0.1 0.1 0.1 0.1 0.1 0.1 0.1 0.1 0.1 -Saudi Arabia (ASIA) 1-Mar-1993 1-Mar-1993 0.0 0.0 62.1 137.5 13.8 23.2 29.8 34.9 119.3 110.6 143.7 138.4 176.0 N.R. -Senegal (AFR) 6-May-1993 6-May-1993 0.4 - 4.0 4.4 10.7 10.0 6.6 8.7 0.0 11.8 7.6 10.4 8.5 9.4 -Serbia and Montenegro (EEUR) 12-Mar-2001 22-Mar-2005 0.0 - - - - - - - - 5.2 6.6 6.6 0.0 14.6 -Seychelles (AFR) 6-Jan-1993 6-Jan-1993 0.0 0.0 0.0 0.1 0.1 0.2 0.5 0.7 0.5 0.1 0.1 164.6 0.5 0.5 -Sierra Leone (AFR) 29-Aug-2001 29-Aug-2001 1.2 1.3 1.4 1.5 1.5 2.1 2.2 1.9 1.8 1.6 1.9 2.2 2.0 1.6 -Singapore (ASIA) 5-Jan-1989 2-Mar-1993 84.7 - 207.2 213.2 197.6 128.2 143.1 105.2 209.1 148.3 134.4 124.1 188.6 192.3 -Solomon Islands (ASIA) 17-Jun-1993 17-Aug-1999 0.0 1.1 0.0 0.1 0.3 0.2 0.0 0.3 0.5 0.5 0.5 5.2 0.2 0.4 -Somalia (AFR) 1-Aug-2001 1-Aug-2001 0.7 0.1 0.3 0.5 0.4 0.4 0.5 0.5 0.6 0.8 0.9 1.1 1.2 1.5 -South Africa (AFR) 15-Jan-1990 12-May-1992 89.2 63.4 142.2 205.1 152.5 194.3 256.9 260.8 269.7 134.7 111.1 168.4 253.7 173.1 -Sri Lanka (ASIA) 15-Dec-1989 16-Jun-1993 1.6 2.7 2.6 2.6 7.8 12.8 15.8 11.1 6.1 6.6 5.9 8.8 7.0 14.2 -Sudan (AFR) 29-Jan-1993 2-Jan-2002 0.0 - 0.0 0.0 0.0 0.0 0.0 0.0 0.0 0.0 0.0 0.0 0.0 0.0 -Suriname (LAC) 14-Oct-1997 2.5 - - - 5.0 5.0 5.0 5.0 5.0 5.0 5.0 5.0 0.1 0.4 -Swaziland (AFR) 10-Nov-1992 0.0 - 0.3 11.8 0.2 0.9 0.8 0.9 0.8 0.5 0.3 0.5 0.3 0.4 -Syrian Arab Republic (ASIA) 12-Dec-1989 30-Nov-1999 0.0 0.0 0.0 - 17.3 16.5 11.6 14.4 25.9 20.0 30.8 10.8 34.6 44.7 -Thailand (ASIA) 7-Jul-1989 25-Jun-1992 184.4 226.3 255.9 237.8 340.7 479.1 546.4 507.5 636.8 791.0 997.7 961.8 1,114.7 988.8 -The Former Yugoslav Republic of Macedonia (EEUR) 10-Mar-1994 9-Nov-1998 0.0 - - - 1.5 2.4 1.8 3.6 1.2 5.0 10.4 3.9 6.0 4.8 -
Togo (AFR) 25-Feb-1991 6-Jul-1998 0.5 - - 0.0 0.0 0.0 0.0 0.0 0.0 3.5 3.2 0.0 4.0 3.7 -Tonga (ASIA) 29-Jul-1998 26-Nov-2003 0.0 - - - 0.0 0.2 0.2 0.0 0.0 0.0 0.1 0.2 0.0 0.1 -Trinidad and Tobago (LAC) 28-Aug-1989 10-Jun-1999 1.2 0.0 0.0 3.0 4.1 6.7 6.9 7.9 10.4 7.0 10.3 28.2 11.5 19.7 -Tunisia (AFR) 25-Sep-1989 15-Jul-1993 5.7 0.3 5.2 5.4 4.1 7.2 9.1 12.4 12.2 16.6 28.6 29.8 24.5 31.9 -Turkey (EEUR) 20-Sep-1991 13-Apr-1995 19.8 32.1 26.4 31.0 61.1 58.8 93.7 143.1 171.2 339.8 205.5 275.2 357.6 493.7 -Tuvalu (ASIA) 15-Jul-1993 31-Aug-2000 0.0 - 0.0 0.0 0.0 0.0 0.0 0.0 0.0 0.0 0.0 0.0 0.0 0.0 -Uganda (AFR) 15-Sep-1988 20-Jan-1994 0.0 0.0 0.0 0.9 0.9 1.1 0.0 1.2 1.4 1.5 1.6 1.7 0.2 0.1 -United Arab Emirates (ASIA) 22-Dec-1989 16-Feb-2005 30.5 45.0 46.9 50.1 55.8 61.2 86.2 68.1 92.8 105.4 174.7 219.2 264.7 327.4 -United Republic of Tanzania (AFR) 16-Apr-1993 16-Apr-1993 0.7 - 1.5 1.7 2.2 2.3 0.4 0.0 0.0 0.0 0.0 0.0 0.0 0.0 -Uruguay (LAC) 8-Jan-1991 16-Nov-1993 8.3 4.8 7.6 8.5 2.3 11.9 13.6 13.3 9.8 10.1 11.6 7.6 9.0 13.0 -Vanuatu (ASIA) 21-Nov-1994 21-Nov-1994 0.0 - - - 0.0 0.0 0.0 0.0 0.0 0.0 0.0 0.0 0.0 0.0 -Venezuela (Bolivarian Republic of) (LAC) 6-Feb-1989 29-Jul-1993 74.3 100.0 102.1 77.9 93.5 75.4 112.1 66.7 69.5 192.2 242.4 98.5 75.3 229.6 -Viet Nam (ASIA) 26-Jan-1994 26-Jan-1994 6.6 - - 0.0 44.4 39.7 42.6 45.4 37.4 36.5 59.7 66.1 104.5 120.7 -Yemen (ASIA) 21-Feb-1996 23-Apr-2001 20.5 - - - 34.0 35.2 37.1 38.3 38.9 40.1 47.0 50.1 53.5 62.7 -Zambia (AFR) 24-Jan-1990 15-Apr-1994 0.0 1.0 1.0 1.3 0.7 0.8 0.8 0.9 1.0 1.0 0.5 0.8 0.8 0.8 -Zimbabwe (AFR) 3-Nov-1992 3-Jun-1994 18.7 - 1.5 18.7 19.0 20.5 3.3 6.8 0.1 8.1 15.4 4.1 3.4 3.6 -Subtotal (Article 5 - Annex C, Group I) 2,317.5 2,102.7 3,213.0 4,335.4 4,110.1 4,948.9 6,235.1 5,802.1 9,868.7 13,021.4 12,442.0 13,424.3 15,856.8 19,578.6 -
TOTAL (Annex C, Group I) 14,283.6 14,612.0 19,290.3 25,022.8 32,880.6 29,175.7 30,302.9 33,546.6 37,231.5 38,217.0 35,793.7 35,735.6 30,639.7 29,802.3 36,845.4
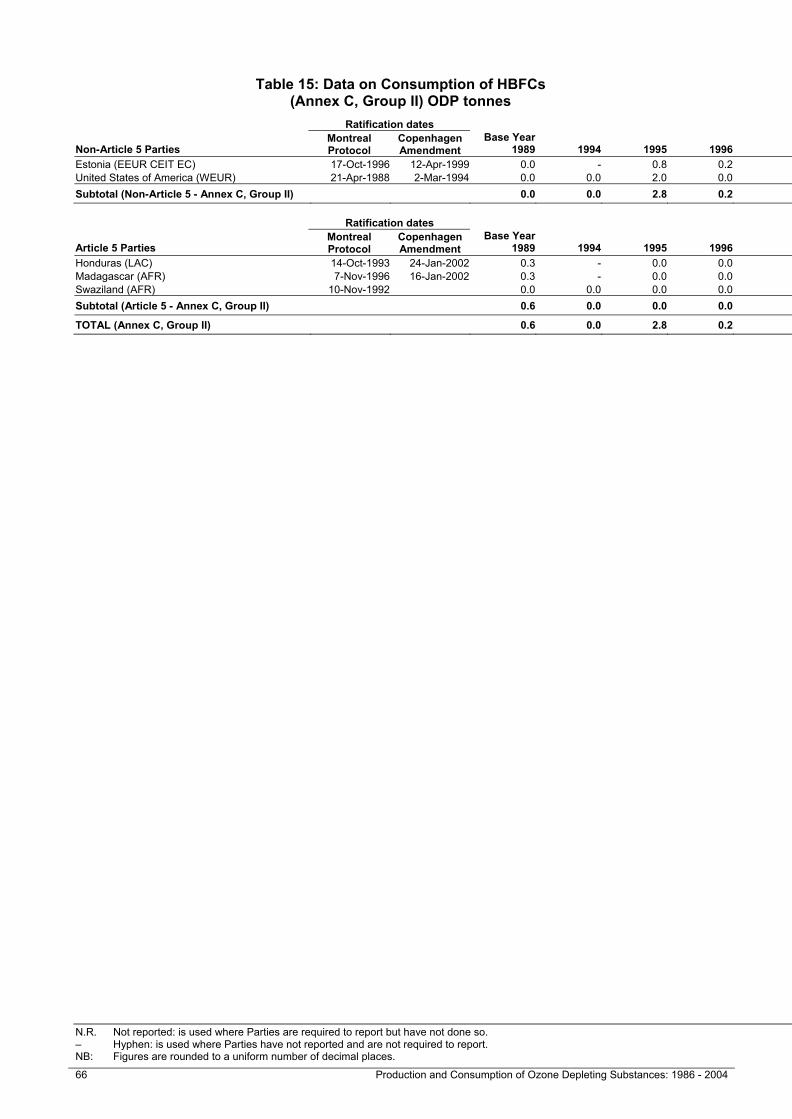
Table 15: Data on Consumption of HBFCs (Annex C, Group II) ODP tonnes
N.R. Not reported: is used where Parties are required to report but have not done so. AFR = Africa ASIA = Asia EEUR = Eastern Europe CEIT = Country with Economy in Transition – Hyphen: is used where Parties have not reported and are not required to report. LAC = Latin America and the Caribbean WEUR = Western Europe and Others EC = Member of the European Community NB: Figures are rounded to a uniform number of decimal places.
66 Production and Consumption of Ozone Depleting Substances: 1986 - 2004 Production and Consumption of Ozone Depleting Substances: 1986 – 2004 67
Table 15: Data on Consumption of HBFCs (Annex C, Group II) ODP tonnes
Ratification dates
Non-Article 5 Parties Montreal Protocol
Copenhagen Amendment
Base Year 1989 1994 1995 1996 1997 1998 1999 2000 2001 2002 2003 2004
Estonia (EEUR CEIT EC) 17-Oct-1996 12-Apr-1999 0.0 - 0.8 0.2 0.0 0.0 0.0 0.0 0.0 0.0 0.0United States of America (WEUR) 21-Apr-1988 2-Mar-1994 0.0 0.0 2.0 0.0 0.0 0.0 0.0 0.0 0.0 0.7 0.0 0.0Subtotal (Non-Article 5 - Annex C, Group II) 0.0 0.0 2.8 0.2 0.0 0.0 0.0 0.0 0.0 0.7 0.0 0.0
Ratification dates
Article 5 Parties Montreal Protocol
Copenhagen Amendment
Base Year 1989 1994 1995 1996 1997 1998 1999 2000 2001 2002 2003 2004
Honduras (LAC) 14-Oct-1993 24-Jan-2002 0.3 - 0.0 0.0 0.0 0.0 0.0 0.0 0.0 0.0 0.0 0.0Madagascar (AFR) 7-Nov-1996 16-Jan-2002 0.3 - 0.0 0.0 0.0 0.0 0.0 0.0 0.0 0.0 0.0 0.0Swaziland (AFR) 10-Nov-1992 0.0 0.0 0.0 0.0 0.0 0.0 0.0 0.3 0.0 0.0 0.0 0.0Subtotal (Article 5 - Annex C, Group II) 0.6 0.0 0.0 0.0 0.0 0.0 0.0 0.3 0.0 0.0 0.0 0.0
TOTAL (Annex C, Group II) 0.6 0.0 2.8 0.2 0.0 0.0 0.0 0.3 0.0 0.7 0.0 0.0
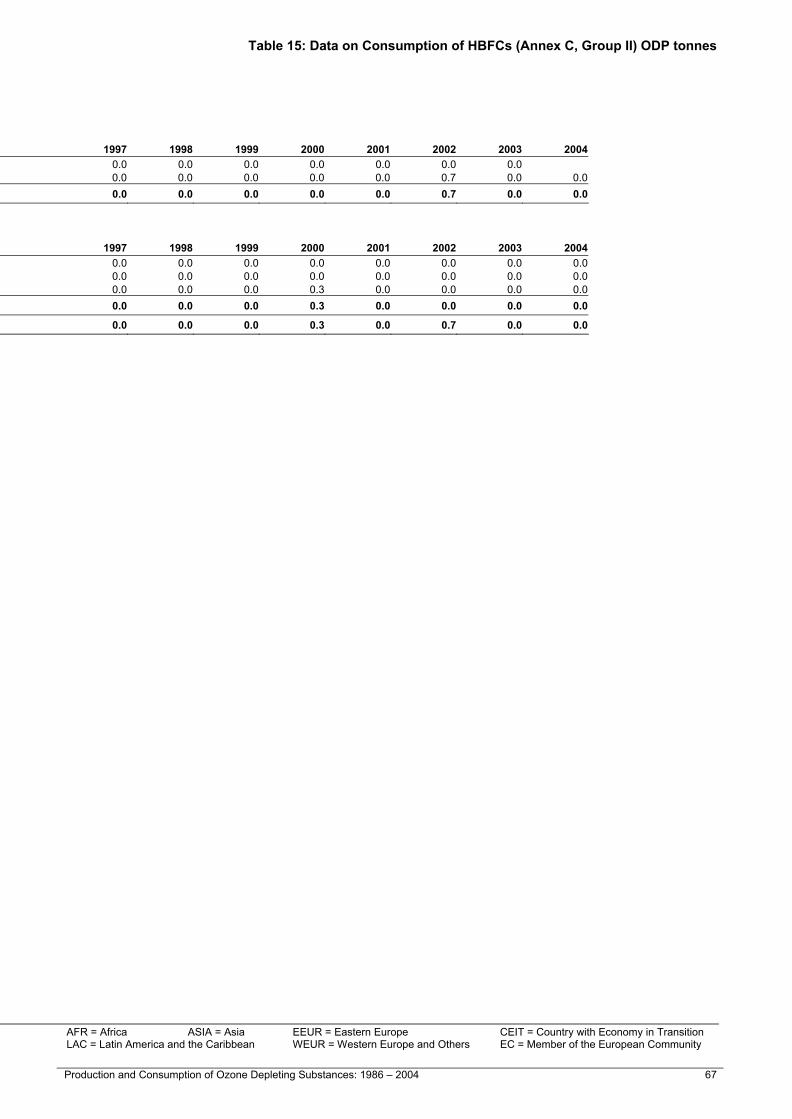
Table 15: Data on Consumption of HBFCs (Annex C, Group II) ODP tonnes
N.R. Not reported: is used where Parties are required to report but have not done so. AFR = Africa ASIA = Asia EEUR = Eastern Europe CEIT = Country with Economy in Transition – Hyphen: is used where Parties have not reported and are not required to report. LAC = Latin America and the Caribbean WEUR = Western Europe and Others EC = Member of the European Community NB: Figures are rounded to a uniform number of decimal places.
66 Production and Consumption of Ozone Depleting Substances: 1986 - 2004 Production and Consumption of Ozone Depleting Substances: 1986 – 2004 67
Table 15: Data on Consumption of HBFCs (Annex C, Group II) ODP tonnes
Ratification dates
Non-Article 5 Parties Montreal Protocol
Copenhagen Amendment
Base Year 1989 1994 1995 1996 1997 1998 1999 2000 2001 2002 2003 2004
Estonia (EEUR CEIT EC) 17-Oct-1996 12-Apr-1999 0.0 - 0.8 0.2 0.0 0.0 0.0 0.0 0.0 0.0 0.0United States of America (WEUR) 21-Apr-1988 2-Mar-1994 0.0 0.0 2.0 0.0 0.0 0.0 0.0 0.0 0.0 0.7 0.0 0.0Subtotal (Non-Article 5 - Annex C, Group II) 0.0 0.0 2.8 0.2 0.0 0.0 0.0 0.0 0.0 0.7 0.0 0.0
Ratification dates
Article 5 Parties Montreal Protocol
Copenhagen Amendment
Base Year 1989 1994 1995 1996 1997 1998 1999 2000 2001 2002 2003 2004
Honduras (LAC) 14-Oct-1993 24-Jan-2002 0.3 - 0.0 0.0 0.0 0.0 0.0 0.0 0.0 0.0 0.0 0.0Madagascar (AFR) 7-Nov-1996 16-Jan-2002 0.3 - 0.0 0.0 0.0 0.0 0.0 0.0 0.0 0.0 0.0 0.0Swaziland (AFR) 10-Nov-1992 0.0 0.0 0.0 0.0 0.0 0.0 0.0 0.3 0.0 0.0 0.0 0.0Subtotal (Article 5 - Annex C, Group II) 0.6 0.0 0.0 0.0 0.0 0.0 0.0 0.3 0.0 0.0 0.0 0.0
TOTAL (Annex C, Group II) 0.6 0.0 2.8 0.2 0.0 0.0 0.0 0.3 0.0 0.7 0.0 0.0
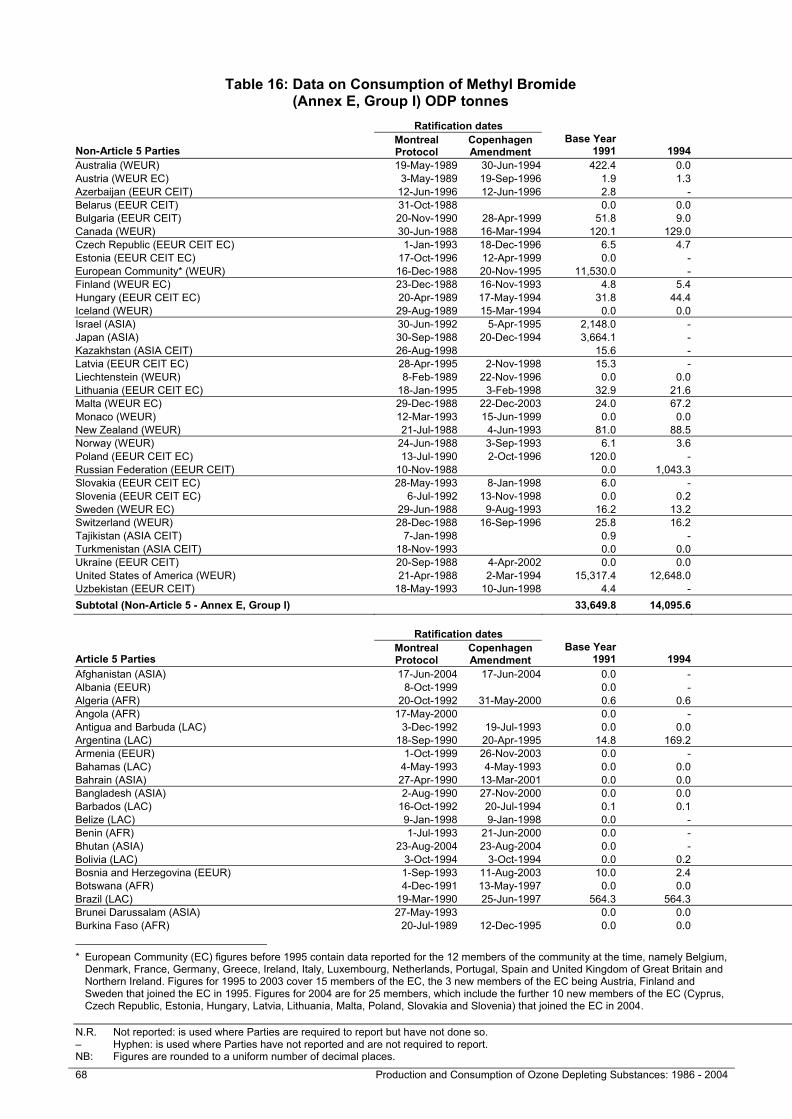
Table 16: Data on Consumption of Methyl Bromide (Annex E, Group I) ODP tonnes
N.R. Not reported: is used where Parties are required to report but have not done so. AFR = Africa ASIA = Asia EEUR = Eastern Europe CEIT = Country with Economy in Transition – Hyphen: is used where Parties have not reported and are not required to report. LAC = Latin America and the Caribbean WEUR = Western Europe and Others EC = Member of the European Community NB: Figures are rounded to a uniform number of decimal places.
68 Production and Consumption of Ozone Depleting Substances: 1986 - 2004 Production and Consumption of Ozone Depleting Substances: 1986 – 2004 69
Table 16: Data on Consumption of Methyl Bromide (Annex E, Group I) ODP tonnes
Ratification dates
Non-Article 5 Parties Montreal Protocol
Copenhagen Amendment
Base Year 1991 1994 1995 1996 1997 1998 1999 2000 2001 2002 2003 2004
Baselevel
Australia (WEUR) 19-May-1989 30-Jun-1994 422.4 0.0 297.8 378.5 196.2 341.7 303.9 270.7 200.5 193.8 109.4 124.1 422.4Austria (WEUR EC) 3-May-1989 19-Sep-1996 1.9 1.3 1.9Azerbaijan (EEUR CEIT) 12-Jun-1996 12-Jun-1996 2.8 - - 0.0 0.0 0.0 0.0 0.0 0.0 0.0 0.0 0.0 2.8Belarus (EEUR CEIT) 31-Oct-1988 0.0 0.0 15.5 37.3 16.0 0.0 0.0 0.0 0.0 0.0 0.0 0.0 0.0Bulgaria (EEUR CEIT) 20-Nov-1990 28-Apr-1999 51.8 9.0 7.2 0.0 0.0 39.0 36.0 13.2 16.2 16.2 4.2 0.0 51.8Canada (WEUR) 30-Jun-1988 16-Mar-1994 120.1 129.0 75.0 79.6 86.4 67.4 74.0 76.9 52.1 57.8 34.9 34.6 120.1Czech Republic (EEUR CEIT EC) 1-Jan-1993 18-Dec-1996 6.5 4.7 11.2 0.0 0.0 0.0 2.2 0.0 0.0 0.0 0.0 6.5Estonia (EEUR CEIT EC) 17-Oct-1996 12-Apr-1999 0.0 - 0.0 0.0 0.0 0.0 0.0 0.0 0.0 0.0 0.0 0.0European Community* (WEUR) 16-Dec-1988 20-Nov-1995 11,530.0 - 10,557.0 10,907.0 10,062.0 7,055.5 7,531.8 6,138.6 4,573.2 4,183.8 2,952.6 2,873.3 11,530.0Finland (WEUR EC) 23-Dec-1988 16-Nov-1993 4.8 5.4 4.8Hungary (EEUR CEIT EC) 20-Apr-1989 17-May-1994 31.8 44.4 31.8 31.8 31.8 31.8 24.0 24.0 15.9 15.9 9.5 31.8Iceland (WEUR) 29-Aug-1989 15-Mar-1994 0.0 0.0 0.0 0.0 0.0 0.0 0.0 0.0 0.0 0.0 0.0 0.0 0.0Israel (ASIA) 30-Jun-1992 5-Apr-1995 2,148.0 - -559.8 -1,164.0 2,002.2 2,216.4 1,487.4 1,573.8 1,032.8 1,124.4 595.2 642.6 2,148.0Japan (ASIA) 30-Sep-1988 20-Dec-1994 3,664.1 - 3,582.6 3,156.6 3,318.0 3,112.2 2,746.2 2,563.8 1,711.2 1,769.7 857.8 1,019.0 3,664.1Kazakhstan (ASIA CEIT) 26-Aug-1998 15.6 - - 2.1 1.2 18.0 13.2 16.9 0.0 0.0 0.0 0.0 15.6Latvia (EEUR CEIT EC) 28-Apr-1995 2-Nov-1998 15.3 - 12.0 15.0 0.0 9.0 0.0 0.5 8.8 0.0 0.0 15.3Liechtenstein (WEUR) 8-Feb-1989 22-Nov-1996 0.0 0.0 0.0 0.0 0.0 0.0 0.0 0.0 0.0 0.0 0.0 N.R. 0.0Lithuania (EEUR CEIT EC) 18-Jan-1995 3-Feb-1998 32.9 21.6 31.4 27.4 0.0 0.0 0.0 9.6 6.0 6.0 6.0 32.9Malta (WEUR EC) 29-Dec-1988 22-Dec-2003 24.0 67.2 37.2 23.4 16.1 21.3 24.0 18.0 16.2 23.3 24.0 24.0Monaco (WEUR) 12-Mar-1993 15-Jun-1999 0.0 0.0 0.0 0.0 0.0 0.0 0.0 0.0 0.0 0.0 0.0 0.0 0.0New Zealand (WEUR) 21-Jul-1988 4-Jun-1993 81.0 88.5 77.1 58.5 61.0 21.0 42.7 43.8 10.8 26.3 20.9 16.5 81.0Norway (WEUR) 24-Jun-1988 3-Sep-1993 6.1 3.6 5.4 5.8 3.5 3.6 4.5 2.7 2.3 2.3 1.3 1.4 6.1Poland (EEUR CEIT EC) 13-Jul-1990 2-Oct-1996 120.0 - - 61.9 20.4 34.5 53.9 38.8 53.0 52.9 36.0 120.0Russian Federation (EEUR CEIT) 10-Nov-1988 0.0 1,043.3 1,430.3 95.5 0.0 0.0 0.0 0.0 0.0 0.0 0.0 - 0.0Slovakia (EEUR CEIT EC) 28-May-1993 8-Jan-1998 6.0 - 0.0 - 5.7 6.1 0.0 0.0 0.0 0.0 0.0 6.0Slovenia (EEUR CEIT EC) 6-Jul-1992 13-Nov-1998 0.0 0.2 0.6 0.0 0.0 0.0 0.0 0.0 0.0 0.0 0.0 0.0Sweden (WEUR EC) 29-Jun-1988 9-Aug-1993 16.2 13.2 16.2Switzerland (WEUR) 28-Dec-1988 16-Sep-1996 25.8 16.2 14.4 13.0 10.2 11.7 7.6 15.5 12.0 12.0 6.3 7.4 25.8Tajikistan (ASIA CEIT) 7-Jan-1998 0.9 - 0.0 2.1 1.6 1.9 0.0 0.0 0.0 0.0 0.0 0.0 0.9Turkmenistan (ASIA CEIT) 18-Nov-1993 0.0 0.0 0.0 0.0 0.0 0.0 0.0 0.0 0.0 0.0 0.0 0.0 0.0Ukraine (EEUR CEIT) 20-Sep-1988 4-Apr-2002 0.0 0.0 390.0 -451.2 0.0 0.0 245.4 0.0 0.0 0.0 0.0 0.0 0.0United States of America (WEUR) 21-Apr-1988 2-Mar-1994 15,317.4 12,648.0 12,483.6 12,920.4 12,505.2 12,600.6 8,525.0 6,564.3 6,397.8 3,051.0 4,053.0 6,353.3 15,317.4Uzbekistan (EEUR CEIT) 18-May-1993 10-Jun-1998 4.4 - - 0.0 0.0 0.0 0.0 0.0 0.0 0.0 0.0 0.0 4.4Subtotal (Non-Article 5 - Annex E, Group I) 33,649.8 14,095.6 28,500.3 26,200.7 28,337.5 25,591.7 21,121.8 17,371.1 14,108.8 10,535.4 8,711.1 11,072.2 33,649.8
Ratification dates Article 5 Baseline Years
Article 5 Parties Montreal Protocol
Copenhagen Amendment
Base Year 1991 1994 1995 1996 1997 1998 1999 2000 2001 2002 2003 2004
Baselevel
Afghanistan (ASIA) 17-Jun-2004 17-Jun-2004 0.0 - 0.0 0.0 0.0 0.0 - - - - - 0.0 0.0Albania (EEUR) 8-Oct-1999 0.0 - 0.0 0.0 0.0 0.0 0.0 0.0 0.0 0.0 0.0 0.0 0.0Algeria (AFR) 20-Oct-1992 31-May-2000 0.6 0.6 0.6 6.0 6.0 6.0 6.0 0.6 4.2 4.2 4.2 3.6 4.7Angola (AFR) 17-May-2000 0.0 - - - - 0.0 - 0.0 0.0 0.0 0.0 0.0 -Antigua and Barbuda (LAC) 3-Dec-1992 19-Jul-1993 0.0 0.0 0.0 0.0 0.0 0.0 0.0 0.0 0.0 0.0 0.0 0.0 0.0Argentina (LAC) 18-Sep-1990 20-Apr-1995 14.8 169.2 265.8 409.8 465.0 504.6 468.0 465.6 358.8 168.6 353.1 362.5 411.3Armenia (EEUR) 1-Oct-1999 26-Nov-2003 0.0 - 0.0 0.0 0.0 0.0 0.0 0.0 0.0 1.4 0.0 1.0 0.0Bahamas (LAC) 4-May-1993 4-May-1993 0.0 0.0 0.0 0.0 0.0 0.6 0.4 0.5 0.0 0.0 0.0 0.0 0.1Bahrain (ASIA) 27-Apr-1990 13-Mar-2001 0.0 0.0 0.0 0.0 0.0 0.0 0.0 0.0 0.0 0.0 0.0 0.0 0.0Bangladesh (ASIA) 2-Aug-1990 27-Nov-2000 0.0 0.0 0.0 0.0 0.0 0.0 0.0 0.0 0.0 0.0 0.0 0.0 0.0Barbados (LAC) 16-Oct-1992 20-Jul-1994 0.1 0.1 0.1 0.1 0.1 0.1 3.3 0.6 0.0 0.4 0.0 0.0 0.1Belize (LAC) 9-Jan-1998 9-Jan-1998 0.0 - 0.0 0.0 0.0 0.0 0.0 0.0 0.0 0.0 0.0 0.0 0.0Benin (AFR) 1-Jul-1993 21-Jun-2000 0.0 - 0.0 0.0 0.0 0.0 0.0 0.0 0.0 0.0 0.0 0.0 0.0Bhutan (ASIA) 23-Aug-2004 23-Aug-2004 0.0 - 0.0 0.0 0.0 0.0 0.0 0.0 - - - 0.0 0.0Bolivia (LAC) 3-Oct-1994 3-Oct-1994 0.0 0.2 0.3 0.3 0.3 1.5 0.6 0.4 1.5 0.3 0.2 0.0 0.6Bosnia and Herzegovina (EEUR) 1-Sep-1993 11-Aug-2003 10.0 2.4 2.4 3.6 3.9 4.2 6.2 6.2 10.0 11.8 9.8 7.6 3.5Botswana (AFR) 4-Dec-1991 13-May-1997 0.0 0.0 0.0 0.2 0.4 0.0 0.0 0.4 0.6 0.6 0.3 0.0 0.1Brazil (LAC) 19-Mar-1990 25-Jun-1997 564.3 564.3 667.0 844.6 756.6 578.3 275.5 430.7 257.6 238.5 218.6 191.2 711.6Brunei Darussalam (ASIA) 27-May-1993 0.0 0.0 0.0 0.0 0.0 0.0 0.0 0.0 0.0 0.0 0.0 - 0.0Burkina Faso (AFR) 20-Jul-1989 12-Dec-1995 0.0 0.0 0.0 0.0 0.0 0.0 0.0 0.0 0.0 0.0 0.0 0.0 0.0
* European Community (EC) figures before 1995 contain data reported for the 12 members of the community at the time, namely Belgium,
Denmark, France, Germany, Greece, Ireland, Italy, Luxembourg, Netherlands, Portugal, Spain and United Kingdom of Great Britain and Northern Ireland. Figures for 1995 to 2003 cover 15 members of the EC, the 3 new members of the EC being Austria, Finland and Sweden that joined the EC in 1995. Figures for 2004 are for 25 members, which include the further 10 new members of the EC (Cyprus, Czech Republic, Estonia, Hungary, Latvia, Lithuania, Malta, Poland, Slovakia and Slovenia) that joined the EC in 2004.
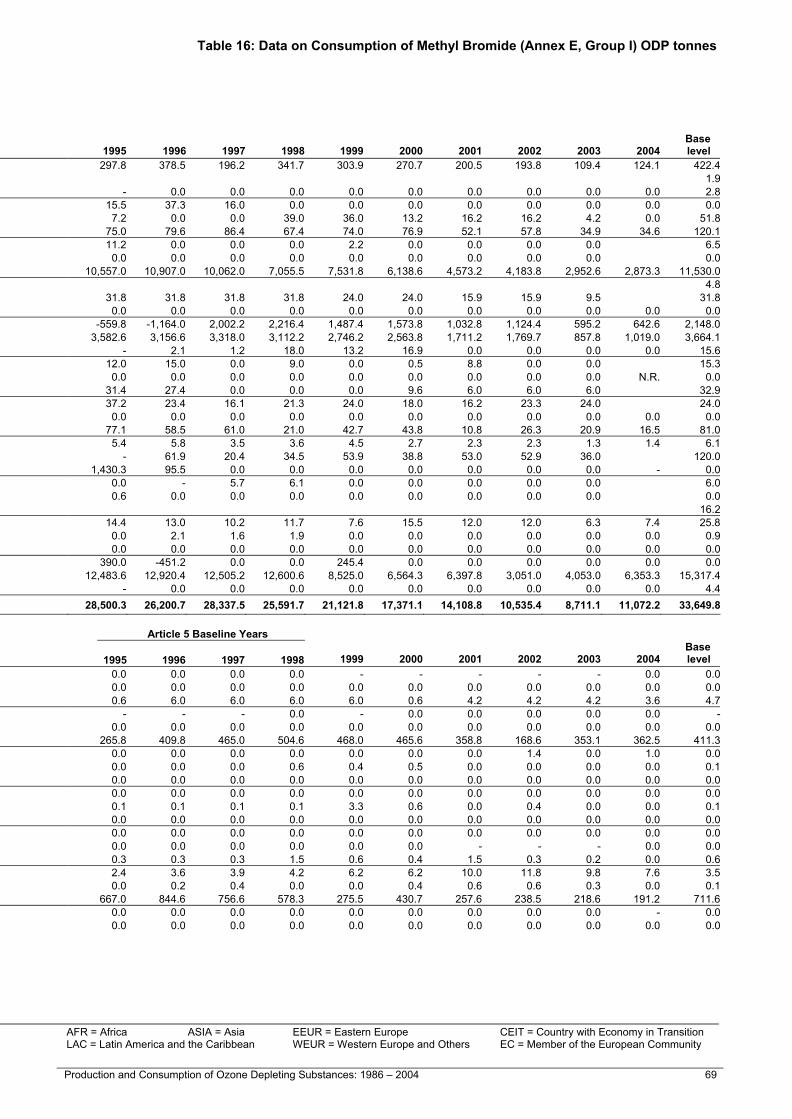
Table 16: Data on Consumption of Methyl Bromide (Annex E, Group I) ODP tonnes
N.R. Not reported: is used where Parties are required to report but have not done so. AFR = Africa ASIA = Asia EEUR = Eastern Europe CEIT = Country with Economy in Transition – Hyphen: is used where Parties have not reported and are not required to report. LAC = Latin America and the Caribbean WEUR = Western Europe and Others EC = Member of the European Community NB: Figures are rounded to a uniform number of decimal places.
68 Production and Consumption of Ozone Depleting Substances: 1986 - 2004 Production and Consumption of Ozone Depleting Substances: 1986 – 2004 69
Table 16: Data on Consumption of Methyl Bromide (Annex E, Group I) ODP tonnes
Ratification dates
Non-Article 5 Parties Montreal Protocol
Copenhagen Amendment
Base Year 1991 1994 1995 1996 1997 1998 1999 2000 2001 2002 2003 2004
Baselevel
Australia (WEUR) 19-May-1989 30-Jun-1994 422.4 0.0 297.8 378.5 196.2 341.7 303.9 270.7 200.5 193.8 109.4 124.1 422.4Austria (WEUR EC) 3-May-1989 19-Sep-1996 1.9 1.3 1.9Azerbaijan (EEUR CEIT) 12-Jun-1996 12-Jun-1996 2.8 - - 0.0 0.0 0.0 0.0 0.0 0.0 0.0 0.0 0.0 2.8Belarus (EEUR CEIT) 31-Oct-1988 0.0 0.0 15.5 37.3 16.0 0.0 0.0 0.0 0.0 0.0 0.0 0.0 0.0Bulgaria (EEUR CEIT) 20-Nov-1990 28-Apr-1999 51.8 9.0 7.2 0.0 0.0 39.0 36.0 13.2 16.2 16.2 4.2 0.0 51.8Canada (WEUR) 30-Jun-1988 16-Mar-1994 120.1 129.0 75.0 79.6 86.4 67.4 74.0 76.9 52.1 57.8 34.9 34.6 120.1Czech Republic (EEUR CEIT EC) 1-Jan-1993 18-Dec-1996 6.5 4.7 11.2 0.0 0.0 0.0 2.2 0.0 0.0 0.0 0.0 6.5Estonia (EEUR CEIT EC) 17-Oct-1996 12-Apr-1999 0.0 - 0.0 0.0 0.0 0.0 0.0 0.0 0.0 0.0 0.0 0.0European Community* (WEUR) 16-Dec-1988 20-Nov-1995 11,530.0 - 10,557.0 10,907.0 10,062.0 7,055.5 7,531.8 6,138.6 4,573.2 4,183.8 2,952.6 2,873.3 11,530.0Finland (WEUR EC) 23-Dec-1988 16-Nov-1993 4.8 5.4 4.8Hungary (EEUR CEIT EC) 20-Apr-1989 17-May-1994 31.8 44.4 31.8 31.8 31.8 31.8 24.0 24.0 15.9 15.9 9.5 31.8Iceland (WEUR) 29-Aug-1989 15-Mar-1994 0.0 0.0 0.0 0.0 0.0 0.0 0.0 0.0 0.0 0.0 0.0 0.0 0.0Israel (ASIA) 30-Jun-1992 5-Apr-1995 2,148.0 - -559.8 -1,164.0 2,002.2 2,216.4 1,487.4 1,573.8 1,032.8 1,124.4 595.2 642.6 2,148.0Japan (ASIA) 30-Sep-1988 20-Dec-1994 3,664.1 - 3,582.6 3,156.6 3,318.0 3,112.2 2,746.2 2,563.8 1,711.2 1,769.7 857.8 1,019.0 3,664.1Kazakhstan (ASIA CEIT) 26-Aug-1998 15.6 - - 2.1 1.2 18.0 13.2 16.9 0.0 0.0 0.0 0.0 15.6Latvia (EEUR CEIT EC) 28-Apr-1995 2-Nov-1998 15.3 - 12.0 15.0 0.0 9.0 0.0 0.5 8.8 0.0 0.0 15.3Liechtenstein (WEUR) 8-Feb-1989 22-Nov-1996 0.0 0.0 0.0 0.0 0.0 0.0 0.0 0.0 0.0 0.0 0.0 N.R. 0.0Lithuania (EEUR CEIT EC) 18-Jan-1995 3-Feb-1998 32.9 21.6 31.4 27.4 0.0 0.0 0.0 9.6 6.0 6.0 6.0 32.9Malta (WEUR EC) 29-Dec-1988 22-Dec-2003 24.0 67.2 37.2 23.4 16.1 21.3 24.0 18.0 16.2 23.3 24.0 24.0Monaco (WEUR) 12-Mar-1993 15-Jun-1999 0.0 0.0 0.0 0.0 0.0 0.0 0.0 0.0 0.0 0.0 0.0 0.0 0.0New Zealand (WEUR) 21-Jul-1988 4-Jun-1993 81.0 88.5 77.1 58.5 61.0 21.0 42.7 43.8 10.8 26.3 20.9 16.5 81.0Norway (WEUR) 24-Jun-1988 3-Sep-1993 6.1 3.6 5.4 5.8 3.5 3.6 4.5 2.7 2.3 2.3 1.3 1.4 6.1Poland (EEUR CEIT EC) 13-Jul-1990 2-Oct-1996 120.0 - - 61.9 20.4 34.5 53.9 38.8 53.0 52.9 36.0 120.0Russian Federation (EEUR CEIT) 10-Nov-1988 0.0 1,043.3 1,430.3 95.5 0.0 0.0 0.0 0.0 0.0 0.0 0.0 - 0.0Slovakia (EEUR CEIT EC) 28-May-1993 8-Jan-1998 6.0 - 0.0 - 5.7 6.1 0.0 0.0 0.0 0.0 0.0 6.0Slovenia (EEUR CEIT EC) 6-Jul-1992 13-Nov-1998 0.0 0.2 0.6 0.0 0.0 0.0 0.0 0.0 0.0 0.0 0.0 0.0Sweden (WEUR EC) 29-Jun-1988 9-Aug-1993 16.2 13.2 16.2Switzerland (WEUR) 28-Dec-1988 16-Sep-1996 25.8 16.2 14.4 13.0 10.2 11.7 7.6 15.5 12.0 12.0 6.3 7.4 25.8Tajikistan (ASIA CEIT) 7-Jan-1998 0.9 - 0.0 2.1 1.6 1.9 0.0 0.0 0.0 0.0 0.0 0.0 0.9Turkmenistan (ASIA CEIT) 18-Nov-1993 0.0 0.0 0.0 0.0 0.0 0.0 0.0 0.0 0.0 0.0 0.0 0.0 0.0Ukraine (EEUR CEIT) 20-Sep-1988 4-Apr-2002 0.0 0.0 390.0 -451.2 0.0 0.0 245.4 0.0 0.0 0.0 0.0 0.0 0.0United States of America (WEUR) 21-Apr-1988 2-Mar-1994 15,317.4 12,648.0 12,483.6 12,920.4 12,505.2 12,600.6 8,525.0 6,564.3 6,397.8 3,051.0 4,053.0 6,353.3 15,317.4Uzbekistan (EEUR CEIT) 18-May-1993 10-Jun-1998 4.4 - - 0.0 0.0 0.0 0.0 0.0 0.0 0.0 0.0 0.0 4.4Subtotal (Non-Article 5 - Annex E, Group I) 33,649.8 14,095.6 28,500.3 26,200.7 28,337.5 25,591.7 21,121.8 17,371.1 14,108.8 10,535.4 8,711.1 11,072.2 33,649.8
Ratification dates Article 5 Baseline Years
Article 5 Parties Montreal Protocol
Copenhagen Amendment
Base Year 1991 1994 1995 1996 1997 1998 1999 2000 2001 2002 2003 2004
Baselevel
Afghanistan (ASIA) 17-Jun-2004 17-Jun-2004 0.0 - 0.0 0.0 0.0 0.0 - - - - - 0.0 0.0Albania (EEUR) 8-Oct-1999 0.0 - 0.0 0.0 0.0 0.0 0.0 0.0 0.0 0.0 0.0 0.0 0.0Algeria (AFR) 20-Oct-1992 31-May-2000 0.6 0.6 0.6 6.0 6.0 6.0 6.0 0.6 4.2 4.2 4.2 3.6 4.7Angola (AFR) 17-May-2000 0.0 - - - - 0.0 - 0.0 0.0 0.0 0.0 0.0 -Antigua and Barbuda (LAC) 3-Dec-1992 19-Jul-1993 0.0 0.0 0.0 0.0 0.0 0.0 0.0 0.0 0.0 0.0 0.0 0.0 0.0Argentina (LAC) 18-Sep-1990 20-Apr-1995 14.8 169.2 265.8 409.8 465.0 504.6 468.0 465.6 358.8 168.6 353.1 362.5 411.3Armenia (EEUR) 1-Oct-1999 26-Nov-2003 0.0 - 0.0 0.0 0.0 0.0 0.0 0.0 0.0 1.4 0.0 1.0 0.0Bahamas (LAC) 4-May-1993 4-May-1993 0.0 0.0 0.0 0.0 0.0 0.6 0.4 0.5 0.0 0.0 0.0 0.0 0.1Bahrain (ASIA) 27-Apr-1990 13-Mar-2001 0.0 0.0 0.0 0.0 0.0 0.0 0.0 0.0 0.0 0.0 0.0 0.0 0.0Bangladesh (ASIA) 2-Aug-1990 27-Nov-2000 0.0 0.0 0.0 0.0 0.0 0.0 0.0 0.0 0.0 0.0 0.0 0.0 0.0Barbados (LAC) 16-Oct-1992 20-Jul-1994 0.1 0.1 0.1 0.1 0.1 0.1 3.3 0.6 0.0 0.4 0.0 0.0 0.1Belize (LAC) 9-Jan-1998 9-Jan-1998 0.0 - 0.0 0.0 0.0 0.0 0.0 0.0 0.0 0.0 0.0 0.0 0.0Benin (AFR) 1-Jul-1993 21-Jun-2000 0.0 - 0.0 0.0 0.0 0.0 0.0 0.0 0.0 0.0 0.0 0.0 0.0Bhutan (ASIA) 23-Aug-2004 23-Aug-2004 0.0 - 0.0 0.0 0.0 0.0 0.0 0.0 - - - 0.0 0.0Bolivia (LAC) 3-Oct-1994 3-Oct-1994 0.0 0.2 0.3 0.3 0.3 1.5 0.6 0.4 1.5 0.3 0.2 0.0 0.6Bosnia and Herzegovina (EEUR) 1-Sep-1993 11-Aug-2003 10.0 2.4 2.4 3.6 3.9 4.2 6.2 6.2 10.0 11.8 9.8 7.6 3.5Botswana (AFR) 4-Dec-1991 13-May-1997 0.0 0.0 0.0 0.2 0.4 0.0 0.0 0.4 0.6 0.6 0.3 0.0 0.1Brazil (LAC) 19-Mar-1990 25-Jun-1997 564.3 564.3 667.0 844.6 756.6 578.3 275.5 430.7 257.6 238.5 218.6 191.2 711.6Brunei Darussalam (ASIA) 27-May-1993 0.0 0.0 0.0 0.0 0.0 0.0 0.0 0.0 0.0 0.0 0.0 - 0.0Burkina Faso (AFR) 20-Jul-1989 12-Dec-1995 0.0 0.0 0.0 0.0 0.0 0.0 0.0 0.0 0.0 0.0 0.0 0.0 0.0
* European Community (EC) figures before 1995 contain data reported for the 12 members of the community at the time, namely Belgium,
Denmark, France, Germany, Greece, Ireland, Italy, Luxembourg, Netherlands, Portugal, Spain and United Kingdom of Great Britain and Northern Ireland. Figures for 1995 to 2003 cover 15 members of the EC, the 3 new members of the EC being Austria, Finland and Sweden that joined the EC in 1995. Figures for 2004 are for 25 members, which include the further 10 new members of the EC (Cyprus, Czech Republic, Estonia, Hungary, Latvia, Lithuania, Malta, Poland, Slovakia and Slovenia) that joined the EC in 2004.
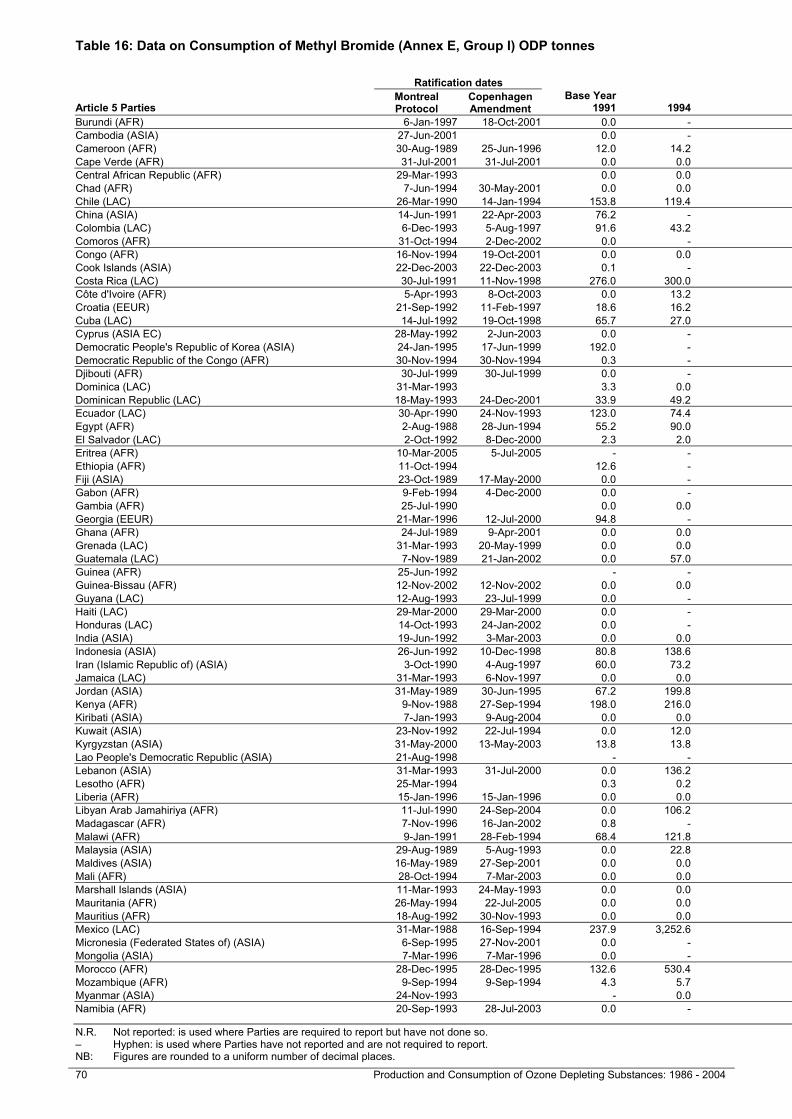
Table 16: Data on Consumption of Methyl Bromide (Annex E, Group I) ODP tonnes Table 16: Data on Consumption of Methyl Bromide (Annex E, Group I) ODP tonnes
N.R. Not reported: is used where Parties are required to report but have not done so. AFR = Africa ASIA = Asia EEUR = Eastern Europe CEIT = Country with Economy in Transition – Hyphen: is used where Parties have not reported and are not required to report. LAC = Latin America and the Caribbean WEUR = Western Europe and Others EC = Member of the European Community NB: Figures are rounded to a uniform number of decimal places.
70 Production and Consumption of Ozone Depleting Substances: 1986 - 2004 Production and Consumption of Ozone Depleting Substances: 1986 – 2004 71
Ratification dates Article 5 Baseline Years
Article 5 Parties Montreal Protocol
Copenhagen Amendment
Base Year 1991 1994 1995 1996 1997 1998 1999 2000 2001 2002 2003 2004
Baselevel
Burundi (AFR) 6-Jan-1997 18-Oct-2001 0.0 - 0.0 0.0 0.0 0.0 0.0 0.0 0.0 0.0 0.0 0.0 0.0Cambodia (ASIA) 27-Jun-2001 0.0 - 0.0 0.0 0.0 0.0 0.0 0.0 0.0 0.0 0.0 0.0 0.0Cameroon (AFR) 30-Aug-1989 25-Jun-1996 12.0 14.2 15.2 33.2 12.0 12.0 25.5 25.5 25.4 25.4 9.9 9.0 18.1Cape Verde (AFR) 31-Jul-2001 31-Jul-2001 0.0 0.0 0.0 0.0 0.0 0.0 0.0 0.0 0.0 0.0 0.0 0.0 0.0Central African Republic (AFR) 29-Mar-1993 0.0 0.0 0.0 0.0 0.0 0.0 0.0 0.0 0.0 0.0 0.0 - 0.0Chad (AFR) 7-Jun-1994 30-May-2001 0.0 0.0 0.0 0.0 0.0 0.0 0.0 0.0 0.0 0.0 0.0 N.R. 0.0Chile (LAC) 26-Mar-1990 14-Jan-1994 153.8 119.4 176.8 236.2 139.0 298.1 107.1 242.5 239.0 165.2 274.3 262.8 212.5China (ASIA) 14-Jun-1991 22-Apr-2003 76.2 - 372.0 720.0 1,356.0 1,960.2 1,598.4 2,100.6 1,567.8 1,087.8 1,008.0 688.8 1,102.1Colombia (LAC) 6-Dec-1993 5-Aug-1997 91.6 43.2 205.8 234.6 0.0 0.0 0.0 0.0 0.0 0.0 0.0 0.0 110.1Comoros (AFR) 31-Oct-1994 2-Dec-2002 0.0 - 0.0 0.0 0.0 0.0 0.0 0.0 0.0 0.0 0.0 0.0 0.0Congo (AFR) 16-Nov-1994 19-Oct-2001 0.0 0.0 0.0 0.0 1.3 2.3 0.8 2.9 0.0 0.0 0.0 0.0 0.9Cook Islands (ASIA) 22-Dec-2003 22-Dec-2003 0.1 - 0.1 0.0 0.0 0.0 0.0 0.0 - - 0.0 N.R. 0.0Costa Rica (LAC) 30-Jul-1991 11-Nov-1998 276.0 300.0 251.6 275.9 405.6 436.7 454.1 390.0 390.0 280.0 337.3 288.2 342.5Côte d'Ivoire (AFR) 5-Apr-1993 8-Oct-2003 0.0 13.2 9.0 2.9 8.6 12.0 0.0 11.1 18.0 12.0 8.5 0.0 8.1Croatia (EEUR) 21-Sep-1992 11-Feb-1997 18.6 16.2 16.8 17.4 16.8 11.7 16.1 10.7 5.4 -0.9 0.0 0.0 15.7Cuba (LAC) 14-Jul-1992 19-Oct-1998 65.7 27.0 48.0 63.3 19.8 70.8 62.1 22.8 15.2 21.1 23.7 19.4 50.5Cyprus (ASIA EC) 28-May-1992 2-Jun-2003 0.0 - 55.2 63.6 0.0 0.0 0.0 0.0 0.0 0.2 0.2 29.7Democratic People's Republic of Korea (ASIA) 24-Jan-1995 17-Jun-1999 192.0 - 120.0 0.0 0.0 0.0 0.0 0.0 0.0 0.0 0.0 0.0 30.0Democratic Republic of the Congo (AFR) 30-Nov-1994 30-Nov-1994 0.3 - 1.5 1.2 1.9 1.2 0.6 1.2 1.2 1.3 1.2 0.9 1.4Djibouti (AFR) 30-Jul-1999 30-Jul-1999 0.0 - 0.0 0.0 0.0 0.0 0.0 0.0 0.0 0.0 0.0 0.0 0.0Dominica (LAC) 31-Mar-1993 3.3 0.0 0.0 0.0 0.0 0.0 0.0 0.0 0.0 0.0 0.0 0.0 0.0Dominican Republic (LAC) 18-May-1993 24-Dec-2001 33.9 49.2 69.0 101.9 102.0 144.0 77.4 176.4 144.0 77.1 44.3 30.6 104.2Ecuador (LAC) 30-Apr-1990 24-Nov-1993 123.0 74.4 39.4 70.0 64.3 91.2 122.4 122.4 369.8 40.8 0.0 0.0 66.2Egypt (AFR) 2-Aug-1988 28-Jun-1994 55.2 90.0 270.0 190.2 252.0 240.0 409.2 420.0 432.0 270.0 238.0 219.0 238.1El Salvador (LAC) 2-Oct-1992 8-Dec-2000 2.3 2.0 2.5 2.1 1.0 0.0 0.0 -17.0 0.0 0.0 0.0 0.0 1.4Eritrea (AFR) 10-Mar-2005 5-Jul-2005 - - - - - - - - - - - - N.R.Ethiopia (AFR) 11-Oct-1994 12.6 - 12.6 13.2 15.0 21.6 15.6 17.4 14.4 12.0 10.8 7.2 15.6Fiji (ASIA) 23-Oct-1989 17-May-2000 0.0 - 1.4 1.3 0.0 0.0 1.0 0.9 1.2 0.3 1.5 1.6 0.7Gabon (AFR) 9-Feb-1994 4-Dec-2000 0.0 - 0.0 0.0 0.0 0.0 0.0 0.0 0.0 0.0 0.0 0.0 0.0Gambia (AFR) 25-Jul-1990 0.0 0.0 0.0 0.0 0.0 0.0 0.0 0.0 0.0 0.0 0.0 0.0 0.0Georgia (EEUR) 21-Mar-1996 12-Jul-2000 94.8 - 21.0 14.4 10.8 8.4 10.5 13.2 10.8 10.5 10.2 9.9 13.7Ghana (AFR) 24-Jul-1989 9-Apr-2001 0.0 0.0 0.0 0.0 0.0 0.0 4.5 6.3 0.0 0.0 0.0 0.0 0.0Grenada (LAC) 31-Mar-1993 20-May-1999 0.0 0.0 0.0 0.0 0.0 0.0 0.0 0.0 0.0 0.0 0.0 0.0 0.0Guatemala (LAC) 7-Nov-1989 21-Jan-2002 0.0 57.0 242.7 255.6 525.0 579.5 514.6 702.0 786.6 709.4 527.7 484.2 400.7Guinea (AFR) 25-Jun-1992 - - - - 0.0 0.0 0.0 0.0 0.0 0.0 0.0 0.0 -Guinea-Bissau (AFR) 12-Nov-2002 12-Nov-2002 0.0 0.0 0.0 0.0 0.0 0.0 0.0 0.0 0.0 0.0 0.0 0.0 0.0Guyana (LAC) 12-Aug-1993 23-Jul-1999 0.0 - 2.8 2.7 0.0 0.0 1.5 0.9 0.6 0.0 0.0 0.0 1.4Haiti (LAC) 29-Mar-2000 29-Mar-2000 0.0 - 0.0 0.0 0.0 0.0 0.0 0.0 0.0 0.0 0.0 0.0 0.0Honduras (LAC) 14-Oct-1993 24-Jan-2002 0.0 - 249.9 254.9 263.8 269.1 292.1 377.7 510.9 412.5 366.5 340.8 259.4India (ASIA) 19-Jun-1992 3-Mar-2003 0.0 0.0 0.0 0.0 0.0 0.0 0.0 0.0 0.0 0.0 0.0 0.0 0.0Indonesia (ASIA) 26-Jun-1992 10-Dec-1998 80.8 138.6 45.7 35.6 43.6 37.8 0.0 0.0 75.6 37.8 37.8 37.8 40.7Iran (Islamic Republic of) (ASIA) 3-Oct-1990 4-Aug-1997 60.0 73.2 15.0 42.0 21.6 28.2 33.0 22.2 27.6 5.4 14.4 7.6 26.7Jamaica (LAC) 31-Mar-1993 6-Nov-1997 0.0 0.0 7.5 2.0 2.6 7.3 7.1 0.9 1.5 1.2 1.5 N.R. 4.9Jordan (ASIA) 31-May-1989 30-Jun-1995 67.2 199.8 180.0 180.0 165.0 180.0 88.8 105.3 105.6 90.6 80.1 80.1 176.3Kenya (AFR) 9-Nov-1988 27-Sep-1994 198.0 216.0 195.0 204.0 236.4 234.6 60.0 92.6 90.0 139.1 74.1 41.1 217.5Kiribati (ASIA) 7-Jan-1993 9-Aug-2004 0.0 0.0 0.0 0.0 0.0 0.0 0.0 0.0 0.0 0.0 0.0 0.0 0.0Kuwait (ASIA) 23-Nov-1992 22-Jul-1994 0.0 12.0 0.0 0.0 0.0 0.0 0.0 0.0 0.0 0.0 0.0 0.0 0.0Kyrgyzstan (ASIA) 31-May-2000 13-May-2003 13.8 13.8 13.8 15.4 13.8 13.7 15.4 0.0 13.8 12.0 13.8 10.5 14.2Lao People's Democratic Republic (ASIA) 21-Aug-1998 - - - - 0.0 0.0 0.0 0.0 0.0 0.0 0.0 0.0 -Lebanon (ASIA) 31-Mar-1993 31-Jul-2000 0.0 136.2 186.0 226.8 247.2 285.6 246.5 234.3 219.0 197.3 184.7 66.0 236.4Lesotho (AFR) 25-Mar-1994 0.3 0.2 0.3 0.2 0.0 0.0 0.0 0.0 0.2 0.2 0.0 0.0 0.1Liberia (AFR) 15-Jan-1996 15-Jan-1996 0.0 0.0 0.0 0.0 0.0 0.0 0.0 0.0 0.0 0.0 0.0 0.0 0.0Libyan Arab Jamahiriya (AFR) 11-Jul-1990 24-Sep-2004 0.0 106.2 88.8 117.0 90.0 80.4 73.5 77.8 77.8 77.8 90.0 96.0 94.1Madagascar (AFR) 7-Nov-1996 16-Jan-2002 0.8 - 1.3 3.0 3.0 3.1 1.2 0.7 0.8 0.4 0.1 0.0 2.6Malawi (AFR) 9-Jan-1991 28-Feb-1994 68.4 121.8 98.2 124.8 102.0 126.0 129.0 79.2 68.0 55.4 41.1 0.0 112.7Malaysia (ASIA) 29-Aug-1989 5-Aug-1993 0.0 22.8 33.5 24.9 0.0 0.0 0.0 60.6 72.2 8.8 6.0 0.0 14.6Maldives (ASIA) 16-May-1989 27-Sep-2001 0.0 0.0 0.0 0.0 0.0 0.0 0.0 0.0 0.0 0.0 0.0 0.0 0.0Mali (AFR) 28-Oct-1994 7-Mar-2003 0.0 0.0 0.0 0.0 0.0 0.0 0.0 0.0 0.0 0.0 0.0 0.0 0.0Marshall Islands (ASIA) 11-Mar-1993 24-May-1993 0.0 0.0 0.0 0.0 0.0 0.0 0.0 0.0 0.0 0.0 0.0 0.0 0.0Mauritania (AFR) 26-May-1994 22-Jul-2005 0.0 0.0 0.0 0.0 0.0 0.0 0.0 0.0 0.0 0.0 0.0 - 0.0Mauritius (AFR) 18-Aug-1992 30-Nov-1993 0.0 0.0 0.0 0.0 0.0 0.4 0.4 0.0 0.4 0.0 0.0 0.0 0.1Mexico (LAC) 31-Mar-1988 16-Sep-1994 237.9 3,252.6 1,438.3 750.6 1,126.8 1,207.5 839.4 867.0 1,100.1 1,067.5 968.0 987.5 1,130.8Micronesia (Federated States of) (ASIA) 6-Sep-1995 27-Nov-2001 0.0 - 0.0 0.1 0.0 0.0 0.0 0.0 0.0 0.0 0.0 0.0 0.0Mongolia (ASIA) 7-Mar-1996 7-Mar-1996 0.0 - 0.0 0.0 0.0 0.0 0.0 0.0 0.0 0.0 0.0 0.0 0.0Morocco (AFR) 28-Dec-1995 28-Dec-1995 132.6 530.4 778.8 651.0 399.0 960.0 409.2 870.2 1,621.4 387.0 697.2 691.2 697.2Mozambique (AFR) 9-Sep-1994 9-Sep-1994 4.3 5.7 4.8 2.7 6.0 0.0 0.0 8.4 8.4 4.5 1.0 N.R. 3.4Myanmar (ASIA) 24-Nov-1993 - 0.0 0.0 13.5 0.0 0.0 0.0 0.0 0.0 0.0 0.0 0.0 3.4Namibia (AFR) 20-Sep-1993 28-Jul-2003 0.0 - 0.6 0.6 1.2 0.6 0.6 1.8 0.6 0.0 0.0 0.0 0.8
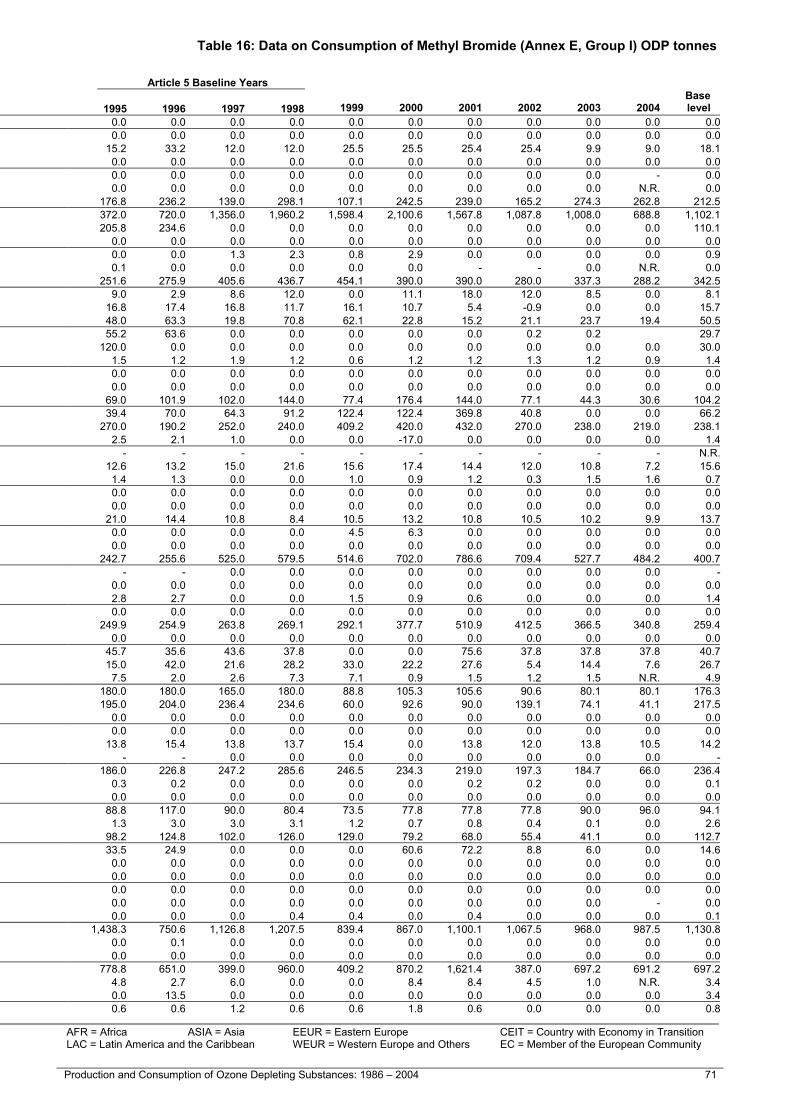
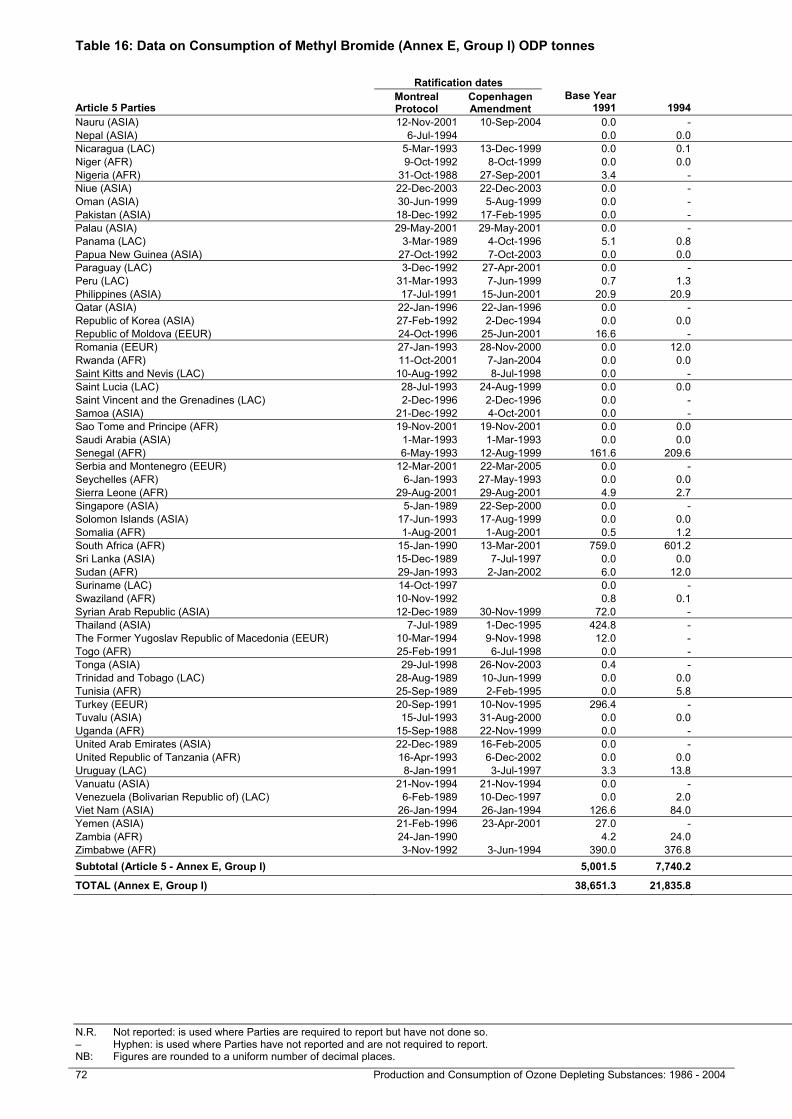
Table 16: Data on Consumption of Methyl Bromide (Annex E, Group I) ODP tonnes Table 16: Data on Consumption of Methyl Bromide (Annex E, Group I) ODP tonnes
N.R. Not reported: is used where Parties are required to report but have not done so. AFR = Africa ASIA = Asia EEUR = Eastern Europe CEIT = Country with Economy in Transition – Hyphen: is used where Parties have not reported and are not required to report. LAC = Latin America and the Caribbean WEUR = Western Europe and Others EC = Member of the European Community NB: Figures are rounded to a uniform number of decimal places.
72 Production and Consumption of Ozone Depleting Substances: 1986 - 2004 Production and Consumption of Ozone Depleting Substances: 1986 – 2004 73
Ratification dates Article 5 Baseline Years
Article 5 Parties Montreal Protocol
Copenhagen Amendment
Base Year 1991 1994 1995 1996 1997 1998 1999 2000 2001 2002 2003 2004
Baselevel
Nauru (ASIA) 12-Nov-2001 10-Sep-2004 0.0 - 0.0 0.0 0.0 0.0 0.0 0.0 0.0 0.0 0.0 N.R. 0.0Nepal (ASIA) 6-Jul-1994 0.0 0.0 0.0 0.0 0.0 0.0 0.0 0.0 0.0 0.0 0.0 0.0 0.0Nicaragua (LAC) 5-Mar-1993 13-Dec-1999 0.0 0.1 0.0 1.7 0.0 0.0 2.1 0.0 0.0 8.2 0.0 0.0 0.4Niger (AFR) 9-Oct-1992 8-Oct-1999 0.0 0.0 0.0 0.0 0.0 0.0 0.0 0.0 0.0 0.0 0.0 0.0 0.0Nigeria (AFR) 31-Oct-1988 27-Sep-2001 3.4 - 3.8 3.1 2.5 2.0 2.0 2.1 2.1 2.0 2.0 1.7 2.8Niue (ASIA) 22-Dec-2003 22-Dec-2003 0.0 - 0.0 0.0 0.0 0.0 0.0 0.0 - - 0.0 0.0 0.0Oman (ASIA) 30-Jun-1999 5-Aug-1999 0.0 - 0.7 0.6 0.6 2.2 4.2 2.9 0.8 0.0 0.0 0.0 1.0Pakistan (ASIA) 18-Dec-1992 17-Feb-1995 0.0 - 0.0 0.0 55.8 0.0 0.0 24.0 24.0 0.0 0.0 0.0 14.0Palau (ASIA) 29-May-2001 29-May-2001 0.0 - 0.0 0.0 0.0 0.0 0.0 0.0 0.0 0.0 0.0 0.0 0.0Panama (LAC) 3-Mar-1989 4-Oct-1996 5.1 0.8 0.0 0.0 0.0 0.0 0.0 0.0 0.0 0.0 0.0 0.0 0.0Papua New Guinea (ASIA) 27-Oct-1992 7-Oct-2003 0.0 0.0 0.7 0.6 0.0 0.0 0.6 0.2 2.2 1.3 0.0 0.0 0.3Paraguay (LAC) 3-Dec-1992 27-Apr-2001 0.0 - 0.8 0.8 1.4 0.4 0.4 0.0 0.5 0.9 -0.2 0.2 0.9Peru (LAC) 31-Mar-1993 7-Jun-1999 0.7 1.3 0.8 0.1 0.3 3.9 3.1 29.3 0.1 0.1 0.0 0.0 1.3Philippines (ASIA) 17-Jul-1991 15-Jun-2001 20.9 20.9 9.5 9.5 13.0 9.2 0.0 0.0 34.9 7.8 9.0 9.7 10.3Qatar (ASIA) 22-Jan-1996 22-Jan-1996 0.0 - 0.0 0.0 0.0 0.0 0.0 0.0 0.0 0.0 0.0 0.0 0.0Republic of Korea (ASIA) 27-Feb-1992 2-Dec-1994 0.0 0.0 0.0 0.0 0.0 0.0 0.0 0.0 0.0 0.0 0.0 1.8 0.0Republic of Moldova (EEUR) 24-Oct-1996 25-Jun-2001 16.6 - 0.7 20.8 5.2 1.1 0.0 0.0 0.0 0.0 0.0 0.0 7.0Romania (EEUR) 27-Jan-1993 28-Nov-2000 0.0 12.0 172.0 100.2 71.1 102.6 33.6 20.0 18.1 70.9 64.6 5.0 111.5Rwanda (AFR) 11-Oct-2001 7-Jan-2004 0.0 0.0 0.0 0.0 0.0 0.0 0.0 0.0 0.0 0.0 0.0 0.0 0.0Saint Kitts and Nevis (LAC) 10-Aug-1992 8-Jul-1998 0.0 - 0.3 0.3 0.3 0.3 0.3 0.3 0.4 0.3 0.0 0.1 0.3Saint Lucia (LAC) 28-Jul-1993 24-Aug-1999 0.0 0.0 0.0 0.0 0.0 0.0 0.0 0.0 0.0 0.0 0.0 0.0 0.0Saint Vincent and the Grenadines (LAC) 2-Dec-1996 2-Dec-1996 0.0 - 0.0 0.0 0.0 0.0 0.0 0.0 0.0 0.0 0.0 0.0 0.0Samoa (ASIA) 21-Dec-1992 4-Oct-2001 0.0 - 0.0 0.0 0.0 0.0 0.0 0.0 0.0 0.0 0.0 N.R. 0.0Sao Tome and Principe (AFR) 19-Nov-2001 19-Nov-2001 0.0 0.0 0.0 0.0 0.0 0.0 0.0 0.0 0.0 0.0 0.0 0.0 0.0Saudi Arabia (ASIA) 1-Mar-1993 1-Mar-1993 0.0 0.0 0.0 0.0 1.2 1.4 1.8 3.0 5.4 0.0 0.0 N.R. 0.6Senegal (AFR) 6-May-1993 12-Aug-1999 161.6 209.6 199.2 12.0 0.7 0.7 0.7 0.0 0.0 0.0 0.0 0.0 53.2Serbia and Montenegro (EEUR) 12-Mar-2001 22-Mar-2005 0.0 - - - - - - 9.5 9.2 12.6 0.0 0.0 N.R.Seychelles (AFR) 6-Jan-1993 27-May-1993 0.0 0.0 0.0 0.0 0.0 0.0 0.0 0.0 0.0 0.0 0.0 0.0 0.0Sierra Leone (AFR) 29-Aug-2001 29-Aug-2001 4.9 2.7 2.7 3.6 2.4 1.8 1.5 1.2 1.2 1.2 0.7 0.4 2.6Singapore (ASIA) 5-Jan-1989 22-Sep-2000 0.0 - 6.2 8.2 4.3 1.1 -46.4 1.3 1.5 1.4 2.7 25.6 5.0Solomon Islands (ASIA) 17-Jun-1993 17-Aug-1999 0.0 0.0 0.0 0.0 0.0 0.0 0.0 0.0 0.0 0.0 0.0 0.0 0.0Somalia (AFR) 1-Aug-2001 1-Aug-2001 0.5 1.2 1.8 0.0 0.0 0.0 0.0 0.0 0.0 0.0 0.0 0.0 0.5South Africa (AFR) 15-Jan-1990 13-Mar-2001 759.0 601.2 604.2 604.2 598.5 604.0 588.1 600.1 596.5 593.8 600.7 601.2 602.7Sri Lanka (ASIA) 15-Dec-1989 7-Jul-1997 0.0 0.0 2.7 8.3 1.6 3.8 6.5 4.8 1.1 1.9 2.0 1.5 4.1Sudan (AFR) 29-Jan-1993 2-Jan-2002 6.0 12.0 6.0 0.0 3.0 3.0 3.0 3.0 3.0 3.0 1.8 1.8 3.0Suriname (LAC) 14-Oct-1997 0.0 - 0.0 0.0 0.0 0.0 0.0 0.0 0.0 0.0 0.0 0.0 0.0Swaziland (AFR) 10-Nov-1992 0.8 0.1 0.4 - 0.7 0.6 0.6 0.7 0.5 0.7 0.0 - -Syrian Arab Republic (ASIA) 12-Dec-1989 30-Nov-1999 72.0 - 153.0 289.2 240.0 72.0 89.3 112.3 165.1 152.7 128.7 113.6 188.6Thailand (ASIA) 7-Jul-1989 1-Dec-1995 424.8 - 193.9 130.7 205.9 201.4 172.2 204.6 291.2 470.5 178.0 181.4 183.0The Former Yugoslav Republic of Macedonia (EEUR) 10-Mar-1994 9-Nov-1998 12.0 - 12.0 12.0 12.0 12.9 27.2 23.4 19.9 5.3 0.0 0.0 12.2Togo (AFR) 25-Feb-1991 6-Jul-1998 0.0 - 0.0 0.0 0.0 0.0 0.0 0.0 0.0 0.0 0.0 0.0 0.0Tonga (ASIA) 29-Jul-1998 26-Nov-2003 0.4 - 0.4 0.3 0.0 0.0 0.0 0.0 0.0 0.0 0.0 0.0 0.2Trinidad and Tobago (LAC) 28-Aug-1989 10-Jun-1999 0.0 0.0 1.2 1.2 1.2 3.3 2.1 0.8 1.1 0.7 0.4 0.2 1.7Tunisia (AFR) 25-Sep-1989 2-Feb-1995 0.0 5.8 12.0 4.8 9.0 7.2 7.8 10.8 11.4 10.8 10.2 10.2 8.3Turkey (EEUR) 20-Sep-1991 10-Nov-1995 296.4 - 421.2 578.4 504.0 415.2 342.6 342.6 43.8 280.8 185.4 90.6 479.7Tuvalu (ASIA) 15-Jul-1993 31-Aug-2000 0.0 0.0 0.0 0.0 0.0 0.0 0.0 0.0 0.0 0.0 0.0 0.0 0.0Uganda (AFR) 15-Sep-1988 22-Nov-1999 0.0 - 1.5 1.8 10.2 11.7 10.5 15.9 22.2 30.0 24.0 24.0 6.3United Arab Emirates (ASIA) 22-Dec-1989 16-Feb-2005 0.0 - 0.0 9.6 19.2 0.0 0.0 0.0 0.0 0.0 0.0 0.0 7.2United Republic of Tanzania (AFR) 16-Apr-1993 6-Dec-2002 0.0 0.0 0.0 0.0 0.0 0.0 0.0 0.0 0.0 0.0 0.0 0.0 0.0Uruguay (LAC) 8-Jan-1991 3-Jul-1997 3.3 13.8 14.9 2.7 16.4 10.8 21.7 23.8 37.8 17.7 8.7 11.1 11.2Vanuatu (ASIA) 21-Nov-1994 21-Nov-1994 0.0 - 0.5 0.0 0.4 0.0 0.0 0.0 0.0 0.0 0.0 0.0 0.2Venezuela (Bolivarian Republic of) (LAC) 6-Feb-1989 10-Dec-1997 0.0 2.0 10.2 10.8 10.1 10.1 0.0 0.0 0.0 0.0 0.0 0.0 10.3Viet Nam (ASIA) 26-Jan-1994 26-Jan-1994 126.6 84.0 153.0 165.0 180.0 48.0 57.0 78.0 51.0 48.0 56.4 57.6 136.5Yemen (ASIA) 21-Feb-1996 23-Apr-2001 27.0 - 37.2 57.0 60.0 63.6 57.6 60.0 65.4 52.8 49.8 42.0 54.5Zambia (AFR) 24-Jan-1990 4.2 24.0 26.4 29.0 32.5 29.5 28.9 28.5 14.3 12.6 11.7 11.4 29.3Zimbabwe (AFR) 3-Nov-1992 3-Jun-1994 390.0 376.8 405.6 424.2 579.0 819.0 490.3 370.7 544.2 202.3 97.4 184.2 557.0Subtotal (Article 5 - Annex E, Group I) 5,001.5 7,740.2 8,662.6 8,704.1 9,527.9 10,862.1 8,286.9 9,927.3 10,616.9 7,625.8 7,092.1 6,321.4 9,439.2
TOTAL (Annex E, Group I) 38,651.3 21,835.8 37,162.9 34,904.8 37,865.4 36,453.8 29,408.7 27,298.4 24,725.7 18,161.2 15,803.2 17,393.6 43,089.0
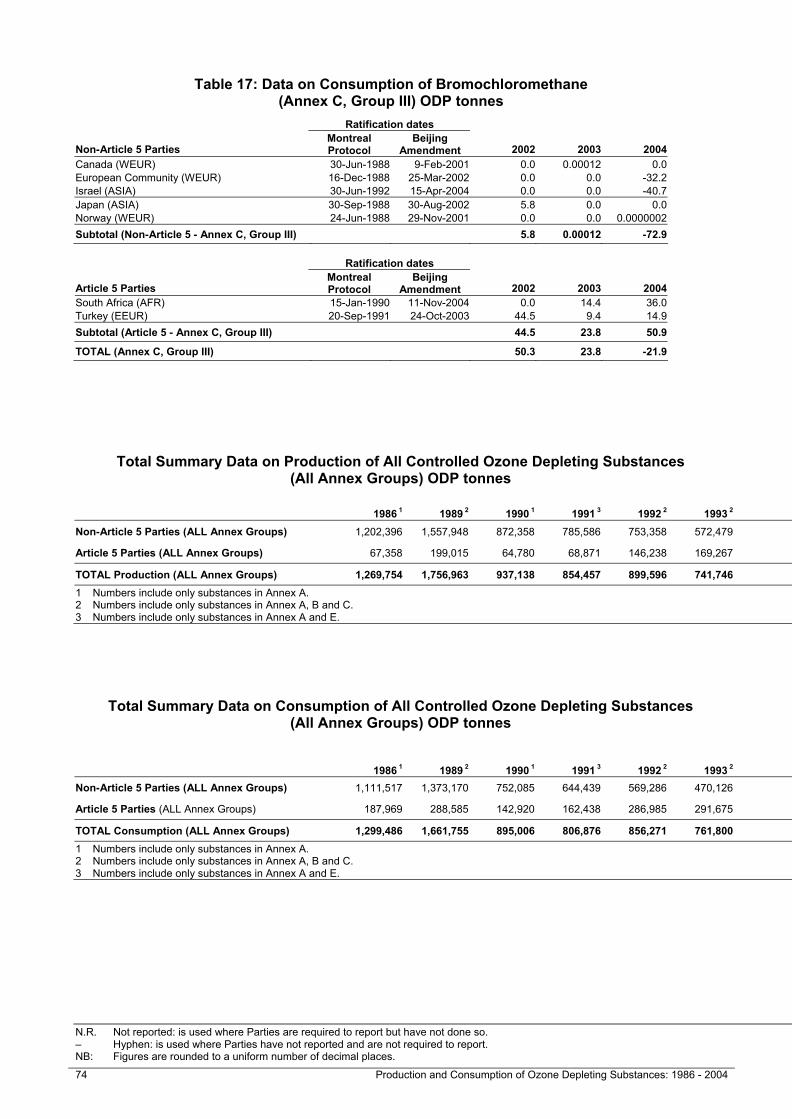
Table 17: Data on Consumption of Bromochloromethane (Annex C, Group III) ODP tonnes
N.R. Not reported: is used where Parties are required to report but have not done so. AFR = Africa ASIA = Asia EEUR = Eastern Europe CEIT = Country with Economy in Transition – Hyphen: is used where Parties have not reported and are not required to report. LAC = Latin America and the Caribbean WEUR = Western Europe and Others EC = Member of the European Community NB: Figures are rounded to a uniform number of decimal places.
74 Production and Consumption of Ozone Depleting Substances: 1986 - 2004 Production and Consumption of Ozone Depleting Substances: 1986 – 2004 75
Table 17: Data on Consumption of Bromochloromethane (Annex C, Group III) ODP tonnes
Ratification dates
Non-Article 5 Parties Montreal Protocol
Beijing Amendment 2002 2003 2004
Canada (WEUR) 30-Jun-1988 9-Feb-2001 0.0 0.00012 0.0European Community (WEUR) 16-Dec-1988 25-Mar-2002 0.0 0.0 -32.2Israel (ASIA) 30-Jun-1992 15-Apr-2004 0.0 0.0 -40.7Japan (ASIA) 30-Sep-1988 30-Aug-2002 5.8 0.0 0.0Norway (WEUR) 24-Jun-1988 29-Nov-2001 0.0 0.0 0.0000002Subtotal (Non-Article 5 - Annex C, Group III) 5.8 0.00012 -72.9
Ratification dates
Article 5 Parties Montreal Protocol
Beijing Amendment 2002 2003 2004
South Africa (AFR) 15-Jan-1990 11-Nov-2004 0.0 14.4 36.0Turkey (EEUR) 20-Sep-1991 24-Oct-2003 44.5 9.4 14.9Subtotal (Article 5 - Annex C, Group III) 44.5 23.8 50.9
TOTAL (Annex C, Group III) 50.3 23.8 -21.9
Total Summary Data on Production of All Controlled Ozone Depleting Substances (All Annex Groups) ODP tonnes
1986 1 1989 2 1990 1 1991 3 1992 2 1993 2 1994 1995 1996 1997 1998 1999 2000 2001 2002 2003 2004Baselevel
Non-Article 5 Parties (ALL Annex Groups) 1,202,396 1,557,948 872,358 785,586 753,358 572,479 322,793 233,795 115,801 113,735 118,330 111,245 112,442 83,291 67,750 46,185 32,742 1,662,321
Article 5 Parties (ALL Annex Groups) 67,358 199,015 64,780 68,871 146,238 169,267 180,605 179,923 167,795 168,747 196,261 157,559 184,256 130,856 106,498 125,334 101,021 209,306
TOTAL Production (ALL Annex Groups) 1,269,754 1,756,963 937,138 854,457 899,596 741,746 503,398 413,718 283,596 282,482 314,591 268,804 296,698 214,147 174,247 171,519 133,763 1,871,6271 Numbers include only substances in Annex A. 2 Numbers include only substances in Annex A, B and C. 3 Numbers include only substances in Annex A and E.
Total Summary Data on Consumption of All Controlled Ozone Depleting Substances (All Annex Groups) ODP tonnes
1986 1 1989 2 1990 1 1991 3 1992 2 1993 2 1994 1995 1996 1997 1998 1999 2000 2001 2002 2003 2004Baselevel
Non-Article 5 Parties (ALL Annex Groups) 1,111,517 1,373,170 752,085 644,439 569,286 470,126 234,934 145,904 77,760 43,654 47,949 61,479 52,031 33,672 16,359 26,100 12,118 1,498,938
Article 5 Parties (ALL Annex Groups) 187,969 288,585 142,920 162,438 286,985 291,675 256,862 259,196 224,373 224,337 289,720 193,798 264,023 174,178 146,250 144,962 111,250 294,766
TOTAL Consumption (ALL Annex Groups) 1,299,486 1,661,755 895,006 806,876 856,271 761,800 491,796 405,101 302,133 267,990 337,668 255,277 316,054 207,850 162,609 171,062 123,367 1,793,7041 Numbers include only substances in Annex A. 2 Numbers include only substances in Annex A, B and C. 3 Numbers include only substances in Annex A and E.
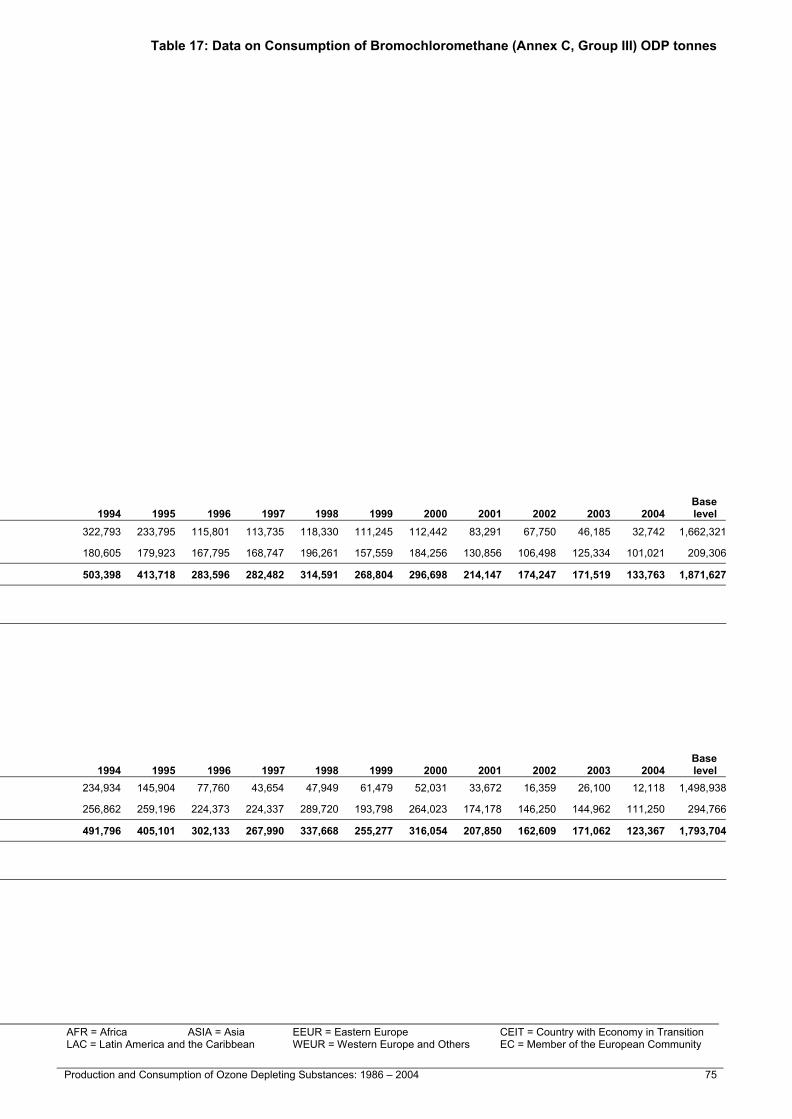
Table 17: Data on Consumption of Bromochloromethane (Annex C, Group III) ODP tonnes
N.R. Not reported: is used where Parties are required to report but have not done so. AFR = Africa ASIA = Asia EEUR = Eastern Europe CEIT = Country with Economy in Transition – Hyphen: is used where Parties have not reported and are not required to report. LAC = Latin America and the Caribbean WEUR = Western Europe and Others EC = Member of the European Community NB: Figures are rounded to a uniform number of decimal places.
74 Production and Consumption of Ozone Depleting Substances: 1986 - 2004 Production and Consumption of Ozone Depleting Substances: 1986 – 2004 75
Table 17: Data on Consumption of Bromochloromethane (Annex C, Group III) ODP tonnes
Ratification dates
Non-Article 5 Parties Montreal Protocol
Beijing Amendment 2002 2003 2004
Canada (WEUR) 30-Jun-1988 9-Feb-2001 0.0 0.00012 0.0European Community (WEUR) 16-Dec-1988 25-Mar-2002 0.0 0.0 -32.2Israel (ASIA) 30-Jun-1992 15-Apr-2004 0.0 0.0 -40.7Japan (ASIA) 30-Sep-1988 30-Aug-2002 5.8 0.0 0.0Norway (WEUR) 24-Jun-1988 29-Nov-2001 0.0 0.0 0.0000002Subtotal (Non-Article 5 - Annex C, Group III) 5.8 0.00012 -72.9
Ratification dates
Article 5 Parties Montreal Protocol
Beijing Amendment 2002 2003 2004
South Africa (AFR) 15-Jan-1990 11-Nov-2004 0.0 14.4 36.0Turkey (EEUR) 20-Sep-1991 24-Oct-2003 44.5 9.4 14.9Subtotal (Article 5 - Annex C, Group III) 44.5 23.8 50.9
TOTAL (Annex C, Group III) 50.3 23.8 -21.9
Total Summary Data on Production of All Controlled Ozone Depleting Substances (All Annex Groups) ODP tonnes
1986 1 1989 2 1990 1 1991 3 1992 2 1993 2 1994 1995 1996 1997 1998 1999 2000 2001 2002 2003 2004Baselevel
Non-Article 5 Parties (ALL Annex Groups) 1,202,396 1,557,948 872,358 785,586 753,358 572,479 322,793 233,795 115,801 113,735 118,330 111,245 112,442 83,291 67,750 46,185 32,742 1,662,321
Article 5 Parties (ALL Annex Groups) 67,358 199,015 64,780 68,871 146,238 169,267 180,605 179,923 167,795 168,747 196,261 157,559 184,256 130,856 106,498 125,334 101,021 209,306
TOTAL Production (ALL Annex Groups) 1,269,754 1,756,963 937,138 854,457 899,596 741,746 503,398 413,718 283,596 282,482 314,591 268,804 296,698 214,147 174,247 171,519 133,763 1,871,6271 Numbers include only substances in Annex A. 2 Numbers include only substances in Annex A, B and C. 3 Numbers include only substances in Annex A and E.
Total Summary Data on Consumption of All Controlled Ozone Depleting Substances (All Annex Groups) ODP tonnes
1986 1 1989 2 1990 1 1991 3 1992 2 1993 2 1994 1995 1996 1997 1998 1999 2000 2001 2002 2003 2004Baselevel
Non-Article 5 Parties (ALL Annex Groups) 1,111,517 1,373,170 752,085 644,439 569,286 470,126 234,934 145,904 77,760 43,654 47,949 61,479 52,031 33,672 16,359 26,100 12,118 1,498,938
Article 5 Parties (ALL Annex Groups) 187,969 288,585 142,920 162,438 286,985 291,675 256,862 259,196 224,373 224,337 289,720 193,798 264,023 174,178 146,250 144,962 111,250 294,766
TOTAL Consumption (ALL Annex Groups) 1,299,486 1,661,755 895,006 806,876 856,271 761,800 491,796 405,101 302,133 267,990 337,668 255,277 316,054 207,850 162,609 171,062 123,367 1,793,7041 Numbers include only substances in Annex A. 2 Numbers include only substances in Annex A, B and C. 3 Numbers include only substances in Annex A and E.