Product Support Analysis - Maintenance Planning
44
Integrity Service Excellence Product Support Analysis - Maintenance Planning Roger Moulder HQ AFMC/A9 March 2014 Air Force Materiel Command
-
Upload
sayed-kassar -
Category
Documents
-
view
71 -
download
0
Transcript of Product Support Analysis - Maintenance Planning
Integrity Service Excellence
Product Support Analysis -
Maintenance Planning
Roger Moulder HQ AFMC/A9 March 2014
Air Force Materiel Command

2
Purpose
Discuss select maintenance planning activities during Product Support Analysis and their impact
on sustainment
3
Agenda
• Importance of Maintenance Planning • Sustainment KPP, KSAs, Outcome Metrics • Interactions of RAM Metrics • Types of Maintenance Analyses • Example A9A Projects • Summary • Discussion
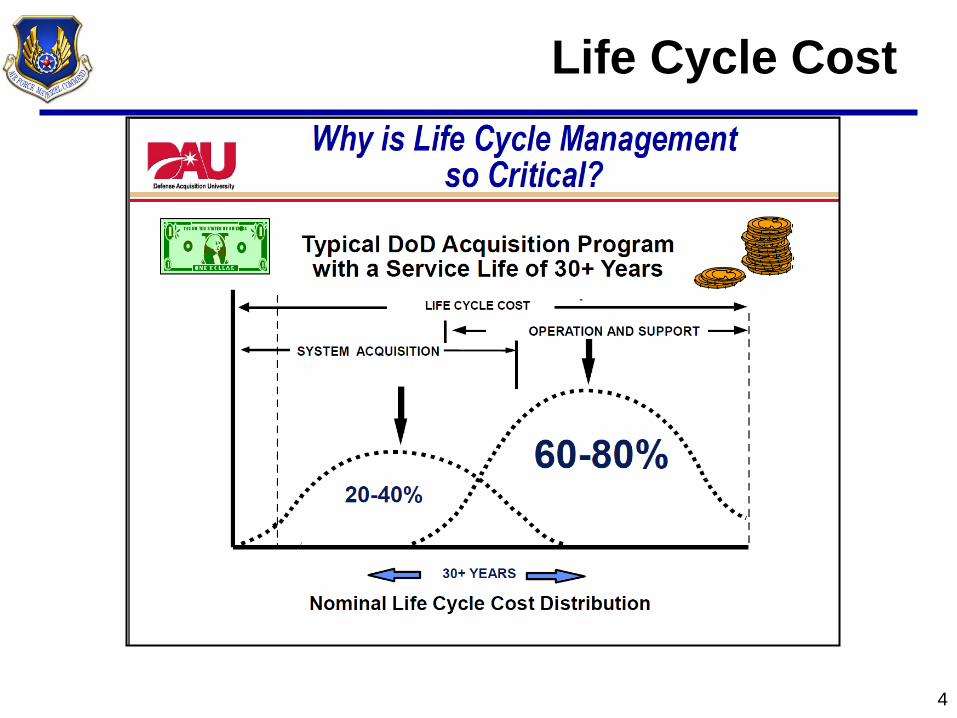
Life Cycle Cost
4

Sustainment KPP & KSAs
5
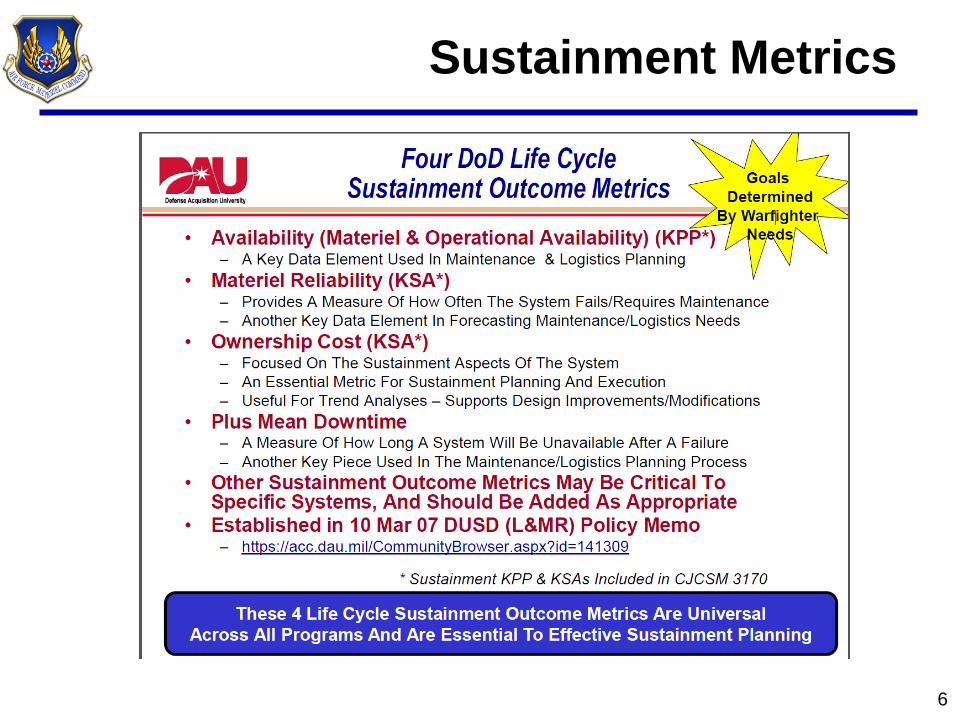
Sustainment Metrics
6

Sustainment Metrics (cont.) • Material Availability
– Am = TAI – (Depot Possessed + UPNR + NMCS + NMCM + NMCB)** – Should be realistic, achievable – Ripple effect through sustainment planning/execution
• Material Reliability – Directly affects availability – How much should be invested (time, $) up front?
• Ownership Cost – Locked in by early decisions
• Will BCA frequency mitigate?
– Driven by material availability/reliability goals
• Mean Down Time – Directly affects availability – Determined in part by reliability and maintainability
7
** Total Active Inventory (TAI), Unit Possessed Not Reported (UPNR), Not Mission Capable Supply (NMCS), Not Mission Capable Maintenance (NMCM), Not Mission Capable Both (NMCB)
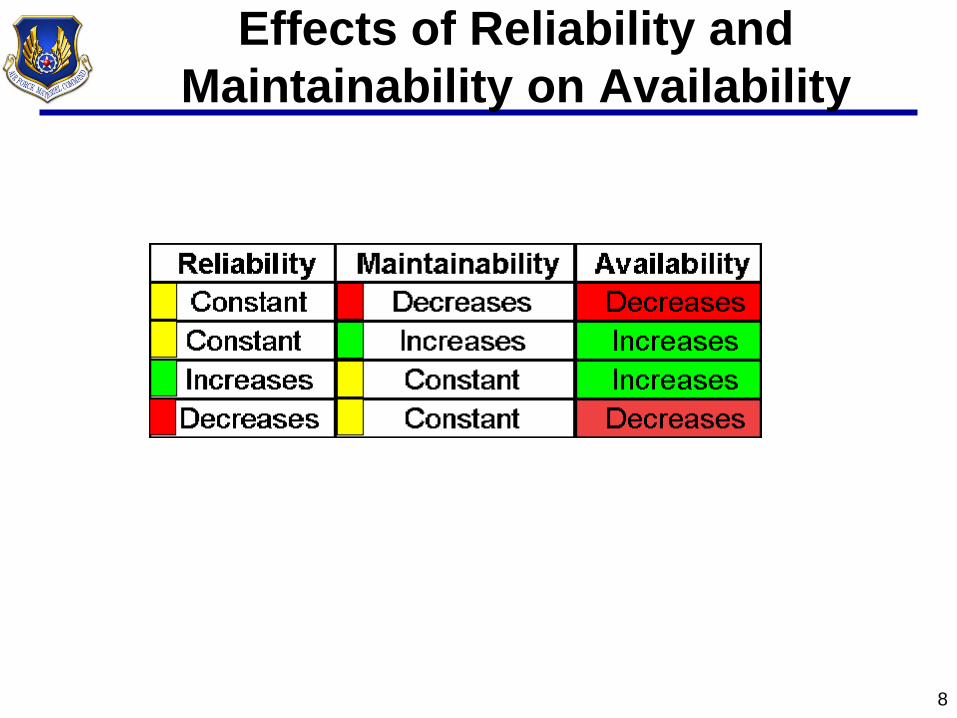
Effects of Reliability and Maintainability on Availability
8
Types of Maintenance Planning Activities
• Level of Repair Analysis (LORA) • Depot Source of Repair (DSOR) • Depot Activation • Repair Network Integration (RNI)
9

Example Projects
• LORA Study • DSOR RIE • KC-46 PDM Capacity Simulation • F100-229 Repair Network Simulation
10
LORA
• Objective: Determine the state of LORA in the Air Force and make recommendations
• Sustainment Impacts: – 50/50 – Ownership Cost (KSA)
11
Background • Air Force Logistics Readiness Board (AFLRB) meeting
29 – 30 Nov 2010 – Process for developing item Expendability Reparability Recoverability
Codes (ERRCs) vary by program office; often driven by contractor processes/models.
– Board established new action items to work toward standardization of the ERRC assignment process. These action items are:
• Review the need for and current state of the existing Air Force LORA model. • If warranted, develop an Air Force LORA model for initially assigning item
ERRCs. • Conduct analysis to determine when an LORA reassessment should be
conducted to update item ERRCs.
• A9A agreed to provide analysis support to review candidate models and policy to make a model recommendation and identify policy gaps directing LORA over the life cycle.
12

LORA—From Integrated Product Support (IPS) Element Guidebook
• Level-of -Repair Analysis (LORA) is the most important physical supportability analysis business decision made during acquisition of a system. LORA produces the final answer as to how a system will be supported. LORA is performed in two steps: (1) using non-economic decision criteria to make the initial support decisions and (2) using an economic model to determine the most cost effective alternative to provide support for the system.
• The LORA process produces the final support solution for the system. It determines where each required maintenance action will be performed, the physical resources that must be available to support performance of maintenance, and what the support infrastructure must be capable of sustaining throughout the operational life of the system. The results of LORA are documented and used as the basis for development of the physical resources for support of the system.
• The LORA process starts by identification of the options where maintenance can be performed. It is common for systems to use 2 or 3 levels of maintenance. LORA produces a decision for each item within the system, indicating where each maintenance action for the item will be performed.
• Non-economic LORA decision criteria are a list of rules or guidelines that are used to determine if there is an overriding reason why maintenance should be performed. Some organizations have policies that any item costing less than a predetermined price level will be discarded and replaced rather than be repaired.
13
Identified Gaps
• No standard tools/methods to conduct/assess LORAs in acquisition
• No AF guidance on updating LORAs after Milestone C – Frequency – Tools – Methods
14

Recommendations
• Require AF assessment of contractor-conducted LORAs
• Require LORAs at specific points in sustainment • Follow Army’s example of requiring a standard tool for
LORA analyses throughout the life cycle – Adopt Army’s COMPASS tool
• HQ AFMC/A9A and AFLMA have evaluated • Navy has already adopted • Available at no cost, fully supported
• Supplement/change AF Guidance/Policy as required • Coordinate with SAF/AQ
15

Depot Source of Repair (DSOR)
• Objective: RIE to redefine the DSOR/Depot Activation Process
• Sustainment Impacts: – 50/50 – Ownership Cost (KSA)
16

RIE Charter Problem Statement
17
• Recent changes to laws, policies and reorganization to the 5 Center construct have adversely affected the DSOR process – Centers have minimal engagement responsibility in
the Core/Candidate depot determination; key AFSPC and AFMC Center organizations must be engaged.
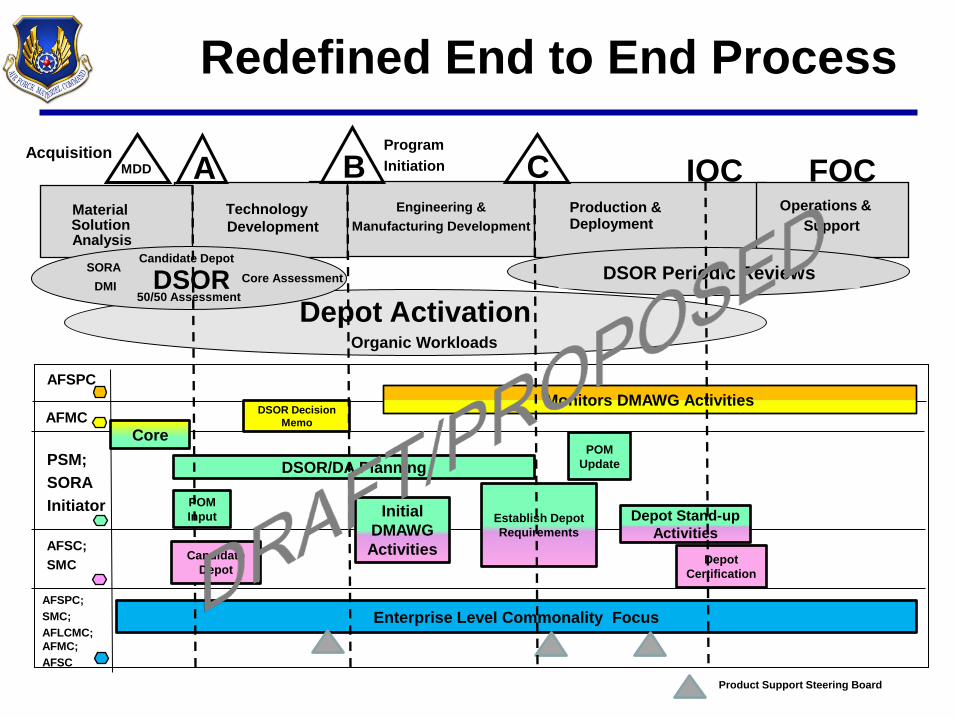
Depot Activation Organic Workloads
IOC B A Technology Development
Engineering & Manufacturing Development
Production & Deployment
Operations & Support
C
FOC Program Initiation
Material
Acquisition MDD
DSOR Periodic Reviews
Solution Analysis
SORA Core Assessment DMI DSOR
Candidate Depot
50/50 Assessment
PSM; SORA Initiator
AFMC
AFSPC; SMC; AFLCMC; AFMC; AFSC
AFSC; SMC
DSOR/DA Planning
Core
POM Input
DSOR Decision Memo
Depot Certification
Initial DMAWG Activities
Enterprise Level Commonality Focus
Establish Depot Requirements
POM Update
Depot Stand-up Activities
Product Support Steering Board
Redefined End to End Process
AFSPC Monitors DMAWG Activities
Candidate Depot
Improvements
• End to End Process Enables: – Realigned Core/Candidate Depot processes – Integrated DSOR and DA processes – Established minimum requirements to support DSOR – Refined DA planning prior to MS-A – Focused process on acquisition events and
scheduled need dates – Addresses commonality across enterprise and life
cycle – Expands governance structure to include PSSB – Established framework for metrics
19

KC-46 PDM Capacity
• Objective: Identify issues (if any) with the proposed Programmed Depot Maintenance (PDM) strategy
• Sustainment Impacts: – Am (KPP) – Ownership Cost (KSA)
20

Proposed KC-46 PDM Strategy
• Utilize the aircraft industry Maintenance Steering Group 3 (MSG 3) process to plan and execute scheduled maintenance
• Unlike most Air Force’s PDM programs, will run a series of C-checks, one every 2 years, focusing on inspection of specific subsystems of the aircraft
• First KC-46 scheduled maintenance is slated for 2018
21
KC-46 PDM Strategy Study Approach
• Use discrete-event simulation modeling to study the proposed PDM strategy
• Primary parameters of interest – Number of aircraft awaiting maintenance (in
queue) – Number of aircraft at depot (queued, in
maintenance) • Depot Possessed segment of Am
22
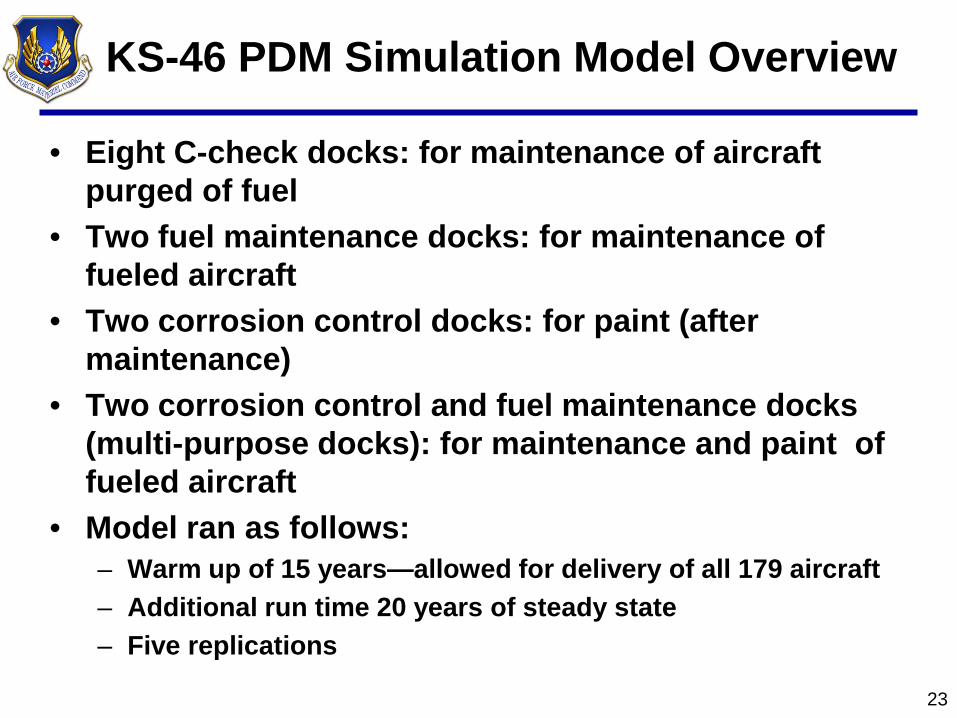
KS-46 PDM Simulation Model Overview
• Eight C-check docks: for maintenance of aircraft purged of fuel
• Two fuel maintenance docks: for maintenance of fueled aircraft
• Two corrosion control docks: for paint (after maintenance)
• Two corrosion control and fuel maintenance docks (multi-purpose docks): for maintenance and paint of fueled aircraft
• Model ran as follows: – Warm up of 15 years—allowed for delivery of all 179 aircraft – Additional run time 20 years of steady state – Five replications
23

Model Layout (in ARENA)
24

Model Parameters
• Used Triangular Distribution based on average flow days for each C-check
25
Maintenance Process
Corrosion Control Process
cCheck Low Mid High Low Mid High 1 16 18 32 - - - 2 21 23 37 15 17 24 3 27 29 43 - - - 4 43 45 59 16 18 25
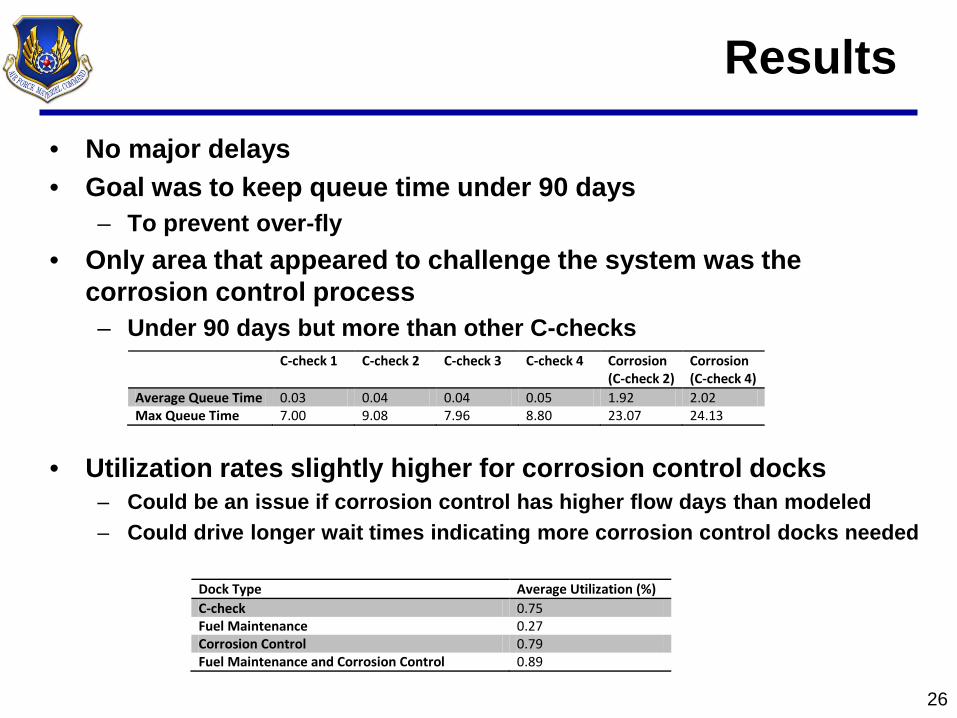
Results
• No major delays • Goal was to keep queue time under 90 days
– To prevent over-fly • Only area that appeared to challenge the system was the
corrosion control process – Under 90 days but more than other C-checks
• Utilization rates slightly higher for corrosion control docks – Could be an issue if corrosion control has higher flow days than modeled – Could drive longer wait times indicating more corrosion control docks needed
26
C-check 1 C-check 2 C-check 3 C-check 4 Corrosion (C-check 2)
Corrosion (C-check 4)
Average Queue Time 0.03 0.04 0.04 0.05 1.92 2.02 Max Queue Time 7.00 9.08 7.96 8.80 23.07 24.13
Dock Type Average Utilization (%) C-check 0.75 Fuel Maintenance 0.27 Corrosion Control 0.79 Fuel Maintenance and Corrosion Control 0.89

Conclusions • On average, between 10 and 11 aircraft at the depot • Seems to align with the program plan to purchase 11
backup aircraft – Am goal is 89% – Ao: CDD objective requirement is 89%; threshold is 80%
• What are the implications to Am and Ao? – Am = TAI – (Depot Possessed + UPNR + NMCS + NMCM +
NMCB) – Depot Possessed of 6% (11 aircraft) leaves 5% for all other
statuses—may be difficult to achieve Am and Ao of 89% (KC-135 has averaged 21%)
• Informs planners that more backup aircraft may be needed
27

F100-229 RNI Simulation
• Objective: Identify improvements to the F100-229 repair network that enable meeting serviceable engine levels more efficiently
• Sustainment Impacts: – Am (KPP) – Ownership Cost (KSA)
28

29
Approach
• Use discrete-event simulation to model F-100229 A/B repair network
• Use Design of Experiments (DOE) and the simulation model to build meta models (equations) for managers to use in exploring what ifs – In essence, “run” the model without running the
model • Use optimization techniques to identify best
settings for all significant factors • Update/embellish simulation model and DOE
as appropriate
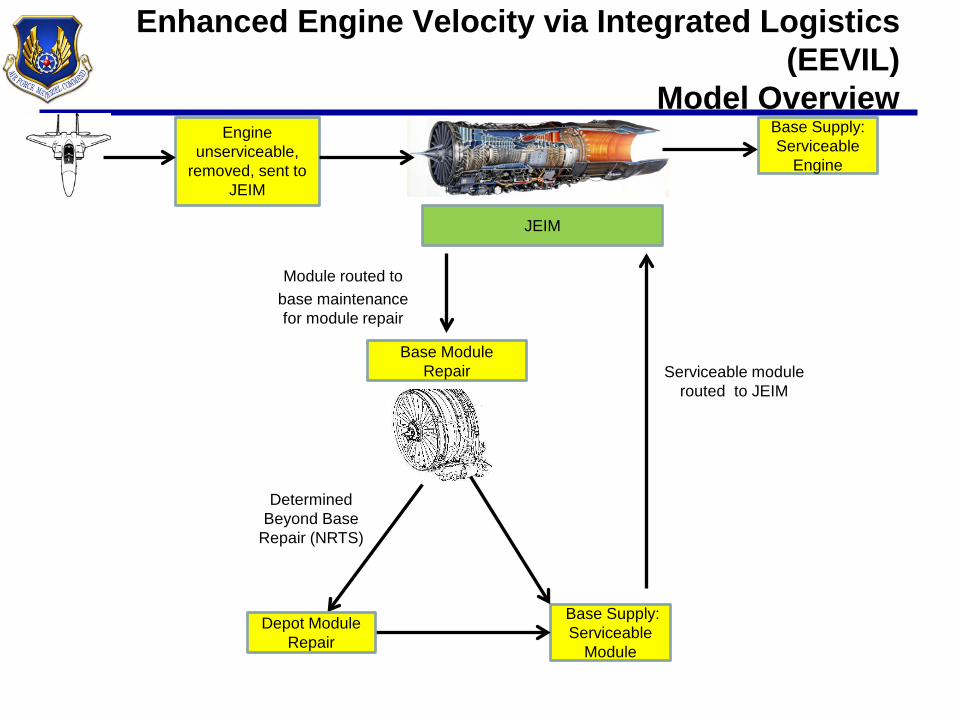
Enhanced Engine Velocity via Integrated Logistics (EEVIL)
Model Overview Engine
unserviceable, removed, sent to
JEIM
Base Module Repair
Base Supply: Serviceable
Module
Depot Module Repair
JEIM
Base Supply: Serviceable
Engine
Module routed to base maintenance for module repair
Determined Beyond Base
Repair (NRTS)
Serviceable module routed to JEIM
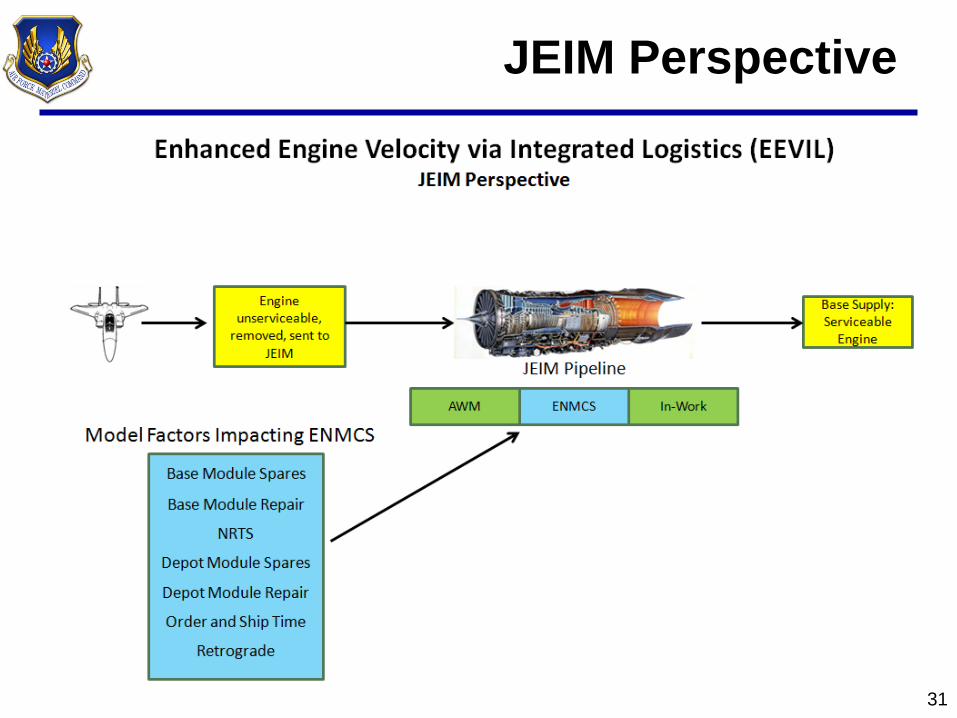
JEIM Perspective
31

Magnitude of Experimental Design
• 23 factors at each base, 10 at depot – Engine Flow days (excluding ENMCS), Base Module TATs, Order & Ship Time,
Retrograde Time, Depot Module TATs, NRTS Rates, Serviceable Modules at Depot
• Full factorial design would require 233 or 8,589,934,592 model runs!
• Consulted with AFIT/ENS – Developed definitive screening design which allowed us to
check for all main effects, all 2-way interactions, and for curvature of all main effects
– Reduced number of runs required to 77 • Replicated 5 times
• Response of interest: – Number of serviceable engines – ENMCS – Probability engine level is greater than or equal to WRE
32
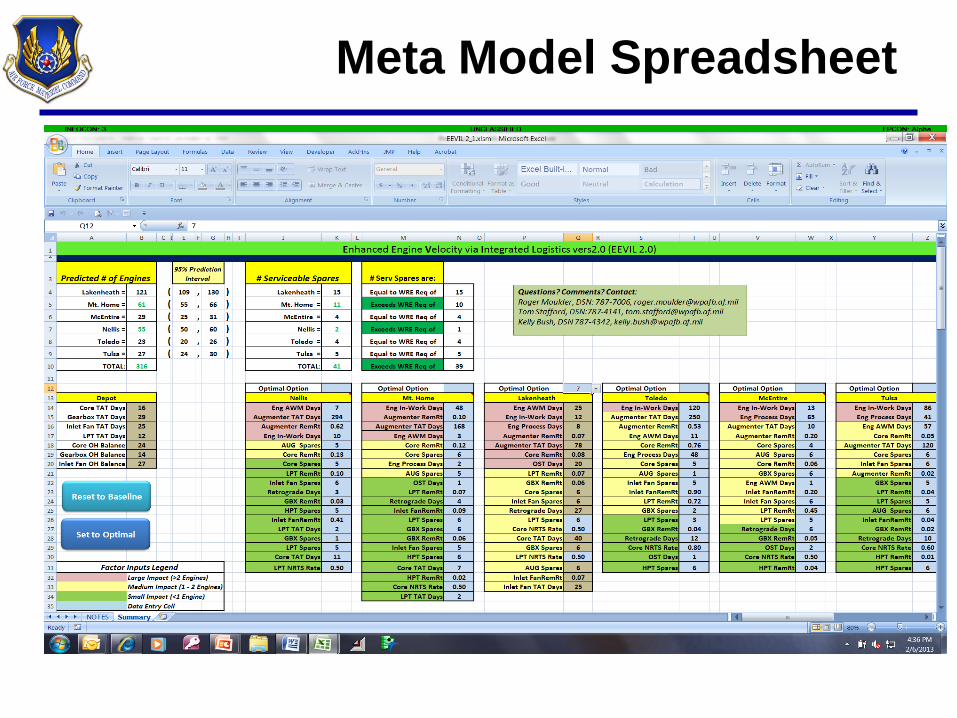
Meta Model Spreadsheet
Results
• Identified significant factors in repair network for improvement
• Identified optimal settings for each base as well as for entire network
• Provides engine managers a desktop tool that helps make repair network more effective and efficient
34

Summary
• Maintenance planning has significant sustainment impacts
• Early, rigorous attention to KPPs and KSAs should guide maintenance planning thus improving product support
• Analysis tools like Simulation Modeling, Design of Experiments, and Linear/Nonlinear programming can inform maintenance planning
35


Focus Areas for Today
38
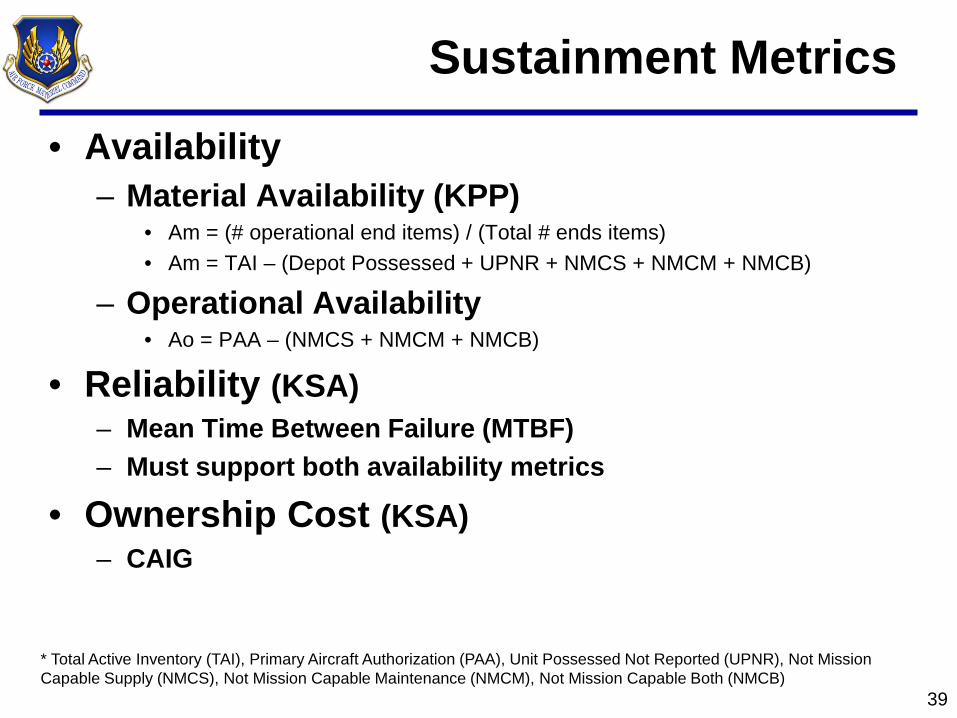
Sustainment Metrics
• Availability – Material Availability (KPP)
• Am = (# operational end items) / (Total # ends items) • Am = TAI – (Depot Possessed + UPNR + NMCS + NMCM + NMCB)
– Operational Availability • Ao = PAA – (NMCS + NMCM + NMCB)
• Reliability (KSA) – Mean Time Between Failure (MTBF) – Must support both availability metrics
• Ownership Cost (KSA) – CAIG
39
* Total Active Inventory (TAI), Primary Aircraft Authorization (PAA), Unit Possessed Not Reported (UPNR), Not Mission Capable Supply (NMCS), Not Mission Capable Maintenance (NMCM), Not Mission Capable Both (NMCB)
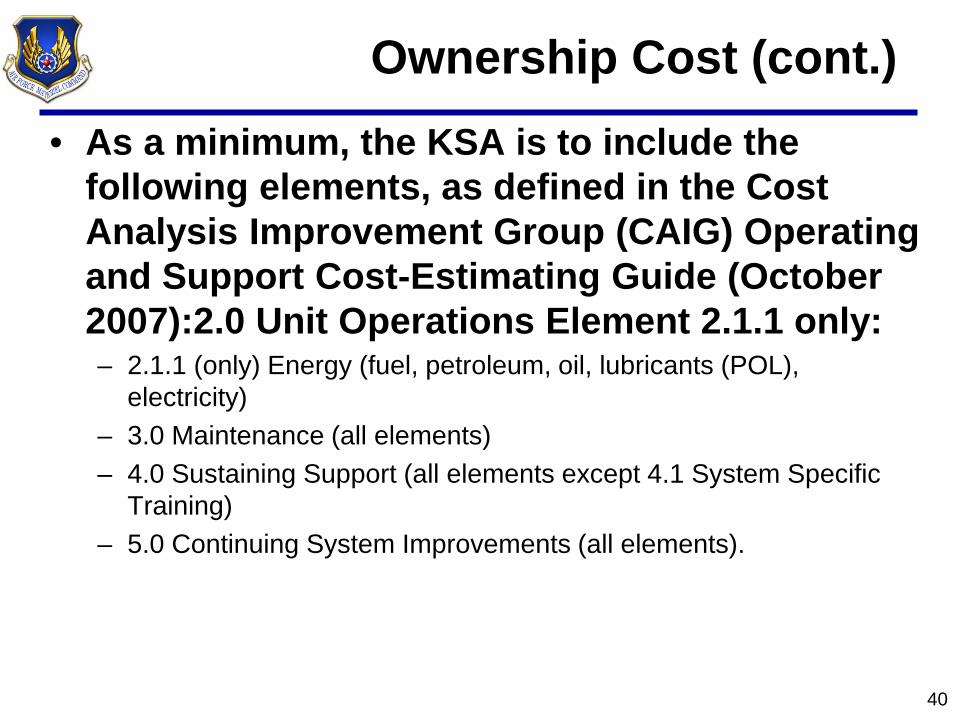
Ownership Cost (cont.) • As a minimum, the KSA is to include the
following elements, as defined in the Cost Analysis Improvement Group (CAIG) Operating and Support Cost-Estimating Guide (October 2007):2.0 Unit Operations Element 2.1.1 only: – 2.1.1 (only) Energy (fuel, petroleum, oil, lubricants (POL),
electricity) – 3.0 Maintenance (all elements) – 4.0 Sustaining Support (all elements except 4.1 System Specific
Training) – 5.0 Continuing System Improvements (all elements).
40

Tools Evaluation
41
Legend
DSOR Analysis Recommendations
• Form DSOR Team (e.g., Program Office, ALC/OB (Candidate Depot), AFSPC/A4U, AFLCMC/LG, AFSC/LG, AFNWC, planners/schedulers, SMEs, etc.)
• Leverage available data (cost, data rights, commonality, Product Support BCA, FEMECA, LORA, MTA, etc…) per AFI 63-101
• Team performs internal system/program-level analysis • Team performs Enterprise commonality analysis (program and
SOR) • Align with strategic objectives (program and SOR) • Pursue organic/contract? • Document CD capability and capacity (if organic) • Complete template with appropriate justification
42
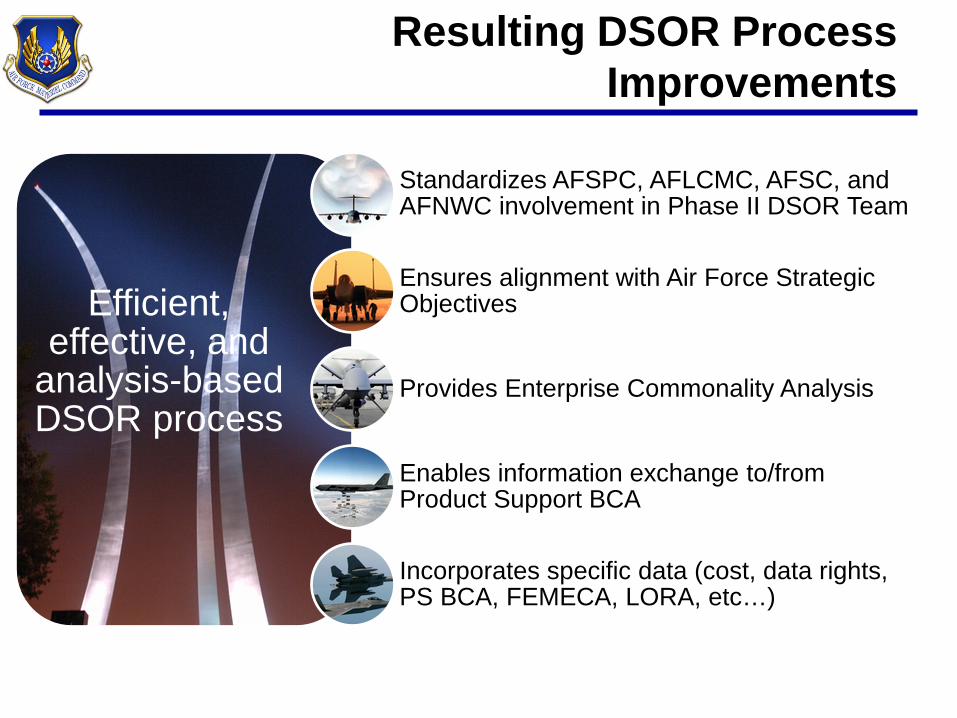
Resulting DSOR Process Improvements
Efficient, effective, and
analysis-based DSOR process
Standardizes AFSPC, AFLCMC, AFSC, and AFNWC involvement in Phase II DSOR Team
Ensures alignment with Air Force Strategic Objectives
Provides Enterprise Commonality Analysis
Enables information exchange to/from Product Support BCA
Incorporates specific data (cost, data rights, PS BCA, FEMECA, LORA, etc…)

Process Realignment
• Initial Core Assessment (10 USC 2464, 10 USC 2366a) transfers from HQ AFMC/A4DC to SORA submitter
• Candidate Depot Determination transfers from HQ AFMC/A4DC to AFSC – Continues to be based on the Technology Repair Center (TRC)
construct • Training and modifications to DSORII in progress • Changes in responsibilities scheduled to coincide with
next major release of DSORII (~May 2014) • Benefits of transfers include:
– Built-in process in DSOR II for immediate core assessment if program is close to milestone A
– AFSC well-suited to improve coordination of candidate depot determinations
44