PRODUCT SECTION Product - SOA
24
Product Matters 3 An Overview of Life and Annuity Living-Benefit Riders By Carl Friedrich 4 Chairperson’s Corner By Jim Filmore 7 What’s Trending In The Universal Life Market? More Of The Same By Susan J. Saip 13 Predictive Modeling Techniques Applied to Quantifying Mortality Risk By Vincent J. Granieri 16 Actuarial Guideline 49 (aka Actuarial Guideline YY) By Donna Megregian 19 Term Conversion Survey Results By Kyle Proebsting and Lindsay Meisinger ISSUE 93 • OCTOBER 2015 PRODUCT DEVELOPMENT SECTION An Overview of Life and Annuity Living-Benefit Riders Page 3 By Carl Friedrich
Transcript of PRODUCT SECTION Product - SOA

Product Matters
3 An Overview of Life and Annuity Living-Benefit Riders
By Carl Friedrich 4 Chairperson’s Corner
By Jim Filmore
7 What’s Trending In The Universal Life Market? More Of The Same
By Susan J. Saip
13 Predictive Modeling Techniques Applied to Quantifying Mortality Risk
By Vincent J. Granieri
16 Actuarial Guideline 49 (aka Actuarial Guideline YY)
By Donna Megregian
19 Term Conversion Survey Results By Kyle Proebsting and
Lindsay Meisinger
ISS
UE
93
• O
CT
OB
ER
20
15
PRODUCT DEVELOPMENT
SECTION
PRODUCT DEVELOPMENT
SECTION
An Overview of Life and Annuity Living-Benefit RidersPage 3
By Carl Friedrich

2 | OCTOBER 2015 PRODUCT MATTERS
Product Matters
2015 SECTION LEADERSHIP
OfficersJim Filmore - Chairperson
Jeremy Bill - Vice Chairperson
Kelly Rabin - Secretary/Treasurer
Council Members2015 SOA Annual Meeting & Exhibit Simpa BaiyePaul FedchakJoseph KordoviVera LjucovicKendrick LombardoDonna Megregian
Board Partner Ronnie Klein
Other Representatives Simpa BaiyeJeremy BillJim FilmoreKurt GuskeDean KerrDonna Megregian
Newsletter Editors Simpa Baiye, [email protected]
Kurt Guske, Co-Editor [email protected]
Vera Ljucovic, [email protected]
SOA StaffKathryn Baker, Staff [email protected]
Jim Miles, Staff [email protected]
Ronora Stryker, Staff Research [email protected]
Julissa Sweeney, Graphic Designer [email protected]
Published by the Product Development Section Council of the Society
of Actuaries
This newsletter is free to section members. Current issues are available
on the SOA website (www.soa.org).
To join the section, SOA members and non-members can locate a membership form on the Health Section Web page at
www.soa.org/product-development.
This publication is provided for informational and educational purposes
only. The Society of Actuaries makes no endorsement, representation
or guarantee with regard to any content, and disclaims any liability
in connection with the use or misuse of any information provided herein.
This publication should not be construed as professional or financial
advice. Statements of fact and opinions expressed herein are those of the individual authors and are not
necessarily those of the Society of Actuaries.
This newsletter is free to section members.
© 2015 Society of Actuaries. All rights reserved.
Issue Number 93 • October 2015
Published by the Product Development Section Council of the Society
of Actuaries.
475 N. Martingale Road, Suite 600 Schaumburg, Ill 60173-2226
Phone: 847.706.3500 Fax: 847.706.3599
SOA.ORG

OCTOBER 2015 PRODUCT MATTERS | 3
The life insurance industry has expanded its product offerings significantly in
the last few years. Some of the most innovative new coverages are provided by riders that can be attached to life insurance policies, and in some cases an-nuities. These “combination” plans allow base policy values, such as life insurance death benefits and cash values, to be accelerated to the policyholder prior to death in the event of a long-term care need or, under some policies, a chronic illness event. In addition, many of these plans will continue long-term care insurance (LTCi) benefit payments even after the base plan values are depleted. This provides a form of insurance leverage that can result in LTCi benefits that might be double or triple the life insurance death benefit. These riders make life insurance or annuities more useful to the policyholder, pro-viding living benefits to address this under-insured need of our society. At the same time, con-trasted with stand-alone LTCi policies, these policies reduce the risk to insurance companies. Policyholders of combination plans share in the LTC risk since they are using their own “assets” first (such as receiving “an advance” on their life insur-
ance benefit) to pay for the first layer of coverage. This factor, and other by-products of these riders such as the reduction in lapse activity on the underlying base plans, make these products a win-win proposition for insur-ers and consumers alike.
A 2015 Society of Actuaries Re-port titled “Life and Annuity Living Benefit Riders: Consid-
erly, may allow chronic illness benefits to be free of federal in-come tax, subject to certain IRS rules and limits.
Most plans require that for ben-efits to be paid, the insured must be certified by a licensed health care practitioner to be chron-ically ill, which often starts with the requirement that the in-sured is unable to perform two or more activities of daily living (ADLs), or suffers from a severe cognitive impairment. State insurance laws require a series of provisions to be met under these chronic illness plans:
• A lump sum payout option is required, commonly but not always interpreted by regu-lators as annual lump sums (often spreading the pay-
erations for Insurers and Rein-surers,” available on the Soci-ety of Actuaries website (www.soa.org), covers a wide range of living benefit riders with med-ically related triggers on life or annuity products. This article will cover several of those.
CHRONIC ILLNESS ACCELERATED DEATH BENEFIT RIDERSThe first products covered are chronic illness riders attached to life insurance policies that provide for Accelerated Death Benefits (ADB) to be paid un-der conditions prescribed by the rider. Insurance laws and regulations and tax laws govern these plans. The purchase of accelerated benefit chronic ill-ness riders, if structured prop-
An Overview of Life and Annuity Living-Benefit Riders By Carl Friedrich
CONTINUED ON PAGE 5

4 | OCTOBER 2015 PRODUCT MATTERS
to form a team and take on all challengers. We stocked up on fruits and vegetables and reg-ularly re-filled our water bot-tles throughout the work day. We then searched for volun-teer opportunities in our local community that were flexible in terms of accepting people to help outside of normal business hours. During the first week, we volunteered with the Atlanta Community Food Bank. It was eye-opening for all of us to find out how much this charity does for our local community. Our group washed and sorted fresh fruits and vegetables which the food bank then sells at cost through three local farmers’ markets that they organize. They told us how the program is focused in some of the poorer sections of town to help make fresh fruits and vegetables more affordable to those who other-wise may defer to eating less nu-tritious meals. At the end of our volunteer assignment, we felt good about what we had accom-plished. We also learned to ap-preciate those who consistently give their time and energy to help others and to ensure that our local community is thriving.
This experience reminded me that one of the greatest gifts that we can give ourselves is to serve others. Serving others could involve talking to elderly peo-
I encourage everyone to find a way to serve others. You may very well find that both your personal well-being and your professional life will grow and prosper as a result of your service.
Thank you for allowing me this time to serve as the chairperson of the Product Development Section Council! n
How often have you heard someone say that they received more
than they gave when partici-pating in some form of volun-teering? In my experience that outcome is common especially when the volunteer activity in-volves interaction with others and goes beyond just a financial donation.
My company is in the midst of an eight week health and well-ness challenge. The concept is simple: form teams and com-pete both against other teams and yourself to be healthier. The criteria that the program utilizes are a balance between simplicity and effectiveness. The categories are water, fresh fruits and vegetables, exercise, sleep, and weekly volunteering. The first four categories should be obvious to most people. However, one may question why volunteering belongs as a main criterion for a health and wellness program as at first it appeared out of place to me. However, upon further reflec-tion, I realized that volunteer-ing is an important component of a well-rounded program of health and wellness as I will ex-plain below.
When the program launched, a few individuals from our pricing and marketing areas decided
ple who are in nursing homes, serving meals to those in need, fostering homeless animals, or volunteering with a section of the Society of Actuaries (hint, hint). This article will be pub-lished around the end date of my three-year tenure of service on the Product Development Section Council. While my official capacity on the council is coming to a close, I will take with me numerous relation-ships that have been formed or enhanced over that time period. I also now have expanded my knowledge of multiple topics that can be applied in my daily personal life and work life. My overall investment of service on the council has figuratively yielded a tenfold return.
CHAIRPERSON’S CORNER
Serving Others By Jim Filmore
Jim Filmore, FSA, MAAA, is a vice president and actuary responsible for Munich Re’s U.S. individual life pricing teams. He can be reached at [email protected].

OCTOBER 2015 PRODUCT MATTERS | 5
outs over two to four years). The SOA report included a survey of direct writers, and among 23 plans, 17 offer a single lump sum, and 20 of-fer periodic payouts (eight annual, 14 monthly, and oth-er variations).
• The product may not be marketed as LTCi. This re-lates to the fact that although some chronic illness riders may pay benefits in largely the same situations as LTCi, they do not meet the con-sumer protection require-ments to qualify as LTCi and do not provide the full range of benefits as LTCi. For ex-ample, chronic illness ben-efits are constrained to the life insurance death benefit, and inflation related benefit increases are not generally available on these plans.
• Allowable pricing methods include a dollar-for-dollar death benefit reduction ap-proach with upfront charges, a discounted death benefit approach, and the lien ap-proach, which will be ex-plained below.
• Terminal illness benefits are included on most plans with chronic illness riders (and required under some regu-lations).
So how do these ADB riders work? Under the discounted death benefit design, the riders are “free” with no extra cost up-front, but when medical trigger requirements are met, a portion of the life death benefit is paid out. However, only a discount-ed portion of the reduction to the death benefit is paid to the policyholder. For example, if the policy has a two year an-nual lump sum ADB rider on a
$250,000 life insurance policy, upon the first claim the death benefit would be reduced by $125,000 ($250,000/2 years), and upon the second claim if the insured is still chronical-ly ill, the remainder of the life policy would be used up. The actual payments to the insured would each be less than the two $125,000 reductions to the death benefit, and those amounts will be dependent on the age of the insured and the mortality assumptions and fac-tors in use by the insurance company at that time. At young-er ages, the payout amounts may be fairly small percentages of the reductions to the life in-surance face amounts. For ex-ample, the policyholder might only receive $100,000 in total as accelerated benefits over the two year period as opposed to the $250,000 they would have received if they kept their cov-erage (and paid premiums) un-til their death.
Under the lien approach, nor-mally offered without an up-front charge, benefits are not discounted, but a lien is placed on the policy values and lien interest is normally charged to the policyholder, so this works essentially like a loan to the policyholder.
For riders with charges up-front, most notably the dol-lar-for-dollar death benefit re-duction approach, a portion of the life death benefit is paid pe-riodically, and the policyholder receives the full amount equal to the reduction in the death benefit. The charges for these riders are often only 10 percent to 15 percent of the cost of the base plan, which many might
view as more attractive than dealing with the uncertainty of what benefits might be paid un-der the discounted death bene-fit approach.
The SOA survey of insurance companies issuing chronic ill-ness riders revealed that these riders are attached to a variety of base plans, with the most common being universal life, whole life, and indexed univer-sal life. As noted above, triggers usually require licensed health care practitioner certification, and the inability to perform two of six ADLs or cognitive impairment, but seven plans out of 23 also require perma-nent nursing home confine-ment. Fourteen of 23 require an expectation of permanence of the condition, which is more restrictive than most LTCi re-quirements.
The study also involved inter-views with reinsurers. More reinsurers are moving to partic-ipate in full in these coverages, but various concerns were ex-pressed. The biggest concern is with the discounted death ben-efit method. There were com-ments about low percentage payouts under certain circum-stances, and whether insurers were able to provide enough information to consumers to avoid unrealistic policyholder expectations. It was noted that in the past, very few people have taken a discounted death benefit offer unless they were relatively healthy and the dis-count was not that substantial. Some reinsurers went so far as to question whether chronic illness discounted death bene-fits can work well without un-derwriting at the time of claim,
which would allow companies to provide a payout appropriate to the insured’s actual medical condition at that point.
LONG-TERM CARE INSURANCE ACCELERATED DEATH BENEFIT RIDERSAnother type of living bene-fit covered in the report was LTCi Riders that provide an acceleration of life insurance benefits. These are very similar to chronic illness riders, with a few key differences.
They are governed by LTCi laws and regulations, with some exemptions from normal LTCi rules. Most qualify as tax quali-fied LTC under IRC 7702B, so benefits are generally tax-free subject to some IRS limits.
Under an LTCi ABR, a speci-fied portion of the death ben-efit is eligible to be paid each month on claim with a pro-portionate reduction to cash values when traditional LTCi triggers are met (two of six ADL’s or cognitive impairment, with no permanence re-quirement). This difference in trigger requirements relates to different regulations that gov-ern chronic illness ADB riders and LTCi ABR riders. Allowed benefit structures include the dollar-for-dollar death benefit reduction approach, or the lien approach, but the discounted death benefit approach is not allowed.
There are three potential types of payout structures. Expense reimbursement plans pay ben-efits that are capped at the lesser of the maximum payout specified in the rider, such as 2
CONTINUED ON PAGE 6
An Overview of Life and Annuity Living-Benefit Riders | CONTINUED FROM PAGE 3

6 | OCTOBER 2015 PRODUCT MATTERS
percent or 4 percent of the face amount every month, or at the level of LTC expenses actually incurred. Indemnity plans or disability plans pay an amount specified in the policy without regard to actual LTC expenses incurred. The indemnity design does require proof that formal care is being received (i.e., re-ceipts from providers), while the disability model does not. Under the disability model, the insurance benefits are paid even if the only care is being provid-ed by family members or other informal care providers.
Most LTCi riders are expense reimbursement or indemnity, which lowers the cost of cov-erage compared to a disability model. In contrast, all chronic illness riders are based on the disability model due to regula-tions.
The SOA survey on LTCi ABR riders indicated that universal life is the most common base plan. Five of eight companies use an indemnity structure and two use a disability model un-der plans where only an accel-eration rider is included. How-ever, this section of the survey does not include those products that also include an Extension of Benefit rider (EBR), which continues coverage after the full face amount is depleted and which may result in LTCi ben-efits that are double or triple the life insurance death benefit if catastrophic LTC expenses are incurred, which leads us to the next set of living benefits.
LIFE/LTCI LINKED BENEFIT PRODUCTSThe products that include both an accelerated LTCi benefit,
as well as additional benefits (EBRs) that are payable with-out reducing the base plan values, are sometimes called “linked-benefit” products, and can feature a life insurance or an annuity base plan. All LTCi reg-ulations apply to the EBR pro-visions/riders. From the SOA survey on life/LTC linked-ben-efits, four are attached to single premium products only, one is attached to both single and recurring premium plans, and two are attached to recurring premium products only. Five of seven use the expense reim-bursement model, and two use an indemnity structure. They are all required to offer infla-tion benefits and nonforfeiture benefits to applicants. Reinsur-ers are increasingly providing support for LTCi accelerated death benefit riders, but there is still only limited support for the EBR and inflation benefit pro-visions that these plans offer.
ANNUITY/LTCI LINKED BENEFIT PRODUCTSThe annuity linked-bene-fit plans work much like the life linked-benefit plans, but the amounts paid out during the accelerated benefit period under most designs are a per-centage of the annuity cash
value at the time of initial claim (with surrender charges being waived), as opposed to a percentage of a life insur-ance face amount. In contrast, some plans base the LTCi ben-efit on a multiple of the initial premium going into the pol-icy. These policies include an extension of benefit feature, as do life linked-benefit plans. This feature continues the monthly LTCi benefits, after the account value is depleted, for an extension period spec-ified in the policy so long as LTCi claim requirements are still met. Inflation benefits are also offered. Not all survey re-spondents answered the ques-tion of what design their policy used, but two indicated that benefits were based on account value at the time of claim, and two said that LTCi benefits were based on a multiple of initial premium. Essentially all of the annuity linked-benefits feature a single premium base plan. One is a variable annuity contract, and the other respon-dents reflected a mix of book value annuities or market val-ue adjusted annuities. Three of five plans reported the use of an expense reimbursement structure, and two feature an indemnity design.
CONCLUSIONIn summary, there is widespread interest and participation by both direct writers and rein-surers in living benefit riders. A wide variety of regulations apply, and favorable tax treat-ment of benefits can be realized by policyholders under several structures, subject to certain limitations. Behind the scenes, reinsurers are working more with direct writers to provide complete reinsurance mecha-nisms to support this business. Sales information gathered from the survey was somewhat fragmented. However, from data gathered in the survey for 2013, plus other sources, the authors estimate chronic illness sales (total policy premium) to be $1.2 billion in first year pre-mium, sales with LTCi riders on life business to be over $2 billion in first year premium in-cluding base plan and rider to-tals, and annuity linked-benefit business to be over $300 mil-lion and climbing. In addition, a number of companies are re-porting that a growing percent-age of their life insurance sales include some form of living benefit rider. This is a very pos-itive sign for the industry and consumers alike, and one that should continue as additional innovative solutions emerge to cover the risks of long-term care or chronic illness. n
Carl Friedrich, FSA, MAAA, is a principal and consulting actuary with the Chicago office of Milliman. Carl specializes in the
design and pricing of life insurance, long-term care, and annuity insurance products. He can be reached at [email protected].
These riders make life insurance or annuities more useful to the policyholder, providing living benefits to address this under-insured need (coverage for long term care or chronic illness) of our society.
An Overview of Life and Annuity Living-Benefit Riders

OCTOBER 2015 PRODUCT MATTERS | 7
eighth annual survey of lead-ing UL insurers delves into the issues and challenges of these products, allowing companies to benchmark their practices against the competition. For purposes of the survey, sales were defined as the sum of re-curring premiums plus 10 per-cent of single premiums. The scope of the Milliman survey included UL with secondary guarantees (ULSG), cash accu-mulation UL (AccumUL), cur-rent assumption UL (CAUL), and the indexed UL (IUL) counterparts of these products. The definition of these product types is as follows:
Survey results are based on responses from 29 carriers of UL/IUL products. This article provides a summary of the key fi ndings of the survey.
UL SALESThe mix of UL sales (excluding IUL sales) reported by survey participants for calendar years 2011 through 2013, and for 2014 as of Sept. 30, 2014 (YTD 9/30/14) are shown in Figure 1. Individual company results were varied, but nine partici-pants reported at least a 25 per-cent shift from or to any one UL product when looking at the YTD 9/30/14 product mix relative to that of 2013. Nine of the 29 participants reported movement to ULSG products, nine to AccumUL products, and eight to CAUL products. Sales of ULSG products were discontinued by fi ve partici-pants. One participant began selling ULSG products, and one began selling AccumUL products.
Trends in the universal life (UL) market of the past few years continued in
2014 and into 2015. Sales in this market have been driven by indexed universal life (IUL) and living benefit riders on UL/IUL products. UL/IUL contin-ues to garner the biggest market share (measured by annualized premium) of total individual life sales (37 percent1 as of March 31, 2015). IUL sales account-ed for 52 percent1 of total UL/IUL sales in the first quarter of 2015. These facts demonstrate the ongoing importance of UL/IUL products in the U.S. indi-vidual life market. Milliman’s
UL/IUL with Secondary Guar-antees: A UL/IUL product de-signed specifi cally for the death benefi t guarantee market that features long-term (guaranteed to last until at least age 90) no-lapse guarantees either through a rider or as a part of the base policy.
Cash Accumulation UL/IUL: A UL/IUL product designed specifi cally for the accumula-tion-oriented market where cash accumulation and effi cient distribution are the primary concerns of the buyer. With-in this category are products that allow for high-early-cash value accumulation, typically through the election of an ac-celerated cash value rider.
Current Assumption UL/IUL: A UL/IUL product designed to offer the lowest cost death ben-efi t coverage without death ben-efi t guarantees. Within this cat-egory are products sometimes referred to as “dollar-solve” or “term alternative.”
What’s Trending in the Universal Life Market? More of the Same By Susan J. Saip
Perc
ent o
f Tot
al In
divi
dual
UL
Sale
s
59%
66%65%
70%
60%
50%
40%
30%
20%
10%
0%
58%
23%
12% 13% 14% 16%
21%
27%25%
2011 2012 2013 YTD 9/30/14
nn ULSG nn Cash Accumulation UL nn Current Assumption UL
CONTINUED ON PAGE 8
Figure 1 UL Product Mix by Year

8 | OCTOBER 2015 PRODUCT MATTERS
In 2013, the average percent-age of ULSG sales (based on policy count) with the selection of no lapse guaranteed (NLG) premiums to age 90 or longer was 81.3 percent, with a medi-an of 100.0 percent. The aver-age reported for YTD 9/30/14 was 78.2 percent, with a medi-an of 99.0 percent. Percentages ranged from 3.7 percent to 100 percent, and in general, were
LIVING BENEFIT RIDER SALESAccelerated death benefi t rid-ers on individual life insurance policies have been popular for many years. More recently, the triggers for these benefi ts have expanded from terminal illness, to chronic illness and long-term care. Under chronic illness riders, payment of the death benefi t may be accelerat-ed if the insured has a chronic illness condition. Requirements to trigger the benefi t typically
slightly higher than percentag-es reported in last year’s survey.
INDEXED UL SALESThe continued trend of increas-ing IUL sales is evidenced by the percentage increase in the IUL market share from 2011 to YTD 9/30/14. Total IUL sales as a percent of total UL and IUL sales combined for survey participants increased from 25 percent in 2011 to 45 percent
utilize a combination of activi-ties of daily living (ADLs) and cognitive impairment, or per-manent nursing home confi ne-ment.
Chronic illness riders are typi-cally fi led under the Accelerat-ed Benefi ts Model Regulation 620. For long-term care (LTC) accelerated benefi t riders, pay-ment of the death benefi t is accelerated if the insured has a chronic illness condition triggering long-term care (i.e.,
during YTD 9/30/14. AccumI-UL sales increased from 70 per-cent to 82 percent of total cash accumulation UL/IUL sales and CAIUL sales increased from 5 percent to 17 percent of total current assumption UL/IUL sales. The recent increase in IUL sales is attributed to the increasing number of new entrants in the IUL market in recent years, policyholders’ in-terest in the upside potential
ADLs, cognitive impairment). LTC accelerated benefi t riders are typically fi led under Long-Term Care regulations. Other legal and design differences exist between chronic illness and long-term care accelerated benefi t riders as well.
Fifteen of the survey partici-pants currently offer a chronic illness accelerated benefi t rider on either a UL or IUL chassis. During the fi rst nine months of 2014 sales of policies with
and downside protection of-fered by IUL products, and the attractiveness of IUL illustra-tions. Overall survey statistics suggest that companies plan to focus more on cash accumula-tion IUL and current assump-tion IUL products and less on universal life with secondary guarantees. The signifi cance of AccumIUL products within the IUL market is illustrated in the graph in Figure 2.
chronic illness riders as a per-cent of total sales were 17 per-cent for UL products. Since more new IUL products have been developed recently, and many of these include a chronic illness rider, a greater share of chronic illness riders on an IUL chassis was seen (45 percent). YTD 9/30/14 sales with chron-ic illness riders as a percent of total sales for UL and IUL products separately by product type are shown in the table in Figure 3.
What’s Trending in the Universal Life Market? More of the Same
Figure 2 IUL Product Mix by Year
Perc
ent o
f Tot
al In
divi
dual
IUL
Sale
s
85%85%
74%
87%
7%4% 3% 9%
2011 2012 2013 YTD 9/30/14
nn IULSG nn Cash Accumulation IUL nn Current Assumption IUL
11% 12% 4%19%
100%
80%
60%
40%
20%
0%

OCTOBER 2015 PRODUCT MATTERS | 9
Three different approaches can be used for the payment of chronic illness accelerat-ed death benefits. Under the discounted death benefit ap-proach, the insurer pays the owner a discounted percentage of the face amount reduction, with the face amount reduc-tion occurring at the same time as the benefit payment. This approach avoids the need for charges up front or other pre-mium requirements for the rid-er, because the insurer covers its costs of early payment of the death benefit via a discount fac-tor. Eight of the 15 participants that reported UL/IUL sales with chronic illness riders pro-vide a discounted death benefit as an accelerated benefit.
Six additional participants re-ported their chronic illness rid-er uses a lien against the death benefit to provide the accelerat-
ed benefit, and one survey par-ticipant uses a dollar-for-dol-lar death benefit reduction approach. Under the lien ap-proach, the payment of accel-erated death benefits is con-sidered a lien or offset against the death benefit. Access to the cash value (CV) is restricted to any excess of the CV over the sum of the lien and any other outstanding policy loans. The gross policy values continue as if the lien did not occur. That is, future premiums/charges are unaffected, and the gross CV continues to grow as if the lien didn’t exist. In most cases there are lien interest charges that are assessed under this design.
Under the dollar-for-dollar ap-proach, there is a dollar-for-dol-lar reduction in the death ben-efit and a pro rata reduction in the CV based on the percentage of the death benefit accelerated.
This approach always requires an explicit charge. Note that a recent SOA study reported a higher mix of plans using the dollar-for-dollar reduction ap-proach.
The aging population and high cost of medical care have drawn attention to long-term care (LTC) needs. One solu-tion for LTC needs is the use of LTC riders attached to UL/IUL policies (linked benefits) as an alternative to standalone LTC policies. During YTD 9/30/14, sales of policies with LTC riders as a percent of total sales were 18 percent for UL products and 9 percent for IUL products, both at peak levels. Figure 4 shows sales of LTC riders as a percent of total sales reported by survey participants for UL and IUL products sepa-rately by product type.
Few companies in the UL/IUL market offer both chronic illness riders and LTC riders; only three of the survey partic-ipants offer both chronic illness and LTC accelerated bene-fit riders. Nearly 86 percent of survey respondents expect to market either an LTC or a chronic illness rider within the next 24 months.
PROFIT MEASURESAs has been reported in the past, an after-tax, after capital statutory return on investment/internal rate of return (ROI/IRR) is the predominant prof-it measure reported by survey participants. The median ROI/IRR is 12 percent for all UL product types, except it is 10 percent for AccumUL, and 12.5 percent for IULSG.
Survey respondents reported their actual results relative to profit goals for 2013 and YTD 9/30/14. In 2013, 53 percent of ULSG participants reported they fell short of profit goals. For the remaining UL/IUL products, the majority of par-ticipants were at least meeting their profit goals. The percent-age of survey respondents re-porting they fell short of profit goals during YTD 9/30/14 for ULSG was 59 percent. Again, for all other UL/IUL product types, the majority of partic-ipants were at least meeting their profit goals. The chart in Figure 5 shows the percentage of survey participants report-ing they fell short of, met, or exceeded their profit goals by UL product type. Low interest earnings and expenses continue to be the top two reasons given for failure to meet profit goals.
YTD 9/30/14 UL Sales With Chronic Illness Riders as a Percent of Total UL Sales (Weighted By Premium)
Total Individual UL ULSG Cash Accumluation UL Current Assumption UL
17% 17% 37% 5%
YTD 9/30/14 IUL Sales With Chronic Illness Riders as a Percent of Total IUL Sales (Weighted By Premium)
Total Individual IUL IULSG Cash Accumluation IUL Current Assumption IUL
45% 31% 44% 58%
Figure 3 Chronic Illness Rider Sales as a Percent of Total Sales
YTD 9/30/14 UL Sales With Long-Term Care Riders as a Percent of Total UL Sales (Weighted By Premium)
Total Individual UL ULSG Cash Accumluation UL Current Assumption UL
18% 26% 10% 4%
YTD 9/30/14 IUL Sales With Long-Term Care Riders as a Percent of Total IUL Sales (Weighted By Premium)
Total Individual IUL IULSG Cash Accumluation IUL Current Assumption IUL
9% 22% 9% 3%
Figure 4 Long-Term Care Rider Sales as a Percent of Total Sales
CONTINUED ON PAGE 10

10 | OCTOBER 2015 PRODUCT MATTERS
What’s Trending in the Universal Life Market? More of the Same
Figure 5 Actual 2013 Results Relative to Profit Goals
85%
18%11%
87%
53% 47%
31%16%
14%7%
86%
64% 83%
0%
17%
nn Exceeded nn Met nn Fell Short
11%
29%
29% 42% 69%
0%
0%
ULSG
Cash Accumulatio
n UL
Current A
ssumptio
n ULIU
LSG
Cash Accumulatio
n IUL
Current A
ssumptio
n IUL
100%
80%
60%
40%
20%
0%
Actual YTD 9/30/14 Results Relative to Profit Goals
85%
12% 11%
87%
59%
47%38%
16%
29% 27%
71%
0%
53%
63%
13%
25%
nn Exceeded nn Met nn Fell Short
11%
20%
29%
42%56%
6%
ULSG
Cash Accumulatio
n UL
Current A
ssumptio
n ULIU
LSG
Cash Accumulatio
n IUL
Current A
ssumptio
n IUL
100%
80%
60%
40%
20%
0%

OCTOBER 2015 PRODUCT MATTERS | 11
PRODUCT DESIGNFour of the 17 participants re-porting ULSG sales repriced their ULSG designs in the last 12 months, and three of those four also reported repricing their ULSG designs in the last 13 to 24 months. Six additional participants repriced in the last 13 to 24 months for a total of nine participants. Four report-ed that premium rates on the new basis versus the old basis increased, and one discontin-ued its ULSG product.
Strategies used in light of the low interest rate environment include:
• Intentionally reducing or limiting UL sales by increas-ing premium rates (11 par-ticipants), or discontinuing sales of certain products (11)
• Instituting premium limita-tions (seven)
• Riding it out (10)• Launching new designs with
reduced guarantees (nine)
ILLUSTRATIONSFourteen of the 29 survey par-ticipants are no longer illustrat-ing non-guaranteed elements on ULSG products, up slightly from last year.
Participants reported the medi-an illustrated rate used in IUL illustrations is 7.50 percent, with an average of 7.10 per-cent. Similarly, the median rate one year ago was 7.29 percent, with an average of 7.06 percent. Nineteen of 20 participants re-ported that the illustrated rate is based on a look-back period, with 11 using a 25-year period, and seven using a 30-year peri-od. Eight participants reported that the illustrated rate applies to both non-loaned and loaned values, and 11 reported that it does not apply to both values.
Survey participants reported if they are currently testing in-force business or using ASOP 24 Section 3.7 to not test when certifying for illustration actu-ary testing on in-force business. ASOP 24 Section 3.7 applies to illustrations on policies in-force one year or more. Twelve of 25 participants reported they are currently using ASOP 24 Sec-
tion 3.7 to not test when cer-tifying for illustration actuary testing, and nine are testing in-force business. The remaining four participants are using both approaches.
Twenty-one of 28 participants are doing sensitivity testing to see where the disciplined current scale (DCS) breakpoints are (i.e., when the DCS might fail).
Three participants reported they are illustrating utilization scenarios/examples for acceler-ated death benefit (ADB) riders with a discounted death benefit approach. Four participants are doing so for other ADB riders. The majority of participants that are illustrating ADB utilization reported that the illustrations are in a supplemental illustra-tion, rather than in the basic illustration.
CONCLUSIONWhile many trends from the past continue within the UL/
IUL market, it isn’t always easy to keep up to date on an indus-try that constantly presents new challenges and opportunities. Staying abreast of practices that are prevalent in the industry is critical for those insurers striv-ing to compete in this market. Industry data, such as that in-cluded in the UL/IUL survey, can help insurers stay ahead of the curve and react as changes occur. A complimentary copy of the executive summary of the June 2015 Universal Life and Indexed Universal Life Issues report may be found at: http://us.milliman.com/insight/ 2 0 1 5 / U n i v e r s a l - l i f e - a n d - indexed-universal-life-issues--2014-survey/. n
Participants reported the medi-an illustrated rate used in IUL illustrations is 7.50 percent, with an average of 7.10 per cent.
ENDNOTE
1 LIMRA International, Inc.
Susan J. Saip, FSA, MAAA, is a consulting actuary with Milliman Inc in Buffalo Grove, Ill. She can be contacted at [email protected].

12 | OCTOBER 2015 PRODUCT MATTERS
OCTOBER 2015 PRODUCT MATTERS | 13
1. INTRODUCTION
Actuaries are familiar with the interaction of art and science in their
work. Some view underwriting in the same way, perhaps con-cluding that underwriting leans more toward art than science. With the advent of powerful computers and predictive mod-eling tools, it is possible to an-alyze survival data and produce statistically credible underwrit-ing models that predict relative mortality risk among individu-als based on demographic infor-mation and relevant conditions. In this paper, we will discuss the use of the Cox Proportional Hazards Model in developing a predictive underwriting model that produces a mortality mul-tiplier for each individual.
Further, we wished to quantify the impact on survival, if any, of certain subpopulations. We were looking to validate the time–accepted concepts of the wealth effect (beyond the scope of this paper) and anti-selection in our population.
Cox Proportional Hazards ModelThe Cox Proportional Hazards Model was introduced in 1972 as a method to examine the relationship between survival (mortality) and one or more independent variables, called
explanatory variables. Some advantages of the Cox mod-el are that it can handle many underwritings on the same life and can utilize data that is right censored; i.e. subjects can leave the study at any time or the study can end before all sub-jects have died. The Cox model does not require knowledge of the underlying (base) survival curve, but we will see that this advantage is also a challenge when analyzing mortality.
Cox Model results are ex-pressed as the logarithm of the hazard so technically, the rela-tive risk factor for each variable is obtained by raising e to the power of the log(hazard) ; e.g. consistent with Gompertz. The relative risk factor is interpret-ed just as it sounds: it describes the force of mortality relative to the reference. A relative risk factor of two for a condition means the subject is twice as likely to die as another subject who does not have that condi-tion.
As an aside, we utilized the R statistical package to produce our survival models. It is partic-ularly well-suited for this type of analysis. Other popular sta-tistical packages, such as SAS, also contain survival models us-ing the Cox algorithms.
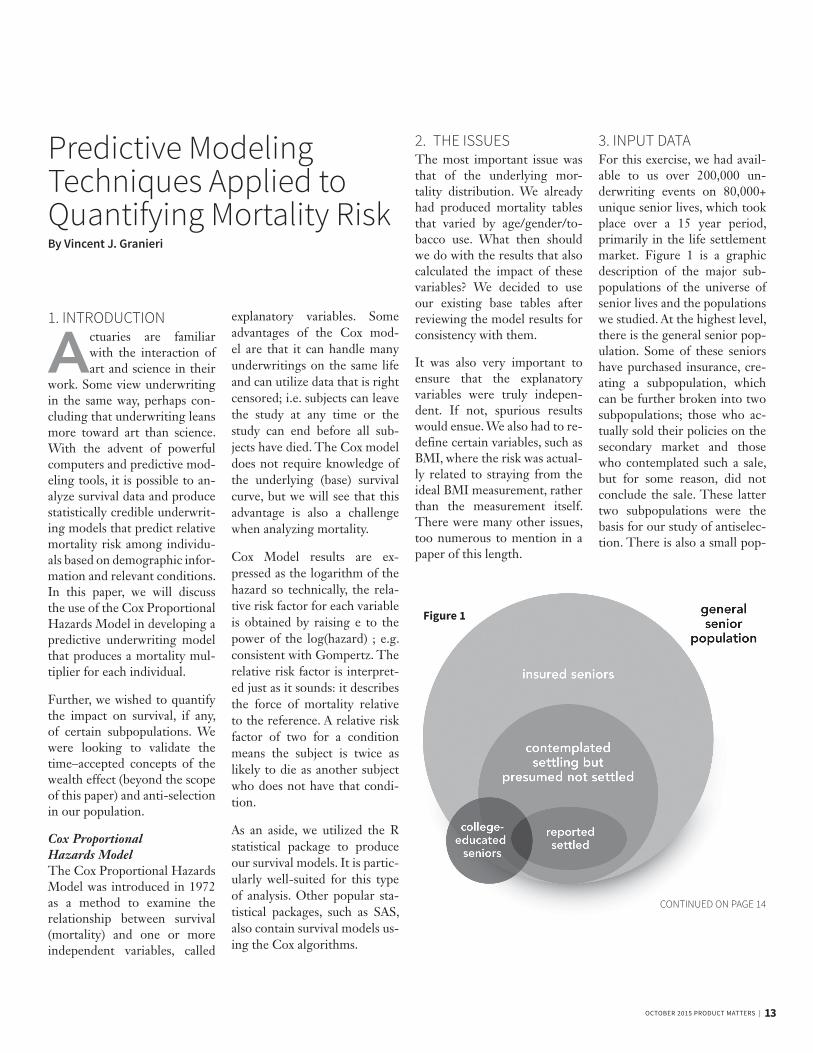
3. INPUT DATAFor this exercise, we had avail-able to us over 200,000 un-derwriting events on 80,000+ unique senior lives, which took place over a 15 year period, primarily in the life settlement market. Figure 1 is a graphic description of the major sub-populations of the universe of senior lives and the populations we studied. At the highest level, there is the general senior pop-ulation. Some of these seniors have purchased insurance, cre-ating a subpopulation, which can be further broken into two subpopulations; those who ac-tually sold their policies on the secondary market and those who contemplated such a sale, but for some reason, did not conclude the sale. These latter two subpopulations were the basis for our study of antiselec-tion. There is also a small pop-
2. THE ISSUESThe most important issue was that of the underlying mor-tality distribution. We already had produced mortality tables that varied by age/gender/to-bacco use. What then should we do with the results that also calculated the impact of these variables? We decided to use our existing base tables after reviewing the model results for consistency with them.
It was also very important to ensure that the explanatory variables were truly indepen-dent. If not, spurious results would ensue. We also had to re-define certain variables, such as BMI, where the risk was actual-ly related to straying from the ideal BMI measurement, rather than the measurement itself. There were many other issues, too numerous to mention in a paper of this length.
Predictive Modeling Techniques Applied to Quantifying Mortality Risk By Vincent J. Granieri
Figure 1
CONTINUED ON PAGE 14

14 | OCTOBER 2015 PRODUCT MATTERS
Predictive Modeling Techniques Applied to Quantifying Mortality Risk
ulation of college-educated se-niors, some of whom can also be associated with the other popu-lations above, which formed the basis for our study of the wealth effect. This data included de-mographic information such as age, gender, dates of birth and dates of death. It also includ-ed various underwriting con-ditions such as BMI, smoking status and indicators for various diseases. Included were favor-able conditions, such as family history of longevity and good exercise tolerance.
4. CREATING COX PROPORTIONAL HAZARDS MODELSThere was significant data preparation involved. We set up the reference population, which we chose to be males who were age-appropriately active, who did not sell their policies and did not use tobacco. Variables were determined to be either continuous (age, BMI), where the condition has infinite pos-sible values, or binary (CAD, osteoporosis), where the con-dition either exists or does not. This required considerable judgment and depended on the availability and form of the data.
Once the data were prepared, we began the process of de-termining which conditions were statistically significant in predicting mortality. We un-derwent an iterative process. The Cox models were run with every variable included at first. We then we reran the models, first eliminating most of those variables with a p-value greater than 0.2. This means we were excluding those conditions
where the probability that the relative risk shown was due to random fluctuation was over 20 percent. These models were again rerun, this time elimi-nating those conditions with a p-value greater than 0.1. Fi-nally, we reran the models, in-cluding only those conditions where the p-value was at most 0.05.
Figure 2 represents partial output from our models, con-sisting of conditions that were included in all runs even if they did not meet the criteria for continued inclusion above. As we advanced through the pro-cess, we felt strongly that these were fundamental variables that clearly impacted surviv-al and should be included in the analysis regardless of their p-values. In reality, only one variable would have been elim-inated, presumably due to data
All (<=0.05)Log (hazard) Hazard Lower CI Upper CI P-Value
Age 0.077 1.080 1.075 1.085 –
Actual BMI less ideal BMI 0.002 1.002 1.001 1.002 0.000
Recurrent Cancer 0.458 1.581 1.365 1.832 0.000
Female (0.365) 0.694 0.649 0.742 –
Active for their age (0.141) 0.869 0.802 0.942 0.001
Sedentary 0.200 1.221 1.054 1.415 0.008
Unknown activity level 0.102 1.107 1.031 1.189 0.005
Family history of longevity (0.087) 0.917 0.857 0.981 0.012
Family history of super longevity (0.240) 0.787 0.722 0.857 0.000
College-educated population member 0.267 1.306 1.117 1.526 0.001
Settled population member (0.370) 0.691 0.650 0.734 –
Current smoker 0.635 1.887 1.693 2.103 –
Discontinued smoking 0.178 1.195 1.128 1.267 0.000
Rare smoker (0.339) 0.713 0.266 1.911 0.501
Tobacco replacement 0.576 1.780 1.187 2.668 0.005
Unknown tobacco use 0.119 1.127 1.018 1.247 0.021
Figure 2
Reference: Male, nonsmoker, normal activity level

OCTOBER 2015 PRODUCT MATTERS | 15
of other conditions that were shown to be mildly protective, things such as BPH, sleep ap-nea, use of blood thinners and benign colon polyps. We con-cluded that these were indica-tors of frequent/better quality of health care, which would al-low for early detection and mit-igation of more serious risks.
5. BUSINESS OUTCOMESThis analysis was the basis for changes in our debit/credit un-derwriting model. We replaced an additive model based only on clinical judgment with one that was more consistent with mortality research and provid-ed us the flexibility to continue to factor in clinical judgment where appropriate. n
scarcity. Light and dark gray shading indicates that a con-dition is hazardous/protective, with the 95 percent confidence limits and p-values also shown. For example, the female haz-ard is 0.694 of that of males (1.0 as males are the reference) and the smoker hazard is 1.887 times that of nonsmokers. For the other explanatory variables, many were eliminated as the p-value criteria became more stringent.
ConclusionsThe most important conclusion that we drew from this exercise was that despite our best efforts to quantify every aspect of un-derwriting, there is still con-siderable judgment brought to bear in that process. However, there is also much useful infor-
mation that predictive models can provide us because of their ability to process large amounts of data quickly and efficiently. We did validate the anti-selec-tion that occurs between those who actually sell their policy versus those who do not. Some results confirmed our clinical judgment; for example, an ac-tive lifestyle or family history of longevity are indicators of higher survival rates. Other things went against our clinical judgment; for example, cardiac related conditions, while still hazardous, were no longer as significant as we thought.
Then there were the confound-ing results. Hyperlipidemia was shown to be protective. We at-tributed this to the ubiquity of statins. There were a number
Vincent J. Granieri, FSA, MAAA, EA, is the founder and CEO of Predictive Resources in Cincinnati, Ohio. He can be reached at vgranieri@predictivere sources.com.

16 | OCTOBER 2015 PRODUCT MATTERS
Actuarial Guideline 49 (aka Actuarial Guideline YY) By Donna Megregian
This article reflects the view of the author and is not representative of the Society of Actuaries, the Amer-ican Academy of Actuaries or RGA.
After a lot of hours, hard work, and compromise, April 16, 2015, brought
about a new actuarial guideline that was approved by the Life Actuarial Task Force (LATF). This guideline officially will be known as “Actuarial Guideline 49 (AG 49), The Application of the Life Illustrations Mod-el Regulation to Policies with Indexed-Based Interest.” The goal of the guideline is to help bring consistency to the de-termination of the maximum illustrated index crediting rate on indexed universal life pol-icies (IUL), moderate what some perceived as the potential for IUL products to meet with consumer dissatisfaction, and provide guidance to the illus-tration actuary.
By Sept. 1, 2015, for all new business and in-force poli-cies issued on or after Sept. 1, 2015, sections 4 and 5 of the guideline must be reflected in illustrations. By March 1, 2016, Sections 6 and 7 of the guide-line are effective. This article will highlight the provisions of each section of the guideline.
BENCHMARK INDEX ACCOUNTThe guideline establishes new definitions that were not con-templated in the Life Illustra-tion Model Regulation (Model Regulation #582 or the Model Reg) or Actuarial Standard of Practice 24 (ASOP 24). One new term is Benchmark Index Account.
Section 3B of AG49 defines a Benchmark Index Account as an Index Account with the fol-lowing features:
i. The interest calculation is based on the percent change in S&P 500® Index value only, over a one-year period using only the begin-ning and ending index val-ues (annual point-to-point approach). (S&P 500® Index ticker: SPX)
ii. An annual cap is used in the interest calculation.
iii. The annual floor used in the interest calculation shall be 0 percent.
iv. The participation rate used in the interest calculation shall be 100 percent.
v. Index interest is credited once per year.
vi. Account charges, if appli-cable, do not exceed the ac-count charges for any other accounts within the policy.
Actuarial judgment is used when parameters do not line up exactly with the Benchmark In-dex Account. For starters, cre-ate a hypothetical supportable index that meets the definition of Benchmark Index Account and reflect the fundamental characteristics of the index ac-count with the appropriate re-lationship to the expected risk and return of the Benchmark Index Account (Sections 4A and 4C). Regardless of what index or index parameters a compa-ny uses (higher floors, different participation rates, different index, etc.), the maximum illus-trated rate cannot exceed that which is based on what is de-fined as the Benchmark Index Account.
Section 5 of AG49 imposes a limitation on how much a disci-plined current scale can assume as an underlying earned inter-est rate. If the insurer engag-es in a hedging program, the
vii. There are no limitations on the portion of account value allocated to the account.
The S&P 500® along with the other parameters defined were chosen because of its wide-spread recognition, history, and popularity among IUL prod-ucts today.
Section 4 of AG49 describes the calculation for what the max-imum illustrated credited rate can be using the Benchmark Index Account parameters. The basic calculation is a roll-ing 25-year average starting on 12/31 of the calendar year that is 66 years prior to the current calendar year, ending 12/31 of the prior calendar year. Illus-trations in 2015 would use a starting point of 12/31/1949. This longer term rolling aver-age will prevent wide swings in the maximum illustrated rate year to year on the Benchmark Index Account.

OCTOBER 2015 PRODUCT MATTERS | 17
assumed earned interest rate underlying the disciplined cur-rent scale (DCS) cannot exceed 145 percent of the annual net investment earnings rate of the general account assets allocated to support the policy. If a com-pany has a 5 percent net invest-ment earnings rate, the earned interest rate cannot exceed 145 percent x 5 percent = 7.25 per-cent. Without a hedging pro-gram, the earned rate is limited to the net investment earned rate (in this case 5 percent).
Pop quiz: You have an indexed account with a 1 percent floor and a current cap of 11 percent. How would you apply AG 49 to determine your maximum illus-trated credited rate? (Answer in the next edition of Product Matters!)
POLICY LOANS AND ALTERNATE SCALESection 6 of AG 49 limits the arbitrage between the loan charged rate and the credit-ed rate on loaned funds un-der participating loans to 100 bps. Many IUL policies have a participating loan, meaning the loaned amount is credited whatever the other non-loaned funds are credited. The charged rate on the loaned fund may be fixed by the company or vari-able, but until AG 49, the dif-ference between the charge and credit in some circumstances
created a loan arbitrage, or bor-row for less than interest cred-ited. Section 6 mitigates the differential, but does not elim-inate the arbitrage completely.
Section 3A of AG 49 defines the Alternate Scale as a scale of non-guaranteed elements currently being illustrated such that:
i. The credited rate for each account does not exceed the credited rate for the Fixed Account, or, if the insurer does not offer a Fixed Ac-count with the illustrated policy, the average of the credited rate for the illus-trated scale and the guar-anteed credited rate for that account.
ii. If the illustration includes a loan, the illustrated rate credited to the loan balance does not exceed the illus-trated loan charge.
iii. All other non-guaranteed elements are equal to the non-guaranteed elements for the illustrated scale.
This Alternate Scale eliminates any excess interest above the current fixed account and any loan arbitrage. Section 7 of AG 49 requires the Alternate Scale and the illustrated scale devel-oped under Section 4 and 5 be shown side by side. Section 7 also requires additional tables to be shown related to the min-
imum and maximum annual credited rates from Section 4 and 20-year historical results for the actual index account us-ing current index parameters. Modifications to illustration systems can take time to put into the correct format which is why this section has an effec-tive date for next year. Because guaranteed scales are also sup-posed to be shown next to cur-rent illustrated scales based on the Model Reg, companies may need to move to a landscape format or create a new page to display the current and the Al-ternate Scale together.
Pop quiz: I have a variable loan rate that is currently projecting 5 percent, and my benchmark index account is calculated to credit 7 percent. What values can I show in my illustration? (Answer in the next edition of Product Matters!)
OVERALL IMPACTSome may lobby for an update to the Model Reg, as broader issues related to a nearly20-year-old regulation (effective in 1997) may need to be addressed more directly than through an actuar-ial guideline. Loan arbitrage can exist on other products, not just IUL, and companies with po-tential for arbitrage may want to consider AG 49 and the precedent it sets related to this topic. Bring-ing consistency and consumer information is in the spirit of the guideline and the Model Reg, however all products and markets may benefit from a refresh of the Model Reg, although that takes time and state approval.
The guideline will not neces-sarily require products with the
same index parameters to have the same maximum illustrated rate. What is supportable is up to the illustration actuary and involves all aspects of the prod-uct, not just the credited rate. The guideline does provide more direction on how com-panies calculate certain aspects of the parameters that feed into the testing.
At the time of this writing, the American Academy of Actu-aries Life Illustrations Work-group has been working on a supplement to the practice notes to help with some ques-tions companies have related to the guideline. By the time this is published, the supplement should be available through the American Academy of Actuar-ies website1. An update to the practice notes is likely on deck after that.
What about New York you ask? New York has been open to the fact that they intend to create their own guidance related to this topic. At the time of this writing, nothing is known to this author to have been made available for comment. n
Donna Megregian, FSA, MAAA, is vice president and actuary for RGA. She can be contacted at [email protected].
What is supportable is up to the illustration actuary and involves all aspects of the product, not just the crediting rate.
ENDNOTE
1 The American Academy of Actu-aries has now published the ad-dendum. Available at https://www.actuary.org/files/IWGPracticeNo-teAdd_08282015.pdf.

18 | OCTOBER 2015 PRODUCT MATTERS
OCTOBER 2015 PRODUCT MATTERS | 19
In 2014, the SOA Product Development and Reinsur-ance Sections, along with the
Committee for Life Insurance Research engaged Reinsurance Group of America (RGA) to undertake a research project on term conversion practices and mortality experience.
The project was split into two phases:
• Phase 1 is an assumption survey which is focused on product features and conver-sion practices.
• Phase 2 is an experience analysis of level term busi-ness as it transitions from the term policy into the convert-ed permanent policy.
The Phase 1 survey was com-pleted by 21 companies that made up 52 percent of the 2013 term sales in the market. This article summarizes some inter-esting findings from the survey. The complete survey report can be found at https://www.soa.org/Research/Research-Proj-ects/Life-Insurance/2015-sur-vey-conversion-assumptions.aspx. Throughout this article, graphs are pulled directly from the complete survey report for ease of reference for the reader.
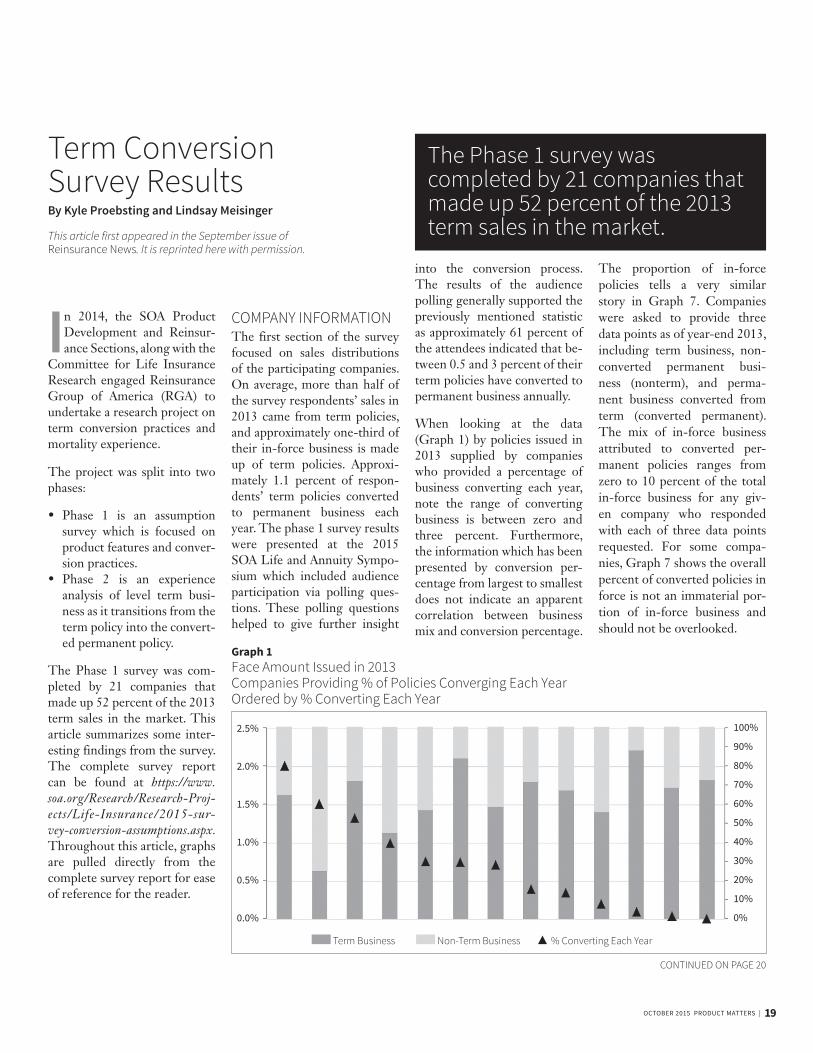
COMPANY INFORMATIONThe first section of the survey focused on sales distributions of the participating companies. On average, more than half of the survey respondents’ sales in 2013 came from term policies, and approximately one-third of their in-force business is made up of term policies. Approxi-mately 1.1 percent of respon-dents’ term policies converted to permanent business each year. The phase 1 survey results were presented at the 2015 SOA Life and Annuity Sympo-sium which included audience participation via polling ques-tions. These polling questions helped to give further insight
The proportion of in-force policies tells a very similar story in Graph 7. Companies were asked to provide three data points as of year-end 2013, including term business, non-converted permanent busi-ness (nonterm), and perma-nent business converted from term (converted permanent). The mix of in-force business attributed to converted per-manent policies ranges from zero to 10 percent of the total in-force business for any giv-en company who responded with each of three data points requested. For some compa-nies, Graph 7 shows the overall percent of converted policies in force is not an immaterial por-tion of in-force business and should not be overlooked.
into the conversion process. The results of the audience polling generally supported the previously mentioned statistic as approximately 61 percent of the attendees indicated that be-tween 0.5 and 3 percent of their term policies have converted to permanent business annually.
When looking at the data (Graph 1) by policies issued in 2013 supplied by companies who provided a percentage of business converting each year, note the range of converting business is between zero and three percent. Furthermore, the information which has been presented by conversion per-centage from largest to smallest does not indicate an apparent correlation between business mix and conversion percentage.
Term Conversion Survey Results By Kyle Proebsting and Lindsay Meisinger
This article first appeared in the September issue of Reinsurance News. It is reprinted here with permission.
2.5%
2.0%
1.5%
1.0%
0.5%
0.0%
100%
90%
80%
70%
60%
50%
40%
30%
20%
10%
0%
Graph 1Face Amount Issued in 2013 Companies Providing % of Policies Converging Each Year Ordered by % Converting Each Year
nn Term Business nn Non-Term Business p % Converting Each Year
The Phase 1 survey was completed by 21 companies that made up 52 percent of the 2013 term sales in the market.
CONTINUED ON PAGE 20

20 | OCTOBER 2015 PRODUCT MATTERS
Term Conversion Survey Results
CONVERSION BEST ESTIMATE MORTALITYThe survey asked respondents to provide the best estimate mortality expectation for con-verted business as a percentage of non-converted permanent business issued at the same time of the original term poli-cy, referred to as Point-in-Scale Mortality (PISM). For exam-ple, a term policy that converts
in the 8th duration is compared to an underwritten permanent policy that is in its 8th duration.
Seventeen of 21 companies an-swered this question. Twelve companies provided a flat mul-tiple of PISM. These multi-ples ranged from 100 percent, meaning no additional mortali-ty for converted business to 200 percent, or two times the mor-tality for converted business as
a percentage of non-converted business.
The remaining five companies provided mortality multiples which varied by duration since conversion. The multiples started anywhere from 200 per-cent to 500 percent (well above the flat multiples provided by the other 12 companies) grad-ing down to approximately 150 percent or 100 percent, 10 to 15
years after the policy converted. This indicates that some com-panies see anti-selective behav-ior of conversions that is more prominent immediately after conversion and wears off in the later policy durations since the conversion.
The results of all companies were averaged by equal weight as well as weighted by face amount totals as of year-end 2013, shown in Graph 13.
Both averages show the same assumption trend in mortal-ity since conversion: higher mortality immediately upon conversions as a percentage of PISM, grading down to little or no additional mortality after at least 15 years since conversion.
CONVERSION PROCESSThe conversion process, con-sisting of topics relating to administration, auditing and experience studies was also surveyed. While three of the 21 respondents indicated that conversions are coded as lapses or surrenders, the remaining 18 companies indicated that con-versions are identified by their own individual code in com-pany systems. Once the policy has been converted to a per-manent plan, it can be coded as in force or new business. Eigh-teen of the 19 companies who responded indicated that they track converted policies as new business. Since conversions are technically a continuation of another contract, this adminis-tration process may be contrib-uting to the fact that only nine of the 21 companies indicated that they could identify con-version on permanent plans as well as link the permanent
100%
90%
80%
70%
60%
50%
40%
30%
20%
10%
0%
Graph 7Policies Inforce Year End 2013
nn Term Business nn Nonterm Business nn Converted Permanent Business
250%
225%
200%
175%
150%
125%
100%
Graph 13Multiple of Best Estimate Mortality Expectation for Converted Business By Duration Since Conversion All Companies
nnnn Equal Weight Average nn nn nn Weighted Average by Face Inforce YE 2013
Poin
t In
Scal
e M
orta
lity
Duration Since Conversion
1 2 3 4 5 6 7 8 9 10 11 12 13 14 15 16
Ulti
mat
e

OCTOBER 2015 PRODUCT MATTERS | 21
plan back to the original term policy. Some of the companies expressed interest in improving this process.
Conversions are generally ad-ministered on the same systems as their permanent and term policies. While every compa-ny indicated that conversions and permanent policies are administered together, only 19 of the 21 respondents indicat-ed that conversions and term policies are administered on the same system. For the two remaining companies the term and conversion policies would be administered on a different system depending on what type of product the policy would be converted.
The survey also asked each company if they had the ability to audit their conversion pro-cess. Only 10 of the 21 compa-nies had the ability to audit and only three of those companies who audit are doing so on a regular basis (at least annual-ly). Based on the findings of a conversion audit, two compa-nies responded that they have enacted changes. The desire to improve current auditing pro-cesses tended to be a general theme among the respondents’ additional comments.
When asked about conversion mortality studies, 16 companies indicated that they are able to look at conversions separately from other data, six of which can review their mortality stud-ies with and without conver-sions. Moreover, 13 of the 16 companies with the ability to look at conversions separately do perform separate conversion mortality studies.
CONVERSION PHILOSOPHYWhen asked whether or not conversions were encouraged, only four of the 21 companies indicated that they are not en-couraged, while two companies were unsure. The remaining breakdown in Chart 18 shows eight companies encouraging conversions to any insured at any time, four companies en-couraging conversions to any insured at certain times, and three companies encouraging conversions to certain insured at certain times.
This seemed to be the gener-al consensus at the 2015 SOA LAS presentation as well, as 72 percent of the polling respon-dents fell into one of the three encouragement camps and only 9 percent claimed their compa-ny does not encourage conver-sion.
One of the hottest topics in the industry today is the idea and implementation of predictive modeling. When asked if pre-dictive modeling is currently used to target conversions no company admitted to be doing so, however, two companies indicated that they have either begun to investigate it as a pos-sibility or potentially will con-sider it in the future.
Chart 19 shows the majority of the survey respondents indicat-ed that they build the cost of conversion into the term policy either implicitly or explicitly.
Implicitly refers potentially to embedding the cost into the mortality assumption and ex-plicitly refers to potentially per policy or per unit additional costs specific to conversions charged in pricing. Conversely and interestingly enough, at the 2015 SOA LAS presentation, most polling responses indicat-ed that they believed the cost of conversion would be built into the permanent policy (48 per-cent total), not the term policy as the survey indicated.
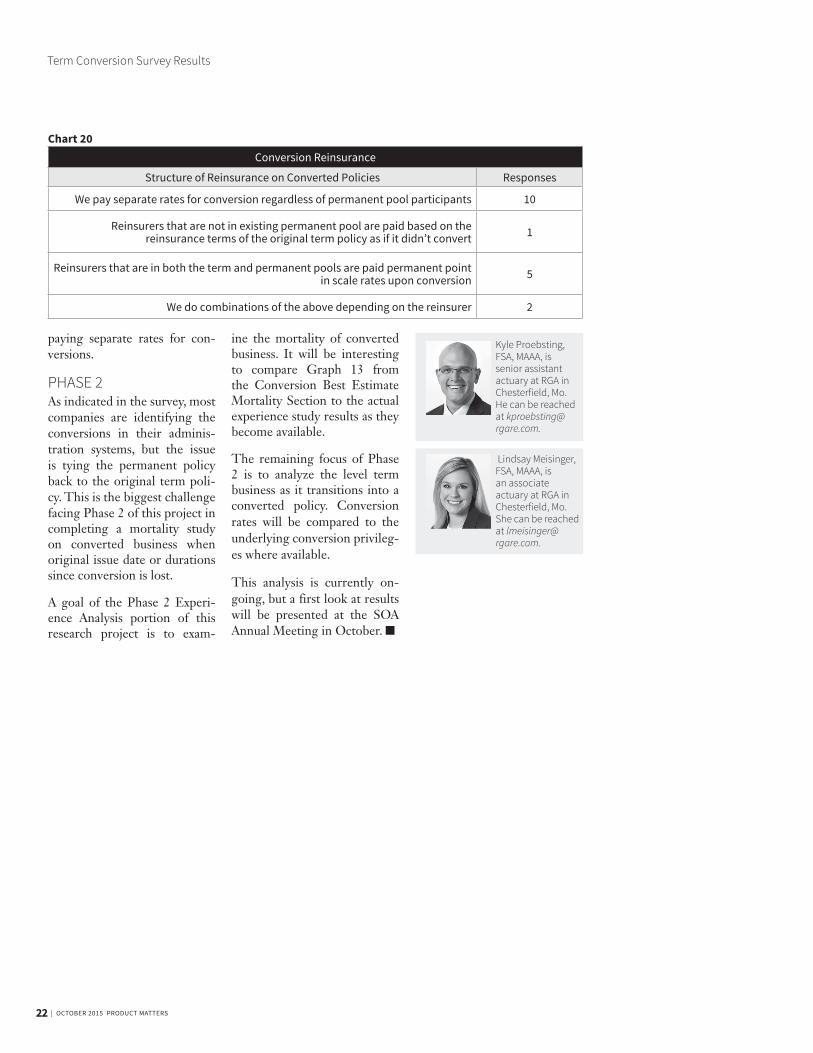
CONVERSION REINSURANCEThe survey concluded with a section on reinsurance of converted policies. Almost all
recognize the conversion pol-icies should be treated differ-ently than the other reinsured permanent policies. Five (5/18) respondents pay permanent point-in-scale rates upon con-version to reinsurers that are in both the permanent and term pools. The remaining responses are shown in Chart 20.
At the Life and Annuity Sym-posium a polling question was asked on the structure of rein-surance premiums. The larg-est portion of respondents, 39 percent, answered that they pay permanent point-in-scale rates. This differed from the survey report results above, where most respondents indicated
of participating companies (18/20) responded that they re-insure conversions. Two com-panies out of 17 respondents recapture the conversions and cede them to the permanent pool, while 15 of the companies indicated the conversions stay with the original reinsurance pool regardless of permanent pool participation.
Slightly more than half of the companies (10/18) indicated they are paying separate rates for conversions regardless of participation in the permanent pool. These companies may
Conversion Philosophy
Encourage Conversions ResponsesAt any time to every insured
At certain points in time for every insured
At certain points in time to certain insured
We do not encourage conversions ever
Not sure
8
4
3
4
2
Chart 18
Conversion Philosophy
Cost of Conversions ResponsesImplicitly built into the term policy
Explicitly built into the term policy
Implicitly built into the permanent policy
Explicitly built into the permanent policy
Not built into either term or permanent policy
Conversion has no cost
5
7
5
2
1
1
Chart 19
CONTINUED ON PAGE 22
22 | OCTOBER 2015 PRODUCT MATTERS
paying separate rates for con-versions.
PHASE 2As indicated in the survey, most companies are identifying the conversions in their adminis-tration systems, but the issue is tying the permanent policy back to the original term poli-cy. This is the biggest challenge facing Phase 2 of this project in completing a mortality study on converted business when original issue date or durations since conversion is lost.
A goal of the Phase 2 Experi-ence Analysis portion of this research project is to exam-
ine the mortality of converted business. It will be interesting to compare Graph 13 from the Conversion Best Estimate Mortality Section to the actual experience study results as they become available.
The remaining focus of Phase 2 is to analyze the level term business as it transitions into a converted policy. Conversion rates will be compared to the underlying conversion privileg-es where available.
This analysis is currently on-going, but a first look at results will be presented at the SOA Annual Meeting in October. n
Conversion Reinsurance
Structure of Reinsurance on Converted Policies Responses
We pay separate rates for conversion regardless of permanent pool participants 10
Reinsurers that are not in existing permanent pool are paid based on the reinsurance terms of the original term policy as if it didn’t convert 1
Reinsurers that are in both the term and permanent pools are paid permanent point in scale rates upon conversion 5
We do combinations of the above depending on the reinsurer 2
Chart 20
Kyle Proebsting, FSA, MAAA, is senior assistant actuary at RGA in Chesterfield, Mo. He can be reached at [email protected].
Lindsay Meisinger, FSA, MAAA, is an associate actuary at RGA in Chesterfield, Mo. She can be reached at [email protected].
Term Conversion Survey Results


475 N. Martingale Road, Suite 600Schaumburg, Illinois 60173
NONPROFIT ORGANIZATIONU.S. POSTAGE
PAIDSAINT JOSEPH, MI
PERMIT NO. 263