Product pack size decisions in the emerging market spaza ...
118
Product pack size decisions in the emerging market spaza retail sector Nick van Woerkom 21181897 A research project submitted to the Gordon Institute of Business Science, University of Pretoria, in partial fulfilment of the requirements for the degree of Master of Business Administration. 7 November 2016 © University of Pretoria
Transcript of Product pack size decisions in the emerging market spaza ...

Product pack size decisions in the
emerging market spaza retail sector
Nick van Woerkom
21181897
A research project submitted to the Gordon Institute of Business
Science, University of Pretoria, in partial fulfilment of the
requirements for the degree of Master of Business Administration.
7 November 2016
© University of Pretoria
ii
Abstract
Despite research around marketing mix recommendations, granular analysis on
product unit pack size in emerging markets has not been extensively researched.
Furthermore, the impact of modern-day retailers on the distribution and sales of
product unit pack sizes has received limited attention. Research has focused on the
broader role that product variety plays in the marketing mix and its impact on firm
performance (Ford, Moodie & Hastings, 2012; Jaiswal & Gupta, 2015; Kumar, Fan,
Gulati & Venkat, 2009). However, little work has been done on how product variety
impacts firm performance in emerging markets and specifically in terms of product unit
pack size (Wan, Dresner & Evers, 2014) which this current study aims to address. A
second aspect of the current study is the influence of modern-day retailers and the
impact that distance between them and emerging market spaza shops has on the
distribution and sales of product unit pack sizes. Secondary quantitative data from
Clover was used to conduct exploratory research on different products in three
geographical clusters. Both the availability of product unit size and the sales thereof
were found to be influenced by the distance between the spaza shops and the modern-
day retailers.
Keywords: Emerging market, spaza shop, pack size, price, modern retailer
© University of Pretoria

iii
Declaration
I declare that this research project is my own work. It is submitted in partial
fulfilment of the requirements for the degree of Master of Business
Administration at the Gordon Institute of Business Science, University of
Pretoria. It has not been submitted before for any degree or examination in any
other University. I further declare that I have obtained the necessary
authorisation and consent to carry out this research.
________________________
Nicholas van Woerkom
Date: 7 November 2016
© University of Pretoria

iv
Contents
1. INTRODUCTION 1
1.1 Research problem 1
1.2 Research relevance and importance 2
1.3 Scope of the research 4
1.4 Structure of the research 5
2. THEORY AND LITERATURE REVIEW 6
2.1 Introduction 6
2.2 Distribution in emerging markets and the threat of large retailers 6
2.3 Product pricing in emerging markets 15
2.4 The relationship between price and unit pack size 18
2.5 Conclusion to the chapter 24
3. RESEARCH QUESTIONS 25
3.1 Introduction 25
3.2 Research objectives 25
3.3 Identification of research questions from the literature 25
3.4 Conclusion 26
4. RESEARCH METHODOLOGY 27
4.1 Introduction 27
4.2 Research design 27
4.3 Unit of analysis 29
4.4 Universe 29
4.5 Sampling method and size 31
4.6 Data measurement 31
4.7 Data collection process 31
4.8 Data analysis approach 32
4.9 Research methodology limitations 37
© University of Pretoria

v
5. RESULTS 38
5.1 Introduction 38
5.2 Evaluation of missing data for reliability 38
5.3 Characteristics of the sample 39
5.4 Influence of distance between modern retailer and spaza shop on product
distribution or availability in emerging market 43
5.5 Influence of distance on product sales in emerging market 60
5.6 Summary and conclusion 77
6. ANALYSIS OF RESULTS 79
6.1 Introduction 79
6.2 The influence of geographical distance between the emerging market spaza
shop and modern-day retailer on product unit size distribution 79
6.3 The influence of geographical distance between emerging market spaza shop
and modern-day retailer on product unit size sales 84
6.4 Comparison of regional clusters 88
6.5 Overall Summary 89
7. CONCLUSION 89
7.1 Introduction 89
7.2 Research background and objectives 90
7.3 Summary of key findings 90
7.4 Implications for management 93
7.5 Limitations of the research 94
7.6 Suggestions for future research 95
7.7 Conclusion 96
References 97
Appendices 104
© University of Pretoria
vi
List of Diagrams and Figures
Diagram 1: Framework of this study 24
Figure 1: Dimensions of the BOP marketing strategy 4
Figure 2: Growth of large BOP Shopping Complexes 7
Figure 3: Shopper penetration by independent retail format 11
Figure 4: Building a profitable distribution strategy in emerging markets 15
Figure 1: Maps of the central points with their coordinates 33
Figure 2: The distribution profile of the Masakhane spaza stores per region 39
Figure 3: Clustered bar chart indicating distance between spaza shops and Modern Retailer 1
with pack size for Clover Fresh Milk 44
Figure 4: Clustered bar chart for distance between spaza shops and Modern Retailer 1 with
pack size for Clover Fruit Nectar 46
Figure 5: Clustered bar chart for distance between spaza shops and Modern Retailer 1 with
pack size for Dairy Fruit Danao Fresh 48
Figure 6: Clustered bar chart for distance between spaza shops and Modern Retailer 1 with
pack size for Dairy 49
Figure 7: Clustered bar chart for distance between spaza shops and Modern Retailer 1 with
pack size for Dairy Fruit Mix Tropika UHT 51
Figure 8: Clustered bar chart for distance between spaza shops and Modern Retailer 1 with
pack size for Krush 100% Fruit Juice Blend 52
Figure 9: Estimate marginal means for pack size 58
Figure 10: Clustered bar chart for distance between spaza shops and Modern Retailer 1 with
sales volume for Clover Fresh Milk 61
Figure 11: Clustered bar chart for distance between Spaza shops and Modern Retailer 1 with
sale volume for Clover Fruit Nectar 63
Figure 12: Clustered bar chart for distance between Spaza shops and Modern Retailer 1 with
sale volume for Dairy Fruit Mix Danao Fresh 65
Figure 13: Clustered bar chart for distance between spaza shops and Modern Retailer 1 with
sale volume for Fruit Mix Tropika Fresh 67
Figure 14: Clustered bar chart for distance between spaza shops and Modern Retailer 1 with
sale volume for Dairy Fruit Mix 69
Figure 15: Clustered bar chart for distance between spaza shops and Modern Retailer 1 with
sale volume for Krush 100% Juice Blend 71
Figure 16: Estimate marginal means for pack size 76
© University of Pretoria
vii
List of Tables
Table 1: The selected modern stores and their distance from central point 32
Table 2: Missing data analysis for the variables understudy 38
Table 3: Distances between the four modern retailers and the Masakhane stores 40
Table 4: The principal subgroups and ProdVLThree products 41
Table 5: Pack size of the products 42
Table 6: Sales volume distribution 42
Table 7: Descriptive statistics of the volume and sales value 43
Table 8: A three-cross tabulation indicating distance between spaza shops and Modern Retailer
1 with the pack size distributed per product brand 45
Table 9: Pack size * Distance Modern Retailer 1. * ProdVLThree Cross tabulation 47
Table 10: Pack size * Distance Modern Retailer 1. * ProdVLThree Cross tabulation 48
Table 11: Pack size * Distance Modern Retailer 1. * ProdVLThree Cross tabulation 50
Table 12: Pack size * Distance Modern Retailer 1. * ProdVLThree Cross tabulation 51
Table 13: Pack size * Distance Modern Retailer 1. * ProdVLThree Cross tabulation 53
Table 14: Chi square analysis test of the product brands on distance with pack size 54
Table 15: Strength of the relationship between pack size and distance between Spaza shops
and Modern Retailer 1 55
Table 16: Pack size * Distance Modern Retailer 1. * ProdVLThree Cross tabulation 56
Table 17: Descriptive statistics indicating the distance and pack size in the three regions 57
Table 18: Test of between-subjects effect 59
Table 19: Sales volume * Distance Modern Retailer 1. * ProdVLThree Cross tabulation 62
Table 20: Sales volume * Distance Modern Retailer 1. * ProdVLThree Cross tabulation 64
Table 21: Sales volume * Distance Modern Retailer 1. * ProdVLThree Cross tabulation 66
Table 22: Sales volume * Distance Modern Retailer 1. * ProdVLThree Cross tabulation 68
Table 23: Sales volume * Distance Modern Retailer 1. * ProdVLThree Cross tabulation 70
Table 24: Sales volume * Distance Modern Retailer 1. * ProdVLThree Cross tabulation 72
Table 25: Analysis of product brand unit sales on distance between spaza and Modern Retailer
no 1 1 73
© University of Pretoria

viii
Table 26: Strength of the relationship between pack unit sales and distance between spaza
shops and Modern Retailer 1 74
Table 27: The cross tabulation of the distance with sales volume 75
Table28: Actual results of the two-way ANOVA 77
Table 29: Summary outcomes of the study 78
© University of Pretoria

1
CHAPTER 1
1. INTRODUCTION
1.1 Research problem
According to Wan, Dresner and Evers (2014), product variety can be created not only
through physical product differentiation but also by means of branding, variations in
packaging, the provision of warranties or after-sales support. Ampuero and Vila (2006), S.T.
Wang (2013) and Rundh (2013) all focused on packaging as a differentiating factor. Despite
research around marketing mix recommendations, granular analysis on product unit pack
size in emerging markets has not been extensively researched. Research has focused on
the broader role that product variety plays in the marketing mix and how this impacts firm
performance (Berger, Draganska & Simonson, 2007; Ford, Moodie & Hastings, 2012;
Jaiswal & Gupta, 2015; and Kumar, Fan, Gulati & Venkat, 2009).
Dholakia and Dholakia (2012), Kumar, Sunder and Sharma (2015), Liedeman, Charman,
Piper and Peterson (2013) and Madlala (2016) all mention the need to study the impact of
an increasing number of modern trade retailers entering the informal emerging market
environment. Research by Kumar et al. (2015) has outlined that a mixed retail system
consisting of large modern stores and smaller traditional stores (STSs) may well continue in
India for the foreseeable future, and the same could be argued for many other emerging
markets including Africa.
Linking the above challenges, it is evident that there has been limited research regarding the
value of pack architecture diversification of products in the emerging market environment
with the influx of large retailers entering this space, as attested by Kumar et al. (2015) as
well as Sorescu, Frambach, Singh and Rangaswamy (2011).
Real and accurate sales data to assess the impact of price and product on an informal or
emerging market spaza outlet are also not readily available, and there is a lack of data to
determine the effect of proximity between retailer and spaza shop on the sales, price and
pack performance of products (Jaiswal & Gupta, 2015.; and Kumar et al., 2015).
It is important to identify where research in a specific area has been lacking or where
limitations in previous studies have not been addressed. Wan et al. (2014) suggest that little
work has been done on how different types of product variety impact firm performance in
emerging markets. Growth of the global emerging economy has brought increased
competition and changing consumers, showing that there is a real need to study product
© University of Pretoria

2
variety specifically focused on product unit size and its potential to offer increased value to
manufacturers, distributors, retailers and end consumers.
In the emerging market environment, manufacturers have greater control over pricing
decisions since the retailer is usually small and independently owned, as is the case with the
spaza shop in the African or Indian context (Kumar et al., 2009). Manufacturers and
producers are bypassing the traditional retailers to enter the emerging market space. The
retailer or wholesaler takes margin and value in the channel which the manufacturer can
circumvent by going directly to the spaza shop or trader, even with the additional distribution
costs of doing so. Kumar et al. (2009) recognise in their study of the laundry detergent
category that consumers are price inelastic and therefore they could benefit from increasing
their product prices. However, according to their results, price elasticities can vary in
emerging markets depending on the form or nature of the product and therefore should be
considered only when developing strategies for emerging markets.
Data on personal disposable income per head suggest that over the years there will be a
steady rise in personal disposable income for consumers in emerging markets (Gupta, Kim
& Sharma, 2011). Increasing consumer aspirations highlight the fact that hedonic shopping
could be on the rise in emerging markets. Where there is increasing modernity in conjunction
with traditionalism and where the rich and the poor live alongside each other, the movement
along the consumer behaviour spectrum will even out towards utilitarianism (Kumar et al.,
2009). Hedonic behaviour will also rise as a sign of aspirations, increasing the dynamism on
the consumer behaviour spectrum. The combination of adapting aspirations and
traditionalism therefore offers opportunity for different retail formats to evolve over time
(Gupta et al., 2011; and Neuwirth, 2014).
Highlighting the above, two key aspects core to this study emerge, namely pack size and
lack of sufficient data in emerging markets to analyse how they are influenced by the
entrance of modern-day retailers. Business and academia, globally, could therefore stand to
benefit, as explained below.
1.2 Research relevance and importance
1.2.1 Relevance to academia
South Africa’s contracting economy has forced many emerging market consumers to tighten
their spending and execute more austerity. With many living from hand to mouth, there is a
need to assess whether pack size variety, and in particular smaller pack sizes, can serve the
needs of those with less daily disposable income (Akır & Balagtas, 2014; and Sy-Changco,
© University of Pretoria

3
Pornpitakpan, Singh, & Bonilla, n.d.).There are already examples of pack size variety in
many shapes and forms such as Coca Cola’s many size options to suit different occasions
and varying individual disposable incomes, as well as Clover’s Tropika fruit juice which has a
pack size range that has gradually increased over time. The studies by Scavarda, Reichhart,
Hamacher and Holweg (2010); Jaiswal and Gupta (2015), Kumar et al. (2009) and Kumar et
al. 2015) focused on the role of product and packaging variety in emerging markets. More
specifically, Pornpitakpan (2010), Sy-Changco et al. (2010) and Wan et al. (2014) conducted
research on the value of package downsizing, pack size and product line. Using the above
studies as a base from which to develop an argument from an emerging market context and
by adding a further research dimension namely the impact of the encroaching modern
retailer (Ligthelm, 2008; Perks, 2010; Polsa & Fan, 2011; Ramakrishnan, 2010; Ruhigga,
2011; and Strydom, 2011), this research study aims to build on previous research and
intends to discover new findings using the combination of these variables in an emerging
market context. The relevance and significance will hopefully lie in the heightened interest
among academia to provide a sound theoretical basis of information on the topic to be
utilised by business.
1.2.2 Importance to business
Emerging markets are becoming increasingly important to organisations in the global
economy (Sheth, 2011) and will account for more of this century’s economic growth than
developed markets (Burgess & Steenkamp, 2013).
This study aims firstly to encourage business to incorporate decisions on price and pack
assortment, and secondly to bring these benefits to the attention of emerging market
retailers or spaza store owners as well as distributors and manufacturers. Furthermore, the
study will have relevance in terms of the impact that the growing spread of formal market
retailers will have on such decisions. These retailers, who possess buying and bargaining
power, will increase price and market share competition thereby threatening the very
existence of the traditional spaza shop (Liedeman et al., 2013; and Madlala, 2016) Given
this threat, emerging market retailers may need to adapt their product and price strategies to
more of a convenience strategy catering for high frequency purchases, leaving formal
retailers to cater for the month-end bulk purchase (London, Esper & Grogan‐ Kaylor, 2014).
An overarching model to consider is the bottom of the pyramid (BOP) strategy as seen in
Figure 1 below. South Africa’s retail environment is very much a hybrid of formal or modern
retail formats and informal emerging market (Evans, 2011; and Ligthelm, 2008) of which
many are at the bottom of the pyramid (those earning less than the equivalent of a dollar a
© University of Pretoria

4
day). It is therefore important to understand the development of the ecosystem from single
serve sachets in the informal market to luxury goods in the formal trade (Hammond &
Prahalad, 2004).
Figure 1: Dimensions of the BOP marketing strategy
Source: Payaud (2014)
1.3 Scope of the research
An “emerging market retailer” or “spaza shop” in this research paper is an informal
convenience business in South Africa, most often run from home and selling small everyday
household items. These shops emerged rapidly due to the growth of sprawling townships
that made commuting to formal shopping places more difficult or expensive (Ligthelm, 2008).
The “formal retailer” or “modern retail format” in this context is a business or person selling
goods to the consumer. These outlets are what South Africans are used to. Easily
recognisable brand names such as Checkers, Shoprite or Pick n Pay are the outlets and
groups whose recent intentions have been to enter the “emerging market”, a term used to
describe developing markets or markets that may be developed in the future.
“Price” or “retail selling price” refers to the price of a product in its final unit form ready to be
purchased from a retail store as a single item for end consumption.
“Product unit pack size” refers to the product in its final unit form ready to be purchased from
a retail store as a single item for end consumption.
The research problem in this study refers to the decisions regarding unit size and the
influence that a growing number of formal retailers have on such decisions, specifically in the
© University of Pretoria

5
South African emerging market context. Forms of product and packaging variety are the
foundation of this research, after which it narrows down to uncover the importance of a more
specific yet less researched topic namely pack size specifically in an emerging market
context. The study furthermore seeks to uncover the impact of the geographical proximity
between small emerging market retailers and large retail formats on the marketing aspects
mentioned, as well as on the sales of these products.
1.4 Structure of the research
The research study consists of seven chapters:
Chapter 1 comprises the research problem, the business and academic need for the study
as well the study objectives.
Chapter 2 visits relevant academic literature and places this study within the context of the
literature, while also suggesting the opportunities for future research to build on.
Chapter 3 defines the study’s research objectives and presents the research questions that
need to be answered.
Chapter 4 is a detailed exploration of the research methodology and the approach taken.
Chapter 5 presents the analysis of the data.
Chapter 6 explains the findings and unravels the insights with supporting evidence from
literature tying everything back to the objectives of the study.
Chapter 7 highlights the findings, limitations and recommendations for future research,
including the implications for business and academia.
© University of Pretoria

6
CHAPTER 2
2. THEORY AND LITERATURE REVIEW
2.1 Introduction
Considering the scope of this study as illustrated under Section 1.3 above, the thread of the
literature follows a funnelled process of understanding previous research and discovery
within the realm of product and packaging variety. Distribution in emerging markets and the
threat of large retailers is analysed first along with the importance of production in pack size
variety. The relationship between price and pack size is then reviewed before identifying the
research questions, methodology and results of Clover’s dairy product range.
2.2 Distribution in emerging markets and the threat of large retailers
Previous research has noted the increasing importance of distribution and marketing in
emerging markets (Arnold & Quelch, 1998; and Reinartz, Dellaert, Krafft, Kumar &
Varadarajan, 2011). Dholakia and Dholakia (2012) noted that, from a distribution
perspective, emerging economies are very different from developed markets in terms of the
unstructured and informal nature of retailing where spaza shops, street vendors, hawkers
and bartering form a large portion of the market, and where informal traders collect stock
from a large base of independent wholesalers and cash and carry stores (Trade Intelligence,
2016).
The study of Kumar et al. (2015) showed that the success of a brand in an emerging market
depends on the extent to which its marketing mix (especially distribution) is customised as
per the unique characteristics of the market. This is no more prevalent than in the study of
sachet distribution in the Philippines where a large number of small stores suit the execution
and sale of smaller pack sizes (Sy-Changco et al., 2010). Over the past five years studies
in marketing literature have pointed out these unique characteristics and provided qualitative
suggestions to firms to achieve success (Bianchi, 2014; Kumar et al., 2015; and Reinartz et
al., 2011).
However, despite the heightened focus on the role of marketing in emerging economies,
Kumar et al. (2009) pointed out that much of the literature was descriptive, qualitative and
lacking in anecdotal evidence. As evidenced by Shankar and Bolton (2004), Bianchi (2014),
Kumar et al. (2009) and Reinartz et al. (2011), despite research around marketing mix
recommendations, granular analysis on product unit pack size and price in emerging
markets needs more work and the assumption that “stable competition equilibrium is
© University of Pretoria

7
assumed” (Shankar & Bolton, 2004, p. 47) shows the need for further study around the
spread of formal or organised retail entering the emerging market space. This current study
will aim to achieve more granular analysis on product pack size and will attempt to show that
stable equilibrium cannot be assumed with the increasing presence of formal retailers.
Figure 2 below, from a study by McGaffin (2010), shows how the informal economy in South
Africa has been impacted by large shopping complexes over the past two decades. The
present study aims to provide further evidence of more recent statistics across the three
clusters as examined in McGaffin’s (2010) study, thereby indicating the continued pattern of
modern retail formats entering the emerging market space, not only in shopping centre
formats but also in stand-alone retailers.
Figure 2: Growth of large BOP Shopping Complexes
Source: (McGaffin, 2010, p. 29)
Most of the distribution networks in developed markets are through large retailers like
Walmart in the United States. In South Africa Pick n Pay, Spar and Checkers represent what
is referred to as organised retail (Kumar et al., 2015), and the landscape is characterised by
these retailers made up of a large number of outlets, spread nationally with a large
assortment of brands and products. However, the emerging market landscape, as is the
case in the emerging market sector in South Africa, consists of a large number of informal,
independently owned retail stores. Sarma (2005) defines disorganised retail as “an outlet run
locally by the caretaker, manager or owner of a shop that lacks technical and accounting
standardisation” (p. 4797).
© University of Pretoria

8
According to Joseph (2008), disorganised retail in China is around 80%, in Brazil it stands at
64% and in India it is as high as 95%. South Africa, however, is despite its burgeoning
emerging market still dominated by modern-day retailers in the formal environment. With
increased competition in the formal sector in South Africa, these retailers are looking for new
markets, new customers and new revenue growth. They consequently enter the emerging
market space.
There seem to be differences between the findings of Ruhigga (2011) and recent research
conducted by Trade Intelligence (2016). Much has changed in the last five years. Research
by Ruhigga (2011) indicated little evidence that the sector was set for recovery in the near
future and countryside outlets were seen to be inadequately stocked for even the most basic
needs, whereas over the last five years as shown by Trade Intelligence (2016) the
emergence of foreign nationals has transformed the spaza industry. Ruhigga (2011)
concluded by saying that the wholesale-retail sector was unlikely to play a leading role in the
South African economy in the future, unless innovative responses to the structural
weaknesses of the rural economy occurred.
As per Trade Intelligence (2016), that innovative response arrived in the form of foreign
nationals who over the last five years have totally transformed the spaza shop environment.
The key to their success has been their ability to create social networks, thereby creating a
more competitive business model. These foreign nationals exhibit a collective buying
behaviour to secure discounts and operational economies of scale. They do this within small
buying groups that create cash accounts with wholesalers and local cash and carry stores,
resulting in lower unit transaction costs due to shared transport and labour. Added to this,
they enforce contractual agreements by clan elders (particularly evident amongst Somali
groups) and strategically focus on concentrated geographical areas to create ethnic
strongholds. They also operate from as early as 5 am and close as late as 10 pm (Trade
Intelligence, 2016). These foreign nationals offer credit to customers and understand the risk
and reward in terms of gradually building trust within their local communities. They
furthermore exhibit higher levels of customer service than their local counterparts and their
commercial competence seems far more adept at catering for the needs of the changing
consumer. They often sell hampers of staple foods and, in line with this study, often re-pack
goods into smaller sizes whereas large corporates and well-known brands have yet to
understand the pack size and price architecture needed for the “top-up” shopper. Trade
Intelligence (2016) as well as Liedeman et al. (2013) and Moloi (2014) further points out that
these foreign nationals have greater access to financial resources, and have a more
© University of Pretoria

9
effective ownership structure where most stores are owned through a shareholding
agreement or a single owner operating several stores.
Given the entrance of modern retail chains and shopping centres, Ligthelm (2008) identified
through feedback from interviewed respondents the following services provided by small
township retailers as contributing to their survival since the opening of the Soshanguve Malls
relevant to their study: proximity to customers’ dwellings, long and flexible business hours,
satisfaction of emergency needs, credit facilities, the availability of merchandise in small
units, and good and friendly customer service. In fact, the results of the study by Gupta et al.
(2011) have shown that it is the experience of the customer with the emerging market
vendor that reduces switching to the organised retailer, rather than the personal
characteristics of the customer.
Madlala (2016) provides evidence to the fact that informal businesses may be exploited by
large retailers as direct competitors in a competitive environment. His findings show how
such large retailers have the competitive power to displace informal retailers. The smaller
informal shops struggle to compete on price with such larger chains, even though the entry
of a new large retailer significantly impacts only those stores that operate within a tight
radius of the larger, formal retailer and only they lose a significant amount of trade.
A big challenge when operating in informal, disorganised and unstructured retail
environments is that brand managers are required to depend heavily on local distributors or
intermediaries (wholesalers and retailers) to “push” the products and brands into the market,
leverage the brands across numerous outlet formats, and thus ensure success of the brand
(Ataman & Heerde, 2010; Kumar et al., 2015; and Venkatesan, Farris, Guissoni & Neves,
2015).
In the emerging market, the decision regarding how to distribute is more difficult to make as
the unstructured nature of the market provides managers with little information (in the form of
data) to make optimal distribution decisions. Given the continued growth of large retail
chains and the power of these retailers, more and more manufacturers and producers are
starting to realise that bypassing such retailers to get to the end consumer may be a more
economical and viable long term strategy to success, especially when the resources are
available to distribute in such a manner (Ataman & Heerde, 2010; Kumar et al., 2015; and
Venkatesan et al., 2015). Ali, Kapoor and Moorthy (2010) noted that large modern organised
retail formats were growing at a phenomenal pace throughout India. As mentioned before,
this is what the researcher in this present study aims to build on, as the same can be said
© University of Pretoria

10
about South Africa. Ali et al. (2010) further added that modern organised retail was reaping
the benefits of changing buying patterns and was growing at a phenomenal rate, which has
induced big national and multi-national corporations to invest into organised retailing in the
informal space.
In assessing the current literature on the changing landscape of the South African informal
economy, it is interesting to note the transition from earlier studies to more recent literature.
In 2006, Tustin and Strydom concluded that because of the proximity of spaza shops to
residences in the informal sector, they would still attract consumer demand. These authors
pointed out, though, that such small spaza retailers would be faced with huge challenges in
meeting the intensity of large formal retailers entering this space and in terms of the
variables of price, assortment and retail experience.
A decade later, in 2016, the drastic changes in the South African landscape as researched
earlier by Liedeman et al. (2013) have become evident. Strydom (2015) referred to these
changes happening over the last five to seven years, attributing them to the resurgence of
foreign-owned, business-astute spaza shop owners. The informal economy has been
transformed and, as surveyed by Trade Intelligence (2016) and noted by (Madlala, 2016) is
competing with and challenging the modern retailer entering this market, on price and
assortment. This has significant meaning for the current study, as this research on
assortment availability and sales may produce results that could prove that, despite the
influx of modern retail, South Africa’s informal economy remains strong and is growing, due
to the assortment and pricing decisions of foreign-owned spaza shop owners. As can be
seen in Figure 3 below, despite the steady growth of modern retail formats into the South
African emerging market, spaza shops have shown an increase in the recent past with other
retail formats in townships and local neighbourhoods decreasing (Trade Intelligence, 2016).
© University of Pretoria

11
Figure 3: Shopper penetration by independent retail format
Source: Trade Intelligence (2016)
The question posed by Ligthelm (2008), Gupta et al. (2011) and Kumar et al. (2015)
remains: What should the product assortment, service levels and location of small township
retailers and spaza shops be to compete effectively in this new retail environment in
township areas? Liedeman et al. (2013), Ligthelm (2008), Madlala 2016) and Moloi (2014) all
suggest that further research should be conducted on the structural changes in the retail
environment of emerging markets, and that further analysis of price and product assortment
should be assessed for future training and advice for small retailers to effectively adjust to
the new retail environment. Given the limited research in the area of retailer versus informal
trader distribution of various pack sizes (Ataman & Heerde, 2010; and Venkatesan et al.,
2015), the current study intends to shed more light on the value of pack size assortment for
informal spaza shops in view of the growing emergence of modern retailers.
Before moving to the next aspect, it is important to take note of the discoveries of Ataman
and Heerde (2010) and Kumar et al. (2015). Ataman and Heerde’s (2010) research in a
Brazilian context found that the sales attributable to a 1% rise in merchandising costs are
higher for modern retailers than for informal or non-traditional stores. Added to this, the sales
effect of a 1% increase in variety with respect to package size is higher in modern retail
chain stores than in informal stores. This is a very important aspect relating to this study.
Although the focus of this research is on pack size and assortment from an informal market
spaza retailer perspective, Ataman and Heerde (2010) in the study above have shown pack
size to be even more important for the modern retailer.
© University of Pretoria

12
Although the research by Kumar et al. (2015) highlights the importance of distribution, they
also stated that the success of a particular brand in an emerging market depended on the
degree to which its marketing mix was customised to the unique characteristics of its market.
Wan et al. (2014), asked why firms offered multiple flavours of a particular brand, and why
companies produced specific products in a range of sizes. As mentioned by Sloot, Fok and
Verhoef (2006), the answer, in short, would be to meet consumer needs and choices. Wan
et al. (2014) added that companies could block out the threat of new entrants by providing
an ever-increasing variety of products, thereby segmenting the market into thinner slices.
Many products in today’s age face aggressive competition, requiring consumers to select
from among several similar items in a store. The impact of product variety on the perceived
quality and on dimensions such as taste continue even post the consumer experience of the
product, indicating that product variety can also induce repeat purchase (Berger et al., 2007;
and Guoying & Qingfeng, 2009). Therefore, competitive and differentiated packaging
solutions can help the consumer to estimate the value of what they can get for their money
(Rundh, 2013). It can also help consumers to better execute portion control which is an
underestimated, understudied and important consideration in the informal emerging market
((G Alcock, 2015), and for the informal retailer, help compete on convenience in the face of
heightened modern retail competition (Liedeman et al., 2013).
However, existing research all confirms that future studies may want to investigate further
ways in which an individual making a selection affects the perception of the chosen option
(Berger et al., 2007; Guoying & Qingfeng, 2009; and Rundh, 2013). Crucially, in terms of the
direction of this study, theoretical and empirical evidence provided by Waller and Tangari
(2008) as well as Eroglu, Williams, and Waller (2011) showed that the number of units per
retail shipping container (case pack quantity) has a significant impact on retail market share.
Their findings indicate that the effect of case pack quantity on market share depends upon
the rate of sale (ROS) of a given stock-keeping unit (SKU). For faster-selling SKUs, larger
case packs increase market share but for slower-selling SKUs, larger case pack quantities
reduce market share. This is because of additional stock-outs at the retail level, resulting
from execution problems caused by the larger case pack quantities (Waller & Tangari,
2008).
The above is evident in the emerging market sector in South Africa and has been
experienced first-hand by the author who, together with the head of the emerging market
strategy at Clover, Kuben Govender, went through a process of reducing case pack. The
cash layout for a spaza shop owner for a case of 20 units is unaffordable, especially if the
© University of Pretoria

13
product is not a crucial key value item (KVI). By reducing the number of units per case, it
allowed more frequent purchase and more reliable on-shelf availability for Clover South
Africa as well as Kellogg Company South Africa, which use the same distribution channel
(Kuben Govender, personal communication, July 7, 2016). These companies’ experience
that emerging market retailers have limited cash flow and are deterred by large case pack
quantities with slower unit rate of sale has been encountered by other companies too,
leading to Red Bull’s reduction of their 24-can cases to 12-can cases and Parmalat’s very
successful introduction of single-slice cheeses (G.G. Alcock, personal communication,
October 20, 2016).
Results in the study by Wan et al. (2014) showed several limitations which could be used as
opportunities for future research. Wan et al. (2014) acknowledged that a limitation of their
study was the restriction of the sample of soft drink products sold in 12-ounce cans. Soft
drinks are sold in many other forms, and the variety across container size could also have an
impact on performance. The implications of this key limitation were that future studies could
examine the impact of various dimensions on a wider range of performance measures.
2.2.1 Importance of production in pack size variety
Production, handling and distribution costs could increase as container variety increases,
although as competition intensifies and consumers become more price-sensitive or are
impacted by a reduction in consumer income, unit pack size variety may become more
predominant. This once again raises the important yet understudied topic of portion control,
not as a control of dietary content or weight control but as a measure of consumption versus
income (Alcock, 2015; Alcock, 2016; and Liedeman et al., 2013). Another understudied trend
in the emerging market in South Africa is that of convenience given the reliance on public
transport according to Trade Intelligence (2016). With distances vast in many instances,
carrying and transporting groceries and bags of food becomes an obstacle for consumers.
Variety and convenience in packaging therefore becomes an important consideration.
Research by Scavarda, Reichhart, Hamacher and Holweg (2010) as well as Bezuidenhout
(2014) reviewed previous research done on “late configuration” (p. 220), a term coined by
Scavarda et al. (2010) to describe variety and assortment created in products post the
manufacturing stage. Their studies have shown that one important aspect has perhaps not
been considered: When comparing the aspects of variety in their study on Ford’s supply
chain (factory-fitted variety versus late configuration at dealerships), it is evident that low-
volume variety can be created more cost-efficiently further down the value chain and in their
study specifically, in a job-shop environment as opposed to an assembly line. Scavarda et
© University of Pretoria

14
al. (2010) stated that future research regarding late configuration should perhaps consider
both volume and variety to provide a more holistic assessment. To add to this, assortment
and packaging variety should also be taken into account and, as mentioned earlier as the
aim of this study, should be analysed within an emerging market context. Scavarda et al.'s
(2010) view that “it is more difficult, if not impossible to increase fundamental and
intermediate variety using late configuration at dealers, which puts a severe restriction on the
variety offered in emerging markets” (p. 221) is also applicable to an emerging market
environment.
2.2.2 Importance of distribution in pack size variety
As Kumar et al. (2015) note in fig 4 below, it is also important to understand the most
effective distribution format for different product forms. Clover’s efficient cold chain
distribution network allows the flexibility to deliver any of their dairy products in any form or
shape. Understanding the retail landscape and different store formats needs to be taken into
consideration. A direct distribution model allows companies to influence the supply side
decisions of the retailer ((Kumar, Fan, Gulati & Venkat, 2009; and Kumar, Sunder & Sharma,
2015).
Pornitakpan (2010) and Sy-Changco et al. (2010) analysed the importance of the distribution
network for sachet marketing in the retail industry in Philippines. With a large number of
small sari-sari stores, their equivalent of South African spaza shops, the extensive
distribution network to these stores supported the success of small package items and
sachets. Without sachets, a retail store would not have survived. As noted by Pornpitakpan
(2010), the small formats and the small stores mutually served each other’s needs. It
therefore goes to show that a solid distribution structure and understanding of store formats
should be in place along with a clear understanding of what pack sizes suit which store
formats in order to fully optimise tertiary selling (Sy-Changco et al., 2010).
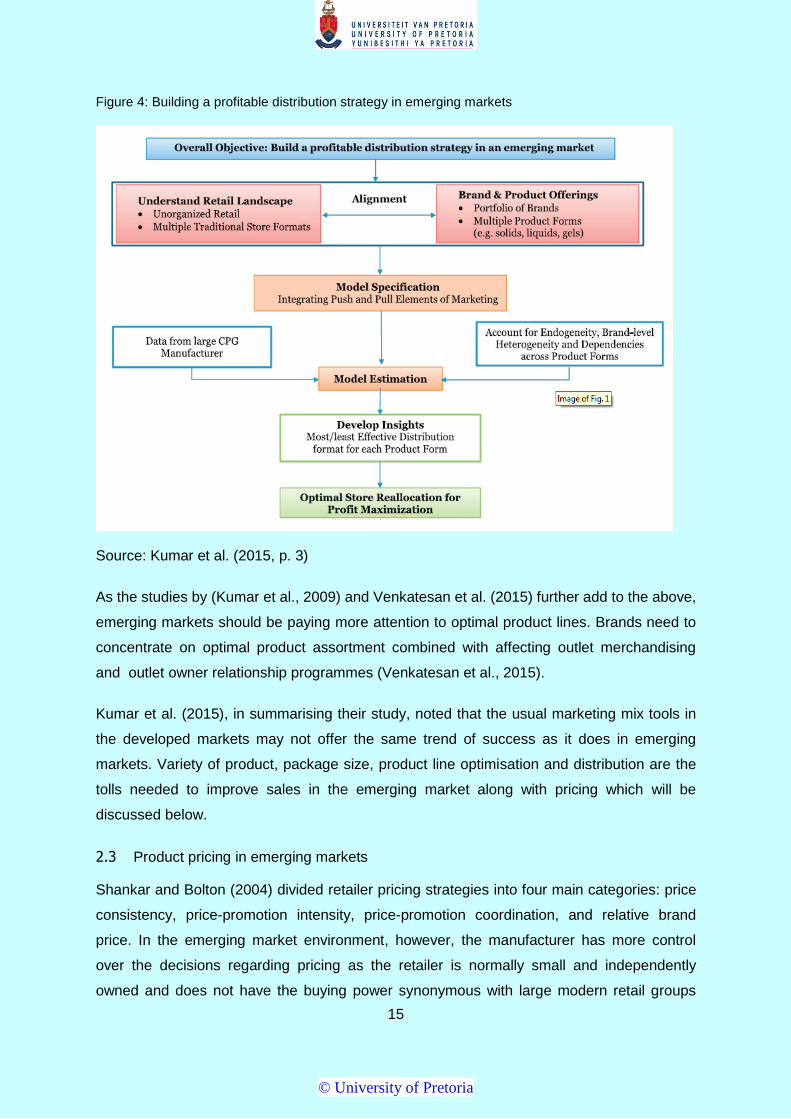
As observed below, Kumar et al. (2015) highlight the important combination of a few key
factors in successfully catering for the right pack sizes at the right price in the emerging
market. Understanding of the retail landscape, knowing what portfolio of brands and product
forms you are distributing in which distribution format and an understanding of brand level
heterogeneity and dependencies across product forms are key considerations.
© University of Pretoria
15
Figure 4: Building a profitable distribution strategy in emerging markets
Source: Kumar et al. (2015, p. 3)
As the studies by (Kumar et al., 2009) and Venkatesan et al. (2015) further add to the above,
emerging markets should be paying more attention to optimal product lines. Brands need to
concentrate on optimal product assortment combined with affecting outlet merchandising
and outlet owner relationship programmes (Venkatesan et al., 2015).
Kumar et al. (2015), in summarising their study, noted that the usual marketing mix tools in
the developed markets may not offer the same trend of success as it does in emerging
markets. Variety of product, package size, product line optimisation and distribution are the
tolls needed to improve sales in the emerging market along with pricing which will be
discussed below.
2.3 Product pricing in emerging markets
Shankar and Bolton (2004) divided retailer pricing strategies into four main categories: price
consistency, price-promotion intensity, price-promotion coordination, and relative brand
price. In the emerging market environment, however, the manufacturer has more control
over the decisions regarding pricing as the retailer is normally small and independently
owned and does not have the buying power synonymous with large modern retail groups
© University of Pretoria
16
(Kumar et al., 2015; and Shankar & Bolton, 2004). Regarding price elasticity, Kumar et al.
(2009) noted earlier that in the laundry detergent category, emerging market consumers
were price inelastic and firms could therefore benefit by increasing prices.
The study by Shankar and Bolton (2004) further showed that a retailer has high levels of
brand consistency when competitors prices are lower and when competitor deals are more
frequent. The other factors at play include market type, chain size and positioning, proximity
of emerging market retailers, category assortment, own price elasticity, cross-price elasticity
and the proximity to urban metropolitan areas versus rural areas.
From a South African perspective there is further complexity with a growing number of
foreign nationals owning emerging market spaza stores (Moloi, 2014; and Mthimkhulu,
2015). In a study by Liedeman et al. (2013 ) on the reasons why foreign nationals are more
successful than South Africans, pricing was found to be a key factor. This ethnographic
study by Liedeman et al. (2013) compared South African-owned and foreign-run businesses
in terms of the way they operated with respect to ownership dynamics (establishment
process, labour and employment), financial investment (size of business and assets), stock
procurement, business operations and operating times. The basic finding was that the
business approach and scale of operations of foreign-run emerging market stores (spaza
shops) contrasted markedly with the predominantly micro or small scale “survivalist”
approach of most South African-owned emerging market stores. Social or community
networks were identified as a key factor which provided access to cheap labour,
predominantly by Somalians who through struggles in their home country know nothing
better than to work hard for little money (Liedeman et al., 2013). Key aspects to their
success were their ability to price more competitively by basing their operating model on
collective procurement, their social distribution networks and their conservative living.
Liedeman et al. (2013) further explained that the South African spaza shop owners or
managers, in contrast, usually operated within a fairly weak social network which was limited
to members of the close family who supported with labour but little else, and they typically
operated as survivalist micro-enterprises. Despite this being a challenge at a local level, the
point is that pricing is a key determinant if emerging market retailers or spaza shops want to
survive with the growing influence of formal or organised retailers entering this space. These
foreign store owners have already shown in the recent studies (Liedeman et al., 2013; and
Trade intelligence, 2016) that they have the ability to compete, but in order to do so more
effectively will need continued collective procurement, social distribution networks and a
© University of Pretoria

17
focus on smaller convenience packs targeting the high-frequency as opposed to the bulk
month-end shopper.
Kumar et al. (2009) as well as Mukherjee and Patel (2005) pointed to the Maximum Retail
Price (MRP) concept and declared that it warrants discussion. The MRP is the highest price
that can be charged by the company and is actually required by law to be printed on the
product package. In an Indian emerging market context, retailers across store formats tend
to sell products at MRP instead of competing on price (Mukherjee & Patel, 2005). In a South
African context, however, and without MRP being required by law, there may be less price
compliance. Kumar et al. (2009) recognised that this could be a limitation of their study for
other emerging markets where MRP did not apply or when large retailers commanded more
bargaining power in the supply chain. However, the Indian and African contexts show
similarity in the fact that, since most store formats comprise traditional, smaller vendors, they
have very little power over deciding prices. These vendors might need to focus on smaller
convenience packs targeting the high-frequency as opposed to the bulk month-end shopper
However, as researched by Liedeman et al. (2013) and as per Trade Intelligence (2016),
collective buying habits and the other characteristics of foreign nationals in South Africa
mentioned above means that this may not necessarily be the case.
Results of research by Kumar et al. (2009) from three home insecticide products showed a
positive effect of competitor sales on private brand or owned brand sales for the solid
product form, a negative effect for the liquid product and a more positive effect for the gel
product format. The results indicated that further investigation in terms of the dynamics of
competitive actions on own sales would need to be conducted in future research, as higher
dependency levels were noted across product forms and brand level heterogeneity. This
needed to be accounted for in the Indian market, and according to Kumar et al. (2009)
managers need to fine-tune their marketing mix prudently to ensure the absence of
cannibalisation between the product forms. Further research is therefore needed to assess
different types of consumers at different disposable income levels in emerging markets in
terms of a tiered pricing strategy, and to an even deeper degree, the level of disposable
income at varying times of the month for waged and salaried low-income earners.
Package downsizing has become more prevalent globally as an alternative to raising price
and remaining price-sensitive in the face of intense competition (Akır & Balagtas, 2014; and
Yang, Chen & Allenby, 2003). While significant research exists with regard to price-
elasticities of demand, the study by Akır and Balagtas (2014) was the first to quantify
consumer responses to package size. Simultaneous demand and supply data on ice cream
© University of Pretoria

18
purchases for a panel of households in Chicago was used, and consumer responses to
changes in package size were assessed. A key finding was that on average consumers
were around four times more sensitive to pack price as they were to pack size.
This result is significant for marketers. Consider a competitive marketing environment in
which managers have only limited room to increase product prices without affecting sales.
Brand managers may prefer to maintain existing prices, or avoid relatively large increases if
the range of acceptable prices as defined by the region between upper and lower-price
thresholds is narrow (Akır & Balagtas, 2014; and Mazumdar & Jun, 1992). Kalyanaram and
Little (1994) also analysed the factors affecting the price-insensitive area within the range of
acceptable prices for sweetened and unsweetened drinks, and their suggestion was that
‘marketers who want to increase prices should ‘nibble’ not ‘bite’’ (p. 416).
Another consideration for companies as recommended by Jaiswal and Gupta (2015) lies in
revising their promotional strategy to recognise the low level of deal proneness and in
tailoring the promotional campaigns to match the level of marketplace literacy in the bottom
of the pyramid sector. Given that consumers in this segment are brand loyal, Jaiswal and
Gupta (2015) have suggested that companies should rather channel promotional and
discount offers into loyalty programmes, not only providing incentive to traders and
consumers but also creating a more consistent price in the market.
2.4 The relationship between price and unit pack size
A study by Lennard, Mitchell, McGoldrick and Betts (2001) found that consumers used a
proxy for the actual volume of product it contains. Research on consumer visual perceptions
of product size and shape discovered that consumer perceptions of size were inelastic
(Chandon & Krishna, 2009), and research by Akır and Balagtas (2014) confirmed that most
consumers ignore size information, rather using visual assumptions of package volume.
What this then suggests is that consumers underestimate the real changes in product unit
size (Chandon & Wansink, 2007; and Chandon & Krishna, 2009).
According to the findings by Chandon and Ordabayeva (2009), the estimation bias of actual
size is enhanced when package changes move from one-dimensional changes to three-
dimensional changes. These findings make valuable contributions to the retailing literature
and need to be considered in this study in terms of the relationship between product unit size
and price. One of the limitations mentioned in the study by Chandon and Ordabayeva (2009)
was that monthly averages of brand level variables were used and it was suggested that
future research might want to use standard store level data to better show the effects of this
© University of Pretoria

19
aggregation on the results. This is important and relevant to the current study as store level
sales data were used which could enhance the studies by Chandon and Wansink (2007),
Chandon and Ordabayeva (2009) and Lennard et al. (2001).
One challenge of downsizing is that consumers think smaller portions are not as economical
(Chandon & Wansink, 2007). Another challenge is that the lower net price reduces the
average consumer spending and may not be equalised by the average increase in number
of customers (Chandon & Wansink, 2007; and Chandon & Ordabayeva, 2009). Between the
discoveries by Chandon and Wansink (2007) and those of Chandon and Ordabayeva (2009)
and even beyond, little has been done to identify whether consumers think that smaller
portions are indeed less economical or that their spending reduces due to the lower net price
of smaller unit sizes.
The key to this study is not in changing the pack or unit size but rather to extend the product
line, creating more pack size options. The consumer then has the alternative of a larger or
smaller product unit size of the self-same product. The importance here is that this study
hopes to uncover a changing consumer environment with more and more emphasis on
different consumption occasions and available, on-hand disposable income for less affluent
consumers in emerging markets. Extensions of the product line in terms of unit pack size
and price are indeed needed and especially smaller unit sizes to cater for the daily purchase
occasion of the emerging market consumers. The above studies were limited in their not
considering that smaller unit pack sizes at different price points may attract new consumers
over and above attracting the existing consumers at different purchase occasions.
Studies by Berger et al. (2007) and others like Iyengar and Lepper (2000) referred to the
importance of product line length. Berger et al. (2007) saw product line as an integral part of
a company’s competitive toolkit. Their results show that price and line length are
complementary: if a firm’s wants to increase price, it can control market share by extending
product line length. Line length affects consumer behavior and production costs
(Pornpitakpan, 2010). Results also suggested that product proliferation could even be
counterproductive in the sense that market share decreases after a certain line length
(Berger et al., 2007). These researchers found that on the organisation’s side production
costs increase exponentially as line length increases, therefore effective management of line
length remains a critical consideration.
The results of the study by Berger et al. (2007) show the impact that product variety has on
brand choice. Even when the exact same options were offered by both brands, consumers
© University of Pretoria

20
were more inclined to select a chocolate when it was offered by the high-variety brand.
Then, when the brand offered greater variety in the product line, participants found the same
chocolates to be tastier and showed a higher likelihood of buying that brand. The results
imply that a brand offering better variety has a higher likelihood of being tasted, and
consumers are likely to perceive it as superior even against taste. Other previous studies
have confirmed that product variety increases a company’s market power, which in turn
raises profit margins and market share (Bayus & William P. Putsis, 1999).
Another limitation to be addressed by the current study is the fact that Berger et al. (2007),
Chernev (2011), and Iyengar and Lepper (2000) in all their experiments consistently used
gourmet chocolate bars as the product to test for assortment size. These studies all
recognised the limitation of only using one product and consistently using this same product
over similar studies and across more than a decade of research. Although there have been
other studies using other products, the work around the area of product line length and
variety remains scant in terms of the products used. The current study therefore comprises
an analysis of three different products in an attempt to show the impact of product line length
and variety from the angle of product pack size as a form of product line length and variety.
Turri (2011) also indicated the need for future research to address some of the limitations
mentioned in Chernev and Hamilton (2009), Chernev (2011) and Berger et al. (2007) by
examining much of the same research in an actual retail setting. This points to yet another
limitation addressed in this present study, as Turri (2011) mentioned that the use of a field
study to tackle a few of the same hypotheses would make for a sample which would be more
representative of the greater population. A more realistic environment would be created,
although the drawback could be that it could be accompanied by a lack of experimental
control.
Research by Chernev and Hamilton (2009) and Chernev (2011) emphasises that consumer
choice among product assortments is a function of the attractiveness of the options found in
these assortments. Smaller assortments are more likely to be preferred when consumers
choose between attractive options than when deciding among assortments where there are
less attractive options. Again, this research ends at this conclusion and does not delve
deeply enough into the decision of product pack size as a form of product variety. Chipp,
Corder and Kapelianis (2012) reminded us, however, that in the South African environment
managers should make careful consideration when defining the bottom of the pyramid and
must distinguish between individual and household purchase decisions. Marketing managers
should be considering such decisions when deciding between alternative pack sizes (Chipp
© University of Pretoria

21
et al., 2012). In fact, this requires further analysis of the results of this study. In the analysis
of different pack sizes across a single branded product, it should be carefully considered that
in some cases there may be purchase interplay between similar sizes, but when analysing
the interplay between for example a 200 ml fruit juice and a 2 L of the same product variant,
there may be different needs states and purchase behaviour and different occasions at play.
In a web article by Florio (2016), the recent term “price pack architecture” is discussed. The
author builds on what the above studies suggest, stating that it is critical for organisations
and marketers to understand the full value case. The right innovation, he argues, may be as
simple as bundling or creating alternative pack sizes and that these adjustments can
legitimately drive shopper desire to pay a higher price point. He furthermore argues that
healthy snacking and convenience are playing more and more of a role in modern busy
times and so creating reduced pack sizes for convenience at increased margins has an
advantage for both the manufacturer or retailer and the consumer. However, this needs to
be carefully assessed by the market and consumer. Price sensitivity in the emerging market
will expose a company that creates more margins through a size reduction at the expense of
value to the consumer, despite the convenience of the product.
Chipp et al. (2012) noted that price-performance trade-off may be one of the most important
aspects of the value proposition for consumers in the emerging market setting. They stated
that this result was in line with results by Dawar and Chattopadhyay (2002) who had pointed
out that pricing strategies needed to be considered first when implementing marketing
programs in the bottom of the pyramid.
Shaikh, Gandhi and Phau (2016) viewed retail margin as very important when a spaza shop
owner chooses to stock a product or not. They looked at factors such as relationship, trust in
the company supplying them, product information and the availability of the same product
with their competitors. Above all the retail margin they make seems most important
(Ailawadi, Harlam, César & Trounce, 2006; Arnold, Palmatier, Grewal & Sharma, 2009; and
Venkatesan & Farris, 2012).
Jaiswal and Gupta (2015) built on recent studies in the emerging market context and their
findings have been invaluable in determining the essence of this study, namely to analyse
the impact of product variety in terms of unit pack size and price in an emerging market
context, and to add another layer by assessing what was previously discussed regarding
modern-day retailers and their impact on unit pack size and price.
© University of Pretoria

22
In their study of Fair and Lovely fairness cream, Jaiswal and Gupta (2015) identified that to
create significant impact in the BOP, one needs inexpensive unit packs or sachets catering
for single serve portions and for the consumer’s limited coinage at the time of purchase.
Apart from single serve portions, another area of success is the rural distribution channel.
Jaiswal and Gupta (2015) used in their research the distribution network known as Project
Shakti, where rural women were recruited as sales agents doing door to door selling of Fair
and Lovely. However, this to the knowledge of Jaiswal and Gupta (2015) and as far as
research for this study is concerned, showed for the first time empirical support for criticism
against marketing to the poor in the bottom of the pyramid. Santos and Laczniak (2000)
stated that the poor are vulnerable and held back by their lack of education, income,
opportunity and access of markets, and Jaiswal and Gupta (2015) agreed that door-to-door
selling leads to diversion of scarce financial resources and prevents fulfilment of basic needs
and purchase of non-essential products.
The findings by Jaiswal and Gupta (2015) did reflect that if the stated marketing goal is an
improvement in life and the market exchange between the marketer and the poor is not
exploited, therefore there is potential for companies to not only contribute to alleviating
poverty but also build long term customer relationships in this segment. They acknowledged
that future research on sachets and unit pack size would need to be done in emerging
markets outside of India. Their study was also done on an urban population, and in the case
of rural South Africa, BOP or emerging market consumers are not exposed to advanced
media forms and aggressive advertising. Rural markets have a long way to go until they are
fully penetrated by distributors and companies, and cultural nuances vary significantly
between the consumers of urban and rural emerging markets (Kumar et al., 2015).
Furthermore, something very fundamental to future research is the argument that the poor
are part of the high-cost economic ecosystem and pay significantly higher prices for different
products and services (Hammond & Prahalad, 2004; and Jaiswal & Gupta, 2015). From a
South African perspective, this high-cost ecosystem may not be applicable considering the
low-cost model foreign nations operate on as alluded to earlier.
In India, shampoo sachets contributed more than 95% of the haircare product industry’s
sales and 60% of sales value in the early 2000’s (Hammond & Prahalad, 2004). Findings by
Gerstner and Hess from as far back as 1987 showed that package size was a good way of
segmenting the market. Dividing a large package into smaller sub-packages enabled people
to control their consumption, according to Wansink and Huckabee (2005), and this has been
seen as a clever marketing strategy in economic downturns (Quelch & Jocz, 2009; and
© University of Pretoria

23
Sarkar, Kundu & Chaudhuri, 2016). If executed properly, this could lead to an increase in
frequency and quantity of purchase.
This study intends adding to the above research by delving deeper into and uncovering in
greater detail the effects of unit package size and price on the decisions of spaza retailer
decisions and consumer choices in emerging markets. Added to this, with the increasing
impact of new large retailers entering the space, there has been a definite need to study how
these modern retail formats affect consumers and spaza retailers alike. This study has
therefore combined the study of unit pack size and price with the impact of large retailers on
decisions in this regard.
Evans (2011) pointed out that “we should not be surprised or distressed when certain types
of retailing fall into disfavour and others emerge to replace them. Rather, it needs to be seen
how and why specific retail institutions and practices have evolved and where they are
headed and adapt strategies accordingly” (p. 11). This study has therefore attempted to add
value to corporate companies that develop and sell products aligned to the emerging market,
by adding understanding of the selection of products and pack sizes, and at what prices
these items should be sold. It has also attempted to highlight the significance of distance
between the spaza shops and new entrant retailers in determining what packs to stock and
in which sizes.
Although marketing literature in the developed markets is rich, empirical research concerning
marketing strategy remains fairly scarce in terms of emerging economies. Microeconomic
theory predicts that consumers in emerging markets are more price-sensitive than those in
developed markets due to tougher financial constraints (Gupta et al., 2011). However,
evidence of the above in an emerging market context has been scarce and inconclusive
(Kumar et al., 2015). Furthermore, by linking time-varying effects to income distribution, it
can be explored whether consumers in emerging markets change their preferences
according to income. In perhaps the most recent and most relevant study in this area by
Kumar et al. (2015), limitations of regional and town level differences in demand due to data
limitations are recognised. This study has therefore attempted to address the above
limitations and build on previous studies with the aim of providing valuable marketing and
pricing discoveries to this field.
© University of Pretoria

24
2.5 Conclusion to the chapter
Diagram 1: Framework of this study
Source: Author's own
In reviewing the above diagram and the literature assessed in this chapter, detailed context
to the importance of the broader concept of product variety emerged. It then narrowed theory
down to product pack size as a form of variety and the pricing decisions that need to be
considered when changing pack size or extending a product line with a greater number of
stock-keeping units of different sizes. The literature review furthermore discussed the above
factors in the context of an emerging market setting, as well as the impact that today’s large
modern retailers are having on the emerging market. Evidently, opportunity remains to
analyse price and pack architecture more extensively, especially in the emerging market
context and with the added complexity of formal retail entering the informal retail space. It
requires a shift in thinking from all parties involved, from manufacturer right through to spaza
shop owner.
© University of Pretoria

25
CHAPTER 3
3. RESEARCH QUESTIONS
3.1 Introduction
The previous chapter discussed literature relating to product pack size, price, and the
entrance of modern-day retailers into the emerging market. This research aims to
understand how these aspects impact the emerging market space and the decisions spaza
shop owners and manufacturers need to make to keep abreast of these changes.
3.2 Research objectives
The research intends to discover insights into the distribution of product stock keeping units
(SKUs) and how the sales performance of existing SKUs will be influenced by the
introduction of smaller SKU sizes. Further objectives are to discover insights around the
influx of modern-day retailers, and whether distance between the emerging market spaza
shop and modern-day retailer impacts the sales and assortment mix of brands.
3.3 Identification of research questions from the literature
The key literature, the limitations that emerged and the opportunities for future research
were narrowed down to identify the research questions.
Dholakia and Dholakia (2012), Kumar et al. (2009) and Yadav, Verma, and Singh (2016)
mentioned the need to study the impact of an increasing number of modern trade retailers
entering the informal emerging market environment. This point was further noted by
Liedeman et al. (2013), Madlala (2016) and Moloi (2014). In addition, little empirical research
has been done on the value of pack architecture diversification of products in the emerging
market environment with the influx of large retailers entering this space as attested by
Kumar et al. (2015) as well as Sorescu et al. (2011).
Referring more specifically to pack unit size and as far back as Gerstner and Hess (1987),
package size has been seen as a good way of segmenting the market. Dividing a large
package into sub-packages allows people to control their consumption (Wansink &
Huckabee, 2005), and this has been seen as an effective marketing strategy in economic
downturns (Quelch & Jocz, 2009; Sarkar et al., 2016).
Trade Intelligence (2016) has noted that within the context of South Africa’s informal,
emerging market, spaza retailers can compete on price. Therefore, narrowing down all the
above aspects means there remains opportunity to study how distance between modern
© University of Pretoria

26
retailer and spaza shop impact product unit availability and sales performance. Uncovering
this will help both spaza owners and suppliers to determine what product sizes to stock,
considering the encroaching modern trade retailer. This then leads to the two research
questions below:
3.3.1 Research Question 1:
Is the availability of product unit size in emerging market spaza shops
influenced by distance between the emerging market spaza shop and
modern-day retailer?
3.3.2 Research Question 2:
Are the sales of a product assortment in emerging market spaza shops
influenced by distance between the emerging market spaza shop and
modern-day retailer?
3.4 Conclusion
The above research questions intend to uncover important information which may assist the
decision making of academia as well as business, particularly those of the informal spaza
shop owners. The methodology behind how the research was conducted will now be
identified, the results will be analysed and recommendations will be made.
© University of Pretoria

27
CHAPTER 4
4. RESEARCH METHODOLOGY
4.1 Introduction
The study required obtaining secondary data from Clover, South Africa’s largest dairy
distributor. The key to Clover’s data reliability lies in the direct distribution of the products
analysed and the thorough measurement of the data over a four-year period. Pricing,
availability (distribution) and sales data of certain product SKUs were analysed along with a
time series analysis of the geographical plotting of spaza shops and modern retailers over
the period to assess the impact of time and changes in numerical outlet growth. The
research study focused on a number of stock-keeping units across three products namely
Clover’s Fruit Krush range, UHT long life milk and the Tropika fruit juice range. The objective
lay not in the number of stock-keeping units across different product types but remained
focused on a few lines as was the case in a similar study of the assortment size of
chocolates (Chernev, 2011). The change in size assortment and sales performance over
time was then observed, considering the introduction of smaller SKUs over time. The study
also assessed the impact of numerical store growth of modern retailers on the changes in
sales, availability and pack architecture.
4.2 Research design
Saunders and Lewis (2012) and Zikmund, Babin, Carr and Griffin (2012) divide research into
three key areas namely exploratory, descriptive and causal studies. In exploratory studies,
research is conducted into new phenomena where the problem is uncertain and exploration
is required. This research is a first step conducted with the expectation that additional
research will add more conclusiveness. Exploratory research is often used to guide and
refine previous research efforts. Descriptive studies are research to more specifically
describe the characteristics of the phenomenon, usually answering the question "what?”.
Causal research identifies cause and effect relationships between variables and answers the
question "why?”.
4.2.1 Exploratory research
This is a study using quantitative data such as sales figures, pack sizes and geographical
coordinates (Saunders et al., 2012). Previous, similar studies of chocolate used consistently
in literature by Berger et al. (2007), Chernev (2011) and Iyengar and Lepper (2000) all used
exploratory research. The use of exploratory research seemed most appropriate for this
current study, depending on the accuracy and reliability of the data.
© University of Pretoria

28
Given the reputation of the data source and the credibility of Clover’s data systems, there
was even more reason to go with this option. Research was conducted as a first step that
additional studies can build on, but it also contains aspects that could refine previous
research (Zikmund et al., 2012). According to these authors, exploratory research is
particularly useful in new product development and therefore has relevance in this study in
terms of exploring existing unit pack sizes and prices and the impact of modern-day retailers
entering the emerging market space. The study may uncover opportunities for new pack
sizes and price points.
4.2.2 Generating secondary data
Secondary data is data that already exists in a processed format (Wegner, 2007, p. 14). The
internally-sourced secondary data collected from Clover are normally used for purposes of
analysis and performance management by their commercial team. According to Zikmund et
al. (2012), when secondary data is reported in a format that does not meet the researcher’s
needs, data conversion may be needed to change the form of the data to more suitably
achieve the research objective.
Secondary data generation was most suited to this research. The secondary data was
accessible, could be acquired faster and was less expensive. The data was stored digitally
and could be retrieved electronically. Since the study dealt with price and pack analysis as
well as geographical coordinates, access to relevant fast-moving consumer goods data was
important; this was made possible in this research study. This data, consisting of pack and
store sales data, went back four years to the inception of the Clover Masakhane strategy
aimed at the bottom of the pyramid in South Africa. This data was overlaid and analysed
against retail outlet geographical coordinates to determine the impact of such modern
retailers on the sales and pricing decisions of spaza stores and their choice of stock-keeping
units.
Zikmund et al. (2012) also noted certain disadvantages to using secondary data, namely that
the information is not relevant and recent and there is a lack of information to cross-check
the relevance of the data. In this study, however, there was little risk of these disadvantages
being applicable, as the data came from a reputable source, was recent going back four
years, and was managed by the company for their own audit and reporting requirements.
Market-basket analysis is a certain type of data mining that assesses anonymous point-of-
sale data to identify purchases that coincide or to pick up relationships between products
purchased and other retail shopping information (Zikmund et al., 2012). The current study
© University of Pretoria

29
was therefore designed to be a market-basket analysis of point-of-sale data by store of
different products in different unit sizes.
4.3 Unit of analysis
Within the context of this study, the units of analysis were the following predetermined
pieces of data:
Unit pack size (measured in grams and/or litres)
Unit pack sales (measured in rands)
Distance between modern-day retailer and spaza shop (measured in kilometres)
100 spaza shops in terms of price and pack data in the three mentioned clusters were
measured in the analyses.
4.4 Universe
‘The population of a research study is the complete set of group members that meet the
requirements of the study (Saunders & Lewis, 2012, p. 12). Using Clover South Africa’s
secondary data, the universe consisted of all retail outlets dispersed nationally where Clover
delivers directly. Segmentation was done according to informal (traditional) trade and
formal/modern trade, although the sample as noted above was restricted to three separate
clusters to ensure less bias of the study only being in one area.
Clover’s split between traditional and modern retailing channels can be defined as follows:
4.4.1 Traditional format stores
This is Clover’s Masakhane channel, established in 2012 and aimed at penetrating 100 000
non-key account customers in the BOP emerging market. Masakhane is a specialised BOP
distribution route to market, with a “cold calling / door to door” market-specific sales
execution team to match this emerging market strategy. The Masakhane channel is an
extension of Clover’s core competitive strength in that Clover’s national distribution network,
infrastructure, sales and marketing mobility technology are used as a critical success factor
to penetrate this market. Traditional-format stores can be defined as independently owned,
smaller-sized stores (Polsa & Fan, 2011). In a South African context, the database of the All
Media and Products Survey (AMPS®) provides the following definitions:
© University of Pretoria

30
Spaza Shop/ Spaza: a convenience retailer operating from a room in a house
(Strydom, 2011).
Independent neighbourhood supermarket: a general goods store independently
owned; often family owned (Strydom, 2011).
However, from a Clover Masakhane perspective, only spaza shops are measured as part of
this channel. Independent neighborhood supermarkets form part of the modern-format
stores discussed below.
4.4.2 Modern-format stores
Modern-format stores are categorised as specialised, self-service chain stores,
supermarkets and hypermarkets (Strydom, 2011). In a South African context, the AMPS
database classifies the following as branded retailers:
Pick n Pay
Pick n Pay Hyper
KwikSpar
Boxer Superstore
Cambridge Foods
Checkers Hyper
Buy Rite
OK Foods
OK Grocer
U Save
Shoprite
For the purposes of the study, only a specific modern retailer in each cluster was used and is
named as Modern Retailer 1 for purposes of confidentiality. Chipp et al. (2012) used the
Living Standards Measure (LSM) to describe lower-income consumers in South Africa as the
“foundation” and “core” (p. 20) groups, measured at LSM1-4 and LSM5-6, respectively. This
study is useful in understanding this sector of consumers. Even though the current research
comprised only emerging market retail shops (spaza shops) in South Africa, the findings
may also have relevance to emerging markets outside South Africa. The sample parameter
© University of Pretoria

31
was narrowed down to all spaza outlets within three separate clusters in South Africa: an
urban sample within Gauteng Province; rural samples on the outskirts of Polokwane,
Limpopo Province; and in Kwa-Mashu, on the outskirts of Durban in KwaZulu Natal
Province. The author found this necessary due to the limitations observed in Madlala (2016)
and Jaiswal & Gupta (2015) where one context or one geography was studied. Given that
this current study observes three different clusters, the variations and similarities of the
findings can be measured and compared across geographies, cultures and population
densities.
4.5 Sampling method and size
Non-probability sampling techniques were used, and specifically elements of quota and
convenience sampling. Quota sampling was selected to ensure that the sample would
contain a sufficient number of units satisfying certain criteria (Saunders et al., 2012). In this
study the quota sampling was done by classifying emerging market spaza shops based on
the distance or radii from modern-day retailers. This quota was applied to approximately 100
participants falling within three to four radii sections. A minimum number of 30 is based on
the likely data saturation point for homogenous populations (Saunders et al., 2012), so the
sample size of this research more than met these criteria. Convenience sampling is a
selection based on ease (Saunders et al., 2012) and in this study, apart from ensuring that
the relevant quota requirements were met, outlets within the geographical areas of the three
separate clusters were selected based on ease of access.
4.6 Data measurement
According to Zikmund et al. (2012), reliability represents the consistency and repeatability of
a measure. In this study the research measurement instrument was the sales and
distribution data sheets captured for each unit of analysis representing each unit product.
Validity is the degree to which the instrument measures the concept the researcher wants to
measure (Zikmund et al., 2012). The instrument in this study was valid and addressed what
needed to be measured. Lastly, according to Zikmund et al. (2012), sensitivity is the ability of
the instrument to accurately measure variability in responses. This study measured the
variability of each transaction over more than a 12-month period.
4.7 Data collection process
The data collected and analysed consisted of the following:
Database of emerging market spaza stores and retailers within three selected clusters
© University of Pretoria
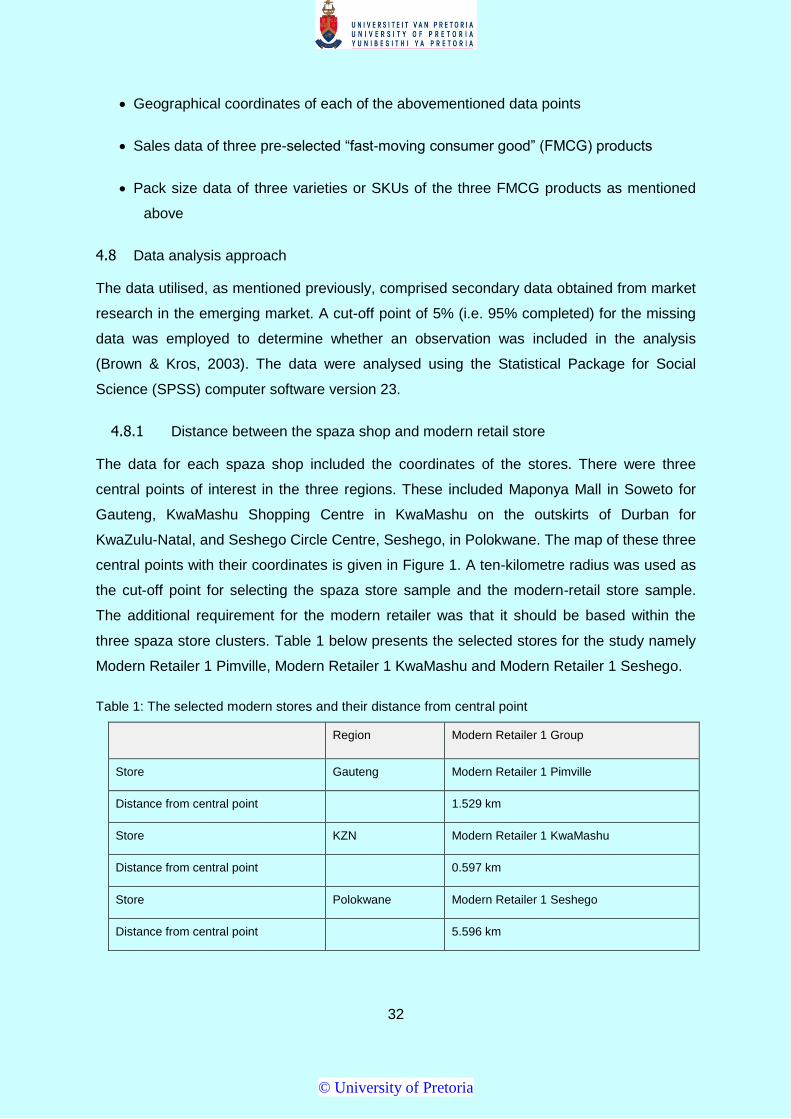
32
Geographical coordinates of each of the abovementioned data points
Sales data of three pre-selected “fast-moving consumer good” (FMCG) products
Pack size data of three varieties or SKUs of the three FMCG products as mentioned
above
4.8 Data analysis approach
The data utilised, as mentioned previously, comprised secondary data obtained from market
research in the emerging market. A cut-off point of 5% (i.e. 95% completed) for the missing
data was employed to determine whether an observation was included in the analysis
(Brown & Kros, 2003). The data were analysed using the Statistical Package for Social
Science (SPSS) computer software version 23.
4.8.1 Distance between the spaza shop and modern retail store
The data for each spaza shop included the coordinates of the stores. There were three
central points of interest in the three regions. These included Maponya Mall in Soweto for
Gauteng, KwaMashu Shopping Centre in KwaMashu on the outskirts of Durban for
KwaZulu-Natal, and Seshego Circle Centre, Seshego, in Polokwane. The map of these three
central points with their coordinates is given in Figure 1. A ten-kilometre radius was used as
the cut-off point for selecting the spaza store sample and the modern-retail store sample.
The additional requirement for the modern retailer was that it should be based within the
three spaza store clusters. Table 1 below presents the selected stores for the study namely
Modern Retailer 1 Pimville, Modern Retailer 1 KwaMashu and Modern Retailer 1 Seshego.
Table 1: The selected modern stores and their distance from central point
Region Modern Retailer 1 Group
Store Gauteng Modern Retailer 1 Pimville
Distance from central point 1.529 km
Store KZN Modern Retailer 1 KwaMashu
Distance from central point 0.597 km
Store Polokwane Modern Retailer 1 Seshego
Distance from central point 5.596 km
© University of Pretoria

33
Figure 1: Maps of the central points with their coordinates
© University of Pretoria

34
© University of Pretoria

35
The range of distance between nearest and farthest spaza store to Modern Retailer 1
retailer was 0.099 km and 5.596 km, respectively. Distances were calculated using the
following formula:
Equation 1: Distance calculating between two GPS coordinates
=6371*ACOS(COS(RADIANS(90–L2))*COS(RADIANS(90-L1))+SIN(RADIANS(90-L2))
*(SIN(RADIANS(90 -L2))* COS(RADIANS(LN2-LN1))))
The mean is the description of the location, which can also be regarded as the
centre of mass of the data (Cajori, 1993).
Sin and Cos are trigonometric functions of an angle. The Sin of an angle is the
context of the right triangle, meaning for a specified angle, it is a ratio of the
length of the side that is opposite that angle to the length of the longest side of
the triangle (Cajori, 1993).
Cos of an angle is the context of the right triangle, meaning the length of the
adjacent side divided by the length of the hypotenuse (Cajori, 1993).
Radian is the unit of measurement of angles equal to about 57.3degrees,
equivalent to the angle subtended at the centre of a circle by an arc equal in
length to the radius (Cajori, 1993).
L1 and L2 = Latitude1 and Latitude 2
LN1 and LN 2= Longitude 1 and Longitude 2
4.8.2 Descriptive statistics
Descriptive statistics are used to describe and summarise features of a large data
(Zikmund et al., 2010). In this study the data for descriptive analysis were summarised
using frequency distributions and percentage frequency, mean and standard deviation.
The frequencies were used to provide the overview of the sample. This was aimed at
acquiring the central tendency and spread of the sample. The frequency and
percentage frequency was then used to understand the outlet spread or distribution
across the radii from the formal retailer as well as to determine the pack size, sales
volumes, brand and sub-brand categories (Zikmund et al., 2012).
A missing value analysis was conducted to analyse the missing values of the
secondary data. This analysis described the patterns of the missing values by locating
© University of Pretoria

36
them and by gaining insight into their extensiveness. If they were data extremities, it
would show that the missing data were random. The guidelines as provided by
Scheffer (2002) indicate that a cut-off of 5% should be used for missing data. If more
than 5% there is a risk of bias that could be brought in by the particular respondent. All
the data in this current study were therefore retained as there were no missing data
above 5%.
4.8.3 Relationship analysis
A cross-tabulation which is a joint frequency distribution of the cases based on two
categorical variables (pack size and distance from spaza shop to modern retail store)
was used to analyse the research questions. Displaying the distribution of the values of
the variables in common is known as contingency tables analysis. This analysis
provided the pattern of the relationship between the independent variable (distance)
and the dependant variables (pack size and sales). The significance of the relationship
was analysed using Pearson’s Chi -square test (χ2) while the strength of the
relationship was analysed using a Phi test or Cramer V test. Both the assumptions of
the Chi-squared test were met, concluding that the variable categories and their groups
were two or more. The p-value significance threshold was set at <.05. For cells with
less than a 5 count, in violation of the significance, the exact Fisher test results were
taken for significance.
Considering the testing level of 0.05, a standardised residual analysis which is a value
similar to a z-score was done to understand which cell contributed to the statistical
significance, meaning which level of independent variable accounted most for the
relationship (Hinkle, Wiersma, & Jurs, 2003). For degrees of association the Cramer’s
V (φ) was analysed, with the strength of the association measured using the guidelines
of Hinkle et al. (2003); with 0 indicating no relationship and 1.00 indicating perfect
relationship. Hinkle et al. (2003) suggest the following parameters: 0.0 – 0.29 (Weak),
0.30 ≥ 0.49 (Low), 0.50 ≥ 0.69 (Moderate), 0.70 ≥ 0.89 (Strong); 0.90 ≥ 1.00 (Very
Strong).
4.8.4 Differences between the groups
The analysis of variance (ANOVA) test was used to analyse the variance between and
within the regions (Soweto, KZN and Polokwane) in this study. The analysis used a p-
value of 0.05 for significance, with a p-value lower than 0.05 deemed as significant.
The variables that were found to be significant were further analysed using a post-hoc
© University of Pretoria

37
test. The post-hoc test by Bonferroni, due to its simplicity and versatility, was employed
to get the details of the differences (Hair, Black, & Babin, 2010).
4.9 Research methodology limitations
The research conducted in this study had, inter alia, the following limitations:
Although the study encompassed a large sample size across three areas, the
use of non-probability sampling means that the sample may not represent the
population statistically (Saunders & Lewis, 2012). The results may therefore not
be validly generalised to the whole population.
Saunders and Lewis (2012) warned that a small sample size in comparison may
negatively affect the validity of the data, which could be a limitation in this study
given the size of the population.
The study shows the impact of modern-day retailers on spaza shops but did not
consider large independent wholesalers or larger emerging market spaza stores
acting as wholesalers. These stores could also impact the sales, price and pack
decisions of spaza shops.
A study by Kumar et al. (2015) on specific store formats in emerging markets
shows that managers can gain a better understanding of the impact of
distribution (type and quantity) on the firm’s sales. This present study, however,
did not consider different store formats and hence presents generalisation
across all emerging market spaza type stores. Future studies could build on this
research by using the store formats analysis from Kumar et al. (2015).
© University of Pretoria

38
CHAPTER 5
5. RESULTS
5.1 Introduction
The objective of this exploratory research study was to gain a deeper understanding of
unit pack sizes in the emerging market spaza retail sector while looking at the growing
influence of formal retailers on stock-holding decisions related to unit pack size. The
research questions were presented in Chapter 3 and the methodology was explained in
Chapter 4. In this chapter, the findings of the study are presented following the format
of the two research questions. The results are presented using both descriptive and
inferential statistics.
5.2 Evaluation of missing data for reliability
The data set was completed with no missing values in all the variables of the 88154
observations, and no missing patterns were found (Table 2).
Table 2: Missing data analysis for the variables understudy
N
Missing
Count Percent
Group 88154 0 0,0
Account Manager 88154 0 0,0
Month 88154 0 0,0
ProdVLThree 88154 0 0,0
Pack size 88154 0 0,0
Actual Sales Value 88154 0 0,0
Price per Volume 88154 0 0,0
Distance PnP 88154 0 0,0
Distance Modern Retailer 1 88154 0 0,0
Distance Spar 88154 0 0,0
Distance wholesaler 88154 0 0,0
© University of Pretoria

39
5.3 Characteristics of the sample
There were a total of 88,154 observations from 265 Clover Masakhane stores (the
company term for spaza shops) in the three clusters sampled. The time frame for the
observations was from November 2012 to June 2016. The distribution per region is
provided in Figure 2. The highest observations were from KwaMashu, KwaZulu-Natal
(KZN) at 54.3% (N= 47895), followed by Gauteng at 25% (N=22115) and Seshego in
Polokwane at 20.6% (N = 18144).
Figure 2: The distribution profile of the Masakhane spaza stores per region
The above observations came from 100 spaza stores in Gauteng, 100 in KZN and 65
in Polokwane (Table 3).
© University of Pretoria
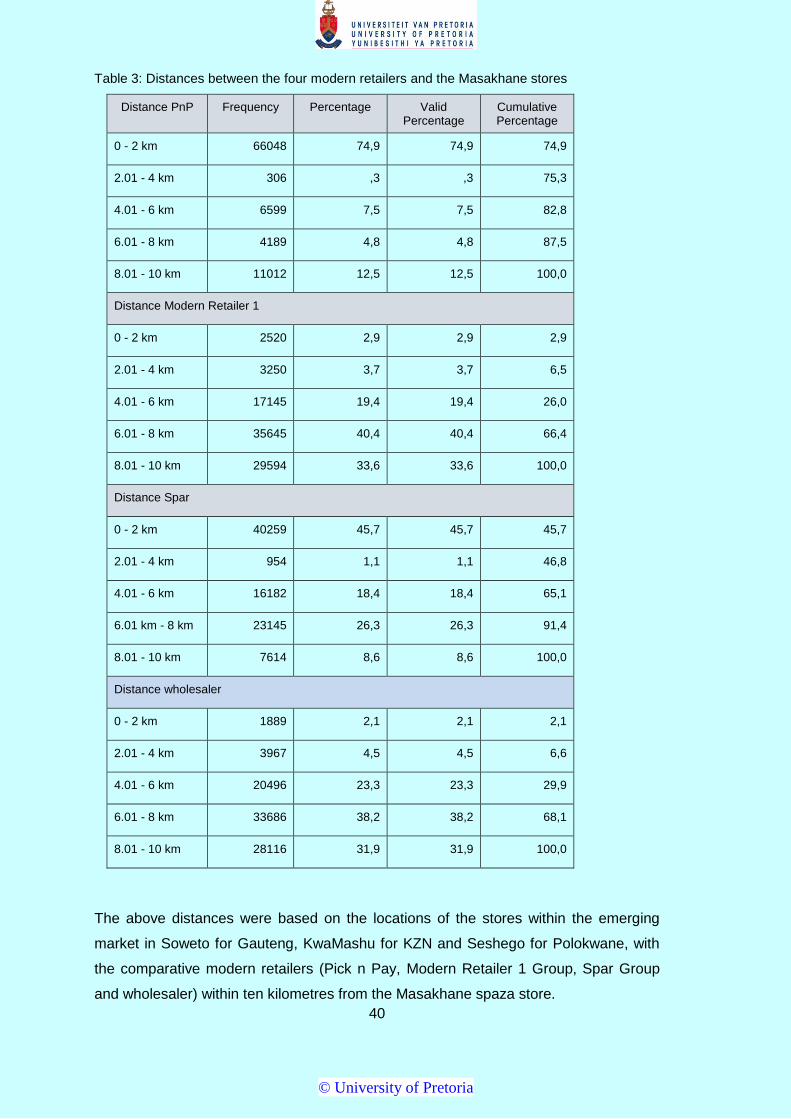
40
Table 3: Distances between the four modern retailers and the Masakhane stores
Distance PnP Frequency Percentage Valid Percentage
Cumulative Percentage
0 - 2 km 66048 74,9 74,9 74,9
2.01 - 4 km 306 ,3 ,3 75,3
4.01 - 6 km 6599 7,5 7,5 82,8
6.01 - 8 km 4189 4,8 4,8 87,5
8.01 - 10 km 11012 12,5 12,5 100,0
Distance Modern Retailer 1
0 - 2 km 2520 2,9 2,9 2,9
2.01 - 4 km 3250 3,7 3,7 6,5
4.01 - 6 km 17145 19,4 19,4 26,0
6.01 - 8 km 35645 40,4 40,4 66,4
8.01 - 10 km 29594 33,6 33,6 100,0
Distance Spar
0 - 2 km 40259 45,7 45,7 45,7
2.01 - 4 km 954 1,1 1,1 46,8
4.01 - 6 km 16182 18,4 18,4 65,1
6.01 km - 8 km 23145 26,3 26,3 91,4
8.01 - 10 km 7614 8,6 8,6 100,0
Distance wholesaler
0 - 2 km 1889 2,1 2,1 2,1
2.01 - 4 km 3967 4,5 4,5 6,6
4.01 - 6 km 20496 23,3 23,3 29,9
6.01 - 8 km 33686 38,2 38,2 68,1
8.01 - 10 km 28116 31,9 31,9 100,0
The above distances were based on the locations of the stores within the emerging
market in Soweto for Gauteng, KwaMashu for KZN and Seshego for Polokwane, with
the comparative modern retailers (Pick n Pay, Modern Retailer 1 Group, Spar Group
and wholesaler) within ten kilometres from the Masakhane spaza store.
© University of Pretoria

41
The three principal subgroups under investigation were dairy fruit mix, fresh milk and
juices, with the six products (labelled as ProdVLThree) being Clover Fresh Milk, Clover
Fruit Nectar, Dairy Fruit Mix Danao Fresh, Dairy Fruit Mix Tropika Fresh, Dairy Fruit
Mix Tropika UHT and Krush 100% Fruit Juice Blend (Table 4).
Table 4: The principal subgroups and ProdVLThree products
Principal Subgroup Frequency Percentage Valid Percentage
Cumulative Percentage
Dairy Fruit Mix 44061 50,0 50,0 50,0
Fresh Milk 29199 33,1 33,1 83,1
Juices 14894 16,9 16,9 100,0
Total 88154 100,0 100,0
ProdVLThree
Clover Fresh Milk 29199 33,1 33,1 33,1
Clover Fruit Nectar 8568 9,7 9,7 42,8
Dairy Fruit Mix Danao Fresh 856 1,0 1,0 43,8
Dairy Fruit Mix Tropika Fresh 40164 45,6 45,6 89,4
Dairy Fruit Mix Tropika UHT 3041 3,4 3,4 92,8
Krush 100% Fruit Juice Blend 6326 7,2 7,2 100,0
Total 88154 100,0 100,0
These products were introduced in different pack sizes between 2013 and 2015,
ranging from 200 ml to 2 L (Table 5). The largest pack size most often distributed was
500 ml at 36.2% (N = 31939), followed by 2 L at 20.8% (N =18335). The least
distributed pack size was 1.5 litre at 3.3% (N=2901).
© University of Pretoria

42
Table 5: Pack size of the products
Pack Size Frequency Percentage Valid Percentage
Cumulative Percentage
1 L 13942 15.8 15.8 15.8
1.5 L 2901 3.3 3.3 19.1
2 L 18335 20.8 20.8 39.9
200 ml 1322 1.5 1.5 41.4
250 ml 15730 17.8 17.8 59.2
330 ml 3985 4.5 4.5 63.8
500 ml 31939 36.2 36.2 100.0
Total 88154 100.0 100.0
The actual case sales volume ranged from a minimum of 1 item to a maximum of 2125
items (Table 6) with a sales value range of ZAR9 to ZAR29 079 (Table 7). The unit
sales volumes were measured in cases and their distribution shows 0-5 cases with the
largest proportion (56.1%) and the lowest unit cases 11-15 at 4.4%, (N = 3881). The
average sales value was ZAR138.84, with an average volume of about 12 (M=11.7
(SD =22.501)).
Table 6: Sales volume distribution
Sales Volume Frequency Percentage Valid Percentage
Cumulative Percentage
0 - 5 49439 56.1 56.1 56.1
6 - 10 16962 19.2 19.2 75.3
11 - 15 3881 4.4 4.4 79.7
16 - 20 5881 6.7 6.7 86.4
21 - 25 5378 6.1 6.1 92.5
Higher than 25 6613 7.5 7.5 100.0
Total 88154 100.0 100.0
© University of Pretoria

43
Table 7: Descriptive statistics of the volume and sales value
N Minimum Maximum Mean Standard Deviation
Sales Value 88154 9 29079 138.84 254.327
Sales volume 88154 1 2125 11.71 22.501
5.4 Influence of distance between modern retailer and spaza shop on product
distribution or availability in emerging market
The availability results of the various ProductVLThree or sub-brands from various
brands within the Clover brand stable were observed, after which the impact of
distance on this availability from the modern retailer were noted. A Modern Retailer 1
retailer was used in each of the three clusters.
Research Question 1: Is the distribution or availability of the product unit pack size in
the emerging market spaza shops influenced by the distance between the emerging
market spaza shop and modern-day retailer?
5.4.1 Relationship of the distance between Modern Retailer 1 and spaza in terms of pack size
The Pearson’s Chi-square test was used to analyse a possible relationship between
the distance between the retail store and spaza shops (Masakhane outlet base) and
the pack size of the product distributed to these spaza stores. The effect on each of the
ProdVLThree namely Clover Fresh Milk, Clover Fruit Nectar, Dairy Fruit Mix Danao
Fresh, Dairy Fruit Mix Tropika Fresh, Dairy Fruit Mix Tropika UHT and Krush 100%
Fruit Juice Blend was tested. To test this relationship, a hypothesis was developed.
H01: Distribution of the product unit size in the emerging market Spaza shops is
not influenced by the distance between the emerging market Spaza shop and
modern-day retailer.
HA1: Distribution of the product unit size in the emerging market Spaza shops is
influenced by the distance between the emerging market Spaza shop and
modern-day retailer.
© University of Pretoria

44
5.4.1.1 Clover Fresh Milk
Figure 3 and Table 8 present a cross tabulation of the distance between spaza shops
and Modern Retailer 1, together with the pack size distributed per product brand. For
the shortest distance of 0-2 km the 500-ml pack size was distributed to 5.5% of spaza
shops, compared to the 24.3% for 1 L and 23.8% for 2 L. This is to some extent
different to the cross tabulation of the longest distance of 8-10 km, where 1 L was the
most dominant pack size at 34.9% as compared to 250 ml at 24.2%. A Chi-square test
was conducted to determine the significance of the association. The results as
presented in Table 14 indicate that they were significant: χ2 (16, N=29199) = 1554.837,
p <.05. There was a contribution of this product across the distance on distribution with
most of these measurements with a standardised residual value higher than ±1.96.
Having established the relationship between distance and pack size with respect to
Clover Fresh Milk, the strength of the relationship was evaluated using Cramer V (φ).
Based on Henkel’s guideline, the strength of the relationship was weak with an φ value
of 0.115 (Table15).
Figure 3: Clustered bar chart indicating distance between spaza shops and Modern Retailer 1
with pack size for Clover Fresh Milk
.
© University of Pretoria

45
Table 8: A three-cross tabulation indicating distance between spaza shops and Modern Retailer 1 with the pack size distributed per product brand
ProdVLThree
Distance Modern Retailer 1.
Total 0 - 2km 2.01 - 4km
4.01 - 6km
6.01 - 8km
8.01 - 10 km
Clover Fresh Milk
Pack size
250 ml
Count 26 425 1907 2886 1982 7226
% within Pack size .4% 5.9% 26.4% 39.9% 27.4% 100.0%
% within Distance Modern Retailer 1.
4.1% 31.9% 27.0% 23.5% 25.1% 24.7%
% of Total .1% 1.5% 6.5% 9.9% 6.8% 24.7%
330 ml
Count 0 0 10 121 2 133
% within Pack size 0.0% 0.0% 7.5% 91.0% 1.5% 100.0%
% within Distance Modern Retailer 1.
0.0% 0.0% .1% 1.0% .0% .5%
% of Total 0.0% 0.0% .0% .4% .0% .5%
500 ml
Count 305 403 1183 2040 1646 5577
% within Pack size 5.5% 7.2% 21.2% 36.6% 29.5% 100.0%
% within Distance Modern Retailer 1.
47.8% 30.3% 16.8% 16.6% 20.9% 19.1%
% of Total 1.0% 1.4% 4.1% 7.0% 5.6% 19.1%
1 lt Count 155 435 3164 5202 2741 11697
% within Pack size 1.3% 3.7% 27.0% 44.5% 23.4% 100.0%
% within Distance Modern Retailer 1.
24.3% 32.7% 44.9% 42.4% 34.7% 40.1%
% of Total .5% 1.5% 10.8% 17.8% 9.4% 40.1%
2 lt Count 152 69 790 2034 1521 4566
% within Pack size 3.3% 1.5% 17.3% 44.5% 33.3% 100.0%
% within Distance Modern Retailer 1.
23.8% 5.2% 11.2% 16.6% 19.3% 15.6%
% of Total .5% .2% 2.7% 7.0% 5.2% 15.6%
Total Count 638 1332 7054 12283 7892 29199
% within Pack size 2.2% 4.6% 24.2% 42.1% 27.0% 100.0%
% within Distance Modern Retailer 1.
100.0% 100.0% 100.0% 100.0% 100.0% 100.0%
% of Total 2.2% 4.6% 24.2% 42.1% 27.0% 100.0%
© University of Pretoria

46
5.4.1.2 Clover Fruit Nectar
Figure 4 shows that at a 0-4 km radius, the 500-ml pack size was exclusively
distributed at 100%. This scenario changes as the distance increases, with 2 L
products of Clover Fruit Nectar the most dominant at 49.7% as compared to 500 ml at
36.4% and 250 ml at 13.8%. The results as presented in Table 9 indicate that they
were significant with a p-value of less than 0.05 (χ2 (8, N=8568) = 196.016, p <.05.
Each pack size had a different impact on the relationship between pack size and
distance (Table 14). The 250-ml impacted this relationship for longer distances, mainly
6-8 km and 8-10 km, indicating the likelihood that this pack size will be distributed in
distances further than 2 km (Figure 4). This was in contrast to the 500 ml, which shows
its contribution towards low distance distribution (0-4 km) with standardised residual
values of 3.1 and 7.5, whereas the other distances had a standardised residual value
of less than ±1.96. The strength of the relationship was also weak with an φ value of
0.107 (Table 15).
Figure 4: Clustered bar chart for distance between spaza shops and Modern Retailer 1 with
pack size for Clover Fruit Nectar
© University of Pretoria

47
Table 9: Pack size * Distance Modern Retailer 1. * ProdVLThree Cross tabulation
ProdVLThree
Distance Modern Retailer 1.
Total 0 - 2km 2.01 - 4km
4.01 - 6km
6.01 - 8km
8.01 - 10 km
Clover Fruit Nectar
Pack size
250 ml
Count 0 28 412 1023 238 1701
% within Pack size 0.0% 1.6% 24.2% 60.1% 14.0% 100.0%
% within Distance Modern Retailer 1.
0.0% 13.9% 20.1% 22.3% 13.9% 19.9%
% of Total 0.0% .3% 4.8% 11.9% 2.8% 19.9%
500 ml
Count 10 91 803 1780 624 3308
% within Pack size .3% 2.8% 24.3% 53.8% 18.9% 100.0%
% within Distance Modern Retailer 1.
100.0% 45.3% 39.2% 38.7% 36.4% 38.6%
% of Total .1% 1.1% 9.4% 20.8% 7.3% 38.6%
2 lt Count 0 82 835 1791 851 3559
% within Pack size 0.0% 2.3% 23.5% 50.3% 23.9% 100.0%
% within Distance Modern Retailer 1.
0.0% 40.8% 40.7% 39.0% 49.7% 41.5%
% of Total 0.0% 1.0% 9.7% 20.9% 9.9% 41.5%
Total Count 10 201 2050 4594 1713 8568
% within Pack size .1% 2.3% 23.9% 53.6% 20.0% 100.0%
% within Distance Modern Retailer 1.
100.0% 100.0% 100.0% 100.0% 100.0% 100.0%
% of Total .1% 2.3% 23.9% 53.6% 20.0% 100.0%
5.4.1.3 Dairy Fruit Mix Danao Fresh
Figure 5 representing the contingency for Diary Fruit Mix Danao Fresh shows that there
were only two pack sizes that were distributed between November 2012 and June
2016 in the Masakhane spaza shops. At 0-2 km, the 330 ml shows a 73% distribution
as compared to 26.1% for 1 L. This trend changes at 6-8 and 8.01-10 km, where the 1
L shows higher distribution in comparison with the 330 ml. For 6.01-8km, the 1 L was
74.1% compared to the 330 ml at 25.9%; whereas at 8.01-10 km the 1 L distribution
was 81.9% as compared to 18.3% for the 330 ml (Table 10). The relationship, shown in
Table 14, between distance and pack size was significant, with a p-value of less than
0.05 (χ2 (4, N=856) = 79.903, p <.05. The strength of the relationship was weak with an
φ value of 0.306 Table 15). This was better than Clover Fresh Milk and Clover Fresh
Nectar, where the relationship was even weaker with even lower φ values.
© University of Pretoria
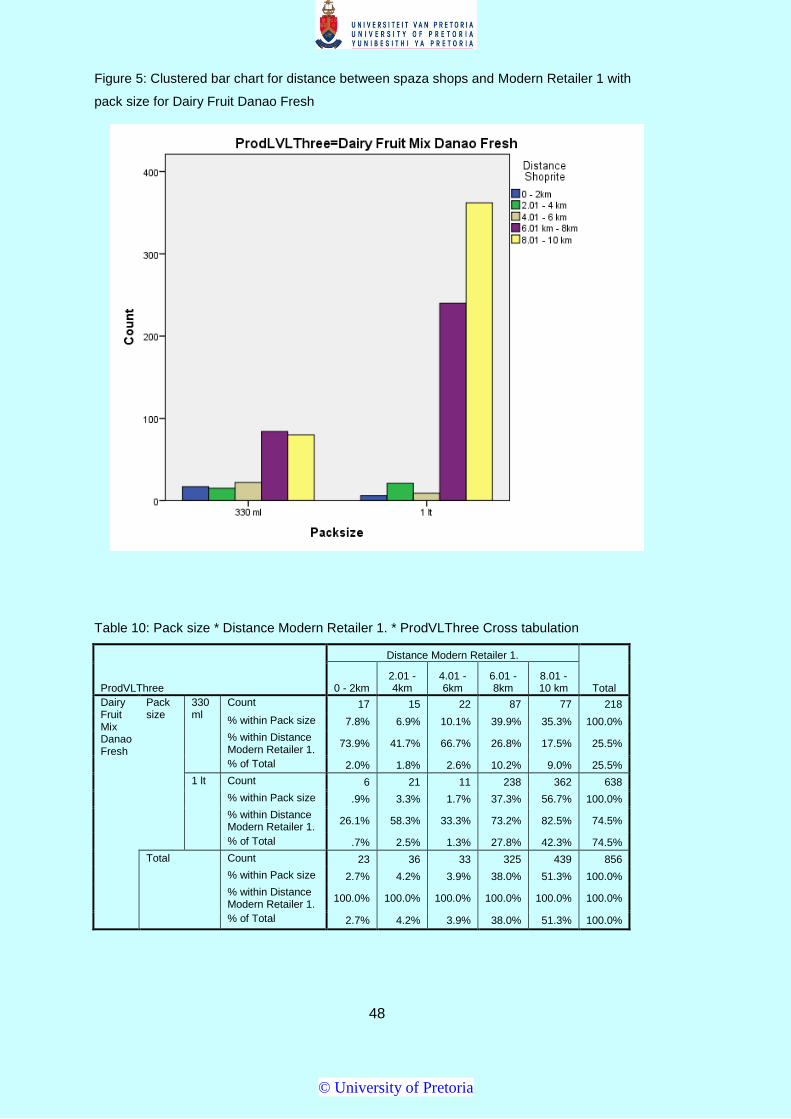
48
Figure 5: Clustered bar chart for distance between spaza shops and Modern Retailer 1 with
pack size for Dairy Fruit Danao Fresh
Table 10: Pack size * Distance Modern Retailer 1. * ProdVLThree Cross tabulation
ProdVLThree
Distance Modern Retailer 1.
Total 0 - 2km 2.01 - 4km
4.01 - 6km
6.01 - 8km
8.01 - 10 km
Dairy Fruit Mix Danao Fresh
Pack size
330 ml
Count 17 15 22 87 77 218
% within Pack size 7.8% 6.9% 10.1% 39.9% 35.3% 100.0%
% within Distance Modern Retailer 1.
73.9% 41.7% 66.7% 26.8% 17.5% 25.5%
% of Total 2.0% 1.8% 2.6% 10.2% 9.0% 25.5%
1 lt Count 6 21 11 238 362 638
% within Pack size .9% 3.3% 1.7% 37.3% 56.7% 100.0%
% within Distance Modern Retailer 1.
26.1% 58.3% 33.3% 73.2% 82.5% 74.5%
% of Total .7% 2.5% 1.3% 27.8% 42.3% 74.5%
Total Count 23 36 33 325 439 856
% within Pack size 2.7% 4.2% 3.9% 38.0% 51.3% 100.0%
% within Distance Modern Retailer 1.
100.0% 100.0% 100.0% 100.0% 100.0% 100.0%
% of Total 2.7% 4.2% 3.9% 38.0% 51.3% 100.0%
© University of Pretoria

49
5.4.1.4 Dairy Fruit Mix Tropika Fresh
Dairy Fruit Mix Tropika Fresh had five of the seven pack sizes distributed between
November 2012 and June 2016. The pack sizes distributed were 250 ml, 330 ml, 500
ml, 1.5 L and 2 L (Figure 6). The highest distribution was 500 ml with 45.5% of the total
distribution, followed by 2 L at 25.4% and 250 ml at 16.7%. The cross-tabulation in
Table 11 shows that for 0-2 km, 500 ml comprised 86.1% compared to 2 L at 8.1%,
with other pack sizes less than 5%. For 2.01-4 km, the 500-ml trend continued with
85.1% of the distribution as compared to 8.80% for the 330 ml. There was no
distribution of 250 ml in the distance radius of 0-4 km. For the farthest distance (8.01-
10 km), the 330 ml comprised 48.0% as compared to 43.2% for the 500 ml. As
represented by Table 14, the relationship between the distance and pack size was
significant, with a p-value of less than 0.05 (χ2 (16, N=40164) = 3465.163, p <.05. The
relationship strength was weak with an φ value of 0.114 (Table 15).
Figure 6: Clustered bar chart for distance between spaza shops and Modern Retailer 1 with
pack size for Dairy
© University of Pretoria

50
Table 11: Pack size * Distance Modern Retailer 1. * ProdVLThree Cross tabulation
ProdVLThree
Distance Modern Retailer 1.
Total 0 - 2km 2.01 - 4km
4.01 - 6km
6.01 - 8km
8.01 - 10 km
Dairy Fruit Mix Tropika Fresh
Pack size
250 ml
Count 0 112 1865 3140 1574 6691
% within Pack size 0.0% 1.7% 27.9% 46.9% 23.5% 100.0%
% within Distance Modern Retailer 1.
0.0% 5.7% 22.1% 20.0% 12.2% 16.7%
% of Total 0.0% .3% 4.6% 7.8% 3.9% 16.7%
330 ml
Count 23 139 551 1343 1576 3632
% within Pack size .6% 3.8% 15.2% 37.0% 43.4% 100.0%
% within Distance Modern Retailer 1.
1.9% 7.0% 6.5% 8.6% 12.3% 9.0%
% of Total .1% .3% 1.4% 3.3% 3.9% 9.0%
500 ml
Count 1026 1415 3726 6644 5457 18268
% within Pack size 5.6% 7.7% 20.4% 36.4% 29.9% 100.0%
% within Distance Modern Retailer 1.
86.1% 71.6% 44.2% 42.3% 42.5% 45.5%
% of Total 2.6% 3.5% 9.3% 16.5% 13.6% 45.5%
1.5 lt
Count 46 25 80 344 876 1371
% within Pack size 3.4% 1.8% 5.8% 25.1% 63.9% 100.0%
% within Distance Modern Retailer 1.
3.9% 1.3% .9% 2.2% 6.8% 3.4%
% of Total .1% .1% .2% .9% 2.2% 3.4%
2 lt Count 97 286 2211 4236 3372 10202
% within Pack size 1.0% 2.8% 21.7% 41.5% 33.1% 100.0%
% within Distance Modern Retailer 1.
8.1% 14.5% 26.2% 27.0% 26.2% 25.4%
% of Total .2% .7% 5.5% 10.5% 8.4% 25.4%
Total Count 1192 1977 8433 15707 12855 40164
% within Pack size 3.0% 4.9% 21.0% 39.1% 32.0% 100.0%
% within Distance Modern Retailer 1.
100.0% 100.0% 100.0% 100.0% 100.0% 100.0%
% of Total 3.0% 4.9% 21.0% 39.1% 32.0% 100.0%
5.4.1.5 Dairy Fruit Mix Tropika UHT
There were three product pack sizes distributed namely 200 ml, 250 ml and 1 L. The 1
L was the most widely distributed at 52.8%. The cross-tabulation in Figure 7 shows that
1 L was distributed at 68.8% as compared to 30.7% for the 200-ml at the shortest
distance (0-2km). Although not excessively so, this trend changed at the furthest
distance with 200ml at 51.7% as compared to 1 L at 45.3%. The relationship shown in
Table 14, between the distance and pack size was significant, (χ2 (8, N=3041) =
308.329, p <.05, with a weak strength (φ = 0.225) according to Table 15.
© University of Pretoria

51
Figure 7: Clustered bar chart for distance between spaza shops and Modern Retailer 1 with
pack size for Dairy Fruit Mix Tropika UHT
Table 12: Pack size * Distance Modern Retailer 1. * ProdVLThree Cross tabulation
ProdVLThree
Distance Modern Retailer 1.
Total 0 - 2km 2.01 - 4km
4.01 - 6km
6.01 - 8km
8.01 - 10 km
Dairy Fruit Mix Tropika UHT
Pack size
200 ml
Count 130 115 128 171 778 1322
% within Pack size 9.8% 8.7% 9.7% 12.9% 58.9% 100.0%
% within Distance Modern Retailer 1.
30.7% 27.4% 45.4% 37.3% 53.4% 43.5%
% of Total 4.3% 3.8% 4.2% 5.6% 25.6% 43.5%
250 ml
Count 2 67 9 28 6 112
% within Pack size 1.8% 59.8% 8.0% 25.0% 5.4% 100.0%
% within Distance Modern Retailer 1.
.5% 16.0% 3.2% 6.1% .4% 3.7%
% of Total .1% 2.2% .3% .9% .2% 3.7%
1 lt Count 291 238 145 259 674 1607
% within Pack size 18.1% 14.8% 9.0% 16.1% 41.9% 100.0%
% within Distance Modern Retailer 1.
68.8% 56.7% 51.4% 56.6% 46.2% 52.8%
% of Total 9.6% 7.8% 4.8% 8.5% 22.2% 52.8%
Total Count 423 420 282 458 1458 3041
% within Pack size 13.9% 13.8% 9.3% 15.1% 47.9% 100.0%
% within Distance Modern Retailer 1.
100.0% 100.0% 100.0% 100.0% 100.0% 100.0%
% of Total 13.9% 13.8% 9.3% 15.1% 47.9% 100.0%
© University of Pretoria

52
5.4.1.6 Krush 100% Fruit Juice Blend
Overall, the 500 ml constituted 75.7% of the total distribution, with the 1.5 L at 18.4%.
The 500 ml was most dominant across all distances.
Figure 8: Clustered bar chart for distance between spaza shops and Modern Retailer 1 with
pack size for Krush 100% Fruit Juice Blend
The short distance radius of 0-2 km showed 88.5% compared to 1.5 L at 10.7%. Even
for the longest distance (8.01-10 km) the 500-ml was 55.9% compared to the 1.5 L at
18.4%. The relationship between the distance and pack size was significant (Table 14),
with a p-value of less than 0.05 (χ2 (12, N=6326) = 248.258, p <.05. The strength of the
relationship was also low with an φ value of 0.147 (Table 15)
© University of Pretoria

53
Table 13: Pack size * Distance Modern Retailer 1. * ProdVLThree Cross tabulation
ProdVLThree
Distance Modern Retailer 1.
Total 0 - 2km 2.01 - 4km
4.01 - 6km
6.01 - 8km
8.01 - 10 km
Krush 100% Fruit Juice Blend
Pack size
330 ml
Count 0 0 0 0 2 2
% within Pack size 0.0% 0.0% 0.0% 0.0% 100.0% 100.0%
% within Distance Modern Retailer 1.
0.0% 0.0% 0.0% 0.0% .1% .0%
% of Total 0.0% 0.0% 0.0% 0.0% .0% .0%
500 ml
Count 207 202 772 1266 2339 4786
% within Pack size 4.3% 4.2% 16.1% 26.5% 48.9% 100.0%
% within Distance Modern Retailer 1.
88.5% 84.9% 92.5% 81.6% 67.4% 75.7%
% of Total 3.3% 3.2% 12.2% 20.0% 37.0% 75.7%
1.5 lt
Count 25 36 63 285 1121 1530
% within Pack size 1.6% 2.4% 4.1% 18.6% 73.3% 100.0%
% within Distance Modern Retailer 1.
10.7% 15.1% 7.5% 18.4% 32.3% 24.2%
% of Total .4% .6% 1.0% 4.5% 17.7% 24.2%
2 lt Count 2 0 0 0 6 8
% within Pack size 25.0% 0.0% 0.0% 0.0% 75.0% 100.0%
% within Distance Modern Retailer 1.
.9% 0.0% 0.0% 0.0% .2% .1%
% of Total .0% 0.0% 0.0% 0.0% .1% .1%
Total Count 234 238 835 1551 3468 6326
% within Pack size 3.7% 3.8% 13.2% 24.5% 54.8% 100.0%
% within Distance Modern Retailer 1.
100.0% 100.0% 100.0% 100.0% 100.0% 100.0%
% of Total 3.7% 3.8% 13.2% 24.5% 54.8% 100.0%
© University of Pretoria

54
Table 14: Chi square analysis test of the product brands on distance with pack size
Value df
Asymptotic
Significance (2-
sided)
Pearson Chi-Square 1554.837 16 .000
Likelihood Ratio 1541.449 16 .000
Linear-by-Linear
Association60.030 1 .000
N of Valid Cases 29199
Pearson Chi-Square 196.016 8 .000
Likelihood Ratio 218.475 8 .000
Linear-by-Linear
Association31.858 1 .000
N of Valid Cases 8568
Pearson Chi-Square 79.903 4 .000
Likelihood Ratio 69.871 4 .000
Linear-by-Linear
Association59.970 1 .000
N of Valid Cases 856
Pearson Chi-Square 3465.163 16 .000
Likelihood Ratio 3916.106 16 .000
Linear-by-Linear
Association133.553 1 .000
N of Valid Cases 40164
Pearson Chi-Square 308.329 8 .000
Likelihood Ratio 251.617 8 .000
Linear-by-Linear
Association69.282 1 .000
N of Valid Cases 3041
Pearson Chi-Square 248.258 12 .000
Krush
100% Fruit
Juice
Blend
Likelihood Ratio 277.379 12 .000
Linear-by-Linear
Association180.742 1 .000
N of Valid Cases 6326
Pearson Chi-Square 6406.215 24 .000
Likelihood Ratio 6663.871 24 .000
Linear-by-Linear
Association234.316 1 .000
N of Valid Cases 88154
Total
ProdLVLThree
Clover
Fresh Milk
Clover
Fruit
Nectar
Dairy Fruit
Mix Danao
Fresh
Dairy Fruit
Mix
Tropika
Fresh
Dairy Fruit
Mix
Tropika
UHT
© University of Pretoria

55
Table 15: Strength of the relationship between pack size and distance between Spaza shops and Modern Retailer 1
ProdVLThree Value Approximate Significance
Clover Fresh Milk Nominal by Nominal Phi .231 .000
Cramer's V .115 .000
N of Valid Cases 29199
Clover Fruit Nectar Nominal by Nominal Phi .151 .000
Cramer's V .107 .000
N of Valid Cases 8568
Dairy Fruit Mix Danao Fresh Nominal by Nominal Phi .306 .000
Cramer's V .306 .000
N of Valid Cases 856
Dairy Fruit Mix Tropika Fresh Nominal by Nominal Phi .294 .000
Cramer's V .147 .000
N of Valid Cases 40164
Dairy Fruit Mix Tropika UHT Nominal by Nominal Phi .318 .000
Cramer's V .225 .000
N of Valid Cases 3041
Krush 100% Fruit Juice
Blend
Nominal by Nominal Phi .198 .000
Cramer's V .114 .000
N of Valid Cases 6326
Total Nominal by Nominal Phi .270 .000
Cramer's V .135 .000
N of Valid Cases 88154
5.4.1.7 Pack size summary
In summary, in looking at all pack sizes across all brands in Table 16, 500ml was the
most distributed pack size over the 10km, constituting 36.2% of the total distribution,
followed by the 2L with 20.8%. Within the various distances, at 0 – 2km, 500ml was
well distributed (61.4%) with 1Lt only 17.9% distributed. The high frequency of 500ml
continued with 50.2% at 2.01 – 4km. As the 500ml distribution decreased over
distance, 250ml increased from 1.1% (0-4km) to 22.4% (4.01- 6km) and remain at 20%
in 6.01 -8km. The increase in distribution along with distance is also encountered with
2lt. The results show that 500ml, 200ml and 2lt distribution are influenced most by the
distance.
© University of Pretoria
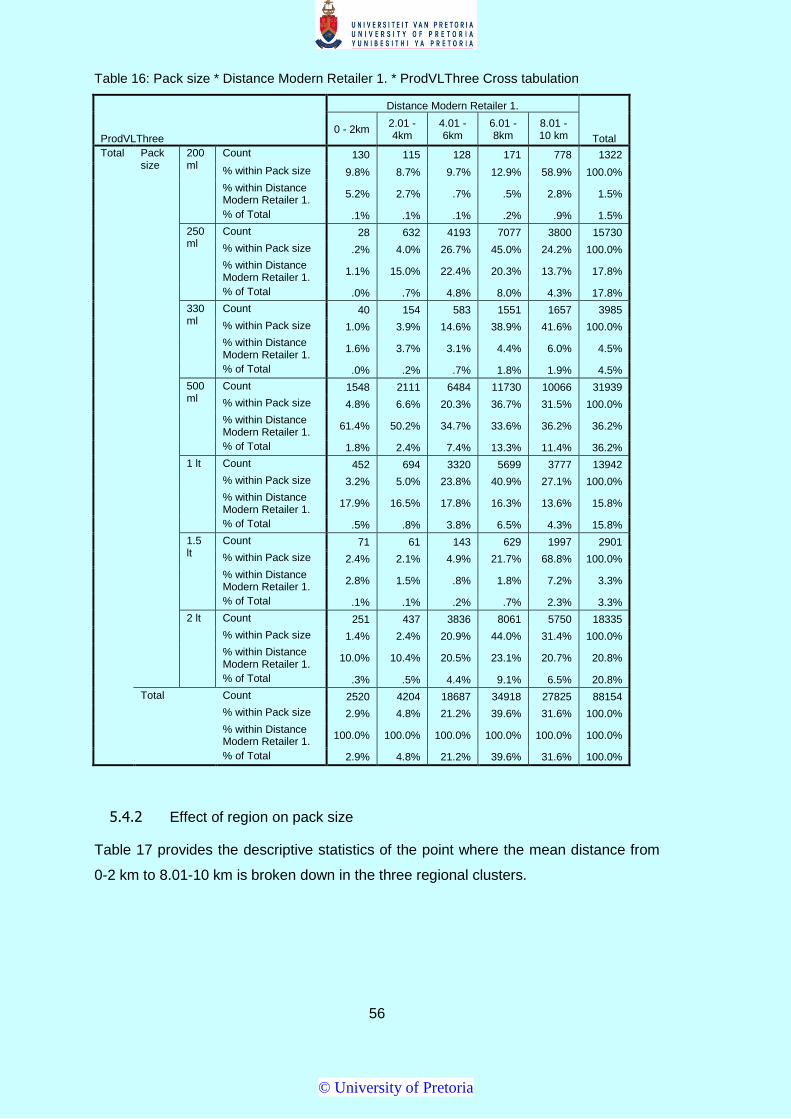
56
Table 16: Pack size * Distance Modern Retailer 1. * ProdVLThree Cross tabulation
ProdVLThree
Distance Modern Retailer 1.
Total 0 - 2km
2.01 - 4km
4.01 - 6km
6.01 - 8km
8.01 - 10 km
Total Pack size
200 ml
Count 130 115 128 171 778 1322
% within Pack size 9.8% 8.7% 9.7% 12.9% 58.9% 100.0%
% within Distance Modern Retailer 1.
5.2% 2.7% .7% .5% 2.8% 1.5%
% of Total .1% .1% .1% .2% .9% 1.5%
250 ml
Count 28 632 4193 7077 3800 15730
% within Pack size .2% 4.0% 26.7% 45.0% 24.2% 100.0%
% within Distance Modern Retailer 1.
1.1% 15.0% 22.4% 20.3% 13.7% 17.8%
% of Total .0% .7% 4.8% 8.0% 4.3% 17.8%
330 ml
Count 40 154 583 1551 1657 3985
% within Pack size 1.0% 3.9% 14.6% 38.9% 41.6% 100.0%
% within Distance Modern Retailer 1.
1.6% 3.7% 3.1% 4.4% 6.0% 4.5%
% of Total .0% .2% .7% 1.8% 1.9% 4.5%
500 ml
Count 1548 2111 6484 11730 10066 31939
% within Pack size 4.8% 6.6% 20.3% 36.7% 31.5% 100.0%
% within Distance Modern Retailer 1.
61.4% 50.2% 34.7% 33.6% 36.2% 36.2%
% of Total 1.8% 2.4% 7.4% 13.3% 11.4% 36.2%
1 lt Count 452 694 3320 5699 3777 13942
% within Pack size 3.2% 5.0% 23.8% 40.9% 27.1% 100.0%
% within Distance Modern Retailer 1.
17.9% 16.5% 17.8% 16.3% 13.6% 15.8%
% of Total .5% .8% 3.8% 6.5% 4.3% 15.8%
1.5 lt
Count 71 61 143 629 1997 2901
% within Pack size 2.4% 2.1% 4.9% 21.7% 68.8% 100.0%
% within Distance Modern Retailer 1.
2.8% 1.5% .8% 1.8% 7.2% 3.3%
% of Total .1% .1% .2% .7% 2.3% 3.3%
2 lt Count 251 437 3836 8061 5750 18335
% within Pack size 1.4% 2.4% 20.9% 44.0% 31.4% 100.0%
% within Distance Modern Retailer 1.
10.0% 10.4% 20.5% 23.1% 20.7% 20.8%
% of Total .3% .5% 4.4% 9.1% 6.5% 20.8%
Total Count 2520 4204 18687 34918 27825 88154
% within Pack size 2.9% 4.8% 21.2% 39.6% 31.6% 100.0%
% within Distance Modern Retailer 1.
100.0% 100.0% 100.0% 100.0% 100.0% 100.0%
% of Total 2.9% 4.8% 21.2% 39.6% 31.6% 100.0%
5.4.2 Effect of region on pack size
Table 17 provides the descriptive statistics of the point where the mean distance from
0-2 km to 8.01-10 km is broken down in the three regional clusters.
© University of Pretoria

57
Table 17: Descriptive statistics indicating the distance and pack size in the three regions
Dependent Variable: Pack size
Distance Modern Retailer 1 Region Mean
Standard deviation N
0 - 2 km Polokwane 4.34 1.264 2520
Total 4.34 1.264 2520
2.01 - 4 km Gauteng 3.78 1.116 1720
KZN 4.66 1.946 954
Polokwane 4.07 1.234 1530
Total 4.09 1.427 4204
4.01 - 6 km Gauteng 4.10 1.167 3845
KZN 4.34 1.881 11998
Polokwane 4.48 1.596 2844
Total 4.31 1.718 18687
6.01 - 8 km Gauteng 4.29 1.459 5651
KZN 4.50 1.851 23934
Polokwane 4.26 1.460 5333
Total 4.43 1.741 34918
8.01 - 10 km Gauteng 4.39 1.546 10899
KZN 4.56 1.934 11009
Polokwane 4.51 1.512 5917
Total 4.48 1.705 27825
Total Gauteng 4.27 1.445 22115
KZN 4.47 1.882 47895
Polokwane 4.37 1.463 18144
Total 4.40 1.701 88154
In Figure 9, the plot of the mean pack size score for each combination of the groups indicating the distance from Modern Retailer 1 and Spaza and the product brand is
© University of Pretoria

58
measured. In Gauteng the mean pack size increases with the increase in distance, where this effect seems minimal for Kwazulu Natal and Polokwane.
Figure 9: Estimate marginal means for pack size
Table 18 presents the actual results of the three-way ANOVA to indicate whether any
of the three independent variables and their interaction is statistically significant.
© University of Pretoria

59
Table 18: Test of between-subjects effect
Source Type III Sum of Squares
df Mean Square
F Sig. Partial Eta
Squared
Noncent. Parameter
Observed Power
b
Corrected
Model 12512.457
a 70 178,749 64,877 0,00 ,049 4541,408 1,000
Intercept 19617,221 1 19617,221 7120,088 0,00 ,075 7120,088 1,000
Distance 17,616 4 4,404 1,598 ,172 ,000 6,394 ,498
Region 20,810 2 10,405 3,777 ,023 ,000 7,553 ,691
ProdVLThree 1764,349 5 352,870 128,074 ,000 ,007 640,372 1,000
Distance
Region 357,172 6 59,529 21,606 ,000 ,001 129,636 1,000
Distance
ProdVLThree 686,769 20 34,338 12,463 ,000 ,003 249,263 1,000
Region
ProdVLThree 1042,612 10 104,261 37,842 ,000 ,004 378,417 1,000
Distance
Region
ProdVLThree
1038,344 23 45,145 16,386 ,000 ,004 376,868 1,000
Error 242685,717 88083 2,755
Total 1962532,000 88154
Corrected
Total 255198,174 88153
a. R Squared = .049 (Adjusted R Squared = .048) b. Computed using alpha = ,05
© University of Pretoria

60
The region is statistically significant regarding pack size, with a p-value of less than .05.
More importantly, there was statistically significant interaction between the effects of the
region and product brand, F (10, 2.755) = 37.842, p <.5. In addition, testing the effect of
distance, region and product brand, their effect was found to be significant, F (23, 2.755) =
16.386, p <.05.
5.5 Influence of distance on product sales in emerging market
Research Question 1 observed the influence of distance on pack size distribution or
availability. The section below discusses the findings related to unit pack sales and
how this is impacted by distance between spaza stores and modern retailer.
Research Question 2: Are the sales of a product pack size assortment in emerging market
spaza shops influenced by the distance between them and modern-day retailer?
5.5.1 Relationship of distance between Modern Retailer 1 and spaza and sales volume
The Pearson’s Chi-square test was used to analyse a possible relationship between the
distance between the retail store and spaza shops (Masakhane outlet base) and the sales of
the product distributed to these spaza stores. The effect on each of the ProdVLThree namely
Clover Fresh Milk, Clover Fruit Nectar, Dairy Fruit Mix Danao Fresh, Dairy Fruit Mix Tropika
Fresh, Dairy Fruit Mix Tropika UHT and Krush 100% Fruit Juice Blend was tested. To test
this relationship, a hypothesis was developed.
H02: Sales of a product assortment in the emerging market spaza shops is not
influenced by the distance between the emerging market spaza shop and modern-
day retailer.
HA2: Sales of a product assortment in the emerging market spaza shops is influenced
by the distance between the emerging market spaza shop and modern-day retailer.
© University of Pretoria

61
5.5.1.1 Clover Fresh Milk
The Clover Fresh Milk was sold most frequently in sales of 0-5 units per transaction, which
comprised a contribution of 30.1% followed by sales per transaction of greater than 25 items
or units per transaction comprising 21.6% (Table 19). Figure 10 shows that at the shortest
distance, 0-5 units were sold as compared to 27.6% for 6-10 items. For the longer distance
of 8.01-10 km, the highest order was 24.8% as compared to 25.7% for 0-5 items and 22.5%
for 6-10 items. The distribution of the sales volume with count is provided in Figure 10.
Figure 10: Clustered bar chart for distance between spaza shops and Modern Retailer 1 with sales
volume for Clover Fresh Milk
A Chi-square test was conducted to determine the significance of the association (Table 25).
The results as presented were significant: χ2 (20, N=29199) = 1379.079, p <.05. The
strength of the relationship was evaluated using Cramer V (φ) and was found to be weak
with an φ value of 0.109 (Table 26).
© University of Pretoria

62
Table 19: Sales volume * Distance Modern Retailer 1. * ProdVLThree Cross tabulation
ProdVLThree
Distance Modern Retailer 1.
Total 0 -
2km 2.01 - 4km
4.01 - 6km
6.01 - 8km
8.01 - 10 km
Clover Fresh Milk
Sales volume
0-5 Count 285 671 2149 3698 1992 8795
% within Sales volume
3.2% 7.6% 24.4% 42.0% 22.6% 100.0%
% within Distance Modern Retailer 1. 44.7% 50.4% 30.5% 30.1% 25.2% 30.1%
% of Total 1.0% 2.3% 7.4% 12.7% 6.8% 30.1%
6-10 Count 176 263 1316 2293 1765 5813
% within Sales volume
3.0% 4.5% 22.6% 39.4% 30.4% 100.0%
% within Distance Modern Retailer 1. 27.6% 19.7% 18.7% 18.7% 22.4% 19.9%
% of Total .6% .9% 4.5% 7.9% 6.0% 19.9%
11-15 Count 6 24 336 729 590 1685
% within Sales volume
.4% 1.4% 19.9% 43.3% 35.0% 100.0%
% within Distance Modern Retailer 1. .9% 1.8% 4.8% 5.9% 7.5% 5.8%
% of Total .0% .1% 1.2% 2.5% 2.0% 5.8%
16-20 Count 15 214 1289 2007 948 4473
% within Sales volume
.3% 4.8% 28.8% 44.9% 21.2% 100.0%
% within Distance Modern Retailer 1. 2.4% 16.1% 18.3% 16.3% 12.0% 15.3%
% of Total .1% .7% 4.4% 6.9% 3.2% 15.3%
21-25 Count 114 69 423 902 630 2138
% within Sales volume
5.3% 3.2% 19.8% 42.2% 29.5% 100.0%
% within Distance Modern Retailer 1. 17.9% 5.2% 6.0% 7.3% 8.0% 7.3%
% of Total .4% .2% 1.4% 3.1% 2.2% 7.3%
Higher than 25
Count 42 91 1541 2654 1967 6295
% within Sales volume
.7% 1.4% 24.5% 42.2% 31.2% 100.0%
% within Distance Modern Retailer 1. 6.6% 6.8% 21.8% 21.6% 24.9% 21.6%
% of Total .1% .3% 5.3% 9.1% 6.7% 21.6%
Total Count 638 1332 7054 12283 7892 29199
% within Sales volume
2.2% 4.6% 24.2% 42.1% 27.0% 100.0%
% within Distance Modern Retailer 1.
100.0%
100.0%
100.0%
100.0%
100.0%
100.0%
% of Total 2.2% 4.6% 24.2% 42.1% 27.0% 100.0%
© University of Pretoria

63
5.5.1.2 Clover Fruit Nectar
This is a product ordered mainly between 0-10 items, with 65.4% for 0-5 items and 20.3% for
6-10 items (Figure 11). The contingency Table 20 shows that at a 0-2 km radius the 0-5%
items were 80% of sales as compared to 20% for 6-10km. This same trend continued with
2.01-4 km with 84.2% for 0-5 items as compared to 15.8% for 6-10 items. None of the pack
sizes were sold within the first 4 km. There was a significant relationship with a p-value of
less than 0.05 (χ2 (20, N=8568) = 141.287, p <.05 (Table 25). The strength of the
relationship was virtually non-existent with an φ value of 0.064 (Table 26).
Figure 11: Clustered bar chart for distance between Spaza shops and Modern Retailer 1 with sale
volume for Clover Fruit Nectar
© University of Pretoria
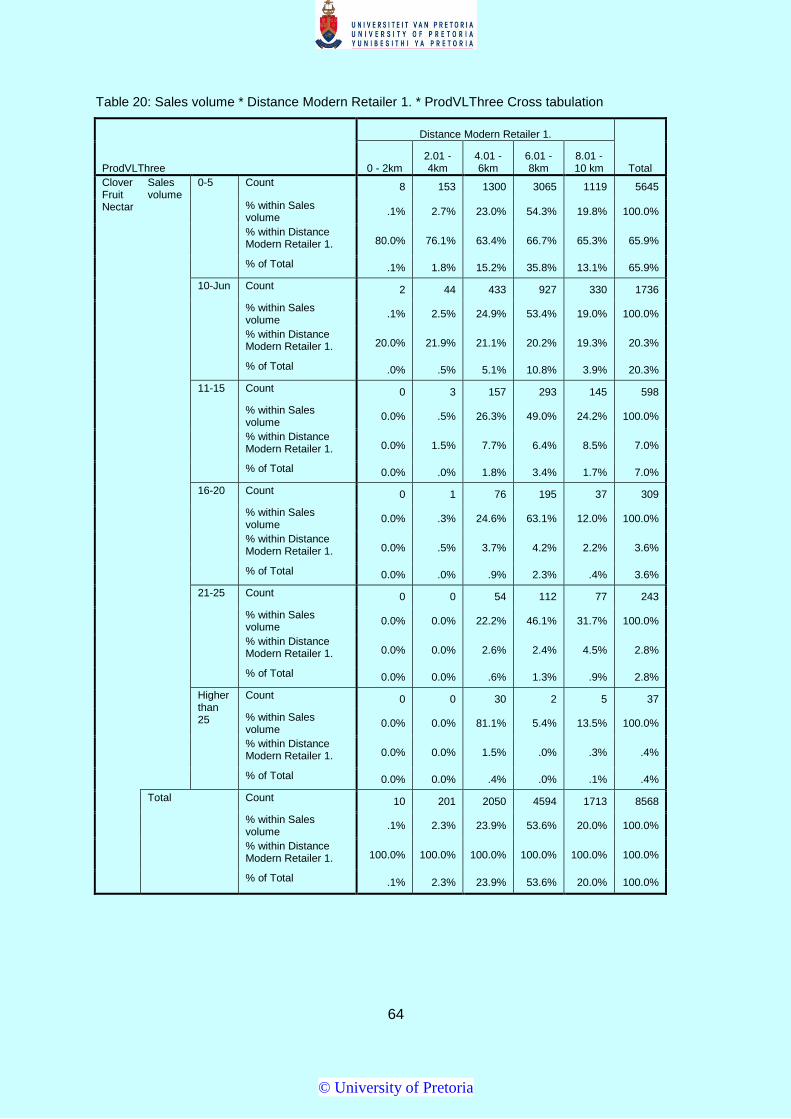
64
Table 20: Sales volume * Distance Modern Retailer 1. * ProdVLThree Cross tabulation
ProdVLThree
Distance Modern Retailer 1.
Total 0 - 2km 2.01 - 4km
4.01 - 6km
6.01 - 8km
8.01 - 10 km
Clover Fruit Nectar
Sales volume
0-5 Count 8 153 1300 3065 1119 5645
% within Sales volume
.1% 2.7% 23.0% 54.3% 19.8% 100.0%
% within Distance Modern Retailer 1. 80.0% 76.1% 63.4% 66.7% 65.3% 65.9%
% of Total .1% 1.8% 15.2% 35.8% 13.1% 65.9%
10-Jun Count 2 44 433 927 330 1736
% within Sales volume
.1% 2.5% 24.9% 53.4% 19.0% 100.0%
% within Distance Modern Retailer 1. 20.0% 21.9% 21.1% 20.2% 19.3% 20.3%
% of Total .0% .5% 5.1% 10.8% 3.9% 20.3%
11-15 Count 0 3 157 293 145 598
% within Sales volume
0.0% .5% 26.3% 49.0% 24.2% 100.0%
% within Distance Modern Retailer 1. 0.0% 1.5% 7.7% 6.4% 8.5% 7.0%
% of Total 0.0% .0% 1.8% 3.4% 1.7% 7.0%
16-20 Count 0 1 76 195 37 309
% within Sales volume
0.0% .3% 24.6% 63.1% 12.0% 100.0%
% within Distance Modern Retailer 1. 0.0% .5% 3.7% 4.2% 2.2% 3.6%
% of Total 0.0% .0% .9% 2.3% .4% 3.6%
21-25 Count 0 0 54 112 77 243
% within Sales volume
0.0% 0.0% 22.2% 46.1% 31.7% 100.0%
% within Distance Modern Retailer 1. 0.0% 0.0% 2.6% 2.4% 4.5% 2.8%
% of Total 0.0% 0.0% .6% 1.3% .9% 2.8%
Higher than 25
Count 0 0 30 2 5 37
% within Sales volume
0.0% 0.0% 81.1% 5.4% 13.5% 100.0%
% within Distance Modern Retailer 1. 0.0% 0.0% 1.5% .0% .3% .4%
% of Total 0.0% 0.0% .4% .0% .1% .4%
Total Count 10 201 2050 4594 1713 8568
% within Sales volume
.1% 2.3% 23.9% 53.6% 20.0% 100.0%
% within Distance Modern Retailer 1. 100.0% 100.0% 100.0% 100.0% 100.0% 100.0%
% of Total .1% 2.3% 23.9% 53.6% 20.0% 100.0%
© University of Pretoria

65
5.5.1.3 Dairy Fruit Mix Danao Fresh
The contingency tables for Danao Fresh show that there were only two pack sizes that were
distributed between November 2012 and June 2016 in the spaza shops.
Figure 12: Clustered bar chart for distance between Spaza shops and Modern Retailer 1 with sale
volume for Dairy Fruit Mix Danao Fresh
About 81.8% of the orders were between 0-10 items. The relationship between the distance
and sales volume was significant (Table 25), with a p-value of less than 0.05 (χ2 (12, N=856)
= 323.718, p <.05. The strength of the relationship was weak with an φ value of 0.355 (Table
26).
© University of Pretoria

66
Table 21: Sales volume * Distance Modern Retailer 1. * ProdVLThree Cross tabulation
ProdVLThree
Distance Modern Retailer 1.
Total 0 - 2km 2.01 - 4km
4.01 - 6km
6.01 - 8km
8.01 - 10 km
Dairy Fruit Mix Danao Fresh
Sales volume
0-5 Count 22 33 22 86 78 241
% within Sales volume
9.1% 13.7% 9.1% 35.7% 32.4% 100.0%
% within Distance Modern Retailer 1. 95.7% 91.7% 66.7% 26.5% 17.8% 28.2%
% of Total 2.6% 3.9% 2.6% 10.0% 9.1% 28.2%
6-10 Count 1 3 6 120 329 459
% within Sales volume
.2% .7% 1.3% 26.1% 71.7% 100.0%
% within Distance Modern Retailer 1. 4.3% 8.3% 18.2% 36.9% 74.9% 53.6%
% of Total .1% .4% .7% 14.0% 38.4% 53.6%
11-15 Count 0 0 5 81 32 118
% within Sales volume
0.0% 0.0% 4.2% 68.6% 27.1% 100.0%
% within Distance Modern Retailer 1. 0.0% 0.0% 15.2% 24.9% 7.3% 13.8%
% of Total 0.0% 0.0% .6% 9.5% 3.7% 13.8%
16-20 Count 0 0 0 38 0 38
% within Sales volume
0.0% 0.0% 0.0% 100.0% 0.0% 100.0%
% within Distance Modern Retailer 1. 0.0% 0.0% 0.0% 11.7% 0.0% 4.4%
% of Total 0.0% 0.0% 0.0% 4.4% 0.0% 4.4%
Total Count 23 36 33 325 439 856
% within Sales volume
2.7% 4.2% 3.9% 38.0% 51.3% 100.0%
% within Distance Modern Retailer 1. 100.0% 100.0% 100.0% 100.0% 100.0% 100.0%
% of Total 2.7% 4.2% 3.9% 38.0% 51.3% 100.0%
© University of Pretoria

67
5.5.1.4 Dairy Fruit Mix Tropika Fresh
Most of the products sold were between 0-5 items in order size (Figure 13). The relationship
between the distance and pack size was significant (Table 25), with a p-value of less than
0.05 (χ2 (20, N=40164) = 1427.202, p <.05. The strength of the relationship was also low
with an φ value of 0.094 (Table 26).
Figure 13: Clustered bar chart for distance between spaza shops and Modern Retailer 1 with sale
volume for Fruit Mix Tropika Fresh
© University of Pretoria

68
Table 22: Sales volume * Distance Modern Retailer 1. * ProdVLThree Cross tabulation
ProdVLThree
Distance Modern Retailer 1.
Total 0 - 2km 2.01 - 4km
4.01 - 6km
6.01 - 8km
8.01 - 10 km
Dairy Fruit Mix Tropika Fresh
Sales volume
0-5 Count 1001 1717 6298 11989 8190 29195
% within Sales volume
3.4% 5.9% 21.6% 41.1% 28.1% 100.0%
% within Distance Modern Retailer 1.
84.0% 86.8% 74.7% 76.3% 63.7% 72.7%
% of Total 2.5% 4.3% 15.7% 29.9% 20.4% 72.7%
6-10 Count 81 180 984 2114 2144 5503
% within Sales volume
1.5% 3.3% 17.9% 38.4% 39.0% 100.0%
% within Distance Modern Retailer 1.
6.8% 9.1% 11.7% 13.5% 16.7% 13.7%
% of Total .2% .4% 2.4% 5.3% 5.3% 13.7%
11-15 Count 5 5 312 500 512 1334
% within Sales volume
.4% .4% 23.4% 37.5% 38.4% 100.0%
% within Distance Modern Retailer 1.
.4% .3% 3.7% 3.2% 4.0% 3.3%
% of Total .0% .0% .8% 1.2% 1.3% 3.3%
16-20 Count 1 6 168 261 433 869
% within Sales volume
.1% .7% 19.3% 30.0% 49.8% 100.0%
% within Distance Modern Retailer 1.
.1% .3% 2.0% 1.7% 3.4% 2.2%
% of Total .0% .0% .4% .6% 1.1% 2.2%
21-25 Count 100 69 523 772 1529 2993
% within Sales volume
3.3% 2.3% 17.5% 25.8% 51.1% 100.0%
% within Distance Modern Retailer 1.
8.4% 3.5% 6.2% 4.9% 11.9% 7.5%
% of Total .2% .2% 1.3% 1.9% 3.8% 7.5%
Higher than 25
Count 4 0 148 71 47 270
% within Sales volume
1.5% 0.0% 54.8% 26.3% 17.4% 100.0%
% within Distance Modern Retailer 1.
.3% 0.0% 1.8% .5% .4% .7%
% of Total .0% 0.0% .4% .2% .1% .7%
Total Count 1192 1977 8433 15707 12855 40164
% within Sales volume
3.0% 4.9% 21.0% 39.1% 32.0% 100.0%
% within Distance Modern Retailer 1.
100.0% 100.0% 100.0% 100.0% 100.0% 100.0%
% of Total 3.0% 4.9% 21.0% 39.1% 32.0% 100.0%
© University of Pretoria

69
5.5.1.5 Dairy Fruit Mix Tropika UHT
Again, the largest amount of product sold was between 6-10 items per order (Figure 14).
The relationship between the distance and sales volume (Table 25) was significant, (χ2 (20,
N=3041) = 237.273, p <.05, with a weak strength (φ = 0.140) as seen in Table 26.
Figure 14: Clustered bar chart for distance between spaza shops and Modern Retailer 1 with sale
volume for Dairy Fruit Mix
© University of Pretoria

70
Table 23: Sales volume * Distance Modern Retailer 1. * ProdVLThree Cross tabulation
ProdVLThree
Distance Modern Retailer 1.
Total 0 - 2km
2.01 - 4km
4.01 - 6km
6.01 - 8km
8.01 - 10 km
Dairy Fruit Mix Tropika UHT
Sales volume
0-5 Count 107 89 111 162 686 1155
% within Sales volume
9.3% 7.7% 9.6% 14.0% 59.4% 100.0%
% within Distance Modern Retailer 1.
25.3% 21.2% 39.4% 35.4% 47.1% 38.0%
% of Total 3.5% 2.9% 3.7% 5.3% 22.6% 38.0%
6-10 Count 260 313 166 292 726 1757
% within Sales volume
14.8% 17.8% 9.4% 16.6% 41.3% 100.0%
% within Distance Modern Retailer 1.
61.5% 74.5% 58.9% 63.8% 49.8% 57.8%
% of Total 8.5% 10.3% 5.5% 9.6% 23.9% 57.8%
11-15 Count 52 10 5 4 41 112
% within Sales volume
46.4% 8.9% 4.5% 3.6% 36.6% 100.0%
% within Distance Modern Retailer 1.
12.3% 2.4% 1.8% .9% 2.8% 3.7%
% of Total 1.7% .3% .2% .1% 1.3% 3.7%
16-20 Count 3 8 0 0 4 15
% within Sales volume
20.0% 53.3% 0.0% 0.0% 26.7% 100.0%
% within Distance Modern Retailer 1.
.7% 1.9% 0.0% 0.0% .3% .5%
% of Total .1% .3% 0.0% 0.0% .1% .5%
21-25 Count 0 0 0 0 1 1
% within Sales volume
0.0% 0.0% 0.0% 0.0% 100.0% 100.0%
% within Distance Modern Retailer 1.
0.0% 0.0% 0.0% 0.0% .1% .0%
% of Total 0.0% 0.0% 0.0% 0.0% .0% .0%
Higher than 25
Count 1 0 0 0 0 1
% within Sales volume
100.0% 0.0% 0.0% 0.0% 0.0% 100.0%
% within Distance Modern Retailer 1.
.2% 0.0% 0.0% 0.0% 0.0% .0%
% of Total .0% 0.0% 0.0% 0.0% 0.0% .0%
Total Count 423 420 282 458 1458 3041
% within Sales volume
13.9% 13.8% 9.3% 15.1% 47.9% 100.0%
% within Distance Modern Retailer 1.
100.0% 100.0% 100.0% 100.0% 100.0% 100.0%
% of Total 13.9% 13.8% 9.3% 15.1% 47.9% 100.0%
© University of Pretoria

71
5.5.1.6 Krush 100% Fruit Juice Blend
Overall, orders of 0-10 items constituted 75.3% of the total distribution, at 56.1% for 0-5
items and 19.2% for 6-10 items (Figure15).
Figure 15: Clustered bar chart for distance between spaza shops and Modern Retailer 1 with sale
volume for Krush 100% Juice Blend
The relationship between the distance and sales volume was significant (Table 25), with a p-
value of less than 0.05 (χ2 (20, N=6326) = 577.783, p <.05. The strength of the relationship
was weak with an φ value of 0.151 (Table 26).
© University of Pretoria

72
Table 24: Sales volume * Distance Modern Retailer 1. * ProdVLThree Cross tabulation
ProdVLThree
Distance Modern Retailer 1.
Total 0 - 2km 2.01 - 4km
4.01 - 6km
6.01 - 8km
8.01 - 10 km
Krush 100% Fruit Juice Blend
Sales volume
0-5 Count 202 180 730 1360 1936 4408
% within Sales volume
4.6% 4.1% 16.6% 30.9% 43.9% 100.0%
% within Distance Modern Retailer 1.
86.3% 75.6% 87.4% 87.7% 55.8% 69.7%
% of Total 3.2% 2.8% 11.5% 21.5% 30.6% 69.7%
6-10 Count 26 57 102 179 1330 1694
% within Sales volume
1.5% 3.4% 6.0% 10.6% 78.5% 100.0%
% within Distance Modern Retailer 1.
11.1% 23.9% 12.2% 11.5% 38.4% 26.8%
% of Total .4% .9% 1.6% 2.8% 21.0% 26.8%
11-15 Count 6 0 2 3 23 34
% within Sales volume
17.6% 0.0% 5.9% 8.8% 67.6% 100.0%
% within Distance Modern Retailer 1.
2.6% 0.0% .2% .2% .7% .5%
% of Total .1% 0.0% .0% .0% .4% .5%
16-20 Count 0 0 1 8 168 177
% within Sales volume
0.0% 0.0% .6% 4.5% 94.9% 100.0%
% within Distance Modern Retailer 1.
0.0% 0.0% .1% .5% 4.8% 2.8%
% of Total 0.0% 0.0% .0% .1% 2.7% 2.8%
21-25 Count 0 0 0 0 3 3
% within Sales volume
0.0% 0.0% 0.0% 0.0% 100.0% 100.0%
% within Distance Modern Retailer 1.
0.0% 0.0% 0.0% 0.0% .1% .0%
% of Total 0.0% 0.0% 0.0% 0.0% .0% .0%
Higher than 25
Count 0 1 0 1 8 10
% within Sales volume
0.0% 10.0% 0.0% 10.0% 80.0% 100.0%
% within Distance Modern Retailer 1.
0.0% .4% 0.0% .1% .2% .2%
% of Total 0.0% .0% 0.0% .0% .1% .2%
Total Count 234 238 835 1551 3468 6326
% within Sales volume
3.7% 3.8% 13.2% 24.5% 54.8% 100.0%
% within Distance Modern Retailer 1.
100.0% 100.0% 100.0% 100.0% 100.0% 100.0%
% of Total 3.7% 3.8% 13.2% 24.5% 54.8% 100.0%
© University of Pretoria

73
Table 25: Analysis of product brand unit sales on distance between spaza and Modern Retailer no 1 1
ProdVLThree Value df Asymptotic
Significance (2-sided)
Clover Fresh Milk
Pearson Chi-Square 1379.078 20 .000
Likelihood Ratio 1558.765 20 .000
Linear-by-Linear Association 251.782 1 .000
N of Valid Cases 29199
Clover Fruit Nectar
Pearson Chi-Square 141.287 20 .000
Likelihood Ratio 136.340 20 .000
Linear-by-Linear Association .515 1 .473
N of Valid Cases 8568
Dairy Fruit Mix Danao Fresh
Pearson Chi-Square 323.718 12 .000
Likelihood Ratio 319.753 12 .000
Linear-by-Linear Association 30.010 1 .000
N of Valid Cases 856
Dairy Fruit Mix Tropika Fresh
Pearson Chi-Square 1427.202 20 .000
Likelihood Ratio 1463.918 20 .000
Linear-by-Linear Association 425.746 1 .000
N of Valid Cases 40164
Dairy Fruit Mix Tropika UHT
Pearson Chi-Square 237.273 20 .000
Likelihood Ratio 208.843 20 .000
Linear-by-Linear Association 139.560 1 .000
N of Valid Cases 3041
Krush 100% Fruit Juice Blend
Pearson Chi-Square 577.783 20 .000
Likelihood Ratio 641.193 20 .000
Linear-by-Linear Association 262.437 1 .000
N of Valid Cases 6326
Total
Pearson Chi-Square 2212.058 20 .000
Likelihood Ratio 2583.991 20 .000
Linear-by-Linear Association 277.082 1 .000
N of Valid Cases 88154
© University of Pretoria

74
Table 26: Strength of the relationship between pack unit sales and distance between spaza shops and Modern Retailer 1
ProdVLThree Value
Approximate
Significance
Clover Fresh Milk Nominal by Nominal Phi .217 .000
Cramer's V .109 .000
N of Valid Cases 29199
Clover Fruit Nectar Nominal by Nominal Phi .128 .000
Cramer's V .064 .000
N of Valid Cases 8568
Dairy Fruit Mix Danao Fresh Nominal by Nominal Phi .615 .000
Cramer's V .355 .000
N of Valid Cases 856
Dairy Fruit Mix Tropika Fresh Nominal by Nominal Phi .189 .000
Cramer's V .094 .000
N of Valid Cases 40164
Dairy Fruit Mix Tropika UHT Nominal by Nominal Phi .279 .000
Cramer's V .140 .000
N of Valid Cases 3041
Krush 100% Fruit Juice Blend Nominal by Nominal Phi .302 .000
Cramer's V .151 .000
N of Valid Cases 6326
Total Nominal by Nominal Phi .158 .000
Cramer's V .079 .000
N of Valid Cases 88154
5.5.1.7 Unit sales summary
Table 27 presents the contingency table which is a cross tabulation of distance of Modern
Retailer 1 and Masakhane spaza stores with sales volume. So, 64.5% (N = 1625) of the
sales of 0-5 units per case were within 0-2 km of Modern Retailer 1 from a Masakhane store
as compared to 21.7% at 6-10km.
© University of Pretoria

75
Table 27: The cross tabulation of the distance with sales volume
Distance Modern Retailer 1 Total
0 -
2km
2.01 -
4 km
4.01 -
6 km
6.01
km -
8km
8.01 -
10 km
0-5
Count 1625 2290 9728 20640 15156 49439
% within Sales Volume 3.3% 4.6% 19.7% 41.7% 30.7% 100.0%
% within Distance Modern Retailer 1 64.5% 70.5% 56.7% 57.9% 51.2% 56.1%
% of Total 1.8% 2.6% 11.0% 23.4% 17.2% 56.1%
6-10
Count 546 734 2665 6118 6899 16962
% within Sales Volume 3.2% 4.3% 15.7% 36.1% 40.7% 100.0%
% within Distance Modern Retailer 1 21.7% 22.6% 15.5% 17.2% 23.3% 19.2%
% of Total 0.6% 0.8% 3.0% 6.9% 7.8% 19.2%
11-15
Count 69 39 649 1767 1357 3881
% within Sales Volume 1.8% 1.0% 16.7% 45.5% 35.0% 100.0%
% within Distance Modern Retailer 1 2.7% 1.2% 3.8% 5.0% 4.6% 4.4%
% of Total 0.1% 0.0% 0.7% 2.0% 1.5% 4.4%
16-20
Count 19 40 1622 2560 1640 5881
% within Sales Volume 0.3% 0.7% 27.6% 43.5% 27.9% 100.0%
% within Distance Modern Retailer 1 0.8% 1.2% 9.5% 7.2% 5.5% 6.7%
% of Total 0.0% 0.0% 1.8% 2.9% 1.9% 6.7%
21-25
Count 214 138 877 1766 2383 5378
% within Sales Volume 4.0% 2.6% 16.3% 32.8% 44.3% 100.0%
% within Distance Modern Retailer 1 8.5% 4.2% 5.1% 5.0% 8.1% 6.1%
% of Total 0.2% 0.2% 1.0% 2.0% 2.7% 6.1%
25+
Count 47 9 1604 2794 2159 6613
% within Sales Volume 0.7% 0.1% 24.3% 42.3% 32.6% 100.0%
% within Distance Modern Retailer 1 1.9% 0.3% 9.4% 7.8% 7.3% 7.5%
% of Total 0.1% 0.0% 1.8% 3.2% 2.4% 7.5%
Total Count 2520 3250 17145 35645 29594 88154
© University of Pretoria

76
% within Sales Volume 2.9% 3.7% 19.4% 40.4% 33.6% 100.0%
% within Distance Modern Retailer 1 100.0
%
100.0
%
100.0
%
100.0
%
100.0
% 100.0%
% of Total 2.9% 3.7% 19.4% 40.4% 33.6% 100.0%
5.5.2 The effect of region on sales volume
The plot of the mean sales volume score by brand pack size, for each of the radii from
Modern Retailer 1 to spaza, is broken down in the three regional clusters. The general trend
is that the mean (sales volume) increases as the distance increases for both the Gauteng
and Polokwane clusters. This effect is marginally the same in KZN.
Figure 16: Estimate marginal means for pack size
Table 28 presents the actual results of the two-way ANOVA to indicate whether any of the
three independent variables and their interaction is statistically significant. The region is
statistically significant with pack size with the p-value being less than .05. More importantly,
there was a statistically significant interaction between the effects of the region and distance,
F (6, 1.959) = 8.448, p <.5. In addition, testing the effect of distance, region and product
brand, their effect was found to be significant, F (23, 1.959) = 10.449, p <.05.
© University of Pretoria

77
Table28: Actual results of the two-way ANOVA
5.6 Summary and conclusion
In this study, 88,154 observations were made at 265 Masakhane spaza shops in Gauteng,
KwaZulu-Natal and Polokwane (Limpopo) regions. There were two research questions in
this study. The outcomes are summarised in Table 29. It is obvious from the above statistics
that both the pack size and sales volumes are influenced by the distance between the spaza
shop and modern retailer, which in this study was Modern Retailer 1 group.
Type III Sum of
Squares df
Mean
Square F Sig.
Partial Eta
Squared
Noncent.
Parameter
Observed
Powerb
Corrected Model 57584.554a 70 822,636 419,833 0,000 ,250 29388,335 1,000
Intercept 3306,498 1 3306,498 1687,474 0,000 ,019 1687,474 1,000
Distance 28,042 4 7,010 3,578 ,006 ,000 14,311 ,875
Region 15,238 2 7,619 3,888 ,020 ,000 7,777 ,704
ProdLVLThree 12062,589 5 2412,518 1231,231 0,000 ,065 6156,155 1,000
Distance * Region 99,323 6 16,554 8,448 ,000 ,001 50,690 1,000
Distance* ProdLVLThree 453,338 20 22,667 11,568 ,000 ,003 231,361 1,000
Region * ProdLVLThree 2697,864 10 269,786 137,686 ,000 ,015 1376,858 1,000
Distance * Region *
ProdLVLThree470,917 23 20,475 10,449 ,000 ,003 240,333 1,000
Error 172592,979 88083 1,959
Total 618830,000 88154
Corrected Total 230177,533 88153
Dependent Variable:
Source
a. R Squared = .250 (Adjusted R Squared = .250)
b. Computed using alpha = ,05
© University of Pretoria

78
Table 29: Summary outcomes of the study
© University of Pretoria

79
CHAPTER 6
6. ANALYSIS OF RESULTS
6.1 Introduction
Chapter 5 detailed the results of the current study and looked at the impact of distance
between the encroaching modern retailer and the informal emerging market spaza shops on
product pack size. It assessed each product and SKU by pack size and showed its
distribution and sales performance in spaza shops at various radii from the Modern Retailer
1 retailer. It also assessed differences across three clusters in terms of sales performance.
Measuring distribution shows whether the product was bought by the spaza shop and
measuring sales assessed the rate of sale of each SKU available.
This chapter discusses the research results on the distribution of six dairy products from
Clover South Africa. Conclusions on each research question are formulated and compared
to the findings of past research previously discussed in Chapter 2. The distribution and sales
results of each pack size within these six products are discussed with reference to prior
research and the intention of setting a platform from which to conclude the principal findings
and suggestions for future research.
6.2 The influence of geographical distance between the emerging market spaza shop and
modern-day retailer on product unit size distribution
6.2.1 Introduction
The author of the current study highlighted the importance of product variety. Previous work
by Ampuero and Vila (2006), S.T. Wang (2013) and Rundh (2013) all focused on packaging
as a differentiating factor. Other studies such as those by Sorenson (2000), Berger et al.
(2007) and Ford et al. (2012) show how the study of product and packaging variety can aid
future research with reference to different products and product sizes. The hypothesis was
therefore informed by the literature. It narrowed the study down from the importance of
variety to the importance of product unit size as a form of product variety. Previous studies
have confirmed that product variety increases a company’s market power, which in turn
raises profit margins and market share (Bayus & William P. Putsis, 1999).
Research Question 1: Is the distribution of product unit size in emerging market spaza shops influenced by distance between the emerging market spaza shop and modern-day retailer?
© University of Pretoria

80
In their study on Fair and Lovely fairness cream, Jaiswal and Gupta (2015) identified that, to
create significant impact in the BOP (bottom of the pyramid), one needs inexpensive unit
packs or sachets catering for single-serve portions and for the consumer’s limited coinage at
the time of purchase. This channelled the current study into the area of emerging markets
where research by Shankar and Bolton (2004), Bianchi (2014), Kumar et al. (2009) and
Reinartz et al. (2011) showed that despite research around product variety, granular analysis
on product unit pack size and price in emerging markets needs more work.
However, to convert product pack size variety into successful sales and market share, one
needs the distribution and availability of product in the outlet (Kumar et al., 2009). The
current study therefore aims to build onto the recent study by Kumar et al. (2015) where they
acknowledge that the study did not extrapolate aggregate data from an emerging market;
also that they had not been able to study information on the distribution intensity of stores at
a regional or town level. The below section will therefore discuss the results against the
distribution of product unit size in emerging market spaza shops and how such results could
be influenced by the distance between the emerging market spaza shop and modern-day
retailer.
6.2.2 Discussion of research results
Clover Fresh Milk
For the shortest distance (0-2 km) from the sampled stores, distribution of the 500 ml pack
size scored at only 5.5% whereas the 1 L and 2 L pack sizes scored significantly better at
24.3% and 23.8%, respectively. For the longest distance of 8-10 km the 1 L was the most
dominant pack size at 34.9% distribution whereas the 250 ml was only 24.2% distributed.
The results indicate a significant association namely χ2 (16, N=29199) = 1554.837, p <.05.
Having established the relationship between distance and pack size with respect to Clover
Fresh Milk, the strength of the relationship was evaluated using Cramer V (φ). The strength
of the relationship was weak with an φ value of 0.115. This result was unexpected and may
well show that spaza shop owners are not concerned about stocking 1 L and 2 L pack sizes
despite their being in close proximity to the modern-day retailer, in this case within 2 km of
the Modern Retailer 1 outlet. Logic would say that they would focus on convenience
(Pornpitakpan, 2010; and Sy-Changco et al., 2010), given that modern retail formats focus
on larger packs (Wansink & Huckabee, 2005). This could well point to analysis done by
Trade Intelligence (2016) that such spaza stores are just as price-competitive as their
modern retail competitors. It will be interesting to note how sales compare, which will be
© University of Pretoria

81
analysed as part of Research Question 2. The sales results could therefore indicate that
those spaza stores within a 0-2 km and 2-4 km radius are missing an opportunity by not
stocking smaller pack sizes. However, the purchasing decision around Fresh Milk versus
long life milk also needs to be considered. One of the views may well be that, depending on
the product (for example its perishability or shelf life), separate strategies may be needed
regarding which packs to focus on when either closer or further away from large modern
retail competitors.
Clover Fruit Nectar- Danao
The results show that within a 0-4 km radius, the 500 ml pack was 100% distributed but as
distance increased, the larger 2 L Danao Fruit Nectar became more readily available and
better distributed. This was opposite to the 500 ml, which shows better distribution within 0-4
km from the modern retailer. However, the 250 ml Danao had a different impact on the
relationship between pack size and distance with regard to longer distances, mainly 6-8 km
and 8-10 km, indicating better distribution further from the modern retailer. These results are
therefore somewhat mixed. However, they remain significant in the sense that without a
common pattern of results, there remains opportunity not only to better educate trader and
supplier alike as to the advantages of SKU assortment and pack size variety but also to
improve distribution.
As recently researched by Sy-Changco et al. (2010), in the emerging market context of the
Philippines, a 5 Peso pack or a 10 Peso pack are affordable but if marketed “beyond the
coinage” (p. 759) it will not appeal to the people because the coinage has formed a limit.
They further acknowledge how tough it then is to reduce pack sizes in emerging markets as
you need to play with the coinage (Rundh, 2013; and Sy-Changco et al., 2010). There
therefore needs to be more science behind purely providing more variety and offering
alternative pack sizes as researched by Gerstner and Hess (1987), Hammond and Prahalad
(2004) and Sy-Changco et al. (2010). The likes of Clover and Kellogg Company South Africa
who are entering the emerging market will need to take note of certain recommendations
from this prior research. As can be seen by the above results in relation to both the Danao
Fruit Nectar and the Clover Fresh Milk, consumer behaviour and spending habits play a role
in the emerging market but the need has emerged to also consider the distance from the
modern retailer and the effect on stocking different product pack sizes.
Dairy Fruit Mix Danao Fresh
© University of Pretoria

82
The results showed that with only two pack sizes there may be room for further pack size
considerations. The trend showed a high availability of the 1 L closer to the Modern Retailer
1 retailer and, in contrast, a very low availability of the 330 ml. Furthermore, the 1 L
availability improved even more the further the distance from the modern retailer. This might
indicate that significantly more opportunity exists for smaller pack sizes closer to the modern
retailer. A more focused approach on convenience and single purchase consumption as
evidenced by Florio (2016) in his examples of proven price and pack architecture
effectiveness should therefore be examined.
Dairy Fruit Mix Tropika Fresh
Tropika Fresh had 5 pack sizes across a number of different flavours distributed. The pack
sizes distributed were 250 ml, 330 ml, 500 ml, 1.5 L and 2 L. In analysing the results, it is
noteworthy that the 500 ml had the best distribution and was above 80% availability in the 0-
2 km as well as the 2-4 km radii, whereas the 2 L and 250 ml showed far less distribution
penetration. The 330 ml and 250 ml were poorly distributed and hardly available the closer
the distance from the Modern Retailer 1 retailer. With 7 pack sizes of this product, the
analysis shows disappointing distribution results for such a well-recognised brand name in
the South African emerging market. As Kuben Govender from Clover stated, a lack of focus
on what pack sizes to concentrate on and in which retail environments is confirmed by the
distribution performance (Kuben Govender, personal communication, July 7, 2016).
Two key studies previously referred to by the author in this current study are noted, the first
being that of Kumar et al. (2015) in which different retail formats are analysed and marketing
mix recommendations are aligned to each format, and the second Wan et al.'s (2014)
research where the value of product line and pack size was measured. It is evident in the
current study that in the performance of this product there are a few significant
recommendations addressed in the next chapter. As previously found in the study of Chipp
et al. (2012), it is important to distinguish between individual and household purchase
decisions. Not only should unit pack sizes be segmented by retail format (Kumar, Fan, Gulati
& Venkat, 2009; and Kumar, Sunder & Sharma, 2015), but also by individual versus family
consumption (Chipp et al., 2012).
Dairy Fruit Mix Tropika UHT
Three product pack sizes were distributed namely 200 ml, 250 ml and 1 L, of which the 1 L
was most widely distributed except at the furthest radius where the 200 ml was better
distributed with higher availability. Again, there may be a significant amount of analysis to be
© University of Pretoria

83
considered here by combining these scores with the distribution scores of the Tropika Fresh
above. The smaller pack sizes across both Tropika Fresh and UHT are relatively poorly
distributed within 4 km of the Modern Retailer 1 retailer.
It must also be noted that Clover grew this product line from three SKUs to seven to take
advantage of the single consumption occasion in emerging markets (Kuben Govender,
personal communication, July 7, 2016). As noted earlier in this study, Sloot et al. (2006)
introduced line extensions and package downsizing as a means of further meeting consumer
needs and choices. Wan et al. (2014) added that companies could block out the threat of
new entrants by providing an ever-increasing variety of products, thereby segmenting the
market into thinner slices. However, unless there is a clear understanding of an
organisation’s competitive toolkit, (Berger et al., 2007)(Berger et al., 2007)(Berger et al.,
2007)(Berger et al., 2007)(Berger et al., 2007)(Berger et al., 2007)(Berger et al., 2007)
results can also suggest that product proliferation can even be counterproductive in the
sense that market share decreases after a certain line length (Berger et al., 2007). These
researchers found that on the organisation’s side, production costs increase exponentially as
line length increases, therefore effective management of line length remains a critical
consideration. As the study by Akır and Balagtas (2014) observed, there may be a myriad of
responses to packaging downsizing and as researched by De Matta, Lowe and Wu (2014),
managing product variety in light of consumer expectations is critical in supply chain. Several
recommendations may be made to Clover arising from the distribution results of the current
study and in particular those of their number one brand, Tropika Fresh. More consideration
will need to be given to the mix of products and pack sizes between the UHT sizes and
flavours and the fresh alternative. Occasions, regional differences, single-serve versus
family purchase decisions and flavour alternatives will need to be considered
Krush 100% Fruit Juice Blend
Overall, the 500 ml achieved 75.7% of the total distribution and had even better distribution
over shorter radii. Further distances also showed good distribution figures for the 500 ml,
whereas the 1.5 L showed less than 20% availability overall and was less available the
further the distance from the Modern Retailer 1 retailer. Pornpitakpan (2010), Sy-Changco et
al. (2010) and Wan et al. (2014) all showed that there is indeed a definitive case for different
pack sizes although a common thread in their argument was that the context and type of
product mattered.
© University of Pretoria

84
In the study of package unit sizes with Thai undergraduates (Pornpitakpan, 2010, p. 289),
the participants read scenarios and poured products into containers. The study showed that
the effect of pack size, unit costs and fill amounts varied by product type. Some consumers
of certain products like cooking oil used a greater product amount when the package size
was larger versus smaller, and some consumers used a greater amount when the product
unit cost was lower. This was especially evident in the case of detergent. The Thai study has
particular relevance to Clover’s Krush 100% Fruit Juice Blend. It is evident that the 500 ml is
a popular choice at the size and price and with only two size options of this brand it is worth
considering the impact of a smaller 250 ml or 300 ml and a larger 1 L pack. Berger et al.
(2007) does warn against product proliferation but given the sales data at Clover’s disposal
and the fact that distribution costs would be minimised due to the smaller moulds already in
use in other products (Govender, personal communication, July 7, 2016; and De Matta et al.,
2014), a trial with a smaller and larger pack could be a prudent move. According to Kuben
Govender from Clover (personal communication, July 7, 2016), and G.G. Alcock from
Minanawe (personal communication, October 20, 2016), an analysis of competitor pack
sizes would need to be clearly understood.
6.2.3 Summary
As previous studies by Venkatesan et al. (2015), Chandon and Ordabayeva (2009) and
Kumar et al. (2015) conclude, managers in emerging markets need to focus on the optimal
product line length and variety for each retail channel served. This should be coupled with a
strong relationship programme, effective in-store merchandising and an extensive
distribution network to drive product distribution. Furthermore, consistent with the literature
reviewed in Chapter 2, product variety, specifically unit pack size, and the influence of formal
retailers are both factors that affect brand distribution in the emerging market.
6.3 The influence of geographical distance between emerging market spaza shop and
modern-day retailer on product unit size sales
6.3.1 Introduction
Research Question 2: Are the sales of product unit size in emerging market spaza shops influenced by the distance between the emerging market spaza shop and modern-day retailer?
© University of Pretoria

85
Measuring distribution shows the effectiveness of the combined elements of distribution,
sales and marketing in getting the product on shelf. Measuring sales obviously assessed the
rate of sale of each SKU available. The findings of the results from Chapter 5 with specific
emphasis on the impact of sales and conclusions are examined, formulated and compared
to the findings of past research in Chapter 2. In the study by Ali et al. (2010), the mean value
of the consumer responses on a range of product attributes showed that approximately 70%
of all respondents considered packaging and convenience as important when making a
purchase. The analysis of sales results of each of Clover’s ProductVLThree sub-brands in
question will be explained and concluded separately in the next section.
6.3.2 Discussion of research results
Clover Fresh Milk
The shorter the distance from the Modern Retailer 1 retailer, the less fresh milk was sold by
the spaza shop. For the longer distances of 6-8 km and 8-10 km, the number of transactions
was far higher for each of the sales volume segments. In other words, those consumers
living further away from the Modern Retailer 1 store were inclined to visit their local spaza
shop more frequently than consumers purchasing from spaza shops closer to the Modern
Retailer 1 retailer. In assessing the impact of the modern retailer it must also be noted that
all the unit pack sizes namely 250 ml, 500 ml, 1 L and 2 L struggled in terms of distribution,
number of sales transactions and sales volume the closer the proximity of the Modern
Retailer 1 retailer.
The results of the study by Madlala (2016) show that smaller informal spaza shops struggle
to compete on price with larger chains, even though the entry of a new large retailer
significantly impacts only those stores that operate within a tight radius of the larger, formal
retailer. In contrast, the latest pricing survey by Trade Intelligence (2016) has noted that
such small informal spaza shops can compete on price. In this current study it may again
amount to focusing on the right pack sizes the closer the proximity to the modern retailer.
Ligthelm (2008) and Liedeman et al. (2013) identified that proximity to customers’ dwellings,
long and flexible business hours, satisfaction of emergency needs, credit facilities, the
availability of merchandise in small units as well as good and friendly customer service were
key to the survival of these spaza retail shops. Given the modern retailer’s focus on larger
pack sizes (Liedeman et al., 2013), it may be a case of not only variety but which careful
selection of unit pack size variety the spaza retailer should be focusing on.
© University of Pretoria

86
The Clover Fresh Milk results may also be impacted by the nature and seasonality of the
product (Ali et al., 2010). UHT (long life milk) stays fresh considerably longer and may be a
safer choice in summer or when the customer needs to make sure his milk stays fresh in the
absence of refrigeration facilities.
Clover Fruit Nectar
This is a product that is being ordered mainly in transactions of 0-10 units, with 65.4% in 0-5
units and 20.3% in 6-10 units. However, none of the order volumes were sold in the first 4
km radius due to a lack of distribution closer to the Modern Retailer 1 retailer. The 500 ml
and 1 L exceeded the 250 ml sales, the former taking place mainly in the 6-8 km radius.
These results show a definite opportunity for a more focused strategy. Research results by
Wan et al. (2014) note that taking advantage of product variety such as product lines may
have a positive result on sales performance while increasing other aspects of variety like
pack size may have a negative impact. Different product attributes need to be assessed in
view of the fact that the positive total effect of product-line variety on sales at a certain point
reduces as the number of items increases (Iyengar & Lepper, 2000; and Wan et al., 2014).
In the results of Clover Fruit Nectar there clearly seems to be room and opportunity to
increase the product line with smaller unit pack sizes.
Danao Fruit Mix Fresh
More than 90% of the sales of Danao fruit mix occurred between 6-10 km, and 81.8% of the
orders were between 6-10 units. With only two different pack sizes namely 330 ml and 1 L, it
was clear from the distribution of the products that the 1 L was far better distributed and
available more often than the 330 ml, especially in the 6-10 km radius. A significant amount
of work therefore needs to be done on seeding the smaller pack. As studies by Kekre and
Srinivasan (1990), Neuwirth (2014), Payaud (2014) and more recently that of Shaikh et al.
(2016) noted, product line length decisions are an important consideration for market share
growth in the emerging market. Given the seemingly high number of pack sizes in certain
products analysed in the Clover stable in this current study as well as the seemingly low
number of unit pack size alternatives of other products in the same stable, it is evident that
significant insights could be drawn from the studies mentioned above coupled with those by
Sy-Changco et al. (2011) and Pornpitakpan (2010). Sy-Changco et al. (2010) noted that
sachet marketing or marketing in small unit pack sizes is a way of introducing products to
new consumers. These smaller unit sizes also allow spaza owners to offer more product
variety in their small shops.
© University of Pretoria
87
Dairy Fruit Mix Tropika Fresh
The majority of Dairy Fruit Mix Tropika Fresh was sold between 0-5 unit sales per
transaction, and between 6-10 km. Figure 6 shows that of a proliferation of seven unit pack
sizes in this product line, only three are really proving successful. The 330 ml and 1.5 L are
insignificant in terms of distribution and volume, whereas the 250 ml, 500 ml and 2 L
dominate availability in the 4-10 km radius. Again, it must be considered that smaller pack
size sales and distribution should be better the shorter the distance to the modern retailer.
Competitive and differentiated packaging solutions can help the consumer to better estimate
the value of what they can get for their money (Rundh, 2013), but results also suggest that
product proliferation can be counterproductive in the sense that market share decreases
after a certain line length (Berger et al., 2007). In this current research it therefore seems
that a SKU rationalisation process may be needed to reach the optimal balance between
cannibalising on own pack sizes and optimal market share.
Dairy Fruit Mix Tropika UHT
Three product pack sizes were distributed namely 200 ml, 250 ml and 1 L, of which the 1 L
was most widely distributed except for the furthest radius where the 200 ml was better
distributed with a higher availability. In terms of volume of sales, smaller size unit
transactions were sold, mainly in units of between 0-10 per transaction and mainly in the 8-
10 km radius. It is logical that th
e 200 ml and 1 L will dominate distribution and sales, considering that the 250 ml, 500 ml
and 2 L dominate in the Tropika fresh product line.
As mentioned before, Scavarda et al. (2010) and Bezuidenhout (2014) looked at previous
research done on “late configuration” (Scavarda, 2010, p. 220), a term given to variety and
assortment created in products post the manufacturing stage. This is a pertinent aspect to
consider where the above two interplaying product lines, Dairy Fruit Mix Tropika UHT and
Dairy Fruit Mix Tropika Fresh, with ten different pack sizes between them, need considerable
attention towards production costs. Packaging of the different pack sizes and the costs
associated form a significant consideration of how far variety can be taken advantage of.
Again, the balance between cost and market share needs to be carefully considered.
© University of Pretoria

88
Krush 100% Fruit Juice Blend
According to the sample studied the 500 ml distribution is this brand’s strength. Overall
orders of 0-10 units per transaction constituted 75.3% of the total sales showing that
potentially most were for immediate consumption but less likely as a monthly bulk purchase.
This could justify an argument for a smaller pack size in this brand to enhance immediate
consumption (Ampuero & Vila, 2006; and Guoying & Qingfeng, 2009). For this to happen,
Clover’s distribution network through their Masakhane channel represents a competitive
advantage and mirrors that of the Philippine archipelago which feeds a distribution network
of goods to many of the small sari-sari stores (Sy-Changco et al., 2010). Powder oils,
cologne and other products are distributed in very small bottles. They do this because given
the wide distribution network and economies of scale they can distribute products which,
albeit making limited money, create a conversion to the larger pack sizes of the same
product or brand (Sy-Changco et al., 2010).
6.3.3 Summary
Sales cannot materialize without effective and efficient distribution of the product to make it
available (Kumar et al., 2015; and Payaud, 2014). The more tailored the distribution network
and the more customised the variety of the brand to emerging markets (Jaiswal & Gupta,
2015.; and Rundh, 2013), the more likely distribution of the product can provide on-shelf
availability of the product which can then materialise into sales. However, there is no point in
having a brand available in a pack size that does not sell, or missing the opportunity to
create sales through a pack size despite having great distribution (Kumar et al., 2015). From
the above observations of the six products within the Clover portfolio, it is evident that
ongoing optimisation of product pack size is necessary to achieve optimal sales and grow
market share.
6.4 Comparison of regional clusters
Table 16 illustrated the actual results of the two-way ANOVA which showed the region to be
statistically significant with pack size. The general trend showed that sales volumes
increased as the distance increased for both the Gauteng and Polokwane clusters. This
effect was only marginally the same for KZN.
The current study was done to analyse the regional similarity between clusters. The
observation in this study that the further away the spaza shops are from the Modern Retailer
1 retailer the better their performance in terms of sales, goes uncontested.
© University of Pretoria

89
Liedeman et al. (2013), Ligthelm (2008), Madlala (2016) and Moloi (2014) all suggest that
further research should be conducted on the structural changes in the retail environment of
emerging markets, and Ataman and Heerde (2010) as well as Venkatesan et al. (2015) note
the opportunity that exists in assessing the impact of such structural changes on the pack
size alternatives spaza shop owners and their suppliers should be addressing. The similarity
in sales trend in three different clusters provides further evidence that Clover and other
suppliers and distributors need to consider the impact of pack size variety on their sales
performance and, more importantly, how similar or dissimilar this can be by region.
The analysis of these three regions further highlights that, despite differences in population,
spaza shop density and number of modern retailers, the same trend exists namely that
spaza stores closer to the modern retailer sell less of a given product.
6.5 Overall Summary
From the current study the author has uncovered further analysis alluding to the opportunity
that exists and where, in the context of brand and pack examples from Clover SA,
companies and spaza shop owners need to consider the variables of location and proximity
to modern retailers. At the same time identifying which brands and in which pack sizes they
need to be made available to maximize sales is an important consideration. The analysis by
product identified several noteworthy observations with opportunity to lengthen, reduce or
reformulate the pack sizes within a product line. Other factors like the cost of production, the
cost of distribution and cannibalisation within the product line were also noted. However, in
summary, when looking at the products analysed it should be acknowledged that the entry
and impact of larger retailers and the effect this has on product pack and price strategies will
remain an important study to build on to.
CHAPTER 7
7. CONCLUSION
7.1 Introduction
This chapter will summarize the objectives of the research and also provide insight into the
effect that modern retail and the distance between spaza shop and modern retailer has on
the pack size decisions of these spaza shop owners. Although the context is South Africa,
the aim, through a comparison of three different clusters, is to show the similar pack size and
proximity complexities that different emerging markets face. Recommendations for business
© University of Pretoria

90
from the perspective of the spaza shop owner and suppliers are also discussed and
conclusions are made on the limitations and implications for future research.
7.2 Research background and objectives
As evidenced by Shankar and Bolton (2004), Bianchi (2014), Kumar et al. (2009) and
Reinartz et al. (2011), granular analysis on product unit pack size and price in emerging
markets needs more work to more clearly understand how brands, through variety, can
capture the diverse needs of consumers. To date there is no study in a South African context
and very little related research in emerging markets globally that deals specifically with the
impact of the ever encroaching modern retailers and their impact on product assortment
decisions in emerging markets (Liedeman et al., 2013; Moloi, 2014; and Mthimkhulu, 2015).
The research aims to specifically address challenges relating to unit pack size in order to
better inform spaza shop retailers and suppliers of the pack size assortment decisions they
need to make to ensure that spaza shops not only survive, but remain competitive in the
face of such modern retailers entering emerging markets.
The research aimed to go one step further by comparing the results of three different
geographical clusters. The overarching objective therefore was to contribute to rethinking
about the way spaza shop owners and managers look at pack size in the emerging market
and to understand that a key factor to ensuring spaza shop survival is ensuring that those
pack sizes that are stocked are done so with the increased competition of modern-day
retailers in mind (Ramakrishnan, 2010; Strydom, 2015; and Yadav et al., 2016).
The research objectives were identified as follows:
To establish to what degree the distribution of pack size is affected by the proximity
of spaza shop to modern-day retailer
To establish to what degree the sales of pack size is affected by the proximity of
spaza shop to modern-day retailer
To understand the impact that different geographies play in the relationship between
availability or sales and the proximity of spaza shop to modern-day retailer
7.3 Summary of key findings
© University of Pretoria

91
As highlighted in the objectives, the study examined the impact of modern-day retailers in
two areas, namely their impact on distribution of pack sizes and their impact on the sales of
different pack sizes. The findings will be unpacked according to these two levels looking at
the specific impact on branded products and their respective pack sizes in the Clover dairy
product range.
7.3.1 Impact of modern retailer on distribution of unit pack size
Clover Fresh Milk distribution findings showed little impact of the modern retailer on spaza
shop distribution of larger 1 L and 2 L packs in contrast to the fact that large modern retail
formats focus on larger packs (Rundh, 2013; and Wansink & Huckabee, 2005) This may well
point to the fact that recent pricing data from the South African emerging market (Trade
Intelligence, 2016) show that such spaza stores are just as price-competitive as their modern
retail competitors. In fact, as Strydom (2015) described it, the current scenario is literally a
“David versus Goliath phenomenon” (p. 463) with the foreign national spaza owner
transforming the industry as Liedeman et al. (2013) emphasizes and through reasons
described in the current study.
Rundh, (2013) and Sy-Changco et al. (2010) acknowledge how tough it is to reduce pack
sizes in emerging markets as there needs to be an awareness of the coinage
denominations. The finding here is that to the admission of Kuben Govender, emerging
market head at Clover, companies currently do not put enough science behind alternative
pack sizes (personal communication, July 7, 2016) , as noted by Gerstner and Hess (1987),
Hammond and Prahalad (2004) and Sy-Changco et al. (2010) and do not clearly articulate
their price pack architecture and match it to the coinage denominations which define the
daily purchase occasion of those in the bottom of the pyramid (Hammond & Prahalad, 2004).
The availability results of Dairy Fruit Mix Tropika Fresh showed that with 7 pack sizes,
Clover has suffered from a lack of focus in terms of what pack sizes to concentrate on and in
which retail environments to distribute to (Kuben Govender, personal communication, July 7,
2016). As previously found in the study of Chipp et al. (2012), it is important to distinguish
between individual and household purchase decisions. Not only should unit pack sizes be
segmented by retail format (Kumar, Fan, Gulati & Venkat, 2009; and Kumar, Sunder &
Sharma, 2015), but also by individual versus family consumption (Chipp et al., 2012).
Between the UHT and Fresh versions of Tropika, the current study noted 10 pack sizes in
the market. Unless there is a clear understanding of an organisation’s competitive toolkit,
© University of Pretoria

92
results can suggest that product proliferation can even be counterproductive in the sense
that market share decreases after a certain line length (Berger et al., 2007).
Krush 100% Fruit Juice Blend results showed that with only two pack sizes there may be
room for further pack size considerations. The trend showed a high availability of the 1 L
closer to the Modern Retailer 1 retailer and, in contrast, a very low availability of the 330 ml.
This might indicate that significantly more opportunity exists for smaller pack sizes closer to
the modern retailer. Studies have confirmed that product variety increases as a company’s
market power rises, which in turn raises profit margins and market share (Bayus & William P.
Putsis, 1999). The opportunity therefore, to extend the Krush product line into more pack
sizes can further drive profit and market share for Clover.
7.3.2 Impact of modern retailer on sales of unit pack size
In assessing the impact of the modern retailer on Clover Fresh Milk sales it must also be
noted that all the unit pack sizes namely 250 ml, 500 ml, 1 L and 2 L struggled in terms of
distribution, number of sales transactions and sales volume the closer the proximity of the
Modern Retailer 1 retailer. In fact, it seems that of all the products analysed, fresh milk was
most impacted by proximity to the modern retailer. The finding here is that different products,
even within Clover’s dairy product category, are influenced by different purchase decisions.
Danao Fruit Mix Fresh had seemingly low numbers of sales in the smaller unit pack size
alternatives. In this, significant insights could be drawn from the studies by Sy-Changco et al.
(2010) and Pornpitakpan (2010). Sy-Changco et al. (2010) noted that sachet marketing or
marketing in small unit pack sizes is a way of introducing products to new consumers. These
smaller unit sizes also allow spaza owners to offer more product variety in their small shops.
In terms of Dairy Fruit Mix Tropika Fresh, with a proliferation of seven pack sizes in this
product line, only three have really proved successful. Product proliferation can be
counterproductive (Berger et al., 2007) and in this current research it therefore seems that a
SKU rationalisation process may be needed to reach the optimal balance between
cannibalising on own pack sizes and using certain pack sizes to enhance the sales of others.
In assessing Dairy Fruit Mix Tropika UHT, it is logical that the 200 ml and 1 L will dominate
distribution and sales, considering that the 250 ml, 500 ml and 2 L dominate in the Tropika
fresh product line. Therefore, between Dairy Fruit Mix Tropika Fresh and Dairy Fruit Mix
Tropika UHT the opportunity is presented to refocus and refine the strategy through a SKU
rationalisation process.
© University of Pretoria

93
The sales results of Krush 100% Fruit Juice Blend 500 ml indicate that there could be an
argument for a smaller pack size. With this pack size as the standalone sales driver in this
product, it presents the opportunity to introduce a smaller pack size in this brand to enhance
immediate consumption (Ampuero & Vila, 2006; and Guoying & Qingfeng, 2009).
7.3.3 Impact of geographical location on the relationship between modern-day retailer
and availability and sales of unit pack size
The analysis of these three regions further highlights that, despite differences in population,
spaza shop density and number of modern retailers, the same trend exists namely that
spaza stores closer to the modern retailer sell less of a given product. The results show that
across regions in emerging markets, manufacturers and retailers face the same challenge of
catering for daily consumption needs, portion control and convenience (Chernev, 2011;
Dawar & Chattopadhyay, 2002; and Pornpitakpan, 2010).
7.4 Implications for management
The studies by Scavarda et al. (2010), Jaiswal and Gupta (2015), (Kumar, Fan, Gulati and
Venkat (2009) and Kumar, Sunder and Sharma (2015) focused on the role of product and
packaging variety in emerging markets. More specifically, Pornpitakpan (2010), Sy-Changco
et al. (2010) and Wan et al. (2014) conducted research on the value of package downsizing,
pack size and product line. Berger et al. (2007) viewed product line as an integral part of an
organisation’s competitive toolkit. Their results show that price and line length are
complementary. Other previous studies have confirmed that product variety increases a
company’s market power, which in turn raises profit margins and market share (Bayus &
William P. Putsis, 1999).
Although the research by Kumar et al. (2015) highlights the importance of distribution, they
also stated that the success of a brand in an emerging market depends on the extent to
which its marketing mix is customised to the unique characteristics of its market. The
findings and recommendations of the current study in relation to Clover’s brand pack sizes
show that refining packs sizes, rationalising product lines and catering for the impact of the
encroaching modern retailer are all important management considerations in lieu of
changing consumer trends and increased competition in emerging markets.
Wan et al. (2014), asked why firms offer multiple flavours of a particular brand, and why
companies produce specific products in a range of sizes. As mentioned by Sloot et al.
(2006), the answer, in short, would be to meet consumer needs and choices. In certain
© University of Pretoria

94
instances in the current study, these needs and choices seem to have been met, considering
the good distribution and sales of certain pack sizes. In other instances, certain pack sizes
were more affected by proximity to the modern retailer, and in some instances the
recommendation was to consider extending or simplifying the range of pack sizes in order to
either increase market share or reduce the threat of cannibalisation within the same product
line. Wan et al. (2014) suggested that managers could block out the threat of new entrants
by providing an ever-increasing variety of products, thereby segmenting the market into
thinner slices but results in the current study also suggested that product proliferation can be
counterproductive and can negatively affect market share and sales after a certain line
length (Berger et al., 2007). However, in discussions with Govender (personal
communication, July 7, 2016), he noted that managers must realise that product variety,
especially through the use of sachets and small pack sizes, can also foster repeat purchase
and encourage the buyer to trade up to larger sizes (Berger et al., 2007; and Guoying &
Qingfeng, 2009).
Managers of organisations and spaza shop owners need to adapt their product and price
strategies to cater for high frequency purchases. Being more flexible, adaptive and
responsive and by offering better service to the encroaching modern retailers may be the
answer to managers and owners of spaza shops and to the survival and long-term success
of their business. Ultimately, one of the key factors to success is being able to offer better
service than the modern retailer entering the spaza shop’s space (GG Alcock, 2015).
7.5 Limitations of the research
The study encompasses the analysis of distribution and sales data of Clover South Africa’s
dairy product range. As was the case with the numerous studies of chocolate by Berger et
al. (2007), Chernev (2011) and Iyengar and Lepper (2000), all their experiments consistently
used gourmet chocolate bars as the product to test for assortment size. These studies all
recognised the limitation of using only one product and consistently using this same product
across similar studies and over more than a decade of research. Although this current study
was a little more diverse in the sense that it analysed more than 30 pack sizes across six
brands in the Clover dairy stable, future studies could try to assess a broader range and a
more diverse cross-section of fast-moving consumer goods.
The second limitation that needs to be noted is the fact that in assessing the impact of
modern-day retailers, only one retailer within each sample cluster was analysed. Given the
© University of Pretoria

95
complexity of using more than one, the current study does not assess the impact of other
wholesalers or retailers within each cluster and a study beyond the simplistic view of the
impact on distribution and sales by the Modern Retailer 1 retailer in each of the three
geographical clusters needs to be taken.
Moreover, there are many factors that could affect the distribution and performance of pack
size. Clover themselves may have had logistical decisions for such performances, consumer
demand may have played a role, and so other factors such as relationships, competition,
price and promotion as well.
The impact of pricing and the interplay between price and unit pack size is a crucial area of
study and due to the vastness of such analysis and for the purpose of keeping the current
study focused and simple, such analysis was omitted. Moreover, the impact of promotions
on different pack sizes and products was also a limitation of the study.
Lastly, although the analysis and results have value for other emerging markets globally, it
was a study of three clusters within South Africa’s borders. This has limitations given that
one cannot assume the same trends and tendencies in other countries.
7.6 Suggestions for future research
Future studies can investigate additional ways in which the variety of options from which an
individual makes a selection or decision affects the perception of the chosen option (Berger
et al., 2007; Guoying & Qingfeng, 2009; and Rundh, 2013). The psychology of purchase
therefore plays an important role in the unit pack size consumption decisions of buyers.
Furthermore, a very important study to further assess and which was recognised in the
analysis of this study is the theoretical and empirical evidence provided by Waller and
Tangari (2008) and Eroglu et al. (2011) showing that the number of units per retail shipping
container or case pack quantity has a significant impact on retail market share. These
authors’ findings indicated that the effect of case pack quantity on market share depends
upon the rate of sale of a particular stock-keeping unit (SKU). For faster-selling SKUs,
market share increases with larger case packs but for slower-selling SKUs, market share
reduces the larger the case pack.
Price pack architecture is an important area of study for future research. Although there have
been studies around the decision to either reduce pack size or increase price, there is
definitely more work that can be done around emerging markets and the impact of widening
© University of Pretoria

96
a portfolio of pack sizes within a product portfolio whilst assessing the impact of price
(Pornpitakpan, 2010; and Wan et al., 2014)
Lastly, the impact of the encroaching modern retailer needs to be further assessed. The next
few years will most certainly be, as noted in Strydom (2015), a David versus Goliath
scenario.
7.7 Conclusion
The opportunity recognised in this study was that of a granular section of the marketing mix,
namely product variety in the form of product unit pack sizes. Despite research around
marketing mix recommendations, granular analysis on product unit pack size and price in
emerging markets was under-researched and the assumption that “stable competition
equilibrium is assumed” (Shankar & Bolton, 2004, p. 47) showed the need for further study
in terms of the growth of formal or organised retail entering the emerging market space.
Both the availability of the product unit size and the sales of the product size assortment
were found to be influenced by the distance between the spaza shops and the modern-day
retailers. The study therefore has important managerial and academic implications from
which future studies can be built on to further enhance the value of pack size variety as a
driver of profit for spaza shops and manufacturers alike.
© University of Pretoria

97
References
Ailawadi, K. L., Harlam, B. A., César, J., & Trounce, D. (2006). Promotion Profitability for a Retailer: The Role of Promotion, Brand, Category, and Store Characteristics. Journal of Marketing Research, 43(4), 518–535. http://doi.org/10.1509/jmkr.43.4.518
Akır, M. Ç., & Balagtas, J. V. (2014). Consumer Response to Package Downsizing: Evidence from the Chicago Ice Cream Market. Journal of Retailing, 90(1), 1–12. http://doi.org/10.1016/j.jretai.2013.06.002
Ali, J., Kapoor, S., & Moorthy, J. (2010). Buying behaviour of consumers for food products in an emerging economy. http://doi.org/10.1108/00070701011018806
Ampuero, O., & Vila, N. (2006). Consumer perceptions of product packaging. Journal of Consumer Marketing, 23(2), 100–112. http://doi.org/10.1108/07363760610655032
Arnold, D., & Quelch, J. (1998). New strategies in emerging markets. MIT Sloan Management Review. Retrieved from http://search.proquest.com/openview/98a2a9413d99b07ecebd44197555abbe/1?pq-origsite=gscholar
Arnold, T., Palmatier, R., Grewal, D., & Sharma, A. (2009). Understanding retail managers’ role in the sales of products and services. Journal of Retailing. Retrieved from http://www.sciencedirect.com/science/article/pii/S0022435908000729
Ataman, M., & Heerde, H. Van. (2010). The long-term effect of marketing strategy on brand sales. Journal of Marketing. Retrieved from http://journals.ama.org/doi/abs/10.1509/jmkr.47.5.866
Bayus, B. L., & William P. Putsis, J. (1999). Product Proliferation: An Empirical Analysis of Product Line Determinants and Market Outcomes. http://dx.doi.org/10.1287/mksc.18.2.137.
Berger, J., Draganska, M., & Simonson, I. (2007). The influence of product variety on brand perception and choice. Marketing Science. Retrieved from http://pubsonline.informs.org/doi/abs/10.1287/mksc.1060.0253
Bezuidenhout, L. (2014). Emerging female consumers’ use of diagnostic cues in evaluating apparel assortment of South African department stores. Retrieved from http://www.repository.up.ac.za/handle/2263/41105
Bianchi, C. (2014). Internationalisation of emerging market firms: an exploratory study of Chilean companies. International Journal of Emerging Markets, 9(1), 54–78. http://doi.org/10.1108/IJoEM-02-2010-0013
Brown, M., & Kros, J. (2003). Data mining and the impact of missing data. Industrial Management & Data Systems. Retrieved from http://www.emeraldinsight.com/doi/pdf/10.1108/02635570310497657
Burgess, S., & Steenkamp, J. (2013). Editorial: introduction to the special issue on marketing in emerging markets. International Journal of Research. Retrieved from https://dialnet.unirioja.es/servlet/articulo?codigo=4323468
Cajori, F. (1993). A history of mathematical notations. Dover Publications.
© University of Pretoria

98
Chandon, P., & Krishna, A. (2009). Estimating Food Quantity. Retrieved from https://books.google.co.za/books?hl=en&lr=&id=qfKOAgAAQBAJ&oi=fnd&pg=PA323&dq=consumer+perceptions+of+size+are+inelastic+(Krishna+2006%253B+Raghubir+and+Krishna+1999).&ots=6ZJ-Nerzc4&sig=DY23O5co1qdKpaaI0g2sOUkMZFk
Chandon, P., & Ordabayeva, N. (2009). Supersize in One Dimension, Downsize in Three Dimensions: Effects of Spatial Dimensionality on Size Perceptions and Preferences. Journal of Marketing Research, 46(6), 739–753. http://doi.org/10.1509/jmkr.46.6.739
Chandon, P., & Wansink, B. (2007). The biasing health halos of fast-food restaurant health claims: lower calorie estimates and higher side-dish consumption intentions. Journal of Consumer Research. Retrieved from http://jcr.oxfordjournals.org/content/34/3/301.abstract
Chernev, A. (2011). Product Assortment and Consumer Choice : An Interdisciplinary Review, 6(1), 1–61. http://doi.org/10.1561/1700000030
Chernev, A., & Hamilton, R. (2009). Assortment Size and Option Attractiveness in Consumer Choice Among Retailers. Journal of Marketing Research, 46(3), 410–420. http://doi.org/10.1509/jmkr.46.3.410
Chipp, K., Corder, C., & Kapelianis, D. (2012). Where practice meets theory: Defining and reviewing the bottom of the pyramid for South African marketers. Management Dynamics. Retrieved from http://search.proquest.com/openview/edca05880c7f7ba1a25f56c1fc4751fd/1?pq-origsite=gscholar
Dawar, N., & Chattopadhyay, A. (2002). Rethinking marketing programs for emerging markets. Long Range Planning. Retrieved from http://www.sciencedirect.com/science/article/pii/S0024630102001085
de Matta, R., Lowe, T. J., & Wu, L. (2014). Managing Product Variety in a Supply Chain. IEEE Transactions on Engineering Management. http://doi.org/10.1109/TEM.2014.2368384
Dholakia, N., & Dholakia, R. (2012). India’s emerging retail systems coexistence of tradition and modernity. Journal of Macromarketing. Retrieved from http://jmk.sagepub.com/content/32/3/252.short
Eroglu, C., Williams, B., & Waller, M. (2011). Consumer-driven retail operations: The moderating effects of consumer demand and case pack quantity. International Journal of. Retrieved from http://www.emeraldinsight.com/doi/abs/10.1108/09600031111138808
Evans, J. (2011). Retailing in perspective: the past is a prologue to the future. The International Review of Retail, Distribution and. Retrieved from http://www.tandfonline.com/doi/abs/10.1080/09593969.2011.537817
Felipe Scavarda, L., Reichhart, A., Hamacher, S., & Holweg, M. (2010). Managing product variety in emerging markets. http://doi.org/10.1108/01443571011018716
Florio, R. (2016). Price Pack Architecture: A Proven Strategy for Sustainable and Profitable Innovation - Google Search. Retrieved from https://www.google.co.za/webhp?sourceid=chrome-instant&ion=1&espv=2&ie=UTF-
© University of Pretoria

99
8#q=Price+Pack+Architecture%253A+A+Proven+Strategy+for+Sustainable+and+Profitable+Innovation
Ford, A., Moodie, C., & Hastings, G. (2012). The role of packaging for consumer products: Understanding the move towards “plain” tobacco packaging. Addiction Research & Theory, 20(4), 339–347. http://doi.org/10.3109/16066359.2011.632700
Gerstner, E., & Hess, J. (1987). Why do hot dogs come in packs of 10 and buns in 8s or 12s? A demand-side investigation. Journal of Business. Retrieved from http://www.jstor.org/stable/2352958
GG Alcock. (2015). KasiNomics. Retrieved from http://traceymcdonaldpublishers.com/?page_id=946
Guoying, W., & Qingfeng, H. (2009). The Influence of Product Variety on Brand Perception and Choice. Finance and Economics-Journal of Tianjin …. Retrieved from http://en.cnki.com.cn/Article_en/CJFDTOTAL-XCXB200908014.htm
Gupta, S., Kim, H., & Sharma, M. (2011). Customer switching to organized retail in semiurban markets: A study in an Indian context. Journal of International Consumer Marketing. Retrieved from http://www.tandfonline.com/doi/abs/10.1080/08961530.2011.602950
Hair, J., Black, W., & Babin, B. (2010). Multivariate data analysis: A global perspective. Pearson: Upper Saddle. Retrieved from http://library.wur.nl/WebQuery/clc/1924429
Hammond, A., & Prahalad, C. (2004). Selling to the poor. Foreign Policy. Retrieved from http://www.jstor.org/stable/4147574
Hinkle, D., Wiersma, W., & Jurs, S. (2003). Applied statistics for the behavioral sciences. Retrieved from http://www.jstor.org/stable/pdf/1164825.pdf
Iyengar, S., & Lepper, M. (2000). When choice is demotivating: Can one desire too much of a good thing? Journal of Personality and Social. Retrieved from http://psycnet.apa.org/journals/psp/79/6/995/
Jaiswal, A. K., & Gupta, S. (2015). The influence of marketing on consumption behavior at the bottom of the pyramid. http://doi.org/10.1108/JCM-05-2014-0996
Joseph, M. (2008). Nirupama Soundararajan Manisha Gupta Sanghamitra Sahu. Retrieved from http://rasci.in/downloads/2008/Impact_Organised_Retail_Unorganised_Sector_2008.pdf
Kalyanaram, G., & Little, J. (1994). An empirical analysis of latitude of price acceptance in consumer package goods. Journal of Consumer Research. Retrieved from http://www.jstor.org/stable/2489682
Kekre, S., & Srinivasan, K. (1990). Broader product line: a necessity to achieve success? Management Science. Retrieved from http://pubsonline.informs.org/doi/abs/10.1287/mnsc.36.10.1216
Kumar, V., Fan, J., Gulati, R., & Venkat, P. (2009). Practice Prize Paper —Marketing-Mix Recommendations to Manage Value Growth at P&G Asia-Pacific. Marketing
© University of Pretoria
100
Science, 28(4), 645–655. http://doi.org/10.1287/mksc.1080.0477
Kumar, V., Sunder, S., & Sharma, A. (2015). Leveraging Distribution to maximize firm performance in Emerging markets. Journal of Retailing. Retrieved from http://www.sciencedirect.com/science/article/pii/S002243591400061X
Lennard, D., Mitchell, V.-W., McGoldrick, P., & Betts, E. (2001). Why consumers under-use food quantity indicators. The International Review of Retail, Distribution and Consumer Research, 11(2), 177–199. http://doi.org/10.1080/09593960010023887
Liedeman, R., Charman, A., Piper, L., & Petersen, L. (2013). Why are foreign‐run spaza shops more successful? The rapidly changing spaza sector in South Africa. Retrieved from http://www.econ3x3.org/sites/default/files/articles/Liedeman 2013 Spaza shops FINAL_0.pdf
Liedeman, R., Charman, A., Piper, L., & Petersen, L. (2013). Why are foreign‐run spaza shops more successful? The rapidly changing spaza sector in South Africa.
Ligthelm, A. (2008). The impacT of shopping mall developmenT on small Township reTailers. SAJEMS NS, 11(1).
London, T., Esper, H., & Grogan‐Kaylor, A. (2014). Connecting poverty to purchase in informal markets. Strategic. Retrieved from http://onlinelibrary.wiley.com/doi/10.1002/sej.1173/full
Madlala, T. T. (2016). DO LARGE RETAILERS DISPLACE SMALL INFORMAL RETAILERS? THE CASE OF A PICK N PAY STORE IN KWAMASHU, DURBAN, SOUTH AFRICA.
Mazumdar, T., & Jun, S. (1992). Effects of price uncertainty on consumer purchase budget and price thresholds. Marketing Letters. Retrieved from http://link.springer.com/article/10.1007/BF00993917
McGaffin, R. (2010). Shopping centres in township areas: blessing or curse. Report for Urban Landmark, Pretoria. Retrieved from http://www.urbanlandmark.org.za/newsletter/issue/0501/download/shopping_centres_in _township_areas.pdf
Moloi, R. (2014). Exploring the barriers to the sustainability of Spaza shops in Atteridgeville, Tshwane. Retrieved from http://uir.unisa.ac.za/handle/10500/18649
Mthimkhulu, A. (2015). Small enterprise development in South Africa: an exploration of the constraints and job creation potential. Retrieved from http://scholar.sun.ac.za/bitstream/handle/10019.1/97117/mthimkhulu_small_2015.pdf?sequence=2
Mukherjee, A., & Patel, N. (2005). FDI in retail sector, India. Retrieved from https://books.google.co.za/books?hl=en&lr=&id=JqwlvXImtAcC&oi=fnd&pg=PA9&dq=Mukherjee,+Arpita+and+Nitisha+Patel+(2005),+FDI+in+Retail+Sector,+India:+Academic+Foundation.&ots=zFnnXUt-95&sig=tguY1xQSvopBKwqIt8lkCZ9l25o
Neuwirth, B. (2014). Marketing channel strategies in rural emerging markets. Kellogg School of Management. Available Online. Retrieved from http://www.academia.edu/download/43330118/Marketing_Channel_Strategy_in_Rural_
© University of Pretoria

101
Emerging_Markets_Ben_Neuwirth_1.pdf
Payaud, M. (2014). Marketing strategies at the bottom of the pyramid: Examples from Nestlé, danone, and procter & gamble. Global Business and Organizational Excellence. Retrieved from https://www.researchgate.net/profile/Marielle_Payaud/publication/259539408_Marketing_Strategies_at_the_Bottom_of_the_Pyramid_Examples_From_Nestle_Danone_and_Procter_Gamble/links/546ed4460cf29806ec2ebed2.pdf
Perks, S. (2010). Exploring the management abilities of spaza shop owners in the Nelson Mandela Metropolitan Municipality. South African Journal of Economic and Management. Retrieved from http://www.scielo.org.za/scielo.php?pid=S2222-34362010000400006&script=sci_arttext&tlng=pt
Polsa, P., & Fan, X. (2011). Globalization of Local Retailing: Threat or Opportunity? The Case of Food Retailing in Guilin, China. Journal of Macromarketing. Retrieved from http://jmk.sagepub.com/content/31/3/291.short
Pornpitakpan, C. (2010). How Package Sizes, Fill Amounts, and Unit Costs Influence Product Usage Amounts. Journal of Global Marketing, 23(4). Retrieved from http://search.proquest.com.uplib.idm.oclc.org/docview/751418426?accountid=14717
Quelch, J., & Jocz, K. (2009). How to Market in a Downturn. Harvard Business Review. Retrieved from http://www.ocvets4pets.com/archive17/How_to_Market_in_a_Downturn_-_HBR.org.pdf
Ramakrishnan, K. (2010). The competitive response of small, independent retailers to organized retail: Study in an emerging economy. Journal of Retailing and Consumer Services, 17(4), 251–258. http://doi.org/10.1016/j.jretconser.2010.02.002
Reinartz, W., Dellaert, B., Krafft, M., Kumar, V., & Varadarajan, R. (2011). Retailing Innovations in a Globalizing Retail Market Environment. Journal of Retailing, 87, S53–S66. http://doi.org/10.1016/j.jretai.2011.04.009
Ruhigga, T. (2011). The wholesale-retail sector and changes in consumer market response in rural South Africa. Journal of Social Science. Retrieved from http://www.krepublishers.com/02-Journals/JSS/JSS-29-0-000-11-Web/JSS-29-1-000-2011-Abst-PDF/JSS-29-1-091-11-1318-Ruhiiga-T-M/JSS-29-1-091-11-1318-Ruhiiga-T-M-Tt.pdf
Rundh, B. (2013). Linking packaging to marketing: how packaging is influencing the marketing strategy. British Food Journal. Retrieved from http://www.emeraldinsight.com/doi/pdf/10.1108/BFJ-12-2011-0297
S.T. Wang, E. (2013). The influence of visual packaging design on perceived food product quality, value, and brand preference. International Journal of Retail & Distribution Management, 41(10), 805–816. http://doi.org/10.1108/IJRDM-12-2012-0113
Sarkar, D., Kundu, K., & Chaudhuri, H. (2016). Constructing a conceptual model of purchase behaviour of village shopkeepers–a study of small rural retailers in Eastern India. Journal of Retailing and Consumer. Retrieved from http://www.sciencedirect.com/science/article/pii/S0969698915300254
Sarma, E. (2005). Need for caution in retail FDI. Economic and Political Weekly. Retrieved
© University of Pretoria

102
from http://www.jstor.org/stable/4417383
Saunders, M., Lewis, P., & Lewis, P. (2012). Doing research in business and management: An essential guide to planning your project. Retrieved from http://library.wur.nl/WebQuery/clc/2036357
Scheffer, J. (2002). Dealing with missing data. Retrieved from http://mro.massey.ac.nz/handle/10179/4355
Shankar, V., & Bolton, R. (2004). An empirical analysis of determinants of retailer pricing strategy. Marketing Science. Retrieved from http://pubsonline.informs.org/doi/abs/10.1287/mksc.1030.0034
(Sheth, 2011)Sheth, J. (2011). Impact of emerging markets on marketing: Rethinking existing perspectives and practices. Journal of Marketing. Retrieved from http://journals.ama.org/doi/abs/10.1509/jmkg.75.4.166
Sloot, L. M., Fok, D., & Verhoef, P. C. (2006). The Short- and Long-Term Impact of an Assortment Reduction on Category Sales. Journal of Marketing Research, 43(4), 536–548. http://doi.org/10.1509/jmkr.43.4.536
Sorenson, O. (2000). Letting the market work for you: An evolutionary perspective on product strategy. Strategic Management Journal. Retrieved from http://www.jstor.org/stable/pdf/3094141.pdf
Sorescu, A., Frambach, R., Singh, J., & Rangaswamy, A. (2011). Innovations in retail business models. Journal of. Retrieved from http://www.sciencedirect.com/science/article/pii/S0022435911000340
Strydom, J. (2011). Retailing in disadvantaged communities: the outshopping phenomenon revisited. Journal of Contemporary Management. Retrieved from https://www.researchgate.net/profile/John_Strydom/publication/274715344_Journal_of_Contemporary_Management/links/55279ef10cf229e6d6363010.pdf
Strydom, J. (2015). David Against Goliath: Predicting The Survival Of Formal Small Businesses In Soweto. International Business & Economics Research Journal – May, 14(3).
Sy-Changco, J. A., Pornpitakpan, C., Singh, R., & Bonilla, C. M. (2010). Managerial insights into sachet marketing strategies and popularity in the Philippines. http://doi.org/10.1108/13555851111183129
Turri, W. (2011). THE CHOICE OVERLOAD HYPOTHESIS: EXPLORING MODERATORS AND EXAMINING THE EFFECTS OF PERCEIVED CHOICE OPTIONS ON THE CONSUMER CHOICE-MAKING PROCESS IN A RETAIL CONTEXT.
Tustin, D., & Strydom, J. (2006). The potential impact of formal retail chains’ expansion strategies on retail township development in South Africa. Southern African Business Review. Retrieved from http://reference.sabinet.co.za/webx/access/journal_archive/1561896X/130.pdf
Venkatesan, R., & Farris, P. (2012). Measuring and managing returns from retailer-customized coupon campaigns. Journal of Marketing. Retrieved from http://journals.ama.org/doi/abs/10.1509/jm.10.0162
© University of Pretoria

103
Venkatesan, R., Farris, P., Guissoni, L. A., & Neves, M. F. (2015). Consumer Brand Marketing through Full- and Self-Service Channels in an Emerging Economy. Journal of Retailing, 91(4), 644–659. http://doi.org/10.1016/j.jretai.2015.04.003
Venkatesan, R., Farris, P., Guissoni, L., & Neves, M. (2015). Consumer Brand Marketing through Full-and Self-Service Channels in an Emerging Economy. Journal of Retailing. Retrieved from http://www.sciencedirect.com/science/article/pii/S0022435915000287
Waller, M., & Tangari, A. H. (2008). Case pack quantity’s effect on retail market share: An examination of the backroom logistics effect and the store-level fill rate effect. International Journal of. Retrieved from http://www.emeraldinsight.com/doi/abs/10.1108/09600030810893508
Wan, X., Dresner, M. E., & Evers, P. T. (2014). Assessing the Dimensions of Product Variety on Performance: The Value of Product Line and Pack Size. Journal of Business Logistics. http://doi.org/10.1111/jbl.12054
Wansink, B., & Huckabee, M. (2005). De-marketing obesity. California Management Review. Retrieved from http://cmr.ucpress.edu/content/47/4/6.abstract
Wegner, T. (2007). Applied business statistics: Methods and Excel-based applications. Retrieved from https://books.google.co.za/books?hl=en&lr=&id=EfWjtW4xXO8C&oi=fnd&pg=PA2&dq=Wegner+Applied+business+statistics&ots=5vUJZswhdD&sig=cjoj6NH3ECZySF0XLxJmYBELH1Y
Welcome to Trade Intelligence - Home. (2016). Retrieved from http://www.tradeintelligence.co.za/Home.aspx#.WB96Ny196M8
Yadav, R., Verma, M., & Singh, S. (2016). Impact of organised retail on neighborhood kirana stores: A case Study of Malwa region in Madhya Pradesh. World Scientific News. Retrieved from http://search.proquest.com/openview/7ff50f05699735da147b0bd326a4ca74/1?pq-origsite=gscholar&cbl=2042207
Yang, S., Chen, Y., & Allenby, G. (2003). Bayesian analysis of simultaneous demand and supply. Quantitative Marketing and Economics. Retrieved from http://link.springer.com/article/10.1023/B:QMEC.0000003327.55605.26
Zikmund, W., Babin, B., Carr, J., & Griffin, M. (2012). Business research methods. Retrieved from https://books.google.co.za/books?hl=en&lr=&id=ydcKAAAAQBAJ&oi=fnd&pg=PR6&dq=Zikmund&ots=Y5JkO4d7WD&sig=LBPsITCoIIHjd8yW3WMkKRNWLtI
© University of Pretoria

104
Appendices
Appendix 1: GIBS Ethical Approval Letter
Dear Mr Nicholas van Woerkom
Protocol Number: Temp2016-01287
Title: Product pack size and pricing decisions in the emerging market spaza retail
sector
Please be advised that your application for Ethical Clearance has been APPROVED.
You are therefore allowed to continue collecting your data.
We wish you everything of the best for the rest of the project.
Kind Regards,
Adele Bekker
© University of Pretoria

105
Appendix 2: Company permission letters
1: Clover
2: The Brand & Beverage Company
3: Kellogg Company South Africa
© University of Pretoria

106
© University of Pretoria

107
© University of Pretoria

108
© University of Pretoria

109
© University of Pretoria

110
© University of Pretoria