Product Market Competition, Wages and Productivity ...blnchflr/papers/ProdMarket.pdfProduct Market...
39
Product Market Competition, Wages and Productivity: International Evidence From Establishment-Level Data March 1995 September 1995 - Revised David Blanchflower * and Stephen Machin ** * Department of Economics, Dartmouth College Centre for Economic Performance, London School of Economics and NBER ** Department of Economics, University College London and Centre for Economic Performance, London School of Economics forthcoming in a special volume of the Annales d'Economie et de Statistique edited by John Abowd and Francis Kramarz. Abstract That greater product market competition has the potential to affect outcomes in labour and product markets is borne out by one of the key premises of standard economic theory which predicts that, all other things held constant, prices should be lower and efficiency enhanced by more competition. In this paper we test this notion by considering the relationship between product market competition and establishment-level wages and economic performance. We use two microeconomic data sources from Britain and Australia to consider this relationship. Our results find only a limited role for market competition to impact on wages and productivity. In British workplaces, labour productivity is not raised by more competition, whilst in Australia we can only find evidence of the conventionally expected positive impact in manufacturing workplaces. With respect to wages, the results are more consistent with the competition hypothesis, though effects are not that strong, with significant effects only being found for some of the skill groups within our samples of establishments. Hence, there is only limited support for the key hypothesis of interest that we consider. Acknowledgements We would like to thank the John Abowd, Francis Kramarz and participants in the December 1994 Paris Conference "The Microeconometrics of Human-Resource Management: Multinational Studies of Firm Practices" for a number of helpful comments.
Transcript of Product Market Competition, Wages and Productivity ...blnchflr/papers/ProdMarket.pdfProduct Market...

Product Market Competition, Wages and Productivity:International Evidence From Establishment-Level Data
March 1995September 1995 - Revised
David Blanchflower* and Stephen Machin**
* Department of Economics, Dartmouth College Centre for Economic Performance,London School of Economics and NBER
** Department of Economics, University College London and Centre for EconomicPerformance, London School of Economics
forthcoming in a special volume of the Annales d'Economie et de Statistiqueedited by John Abowd and Francis Kramarz.
AbstractThat greater product market competition has the potential to affect outcomes in labour
and product markets is borne out by one of the key premises of standard economic theorywhich predicts that, all other things held constant, prices should be lower and efficiencyenhanced by more competition. In this paper we test this notion by considering the relationshipbetween product market competition and establishment-level wages and economic performance.We use two microeconomic data sources from Britain and Australia to consider thisrelationship.
Our results find only a limited role for market competition to impact on wages andproductivity. In British workplaces, labour productivity is not raised by more competition,whilst in Australia we can only find evidence of the conventionally expected positive impact inmanufacturing workplaces. With respect to wages, the results are more consistent with thecompetition hypothesis, though effects are not that strong, with significant effects only beingfound for some of the skill groups within our samples of establishments. Hence, there is onlylimited support for the key hypothesis of interest that we consider.
AcknowledgementsWe would like to thank the John Abowd, Francis Kramarz and participants in the
December 1994 Paris Conference "The Microeconometrics of Human-Resource Management:Multinational Studies of Firm Practices" for a number of helpful comments.
1
I. Introduction
That greater product market competition has the potential to affect outcomes in labour
and product markets is borne out by one of the key premises of standard economic theory
which predicts that, all other things held constant, prices should be lower and efficiency
enhanced by more competition. In terms of individual workplaces, one should, ceteris paribus,
see wages being lower in more competitive situations and performance outcomes (like
productivity and efficiency) being improved. In this paper we take this basic prediction and
empirically evaluate its importance using establishment-level data from Britain and Australia in
the late 1980s and early 1990s.
We focus on two outcome variables of interest, wages and productivity, to assess the
competition hypothesis. At the outset, it is worth pointing out that we analyse the relationship
between these outcomes and market competition at a disaggregated level (the workplace) and
that one needs to be careful what is meant by competition at this level. We utilise unique survey
data from the questioning of managers to define our competition variable and we argue that this
provides valuable information for several reasons, not least the fact that these managers are
allowed to define the market in which they operate and compete, so that (potentially severe)
problems of market definition do not contaminate our analysis.
Whilst the separate study of market forces on wages and productivity is not new, there
are several features of our analysis that we feel should be stressed. First, as mentioned above,
we carry out an international comparison based on studying comparable microeconomic data in
Britain and Australia. Second, we consider the impact of competition on both wages and
productivity at establishment-level. Third, unlike most studies (of which we are aware) we can
consider the relationship between productivity and competition outside the manufacturing
sector: our data based on survey questioning of managers is especially useful in this regard.
Our results find only a limited role for market competition to impact on wages and
productivity. In British workplaces, labour productivity is not raised by more competition,
whilst in Australia we can only find evidence of the conventionally expected positive impact in
manufacturing workplaces. With respect to wages, the results are more consistent with the
competition hypothesis, though effects are not that strong, with significant effects only being

2
found for some of the skill groups within the samples of establishments that we consider.
Hence, there is some limited, but by no means overwhelming, support for the key hypothesis of
interest that we consider.
The rest of the paper is structured as follows. In the next section we present some
background information on what economic theory has to say about the relationship between
product market competition, productivity and wages. Section III then presents a description of
the data that we use. Section IV first considers the relationship between establishment-level
productivity and competition, and then moves on to analyse the wage-competition relationship.
Finally, section V concludes.
II. Product Market Competition, Productivity and Wages
Productivity and Competition
The initial assumption that many have made about the way in which competition affects
the productivity performance of workplaces or firms is that it enhances incentives and eliminates
various inefficiencies, thereby raising productivity. This can be justified in several ways: in
models of managerial incentives where competition raises managerial effort; where the
existence of monopoly power enables inefficiencies to be sustained; where competition leads
workers to work harder; and others (see the discussion in Nickell, 1993).
There is, however, currently not much empirical support for this proposition. And what
research does exist typically reports fairly weak evidence on the issue. In a study based on
industry-level data over time, Geroski (1990) reports a negative correlation between innovative
activity and industry concentration, and elsewhere (Geroski, 1991) reports a positive relation
between productivity and the same measure of innovative activity, thus suggesting a positive
relationship between productivity and competition. Similar (statistically quite weak) results, also
based on industry data, are reported in Haskel (1992). And some firm-level evidence of a
negative relationship between productivity and market share is presented in Nickell, Wadhwani
and Wall (1992) and Nickell (1993).
The empirical work that we present below considers the relationship between
productivity and competition at establishment-level. We feel that this is the appropriate level of

3
(dis)aggregation for considering this issue. And, we present evidence from comparable
establishment data in two countries (Britain and Australia) in the hope of providing a stronger
test than that merely based on a single country study as, if one can identify a link between
productivity and competition, then presumably one would expect to see similar patterns (e.g.
across industries) in different countries.
Wages and Competition
Predictions about the relationship between wages and competition have received more
attention and there are numerous models of the labour market (e.g. rent-sharing models,
efficiency wage models, effort bargaining models) that predict wages will be higher (lower) in
less (more) competitive situations. This is because less competition generates a surplus, to
which workers have a claim of a share.
According to the competitive model, an employer is a wage-taker and must set the wage
rate which gives workers the market level of utility. In a purely competitive world, the surplus
cannot exceed the amount which is just required to compensate the agents for their efforts.
There is no scope for bargaining; employers are unable to appropriate any of the returns to an
improvement in their firm's prosperity; there are no rents. However, objections to this perfectly
competitive view have been voiced for many years.
In an early attack on the traditional analysis, Sumner Slichter (1950) argued that a
competitive model fails to explain the empirical evidence that apparently homogenous types of
employee earn significantly different amounts in different industries. His data, drawn from the
US manufacturing sector, showed that wages appeared to be positively correlated with various
measures of the employer's 'ability to pay'. Slichter concluded that this correlation provided
prima facie evidence against a conventional competitive model.
Early UK work by MacKay et al. (1971) echoed such sentiments. After examining the
personnel records of 75,000 manual workers in 66 engineering plants, the authors were led to
reject the validity of the competitive model. They found substantial, persistent wage differentials
which could not be explained satisfactorily by non-pecuniary factors.
Recent research into this issue in the US by Dickens and Katz (1987), Krueger and
Summers (1987, 1988), Katz and Summers (1989), Allen (1994) and Blanchflower, Oswald and

4
Sanfey (1994) has reached the same conclusions using better data than were available in
Slichter's time. These studies show that there are unexplained industry wage differentials and,
in some cases, examine the correlation between wage levels and industry profitability. Abowd
and Lemieux (1993) and Christofides and Oswald (1992) also find effects from profitability on
wages, after controlling for fixed effects, using union contract data for Canada. Related
work, often with panel data, has been done on European labor markets. This includes research
by, for example, Abowd and Allain (1994), Abowd, Kramarz and Margolis (1994), Beckerman
and Jenkinson (1990), Carruth and Oswald (1989), Holmlund and Zetterberg (1991), Denny
and Machin (1991), Hildreth and Oswald (1992) and Nickell and Wadhwani (1990). All find
evidence for some kind of ability-to-pay effect on wages. In Blanchflower, Oswald and Garrett
(1990), data from the Workplace Industrial Relations Survey of 1984 (WIRS2) was used to
examine the forces that determine wages in Great Britain. Pay appeared to be shaped by both
inside and outside forces: an establishment's financial performance and its oligopolistic position
influenced pay as did the state of the local labor market as measured by the local area
unemployment rate.1 Profitable employers appeared to pay significantly more, ceteris paribus,
than did unprofitable ones. Blanchflower and Oswald (1988) also presents questionnaire
evidence using data from the same source that is also consistent with this view.
III. Data Description
We consider evidence based on data from two (broadly) comparable cross-sectional
surveys of establishments in Britain (in 1990) and Australia (mostly in 19902). Before
considering the actual data that we use, it is however worth pointing out that at the times of the
surveys both countries were at very similar points in the economic cycle. Figure 1 plots
unemployment rates over time in the two countries to illustrate this and shows very similar
unemployment rates and very similar points of the business cycle in both countries in 1990.
This is important if we are to draw cross-country comparisons from our empirical work.
1For more on this see Blanchflower and Oswald (1994).
2The AWIRS survey was mostly conducted in 1990, with interviews taking place in the periodfrom November 1989 to May 1990.

5
The British and Australian Workplace Industrial Relations Surveys
To date, there have been three nationally representative surveys of industrial relations
issues in British workplaces with at least 25 employees which were conducted in 1980, 1984
and 1990 (more details are in Millward et al., 1992). The surveys have been used quite
extensively by industrial relations researchers and by labour economists to analyse a range of
issues (see Millward, 1992, for a description of this research). They are very rich in terms of
information on industrial relations issues, but also contain various questions of interest to
economists. The 1990 survey that we use here (WIRS3) contains information on 2061
workplaces.
The Australian Workplace Industrial Relations Survey (AWIRS) contains data on 2004
workplaces with at least 20 employees. It is described in some detail in Callus et al. (1992). The
differences in sampling arrangements between WIRS3 and AWIRS concern the size cut-off (25
versus 20 employees) and that WIRS3 excludes mining establishments. We use comparable
samples by excluding Australian mining workplaces and those with less than 25 workers. Some
of the questions asked in AWIRS are directly comparable with those from the British surveys,
though there are, in some cases, different wordings and different questions asked. Our work
attempts to ensure comparability of both questions and samples used in our empirical work
below. Fuller details on sampling frames and the overall nature of both surveys are given in the
Data Appendix.
Basic Data Description
In terms of the data we consider, WIRS3 and AWIRS asked comparable questions on
establishment-level productivity performance, and on the extent of competition faced by the
establishment. The precise questions asked to the principal management respondent in both
surveys were:
Labour Productivity
"In your opinion how does the level of labour productivity here compare with othersimilar workplaces
A lot higherA little higherAbout the sameA little lowerA lot lower"

6
Competition
"Is the market dominated by your organisation, are there only a few competitors or arethere many competitors (Few equals five or a lower number)
Organisation dominates marketFew competitorsMany competitors"
In Table 1 we report some descriptive data on the market competition variable. The
distribution displays a similar pattern across countries, with just over 60 percent of respondents
stating that they faced five or more competitors across all sectors, and around 50 percent in
manufacturing. Table A1 in the Appendix gives a more detailed industry breakdown and shows
a very similar cross-country distribution of the extent of product market competition. As such it
seems that more competitive industries are likely to be the same ones in each country (a simple
correlation coefficient for the one-digit industries in the Table = .798).
As the competition variable is an unconventional one, it is worth discussing its relative
advantages and disadvantages as compared to the more orthodox ones that are often utilised by
economists (e.g. firm market share or industrial concentration). The first point to note is that a
considerable problem with the latter is that they are usually based on a rigid definition of the
market corresponding to some kind of industrial classification (e.g. 3-digit industry). This can
be very problematic for a number of reasons, including the fact that firms are often diversified
and may well compete across several industries and that different levels of disaggregation may
delineate markets for different firms. A key advantage of our measure is that it lets managers
define their own market. A second advantage is that, despite the subjective nature of the
questioning, the variable does actually reflect what managers think and, as such, provides a very
useful counterpoint to more frequently utilised measures of competition. A third advantage is
that the variable applies equally well outside of the manufacturing sector, and, as very little is
known about competitive pressures (and their economic effects) in the service sector, this is very
useful and we consider differences in manufacturing and non-manufacturing establishments in
our empirical work.
Of course, the variable also has its limitations. It provides only qualitative information
and one may think the cut-off point of five competitors to be somewhat arbitrary. On the latter

7
it is somewhat reassuring that some work in Industrial Organization (Bresnahan and Reiss,
1991) finds that five is an important threshold number in terms of defining market power. It is
also reassuring that, as the last row of Table 1 testifies, the measure is correlated with industry
concentration measures in manufacturing.3
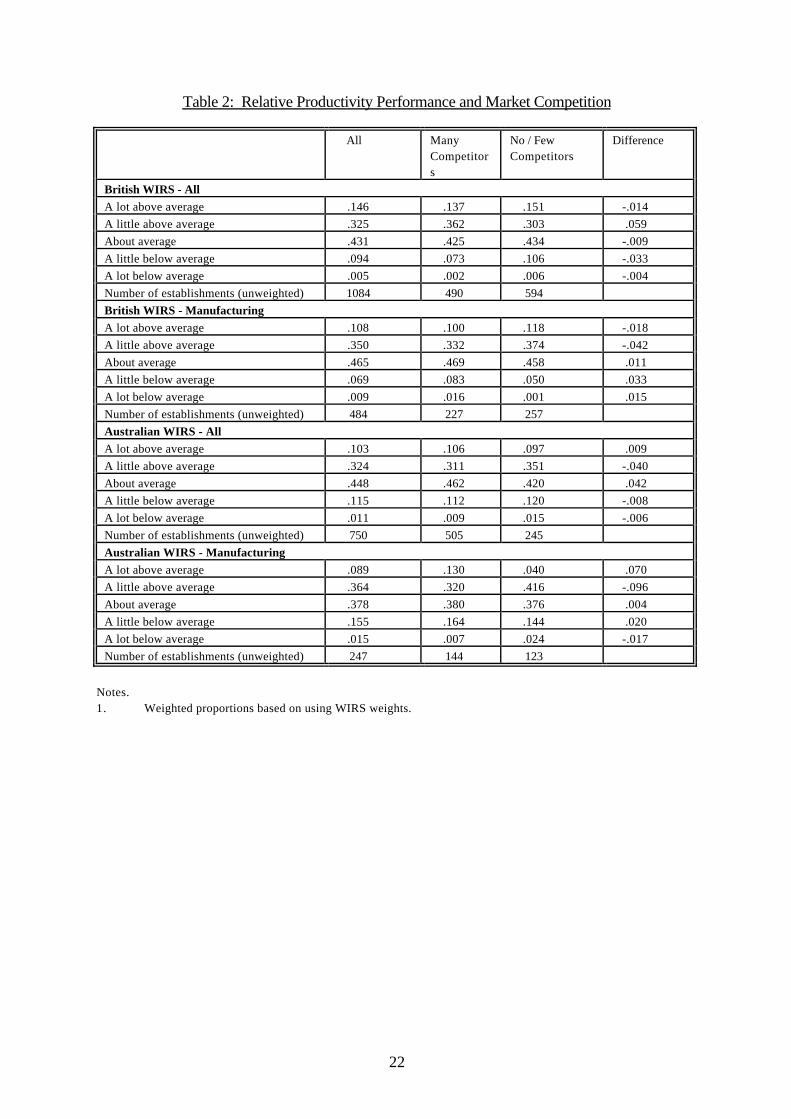
Turning to the relative productivity variable, Table 2 reports the distribution of responses
given by British and Australian managers, for all establishments and for manufacturing
establishments separately (cross-industry comparisons for both countries are given in Table A2
of the Data Appendix). The reason for reporting statistics for the manufacturing sector is that,
as in the case of the competition variable, data on productivity is usually only available in
manufacturing (see Griliches, 1992, and Gordon, 1992, for discussions of the difficulties
involved in measuring productivity in the service sector). Again, before considering the
descriptive statistics in the Table it is worth pointing out the relative merits and shortcomings of
this variable.
There are notorious difficulties in accurately measuring productivity. For example, the
usual measure used in the existing literature is some kind of value added measure which is
typically normalised on employment or total employee hours. There are well known difficulties
with measuring value added, and associated problems with deflating by some suitable price
index to obtain an output measure. Some work has used physical output measures (e.g. studies
of the cement industry) but this work then suffers from the shortcoming that such measures are
only available for a small number of very specific sectors. The measure that we utilise does not
suffer from these problems as it actually asks managers what they think their labour
productivity is, and therefore provides a very useful counterpoint to the more conventional
measures that have been used in existing work. Of course, it also suffers from the potential
problems generated by it being a qualitative index which contains less information than
continuous measures.
Turning to the actual statistics in Table 2, one can see a pattern that managers are more
likely to report about or above average productivity levels in both surveys. In terms of the
3Industrial concentration data is only available for manufacturing industries in both countries.

8
overall distribution there is also very little difference between responses in the sub-samples of
manufacturing establishments and the full samples.
The last three columns of the Table report the distribution of responses conditional on
the competition variable (defined by a dummy variable equal to one for establishments with
many competitors and zero for those with few or no competitors). Some noticeable differences
emerge. In the British survey, there is little difference between managers' responses across
establishments that face many competitors as compared to those which face few or none; this is
also the case in the manufacturing sub-sample. On the other hand, there is some difference in
the Australian survey, especially in manufacturing.
The second issue of interest in this paper concerns the relationship between wages and
competition, so Table 3 reports average weekly pay levels for the various skill groups within the
establishment that each survey contains.4 The pay data in the Table point to the expected
pattern across occupational groups in both countries, but also display an interesting pattern
when one conditions on the market competition variable. Pay is almost always lower in
establishments that face many competitors, as the pay gap in the final column shows. This is
only not the case for foremen/supervisors in Britain and for two of the higher grade non-manual
groups in the Australian survey (para-professionals and professionals).
The raw data presented in this section suggests that the distribution of product market
power displays a very similar cross-industry pattern in both Britain and Australia. In terms of
its relationship with productivity and wages, there is little evidence of much of a link with
establishment-level productivity, but wages seem to be lower where there is more competition.
In the next section of the paper we subject this to more rigorous testing as we report
econometric models of the determinants of productivity and wages at establishment-level.
4It is worth pointing out that, unlike the competition and productivity variables, the payquestions are not the same across the two surveys. In the British WIRS they are the medianwage of the majority sex worker in the establishment and are available for five skill groups(unskilled, semi-skilled and skilled manual workers, clerical workers and supervisory staff andforemen). In the Australian survey they are available as the minimum, mode and maximumwage for workers in eight skill groups (labourers and unskilled workers, plant and machineoperators, sales and personal service workers, clerks, tradespersons, para-professionals,professionals and managers). These wage definitions are discussed more below.

9
IV. Empirical Analysis
Productivity Equations
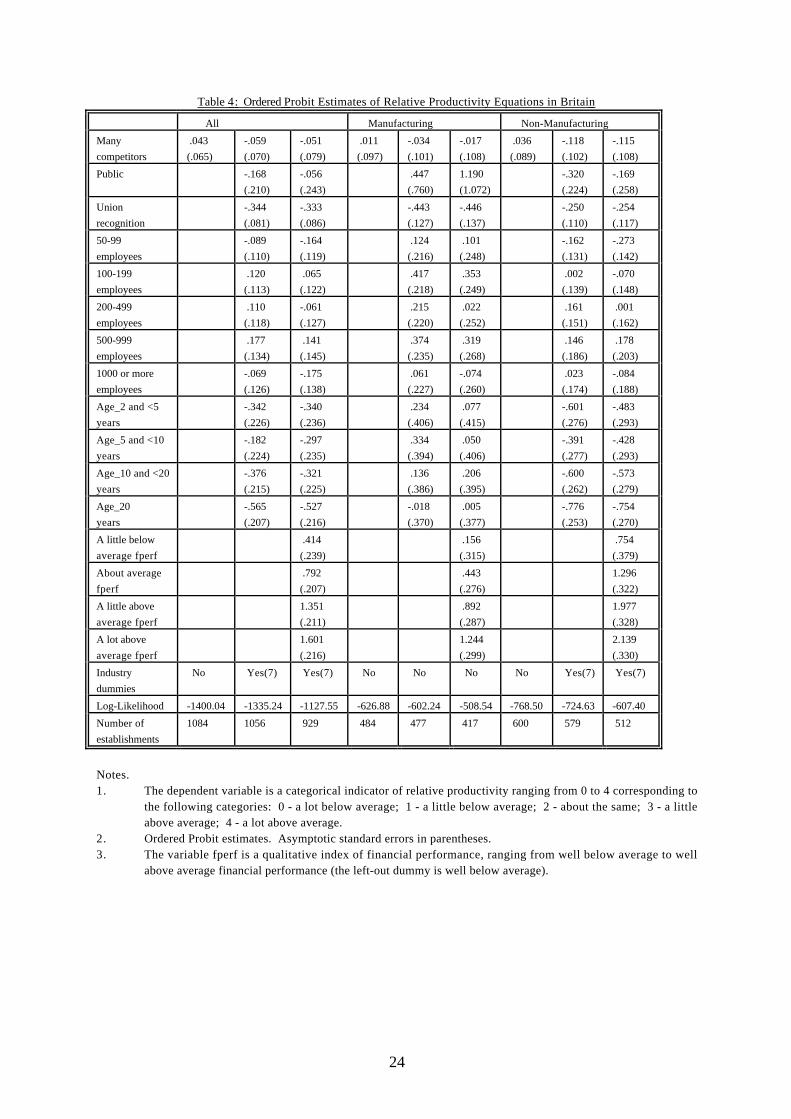
In Tables 4 and 5 we report Ordered Probit estimates of the determinants of productivity
for the two surveys.5 As far as possible we have tried to estimate comparable specifications in
the two countries. For each country we report separate results for the trading sector -- we
exclude public sector non-trading establishments but include those in public sector trading. We
then report results separately for manufacturing and non-manufacturing samples.
Starting with Table 4 for Great Britain, in column 1 we include only a constant and a
dummy variable set to one if the establishment faces many competitors, and zero otherwise. The
estimated coefficient on this variable is insignificantly different from zero: it remains so in
column 2 when we add controls for the public sector, whether unions were recognised at the
workplace, establishment size, age and industrial sector. Furthermore, the estimated coefficient
remains insignificant in column 3 when we add four dummy variables reflecting management's
view of the financial performance of the establishment.
Analogous results to those reported in columns 1-3 are found for the manufacturing
sector in columns 4-6 and non-manufacturing in columns 7-9. Again, no significant
competition effects are isolated. However, one interesting result is the finding that unions have a
negative effect on productivity in all specifications and all sectors. This runs contrary to the
claim for the U.S. in Freeman and Medoff (1984) that unions have a positive impact on
productivity but is consistent with the firm level results for the U.K. of Pencavel (1977),
Edwards (1987) and the industry level results of Knight (1989) and Davies and Caves (1987).
An obvious question that comes to mind is whether there is much variation in the size of
the estimated union effects across sectors given the higher level of union recognition in
manufacturing compared with services (38 percent and 45 percent in our sample respectively).
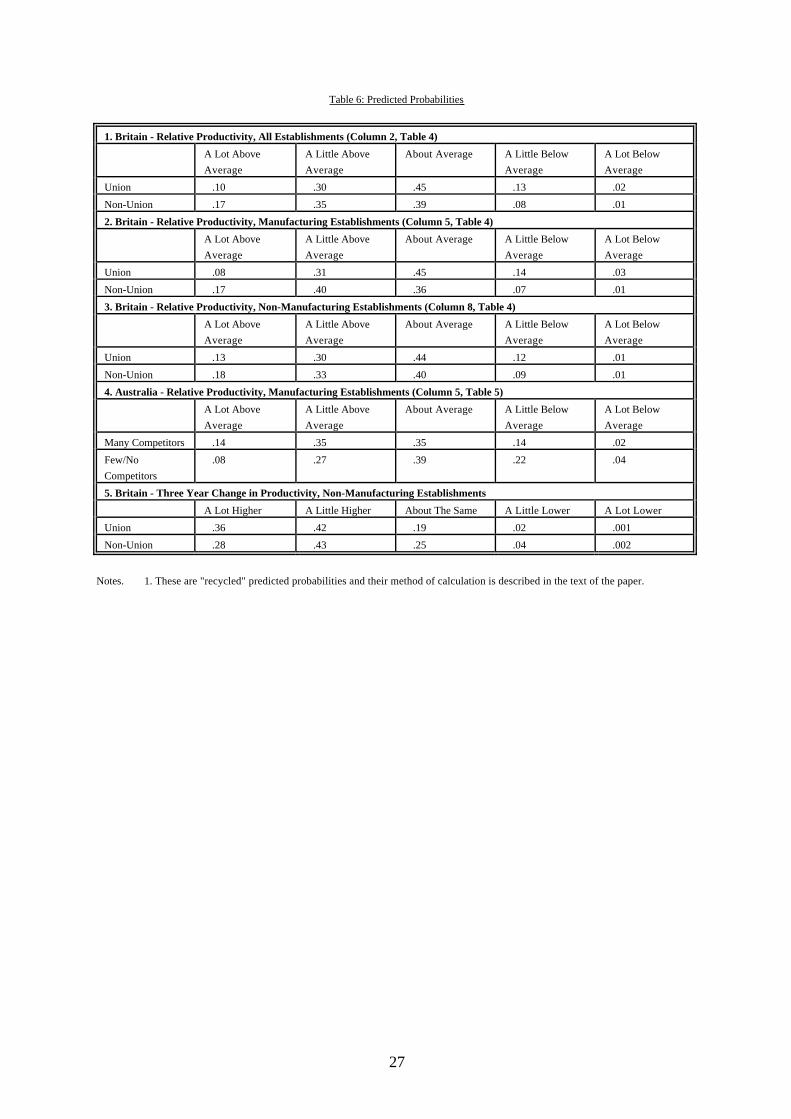
In part a) of Table 6 we report the weighted mean of the productivity variable plus a series of
predicted probabilities based on the level of productivity at the workplace compared with similar
5The qualitative dependent variable is ordered from 0 to 4, with 0 corresponding to the lowestproductivity level and 4 to the highest. Hence, a positive coefficient in the Ordered Probitmodels means higher productivity.
10
workplaces. The method used is called the "method of recycled predictions" in which we vary
characteristics of interest across the whole data set and then average the predictions. That is, we
have data on both union and non-union workplaces: we will first pretend that all workplaces in
the data file are unionized holding their other characteristics constant. We then calculate the
probability of each outcome. Next we pretend that all workplaces in the file are non-union,
again holding their characteristics constant. We then calculate the probability of each outcome.
The difference between the two sets of probabilities, then, is the difference due to union status
holding other characteristics constant.
Overall, we found a probability of .40 in union workplaces that productivity was a lot or
a little above average compared with .52 for non-union workplaces. Conversely, the
probabilities are .15 and .09 respectively that the manager reported that productivity was a lot or
a little below average. The differences in the predicted probabilities between union and non-
union workplaces were greater in manufacturing than in non-manufacturing: in the former case
the probability of reporting that productivity was a lot or a little above average was .39 for union
workplaces compared with .57 for non-union workplaces whereas in non-manufacturing the
figures were .43 and .51 respectively. Similar stories apply at the lower end for the below
average categories also.
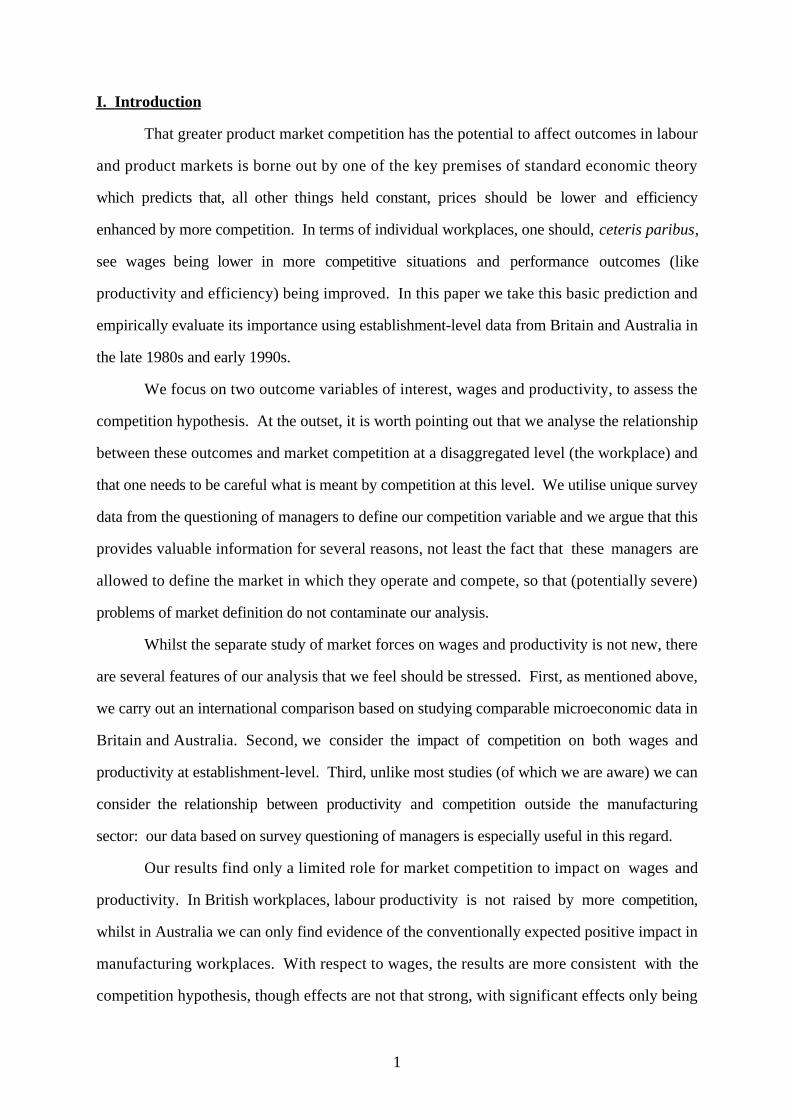
Also available in the British survey of 1990 is the following question.
"In your opinion how does the level of productivity here compare with what it was 3years ago?
A lot higher? A little higher? About the same?A little lower? A lot lower?"
The (weighted) responses to this question are reported in Table 7.
Table 7: Productivity Growth By Union Status
Responses: All Establishments Manufacturing Non-ManufacturingUnion Non-Union Union Non-Union Union Non-Union
A lot higher .33 .30 .22 .33 .39 .29A little higher .44 .36 .51 .38 .41 .36About the same .17 .31 .19 .23 .17 .34A little lower .05 .02 .07 .05 .03 .01A lot lower .01 .001 .01 - .01 .001
11
There is existing evidence for the UK in the 1980s that unions had a positive impact on
productivity growth6, at least in some years, and Table 7 also shows some tendency for
managers in union workplaces to report more favourably on the change in productivity than is
true in non-union workplaces. This is especially apparent in non-manufacturing (see also
Machin and Stewart, 1994, who study productivity growth at the end of the 1980s using this
variable). In an attempt to explore the issue of whether unions had a negative impact on
productivity growth we estimated a series of Ordered Probit equations using these responses as
the dependent variable.
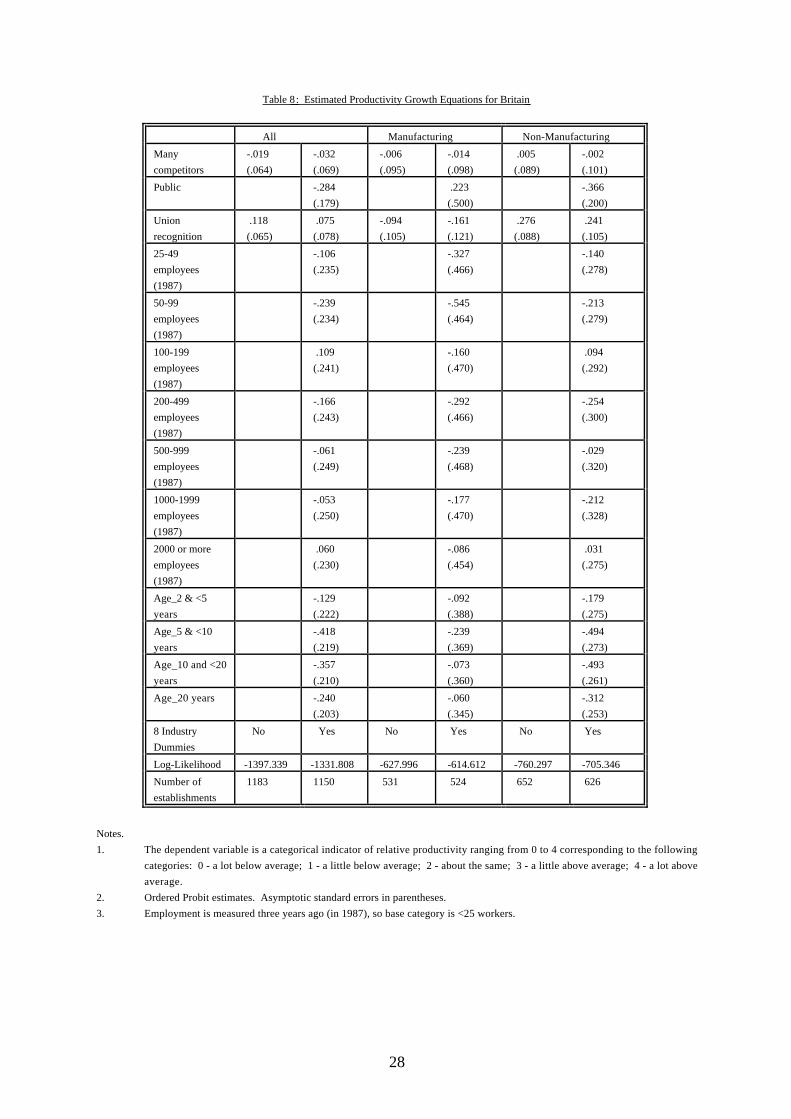
Results are reported in Table 8. The union variable is insignificant overall and in
manufacturing, but is significant and positive in non-manufacturing. In panel 5 of Table 6 we
also report the predicted probabilities derived from the final column of Table 8 for non-
manufacturing using the method of recycled predictions outlined above. The predicted
probability of reporting that productivity was a lot higher than it had been three years earlier was
.36 in union establishments compared with .28 in non-union.
Hence, we have evidence of a negative union effect on productivity, coupled with (in
non-manufacturing) some evidence of a relative productivity improvement in the late 1980s.
This is consistent with stories that stress productivity improvements as a consequence of a
weakened union movement and with other empirical evidence on this issue in the UK (e.g. see
Gregg et al.'s, 1993, evidence that productivity growth was higher in 1988-89 in unionized
firms).
We now turn to Australia. In Table 5 we report a series of Ordered Probit estimates
where the dependent variable is the same as used in Table 4 for Great Britain. Once again we
report overall results for the traded sector as well as separately by industrial sector, with and
without a series of control variables. We find evidence that productivity is higher where the
establishment produces products for export.7 Given the high levels of unionization itself and of
6See Metcalf (1990) and Gregg et al. (1993), among others.
7This positive export performance effect in the Australian equations is particularly pronouncedin non-manufacturing. In the British survey, based on a much smaller sample of around 350establishments from the financial manager's questionnaire, we also considered a variable based

12
spillovers of agreements across sectors in Australia it is perhaps unsurprising that we find no
evidence of any union productivity effects.
As in the case of Great Britain overall the coefficient on the 'many competitors' variable
is insignificant whether we include a group of control variables or not. There is weak evidence
in non-manufacturing that productivity is actually lower where there are many competitors ('t' =
1.85). In manufacturing, which accounts for around a third of our sample, we find evidence that
the coefficient on this variable is significantly positive ('t' = 2.40 in column 3). How big are the
effects? The predicted probabilities calculated in the same way as above are reported in panel 4
of Table 6. The predicted probability of reporting that productivity was a lot a or a little above
average compared with similar workplaces was .49 in competitive workplaces compared with .35
in non-competitive ones.
In both Australia and Great Britain we do find some evidence that relative productivity is
higher where profits are higher. We do have to use somewhat different variables in the two
countries. In Britain respondents were asked to report on how the financial performance at their
workplace compared with similar workplaces -- the excluded category was 'a lot below average'.
Productivity appeared to improve with financial performance. In Australia we used a variable
which showed the rate of return on capital for approximately two thirds of our sample.
Productivity was especially high in workplaces that had rates of return of 15 percent and more.
Despite obvious worries about the endogeneity of this variable, this is potentially another way of
picking up non-competitive behaviour and does suggest that more profitable establishments
have higher productivity levels. Of course, however, this may be due to factors other than
competitive pressures so one should probably not read too much into this result.
Wage Equations
Data in both WIRS3 and AWIRS are available on wages. As already noted above (in
footnote 4) the questions asked are rather different across the surveys. In the British case the
question was asked separately for five groups of workers -- unskilled, semi-skilled and skilled
manuals, clericals and supervisors. Responses are available for a category of worker only if
on whether the main market for the establishment's products or services was primarily exportbut could find no significant effect on productivity.

13
there are at least five workers of that type at the workplace. First, respondents were asked to
report whether the majority group in the category were men or women: then they were asked "If
all the employees were listed individually in order of their gross weekly earnings (including any
bonuses or overtime) which of the ranges on this card would apply to the employee in the
middle of such a list?". Respondents were then offered eleven possible alternative ranges of
earnings for each group (this includes open ended upper and lower bands).
In the case of Australia management respondents were asked to report the gross weekly
earnings (before taxation and any deductions) of full-time permanent employees in each of eight
occupational groups -- labourers and unskilled manuals, plant and machine operators and
drivers, sales and personal service workers, clerks, tradespersons, para-professionals,
professionals and managers. Twelve possible alternative ranges of earnings were available for
each group (also including open ended upper and lower bands). Respondents were asked to
identify three separate responses for each group -- "lowest", "most" and "highest". To be as
comparable as we can with the data from WIRS3 we used the information from the "most"
category.
For empirical implementation in both countries mid-points were allocated to the ranges
and the end classes were closed in an inevitably ad hoc way. The results were relatively stable
to differences in values allocated to the open upper class interval.
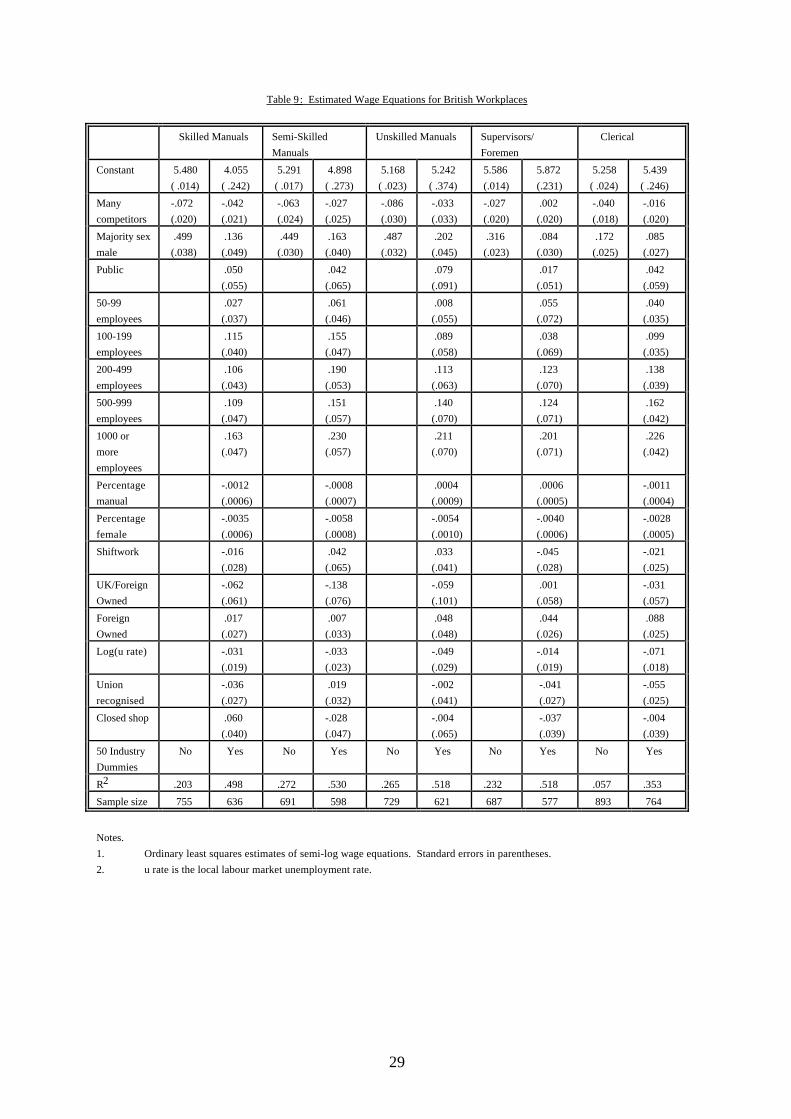
In Table 9 we report a series of log earnings equations for Great Britain. The controls
have been used in a number of earlier papers and are by now relatively standard and
uncontroversial (see Blanchflower (1984) using WIRS1, Blanchflower, Oswald and Garrett
(1990) for WIRS2 and Blanchflower and Oswald (1994) for WIRS1, 2 and 3). As the question
asks for the manager at the workplace to report a wage of the majority sex worker, we include a
dummy variable to indicate if this worker is male or female. In every equation earnings are
lower if majority sex worker in the occupation was female, even controlling for the proportion of
females in the workforce as a whole. In four of the five skill groups there is some evidence that
earnings are lower where there are many competitors when no other controls (except the
majority sex male dummy variable) are included -- the exception is supervisors ('t' = 1.38).
When controls are added for establishment size, union recognition, workforce structure,

14
shiftwork, industry, foreign ownership and the local area unemployment rate then the coefficient
on the 'many competitors' variable becomes insignificant in the unskilled manual, semi-skilled
manual and clerical equations. However, it remains significant in the skilled worker equation ('t'
= 2.0).
In Table 10 we report estimated wage equations for eight groups of workers for
Australia. In six of the eight cases the many competitors variable is significantly negative in the
absence of control variables: the exceptions are professionals and para-professionals. We then
add a series of controls which are as comparable to those we used above for Great Britain as we
are able to construct. Once we add these control variables the coefficient on the 'many
competitors' variable is significant only for clericals ('t' = 2.14) and weakly so for tradespersons
('t' = 1.58). As in the case of Great Britain wages are lower the higher the proportion of females
in the workforce. Wages tend to be higher for non-manuals and in foreign-owned firms.
Having a union present appears to convey a premium for only unskilled manual workers.
Somewhat unusually given the large body of literature that has documented a positive
relationship between earnings and establishment size (see, for example, Brown, Hamilton and
Medoff (1990)), and in contrast to the results reported in Table 9 for Great Britain, we find no
evidence among manual workers that wages are correlated with establishment size in Australia.
Among the non-manuals there is evidence of a positive correlation for sales workers, clericals
and managers, but not for para-professionals or professionals.
Another aspect of competitive behaviour is export performance. In the Australian survey
respondents are asked about whether their principal sales activity is in the export market. In the
British data only a sub-set of respondents, the financial managers, are asked a question about
the nature of their market so that sample sizes become small (particularly for estimating
regression models).8 We have, however, considered the potential role for better export
performance to influence wages. Despite the small sample sizes in the British results, there is
8The financial manager questionnaire was conducted in 489 of the total sample of 2061establishments in WIRS3.
15
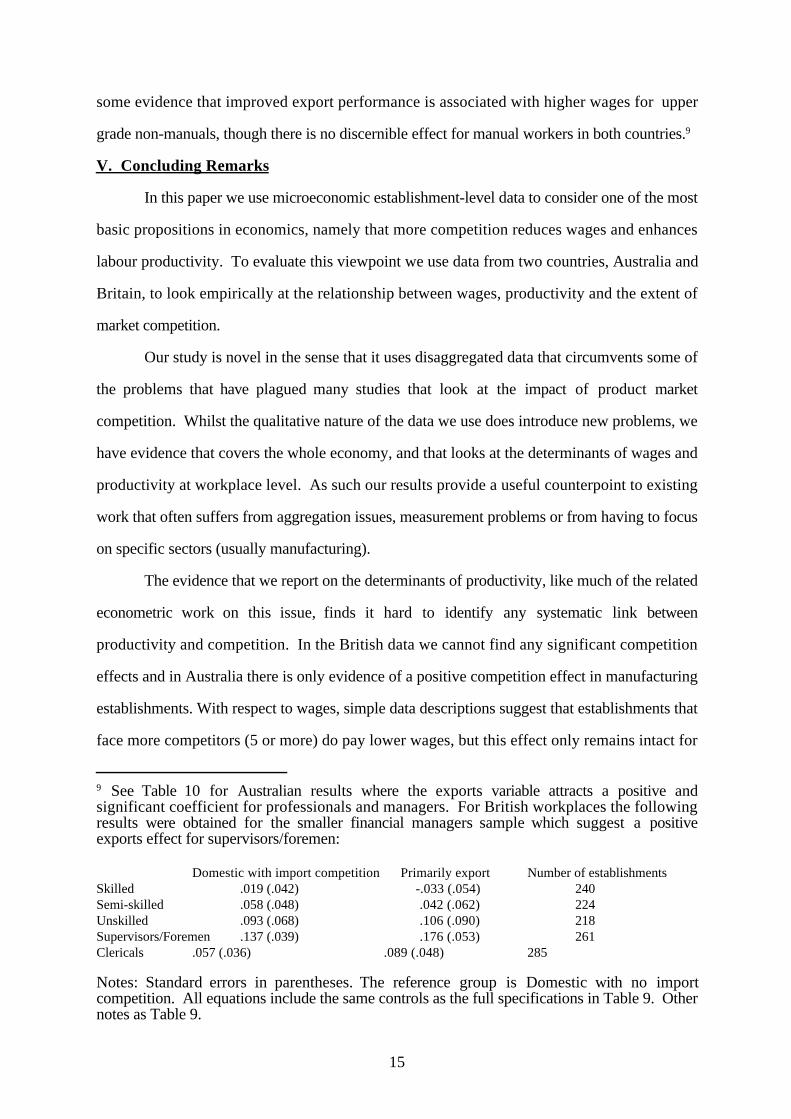
some evidence that improved export performance is associated with higher wages for upper
grade non-manuals, though there is no discernible effect for manual workers in both countries.9
V. Concluding Remarks
In this paper we use microeconomic establishment-level data to consider one of the most
basic propositions in economics, namely that more competition reduces wages and enhances
labour productivity. To evaluate this viewpoint we use data from two countries, Australia and
Britain, to look empirically at the relationship between wages, productivity and the extent of
market competition.
Our study is novel in the sense that it uses disaggregated data that circumvents some of
the problems that have plagued many studies that look at the impact of product market
competition. Whilst the qualitative nature of the data we use does introduce new problems, we
have evidence that covers the whole economy, and that looks at the determinants of wages and
productivity at workplace level. As such our results provide a useful counterpoint to existing
work that often suffers from aggregation issues, measurement problems or from having to focus
on specific sectors (usually manufacturing).
The evidence that we report on the determinants of productivity, like much of the related
econometric work on this issue, finds it hard to identify any systematic link between
productivity and competition. In the British data we cannot find any significant competition
effects and in Australia there is only evidence of a positive competition effect in manufacturing
establishments. With respect to wages, simple data descriptions suggest that establishments that
face more competitors (5 or more) do pay lower wages, but this effect only remains intact for
9 See Table 10 for Australian results where the exports variable attracts a positive andsignificant coefficient for professionals and managers. For British workplaces the followingresults were obtained for the smaller financial managers sample which suggest a positiveexports effect for supervisors/foremen:
Domestic with import competition Primarily export Number of establishmentsSkilled .019 (.042) -.033 (.054) 240Semi-skilled .058 (.048) .042 (.062) 224Unskilled .093 (.068) .106 (.090) 218Supervisors/Foremen .137 (.039) .176 (.053) 261Clericals .057 (.036) .089 (.048) 285
Notes: Standard errors in parentheses. The reference group is Domestic with no importcompetition. All equations include the same controls as the full specifications in Table 9. Othernotes as Table 9.

16
some of the skill groups that we consider when we control for various other factors. The same
is true of firms who mainly operate in export markets, where we detect positive wage effects for
some non-manual workers in both countries, but no important effects for manual employees.
Overall the empirical work that we present is suggestive of rather limited support for the
competition hypothesis. Whilst there is some evidence of a product market competition effect
in some situations, it seems that other factors, especially those related to labour market outcomes
(especially unionization, worker characteristics and, in Britain, employer size), are more
important determinants of wages and productivity in British and Australian workplaces.

17
References
Abowd, J. and Allain, L. (1994), 'Compensation structure and product market competition', Cornell University mimeo.
Abowd, J., F. Kramarz and D. Margolis (1994), 'High-wage workers and high-wage firms',National Bureau of Economic Research Working Paper No. 4917.
Abowd, J. and Lemieux, T. (1993), 'The effects of product market competition on collective bargaining agreements: The case of foreign competition in Canada', Quarterly Journal
of Economics 108, 983-1014.
Allen, S.G., (1995), 'Updated Notes on the Interindustry Wage Structure', Industrial andLabor Relations Review, 48(2), pp. 305-321.
Beckerman, W. and Jenkinson, T.J., (1990), 'Wage Bargaining and Profitability:A Disaggregative Analysis', Labor, 4, 57-77.
Blanchflower, D.G. (1984), 'Union relative wage effects; a cross-section analysis usingestablishment data', British Journal of Industrial Relations, November 1984, pp. 311-332.
Blanchflower, D.G. and Oswald, A.J., (1988), 'Internal and External Influences Upon Wage Settlements', British Journal of Industrial Relations, 26, 363-370.
Blanchflower, D.G. and Oswald, A.J., (1994), The Wage Curve, MIT Press: Cambridge, MA.
Blanchflower, D.G., Oswald, A.J. and Garrett, M.D., (1990), 'Insider Power in Wage Determination', Economica, 57, 363-370.
Bresnahan, T. and Reiss, P. (1991), 'Entry and competition in concentrated markets',Journal of Political Economy, 99, 977-1009.
Brown, C., J. Hamilton and J. Medoff (1990), Employers Large and Small, Harvard UniversityPress: Cambridge, MA.
Callus, R., Morehead, A., Cully, M. and J. Buchanan (1991), Industrial Relations at Work. The Australian Workplace Industrial Relations Survey, Australian Government
Publishing Service, Canberra, Australia.
Christofides, L.N. and Oswald, A.J., (1992), 'Real Wage Determination and Rent-Sharing inCollective Bargaining Agreements', Quarterly Journal of Economics, 107, 985-1002.
Davies, S. and R. Caves (1987), Britain's Productivity Gap, Cambridge University Press for NIESR.
Denny, K. and Machin, S., (1991), 'The Role of Profitability and Industrial Wages in Firm-Level Wage Determination', Fiscal Studies, 12, 34-45.
Dickens, W.T. and Katz, L.F. (1987), 'Inter-Industry Wage Differences and IndustryCharacteristics', in Lang, K. and Leonard, J., Unemployment and the Structure of LaborMarket, Basil Blackwell: Oxford.
Edwards, P.K. (1987), Managing the factory, Basil Blackwell, Oxford.
Freeman, R. and J. Medoff (1984), What do unions do?, Basic Books, New York.

18
Geroski, P. (1990) Innovation, Technological Opportunity and Market Structure, OxfordEconomic Papers, 42, 586-602.
Geroski, P. (1991), 'Innovation and the sectoral sources of UK productivity growth', EconomicJournal, 101, 1438-51.
Gordon, R. (1992), 'Productivity in the transportatation sector', in Z. Griliches (ed.) Output Measurement in the Service Sectors, Chicago: University of Chicago Press.
Gregg, P., Machin, S. and D. Metcalf (1993), 'Signals and Cycles: Productivity growth and changes in union status in British companies, 1984-9', Economic Journal, 103, 894-907.
Griliches, Z. (1992) Output Measurement in the Service Sectors, Chicago: University ofChicago Press.
Haskel, J. (1992), 'Imperfect competition, work practices and productivity growth', OxfordBulletin of Economics and Statistics, 53, 265-79.
Hildreth, A. K. G. and Oswald, A.J. (1992), 'Rent-Sharing and Wages: Evidence fromCompany and Establishment Panels', mimeo, Oxford University.
Holmlund, B. and Zetterberg, J. (1991), 'Insider Effects in Wage Determination: Evidence from Five Countries', European Economic Review, 35, 1009-1034.
Katz, L.F and Summers, L.H., (1989), 'Industry Rents: Evidence and Implications', BrookingsPapers on Economic Activity (Microeconomics), 209-275.
Knight, K.G. (1989), 'Labour productivity and strike activity in British manufacturingindustries: some quantitative evidence', British Journal of Industrial Relations, 27(3), pp.365-374.
Krueger, A.B. and Summers, L.H., (1987), 'Reflections on the Inter-Industry Wage Structure',in Lang, K. and Leonard, J., Unemployment and the Structure of Labor Markets, BasilBlackwell.
Krueger, A.B. and Summers, L.H., (1988), 'Efficiency Wages and the Inter-Industry Wage Structure', Econometrica, 56, 259-293.
Machin, S. and Stewart, M. (1994), 'Productivity growth at the end of the 1980s', mimeo,University College London.
MacKay, D.I., Boddy, D., Brack, J., Diack, J.A. and Jones, N. (1971), Labour Markets UnderDifferent Employment Conditions, George Allen and Unwin: London.
Metcalf, D. (1990), 'Union presence and productivity in British manufacturing industry: areply to Nolan and Marginson', British Journal of Industrial Relations, 28(2), pp. 249-266.
Nickell, S. (1993) Competition and Corporate Performance, Centre for Economic PerformanceDiscussion Paper No. 182.
Nickell, S. and D. Nicolitsas (1994) Wages, Effort and Productivity, Centre for EconomicPerformance Discussion Paper No. 219.
Nickell, S. and Wadhwani, S., (1990), 'Insider Forces and Wage Determination', EconomicJournal, 100, 496-509.

19
Nickell, S., Wadhwani, S. and M. Wall (1992), 'Productivity growth in UK companies, 1975-86', European Economic Review, 36, 1055-92.
Pencavel, J. (1977), 'The distributional and efficiency effects of trade unions in Great Britain',British Journal of Industrial Relations, 15(2), pp. 137-156.
Slichter, S., (1950), 'Notes on the Structure of Wages', Review of Economics and Statistics,32, 80-91.

20
Figure 1: Standardised UK and Australian Unemployment Rates, 1974-1993
199319911989198719851983198119791977197519732
4
6
8
10
12
14UK Unemployment RateAustralian Unemployment Rate
Figure 1: Standardised UK and Australian Unemployment Rates, 1974-1993
Year
Per
cent
Source: OECD Economic Outlook, 56, December 1994.

21
Table 1: Product Market Competition Measures
British WIRS Australian WIRS All Manufact-
uring All Manufact-
uringNo Competitors .086 .056 .039 .015Few Competitors .304 .403 .309 .450Many Competitors .611 .541 .652 .535Number of Establishments(Unweighted)
1223 544 1125 355
Estimated Coefficient FromLogit Regression of ManyCompetitors DummyVariable on IndustryConcentration (standarderror)
- -.840 (.427)
- -1.461 (.840)
Notes.
1. All refers to all private sector plus commercial public sector establishments.2. Australian data excludes mining and establishments with less than 25 employees to
ensure comparability.3. The industry concentration data are the 3-digit industry 5-firm concentration ratio for
Britain and the 2-digit 4-firm concentration ratio for Australia.4. Proportions are weighted using survey weights.
22
Table 2: Relative Productivity Performance and Market Competition
All ManyCompetitors
No / FewCompetitors
Difference
British WIRS - All
A lot above average .146 .137 .151 -.014
A little above average .325 .362 .303 .059
About average .431 .425 .434 -.009
A little below average .094 .073 .106 -.033
A lot below average .005 .002 .006 -.004
Number of establishments (unweighted) 1084 490 594
British WIRS - Manufacturing
A lot above average .108 .100 .118 -.018
A little above average .350 .332 .374 -.042
About average .465 .469 .458 .011
A little below average .069 .083 .050 .033
A lot below average .009 .016 .001 .015
Number of establishments (unweighted) 484 227 257
Australian WIRS - All
A lot above average .103 .106 .097 .009
A little above average .324 .311 .351 -.040
About average .448 .462 .420 .042
A little below average .115 .112 .120 -.008
A lot below average .011 .009 .015 -.006
Number of establishments (unweighted) 750 505 245
Australian WIRS - Manufacturing
A lot above average .089 .130 .040 .070
A little above average .364 .320 .416 -.096
About average .378 .380 .376 .004
A little below average .155 .164 .144 .020
A lot below average .015 .007 .024 -.017
Number of establishments (unweighted) 247 144 123
Notes.1. Weighted proportions based on using WIRS weights.

23
Table 3: Average Weekly Wage Differences Broken Down By Market Competition
All ManyCompetitors
No / FewCompetitors
Difference
British WIRS
Skilled manuals 209.3 202.6 221.4 -18.8
Semi-skilled manuals 160.9 151.1 173.1 -22.0
Unskilled manuals 135.8 133.3 139.4 - 6.1
Clericals 154.7 153.7 156.2 - 2.5
Foremen 229.7 231.1 227.4 3.7
Australian WIRS
Labourers and unskilled workers 361.6 351.7 376.1 -24.4
Plant and machine operators 433.0 416.0 456.0 -40.0
Sales and personal service workers 463.5 455.6 456.8 - 1.2
Clerks 408.6 391.1 419.7 -28.6
Tradespersons 489.0 478.6 502.8 -24.2
Para-professionals 610.5 620.7 590.8 30.1
Professionals 764.4 742.4 735.6 6.8
Managers 817.8 782.9 820.0 -37.1
Notes: Weekly wages are in pounds sterling for WIRS3 and in Australian dollars for AWIRS.
24
Table 4 : Ordered Probit Estimates of Relative Productivity Equations in Britain
All Manufacturing Non-Manufacturing
Many
competitors
.043
(.065)
-.059
(.070)
-.051
(.079)
.011
(.097)
-.034
(.101)
-.017
(.108)
.036
(.089)
-.118
(.102)
-.115
(.108)
Public -.168
(.210)
-.056
(.243)
.447
(.760)
1.190
(1.072)
-.320
(.224)
-.169
(.258)
Union
recognition
-.344
(.081)
-.333
(.086)
-.443
(.127)
-.446
(.137)
-.250
(.110)
-.254
(.117)
50-99
employees
-.089
(.110)
-.164
(.119)
.124
(.216)
.101
(.248)
-.162
(.131)
-.273
(.142)
100-199
employees
.120
(.113)
.065
(.122)
.417
(.218)
.353
(.249)
.002
(.139)
-.070
(.148)
200-499
employees
.110
(.118)
-.061
(.127)
.215
(.220)
.022
(.252)
.161
(.151)
.001
(.162)
500-999
employees
.177
(.134)
.141
(.145)
.374
(.235)
.319
(.268)
.146
(.186)
.178
(.203)
1000 or more
employees
-.069
(.126)
-.175
(.138)
.061
(.227)
-.074
(.260)
.023
(.174)
-.084
(.188)
Age_2 and <5
years
-.342
(.226)
-.340
(.236)
.234
(.406)
.077
(.415)
-.601
(.276)
-.483
(.293)
Age_5 and <10
years
-.182
(.224)
-.297
(.235)
.334
(.394)
.050
(.406)
-.391
(.277)
-.428
(.293)
Age_10 and <20
years
-.376
(.215)
-.321
(.225)
.136
(.386)
.206
(.395)
-.600
(.262)
-.573
(.279)
Age_20
years
-.565
(.207)
-.527
(.216)
-.018
(.370)
.005
(.377)
-.776
(.253)
-.754
(.270)
A little below
average fperf
.414
(.239)
.156
(.315)
.754
(.379)
About average
fperf
.792
(.207)
.443
(.276)
1.296
(.322)
A little above
average fperf
1.351
(.211)
.892
(.287)
1.977
(.328)
A lot above
average fperf
1.601
(.216)
1.244
(.299)
2.139
(.330)
Industry
dummies
No Yes(7) Yes(7) No No No No Yes(7) Yes(7)
Log-Likelihood -1400.04 -1335.24 -1127.55 -626.88 -602.24 -508.54 -768.50 -724.63 -607.40
Number of
establishments
1084 1056 929 484 477 417 600 579 512
Notes.1. The dependent variable is a categorical indicator of relative productivity ranging from 0 to 4 corresponding to
the following categories: 0 - a lot below average; 1 - a little below average; 2 - about the same; 3 - a littleabove average; 4 - a lot above average.
2. Ordered Probit estimates. Asymptotic standard errors in parentheses.3. The variable fperf is a qualitative index of financial performance, ranging from well below average to well
above average financial performance (the left-out dummy is well below average).

25
Table 5 : Ordered Probit Estimates of Relative Productivity Equations in Australia
All Manufacturing Non-Manufacturing
Many
competitors
.111
(.083)
.062
(.094)
.023
(.116)
.275
(.130)
.296
(.139)
.403
(.168)
-.067
(.112)
-.116
(.134)
-.324
(.175)
Public -.449
(.177)
-.457
(.235)
-.720
(.403)
-.530
(.509)
-.414
(.207)
-.535
(.284)
Union present -.121
(.115)
-.161
(.128)
-.014
(.228)
-.063
(.245)
-.146
(.138)
-.240
(.159)
50-99
employees
-.017
(.112)
.051
(.130)
-.070
(.213)
-.169
(.240)
-.014
(.134)
.075
(.159)
100-199
employees
-.063
(.122)
.114
(.147)
-.084
(.241)
.136
(.277)
-.097
(.144)
.037
(.180)
200-499
employees
-.042
(.148)
.045
(.175)
-.137
(.245)
-.185
(.278)
.003
(.209)
.174
(.263)
500-999
employees
-.166
(.168)
.004
(.217)
-.427
(.299)
-.651
(.399)
.067
(.226)
.360
(.284)
1000 or more
employees
-.375
(.263)
-.336
(.339)
-.288
(.390)
-.379
(.564)
-.306
(.428)
.236
(.516)
Age>=5 and
<10 years
-.036
(.181)
-.184
(.215)
.090
(.418)
-.653
(.519)
-.040
(.210)
.049
(.255)
Age>=10 and
<20 years
-.026
(.155)
-.065
(.186)
-.013
(.382)
-.480
(.491)
.031
(.176)
.111
(.213)
Age>=20 and
<50 years
-.022
(.150)
-.131
(.179)
.060
(.373)
-.457
(.477)
.015
(.170)
.024
(.204)
Age>=50 years -.210
(.166)
-.219
(.200)
-.056
(.394)
-.457
(.502)
-.212
(.193)
-.141
(.232)
Mainly
Australian
-.153
(.121)
-.156
(.146)
-.020
(.208)
.101
(.245)
-.172
(.153)
-.252
(.188)
Foreign .148
(.133)
-.009
(.152)
.247
(.216)
.029
(.253)
.112
(.174)
-.039
(.200)
Mainly Foreign -.198
(.170)
-.311
(.202)
-.127
(.236)
-.357
(.293)
-.144
(.258)
-.332
(.295)
Jointly Owned .018
(.414)
-.163
(.456)
.051
(.424)
-.212
(.471)
Domestic and
import
.159
(.089)
.078
(.106)
.192
(.147)
.197
(.177)
.127
(.115)
.050
(.141)
Export market .670
(.245)
.955
(.369)
.229
(.320)
.057
(.624)
1.591
(.474)
2.071
(.606)
Rate of return,
0-5%
-.094
(.170)
-.094
(.281)
-.248
(.224)
Rate of return,
6-10%
.186
(.171)
.262
(.279)
.104
(.226)
Rate of
return,11-15%
.102
(.190)
.050
(.306)
.035
(.252)
Rate of return,
15% or more
.451
(.172)
.778
(.267)
.126
(.236)
7 Industry
dummies
No Yes Yes No No No No Yes Yes
Log-Likelihood -977.10 -944.97 -678.65 -367.50 -360.48 -260.69 -601.83 -570.51 -399.40
Number of
establishments
750 743 530 267 267 201 483 476 329
Notes.

26
1. The dependent variable is a categorical indicator of relative productivity ranging from 0 to 4 corresponding tothe following categories: 0 - a lot below average; 1 - a little below average; 2 - about the same; 3 - a littleabove average; 4 - a lot above average.
2. Ordered Probit estimates. Asymptotic standard errors in parentheses.
27
Table 6: Predicted Probabilities
1. Britain - Relative Productivity, All Establishments (Column 2, Table 4)
A Lot Above
Average
A Little Above
Average
About Average A Little Below
Average
A Lot Below
Average
Union .10 .30 .45 .13 .02
Non-Union .17 .35 .39 .08 .01
2. Britain - Relative Productivity, Manufacturing Establishments (Column 5, Table 4)
A Lot Above
Average
A Little Above
Average
About Average A Little Below
Average
A Lot Below
Average
Union .08 .31 .45 .14 .03
Non-Union .17 .40 .36 .07 .01
3. Britain - Relative Productivity, Non-Manufacturing Establishments (Column 8, Table 4)
A Lot Above
Average
A Little Above
Average
About Average A Little Below
Average
A Lot Below
Average
Union .13 .30 .44 .12 .01
Non-Union .18 .33 .40 .09 .01
4. Australia - Relative Productivity, Manufacturing Establishments (Column 5, Table 5)
A Lot Above
Average
A Little Above
Average
About Average A Little Below
Average
A Lot Below
Average
Many Competitors .14 .35 .35 .14 .02
Few/No
Competitors
.08 .27 .39 .22 .04
5. Britain - Three Year Change in Productivity, Non-Manufacturing Establishments
A Lot Higher A Little Higher About The Same A Little Lower A Lot Lower
Union .36 .42 .19 .02 .001
Non-Union .28 .43 .25 .04 .002
Notes. 1. These are "recycled" predicted probabilities and their method of calculation is described in the text of the paper.
28
Table 8 : Estimated Productivity Growth Equations for Britain
All Manufacturing Non-Manufacturing
Many
competitors
-.019
(.064)
-.032
(.069)
-.006
(.095)
-.014
(.098)
.005
(.089)
-.002
(.101)
Public -.284
(.179)
.223
(.500)
-.366
(.200)
Union
recognition
.118
(.065)
.075
(.078)
-.094
(.105)
-.161
(.121)
.276
(.088)
.241
(.105)
25-49
employees
(1987)
-.106
(.235)
-.327
(.466)
-.140
(.278)
50-99
employees
(1987)
-.239
(.234)
-.545
(.464)
-.213
(.279)
100-199
employees
(1987)
.109
(.241)
-.160
(.470)
.094
(.292)
200-499
employees
(1987)
-.166
(.243)
-.292
(.466)
-.254
(.300)
500-999
employees
(1987)
-.061
(.249)
-.239
(.468)
-.029
(.320)
1000-1999
employees
(1987)
-.053
(.250)
-.177
(.470)
-.212
(.328)
2000 or more
employees
(1987)
.060
(.230)
-.086
(.454)
.031
(.275)
Age_2 & <5
years
-.129
(.222)
-.092
(.388)
-.179
(.275)
Age_5 & <10
years
-.418
(.219)
-.239
(.369)
-.494
(.273)
Age_10 and <20
years
-.357
(.210)
-.073
(.360)
-.493
(.261)
Age_20 years -.240
(.203)
-.060
(.345)
-.312
(.253)
8 Industry
Dummies
No Yes No Yes No Yes
Log-Likelihood -1397.339 -1331.808 -627.996 -614.612 -760.297 -705.346
Number of
establishments
1183 1150 531 524 652 626
Notes.
1. The dependent variable is a categorical indicator of relative productivity ranging from 0 to 4 corresponding to the following
categories: 0 - a lot below average; 1 - a little below average; 2 - about the same; 3 - a little above average; 4 - a lot above
average.
2. Ordered Probit estimates. Asymptotic standard errors in parentheses.
3. Employment is measured three years ago (in 1987), so base category is <25 workers.
29
Table 9 : Estimated Wage Equations for British Workplaces
Skilled Manuals Semi-Skilled
Manuals
Unskilled Manuals Supervisors/
Foremen
Clerical
Constant 5.480
( .014)
4.055
( .242)
5.291
( .017)
4.898
( .273)
5.168
( .023)
5.242
( .374)
5.586
(.014)
5.872
(.231)
5.258
( .024)
5.439
( .246)
Many
competitors
-.072
(.020)
-.042
(.021)
-.063
(.024)
-.027
(.025)
-.086
(.030)
-.033
(.033)
-.027
(.020)
.002
(.020)
-.040
(.018)
-.016
(.020)
Majority sex
male
.499
(.038)
.136
(.049)
.449
(.030)
.163
(.040)
.487
(.032)
.202
(.045)
.316
(.023)
.084
(.030)
.172
(.025)
.085
(.027)
Public .050
(.055)
.042
(.065)
.079
(.091)
.017
(.051)
.042
(.059)
50-99
employees
.027
(.037)
.061
(.046)
.008
(.055)
.055
(.072)
.040
(.035)
100-199
employees
.115
(.040)
.155
(.047)
.089
(.058)
.038
(.069)
.099
(.035)
200-499
employees
.106
(.043)
.190
(.053)
.113
(.063)
.123
(.070)
.138
(.039)
500-999
employees
.109
(.047)
.151
(.057)
.140
(.070)
.124
(.071)
.162
(.042)
1000 or
more
employees
.163
(.047)
.230
(.057)
.211
(.070)
.201
(.071)
.226
(.042)
Percentage
manual
-.0012
(.0006)
-.0008
(.0007)
.0004
(.0009)
.0006
(.0005)
-.0011
(.0004)
Percentage
female
-.0035
(.0006)
-.0058
(.0008)
-.0054
(.0010)
-.0040
(.0006)
-.0028
(.0005)
Shiftwork -.016
(.028)
.042
(.065)
.033
(.041)
-.045
(.028)
-.021
(.025)
UK/Foreign
Owned
-.062
(.061)
-.138
(.076)
-.059
(.101)
.001
(.058)
-.031
(.057)
Foreign
Owned
.017
(.027)
.007
(.033)
.048
(.048)
.044
(.026)
.088
(.025)
Log(u rate) -.031
(.019)
-.033
(.023)
-.049
(.029)
-.014
(.019)
-.071
(.018)
Union
recognised
-.036
(.027)
.019
(.032)
-.002
(.041)
-.041
(.027)
-.055
(.025)
Closed shop .060
(.040)
-.028
(.047)
-.004
(.065)
-.037
(.039)
-.004
(.039)
50 Industry
Dummies
No Yes No Yes No Yes No Yes No Yes
R2 .203 .498 .272 .530 .265 .518 .232 .518 .057 .353
Sample size 755 636 691 598 729 621 687 577 893 764
Notes.
1. Ordinary least squares estimates of semi-log wage equations. Standard errors in parentheses.
2. u rate is the local labour market unemployment rate.

30
Table 10: Estimated Wage Equations for Australian Workplaces
Labourers and
Unskilled Workers
Plant and Machine
Operators
Sales and Personal
Service Workers
Clerks
Constant 5.911
( .022)
5.716
( .229)
6.086
( .019)
5.835
( .247)
6.123
( .033)
6.189
( .067)
6.051
( .016)
5.987
( .036)
Many competitors -.105
(.029)
-.007
(.029)
-.083
(.027)
-.034
(.027)
-.103
(.041)
-.015
(.038)
-.094
(.020)
-.056
(.020)
Public .039
(.063)
-.044
(.054)
-.069
(.082)
-.003
(.037)
50-99 employees -.035
(.039)
.022
(.040)
.074
(.047)
.101
(.025)
100-199
employees
-.037
(.044)
.047
(.043)
.088
(.050)
.123
(.028)
200-499
employees
.003
(.050)
.055
(.045)
.085
(.062)
.162
(.032)
500-999
employees
.022
(.057)
.097
(.054)
.105
(.072)
.212
(.038)
1000 or more
employees
.030
(.087)
.095
(.078)
.133
(.109)
.228
(.061)
Percentage part-
time
.0008
(.0013)
.0011
(.0025)
-.177
(.153)
-.041
(.084)
Percentage
female
-.0022
(.0008)
-.0028
(.0009)
-.539
(.089)
-.279
(.046)
Predominantly
Australian
.050
(.043)
-.061
(.042)
-.080
(.048)
-.009
(.028)
Foreign Owned .017
(.046)
.057
(.045)
.123
(.057)
.111
(.030)
Predominantly
Foreign
.003
(.056)
-.007
(.047)
-.050
(.074)
.006
(.038)
Jointly Owned -.294
(.159)
.226
(.287)
-.063
(.228)
-.212
(.127)
Domestic and
import
.044
(.032)
-.010
(.030)
.175
(.036)
.002
(.020)
Export -.069
(.074)
.103
(.062)
.146
(.104)
.011
(.050)
Union present .145
(.042)
.023
(.046)
.001
(.049)
-.035
(.027)
34 Industry
Dummies
No Yes No Yes No Yes No Yes
R2 .022 .360 .024 .360 .012 .334 .029 .204
Number of
establishments
586 581 389 387 516 509 743 737
Notes.
1. Ordinary least squares estimates of semi-log wage equations. Standard errors in parentheses.

31
Table 11: Estimated Wage Equations for Australian Workplaces (continued)
Tradespersons Para-Professionals Professionals Managers
Constant 6.214
( .018)
6.199
( .045)
6.394
( .021)
6.398
( .064)
6.593
( .020)
6.507
( .055)
6.721
( .022)
6.199
( .045)
Many competitors -.089
(.023)
-.050
(.024)
-.016
(.029)
.014
(.030)
-.001
(.027)
-.013
(.029)
-.114
(.027)
-.026
(.025)
Public -.068
(.047)
-.095
(.054)
.079
(.056)
-.017
(.049)
50-99 employees .004
(.034)
.028
(.048)
.003
(.045)
.062
(.032)
100-199
employees
.009
(.037)
.028
(.051)
.049
(.047)
.120
(.034)
200-499
employees
.084
(.041)
-.026
(.053)
.062
(.050)
.185
(.040)
500-999
employees
.059
(.047)
.021
(.058)
.096
(.057)
.162
(.048)
1000 or more
employees
-.006
(.067)
.001
(.080)
-.039
(.084)
.187
(.074)
Proportion part-
time
-.041
(.126)
-.286
(.127)
-.211
(.142)
-.025
(.095)
Proportion female -.157
(.058)
-.223
(.073)
-.480
(.075)
-.321
(.056)
Predominantly
Australian
-.032
(.034)
.028
(.048)
.008
(.047)
-.032
(.035)
Foreign Owned .035
(.039)
.061
(.044)
.069
(.041)
.105
(.036)
Predominantly
Foreign
.028
(.043)
.055
(.050)
.075
(.048)
.132
(.049)
Jointly Owned -.110
(.151)
.055
(.280)
-.036
(.278)
-.055
(.135)
Domestic and
import
.004
(.025)
-.019
(.034)
.043
(.031)
.068
(.025)
Export .075
(.055)
.023
(.070)
.195
(.067)
.128
(.066)
Union present .037
(.036)
.039
(.048)
-.029
(.041)
-.061
(.031)
34 Industry
dummies
No Yes No Yes No Yes No Yes
R2 .026 .200 .001 .157 .000 .109 .023 .365
Number of
establishments
537 533 374 373 385 383 729 722
Notes.
1. Ordinary least squares estimates of semi-log wage equations. Standard errors in parentheses.

32
Data Appendix
Details on the British 1990 Workplace Industrial Relations Survey (WIRS3)
There are three Workplace Industrial Relations Surveys, that were carried out in 1980,
1984 and 1990. The sample design for the 1990 main survey broadly followed that developed
for previous surveys. The sampling frame was the Employment Department's 1987 Census of
Employment (for the 1984 survey it was the Census conducted in 1981; and for the 1980
survey it was the Census conducted in 1977). As in previous surveys, all Census units recorded
as having 24 or fewer employees were excluded, as were units falling within Agriculture,
Forestry and Fishing (Division 0) of the Standard Industrial Classification (1980). Otherwise
all sectors of civil employment in England, Scotland and Wales were included in the sampling
universe (public and private sector, manufacturing and service industries). In 1990, as in
previous surveys, larger units (on the basis of number of employees) were oversampled.
A Census unit is, in most cases, a number of employees working at the same address
who are paid from the same location by the same employer. The requirement of the survey
design was for a sample of establishments (that is, individual places of employment at a single
address and covering all the employees of the identified employer at that address). In general,
there is a sufficient degree of correspondence between Census units and establishments for the
Census to serve as a viable sampling frame for the survey series. However, some Census units
have been found to refer to more than one establishment and in others to just part of an
establishment.
At the time of the design of the 1990 sample, the 1987 Census of Employment file
contained just over 142,000 units with 25 or more employees, which is slightly more than the
135,000 in the 1981 Census used for the 1984 survey. A stratified random sample totalling
3,577 units was drawn (in 1984 the figure was 3,640 units and in 1980 the figure was 3,994
units). The selected sample was smaller in 1990 for two reasons. Firstly, the number of
establishments at which interviews were required was 1,870, as against 2,000 in the first survey.
Secondly, as none of the 'reserve pool' of nearly 500 units had been used in 1984 and the 1984
experience gave a good guide to the extent of out-of-scope and non-responding addresses, the

33
size of the reserve pool in 1990 could be reduced. In the event none of the 358 units selected for
the 1990 reserve pool were used.
The selection of units from the Census file involved an initial division of the file into
seven files, each containing units within a size range: 25 to 49 employees, 50 to 99 employees,
and so on. Within each file the Census units were then re-ordered by: the proportion of male
employees, within the proportion of full-time employees, within the Activities of the Standard
Industrial Classification (SIC). Differential sampling fractions were applied to the six lower
size bands, the seventh (top) band having the same sampling fraction as the sixth band. From
the re-ordered lists, samples were selected by marking off at intervals from a randomly selected
starting point, the list being treated as circular.
The range of sampling fractions employed has been progressively increased during the
course of the series. Partly this was because the number of large units in the population has
declined and we still wanted to have sufficient large establishments of different sizes. It also
reflected an increased emphasis on estimates focusing on employees rather than establishments.
Analysis of the 1980 results had shown that employee estimates could be improved with little
loss of accuracy on establishment estimates if the sample contained more large, and fewer small,
units.
Besides the withdrawal of the ten per cent of addresses for the reserve pool, the sample
selected in 1990 was also reduced by a further 210 addresses from SIC Classes 91, 93 and 95.
This innovation was made because analysis of the previous surveys had demonstrated that there
was less variation within these easily identifiable parts of the public sector on most of the
matters of interest in the surveys. It seemed advisable, therefore, to spread the survey resources
that could be saved by undersampling these sectors over the remaining sectors of the
population. The result of these two types of withdrawal from the selected sample -- the reserve
pool and the undersampling of Classes 91, 93 and 95 -- was to bring the number of units in the
initial sample down to 3,009.
In 1984, all addresses in the deep coal-mining industry had been withdrawn from the
sample prior to fieldwork, owing to the industry-wide dispute current at the time. In 1990 the

34
deep coal-mining industry was again excluded so that the industrial coverage of the three
surveys in the series would be identical.
Interviewing started in late January, shortly after the main interviewer briefings, and
continued until September 1990, with the bulk of interviews taking place in February to April.
The median date for the main management interviews was late March, compared with May for
the two previous surveys. The final sample size was 2061 establishments.
Details on the Australian 1989/90 Workplace Industrial Relations Survey (AWIRS)
The units of analyses for AWIRS are called locations, which the Australian Bureau of
Statistics (ABS) defines as 'a single physical area occupied by the establishment from which It
engages in productive activity on a relatively permanent basis'. The ABS classifies workplaces
in a number of ways, including locations, establishments of enterprises. 'Locations', such as a
bank branch of a council works depot, are a smaller classificatory unit than establishments
which may control or be responsible for a number of locations - for example, regional bank
offices or council chambers are establishments. An enterprise can cover all the operations in
Australia (locations in all establishments) of a single operating legal entity. These definitions
apply to both the private and public sectors. Single one-location workplaces that are not part of
a larger organisation - for example, an independent hairdressing salon or newsagency - would
appear in each of these classificatory independent hairdressing salon or newsagency - would
appear in each of these classificatory levels. Further, a head office of an organisation may be
classified as a location and/or an enterprise, depending on its organisational character.
Because the AWIRS sample - head offices, regional offices, worksites and branches, as
well as single or independent workplaces that were not part of a larger enterprise group. When
a workplace address housed complex and diverse organisational structures or administrative
units, in terms of industrial relations, it was regarded as consisting of several separate
workplaces. In such cases, the survey reviewed the industrial relations structures and practices
of the workplace (or part of the organisation) with the greatest number of employees. Problems
also arise with multi-location organisations when a number of workplaces may be controlled
centrally This because industrial relations practices and structures may be determined elsewhere
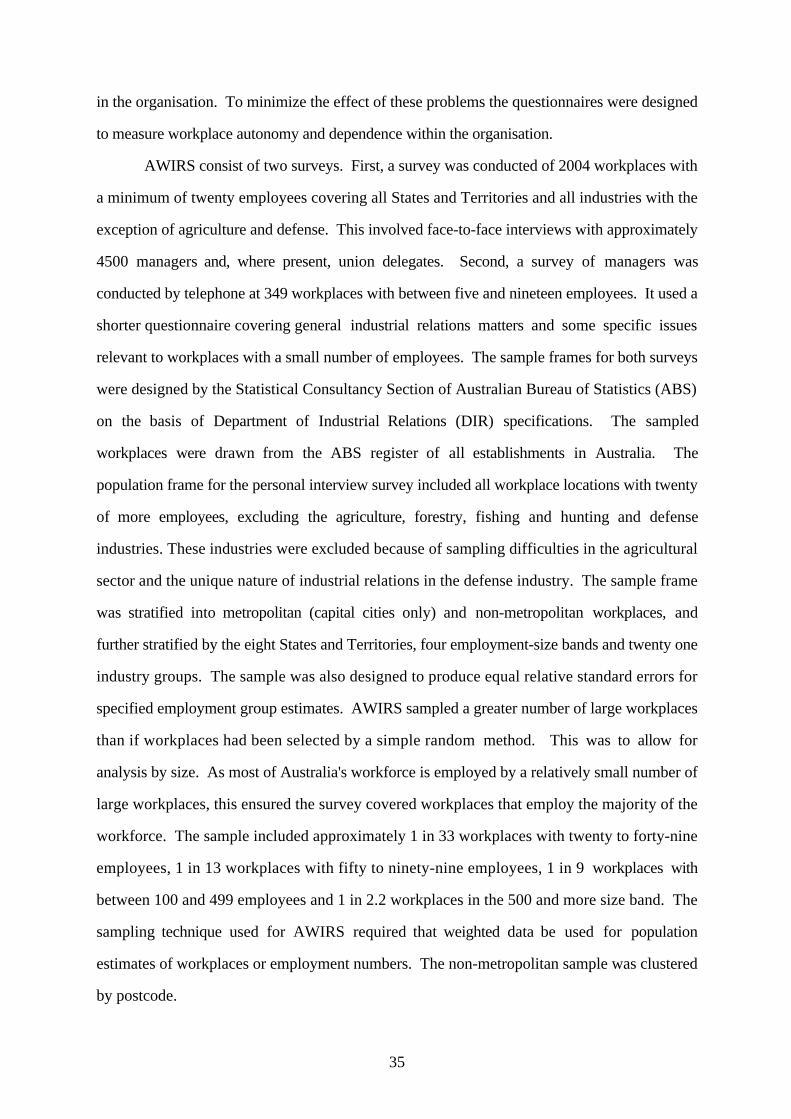
35
in the organisation. To minimize the effect of these problems the questionnaires were designed
to measure workplace autonomy and dependence within the organisation.
AWIRS consist of two surveys. First, a survey was conducted of 2004 workplaces with
a minimum of twenty employees covering all States and Territories and all industries with the
exception of agriculture and defense. This involved face-to-face interviews with approximately
4500 managers and, where present, union delegates. Second, a survey of managers was
conducted by telephone at 349 workplaces with between five and nineteen employees. It used a
shorter questionnaire covering general industrial relations matters and some specific issues
relevant to workplaces with a small number of employees. The sample frames for both surveys
were designed by the Statistical Consultancy Section of Australian Bureau of Statistics (ABS)
on the basis of Department of Industrial Relations (DIR) specifications. The sampled
workplaces were drawn from the ABS register of all establishments in Australia. The
population frame for the personal interview survey included all workplace locations with twenty
of more employees, excluding the agriculture, forestry, fishing and hunting and defense
industries. These industries were excluded because of sampling difficulties in the agricultural
sector and the unique nature of industrial relations in the defense industry. The sample frame
was stratified into metropolitan (capital cities only) and non-metropolitan workplaces, and
further stratified by the eight States and Territories, four employment-size bands and twenty one
industry groups. The sample was also designed to produce equal relative standard errors for
specified employment group estimates. AWIRS sampled a greater number of large workplaces
than if workplaces had been selected by a simple random method. This was to allow for
analysis by size. As most of Australia's workforce is employed by a relatively small number of
large workplaces, this ensured the survey covered workplaces that employ the majority of the
workforce. The sample included approximately 1 in 33 workplaces with twenty to forty-nine
employees, 1 in 13 workplaces with fifty to ninety-nine employees, 1 in 9 workplaces with
between 100 and 499 employees and 1 in 2.2 workplaces in the 500 and more size band. The
sampling technique used for AWIRS required that weighted data be used for population
estimates of workplaces or employment numbers. The non-metropolitan sample was clustered
by postcode.

36
Interviews were conducted in an average of five workplaces per 100 of the possible 1000
non-metropolitan postcodes. The sample for the small workplace telephone survey was less
complex and allowed for national estimates of workplaces with between five and nineteen
employees. Because there are about 92,000 workplaces with between five and nineteen
employees, the average sampling fraction for the telephone survey was 1 in 260. The sample
was designed to allow disaggregation and reliable estimates for public and private sector
workplaces, manufacturing and non-manufacturing workplaces; organisational status of
workplaces; and two size bands. Data from this survey can be combined with the data from the
survey of workplaces with twenty or more employees to allow some comparisons between small
and large workplaces.

37
Table A1: Industry Breakdowns of Competition Measures in the Two Countries
1. Australia - Market Competition
No Competitors Few Competitors Many Competitors Number of
Establishments
(Weighted)
Manufacturing .015 .450 .535 358
Utilities .376 .599 .025 20
Construction .012 .272 .716 54
Wholesale and Retail
Trade
.018 .147 .835 316
Transportation .077 .499 .424 49
Communication .061 .676 .263 28
Banking .007 .141 .852 143
Commercial Services .179 .380 .441 85
Other Services .024 .218 .757 146
All .037 .302 .661 1200
2. Britain - Market Competition
No Competitors Few Competitors Many Competitors Number of
Establishments
(Weighted)
Manufacturing .056 .403 .541 387
Utilities .720 .140 .140 16
Construction .045 .117 .838 62
Wholesale and Retail
Trade
.071 .254 .675 375
Transportation .019 .318 .663 61
Communication .627 .340 .032 44
Banking .042 .228 .730 201
Commercial Services .055 .375 .570 83
Other Services .118 .348 .534 26
All .086 .304 .611 1256

38
Table A2: Industry Breakdowns of Relative Productivity Measures in the Two Countries
1. Australia - Relative Productivity
A Lot Above
Average
A Little Above
Average
About Average A Little Below
Average
A Lot Below
Average
Number of
Establishments
(Weighted)
Manufacturing .087 .371 .373 .147 .022 313
Utilities .083 .431 .449 .007 .030 18
Construction .064 .198 .559 .148 .032 48
Wholesale and
Retail Trade
.106 .317 .461 .105 .011 258
Transportation .055 .174 .576 .196 .000 35
Communication .039 .381 .532 .047 .000 37
Banking .129 .356 .425 .078 .012 153
Commercial
Services
.201 .406 .237 .143 .012 54
Other Services .129 .253 .489 .129 .000 116
All .105 .331 .432 .119 .014 1031
2. Britain - Relative Productivity
A Lot Above
Average
A Little Above
Average
About Average A Little Below
Average
A Lot Below
Average
Number of
Establishments
(Weighted)
Manufacturing .107 .355 .458 .068 .012 347
Utilities .060 .171 .736 .032 .000 17
Construction .105 .497 .391 .008 .000 58
Wholesale and
Retail Trade
.138 .374 .389 .099 .000 354
Transportation .334 .149 .376 .103 .037 52
Communication .066 .180 .505 .228 .020 38
Banking .133 .281 .469 .110 .007 193
Commercial
Services
.273 .207 .406 .114 .000 75
Other Services .230 .097 .592 .081 .000 24
All .142 .323 .437 .091 .007 1158