Product Labeling - Motilal Oswal Labeling Name of the Scheme This product is suitable for investors...
26
-
Upload
nguyentuyen -
Category
Documents
-
view
219 -
download
0
Transcript of Product Labeling - Motilal Oswal Labeling Name of the Scheme This product is suitable for investors...

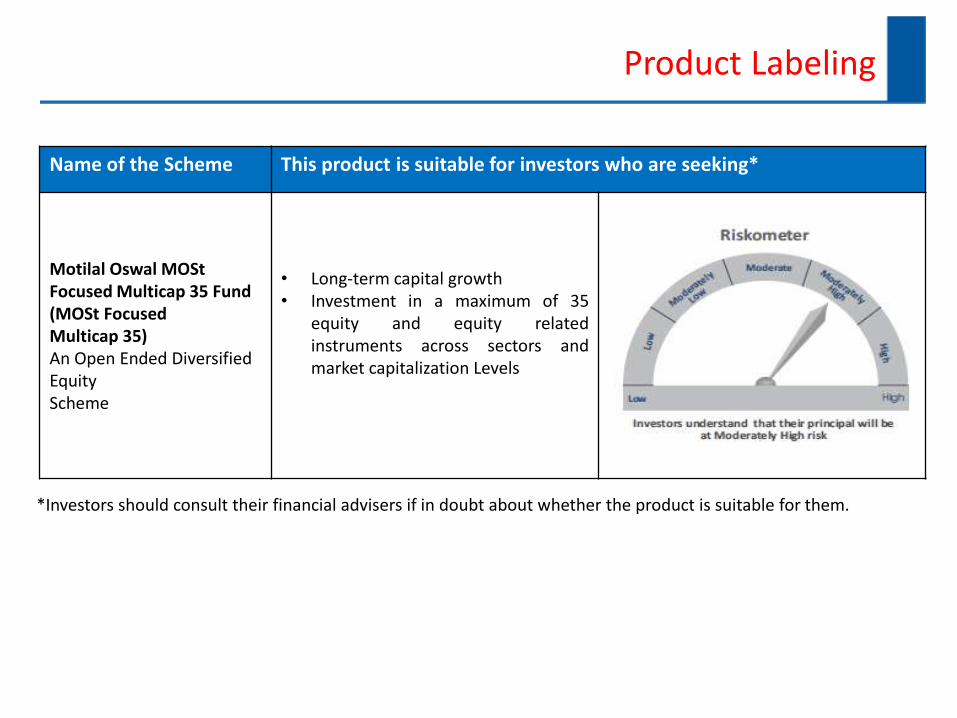
Product Labeling
Name of the Scheme This product is suitable for investors who are seeking*
Motilal Oswal MOSt Focused Multicap 35 Fund (MOSt Focused Multicap 35) An Open Ended Diversified Equity Scheme
• Long-term capital growth • Investment in a maximum of 35
equity and equity related instruments across sectors and market capitalization Levels
*Investors should consult their financial advisers if in doubt about whether the product is suitable for them.
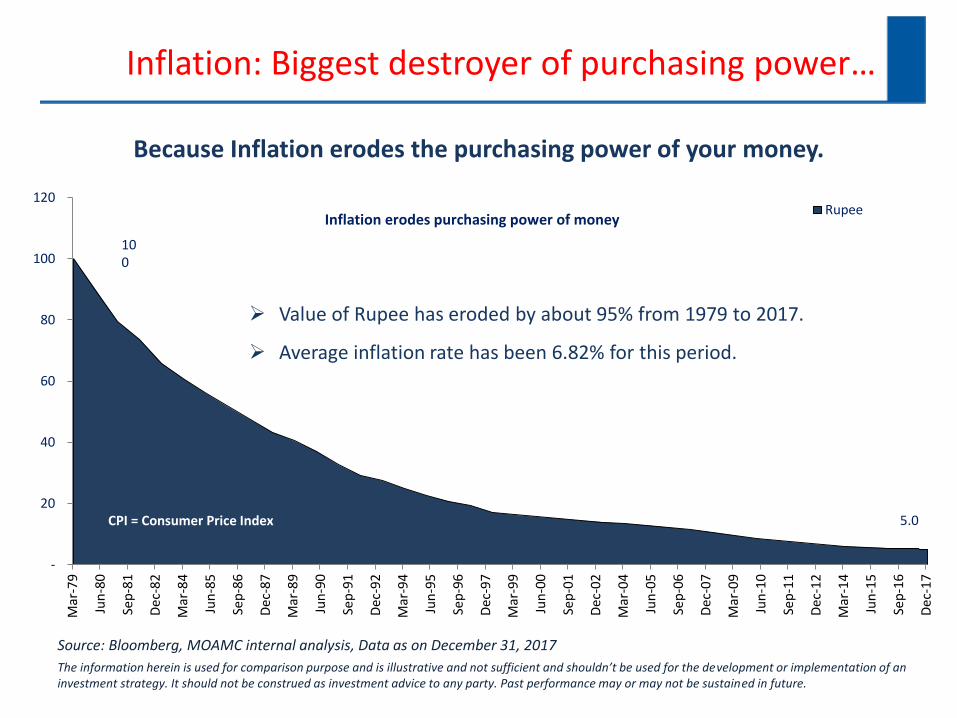
Inflation: Biggest destroyer of purchasing power…
Source: Bloomberg, MOAMC internal analysis, Data as on December 31, 2017
The information herein is used for comparison purpose and is illustrative and not sufficient and shouldn’t be used for the development or implementation of an investment strategy. It should not be construed as investment advice to any party. Past performance may or may not be sustained in future.
Because Inflation erodes the purchasing power of your money.
Value of Rupee has eroded by about 95% from 1979 to 2017.
Average inflation rate has been 6.82% for this period.
-
20
40
60
80
100
120
Mar
-79
Jun
-80
Sep
-81
Dec
-82
Mar
-84
Jun
-85
Sep
-86
Dec
-87
Mar
-89
Jun
-90
Sep
-91
Dec
-92
Mar
-94
Jun
-95
Sep
-96
Dec
-97
Mar
-99
Jun
-00
Sep
-01
Dec
-02
Mar
-04
Jun
-05
Sep
-06
Dec
-07
Mar
-09
Jun
-10
Sep
-11
Dec
-12
Mar
-14
Jun
-15
Sep
-16
Dec
-17
Rupee
CPI = Consumer Price Index
Inflation erodes purchasing power of money
5.0
100

Key Objective of Investing
Inflation adjusted current values of the investment of Rs. 100 invested in March 1979
Source: Bloomberg, MOAMC internal analysis, Data as on December 31, 2017
The information herein is used for comparison purpose and is illustrative and not sufficient and shouldn’t be used for the development or implementation of an investment strategy. It should not be construed as investment advice to any party. Past performance may or may not be sustained in future.
Because key objective of investing in equities is to create wealth.
-
250
500
750
1,000
1,250
1,500
1,750
Mar
-79
Jun
-80
Sep
-81
Dec
-82
Mar
-84
Jun
-85
Sep
-86
Dec
-87
Mar
-89
Jun
-90
Sep
-91
Dec
-92
Mar
-94
Jun
-95
Sep
-96
Dec
-97
Mar
-99
Jun
-00
Sep
-01
Dec
-02
Mar
-04
Jun
-05
Sep
-06
Dec
-07
Mar
-09
Jun
-10
Sep
-11
Dec
-12
Mar
-14
Jun
-15
Sep
-16
Dec
-17
Pu
rch
asin
g P
ow
er
Sensex Fixed Deposit Gold
If you had invested Rs 100 .....
1,720
211
110

Key Objective of Investing
Source: Bloomberg, MOAMC internal analysis, Data as on December 31, 2017 Note: The information herein is used for comparison purpose and is illustrative and is not sufficient and shouldn’t be used for the development or implementation of an investment strategy. It should not be constructed as investment advice to any party. Past performance may or may not be sustained in future.
-
5,000
10,000
15,000
20,000
25,000
30,000
35,000
Mar
-79
Jun
-80
Sep
-81
Dec
-82
Mar
-84
Jun
-85
Sep
-86
Dec
-87
Mar
-89
Jun
-90
Sep
-91
Dec
-92
Mar
-94
Jun
-95
Sep
-96
Dec
-97
Mar
-99
Jun
-00
Sep
-01
Dec
-02
Mar
-04
Jun
-05
Sep
-06
Dec
-07
Mar
-09
Jun
-10
Sep
-11
Dec
-12
Mar
-14
Jun
-15
Sep
-16
Dec
-17
No
min
al V
alu
e
Sensex Fixed Deposit Gold
If you had invested Rs 100 .....
4,176
2,182
34,057

WHY INVEST IN EQUITIES NOW?
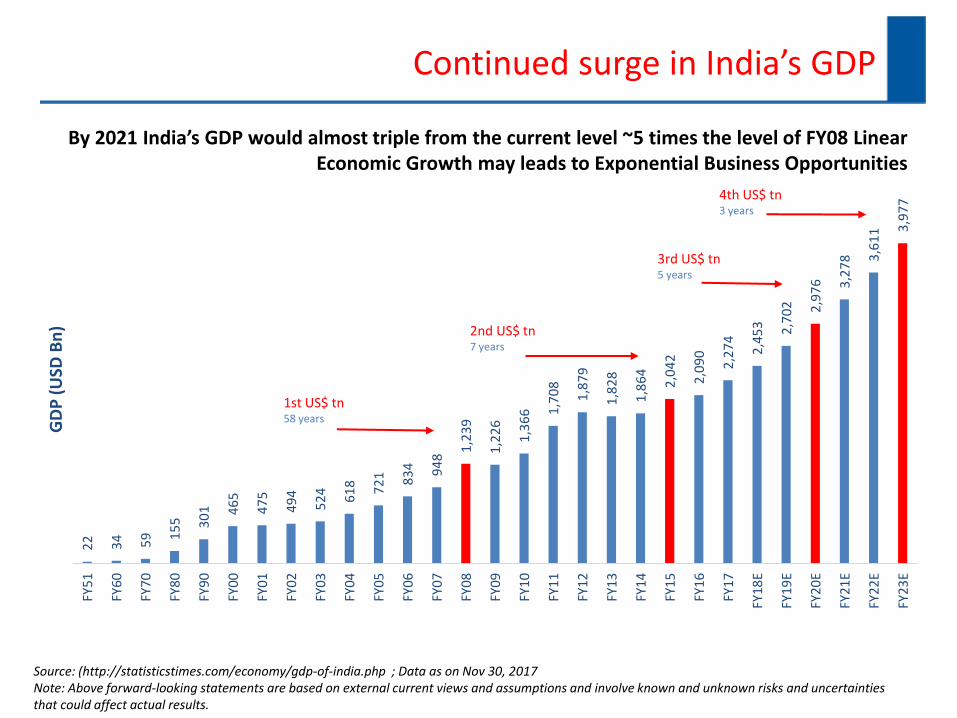
Continued surge in India’s GDP
By 2021 India’s GDP would almost triple from the current level ~5 times the level of FY08 Linear Economic Growth may leads to Exponential Business Opportunities
Source: (http://statisticstimes.com/economy/gdp-of-india.php ; Data as on Nov 30, 2017 Note: Above forward-looking statements are based on external current views and assumptions and involve known and unknown risks and uncertainties that could affect actual results.
GD
P (
USD
Bn
)
22
34
59
15
5
30
1
46
5
47
5
49
4
52
4
61
8
72
1
83
4
94
8 1
,23
9
1,2
26
1,3
66
1,7
08
1,8
79
1,8
28
1,8
64
2,0
42
2,0
90
2,2
74
2,4
53
2,7
02
2,9
76
3,2
78
3,6
11
3,9
77
FY5
1
FY6
0
FY7
0
FY8
0
FY9
0
FY0
0
FY0
1
FY0
2
FY0
3
FY0
4
FY0
5
FY0
6
FY0
7
FY0
8
FY0
9
FY1
0
FY11
FY1
2
FY13
FY1
4
FY1
5
FY1
6
FY1
7
FY1
8E
FY1
9E
FY2
0E
FY2
1E
FY2
2E
FY2
3E
1st US$ tn 58 years
2nd US$ tn 7 years
3rd US$ tn 5 years
4th US$ tn 3 years

Blazing growth trails at select companies, while Index has been rather lackluster
Source: Bloomberg. Data as on Dec 31, 2017 The Stocks mentioned above are used to explain the concept and is for illustration and comparison purpose only and should not used for development or implementation of an investment strategy. It should not be construed as investment advice to any party. The stocks may or may not be part of our portfolio/strategy/ schemes. Past performance may or may not be sustained in future
Stocks Market Price (Rs)
Market Price (Rs)
Performance
(As on 4th January, 2008) (As on 31st December 2017) (Growth)
Nifty Index 6,274 10,531 67.85%
Eicher Motors 416 30,341 7197%
Page Industries 482 25,542 5203%
TTK Prestige 224 7,702 3345%
GRUH Finance 21 503 2336%
GlaxoSmith C H L 689 6,538 848%
Lupin 123 885 622%
HCL Technologies 157 891 466%
Nestle India 1,460 7,871 439%
TCS 503 2,701 437%

Expected upturn in earnings growth of India Inc shall produce more companies with uncommon profits
73 78 92
131
169 184
236
281 251 247
315 349
369 405 413
396 426
497
601
FY01 FY02 FY03 FY04 FY05 FY06 FY07 FY08 FY09 FY10 FY11 FY12 FY13 FY14 FY15 FY16 FY17 FY18E FY19E
FY01-08: 21% CAGR
FY08-17: 4.7% CAGR
FY17-19E: 19% CAGR
7%
17%
21%
Earnings Per Share (EPS) growth of Nifty from FY01 - FY19(E)
Strong leadership can further accelerate growth through infrastructure development
Source: Motilal Oswal Securities Ltd. Data as on Aug 31, 2017 Note: Above forward-looking statements are based on external current views and assumptions and involve known and unknown risks and uncertainties that could cause actual results. Past performance may or may not be sustained in future.

Why
Motilal Oswal
Asset Management Company?

Our Investment Philosophy
Buy Right Sit Tight
‘Q’uality denotes quality of the business and management
‘G’rowth denotes growth in earnings and sustained RoE
‘L’ongevity denotes longevity of the competitive advantage or economic moat of the business
‘P’rice denotes our approach of buying a good business for a fair price rather than buying a fair business for a good price
Buy and Hold: We are strictly buy and hold investors and believe that picking the right business needs skill and holding onto these businesses to enable our investors to benefit from the entire growth cycle needs even more skill.
Focus: Our portfolios are high conviction portfolios with 20 to 25 stocks being our ideal number. We believe in adequate diversification but over-diversification results in diluting returns for our investors and adding market risk
QGLP
At Motilal Oswal Asset Management Company (MOAMC), our investment philosophy and investing style is centered on 'Buy Right: Sit Tight‘ principle.

Investment Process
A business we
“understand”
Favorable
“long term
economics”
Margin of
“safety”
Able and trustworthy
“management”

Why Quality?
Quality companies are those which have enduring economic moats (EMC’s)*
*The idea of an economic moat refers to how likely a company is able to keep competitors at bay for an extended period. One of the keys to finding superior long-term investments is buying companies that will be able to stay one step ahead of their competitors.
Source: 17th Motilal Oswal Wealth Creation Study (WCS) Data upto FY2012 Note: All rebased to 100 in March 2002. Past performance may or may not be sustained in future.
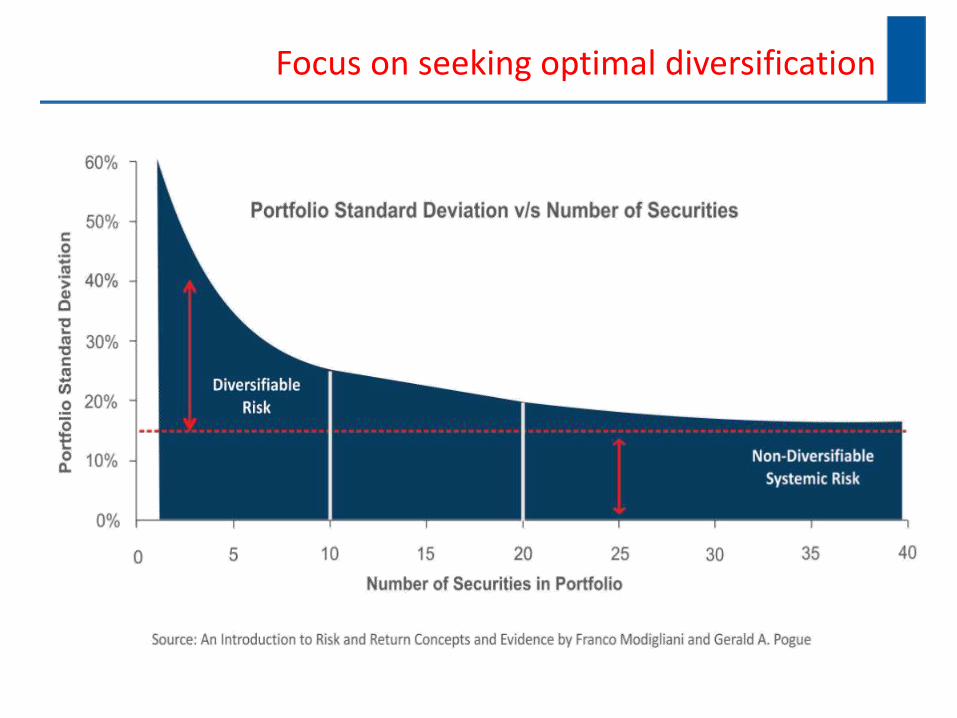
Focus on seeking optimal diversification
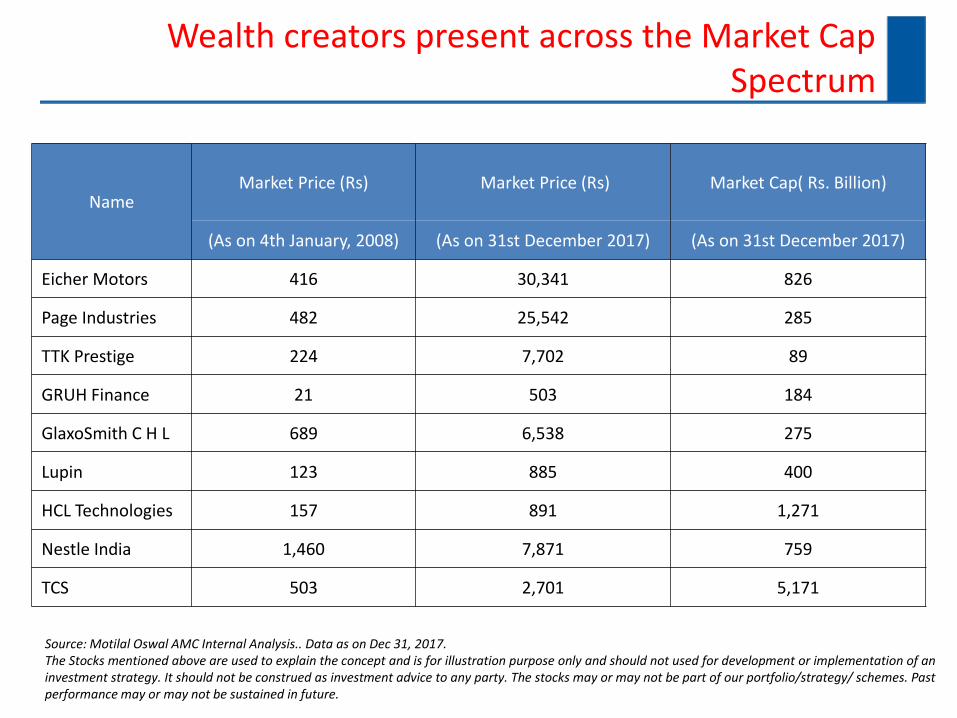
Wealth creators present across the Market Cap Spectrum
Source: Motilal Oswal AMC Internal Analysis.. Data as on Dec 31, 2017. The Stocks mentioned above are used to explain the concept and is for illustration purpose only and should not used for development or implementation of an investment strategy. It should not be construed as investment advice to any party. The stocks may or may not be part of our portfolio/strategy/ schemes. Past performance may or may not be sustained in future.
Name Market Price (Rs)
Market Price (Rs)
Market Cap( Rs. Billion)
(As on 4th January, 2008) (As on 31st December 2017) (As on 31st December 2017)
Eicher Motors 416 30,341 826
Page Industries 482 25,542 285
TTK Prestige 224 7,702 89
GRUH Finance 21 503 184
GlaxoSmith C H L 689 6,538 275
Lupin 123 885 400
HCL Technologies 157 891 1,271
Nestle India 1,460 7,871 759
TCS 503 2,701 5,171

Earnings is Concentrated in certain sectors
India Inc's Profit Pool breakdown by sector
10 Highest profit generating sectors % Share
10 Lowest profit generating sectors
Sector 2014 PAT (INR billion) Sector 2014 PAT (INR billion)
Financials 1,117 28 Airlines -52
Oil & Gas 785 20 Alcoholic Beverages -41
Technology & Software 454 11 Sugar -27
Metals & Mining 435 11 Telecom Equipment -14
Automobiles 263 7 Trading -9
Utilities-Power 217 5 Ship Building -7
Consumer-Non-Durables 209 5 Computer Education -5
HealthCare 155 4 Hotels & Restaurants -5
Cement 45 1 Technology-Hardware -3
Auto Ancillaries 45 1 Glass & Glass Products -2
Total of Above 3,726 94 Total of Above -166
Total Corporate PAT 3,947 100 Total Corporate PAT 3,947
Source: 19th Motilal Oswal Wealth Creation Study (WCS) Data for Fy2015. Motilal Oswal Asset Management Company Ltd. (MOAMC) does not guarantee any returns. The sectors may or may not be part of our portfolio/strategy/scheme. Past performance may or may not be sustained in the future
The sector mentioned herein are for general and comparison purpose only and not a complete disclosure of every material fact. It should not be construed as investment advice to any party. Past performance may or may not be sustained in future
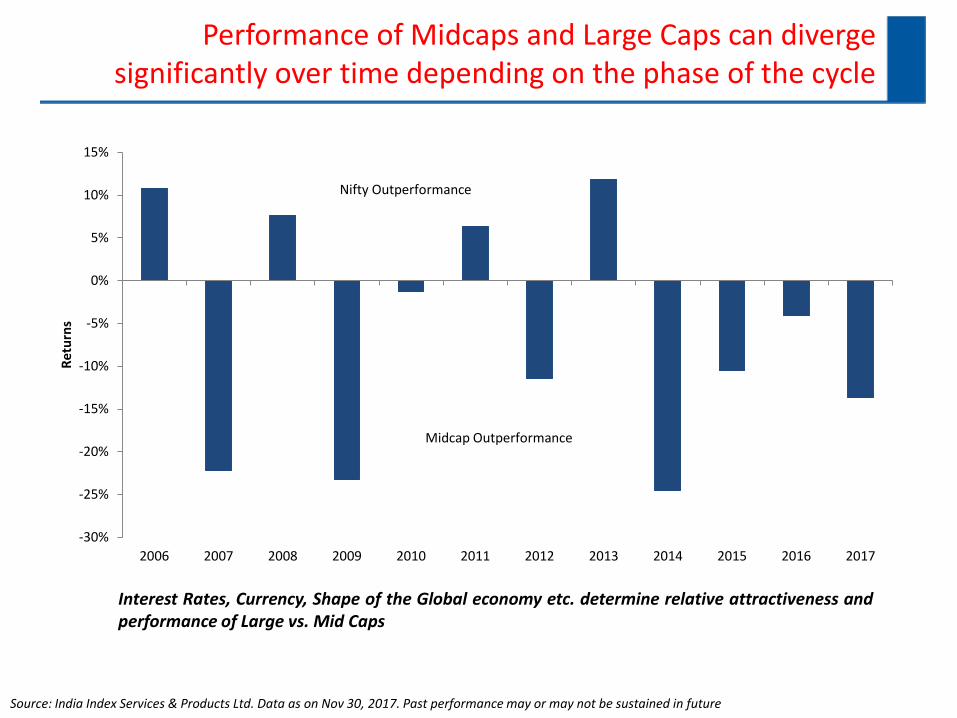
Performance of Midcaps and Large Caps can diverge significantly over time depending on the phase of the cycle
Interest Rates, Currency, Shape of the Global economy etc. determine relative attractiveness and performance of Large vs. Mid Caps
Source: India Index Services & Products Ltd. Data as on Nov 30, 2017. Past performance may or may not be sustained in future
-30%
-25%
-20%
-15%
-10%
-5%
0%
5%
10%
15%
2006 2007 2008 2009 2010 2011 2012 2013 2014 2015 2016 2017
Re
turn
s
Midcap Outperformance
Nifty Outperformance
Motilal Oswal
MOSt Focused Multicap 35 Fund
(Most Focused Multicap 35)
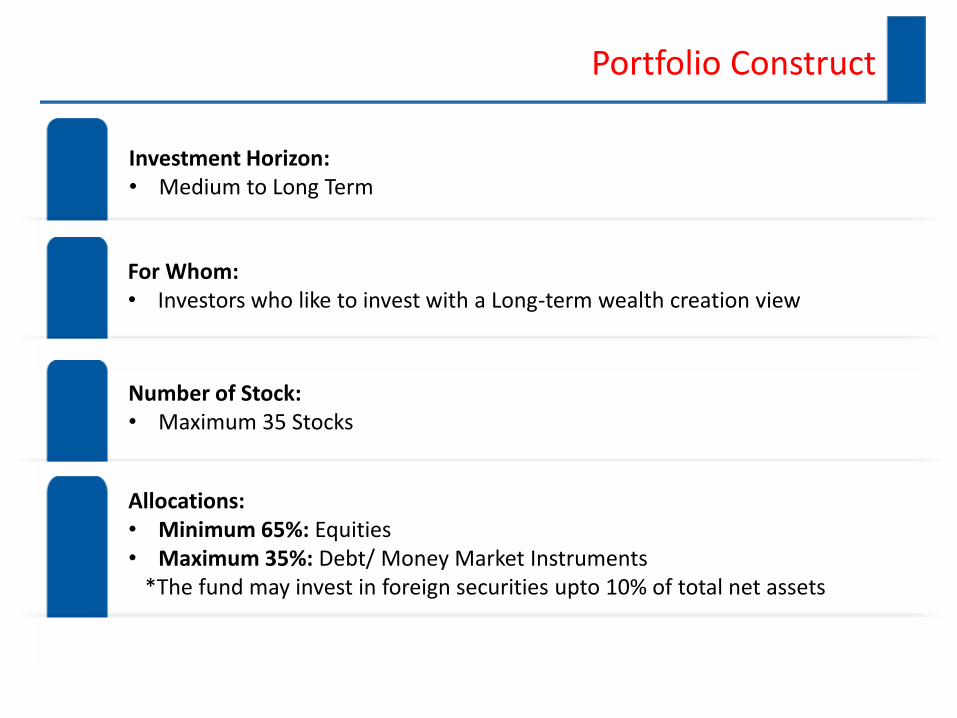
Portfolio Construct
Investment Horizon: • Medium to Long Term
For Whom: • Investors who like to invest with a Long-term wealth creation view
Number of Stock: • Maximum 35 Stocks
Allocations: • Minimum 65%: Equities • Maximum 35%: Debt/ Money Market Instruments *The fund may invest in foreign securities upto 10% of total net assets

About the Scheme
The investment objective of the Scheme is to achieve long term capital appreciation by primarily investing in a maximum of 35 equity & equity related instruments across sectors and market capitalization levels. However, there can be no assurance or guarantee that the investment objective of the Scheme would be achieved
MOSt Focused Multicap 35 would endeavour to construct such a portfolio that the product is best suited for medium and long term investment
High conviction ideas with improved risk-adjusted return characteristics
‘360 degree view’ of company to identify competitive advantages

Fund Details
Type of Scheme An open ended diversified equity scheme
Investment Objective:
The investment objective of the Scheme is to achieve long term capital appreciation by primarily investing in a maximum of 35 equity & equity related instruments across sectors and market capitalization levels. However, there can be no assurance or guarantee that the investment objective of the Scheme would be achieved.
Benchmark: Nifty 500 Index
Entry/Exit Load: 1% if redeemed on or before 1 year from the date of allotment; Nil if redeemed after 1 year from the date of allotment
Plans: Regular Plan and Direct Plan
Options (Under each plan): Dividend (Payout and Reinvestment) and Growth
Minimum Application Amount:
Rs. 5,000/- and in multiples of Re. 1/- thereafter
Additional Application Amount:
Rs. 1,000/- and in multiples of Re. 1/- thereafter.
Systematic Investment Plan (SIP):
Weekly SIP 1,000 and in multiples of Re.1/- thereafter (Minimum Installment – 6) Fortnightly SIP
Monthly SIP Quarterly SIP 2,000 and in multiples of Re.1/- thereafter (Minimum Installment – 3)
Annual SIP 5,000 and in multiples of Re. 1/- thereafter (Minimum Installment – 1) Minimum Redemption Amount:
Rs. 1,000/- and in multiples of Re. 1/- thereafter or account balance, whichever is lower.
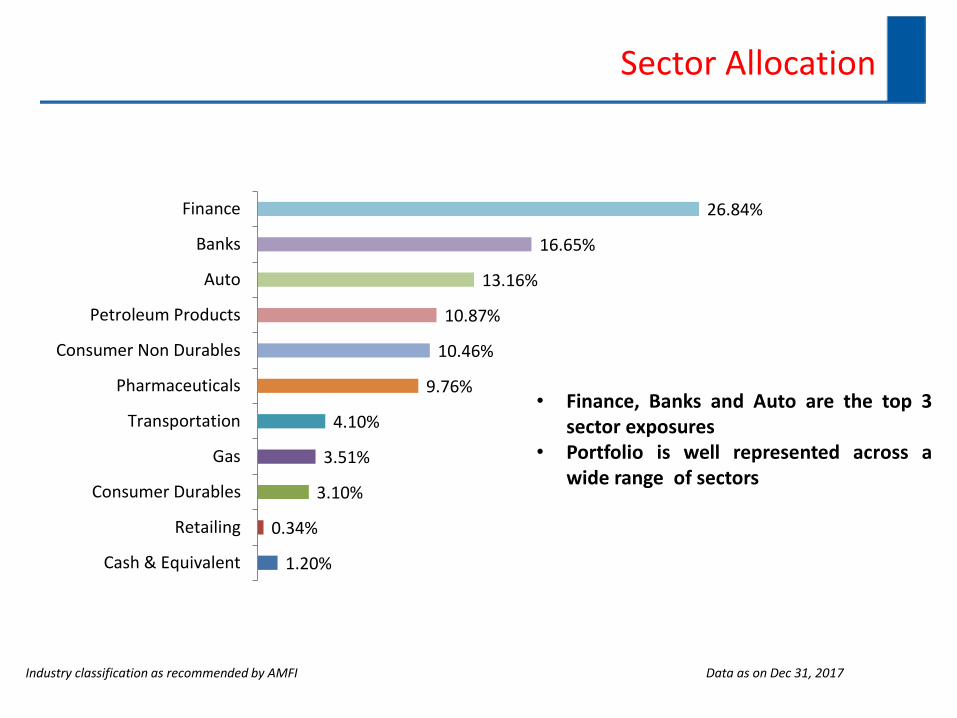
Sector Allocation
Industry classification as recommended by AMFI Data as on Dec 31, 2017
• Finance, Banks and Auto are the top 3 sector exposures
• Portfolio is well represented across a wide range of sectors
1.20%
0.34%
3.10%
3.51%
4.10%
9.76%
10.46%
10.87%
13.16%
16.65%
26.84%
Cash & Equivalent
Retailing
Consumer Durables
Gas
Transportation
Pharmaceuticals
Consumer Non Durables
Petroleum Products
Auto
Banks
Finance

Portfolio Holdings
TOP 10 Holdings
• TOP 5 Stocks % to NAV= 35.45% • Top 10 Stocks % to NAV= 57.24% • Currently we hold 25 stocks
Data as on Dec 31, 2017
Scrip Weightage (%)
Maruti Suzuki India Limited 8.67%
Housing Development Finance Corporation Limited 8.65%
HDFC Bank Limited 7.25%
Hindustan Petroleum Corporation Limited 5.71%
Bharat Petroleum Corporation Limited 5.16%
United Spirits Limited 4.72%
Eicher Motors Limited 4.48%
IndusInd Bank Limited 4.44%
Interglobe Aviation Limited 4.10%
PNB Housing Finance Limited 4.05%
Fund Manager
For Equity Component: Mr. Gautam Sinha Roy: Mr Gautam Sinha Roy: He has close to 13 years of rich and varied experience in fund management and research. He is the Fund Manager for the scheme Motilal Oswal MOSt Focused Dynamic Equity Fund and Motilal Oswal MOSt Focused Multicap 35 Fund He is also the Co- Fund manager for Motilal Oswal MOSt Focused 25 Fund. He has also worked with IIFL Capital (Singapore), Mirae Asset Global Investments, Edelweiss Capital and GE Capital Intnl. Services prior to joining Motilal Oswal group, where he has worked for the last four years. He is an alumnus of IIM Calcutta (2003) and holds a honors degree in Chemical Engineering.
For Foreign securities: Mr Swapnil Mayekar- Mr. Mayekar has 12 years of experience in the financial services industry. He has been part of fund management & product development team for Motilal Oswal Asset Management Company Limited (Mutual Fund) for last 5 years. His key area of expertise is quantitative analysis, creating customized indices, model testing and building research database. His last assignment was with Business Standard Limited as a Research Associate. He has done his post-graduation in Commerce (Finance Management) from University of Mumbai. Others Fund Managed by Mr. Swapnil Mayekar: Motilal Oswal MOSt Shares NASDAQ-100 ETF.
Fund Manager
For Debt Component: Mr Abhiroop Mukherjee- He is B.com (H), MBA with 10 years of experience in Trading Fixed Income Securities viz. He has also worked with PNB GILTS LTD. as a WDM Dealer. Funds Managed: Motilal Oswal MOSt Ultra Short Term Bond Fund. He is also the Fund manager for the debt component of Motilal Oswal MOSt Focused Midcap 30 Fund, Motilal Oswal MOSt Focused 25, Motilal Oswal MOSt Focused Multicap 35 Fund and Motilal Oswal MOSt Focused Long Term Fund.
Co-Fund Manager (For Equity Component) Mr. Siddharth Bothra: Mr Siddharth Bothra has a rich experience of more than 17 years in the field of research and investments. Prior to joining Motilal Oswal AMC he had an extensive stint with Motilal Oswal Securities ltd. as senior analyst in the institutional equities division covering various sectors. During his stint with Motilal Oswal Securities Ltd. Mr. Bothra won various recognitions such as: ZEE Business TV - India’s Best Analyst Awards 2009 Infrastructure, ET Reuters Starmine Awards No.1 Earnings Estimator 2009 Real Estate & No. 2 Stock Picker 2010 Real Estate Mr. Bothra has also worked with broking outfits like Alchemy Share & Stocks and VCK Share & Stocks in the past He holds an honors degree of MBA (Post Graduate Program) from ISB (Indian School of Business, Hyderabad), MBA International Student Exchange NYU Stern School of Business (New York) and B.Com (Honors). Funds Managed by Mr. Siddharth Bothra: Motilal Oswal MOSt Focused 25 Fund and co manages Motilal Oswal MOSt Focused 30 Fund & Motilal Oswal MOSt Focused dynamic equity fund.

Disclaimer