
Product Labeling - Motilal Oswal asset allocation based on Motilal Oswal Value Index (MOVI) Most...
25
Transcript of Product Labeling - Motilal Oswal asset allocation based on Motilal Oswal Value Index (MOVI) Most...

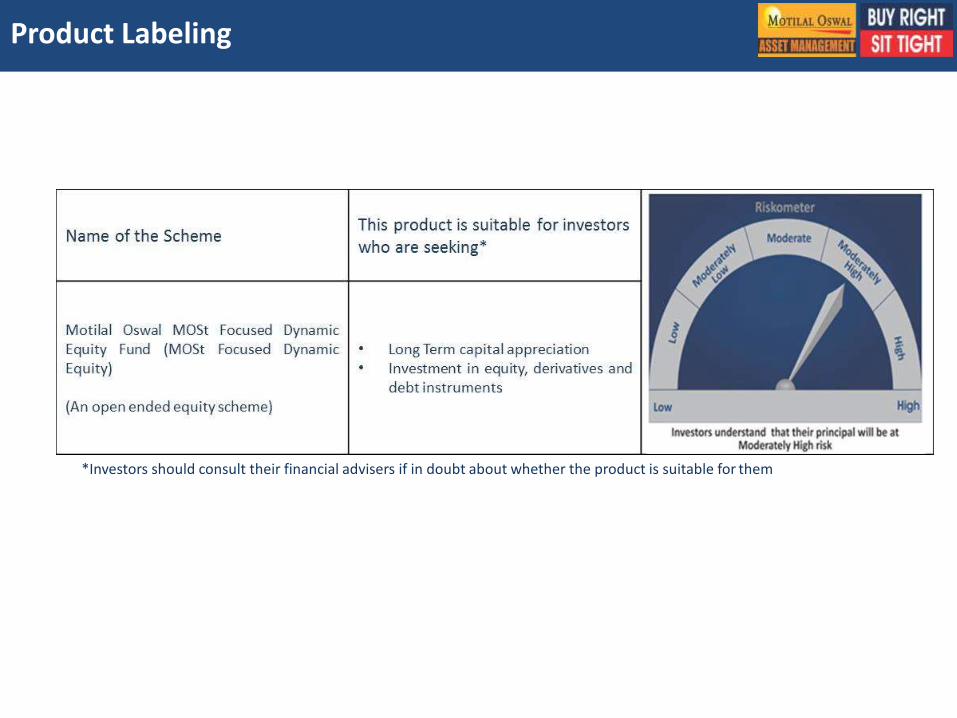
Product Labeling
*Investors should consult their financial advisers if in doubt about whether the product is suitable for them
Need for Asset Allocation?
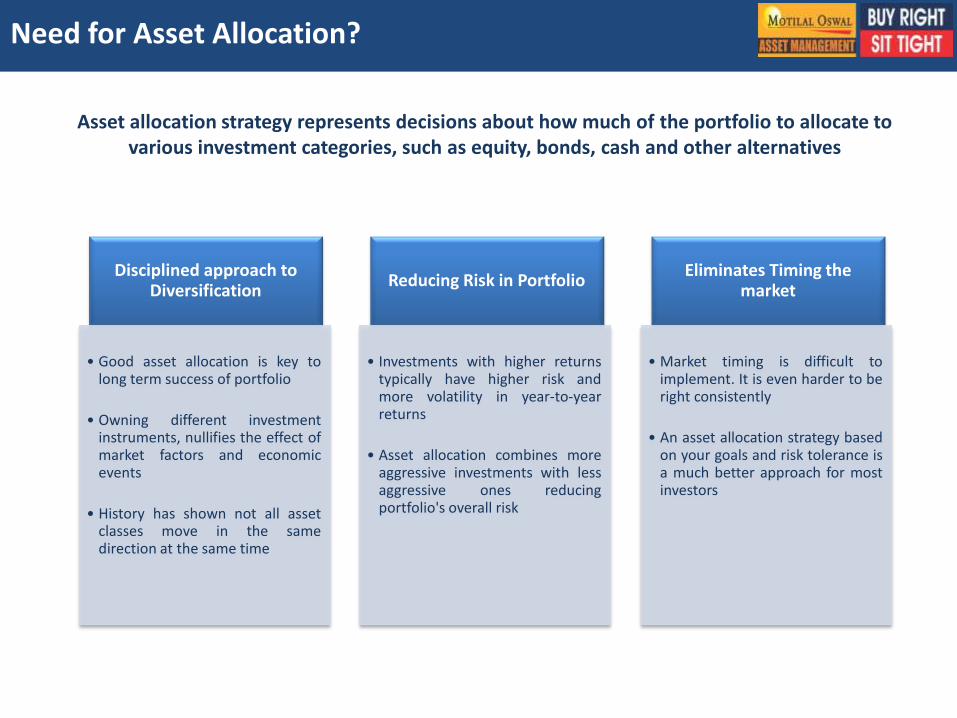
Asset allocation strategy represents decisions about how much of the portfolio to allocate to various investment categories, such as equity, bonds, cash and other alternatives
Disciplined approach to Diversification
• Good asset allocation is key to long term success of portfolio
• Owning different investment instruments, nullifies the effect of market factors and economic events
• History has shown not all asset classes move in the same direction at the same time
Reducing Risk in Portfolio
• Investments with higher returns typically have higher risk and more volatility in year-to-year returns
• Asset allocation combines more aggressive investments with less aggressive ones reducing portfolio's overall risk
Eliminates Timing the market
• Market timing is difficult to implement. It is even harder to be right consistently
• An asset allocation strategy based on your goals and risk tolerance is a much better approach for most investors

Why is it important?
Since different asset classes react differently to changing market and economic conditions, having an appropriate asset allocation can help you manage the ups and
downs of financial markets
“Timing the market is a fools game, whereas time in the market is your greatest natural advantage” – Nick Murray
“Mutual Funds were created to make investing easy, so consumers wouldn’t have to be burdened with picking individual stocks” – Scott Cook

What leads to Volatility?
Volatility
RBI/Government policy
Growth Concerns
Political Events
FII Flow Movements
DII Flow Movements
Quarterly Results
Global Macro Economic
Developments
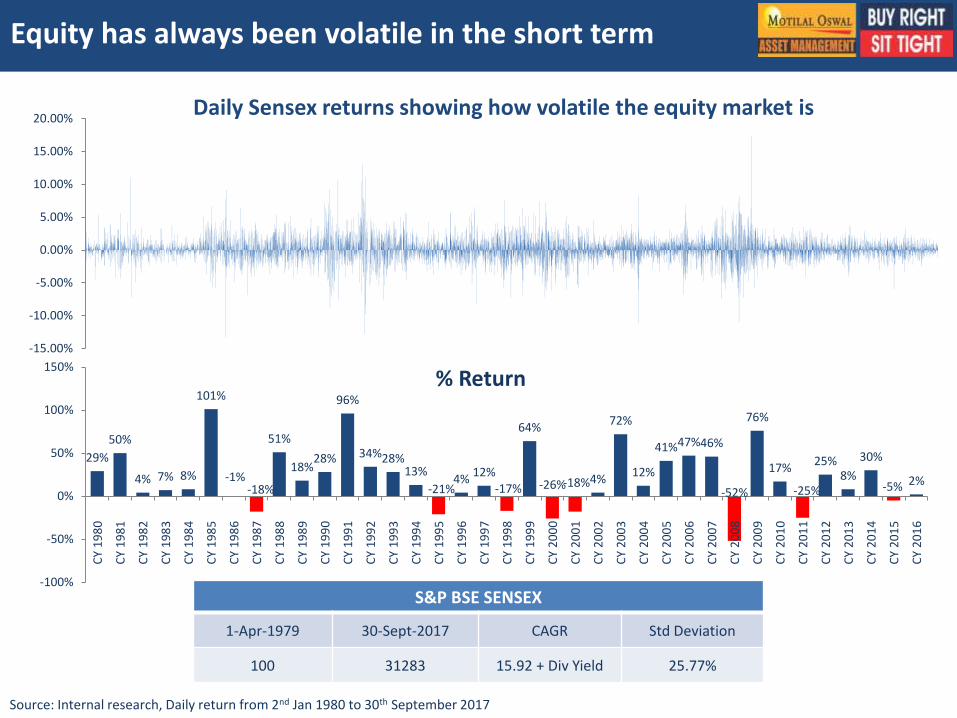
Equity has always been volatile in the short term
S&P BSE SENSEX
1-Apr-1979 30-Sept-2017 CAGR Std Deviation
100 31283 15.92 + Div Yield 25.77%
-15.00%
-10.00%
-5.00%
0.00%
5.00%
10.00%
15.00%
20.00%
Source: Internal research, Daily return from 2nd Jan 1980 to 30th September 2017
29%
50%
4% 7% 8%
101%
-1% -18%
51%
18% 28%
96%
34% 28% 13%
-21% 4%
12% -17%
64%
-26% -18% 4%
72%
12%
41% 47% 46%
-52%
76%
17%
-25%
25% 8%
30%
-5% 2%
-100%
-50%
0%
50%
100%
150%
CY
19
80
CY
19
81
CY
19
82
CY
19
83
CY
19
84
CY
19
85
CY
19
86
CY
19
87
CY
19
88
CY
19
89
CY
19
90
CY
19
91
CY
19
92
CY
19
93
CY
19
94
CY
19
95
CY
19
96
CY
19
97
CY
19
98
CY
19
99
CY
20
00
CY
20
01
CY
20
02
CY
20
03
CY
20
04
CY
20
05
CY
20
06
CY
20
07
CY
20
08
CY
20
09
CY
20
10
CY
20
11
CY
20
12
CY
20
13
CY
20
14
CY
20
15
CY
20
16
% Return
Daily Sensex returns showing how volatile the equity market is

Why is Dynamic Asset Allocation better than others?
Dynamic asset allocation Allocations are made between equity, debt/cash based on market
valuation parameters
Model Driven Rebalancing decisions are based on a well defined and time tested
model that removes biases of any kind
Tax Efficiency Allocation across different asset classes does not lead to any tax liability
in the hands of the investor. Tax treatment is the same as in equity
Fund for all markets Risk adjusted returns are similar to investments in Equity and with low
volatility across market conditions
MOSt Focused Dynamic Equity Fund
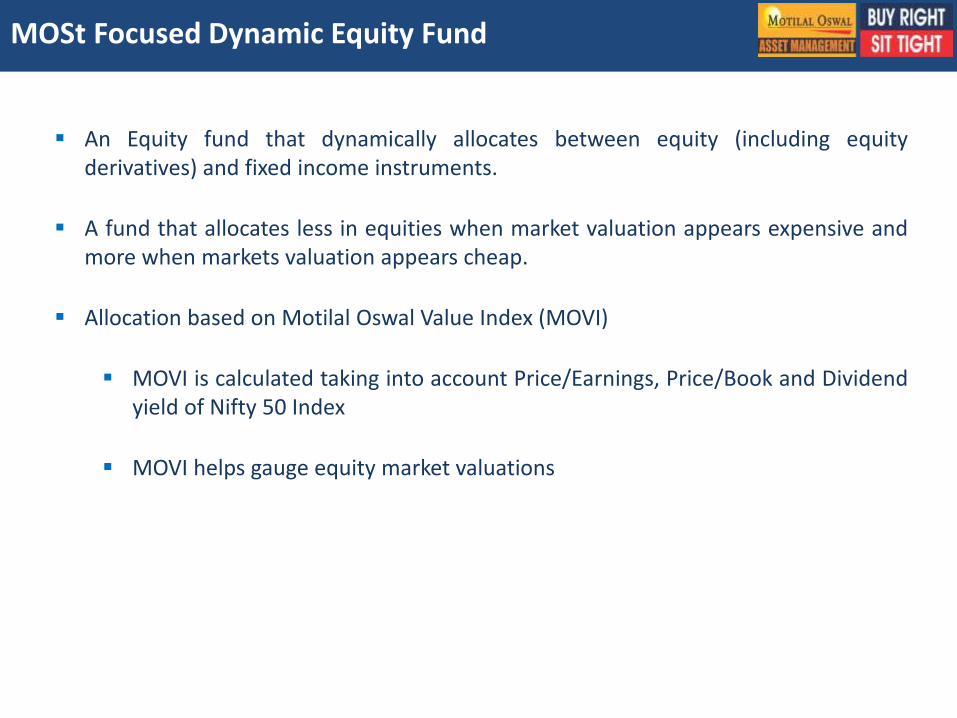
An Equity fund that dynamically allocates between equity (including equity derivatives) and fixed income instruments.
A fund that allocates less in equities when market valuation appears expensive and more when markets valuation appears cheap.
Allocation based on Motilal Oswal Value Index (MOVI)
MOVI is calculated taking into account Price/Earnings, Price/Book and Dividend yield of Nifty 50 Index
MOVI helps gauge equity market valuations

MOVI indicators
Price-Earnings Ratio (P/E) A valuation ratio of a
company's current share price compared to its per-
share earnings
P/E ratios are more useful to compare companies in the same industry
E.g. Two different sectors growing at different growth rates cannot be compared alone by P/E as IT companies will have a high P/E and a utility company will have a lower P/E
Dividend Yield A financial ratio that shows how much a company pays out in dividends each year relative to its share price
Dividend yield matters more to an income investor than it does to someone into growth stocks
E.g. Cyclical stocks maybe valued fairly by dividend yields of steady, mature businesses, such as utilities and banks, are generally good dividend payers
Price-To-Book Ratio (P/B) A ratio used to compare a stocks market value to its
book value
P/B is useful when you are looking at financial businesses
E.g. Banks are best valued by using P/B and service industry are not as it has more intangible assets

About the Scheme
The investment objective is to generate long term capital appreciation by investing in equity and equity related instruments including equity derivatives as well as debt instruments*
The fund endeavours to construct such a portfolio that the product is best suited for medium and long term investment
Dynamic asset allocation based on Motilal Oswal Value Index (MOVI) Most Market indices are price indices that provide market levels. As time
elapses, fundamentals of the market change MOVI helps investors gauge the investment attractiveness of the markets it
helps investors in understanding if the markets are cheap or expensive
Rebalancing of portfolio on fortnightly basis and a day prior to derivative expiry day on the Exchange (if the above days are a non-business day, the previous business day shall be considered for rebalancing)
*However there can be no assurance or guarantee the investment objective of the scheme would be achieved

MOSt Dynamic Equity Fund Allocation
# Asset allocation shall be reviewed twice a month i.e. 15th of every month and a day prior to derivative expiry day on the Exchange, additional rebalances may be at the discretion of the Fund manager
• High conviction focused portfolio based on the ‘Buy Right : Sit Tight’ investment philosophy
• Investments across market-capitalization and sectors • From 65-100% of the portfolio
• Asset Allocation based on MOVI #
• Net long only equity exposure shall be minimum of 30% of the portfolio value
• Arbitrage strategy – Cash vs Futures • Hedged position • Maximum upto 35% of the portfolio
• Instruments including Government Securities, Corporate Debt, Other debt instruments and Money Market Instruments
• Maximum upto 35% of the portfolio
Asset Allocation
Equity
Equity Derivatives
Debt

In-house Allocation through MOVI
Low MOVI = Cheap valuations Higher equity allocation when valuations are low
If one invests as per MOVI levels the returns on the basis of historical Nifty 50 are depicted below:
High MOVI = Expensive valuations Lower equity allocation when valuations are high
Net Equity exposure in MOSt Dynamic Equity Fund through MOVI
Month Net Equity Levels 30 DMA MOVI Value - Avg
Oct-16 54.04 109.24
Nov-16 60.82 106.57
Dec-16 56.37 102.51
Jan-17 57.08 102.42
Feb-17 55.70 105.86
Mar-17 55.65 108.72
Apr-17 42.27 109.9
May-17 41.29 110.69
Jun-17 44.38 112.91
Jul-17 44.95 114.94
Aug-17 44.54 118.52
Sept-17 44.77 120.42
MOVI Range Estimate Return (%) on basis of historical NIFTY 50 value
12 M 24 M 36 M
0 70 58.44% 38.08% 34.08%
70 80 31.68% 33.61% 31.26%
80 90 15.85% 22.32% 21.88%
90 100 17.53% 15.58% 14.95%
100 110 5.42% 5.69% 4.29%
110 120 4.98% 1.34% 2.51%
120 130 3.20% -4.26% 1.52%
130 160 -49.54% -5.56% 0.93%
Data as on 30th September 2017

Returns during stagnant market periods
Dynamic Equity Funds does bridge the gap between valuations and asset allocation for such investors, these funds combines equity, debt and equity arbitrage in to
suitable combination based on some pre-defined parameters which can reduce the volatility in the fund
Scenario Date Nifty Index Index Rebalanced
Returns Std Dev Returns Std Dev
A 21/12/2010 6,001
0.51% 17.62% 5.53% 11.75% 18/01/2013 6,064
B 25/05/2010 4,807
0.56% 18.55% 3.18% 11.18% 22/05/2012 4,861
C 08/06/2010 4,987
0.52% 18.08% 3.54% 11.27% 26/07/2012 5,043
D 01/11/2010 6,118
-0.27% 17.58% 4.29% 11.93% 11/02/2014 6,063
Scenarios A,B,C and D shows during stagnant market NIFTY 50 Dynamic has provided better returns with lesser volatility.
Returns are annualized. Index = Nifty 50; Index Rebalanced = Nifty 50 rebalanced on MOVI levels; Std Dev = Standard Deviation The above stagnant market periods are chosen to explain the concept and is for illustration purpose only and should not be used for development or implementation of an investment strategy. It should not be constructed as investment advice to any party. The above illustration is based on certain calculations and assumptions and involve known and unknown risks and uncertainties that could cause actual results, performance or event to differ materially from those expressed or implied in such table. Past performance may or may not be sustained in future Source : NSE, MOAMC Internal Analysis

Creates wealth in low volatility
Index Index - Rebased
Annualized Returns 12.61% 12.99%
Standard Deviation 23.35% 14.22%
Dynamic Asset allocation POWERS creation of wealth, and aims to PROTECT from downside during market corrections
• Index – Nifty 50; Index Rebalanced – Nifty 50 rebalanced based on MOVI levels • Scenario A – MOVI level was high (Market appears expensive), equity allocation has been reduced to 30% • Scenario B – MOVI level was low (Market appears cheap), equity allocation has been increased to 100%
Source : Motilal Oswal AMC Internal Research ; Data as on 30th September 2017
Scenario A
Scenario B
-
10
20
30
40
50
60
Jan
-04
Jul-
04
Feb
-05
Au
g-0
5
Mar
-06
Sep
-06
Ap
r-0
7
No
v-07
May
-08
Dec
-08
Jun
-09
Jan
-10
Jul-
10
Feb
-11
Sep
-11
Mar
-12
Oct
-12
Ap
r-1
3
No
v-13
May
-14
Dec
-14
Jul-
15
Jan
-16
Au
g-1
6
Feb
-17
Sep
-17
Index Index Rebalanced
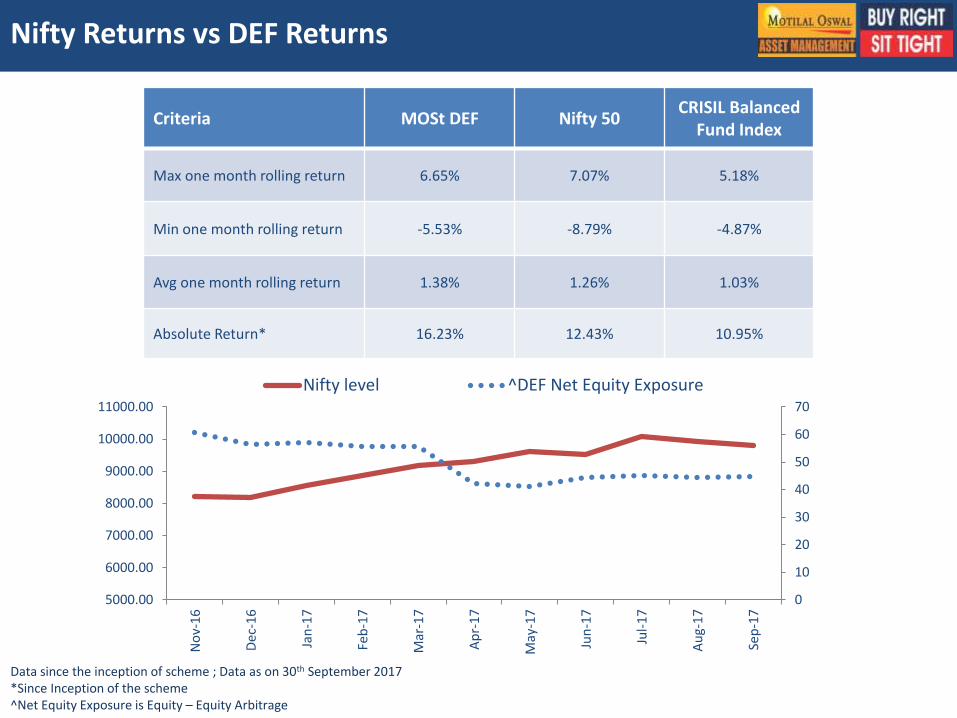
Nifty Returns vs DEF Returns
Data since the inception of scheme ; Data as on 30th September 2017 *Since Inception of the scheme ^Net Equity Exposure is Equity – Equity Arbitrage
Criteria MOSt DEF Nifty 50 CRISIL Balanced
Fund Index
Max one month rolling return 6.65% 7.07% 5.18%
Min one month rolling return -5.53% -8.79% -4.87%
Avg one month rolling return 1.38% 1.26% 1.03%
Absolute Return* 16.23% 12.43% 10.95%
0
10
20
30
40
50
60
70
5000.00
6000.00
7000.00
8000.00
9000.00
10000.00
11000.00
No
v-16
Dec
-16
Jan
-17
Feb
-17
Mar
-17
Ap
r-1
7
May
-17
Jun
-17
Jul-
17
Au
g-1
7
Sep
-17
Nifty level ^DEF Net Equity Exposure

Sector, Asset Allocation & Top 10 Holdings
Data as on 30th September 2017
Sector Allocation
Instrument Name Weightage %
Equity 79.52%
Bonds and NCDs 9.87%
Fixed Deposits 0.96%
CBLO 2.57%
Cash and Cash Equivalent (including Book Value of Futures)
41.83%
Equity Derivatives -34.75%
Total 100%
Asset Allocation
Top 10 Holdings Industry classification as recommended by AMFI
0.18%
0.99%
1.46%
1.89%
3.38%
4.21%
9.94%
10.88%
12.00%
14.40%
20.20%
Retailing
Industrial Products
Software
Transportation
Consumer Non Durables
Gas
Pharmaceuticals
Auto
Banks
Petroleum Products
Finance
Scrip Weightage (%)
Housing Development Finance Corporation Limited 8.57%
Bharat Petroleum Corporation Limited 7.68%
Maruti Suzuki India Limited 7.31%
HDFC Bank Limited 6.88%
Indian Oil Corporation Limited 6.72%
IndusInd Bank Limited 4.81%
Lupin Limited 4.43%
Petronet LNG Limited 4.21%
Max Financial Services Limited 3.83%
Eicher Motors Limited 3.56%

Current Tax Structure for Dynamic Equity Fund
The most beneficial part of a Dynamic Equity Fund is not only do you get the best of Equity and Debt market, but the tax treatment is the same as an Equity fund. Since a 65% gross Equity exposure is maintained, the tax treatment* is as follows: • Dividend Distribution Tax : NIL • Short Term Capital Gain : 15% • Long Term Capital Gain: Nil (For investments held for more than 12 Months) (This tax structure is applicable for Individual and HUF) *as per current tax laws
Hence we see we get the best of both worlds: • Safety of a debt fund without the high tax implications and
• Returns of an equity market with lower volatility

Net Asset Value Movement
The Fund NAV and Index NAV are re-based to 10 as on 27th September 2016; Data as on 30th September 2017
11.6880
11.6300
9.0000
10.0000
11.0000
12.0000
Sep
-16
Oct
-16
Oct
-16
No
v-1
6
No
v-1
6
De
c-1
6
De
c-1
6
Jan
-17
Jan
-17
Feb
-17
Feb
-17
Mar
-17
Mar
-17
Mar
-17
Ap
r-1
7
Ap
r-1
7
May
-17
May
-17
Jun
-17
Jun
-17
Jul-
17
Jul-
17
Au
g-1
7
Au
g-1
7
Au
g-1
7
Sep
-17
Sep
-17
MOSt Focused DEF
CRISIL Balanced Fund Index
Systematic Withdrawal Plan (SWP)
What is SWP? • SWP enables investor to withdraw a regular sum from his investments at fixed percentage of the
original investments at a predefined frequency irrespective of the movement in market value of the investments and that would be subject to the availability of account balance of the investor
• It presently offers two options: • MOF – CP @ 7.5% p.a. of original cost of investment • MOF – CP @ 10% p.a. of original cost of investment
• MOF – CP is offered at a predefined frequency i.e. monthly, quarterly and annually
What are the benefits of SWP? • The plan generates regular cash flow • Tax efficiency - No implication of Capital Gains Tax provided the investments are held for 12
months • An investor can withdraw money as and when they need • As regular withdrawal average out return value helps saving an investor from market fluctuations
Note: First payout for SWP - Annual frequency will be processed after a year of completion from the date of investment and thereafter at the desired frequency opted by the investor.

Why Motilal Oswal AMC
Motilal Oswal Group possess legacy in equities for over 3 decade
Motilal Oswal AMC is chaired by Mr. Raamdeo Agrawal, one of the most honored and trusted name in the investing world
Presence across the length and breadth of India and also overseas
Basic Traits of our Investing Style
We invest in companies with operating leverage than financial leverage We do not believe in “timing the market”, rather we believe in “spending time in
market” We do not over diversify The businesses we invest, must have growth potential with economic moat We practise long-term Buy and Hold investing style

Motilal Oswal AMC – Investment Philosophy
Buy Right Sit Tight
‘Q’uality denotes quality of the business and management
‘G’rowth denotes growth in earnings and sustained RoE
‘L’ongevity denotes longevity of the competitive advantage or economic moat of the business
‘P’rice denotes our approach of buying a good business for a fair price rather than buying a fair business for a good price
Buy and Hold: We are strictly buy and hold investors and believe that picking the right business needs skill and holding onto these businesses to enable our investors to benefit from the entire growth cycle needs even more skill.
Focus: Our portfolios are high conviction portfolios with 20 to 25 stocks being our ideal number. We believe in adequate diversification but over-diversification results in diluting returns for our investors and adding market risk
QGLP

Why BUY RIGHT : SIT TIGHT is significant
Real wealth is created by riding out bulk of the growth curve of quality companies and not by trading in and out in response to buy, sell and hold recommendations.
This philosophy enables investor and manager alike to keep focus on the businesses they are holding rather than get distracted by movements in share prices.
An approach of buying high quality stocks and holding them for a long term wealth creation motive, results in drastic reduction of costs for the end investor.
While BUY RIGHT is largely the role of the portfolio manager, SIT TIGHT calls for involvement from the portfolio manager as well as investor. This brings in greater accountability from the manager and at the same time calls for better involvement and understanding from investor resulting in better education for the latter.
Long term multiplication of wealth is obtained only by holding on to the winners and deserting the losers.
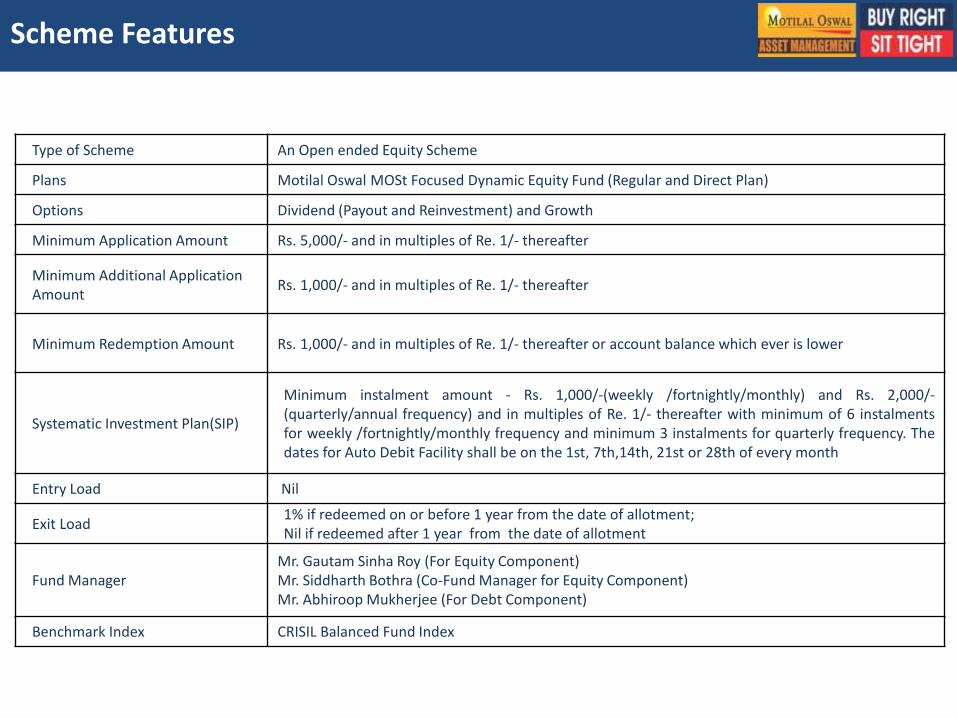
Scheme Features
Type of Scheme An Open ended Equity Scheme
Plans Motilal Oswal MOSt Focused Dynamic Equity Fund (Regular and Direct Plan)
Options Dividend (Payout and Reinvestment) and Growth
Minimum Application Amount Rs. 5,000/- and in multiples of Re. 1/- thereafter
Minimum Additional Application Amount
Rs. 1,000/- and in multiples of Re. 1/- thereafter
Minimum Redemption Amount Rs. 1,000/- and in multiples of Re. 1/- thereafter or account balance which ever is lower
Systematic Investment Plan(SIP)
Minimum instalment amount - Rs. 1,000/-(weekly /fortnightly/monthly) and Rs. 2,000/- (quarterly/annual frequency) and in multiples of Re. 1/- thereafter with minimum of 6 instalments for weekly /fortnightly/monthly frequency and minimum 3 instalments for quarterly frequency. The dates for Auto Debit Facility shall be on the 1st, 7th,14th, 21st or 28th of every month
Entry Load Nil
Exit Load 1% if redeemed on or before 1 year from the date of allotment; Nil if redeemed after 1 year from the date of allotment
Fund Manager Mr. Gautam Sinha Roy (For Equity Component) Mr. Siddharth Bothra (Co-Fund Manager for Equity Component) Mr. Abhiroop Mukherjee (For Debt Component)
Benchmark Index CRISIL Balanced Fund Index

Fund Managers
For Equity Component: Mr Gautam Sinha Roy : He has close to 14 years of rich and varied experience in fund management and research. He is the Fund Manager for the scheme MOSt Dynamic Equity Fund and MOSt Focused Multicap 35 Fund He is also the Co- Fund manager for Motilal Oswal MOSt Focused 25 Fund. He has also worked with IIFL Capital (Singapore), Mirae Asset Global Investments, Edelweiss Capital and GE Capital Intnl. Services prior to joining Motilal Oswal group, where he has worked for the last five years. He is an alumnus of IIM Calcutta (2003) and holds a honors degree in Chemical Engineering.
Co-Fund For Equity Component: Mr Siddharth Bothra : He has a rich experience of more than 17 years in the field of research and investments. Prior to joining Motilal Oswal AMC he was with Motilal Oswal Securities Ltd as senior analyst in the institutional equities division. He has also worked with broking outfits like Achemy Share & Stocks and VCK Share & Stocks in the past. He has done his Post Graduate Program (PGP) from Indian School of Business (ISB), Hyderabad Funds managed by Mr. Siddharth Bothra: Motilal Oswal MOSt Focused 25 Fund. He is also the Co-Fund Manager for Motilal Oswal MOSt Focused 30, Motilal Oswal MOSt Focused Multicap 35 Fund and Motilal Oswal MOSt Focused, Dynamic Equity Fund
Mr. Gautam Sinha Roy Fund Manager
Mr. Siddharth Bothra Co-Fund Manager
For Debt Component: Mr. Abhiroop Mukherjee : He is B.com (H), MBA with 10 years of experience in Trading Fixed Income Securities viz. He has also worked with PNB GILTS LTD. as a WDM Dealer. Other Funds Managed by Mr. Abhiroop Mukherjee : Motilal Oswal MOSt Ultra Short Term Bond Fund. He is also the Fund manager for the debt component of Motilal Oswal MOSt Focused Midcap 30 Fund, Motilal Oswal MOSt Focused 25, Motilal Oswal MOSt Focused Multicap 35 Fund and Motilal Oswal MOSt Focused Long Term Fund.
Mr. Abhiroop Mukherjee Fund Manager

Disclaimer
This presentation has been prepared and issued on the basis of internal data, publicly available information and other sources believed to be reliable. The information contained in this document is for general purposes only and not a complete disclosure of every material fact and terms and conditions and features of Motilal Oswal MOSt Focused Dynamic Fund (MOSt Focused Dynamic) . The information / data herein alone is not sufficient and shouldn’t be used for the development or implementation of an investment strategy. It should not be construed as investment advice to any party. All opinions, figures, charts/graphs, estimates and data included in this presentation are as on date and are subject to change without notice. While utmost care has been exercised while preparing this document, Motilal Oswal Asset Management Company Limited does not warrant the completeness or accuracy of the information and disclaims all liabilities, losses and damages arising out of the use of this information. The statements contained herein may include statements of future expectations and other forward-looking statements that are based on our current views and assumptions and involve known and unknown risks and uncertainties that could cause actual results, performance or events to differ materially from those expressed or implied in such statements. Readers shall be fully responsible/liable for any decision taken on the basis of this presentation. No part of this document may be duplicated in whole or in part in any form and/or redistributed without prior written consent of the Motilal Oswal Mutual Fund/Motilal Oswal Asset Management Company Limited. Readers should before investing in the Scheme make their own investigation and seek appropriate professional advice. Please read Scheme Information Document (SID) and Statement of Additional Information (SAI) carefully before investing . IISL Disclaimer: Motilal Oswal Value Index (MOVI) is not sponsored, endorsed, sold or promoted by India Index Services & Products Limited (IISL). MOVI has been developed by MOAMC and IISL has calculated and maintained as per the specifications and requirements of MOAMC. IISL does not make any representation or warranty, express or implied regarding the advisability of investing in the products linked to MOVI and availing the services generally or particularly or the ability of MOVI to track general stock market performance in India. Please read the full Disclaimers in relation to the MOVI in the Scheme Information Document. Statutory Details: Constitution: Motilal Oswal Mutual Fund has been set up as a trust under the Indian Trust Act, 1882. Trustee: Motilal Oswal Trustee Company Limited. Investment Manager: Motilal Oswal Asset Management Company Ltd. (CIN: U67120MH2008PLC188186) Sponsor: Motilal Oswal Securities Ltd Past performance of the Sponsor/ AMC/ Mutual Fund and its affiliates does not indicate the future performance of the scheme and may not provide a basis of comparison with other investments.
Mutual fund investments are subject to market risks, read all scheme related documents carefully.