Product | English · Data storage in the measuring devices Functional monitoring of measuring...
24
Product | English ENERGY DATA MANAGEMENT visual energy 4 One System. Best Solutions. visualenergy Webbased Energy Management
Transcript of Product | English · Data storage in the measuring devices Functional monitoring of measuring...
Product | English
ENERGY DATA MANAGEMENT
visual energy 4
One System. Best Solutions.
visualenergyWebbasedEnergy Management
RISING ENERGY COSTS CALL FOR
GOOD ENERGY MANAGEMENT
Capture
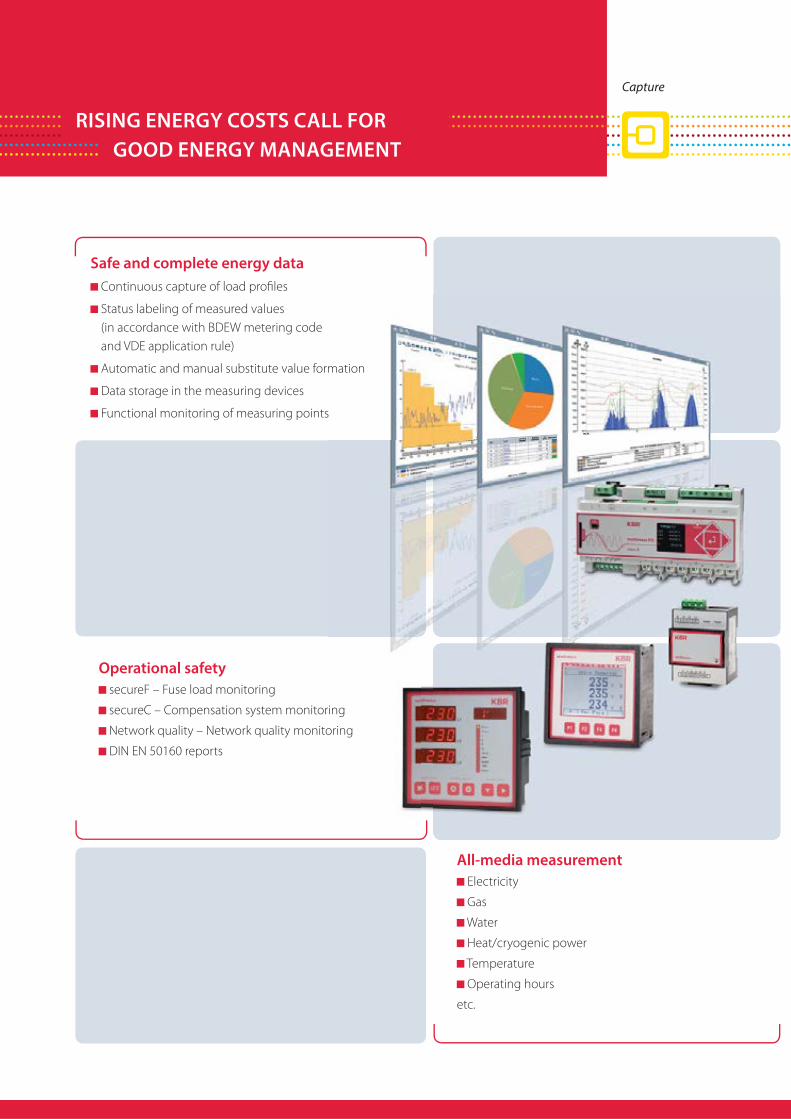
Safe and complete energy data
Continuous capture of load profi les
Status labeling of measured values
(in accordance with BDEW metering code
and VDE application rule)
Automatic and manual substitute value formation
Data storage in the measuring devices
Functional monitoring of measuring points
Operational safety
secureF – Fuse load monitoring
secureC – Compensation system monitoring
Network quality – Network quality monitoring
DIN EN 50160 reports
All-media measurement
Electricity
Gas
Water
Heat/cryogenic power
Temperature
Operating hours
etc.

OptimizingAnalyzingMonitoring Evaluating
One System. Best Solution
by your system provider
Measurement technology from KBR
Software from KBR
Service from KBR
Workshops by KBR
Energy data management
Load profi le evaluation
Consumption and billing management
Total power analysis
Cost center management
Energy use management
Automatic monitoring of energy volumes
Automatic accounting grids
using the energy fl ow diagram etc.
Service
On-site technicians at your service
In-house sales engineers at your service
Customized system commissioning including
"fully operational" handover
Service hotline - including remote access
to the customer system if required
Online customer service center
Video tutorials

visual energy 4
4 | 5
Web based energy data
and visualization soft-
ware visual energy 4
visual energy 4 is an open, web-based
energy data management system
with numerous options for capture,
monitoring, analysis and the opti-
mization of technical networks and
systems. Extensive functions, a clearly
structured user interface, intuitive
operation and easy adaptation to the
given technical infrastructure - what
better prerequisites for effi cient en-
ergy management.
Capture/import
Evaluation/analysis
Output/export
visual energyWebbasiertesEnergy Management
eBuseBus
Measurementof any media
Electricity Energy bus PDF
Water Modbus CSV
Heat/cryogenic
power OPC MSCONS
Gas MSCONS OPC
Signals/pulses
visualenergy
Webbasiertes
Energy Management
Mobile
Reliable energy data capture
and plausible evaluation ........................... 5
Manual and mobile meter reading .... 6
Automatic capture… .................................. 7
Automatic plausibility check
via the supply structure ............................. 8
Consumption monitoring ........................ 9
Evaluating measuring points and cost
centers ................................................................ 10
Automatic CSV and MSCONS
data export ...................................................... 11
Contents
Filter analysis ................................................... 12
Network quality monitoring ................. 13
Fuse monitoring secureF ........................ 14
Load management and
reactive current compensation .......... 15
System requirements client: ................. 18
System requirements server: ................ 18
10 major advantages
of visual energy 4: ........................................ 19
All-in-one systems ....................................... 20
Cloud ................................................................... 20

Overview
VIS
UA
L E
NE
RG
Y 4
visual energy 4 is an open solution
for reliable and continuous energy
data capture, automatic monitoring
and plausible evaluation. It is compat-
ible with the following data sources:
Manual meter reading
Mobile meter reading
using Android smartphones
Data import (MSCONS)
from the energy supplier
Automatic capture of meter read-
ings (electricity, gas, heat, water)
using standard Modbus measuring
devices
Automatic capture of meter
readings via OPC, e.g. M-Bus, BAC-
NET, Profi bus etc.
Automatic meter reading and
load profi le measurement
(electricity, gas, heat, water) using
KBR eBus measuring devices
visual energy 4 not only records the
readings, but also automatically veri-
fi es their plausibility on the basis of
the mapped supply structure. As a re-
sult, the error-prone creation of virtual
measurements is a thing of the past,
as is virtual data maintenance in the
event of changes. The system reliably
prevents measured values and energy
fl ow directions from being mixed up.
Furthermore, fuses in electrical
networks can be monitored, reac-
tive power compensated and power
peaks eff ectively reduced.
Automatic status labeling in accor-
dance with the BDEW metering code
and VDE application rule ensures that
the measurement values are transmit-
ted reliably. In conjunction with the
automatic and manual substitute
value formation, even time-critical
monthly bills are no longer a problem
in the event of interruptions to mea-
surement operations.
Take readings just like
energy providers do.
Reliable energy data capture
and plausible evaluation
Highlights
Open capture system
Visualization
Fuse monitoring
Load management
Reactive power
compensation
Status labeling
for all measured values
Certifi ed by the TÜV
(German Technical
Inspection Association)
ISO 50001
Ene
rg
iekosten
Your tool of choice for ISO 50001

visual energy 4
6 | 7
It is often not possible or advisable to
equip all existing consumption points
with bus capable metering units.
With visual energy 4, however, these
can still be easily integrated into the
system. You can either enter the meter
readings into a web form or use the
Android smartphone app provided.
Defi nition of reading ranges and
assignment of diff erent meter
readers
Defi nition of reading sequence
(travel path)
Central reading prompt
Data entry plausibility check
(meter reverse, zero consumption,
higher/lower consumption)
Meter change assistance
Manual and mobile meter reading…
Automatic ad hoc transfer
upon data connection
Automatic substitute value forma-
tion
The system automatically calcu-
lates the consumption totals from
the applicable meter readings. The
corresponding proportions for each
measuring period are then calcu-
lated by automatic substitute value
formation and saved. This way, the
manual metering points can be
processed and evaluated along with
the automatic load profi le measure-
ments in one and the same supply
structure.
Highlights
Incorporation of manually
recorded meter readings
Meter reader and reading
range management
Manual and periodic
meter reading prompting
Plausibility check
of readings
t
Recordedmeter reading 1
Recordedmeter reading 2Substitute value formation

Capture
VIS
UA
L E
NE
RG
Y 4
Highlights
Automatic periodic
capture
Automatic substitute
value formation
Load profi le simulation
for devices without
integrated memory
Real load profi le
measurement with
status labeling for
KBR eBus devices
…with Modbus devices
A universal driver makes it possible
to read the energy meters and some
instantaneous values from standard
Modbus RTU or Modbus TCP devices.
This is not limited to current measur-
ing devices. Measuring devices for
other media such as water or heat
meters can also be connected. The
periodic data capture process simu-
lates the load profi le measurement
process.
Diff erent media meters
Load profi le simulation
…by OPC
An integrated OPC client
(1.0, 2.0, 3.0 DA) makes it possible to
take meter readings and instanta-
neous value readings from OPC serv-
ers. The periodic data capture process
simulates the load profi le measure-
ment.
Diff erent media meters
Load profi le simulation
Automatic capture…
…with KBR eBus devices
KBR eBus delivers maximum reliability
and convenience. Time and period
synchronization are done automati-
cally. Normally, the devices feature a
load profi le memory with status label-
ing. Depending on the user rights,
the devices can also be confi gured
using the web interface. A dedicated
parameter monitoring feature can
detect and, where applicable prevent,
interference with the device by the
user.
Automatic fuse monitoring, secureF, is
another exclusive feature of KBR eBus
measuring devices, along with event,
device log and switching operations
memory support and automatic error
message functions.
Time and period synchronization
Device confi guration
via web interface
Parameter monitoring
Real internal load profi le memory
secureF fuse monitoring
Event, device log and switching
operations memory
Automatic error message
functions
visual energy 4
8 | 9
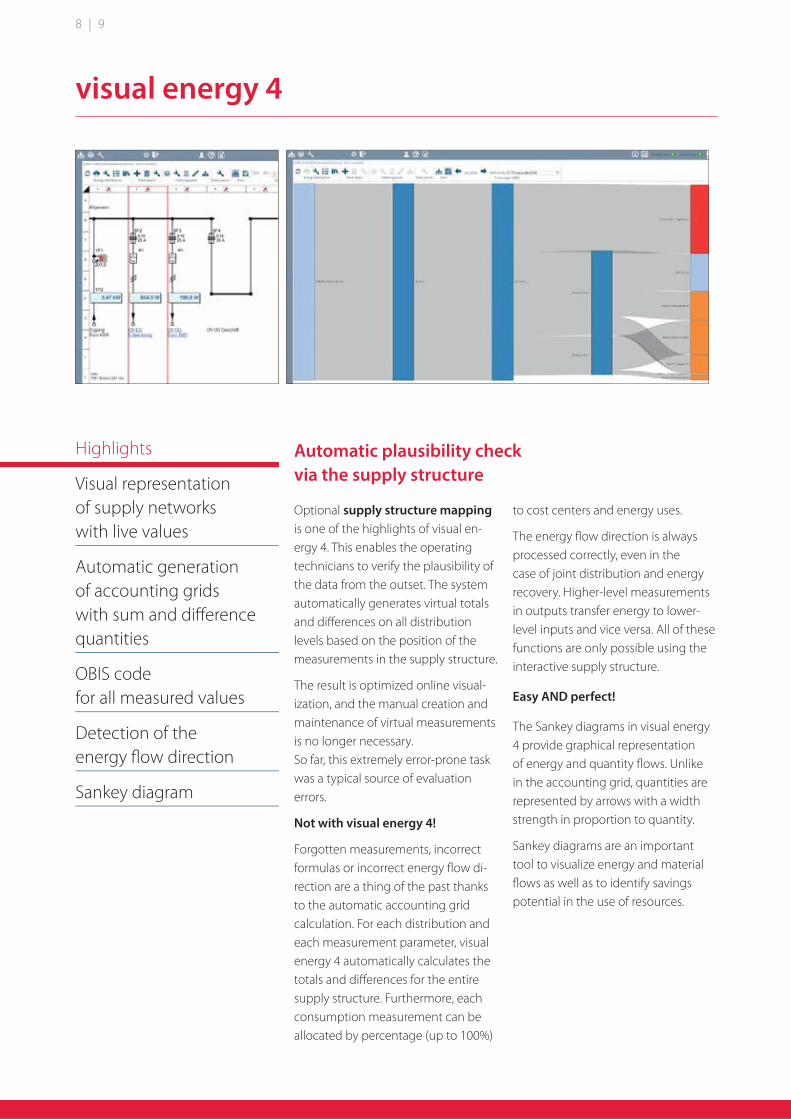
Highlights
Visual representation
of supply networks
with live values
Automatic generation
of accounting grids
with sum and diff erence
quantities
OBIS code
for all measured values
Detection of the
energy fl ow direction
Sankey diagram
Optional supply structure mapping
is one of the highlights of visual en-
ergy 4. This enables the operating
technicians to verify the plausibility of
the data from the outset. The system
automatically generates virtual totals
and diff erences on all distribution
levels based on the position of the
measurements in the supply structure.
The result is optimized online visual-
ization, and the manual creation and
maintenance of virtual measurements
is no longer necessary.
So far, this extremely error-prone task
was a typical source of evaluation
errors.
Not with visual energy 4!
Forgotten measurements, incorrect
formulas or incorrect energy fl ow di-
rection are a thing of the past thanks
to the automatic accounting grid
calculation. For each distribution and
each measurement parameter, visual
energy 4 automatically calculates the
totals and diff erences for the entire
supply structure. Furthermore, each
consumption measurement can be
allocated by percentage (up to 100%)
Automatic plausibility check
via the supply structure
to cost centers and energy uses.
The energy fl ow direction is always
processed correctly, even in the
case of joint distribution and energy
recovery. Higher-level measurements
in outputs transfer energy to lower-
level inputs and vice versa. All of these
functions are only possible using the
interactive supply structure.
Easy AND perfect!
The Sankey diagrams in visual energy
4 provide graphical representation
of energy and quantity fl ows. Unlike
in the accounting grid, quantities are
represented by arrows with a width
strength in proportion to quantity.
Sankey diagrams are an important
tool to visualize energy and material
fl ows as well as to identify savings
potential in the use of resources.
VIS
UA
L E
NE
RG
Y 4
Plausibility check and monitoring
Highlights
Communication
monitoring
Device parameter
monitoring
Absolute value monitoring,
defi nable period
Relative value monitoring,
defi nable period
Consumption monitoring is instru-
mental in energy management. How-
ever, even with only a few measuring
point, this mass of data can quickly
become overwhelming.
For this reason, an integrated con-
sumption monitoring feature ensures
that neither unrealistically high nor
unrealistically low consumption val-
ues go unnoticed. The latter happens
particularly often if manual readings
are forgotten or if there is an interfer-
ence in the measurement operation.
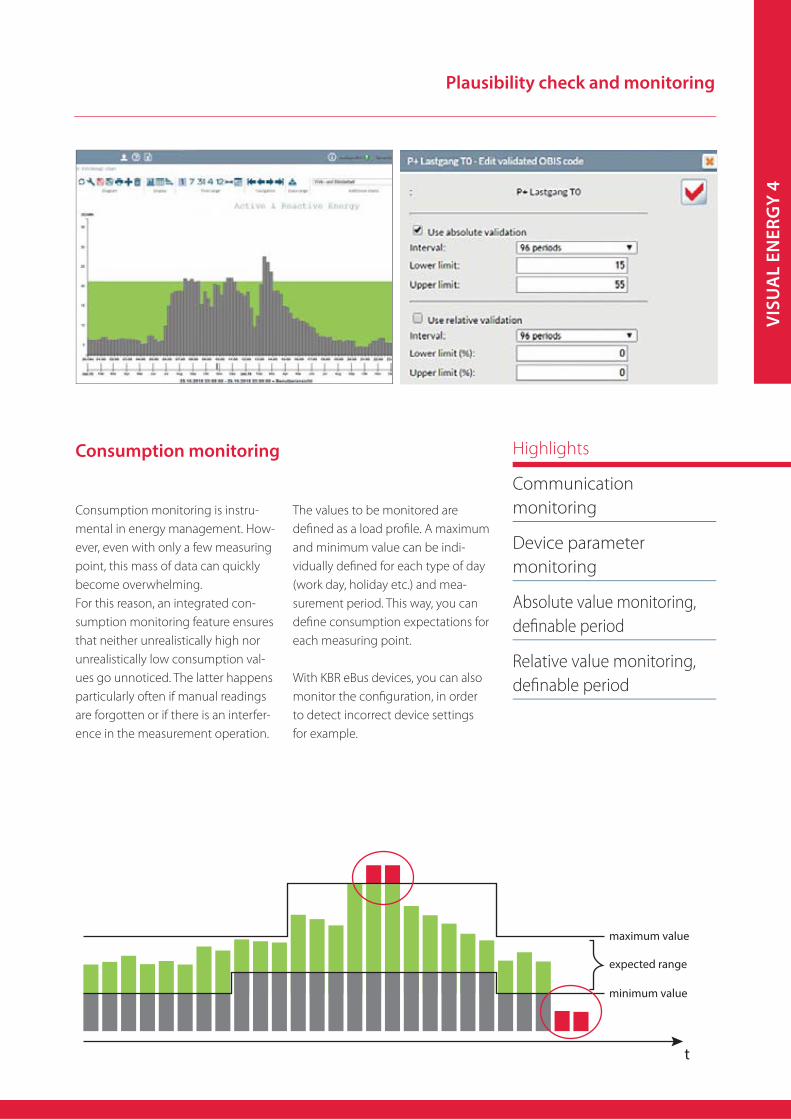
Consumption monitoring
The values to be monitored are
defi ned as a load profi le. A maximum
and minimum value can be indi-
vidually defi ned for each type of day
(work day, holiday etc.) and mea-
surement period. This way, you can
defi ne consumption expectations for
each measuring point.
With KBR eBus devices, you can also
monitor the confi guration, in order
to detect incorrect device settings
for example.
t
maximum value
expected range
minimum value

visual energy 4
10 | 11
Highlights
Scheduled
PDF reports
Quick and easy
chart analysis
Excel add-in
The system periodically generates
standard energy reports, which can be
forwarded or evaluated as a PDF fi le.
This ensures a high level of safety and
a low amount of work.
To be able to analyze the consump-
tion behavior, diagram views with
variable time axes are available. These
diagrams can be widely adapted and
individual diagrams saved in evalu-
ation folders for other users. Those
who want even more individuality can
create customized Excel spreadsheets
Evaluating measuring points and cost centers
using the integrated Excel interface.
Although this gives you access to
almost all information in the energy
archive, no programming skills are
required.
Excel generates typical evaluations at
the touch of a button.
MS Excel can thus be used as full
client access to the visual energy 4
archive.
UV 1 production -
unmeasured 50%
3 - H shelf
12.5%
3 - extruder
12.5%
UV 2 storage -
unmeasured
25%

Evaluation and export
The EDIFACT interface can be used
not only to import energy data but
also to xport stored measured data
and consumption values to other sys-
tems. The EDIFACT interface enables
communication with the energy sup-
plier, network operator or measuring
point operator.
If the export partner is an internal
ERP system that is equipped with an
EDIFACT interface, you can also make
use of the confi gurable scheduled
CSV export.
Automatic CSV and MSCONS data export
CSV cost center export
Benefi t from reliable capture and
automatic plausibility checks in visual
energy 4 without having to dispense
with your operational cost accounting.
The system automatically allocates the
accumulated consumption values to
plausible cost centers in line with the
confi gurable proportions.
These proportions can be consolidat-
ed in a confi gurable export and sent
to the accounting department via CSV.
Capture/import
Evaluation/analysis
Output/export
visual energyWebbasiertesEnergy Management
Measurementof any media
CSV
MSCONS
OPC
Electricity
Water
Heat/cryogenic
power
Gas
Signals/pulses
eBuseBusEnergy bus
Modbus
OPC
MSCONS
visualenergy
Webbasiertes
Energy Management
Mobile
Highlights
EDIFACT import
and export
Confi gurable, automatic
CSV export
VIS
UA
L E
NE
RG
Y 4
ENERGY DATA MANAGEMENT
ISO 50001
Gas, Water, Electricity, etc.Measure-mentmodules
CONTROLLING
ENERGYMANAGEMENT
OPERATING
TECHNOLOGY
KBR SUPPORT
FIRE
WA
LL
SQL DATABASE SERVER
SYSTEM CENTERmultisys
WEB SERVER
MultisysPower
eBus
Module busPulses
eBus
multimessPower
multimessPower
multimess
Multisio
multimessmultimess
MultisysPower
TCP / IP

Highlights
Consumption
behavior fi lters
Values can be analyzed for
several years
Real-time results
Setting fi lter
parameters
visual energy 4
12 | 13
To reduce the energy consumption,
the energy manager serves to detect
weaknesses in the energy consump-
tion behavior and
to initiate improvements.
This task can be performed easily and
effi ciently
with the fi lter analysis in visual
energy 4. With only a few clicks, any
consumption behavior, no matter
how complex,
can be represented and analyzed.
For the examination of a measuring
point,
the values are loaded (for several
years, if required). By means of the
adjustable parameters,
Filter analysis
the data is fi ltered individually.
The result is displayed after each
parameter change without any delay.
Adjustable parameters:
Year(s)
Month(s)
Week day(s)
Weekend
Off -peak period
Time
Value range
The parameters can be used
individually
or in combination.
Professional analysis.

VIS
UA
L E
NE
RG
Y 4
Highlights
Automatic creation of
DIN EN 50160 standard
report
Verifi cation of
network quality
Measured data from a
class A measuring device
Early detection of power
system disturbances
Evaluation and export / network quality
Production stops, as well as machine
or system failures, are tremendously
expensive for companies. In most
cases, these events are caused by
disturbances in the energy supply.
Often, a deterioration in network qual-
ity is caused by machines and systems
within the company. In most cases,
these problems are not detected until
Network quality monitoring
it is too late and the disturbances are
already aff ecting operations.
In combination with the class A
multimess D9-PQ measuring device,
visual energy continuously monitors
the voltage quality and automatically
creates cyclical EN 50160 reports.

14 | 15
visual energy 4
Highlights
Warning in the event of
overload tendency
Warning if the fuse rating
is exceeded
Blown fuse alarm
In combination with KBR eBus
devices, visual energy 4 guarantees
continuous electrical fuse monitoring.
Maximum reliability with just a few
settings:
Early warning of overload
tendency
Immediate warning if
the fuse rating is exceeded
Blown fuse alarm
Monitoring confi guration
with just a few mouse clicks.
Most of the functions
have default system settings
Fuse monitoring secureF
Avoid unpleasant surprises by having
visual energy notify you in time.
Thanks to fl exible relay modules,
warning and alarm messages can
be easily linked to an error message
system.
Method for monitoringof fused outgoing circuits.
KBR security concept
secureF©
secureF and secureC
VIS
UA
L E
NE
RG
Y 4
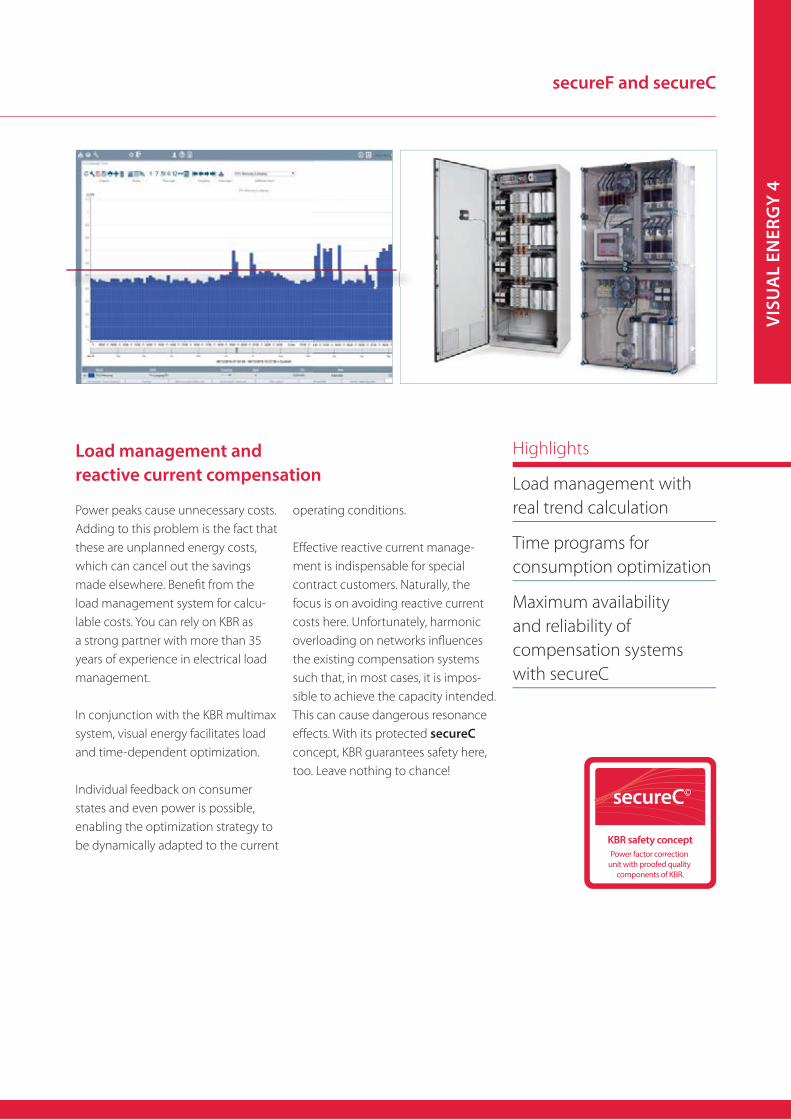
Highlights
Load management with
real trend calculation
Time programs for
consumption optimization
Maximum availability
and reliability of
compensation systems
with secureC
Power peaks cause unnecessary costs.
Adding to this problem is the fact that
these are unplanned energy costs,
which can cancel out the savings
made elsewhere. Benefi t from the
load management system for calcu-
lable costs. You can rely on KBR as
a strong partner with more than 35
years of experience in electrical load
management.
In conjunction with the KBR multimax
system, visual energy facilitates load
and time-dependent optimization.
Individual feedback on consumer
states and even power is possible,
enabling the optimization strategy to
be dynamically adapted to the current
Load management and
reactive current compensation
operating conditions.
Eff ective reactive current manage-
ment is indispensable for special
contract customers. Naturally, the
focus is on avoiding reactive current
costs here. Unfortunately, harmonic
overloading on networks infl uences
the existing compensation systems
such that, in most cases, it is impos-
sible to achieve the capacity intended.
This can cause dangerous resonance
eff ects. With its protected secureC
concept, KBR guarantees safety here,
too. Leave nothing to chance!
Power factor correction unit with proofed quality
components of KBR.
KBR safety concept
secureC©
16 | 17
visual energy 4
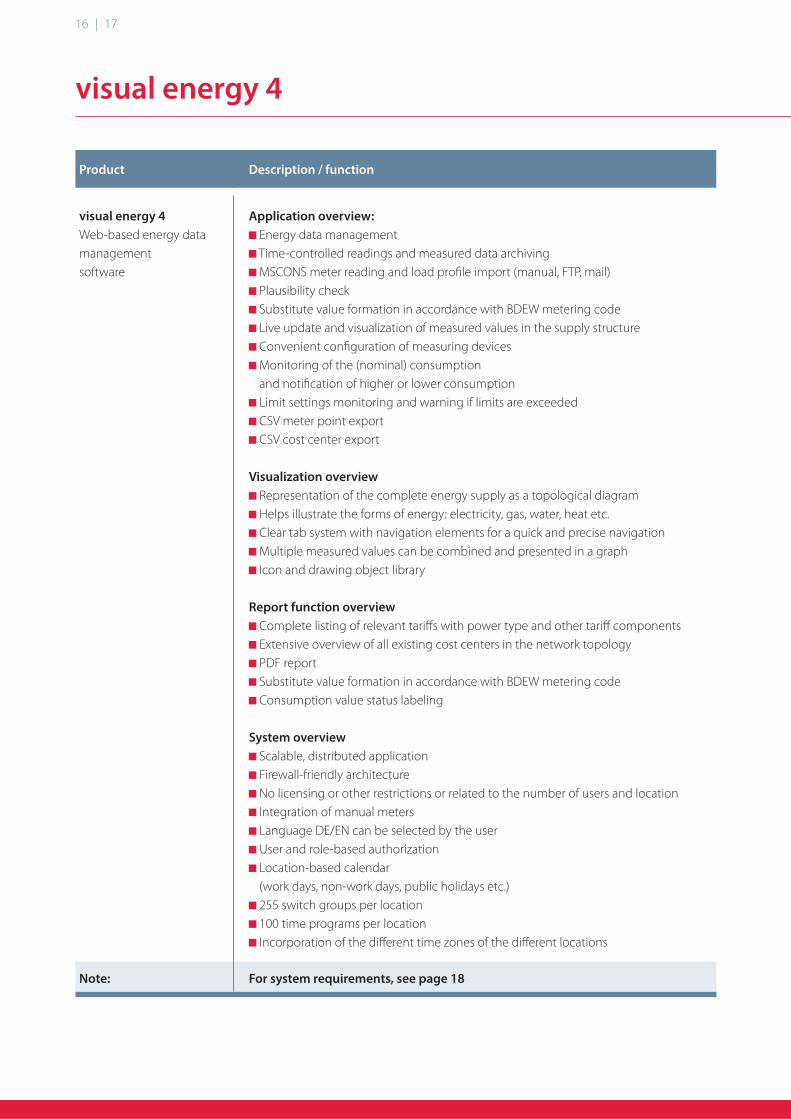
Product Description / function
visual energy 4
Web-based energy data
management
software
Application overview:
Energy data management
Time-controlled readings and measured data archiving
MSCONS meter reading and load profi le import (manual, FTP, mail)
Plausibility check
Substitute value formation in accordance with BDEW metering code
Live update and visualization of measured values in the supply structure
Convenient confi guration of measuring devices
Monitoring of the (nominal) consumption
and notifi cation of higher or lower consumption
Limit settings monitoring and warning if limits are exceeded
CSV meter point export
CSV cost center export
Visualization overview
Representation of the complete energy supply as a topological diagram
Helps illustrate the forms of energy: electricity, gas, water, heat etc.
Clear tab system with navigation elements for a quick and precise navigation
Multiple measured values can be combined and presented in a graph
Icon and drawing object library
Report function overview
Complete listing of relevant tariff s with power type and other tariff components
Extensive overview of all existing cost centers in the network topology
PDF report
Substitute value formation in accordance with BDEW metering code
Consumption value status labeling
System overview
Scalable, distributed application
Firewall-friendly architecture
No licensing or other restrictions or related to the number of users and location
Integration of manual meters
Language DE/EN can be selected by the user
User and role-based authorization
Location-based calendar
(work days, non-work days, public holidays etc.)
255 switch groups per location
100 time programs per location
Incorporation of the diff erent time zones of the diff erent locations
Note: For system requirements, see page 18

VIS
UA
L E
NE
RG
Y 4
Technical data
Product Description / function
multisys ... -BM-100
multisys ... -BM-300
visual energy 4 bus master, 19'' rack for 100 or 300 devices
eBus
Confi guration
of eBus and eBus devices
Automation
MSCONS export
100 time programs
with 25 actions each per location
250 switch groups per location
Device parameter monitoring
secureF fuse monitoring
Language DE/EN
can be selected by the user
Modbus
Universal driver
for electricity, gas, water and heat
quantity meters
Note: System completely installed on embedded computer
OPC option
(license option for multisys ... -BM)
KBR eBus OPC DA server (1.0, 2.0, 3.0)
OPC DA client (1.0, 2.0, 3.0)
Universal driver for electricity, gas, water and heat quantity meters
visual energy 4 mobile
(included in visual energy 4)
Android app for mobile meter reading
Quick and easy connection via QR code
Plausibility check on data entry
(zero consumption, higher/lower consumption, reverse fl ow...)
Meter point identifi cation via QR code scan
Meter change
Language DE/EN can be selected by the user
(Android system setting)
Excel add-in for visual energy 4
(included in visual energy 4)
Excel as client for visual energy 4 energy data
Toolbar and project window enable access to the supply structure
Extensive set of functions to access consumption values
and meter readings
Uses http web service to access energy data
Visual energy 4 user rights are factored in
Shared fi le storage in visual energy 4 web

18 | 19
visual energy 4 Technical specifi cations
System requirements
server:
The visual energy 4 system is a distrib-
uted application that requires a web
server, one or more eBus masters, as
well as clients. The communication
chart gives IT administrators an over-
view of the system's logs and func-
tions broken down into the individual
system components.
The following components are
required on the web server:
Microsoft Server version 2008 R2 SP1
or higher (except SBS variants)
Microsoft Internet Information
Services (IS from version 7) with
ASP.NET options
System requirements
client:
The clients require a current web
browser that can view SVG images
and PDF documents. Furthermore, Ja-
vaScript and CSS must be supported.
We recommend:
- Google Chrome
- Mozilla Firefox
- Microsoft Internet Explorer
(in the current version)
We only test web browsers using
the Windows operating system.
If you are using another operating
system (Linux, MacOS, ...),
this may result in certain constraints.
To use this add-in, MS Excel version
2007 or higher is needed.
Microsoft Message Queuing (MSMQ)
with http support options but
without Active Directory integration
Microsoft .NET Framework 3.5
(IIS installation)
From visuaual energy 4.7
Microsoft .NET Framework 4.6
Visual J# 2.0 (32-bit or 64-bit depend-
ing on the operating system) to en-
able the creation of online PDFs
In addition, nm SQL database is
required:
MS SQL Server version 2008
or higher, MS SQL Express

VIS
UA
L E
NE
RG
Y 4
10 great advantages of visual energy 4
+ Service hotline for customer sup-
port. The service agent can assist the
customer by accessing the customer's
system remotely. User manuals for
anything from device to software
(in English).
…and much more
+ Web-based software. Access to the
energy data management system
from any computer without the need
for client software. No licensing or
other restrictions related to the num-
ber of users and location. No addition-
al costs for separate client software.
User authorization system included.
The individual user rights can be freely
assigned.
+ Plausible energy consumption data
based on status labeling and substi-
tute value formation (in accordance
with VDE metering code). Thanks to
measuring point monitoring, 15-min-
ute load profi les and substitute value
formation, the user can create coher-
ent and plausible energy reports. The
energy data collected can be verifi ed
and recognized as being complete at
a glance.
+ Continuous load profi le capture
(electricity, gas, water, district heat
etc.) All measuring points, irrespective
of the form of energy, are recorded
with average values as common for
the respective medium and stored in
the measuring device memory. The
function of the measuring devices
and bus cables are constantly moni-
tored by the system center.
+ ISO 50001 certifi ed software eligible
for subsidies. Software solutions are
closely examined by the certifi er.
Software certifi cation by an offi cial
body facilitates ISO 50001 certifi cation
substantially.
+ Synchronization of all measuring
points in accordance with VDE meter-
ing code.
The metering code sets down the
minimum requirements that measur-
ing point operation and measure-
ments have to meet as defi ned in the
German Energy Industry Act.
+ Data Transfer in MSCONS format.
The MSCONS data format (Metered
Services CONSumption report
message) is used for Electronic Data
Interchange (in accordance with
EDIFACT requirements of the United
Nations) betwen trading partners
in the energy sector involved in
administration, commerce and
transport.
+ Representation of the entire energy
supply as a topological diagram. visual
energy 4 can process the diagram and
the relevant accounting grids. The
load profi les, consumptions reports
and accounting grids (total supply
- total consumption) are generated
automatically. The advantage here
is that errors in assigning measuring
points are ruled out almost entirely.
+ Graphic representation of consump-
tion values, peak load values and load
profi le data in freely defi nable periods.
PDF reports for evaluation and con-
sumption reports are automatically
generated and supplied to the user.
+ In the cost center, billing and energy
use management system, the measur-
ing points can be freely allocated from
0 – 100%. Each measuring point can
be freely assigned to a cost center or
energy use (e.g. lighting, compressed
air etc.) created by the user.
10 major advantages of visual energy 4:

20 | 21
visual energy 4
SERVICE
Customer
Energy Manager
Webbased
Energy Management
Webbased
Energy Management CustomerDSL - Router
KBR energy Bus
multisio
multimess
multisysPower
CustomerNETWORK
AIO and cloud systems
Highlights
No software is installed
on the customer's server
Complete EDM
on one hardware
Customer project
already created
Includes SQL
and web server
For anyone who wants to set up an
energy data management system
without any major IT investment,
KBR has developed AIO (all-in-one)
systems. With this off er, the software
is preinstalled along with the SQL and
web server. Furthermore, the entire
customer project can also be created
on the hardware before delivery to
the customer.
Introduce – connect – use.
All-in-one systems Cloud
If you do not want to worry about
database and software maintenance,
you can use the KBR cloud solution.
With your personal login, you can
access your data from any computer
anywhere around the world.
The most current version of the soft-
ware runs in a data center. KBR takes
care of data backup.
Just do your work
and let us do the rest.

YourmultiPLUS
with multimess
YourultiPL
with mu
ultime
US
+ Intelligent technology and
fl exible applications
+ Easy to integrate
as a stand-alone device
or system solution
+ Quick capture of many
electrical parameters
+ Maximum effi ciency
+ Long-lasting product quality
and sustainable benefi ts
+ Minimum expenditure
of time for installation
and maintenance+ Intuitive and safe operation
YourmultiPLUS
with multimess
Network analysisThe voltage quality is steadily decreasing. This is due to the
widespread use of power electronics that create harmonics which
infl uence the supply network.
To be able to record and evaluate these disturbances, KBR off ers
the high-quality network analyzer multilog .
p Automatic evaluation in accordance with EN 50160 and IEC 61000
p More than 2,000 measured values in parallel, with a fault recorder ensuring consistency
p Highest possible measuring accuracy in accordance with IEC 61000-4-30, class A
p Recording time of up to a year
CompensationReactive power compensation and improvement of the network
quality are essential aspects of KBR Power Quality. KBR develops
and produces the components for the compensation systems in its
own production facilities. Our Power Quality team off ers network
analyses, on-site troubleshooting and passive as well as active
power fi lters in order to improve grid quality.
p Reducing reactive energy costs
p Increasing supply safety
p Increasing operational safety
ty
cordance with
values in parallel, with a fault ncy
g th
year
POWER
QUALITY
Power factor correction unit with proofed quality
components of KBR.
KBR safety concept
secureC©

Future-proof technology
High precision and
performance in »Made in
Germany« quality off er the
best conditions
for modern energy
management.
MULTIMESS:
MEASURE, MEASURE, MEASURE AND MORE ...
With our energy measuring
devices, effi cient energy
management is very easy.
We will be happy
to advise you.
Product consulting:
+49 (0) 9122 6373-0
VoltageV
Apparent power
Consumption
Load profi lesharmonic
Frequency
… and many more parameters
Reactive power
Active power
AT
QV
P(t) cosφ
Harm.U
Hz
Network performance λ tot
Electricity
Limits
+
Maximum values
Comprehensive range
of applications
Be it as a stand-alone
device or in a system –
multimess is a superior
multimeter available in
several performance
classes.

eBus
Modbus
ModbusTCP
Profi busDP
Capturing and documenting energy data has never been easier.
Whether it be standard and consumption values, load profi les or network
quality according to applicable standards: multimess energy measuring devices
meet the most diverse requirements with the highest level of safety and
precision.
Ethernet
eBus
eBus
TCP
Intuitive operation
Clear, functional user
interface design and LED
or LC displays provide a
good overview and easy
operation.
Comfortable monitoring
Easy monitoring,
evaluation and control of
all captured energy data
with the web-based analy-
sis software
visual energy 4
Flexible interfaces
The bus capability and
load profi le memory create
the basis for effi cient en-
ergy monitoring and safe
power networks.
© W
ave
bre
akM
ed
iaM
icro
|
Foto
lia
S
IGN
AL
S A
ND
EN
ER
GY
DA
TA

1536
6_ED
EPRO
0163
-181
6-1_
EN
Am Kiefernschlag 7D-91126 Schwabach, Germany
T +49 (0) 9122 6373 - 0F +49 (0) 9122 6373 - 83E [email protected]
www.kbr.de
KBR Kompensationsanlagenbau GmbH