Product Development Competition Cornell University Team ......EXECUTIVE SUMMARY Millennials are...
23
2014-2015 Ocean Spray Product Development Competition April 8, 2015 Cornell University Team Members Vanessa Moncayo (Captain), Juliet Leon, Michelle Maldonado, Xi Zhang, Yifan Cheng
Transcript of Product Development Competition Cornell University Team ......EXECUTIVE SUMMARY Millennials are...
2014-2015 Ocean Spray
Product Development Competition
April 8, 2015
Cornell University
Team Members
Vanessa Moncayo (Captain),
Juliet Leon,
Michelle Maldonado,
Xi Zhang,
Yifan Cheng

EXECUTIVE SUMMARY
Millennials are adventurous and health conscious and represent an important segment of
the snack market. This demographic is attracted to convenient foods that easily fit into
their busy lives. With snacking and gluten-free products on the rise, our team decided to
develop CranBo, a gluten-free fusion snack inspired by mochi, a traditional Japanese rice
cake. With a combination of America’s favorite flavors: cranberry, chocolate and
cinnamon, CranBo is a promising, healthy snack that will appeal to American Millennials
with its unique and bold flavor. Prior to developing this product, our target market was
asked their opinion of our product concept through a survey. “CranBochi”, our first
prototype, was received to the most of panelists positively, especially toward the
product’s appearance and the cranberry flavor. The product’s texture was heavily
criticized, however, as people found it to be too floppy and sticky and therefore difficult
to eat. With this feedback, our team worked on developing our second prototype,
“CranBo”, with an emphasis on product texture improvement as well as creating a better
nutritional profile. As a result, CranBo is a healthier option than most snacks on the
market as it is a “good source” of Vitamin C and dietary fiber. Cranberry is known as a
“superfruit” due to its high content of Vitamin C, minerals, and phytochemicals, and it
makes up 20.6% of CranBo’s formulation. One serving of CranBo (50g, 3 pieces)
provides 140 calories with 10% RDI of Vitamin C and 15% DV of fiber and includes
only 2g of fat.
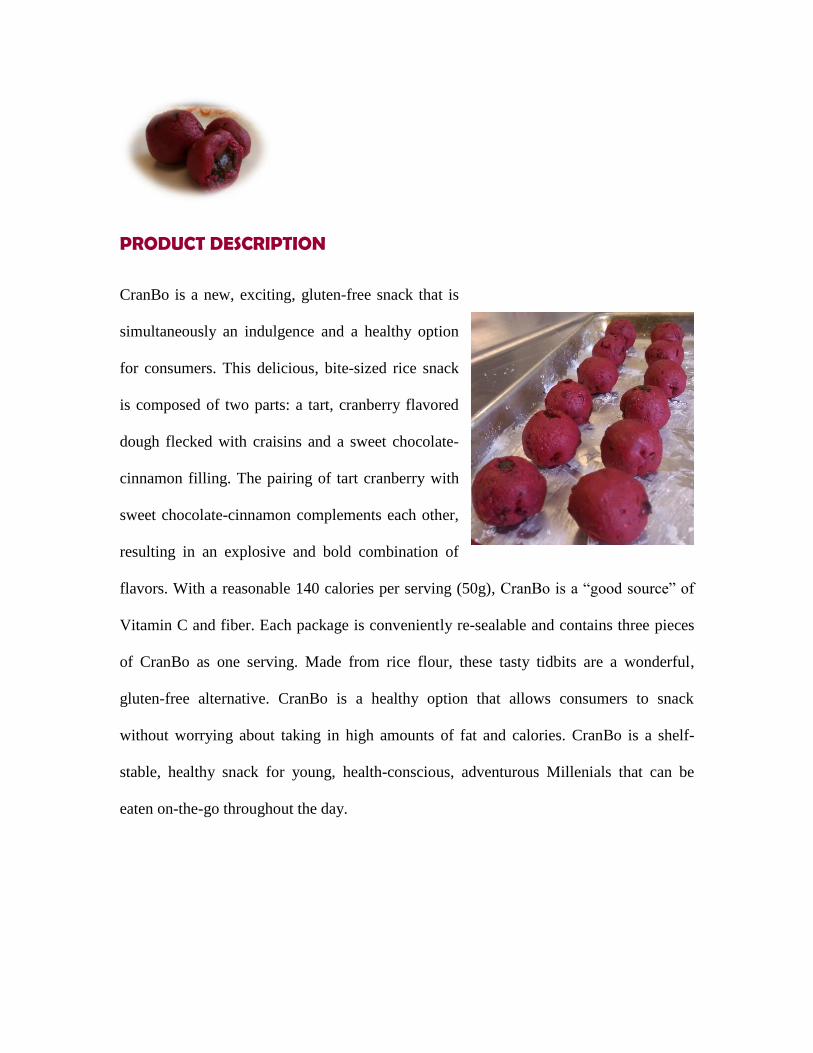
PRODUCT DESCRIPTION
CranBo is a new, exciting, gluten-free snack that is
simultaneously an indulgence and a healthy option
for consumers. This delicious, bite-sized rice snack
is composed of two parts: a tart, cranberry flavored
dough flecked with craisins and a sweet chocolate-
cinnamon filling. The pairing of tart cranberry with
sweet chocolate-cinnamon complements each other,
resulting in an explosive and bold combination of
flavors. With a reasonable 140 calories per serving (50g), CranBo is a “good source” of
Vitamin C and fiber. Each package is conveniently re-sealable and contains three pieces
of CranBo as one serving. Made from rice flour, these tasty tidbits are a wonderful,
gluten-free alternative. CranBo is a healthy option that allows consumers to snack
without worrying about taking in high amounts of fat and calories. CranBo is a shelf-
stable, healthy snack for young, health-conscious, adventurous Millenials that can be
eaten on-the-go throughout the day.

FORMULATION & INGREDIENTS
Cranberry concentrate is the main ingredient of CranBo and makes up 21% of the product.
Xanthan gum was added to the formulation to improve the texture of the product,
allowing it to keep its shape. Bamboo fiber was added to increase the dietary fiber in the
product, specifically as an insoluble fiber source. Sodium benzoate at 0.05% was
incorporated into both the cranberry dough and the sweet filling to control the growth of
bacteria and mold.
Ingredient
Amount/serving (g)
% Formula
Functionality Dough Filling
Cranberry Concentrate 10.28 - 20.56 Flavor, Vitamins, Antioxidants, Color
Granulated Sugar 8.00 1.85 19.68 Sweet Flavor
White Rice Flour 6.4 0.92 14.64 Product Base
Reduced Sugar Craisins 4.57 - 9.14 Flavor, Texture, Fiber, Vitamins
Corn Starch 2.97 0.92 7.79 Product Base
Water - 3.69 7.39 Hydration
Skim Milk 3.43 - 6.85 Hydration
Sweet cocoa powder - 2.31 4.62 Filling Flavor & Color
Grinded Oats 2.28 - 4.57 Soluble Fiber, Minerals, Vitamins
Bamboo Fiber 1.37 - 2.74 Insoluble fiber
Canola Oil 0.45 0.19 1.28 Xanthan Gum Dissolvent
Xanthan Gum 0.23 0.09 0.64 Binding Agent, Texture
Sodium Benzoate 0.02 0.01 0.05 Preservative
Grounded Cinnamon - 0.02 0.04 Filling Flavor
Total 40.00 10.00 100.00 ---
Table 1. Ingredient functionality and formulation per 1 serving of CranBo (50g)

WHY IS CRANBO A HEALTHY SNACK?
CranBo is a healthier option than other filled
fruit snacks on the market. One serving size of
CranBo (50g) consists of 3 pieces that can be
conveniently consumed throughout the day
thanks to its re-sealable packaging. This
serving size provides not only a good source
of dietary fiber (15% DV) and a good source
of Vitamin C (10% DRI), but also includes a
low fat content of 3% DV at only 140 calories.
Cranberry is considered a “superfruit” because
of its high Vitamin C and mineral content, but
especially because of its high amount of
phytochemicals such as proanthocyanidins,
flavonols and quercetin (Duthie, 2006).
Studies have demonstrated that cranberry has
the highest antioxidant and anti-proliferative
activity among the 10 most commonly
consumed fruits in the US (Sun, 2002). Figure 1. Nutritional label
2010 Dietary Guidelines for Americans recommends increased consumption of fruits and
vegetables because of their association with the reduced risk of many chronic diseases. 21%
of CranBo’s formulation is made up of cranberry concentrate which makes our product
an “antioxidant bomb” that can potentially deliver additional health benefits to consumers.

Nutrition Highlight Source Benefit
CRANBERRY
ANTIOXIDANTS
Cranberry concentrate
Craisins
Additional health benefits
beyond essential nutrients
Antioxidant → Scavenge free
radicals & may prevent aging &
some chronic diseases
Anti- proliferative & anti-
inflammatory activity
May reduce the risk of chronic
diseases: cardiovascular
diseases, cancers and
Alzheimer’s (Arai et al., 2000; Hertog et al.,
1993; Jiyoung Kim et al., 2010;
Knekt et al., 1996; Liu, 2003; Neto,
2007; Sun and Hai Liu, 2006)
GOOD SOURCE of
DIETARY FIBER
(15% DV)
Soluble Fibers
Craisins
Grinded Oats
Insoluble Fiber
Bamboo fiber
Grinded Oats
Combination of soluble &
insoluble fibers provides added
benefits to human health.
Soluble fiber (dissolves in water)
→ helps lower levels of glucose
as well as blood cholesterol (Brown et al., 1999).
Insoluble fiber helps food move
through digestive system →
promotes regularity & prevents
constipation
Fibers → lowers the risk of
various chronic diseases, such as
heart disease and type 2 diabetes (Liu et al., 2000; McKeown et al.,
2004; Pereira et al., 2004)
GOOD SOURCE of
VITAMIN C
(10% DRI)
Cranberry Concentrate
Better Vitamin C from natural
source
Table 2. Nutritional benefits of CranBo per serving size (50g)

SENSORY EVALUATION
To guide the development of our product, two sensory evaluations were performed.
Results of first test guided the reformulation of the texture of the product to make it less
sticky and give it a more solid shape. Size of the product was reduced by 50% to make it
easier to consume. The second sensory test was performed to confirm formulation and
overall acceptability of the second prototype, “CranBo”. The same format of the previous
test was used in addition to questions about perceived healthfulness, portion size and
pricing. All 40 panelists that participated in this
study belonged to the millennial age group.
Among the product acceptability components,
flavor and texture had the highest scores, with
68% of the participant’s responses in the liking
part of the scale ("Like extremely," "Like very
much," "Like moderately," and "Like slightly"). Results from the just-about-right scale
indicated that the majority of the panelists rated the cranberry flavor and the bitterness as
just about right. The attribute the panelists felt more divided on was the sweetness of
CranBo, with 50% of the panelists feeling it was not sweet enough and 40% of the
panelists rating it as just-about-right. The results are indicated in Figure 2. Compared to
the results obtained from the first sensory test, the just about right ratings for texture
improved. from 32% to 43%. The feedback obtained by the panelists indicated that an
increase in sweetness would be something that could be included in future formulation to
improve the product.

Figure 2. Just About Right attribute scale results of CranBo sensory evaluation
Panelists were asked to rank characteristics that would compel them to purchase CranBo.
48% of them ranked “presence of antioxidants from cranberries“ as the most important
characteristic, with the second most important factor (38%) being the fact that CranBo is
good source of dietary fiber. Regarding serving size, 83% of panelists indicated they
would consume one serving size (50g) of CranBo throughout the day.
Penalty analysis was conducted to combine data collected from overall acceptability
ratings with JAR data to evaluate the potential impact of being non-JAR on overall
product acceptability. There was a considerable number of panelists who felt that the
Cranbo was too sour. However, this fact did not affect the overall product acceptability
scores. A low level of sweetness was the only attribute that had a statistical significance
difference between hedonic scores of the non-JAR and JAR data.
0% 20% 40% 60% 80% 100%
Sweetness
Bitterness
Texture
JAR Scale results
Too much A little too much Just-about-right
A little too weak Too weak

Figure 3. Penalty analysis of CranBo sensory testing
MARKETING ANALYSIS AND STRATEGIC OVERVIEW
The snacking trend is increasing in popularity in the US, with the average number of
snacks consumed daily having increased from 1.9 in 2010 to 2.8 in 2014. Moreover,
consumers are constantly selecting better-for-you food alternatives (Crawford, 2015).
At the same time, gluten-free products are also on the rise. According to Mintel (2013),
gluten-free products’ sales increased 44% from 2011 to 2013, with sales growth
predictions of 48% from 2013 to 2016. Gluten-free food consumption is high among
young consumers, particularly under 35, since these consumers are very interested in
health trends and new diets (Pauk, 2013).
The Millenials are an important market segment to consider as by 2018 they are predicted
to make up 23% of the US population (Pauk, 2013). Millenials are looking for great
eating experiences and they consume a variety of snacks throughout the day. They tend to
eat what they want, when they want and where they want (FPD, 2014). More than 30% of
Millenials ages 18 to 34 are interested in gluten-free foods because they perceive them as
healthy (Pauk, 2013). When it comes to choosing snacks, 89% of Millennials consider
Not sweet enough
Too sweet
Not sour enough
Too sour
Not bitter enoughToo soft
Too chewyNot enough cranberry
Too bitter
0
0.5
1
1.5
2
2.5
0% 10% 20% 30% 40% 50% 60% 70%
Dro
p f
rom
mea
n
% of Responses
Drop from mean

craving as an important factor followed by comfort/convenience (86%) and healthiness
(83%). Portability is also a key factor. (FPD, 2014).
CranBo’s target market is Millennials ages 15 to 35 who are looking for healthy, single-
serve pouch snacks that fit their on-the-go lifestyles and established snacking routines.
CranBo’s unique, bold flavor, resulting from the mix of tart cranberry and sweet
chocolate-cinnamon, aims to attract taste-adventurous Millenials who like to try new
foods and new flavor combinations. Its bite-sized pieces (3 pieces/package) will appeal to
the Millenials’ tendency to carry snacks around, while its convenient re-sealable
packaging allows consumers to eat one serving size throughout the day. Furthermore,
CranBo was formulated from rice and oat flour in order to appeal to those Millennials
looking for gluten-free snacks. Visual appeal is fundamental for Millennials. They like to
see clean/neat designs and usually buy products packaged in transparent materials
because they want to see what they are buying (Forgrieve, 2014). With this in
mind, we polished our original logo to make it cleaner and to give it a
stronger visual impact. Specifically, we changed the expression of
the mascot because we want to suggest to the consumer that CranBo
has a bold-tart flavor. Also, the heart in the logo suggests the
healthiness of the product.
When marketing to Millennials, an emphasis on the nutritional value of the snack is
important. “Millennials view their food choices as healthier, more expensive, more
natural, less processed, and better-tasting than those of their Baby Boomer parents”
(Sloan, 2014). They are influenced by calorie counts and about two thirds of this
generation read nutrition labels. Over half of Millennials (56%) wanted something

healthy for their last snack (Sloan, 2014). In 2013, two thirds of consumers tried to
manage their weight by adding fiber to their diets. General well-being, weight
management, digestive health, energy boosting, and endurance are all things these
consumers hope to gain from eating more nutritional items (Sloan 2014).
Figure 4. SWOT Analysis of CranBo
Competitive landscape
CranBo will be sold in the shelf-stable snack aisle of supermarkets. Its uniqueness in
terms of appearance, flavor and especially nutritional value make it stand out from other
snacks. CranBo looks like an indulgent snack, but it is much more than that. Compared to
most filled fruit snacks, as well as gluten-free filled products, CranBo stands out as a
superior nutritional option. One serving (50g) of CranBo is packed with antioxidants
from the cranberry content and is a good natural source of Vitamin C. It provides 15%
DV of dietary fiber, containing soluble and insoluble fiber which could impart potential
health benefits such as lowered cholesterol levels and better digestion (Zelman, 2010).
STRENGHTS
Uniqueness: new bold flavor & texture
Nutritional Value: Higher than most
filled snacks on the market
Capital Investment: Low
OPPORTUNITIES
Consumers demand for better-for-you products is on the rise (Crawford, 2015)
More than 30% Millenials (18 to 34) are interested in gluten-free foods, as they perceive them as healthy (Pauk,
2013)
WEAKNESS
Narrower Market Segment:
-Tart flavor leaves out Millenials that preffer sweet flavors.
-Milk and soy allergens
THREATS
Changes in Millenials trends
Competition: reaction from other companies offering similar products
CranBo

Table 3. Comparison of nutrition values among filled fruit snacks in the market.
CRANBO’S SAFETY
Shelf-life: Formulation, processing and packaging choices were made in order
to guarantee CranBo’s shelf-stability of 3 months.
o CranBo has an Aw of 0.72. Water activity ≤ 0.85 inactivates pathogen growth.
o pH ≤ 4.6 is a barrier against pathogen growth. Due to its high cranberry
concentrate inclusion, dough and filling have pHs of 2.6 and 4.4 respectively.
o CranBo dough and filling components have sodium benzoate at 0.05% level,
which acts as a bacteriostatic and fungistatic agent under acidic conditions.
Brand Product description Calorie
(per
100g)
Fat
(%DV/100g)
Saturated
Fat
(%DV/100g)
Dietary
Fiber
(%DV/100g)
Vitamin C
(%RDI/100g)
CranBo
Cranberry
rice cake
with sweet
chocolate-
cinnamon
filling
280 6 2 30 20
Royal Family
Japanese
mixed
mochi
363 17 20 13 0
Yuki and Love
Red bean,
peanut, and
sesame
mochi
371 6 0 0 0
Great Value
Double
blueberry
filled
muffin
380 22 13 7 0
Little Debbie
Jelly cream
pies with
strawberry
filling
457 31 51 0 0
TastyKake
Jelly filled
sponge
cakes
368 12 14 0 0

o Each package of CranBo contains 3 pieces (50g) placed in a polystyrene tray and
wrapped with a clear polypropylene 1.2 mm self-sealing bag. An oxygen
scavenger will be added to the packaging to reduce oxygen levels in the
headspace and prevent the growth of molds, therefore increasing the shelf-life.
o Water activity (Aw) of packed CranBo was measured for 3 weeks at ambient
storage. Cranberry dough and sweet filling component showed no major changes
through time, which means product’s quality was kept impeccable. pH readings
for both components were performed as well and no significant changes were
found.
Figure 5. Water activity of cranberry dough and sweet filling over time
Processing: Processing of CranBo (Appendix II) is done in batches and in three
major steps: a) production of sweet filling b) production of cranberry dough and c)
forming step. The cranberry dough and sweet filling follow similar processing
steps. The main equipment needed for processing CranBo include: a steam kettle
with agitation (steam mixer), a mixer, and the encrusting machine, KN 550 Rheon.
0
0.1
0.2
0.3
0.4
0.5
0.6
0.7
0.8
0 0.5 1 1.5 2 2.5 3 3.5
wat
er a
ctiv
ity(
Aw
)
Time (Weeks)
Aw Dough Aw Filling

a) Sweet Filling Production: Sweet filling ingredients are placed together in a
steam mixer. Steaming of the filling is CCP1 (Appendix 3). Temperature should
be at least 60°C for at least 6.6 minutes in order to comply with the specifications
of the HACCP plan (Appendix III). This time-temperature combination assures
the absence of the biological hazard, Staphylococcus aureus. After steaming, the
filling blend is placed in a mixer hopper where xanthan gum previously dissolved
in canola oil (1:2 ratio) is added to provide the texture of the filling.
b) Production of cranberry dough: Cranberry dough ingredients are placed
together in a steam mixer. Steaming of cranberry dough is CCP2 (Appendix III)
and the temperature and time are at least 66°C for 6.6 minutes, enough to control
biological hazards, Bacillus cereus & Staphylococcus aureus.. After steaming, the
dough is taken to the mixer hopper where a combination of xanthan gum
previously dissolved in canola oil (1:2 ratio) is added to the dough. Xanthan gum
imitates the elasticity effect usually achieved by the presence of gluten in other
doughs. At this step, craisin pieces are added to the dough. Mixing time should be
enough to incorporate the craisin pieces homogeneously throughout the dough.
c) CranBo’s forming step: The Rheon KN550 encrusting machine has 2 hoppers
for placing the cranberry dough and sweet filling. The machine is adjusted to
portion the dough and filling in a 4:1 ratio. The machine extrudes and forms
perfectly filled balls. The speed can be adjusted as needed and the machine is able
to encrust up to 90 pieces/minute. After encrusting, the product is taken to
packaging and labeling. CranBo goes through a metal detector, CCP3 (Appendix
III), to assure the absence of any physical hazards.

CRANBO PRICING
Operating Cost
To minimize the initial investment in machinery and processing, facility manufacturing in
the beginning stage will be through copacking. Annual operating costs for CranBo were
established by adding together the estimated fixed and variable costs of production
(Tables 5 and 6). Wholesale packaging and ingredient costs, processing utilities, labor,
equipment depreciation, building insurance, contribution, and taxes were also
investigated. The unitary operating cost was estimated as $0.81 per serving. Each serving
contains three 16.7g CranBo balls (Appendix 4)
ITEM ($)
Variable Costs 2,299,531
Fixed Costs 85,000
TOTAL 2,384,531
Table 5. Annual operating costs
ITEM ($)
Office Rental 10,000
Labor 20,000
Contribution and taxes 55,000
TOTAL FIXED
COSTS 85,000
Table 6. Annual fixed costs
The breakeven point for the first year in such a copacking scenario is established as
2,107,143 product units, which means that the operating cost involved in production
would be met with the sale of 74% of the 2,950,000 product units produced.
Price/cost Evaluation:
The unitary operating cost of $0.81 enables the product to be sold at a wholesale price of
$1.36 and at a suggested retail price of $1.77 per container. Selling CranBo at $1.77 per
container would allow for a profit margin of 40% for the company, along with anticipated
sales indices such as commissions (4%), marketing (5%), losses (1%), and slotting fees

(20%) (Table e). Our retail price calculation has also included the commission for a
copacker, who usually asks for 20% of the unitary operating cost, about $0.16.
Capital Investment Estimate
Considering cost of freight, labor, vehicle, installation, taxes and contributions, it is
estimated that the company requires an investment of $253,000 for its implementation
(Table f). The first year of operation will be dedicated to overall implementation of the
project, with no cash inflow. In the second year, the company will start its production
with a total capacity of about 3 million units per year (2,950,000), which will be
increased by 8% every following year. To support the company’s total growth, 5% of the
total revenue in year 2 is used as reinvestment. The same practice is maintained through
year 5. Operating costs are estimated to increase by 7.5% every year starting at year 3. A
5-year cash-flow analysis (Table g) allows for the determination of a payback period of 2
years and 3 months or shorter, assuming that 80% or more of the produced CranBo units
are sold.
CHANGES MADE & CHALLENGES OVERCOME
Name: Changing name from CranBochi to CranBo sets our product apart from mochis
letting us advertise it as a filled fruit snack, marketing towards a larger consumer segment.
Cost Reduction: Flax seed was removed from formulation. And processing was made
simpler by removing chocolate drizzling (1st prototype).
Water Migration: 1st prototype presented water migration from filling to dough due to
a water activity difference. The product has been reformulated to have an Aw of 0.72 for
both components, helping to minimize water migration issues.

Figure 6. Evolution of the product from initial to final prototype
PROTOTYPES PICTURES
Floopy Texture &"difficult to eat"
Serving size: 1 piece: 50 g
Individually wrapped, MAP
Elaborated processing
↑nutrition (15% DV fiber)
Better texture
3 bite-size pieces/serving
Resealable package (O2 scavenger)
Simpler processing

References
Duthie, D. S. J. et al. (2006). The effects of cranberry juice consumption on antioxidant status
and biomarkers relating to heart disease and cancer in healthy human volunteers. Eur. J. Nutr. 45,
113–122.
Liu, R. H. (2003). Health benefits of fruit and vegetables are from additive and synergistic
combinations of phytochemicals. Am. J. Clin. Nutr. 78, 517S–520S.
Sun, J., Chu, Y.-F., Wu, X. & Liu, R. H. (2002). Antioxidant and Antiproliferative Activities of
Common Fruits. J. Agric. Food Chem. 50, 7449–7454.
Lawless, H. T. & Hildegarde H. (2010). Sensory Evaluation of Food: Principles and Practices.
2nd ed. New York: Springer.
U.S. Food and Drug Administration (2014). Subpart D. Specific requirements for nutrient content
claims. Part 101 Food Labeling. CFR - Code of Federal Regulations Title 21. Retrieved from
http://www.accessdata.fda.gov/scripts/cdrh/cfdocs/cfcfr/CFRSearch.cfm?fr=101.54
Pauk, Stephanie (2013). “The Rise of Gluten-Free”. Mintel Database.
Retrieved from:
http://www.foodmanufacturing.com/blogs/2014/09/how-millennials-are-making-their-mark-food-
packaging
Food Product Design (2014). “Factors Driving Millennials’ Snack Choices”.
Retrieved from:
http://www.foodproductdesign.com/news/2014/03/factors-driving-millennials-snack-choices.aspx
Forgrieve, J. (2014). “How Millenials are making their mark on food packaging”. Food
Manufacturing.
Retrieved from:
http://www.foodmanufacturing.com/blogs/2014/09/how-millennials-are-making-t heir-mark-
food-packaging
Crawford, Elizabeth (2015). “Increased snacking reshapes marketing strategies”. Food-Navigator
USA.
Retrieved from:
http://www.foodnavigator-usa.com/Markets/Increased-snacking-reshapes-marketing-strategies
Sloan, E. (2014, April 1). The Top Ten Functional Food Trends. Retrieved April 4, 2015,
Retrieved from:
http://www.ift.org/food-technology/past-
issues/2014/april/features/toptentrends.aspx?page=viewall
Zelman, K. (2010, January 1). Dietary Fiber: Insoluble and Soluble Fiber.
Retrieved from:
http://www.webmd.com/diet/insoluble-soluble-fiber

Appendix I: Sensory results for CranBo
Figure 1. Results from the hedonic scale
Appearance Texture Flavor Overall opinion
Mean 5.3 5.9 5.9 5.7
Standard D. 1.5 1.6 1.8 1.6 Table 1. Mean and Standard deviation of the results
Value Scale
9 Like extremely
8 Like very much
7 Like Moderately
6 Like slightly
5 Neither like nor dislike
4 Dislike slightly
3 Dislike Moderately
2 Dislike Very Much
1 Dislike extremely Table 2. Legend for the hedonic scale
Sweetness Sourness Bitterness Cranberry Texture
Mean 2.4 4.0 3.3 3.2 2.8
Standard Deviation 1.1 0.9 0.9 0.7 1.2
Percentage of JAR 40% 38% 70% 63% 43% Table 3. Just about right scale results with % of JAR votes
Value Scale
5 Too much
4 A little too much
3 Just-about-right
2 A little too weak
1 Too weak Table 4. Legend for Just-About-Right scale
0
1
2
3
4
5
6
7
8
9
Appearance Texture Flavor Overall opinion
Liking scale results

Appendix II Process Flow Diagram

Appendix III. HACCP Plan

Appendix 4. Pricing
ITEM Unit Unit Cost
($)
Processing Demand
(Units) Total Cost ($)
RAW
MATERIALS
Concentrate ton 4869.30 29.03 141,346.18
Sugar ton 9617.57 30.33 291,674.47
White Rice Flour ton 1347.58 21.59 29,099.58
Craisins ton 1559.77 6.74 10,511.91
Corn Starch ton 1278.68 4.04 5,170.52
Filtered Water a ton 60.00 1.89 113.56
Skim Milk ton 950.51 0.94 897.29
Sweet cocoa
powder ton 27704.47 11.49 318,216.91
Grinded Oats ton 1209.79 13.48 16,306.47
Bamboo Fiber ton 55115.00 10.11 557,162.32
Canola Oil ton 3069.12 0.08 236.31
Xanthan Gum ton 9027.94 10.90 98,401.70
Sodium Benzoate ton 77105.89 6.81 525,268.71
Cinnamon ton 11563.13 0.05 630.17
Raw Materials
Total
1,995,036.10
PACKAGING
PS unit 0.0025 2,950,000 7,375.00
Oxygen
Scavenger unit 0.003 2,950,000 8,850.00
Labels unit 0.1 2,950,000 295,000.00
Packaging total
302,375.00
UTILITIES
Energy kWh 0.15 800.00 120.00
Office Supplies Budgeted 2,000.00 1 2,000.00
Utilities Total
2,120.00
TOTAL VARIABLE COSTS $2,299,531.10
Table 5. Annual variable costs
a Expense on maintenance supplies are also accounted for
b PS is short for high-density polystyrene

ITEM ($)
Variable Costs 2,299,531.10
Fixed Costs 85,000.00
Total Operating Cost ($) 2,384,531.10
Units produced 2,950,000.00
Unitary Operating Cost ($/container) 0.81
Table 6. Annual unitary operating cost
ITEM SPECIFICATIONS %
1 Commissions 4
2 Marketing 5
3 Losses 1
4 Slotting Fees 20
5 Commercialization Index (1+…+4) 30
6 Profit Margin 40
Table 7. Sales indicates
ITEM ($)
Freight 200,000
Installation (PCs + Lab
equipment) 5,000
Vehicle 18,000
Taxes and Contributions 20,000
Eventual (unexpected expenses) 10,000
TOTAL 253,000
Table 8. Capital Investment estimate
ITEM Year
1 2 3 4 5
Receivable Accounts
Product Sales $0.00 $3,204,809.79 $3,461,194.58 $3,738,090.14 $4,037,137.36
TOTAL $0.00 $3,204,809.79 $3,461,194.58 $3,738,090.14 $4,037,137.36
Accounts Payable
Investment $253,000.00 $0.00 $0.00 $0.00 $0.00
Reinvestment $0.00 $160,240.49 $173,059.73 $186,904.51 $201,856.87
Operating Costs $0.00 $2,844,437.32 $3,057,770.11 $3,271,102.91 $3,484,435.71
TOTAL $253,000.00 $3,004,677.81 $3,230,829.84 $3,458,007.42 $3,686,292.58
Cash Flow -$253,000.00 $200,131.99 $230,364.73 $280,082.72 $350,844.78
Cumulative Cash Flow -$253,000.00 -$52,868.01 $177,496.72 $457,579.45 $808,424.22
Table 9. Cash-flow analysis