PRODUCER PRICE INDEXES AUSTRALIA · Mar 2009 Mar 2010 Mar 2011 Mar 2012 index no. 130 140 150 160...
36
7.2 –1.3 Imports 2.8 0.2 Domestic 3.4 0.1 Preliminary (Stage 1) commodities 4.8 –1.4 Imports 2.6 0.5 Domestic 2.8 0.3 Intermediate (Stage 2) commodities –0.6 –1.5 Imports 1.7 –0.1 Domestic 1.4 –0.3 Final (Stage 3) commodities (excl. exports) % change % change Mar Qtr 11 to Mar Qtr 12 Dec Qtr 11 to Mar Qtr 12 STAGE OF PRODUCTION KEY FIGURES FINAL (STAGE 3) COMMODITIES ! fell 0.3% in the March quarter 2012. ! mainly due to falls in the prices received for other agriculture (–17.7%), building construction (–0.2%) and industrial machinery and equipment manufacturing (–2.4%). ! partly offset by rises in the prices received for electricity, gas and water supply (+2.1%) and tobacco product manufacturing (+7.8%). ! rose 1.4% through the year to the March quarter 2012. INTERMEDIATE (STAGE 2) COMMODITIES ! rose 0.3% in the March quarter 2012. ! mainly due to rises in the prices received for petroleum refining (+3.1%), structural metal product manufacturing (+3.4%) and road freight transport (+1.0%). ! partly offset by falls in the prices received for metal ore mining (–3.3%) and coal mining (–4.5%). ! rose 2.8% through the year to the March quarter 2012. PRELIMINARY (STAGE 1) COMMODITIES ! rose 0.1% in the March quarter 2012. ! mainly due to rises in the prices received for petroleum refining (+3.4%), oil and gas extraction (+0.9%) and property operators and developers (+0.7%). ! partly offset by falls in the prices received for coal mining (–4.5%) and metal ore mining (–4.7%). ! rose 3.4% through the year to the March quarter 2012. KEY POINTS E M B A R G O : 1 1 . 3 0 A M ( C A N B E R R A T I M E ) M O N 2 3 A P R 2 0 1 2 PRODUCER PRICE INDEXES AUSTRALIA 6427.0 M A R C H Q U A R T E R 2 0 1 2 For further information about these and related statistics, contact the National Information and Referral Service on 1300 135 070. Final Stage Base 1998–99 = 100.0 Mar 2008 Mar 2009 Mar 2010 Mar 2011 Mar 2012 index no. 125 130 135 140 145 Final Stage Quarterly % change Mar 2008 Mar 2009 Mar 2010 Mar 2011 Mar 2012 % –1 0 1 2 INQUIRIES www.abs.gov.au
-
Upload
nguyendang -
Category
Documents
-
view
214 -
download
0
Transcript of PRODUCER PRICE INDEXES AUSTRALIA · Mar 2009 Mar 2010 Mar 2011 Mar 2012 index no. 130 140 150 160...

7.2–1.3Imports
2.80.2Domestic
3.40.1Preliminary (Stage 1) commodities
4.8–1.4Imports
2.60.5Domestic
2.80.3Intermediate (Stage 2) commodities
–0.6–1.5Imports
1.7–0.1Domestic
1.4–0.3Final (Stage 3) commodities (excl. exports)
% change% change
Mar Qtr 11 toMar Qtr 12
Dec Qtr 11 toMar Qtr 12
S T A G E O F P R O D U C T I O N
K E Y F I G U R E S
F I N A L ( S T A G E 3 ) C O M M O D I T I E S
! fell 0.3% in the March quarter 2012.
! mainly due to falls in the prices received for other agriculture (–17.7%), building
construction (–0.2%) and industrial machinery and equipment manufacturing (–2.4%).
! partly offset by rises in the prices received for electricity, gas and water supply (+2.1%)
and tobacco product manufacturing (+7.8%).
! rose 1.4% through the year to the March quarter 2012.
I N T E R M E D I A T E ( S T A G E 2 ) C O M M O D I T I E S
! rose 0.3% in the March quarter 2012.
! mainly due to rises in the prices received for petroleum refining (+3.1%), structural
metal product manufacturing (+3.4%) and road freight transport (+1.0%).
! partly offset by falls in the prices received for metal ore mining (–3.3%) and coal mining
(–4.5%).
! rose 2.8% through the year to the March quarter 2012.
P R E L I M I N A R Y ( S T A G E 1 ) C O M M O D I T I E S
! rose 0.1% in the March quarter 2012.
! mainly due to rises in the prices received for petroleum refining (+3.4%), oil and gas
extraction (+0.9%) and property operators and developers (+0.7%).
! partly offset by falls in the prices received for coal mining (–4.5%) and metal ore mining
(–4.7%).
! rose 3.4% through the year to the March quarter 2012.
K E Y P O I N T S
E M B A R G O : 1 1 . 3 0 A M ( C A N B E R R A T I M E ) M O N 2 3 A P R 2 0 1 2
PRODUCER PRICE INDEXES A U S T R A L I A
6427.0M A R C H Q U A R T E R 2 0 1 2
For further informationabout these and relatedstatistics, contact theNational Information andReferral Service on1300 135 070.
Final StageBase 1998–99 = 100.0
Mar2008
Mar2009
Mar2010
Mar2011
Mar2012
index no.
125
130
135
140
145
Final StageQuarterly % change
Mar2008
Mar2009
Mar2010
Mar2011
Mar2012
%
–1
0
1
2
I N Q U I R I E S
w w w . a b s . g o v . a u

3 May 2013March 2013
1 February 2013December 2012
2 November 2012September 2012
23 July 2012June 2012
RELEASE DATEISSUE (Quarter)FO R T H C O M I N G I S S U E S
B r i a n P i n k
Au s t r a l i a n S t a t i s t i c i a n
Data referenced in the Key Points and Commentary are available from the tables shown
in this publication, or in the corresponding tables of this publication on the ABS website
<http://www.abs.gov.au>.
DA T A RE F E R E N C E S
Any discrepancies between totals and sums of components are due to rounding.RO U N D I N G
From the September quarter 2012 issue, the ABS will introduce a number of changes as a
result of the Review of the Producer and International Trade Price Indexes. Outcomes of
the Review were announced in the Information Paper: Outcome of the Review of the
Producer and International Trade Price Indexes, 2012 (cat. no. 6427.0.55.004). The
changes include:
! Introduction of ANZSIC 2006 classification for the SOP indexes (see above, and the
Appendix in this issue);
! Changes to publication table names and SOP and PPI titles (see Chapter 5 of the
above Information paper);
! Changes to release dates – the ABS will delay the release of this publication by nine
working days. The Forthcoming Issues section (see above) has been updated to
reflect this change; and
! Re–referencing – all index numbers will be calculated on a new index reference
period of 2011–12. This will result in the index numbers for each index series being
reset to 100.0 for the financial year 2011–12. Period–to–period percentage changes
may differ slightly to those previously published due to rounding and the
re–referencing. These differences do not constitute a revision.
More information on the implementation of the outcomes of the Review, including
updated weighting patterns for the SOP and PPI series will be published in an
information paper to be released in October 2012.
CH A N G E S IN FU T U R E
RE L E A S E S
This issue includes an Appendix outlining the implementation of the Australian and New
Zealand Standard Industrial Classification, 2006 edition (ANZSIC 2006) for the Stage of
Production (SOP) indexes. The implementation of the ANZSIC 2006 for the SOP indexes
is one of a number of outcomes from a Review of the Producer and International Trade
Price Indexes, published by the ABS on 6 March 2012 (see below). The Appendix
contains correspondences between the old (ANZSIC 1993) and new (ANZSIC 2006) SOP
series currently released in Producer Price Indexes, Australia (cat. no. 6427.0), as well
as details of the SOP series that will be discontinued and expected new series.
CH A N G E S IN TH I S I S S U E
2 A B S • P R O D U C E R P R I C E I N D E X E S • 6 4 2 7 . 0 • MA R QT R 2 0 1 2
N O T E S

Mar2009
Mar2010
Mar2011
Mar2012
index no.
130
140
150
160Final (excl. exports)IntermediatePreliminary
COMPARISON OF SOP INDEXES: Base: 1998-99 = 100.0
In the March quarter 2012, the final (Stage 3) index fell 0.3%, the intermediate (Stage 2)
index rose 0.3% and the preliminary (Stage 1) index rose 0.1%. Through the year to the
March quarter 2012, the final (Stage 3) index rose 1.4%, the intermediate (Stage 2) index
rose 2.8% and the preliminary (Stage 1) index rose 3.4%.
The fall of 0.3% in the final (Stage 3) index reflected a decrease of 0.1% in the prices of
domestically produced products and a decrease of 1.5% in the prices of imported
products. The domestic component recorded falls in the prices received for other
agriculture (–17.7%) and building construction (–0.2%). Partly offsetting these falls were
rises in the prices received for electricity, gas and water supply (+2.1%) and tobacco
product manufacturing (+8.6%). The imports component recorded falls in the prices for
industrial machinery and equipment manufacturing (–3.5%) and other chemical product
manufacturing (–6.8%). Partly offsetting these falls were rises in the prices for petroleum
refining (+5.8%).
The rise of 0.3% in the intermediate (Stage 2) index reflected an increase of 0.5% in the
prices of domestically produced products and a decrease of 1.4% in the prices of
imported products. The domestic component recorded rises in the prices received for
petroleum refining (+3.4%), structural metal product manufacturing (+3.3%) and road
freight transport (+1.0%). Partly offsetting these rises were falls in the prices received for
coal mining (–4.5%) and metal ore mining (–3.2%). The imports component recorded
falls in the prices for basic chemical manufacturing (–4.2%), industrial machinery and
equipment manufacturing (–2.9%) and electrical equipment and appliance
manufacturing (–3.0%). Partly offsetting these falls were rises in the prices for petroleum
refining (+2.1%).
The rise of 0.1% in the preliminary (Stage 1) index reflected an increase of 0.2% in the
prices of domestically produced products and a decrease of 1.3% in the prices of
imported products. The domestic component recorded rises in the prices received for
petroleum refining (+3.4%), oil and gas extraction (+2.3%) and property operators and
developers (+0.7%). Partly offsetting these rises were falls in the prices received for coal
mining (–4.5%) and metal ore mining (–4.9%). The imports component recorded falls in
the prices for basic chemical manufacturing (–4.2%), paper and paper product
manufacturing (–4.4%) and industrial machinery and equipment manufacturing (–2.8%).
Partly offsetting these falls were rises in the prices for petroleum refining (+3.1%).
ST A G E OF PR O D U C T I O N
(S O P ) OV E R V I E W
A B S • P R O D U C E R P R I C E I N D E X E S • 6 4 2 7 . 0 • MA R QT R 2 0 1 2 3
S T A G E O F P R O D U C T I O N C O M M E N T A R Y

Additional commentary for Producer Price Indexes is available in the entry for Producer
Price Indexes, Australia (cat. no. 6427.0) on the ABS website <http://www.abs.gov.au>.
The additional commentary includes:
! Manufacturing industries producer price indexes
! Materials used in manufacturing industries
! Articles produced by manufacturing industries
! Construction industries producer price indexes
! Materials used in house building
! Output of the construction industry
! Service industries producer price indexes
WH E R E TO F I N D
AD D I T I O N A L
CO M M E N T A R Y
4 A B S • P R O D U C E R P R I C E I N D E X E S • 6 4 2 7 . 0 • MA R QT R 2 0 1 2
S T A G E O F P R O D U C T I O N C O M M E N T A R Y continued

SE R V I C E IN D U S T R I E S PR O D U C E R PR I C E IN D E X E S
Materials used in coal mining, index numbers and percentage
changes
18
MI N I N G IN D U S T R I E S PR O D U C E R PR I C E IN D E X E S
Materials used in house building, percentage change by state capital
city
17
Materials used in house building, index numbers by state capital city16
Selected output of Division E – Construction, subdivision and class
index numbers
15
CO N S T R U C T I O N IN D U S T R I E S PR O D U C E R PR I C E IN D E X E S
Materials used in manufacturing industries, index numbers for
subdivisions
14
Materials used in manufacturing industries, division percentage
changes
13
Materials used in manufacturing industries, index numbers for
division and selected materials
12
Articles produced by manufacturing industries, index numbers for
subdivisions, groups and classes
11
Articles produced by manufacturing industries, division index
numbers and percentage changes
10
MA N U F A C T U R I N G IN D U S T R I E S PR O D U C E R PR I C E IN D E X E S
AD D I T I O N A L TA B L E S AV A I L A B L E ON AB S WE B S I T E
27Stage of Production and Implementation of ANZSIC 20061 . . . . . . . . . . . .AP P E N D I X
15
Contribution to change in preliminary commodities index by industry
and source
9. . . . . . . . . . . . . . . . . . . . . . . . . . . . . . . . . . . . . . . . .
14
Contribution to change in intermediate commodities index by industry
and source
8. . . . . . . . . . . . . . . . . . . . . . . . . . . . . . . . . . . . . . . . .
13
Contribution to change in imported final commodities index by
industry and destination
7. . . . . . . . . . . . . . . . . . . . . . . . . . . . . . . . .
12
Contribution to change in domestic final commodities index by
industry and destination
6. . . . . . . . . . . . . . . . . . . . . . . . . . . . . . . . .
11
Contribution to change in final commodities index by industry and
source
5. . . . . . . . . . . . . . . . . . . . . . . . . . . . . . . . . . . . . . . . . . . .
10Percentage change, final commodities by source and destination4 . . . . . . .9Final commodities by source and destination3 . . . . . . . . . . . . . . . . . . . . .8Percentage change by stage and source2 . . . . . . . . . . . . . . . . . . . . . . . .7Index numbers by stage and source1 . . . . . . . . . . . . . . . . . . . . . . . . . . .
pageTA B L E S OF ST A G E OF PR O D U C T I O N PR O D U C E R PR I C E IN D E X E S
A B S • P R O D U C E R P R I C E I N D E X E S • 6 4 2 7 . 0 • MA R QT R 2 0 1 2 5
L I S T O F T A B L E S

Index numbers, weighted average of six state capital cities31
PR I C E IN D E X E S FO R AS P H A L T SU P P L I E D AN D PL A C E D
Copper materials used in the manufacture of electrical equipment,
index numbers and percentage changes
30
PR I C E IN D E X E S OF CO P P E R MA T E R I A L S
Contribution to all groups index by state capital city29
PR I C E IN D E X OF MA T E R I A L S US E D IN HO U S E BU I L D I N G
Indexes of metallic materials used in the fabricated metal products
industry
28
Contribution of selected materials27
PR I C E IN D E X E S OF MA T E R I A L S US E D IN MA N U F A C T U R I N G IN D U S T R I E S
Contribution of subdivisions26
PR I C E IN D E X E S OF AR T I C L E S PR O D U C E D BY MA N U F A C T U R I N G
IN D U S T R I E S
Percentage change, final commodities by source and destination,
including exports
25
Index numbers, final commodities by source and destination,
including exports
24
ST A G E OF PR O D U C T I O N PR O D U C E R PR I C E IN D E X E S
Selected output of Division N – Administrative and support services,
group and class index numbers
23
Selected output of Division M – Professional, scientific and technical
services, group and class index numbers
22
Selected output of Division L – Rental, hiring and real estate services,
subdivision, group and class index numbers
21
Selected output of Division J – Information media and
telecommunications, Division O – Public administration and safety,
and Division S – Other services, group and class index numbers
20
Selected output of Division I – Transport, postal and warehousing,
group and class index numbers
19
SE R V I C E IN D U S T R I E S PR O D U C E R PR I C E IN D E X E S continued
AD D I T I O N A L TA B L E S AV A I L A B L E ON AB S WE B S I T E continued
6 A B S • P R O D U C E R P R I C E I N D E X E S • 6 4 2 7 . 0 • MA R QT R 2 0 1 2
L I S T O F T A B L E S continued

(c) Excluding exports.(a) Compiled on ANZSIC 1993 basis.(b) Reference base of each index: 1998–99 = 100.0.
140.777.8157.0151.1122.2156.1159.8149.4161.6March2012
141.179.0157.1150.7123.9155.3159.6151.3161.2December140.777.2157.1150.2121.1155.2159.0148.0160.9September139.877.2156.0150.1121.5155.0158.9149.5160.6June138.778.3154.3147.0116.6152.2154.6139.4157.2March
2011137.178.5152.2143.7114.3148.8150.7134.2153.5December137.082.1151.1143.7118.5148.0150.6138.5152.7September135.281.4149.1142.1117.0146.4148.8137.4150.7June134.881.5148.5140.8114.2145.4146.6132.3149.1March
2010133.580.4147.1139.1113.8143.5145.2132.2147.5December134.084.8146.7140.3118.4144.1146.3136.5148.0September133.989.4145.3141.2119.6144.9147.1133.5149.4June135.095.0145.3144.0129.8146.5151.2144.3152.4March
2009135.591.4146.8148.8141.6150.0158.5171.7156.6December133.779.6147.6147.5132.6150.0158.1168.9156.6September131.178.2144.8142.3123.5145.5149.9154.2149.4June129.879.0142.8138.6118.4142.1144.9143.3145.4March
2008127.478.5140.0135.9114.2139.6141.6136.6142.6December126.679.6138.7134.4113.5138.1139.5133.6140.6September125.280.8136.6132.9113.8136.2138.1132.7139.1June
2007
138.279.0153.4146.1117.7151.0153.7140.4156.02010–11134.482.0147.9140.6115.9144.9146.7134.6148.82009–10134.588.9146.3145.4130.9147.9153.7154.6153.82008–09128.778.8141.6137.8117.4141.3144.0141.9144.52007–08
TotalImportsDomesticTotalImportsDomesticTotalImportsDomestic
FINAL(c)INTERMEDIATEPRELIMINARY
Per i od
STAGE OF PRODUCT ION (a) (b ) : Index numbers1
A B S • P R O D U C E R P R I C E I N D E X E S • 6 4 2 7 . 0 • MA R QT R 2 0 1 2 7

(b) Excluding exports.(a) Compiled on ANZSIC 1993 basis.
1.4–0.61.72.84.82.63.47.22.8March2012
2.90.63.24.98.44.45.912.75.0December2.7–6.04.04.52.24.95.66.95.4September3.4–5.24.65.63.85.96.88.86.6June2.9–3.93.94.42.14.75.55.45.4March
20112.7–2.43.53.30.43.73.81.54.1December2.2–3.23.02.40.12.72.91.53.2September1.0–8.92.60.6–2.21.01.22.90.9June
–0.1–14.22.2–2.2–12.0–0.8–3.0–8.3–2.2March2010
–1.5–12.00.2–6.5–19.6–4.3–8.4–23.0–5.8December0.26.5–0.6–4.9–10.7–3.9–7.5–19.2–5.5September2.114.30.3–0.8–3.2–0.4–1.9–13.40.0June4.020.31.83.99.63.14.30.74.8March
20096.416.44.99.524.07.411.925.79.8December5.60.06.49.716.88.613.326.411.4September4.7–3.26.07.18.56.88.516.27.4June4.8–3.86.16.06.16.06.912.46.2March
20082.8–5.44.24.30.44.84.74.74.7December2.4–5.53.73.2–4.44.52.6–3.93.6September
2007
PE R C E N T A G E CH A N G E FR O M CO R R E S P O N D I N G QU A R T E R OF PR E V I O U S YE A R
–0.3–1.5–0.10.3–1.40.50.1–1.30.2March2012
0.32.30.00.32.30.10.42.20.2December0.60.00.70.1–0.30.10.1–1.00.2September0.8–1.41.12.14.21.82.87.22.2June1.2–0.31.42.32.02.32.63.92.4March
20110.1–4.40.70.0–3.50.50.1–3.10.5December1.30.91.31.11.31.11.20.81.3September0.3–0.10.40.92.50.71.53.91.1June1.01.41.01.20.41.31.00.11.1March
2010–0.4–5.20.3–0.9–3.9–0.4–0.8–3.2–0.3December0.1–5.11.0–0.6–1.0–0.6–0.52.2–0.9September
–0.8–5.90.0–1.9–7.9–1.1–2.7–7.5–2.0June–0.43.9–1.0–3.2–8.3–2.3–4.6–16.0–2.7March
20091.314.8–0.50.96.80.00.31.70.0December2.01.81.93.77.43.15.59.54.8September1.0–1.01.42.74.32.43.57.62.8June1.90.62.02.03.71.82.34.92.0March
20080.6–1.40.91.10.61.11.52.21.4December1.1–1.51.51.1–0.31.41.00.71.1September
2007
PE R C E N T A G E CH A N G E FR O M PR E V I O U S QU A R T E R
2.8–3.73.73.91.64.24.84.34.82010–11–0.1–7.81.1–3.3–11.5–2.0–4.6–12.9–3.32009–104.512.83.35.511.54.76.78.96.42008–093.6–4.55.05.22.55.55.77.25.52007–08
PE R C E N T A G E CH A N G E FR O M PR E V I O U S YE A R
TotalImportsDomesticTotalImportsDomesticTotalImportsDomestic
FINAL(b)INTERMEDIATEPRELIMINARY
Per i od
STAGE OF PRODUCT ION (a) : Percentage change2
8 A B S • P R O D U C E R P R I C E I N D E X E S • 6 4 2 7 . 0 • MA R QT R 2 0 1 2

(c) Excluding exports.(a) Compiled on ANZSIC 1993 basis.(b) Reference base of each index: 1998–99 = 100.0.
140.7140.2141.577.866.388.9157.0157.3157.0March2012
141.1140.4142.079.067.490.1157.1157.4157.2December140.7139.7142.177.265.988.1157.1156.8158.0September139.8139.9139.977.265.788.3156.0157.1155.1June138.7138.9138.678.367.588.7154.3155.4153.3March
2011137.1138.7135.378.568.788.0152.2154.9149.2December137.0138.5135.282.171.592.2151.1154.1147.8September135.2137.3132.881.470.891.5149.1152.8144.8June134.8137.0132.381.571.690.9148.5152.1144.4March
2010133.5135.9130.580.470.689.9147.1151.1142.4December134.0136.3131.484.874.594.6146.7150.6142.1September133.9137.6129.589.479.398.9145.3151.1138.3June135.0138.9130.495.084.8104.7145.3151.5137.7March
2009135.5139.7130.591.480.3102.0146.8153.5138.7December133.7137.6129.179.668.790.1147.6153.6140.5September131.1135.3126.378.267.888.1144.8150.9137.4June129.8133.6125.279.069.088.5142.8148.6135.9March
2008127.4131.6122.578.569.487.2140.0146.0132.8December126.6130.6121.979.670.988.0138.7144.4131.7September125.2129.2120.580.872.189.2136.6142.4129.5June
2007
138.2139.0137.379.068.489.3153.4155.4151.42010–11134.4136.6131.882.071.991.7147.9151.7143.42009–10134.5138.5129.988.978.398.9146.3152.4138.82008–09128.7132.8124.078.869.388.0141.6147.5134.52007–08
TotalCapitalConsumerTotalCapitalConsumerTotalCapitalConsumer
TOTAL(c)IMPORTSDOMESTIC(c)
Per i od
STAGE OF PRODUCT ION (a) (b ) : Fina l commod i t i es index numbers3
A B S • P R O D U C E R P R I C E I N D E X E S • 6 4 2 7 . 0 • MA R QT R 2 0 1 2 9

(b) Excluding exports.(a) Compiled on ANZSIC 1993 basis.
1.40.92.1–0.6–1.80.21.71.22.4March2012
2.91.25.00.6–1.92.43.21.65.4December2.70.95.1–6.0–7.8–4.44.01.86.9September3.41.95.3–5.2–7.2–3.54.62.87.1June2.91.44.8–3.9–5.7–2.43.92.26.2March
20112.72.13.7–2.4–2.7–2.13.52.54.8December2.21.62.9–3.2–4.0–2.53.02.34.0September1.0–0.22.5–8.9–10.7–7.52.61.14.7June
–0.1–1.41.5–14.2–15.6–13.22.20.44.9March2010
–1.5–2.70.0–12.0–12.1–11.90.2–1.62.7December0.2–0.91.86.58.45.0–0.6–2.01.1September2.11.72.514.317.012.30.30.10.7June4.04.04.220.322.918.31.82.01.3March
20096.46.26.516.415.717.04.95.14.4December5.65.45.90.0–3.12.46.46.46.7September4.74.74.8–3.2–6.0–1.26.06.06.1June4.84.25.5–3.8–5.6–2.46.15.57.2March
20082.83.32.3–5.4–6.3–4.74.24.43.9December2.43.31.3–5.5–5.2–5.63.74.42.7September
2007
PE R C E N T A G E CH A N G E FR O M CO R R E S P O N D I N G QU A R T E R OF PR E V I O U S YE A R
–0.3–0.1–0.4–1.5–1.6–1.3–0.1–0.1–0.1March2012
0.30.5–0.12.32.32.30.00.4–0.5December0.6–0.11.60.00.3–0.20.7–0.21.9September0.80.70.9–1.4–2.7–0.51.11.11.2June1.20.12.4–0.3–1.70.81.40.32.7March
20110.10.10.1–4.4–3.9–4.60.70.50.9December1.30.91.80.91.00.81.30.92.1September0.30.20.4–0.1–1.10.70.40.50.3June1.00.81.41.41.41.11.00.71.4March
2010–0.4–0.3–0.7–5.2–5.2–5.00.30.30.2December0.1–0.91.5–5.1–6.1–4.31.0–0.32.7September
–0.8–0.9–0.7–5.9–6.5–5.50.0–0.30.4June–0.4–0.6–0.13.95.62.6–1.0–1.3–0.7March
20091.31.51.114.816.913.2–0.5–0.1–1.3December2.01.72.21.81.32.31.91.82.3September1.01.30.9–1.0–1.7–0.51.41.51.1June1.91.52.20.6–0.61.52.01.82.3March
20080.60.80.5–1.4–2.1–0.90.91.10.8December1.11.11.2–1.5–1.7–1.31.51.41.7September
2007
PE R C E N T A G E CH A N G E FR O M PR E V I O U S QU A R T E R
2.81.84.2–3.7–4.9–2.63.72.45.62010–11–0.1–1.41.5–7.8–8.2–7.31.1–0.53.32009–104.54.34.812.813.012.43.33.33.22008–093.63.93.5–4.5–5.7–3.55.05.15.02007–08
PE R C E N T A G E CH A N G E FR O M PR E V I O U S YE A R
TotalCapitalConsumerTotalCapitalConsumerTotalCapitalConsumer
TOTAL(b)IMPORTSDOMESTIC(b)
Per i od
STAGE OF PRODUCT ION (a) : Fina l commod i t i es percen tage change4
10 A B S • P R O D U C E R P R I C E I N D E X E S • 6 4 2 7 . 0 • MA R QT R 2 0 1 2

(b) Excluding exports.. . not applicable(a) Reference base of each index: 1998–99 = 100.0.
–0.4140.7141.1–1.277.879.0–0.1157.0157.1Total
0.000.660.66. .. .. .0.000.830.83Legal and accounting services7840.053.113.06. .. .. .0.073.923.85Computer services783
–0.011.121.13. .. .. .–0.011.411.42Technical services782–0.013.233.24. .. .. .–0.024.074.09Real estate agents7720.011.891.88. .. .. .0.022.382.36Services to transport660.010.300.29. .. .. .0.010.370.36Water, air and space transport630–6400.010.480.47. .. .. .0.020.610.59Rail transport6200.021.671.65. .. .. .0.022.102.08Road freight transport6110.011.461.45. .. .. .0.011.841.83Accommodation5710.075.285.21. .. .. .0.096.666.57Non-building construction412
–0.1248.7048.82. .. .. .–0.1661.3961.55Building construction4110.2110.3210.11. .. .. .0.2513.0012.75Electricity, gas and water supply36–370.023.873.85–0.014.504.510.043.703.66Other mfg29
–0.104.094.19–0.4211.7412.16–0.012.072.08Industrial machinery and equipment mfg286–0.021.982.00–0.063.363.42–0.011.611.62Electrical equipment and appliance mfg285–0.031.101.13–0.163.994.150.000.340.34Electronic equipment mfg2840.000.790.79–0.023.193.210.000.160.16Photographic and scientific equipment mfg283
–0.021.321.34–0.093.873.960.010.650.64Other transport equipment mfg282–0.028.168.180.0016.8916.89–0.025.855.87Motor vehicle and part mfg281–0.010.380.39–0.030.940.970.000.230.23Fabricated metal product mfg2760.000.250.25. .. .. .–0.010.310.32Sheet metal product mfg2750.000.040.040.000.180.18. .. .. .Non-ferrous basic metal product mfg2730.000.030.030.000.140.14. .. .. .Iron and steel mfg2710.011.041.030.010.750.740.001.111.11Plastic product mfg2560.000.260.26–0.010.760.770.010.130.12Rubber product mfg255
–0.032.682.71–0.304.064.360.042.312.27Other chemical product mfg2540.000.120.12–0.010.570.58. .. .. .Basic chemical mfg2530.024.184.160.142.602.46–0.024.584.60Petroleum refining2510.000.280.280.020.750.730.000.160.16Recorded media mfg and publishing243
–0.011.341.35–0.040.710.750.001.511.51Publishing2420.010.320.310.000.070.070.000.380.38Printing and services to printing2410.000.640.64. .. .. .0.000.810.81Other wood, paper and paper product mfg232–2330.000.140.14–0.010.690.70. .. .. .Leather and leather product mfg226
–0.020.490.510.011.111.10–0.030.320.35Footwear mfg2250.022.472.45–0.113.753.860.062.132.07Clothing mfg2240.000.390.39–0.020.520.540.000.350.35Knitting mills223
–0.030.620.65–0.020.700.72–0.040.600.64Textile product mfg2220.000.400.400.010.680.670.010.330.32Textile fibre, yarn and woven fabric mfg2210.142.021.880.122.292.170.161.951.79Tobacco product mfg2190.084.934.850.012.092.080.095.665.57Beverage and malt mfg218
–0.084.154.23–0.043.483.52–0.094.324.41Other food mfg217–0.011.911.92. .. .. .–0.012.412.42Bakery product mfg2160.000.820.82. .. .. .0.001.041.04Flour mill and cereal food mfg215
–0.010.100.11–0.050.480.53. .. .. .Oil and fat mfg2140.012.202.19–0.041.581.620.012.352.34Fruit and vegetable processing213
–0.023.373.39–0.041.351.39–0.023.903.92Dairy product mfg212–0.022.732.75. .. .. .–0.023.453.47Meat and meat product mfg211–0.060.860.92. .. .. .–0.071.091.16Commercial fishing04–0.401.872.27. .. .. .–0.502.362.86Other agriculture011, 014–0160.000.180.18. .. .. .0.000.230.23Grain, sheep, beef and dairy cattle farming012–013
Change
Mar Qtr
2012
Dec Qtr
2011Change
Mar Qtr
2012
Dec Qtr
2011Change
Mar Qtr
2012
Dec Qtr
2011
TOTAL(b)IMPORTSDOMESTIC(b)
ANZS IC 1993
STAGE OF PRODUCT ION, FINAL COMMODIT IES INDEX POINTS CHANGE (a) : Fina l
commod i t i es index poin t s change5
A B S • P R O D U C E R P R I C E I N D E X E S • 6 4 2 7 . 0 • MA R QT R 2 0 1 2 11

(b) Excluding exports.. . not applicable(a) Reference base of each index: 1998–99 = 100.0.
–0.1157.0157.1–0.1157.3157.4–0.2157.0157.2Total
0.000.830.830.001.471.47. .. .. .Legal and accounting services7840.073.923.850.136.996.86. .. .. .Computer services783
–0.011.411.42–0.012.522.53. .. .. .Technical services782–0.024.074.09–0.047.257.29. .. .. .Real estate agents7720.022.382.36. .. .. .0.045.455.41Services to transport660.010.370.36. .. .. .0.020.850.83Water, air and space transport630–6400.020.610.59. .. .. .0.041.391.35Rail transport6200.022.102.08. .. .. .0.054.814.76Road freight transport6110.011.841.83. .. .. .0.034.224.19Accommodation5710.096.666.570.1611.8611.70. .. .. .Non-building construction412
–0.1661.3961.55–0.28109.37109.65. .. .. .Building construction4110.2513.0012.75. .. .. .0.5929.7329.14Electricity, gas and water supply36–370.043.703.660.044.634.590.022.512.49Other mfg29
–0.012.072.08–0.033.683.71. .. .. .Industrial machinery and equipment mfg286–0.011.611.620.001.101.10–0.032.272.30Electrical equipment and appliance mfg2850.000.340.340.000.490.490.000.150.15Electronic equipment mfg2840.000.160.160.000.280.28. .. .. .Photographic and scientific equipment mfg2830.010.650.640.020.810.79–0.010.450.46Other transport equipment mfg282
–0.025.855.87–0.025.925.94–0.025.795.81Motor vehicle and part mfg2810.000.230.230.000.420.42. .. .. .Fabricated metal product mfg276
–0.010.310.320.000.560.56. .. .. .Sheet metal product mfg2750.001.111.11. .. .. .0.002.542.54Plastic product mfg2560.010.130.12. .. .. .0.010.290.28Rubber product mfg2550.042.312.27. .. .. .0.095.275.18Other chemical product mfg254
–0.024.584.60. .. .. .–0.0310.4810.51Petroleum refining2510.000.160.16. .. .. .0.000.360.36Recorded media mfg and publishing2430.001.511.51. .. .. .0.003.453.45Publishing2420.000.380.38. .. .. .0.010.880.87Printing and services to printing2410.000.810.81. .. .. .0.011.851.84Other wood, paper and paper product mfg232–233
–0.030.320.35. .. .. .–0.060.740.80Footwear mfg2250.062.132.07. .. .. .0.144.874.73Clothing mfg2240.000.350.35. .. .. .0.000.800.80Knitting mills223
–0.040.600.64. .. .. .–0.071.381.45Textile product mfg2220.010.330.32. .. .. .0.010.750.74Textile fibre, yarn and woven fabric mfg2210.161.951.79. .. .. .0.354.454.10Tobacco product mfg2190.095.665.57. .. .. .0.2112.9512.74Beverage and malt mfg218
–0.094.324.41. .. .. .–0.219.8710.08Other food mfg217–0.012.412.42. .. .. .–0.025.515.53Bakery product mfg2160.001.041.04. .. .. .0.002.372.37Flour mill and cereal food mfg2150.012.352.34. .. .. .0.035.385.35Fruit and vegetable processing213
–0.023.903.92. .. .. .–0.048.918.95Dairy product mfg212–0.023.453.47. .. .. .–0.057.887.93Meat and meat product mfg211–0.071.091.16. .. .. .–0.162.482.64Commercial fishing04–0.502.362.86. .. .. .–1.165.396.55Other agriculture011, 014–0160.000.230.23. .. .. .–0.020.510.53Grain, sheep, beef and dairy cattle farming012–013
Change
Mar Qtr
2012
Dec Qtr
2011Change
Mar Qtr
2012
Dec Qtr
2011Change
Mar Qtr
2012
Dec Qtr
2011
TOTALCAPITALCONSUMER
ANZS IC 1993
STAGE OF PRODUCT ION (a) (b ) : Domest i c f ina l commod i t i es index po in t s change6
12 A B S • P R O D U C E R P R I C E I N D E X E S • 6 4 2 7 . 0 • MA R QT R 2 0 1 2

(a) Reference base of each index: 1998–99 = 100.0.. . not applicable
–1.277.879.0–1.166.367.4–1.288.990.1Total
–0.014.504.510.021.901.88–0.047.067.10Other mfg29–0.4211.7412.16–0.8423.5824.42. .. .. .Industrial machinery and equipment mfg286–0.063.363.42–0.033.083.11–0.093.633.72Electrical equipment and appliance mfg285–0.163.994.15–0.246.356.59–0.061.651.71Electronic equipment mfg284–0.023.193.21–0.044.054.090.002.332.33Photographic and scientific equipment mfg283–0.093.873.96–0.125.555.67–0.072.202.27Other transport equipment mfg2820.0016.8916.890.1721.7721.60–0.1612.0112.17Motor vehicle and part mfg281
–0.030.940.97. .. .. .–0.061.871.93Fabricated metal product mfg2760.000.180.18. .. .. .0.000.360.36Non-ferrous basic metal product mfg2730.000.140.14. .. .. .0.000.280.28Iron and steel mfg2710.010.750.74. .. .. .0.031.501.47Plastic product mfg256
–0.010.760.77. .. .. .–0.041.501.54Rubber product mfg255–0.304.064.36. .. .. .–0.598.068.65Other chemical product mfg254–0.010.570.58. .. .. .–0.031.131.16Basic chemical mfg2530.142.602.46. .. .. .0.295.174.88Petroleum refining2510.020.750.73. .. .. .0.031.481.45Recorded media mfg and publishing243
–0.040.710.75. .. .. .–0.061.421.48Publishing2420.000.070.07. .. .. .–0.010.130.14Printing and services to printing241
–0.010.690.70. .. .. .–0.011.371.38Leather and leather product mfg2260.011.111.10. .. .. .0.022.202.18Footwear mfg225
–0.113.753.86. .. .. .–0.217.457.66Clothing mfg224–0.020.520.54. .. .. .–0.051.021.07Knitting mills223–0.020.700.72. .. .. .–0.031.391.42Textile product mfg2220.010.680.67. .. .. .0.031.361.33Textile fibre, yarn and woven fabric mfg2210.122.292.17. .. .. .0.224.544.32Tobacco product mfg2190.012.092.08. .. .. .0.014.144.13Beverage and malt mfg218
–0.043.483.52. .. .. .–0.076.926.99Other food mfg217–0.050.480.53. .. .. .–0.110.941.05Oil and fat mfg214–0.041.581.62. .. .. .–0.083.133.21Fruit and vegetable processing213–0.041.351.39. .. .. .–0.082.672.75Dairy product mfg212
Change
Mar Qtr
2012
Dec Qtr
2011Change
Mar Qtr
2012
Dec Qtr
2011Change
Mar Qtr
2012
Dec Qtr
2011
TOTALCAPITALCONSUMER
ANZS IC 1993
STAGE OF PRODUCT ION (a) : Impor ted f ina l commod i t i es index poin ts change7
A B S • P R O D U C E R P R I C E I N D E X E S • 6 4 2 7 . 0 • MA R QT R 2 0 1 2 13

(a) Reference base of each index: 1998-99 = 100.0.. . not applicable
0.4151.1150.7–1.7122.2123.90.8156.1155.3Total
0.047.597.55. .. .. .0.048.888.84Other business services7860.006.176.17. .. .. .0.017.237.22Marketing and business management services7850.026.186.16. .. .. .0.037.247.21Legal and accounting services7840.053.343.29. .. .. .0.053.903.85Computer services783
–0.012.682.69. .. .. .0.003.143.14Technical services7820.001.451.45. .. .. .0.001.701.70Machinery and equipment hiring and leasing7740.001.831.83. .. .. .–0.012.142.15Real estate agents7720.0811.6111.53. .. .. .0.0813.5813.50Property operators and developers7710.011.171.16. .. .. .0.021.371.35Storage6700.021.941.92. .. .. .0.022.272.25Services to transport660.010.290.28. .. .. .0.010.340.33Other transport6500.031.321.29. .. .. .0.041.551.51Air and space transport6400.010.580.57. .. .. .0.020.680.66Water transport6300.030.800.77. .. .. .0.030.930.90Rail transport6200.087.757.67. .. .. .0.099.078.98Road freight transport6110.020.610.59. .. .. .0.010.710.70Accommodation5710.016.966.95. .. .. .0.028.158.13Electricity, gas and water supply36–37
–0.010.280.29–0.021.961.98. .. .. .Other mfg29–0.052.852.90–0.279.329.59–0.011.751.76Industrial machinery and equipment mfg286–0.032.722.75–0.206.296.49–0.012.112.12Electrical equipment and appliance mfg285–0.011.151.16–0.102.943.040.000.850.85Electronic equipment mfg284–0.010.680.69–0.053.543.59–0.010.190.20Photographic and scientific equipment mfg2830.010.910.90–0.011.501.510.020.810.79Other transport equipment mfg282
–0.013.233.24–0.149.089.220.012.232.22Motor vehicle and part mfg2810.011.941.93–0.014.054.060.011.581.57Fabricated metal product mfg2760.001.231.23–0.010.140.150.001.421.42Sheet metal product mfg2750.103.153.050.000.060.060.123.683.56Structural metal product mfg2740.020.580.560.071.671.600.000.390.39Non-ferrous basic metal product mfg2730.032.272.240.051.211.160.032.452.42Basic non-ferrous metal mfg272
–0.044.094.13–0.164.534.69–0.024.024.04Iron and steel mfg2710.015.095.08–0.062.642.700.025.515.49Non-metallic mineral product mfg260.002.462.46–0.013.053.060.012.372.36Plastic product mfg2560.030.960.93–0.042.963.000.040.620.58Rubber product mfg2550.002.532.53–0.114.064.170.022.272.25Other chemical product mfg254
–0.062.732.79–0.398.969.35–0.011.671.68Basic chemical mfg2530.186.025.840.188.908.720.185.535.35Petroleum refining251
–0.022.882.90. .. .. .–0.023.373.39Publishing2420.022.001.98. .. .. .0.032.352.32Printing and services to printing241
–0.011.661.67–0.122.782.900.011.471.46Paper and paper product mfg2330.062.352.290.020.850.830.062.602.54Other wood product mfg2320.001.141.14–0.021.871.890.011.021.01Log sawmilling and timber dressing2310.002.582.580.047.737.69–0.011.711.72Textile, clothing, footwear and leather mfg220.020.960.94–0.010.640.650.021.010.99Beverage and malt mfg218
–0.071.151.220.010.730.72–0.081.231.31Other food mfg2170.000.200.20. .. .. .0.000.240.24Bakery product mfg216
–0.010.850.86. .. .. .–0.011.001.01Flour mill and cereal food mfg2150.000.360.36–0.060.700.760.010.310.30Fruit and vegetable processing; oil and fat mfg213–214
–0.031.351.38–0.041.031.07–0.021.411.43Dairy product mfg2120.011.821.81. .. .. .0.012.132.12Meat and meat product mfg2110.001.361.36–0.040.670.710.011.481.47Other mining14
–0.113.313.42–0.143.493.63–0.113.283.39Metal ore mining1310.056.306.25–0.0424.9124.950.073.143.07Oil and gas extraction120
–0.102.202.30. .. .. .–0.122.572.69Coal mining1100.020.400.38. .. .. .0.030.470.44Commercial fishing04
–0.010.160.17. .. .. .–0.020.180.20Services to agriculture; hunting and trapping02–0.023.633.65. .. .. .–0.024.254.27Other agriculture011, 014–0160.067.327.26. .. .. .0.068.568.50Grain, sheep, beef and dairy cattle farming012–013
Change
Mar Qtr
2012
Dec Qtr
2011Change
Mar Qtr
2012
Dec Qtr
2011Change
Mar Qtr
2012
Dec Qtr
2011
TOTALIMPORTSDOMESTIC
ANZS IC 1993
STAGE OF PRODUCT ION PRICE INDEXES (a) : Inte rmed ia te commod i t i es index po in ts
change8
14 A B S • P R O D U C E R P R I C E I N D E X E S • 6 4 2 7 . 0 • MA R QT R 2 0 1 2

(a) Reference base of each index: 1998-99 = 100.0.. . not applicable
0.2159.8159.6–1.9149.4151.30.4161.6161.2Total
0.047.377.33. .. .. .0.048.568.52Other business services7860.015.805.79. .. .. .0.016.746.73Marketing and business management services7850.025.775.75. .. .. .0.026.706.68Legal and accounting services7840.053.583.53. .. .. .0.064.164.10Computer services783
–0.012.872.88. .. .. .–0.013.343.35Technical services782–0.012.042.05. .. .. .–0.012.372.38Machinery and equipment hiring and leasing774–0.012.582.59. .. .. .–0.022.993.01Real estate agents7720.1116.3816.27. .. .. .0.1319.0218.89Property operators and developers7710.011.431.42. .. .. .0.011.661.65Storage6700.022.322.30. .. .. .0.022.702.68Services to transport660.010.390.38. .. .. .0.010.460.45Other transport6500.031.481.45. .. .. .0.041.721.68Air and space transport6400.010.650.64. .. .. .0.010.750.74Water transport6300.041.101.06. .. .. .0.041.281.24Rail transport6200.109.559.45. .. .. .0.1111.0910.98Road freight transport6110.020.720.70. .. .. .0.010.830.82Accommodation5710.028.828.80. .. .. .0.0210.2510.23Electricity, gas and water supply36–37
–0.052.572.62–0.269.089.34–0.021.531.55Industrial machinery and equipment mfg286–0.021.721.74–0.144.404.540.001.291.29Electrical equipment and appliance mfg285–0.010.930.94–0.092.522.610.000.680.68Electronic equipment mfg2840.000.350.35–0.032.022.050.000.080.08Photographic and scientific equipment mfg2830.000.790.79–0.021.471.490.010.680.67Other transport equipment mfg2820.002.172.17–0.106.146.240.011.531.52Motor vehicle and part mfg2810.011.461.450.003.133.130.011.191.18Fabricated metal product mfg2760.000.620.620.000.070.070.000.710.71Sheet metal product mfg2750.072.182.11. .. .. .0.082.532.45Structural metal product mfg2740.010.700.690.092.081.990.000.480.48Non-ferrous basic metal product mfg2730.042.812.770.061.551.490.033.012.98Basic non-ferrous metal mfg272
–0.056.396.44–0.227.177.39–0.026.276.29Iron and steel mfg2710.012.162.15. .. .. .0.012.512.50Non-metallic mineral product mfg260.002.202.20–0.012.892.900.002.092.09Plastic product mfg2560.020.790.77–0.042.592.630.040.510.47Rubber product mfg2550.012.812.80–0.045.165.200.022.442.42Other chemical product mfg254
–0.145.605.74–0.8418.7719.61–0.033.503.53Basic chemical mfg2530.216.576.360.309.829.520.206.065.86Petroleum refining251
–0.022.442.46. .. .. .–0.022.832.85Publishing2420.021.631.61. .. .. .0.021.891.87Printing and services to printing241
–0.042.742.78–0.327.127.440.002.042.04Paper and paper product mfg2330.020.920.900.000.240.240.031.031.00Other wood product mfg2320.001.141.14–0.021.631.650.001.061.06Log sawmilling and timber dressing2310.001.581.580.035.285.25–0.010.991.00Textile, clothing, footwear and leather mfg220.010.510.500.000.410.410.010.530.52Beverage and malt mfg218
–0.071.151.220.000.520.52–0.081.251.33Other food mfg2170.000.070.07. .. .. .0.000.080.08Bakery product mfg216
–0.010.440.45. .. .. .–0.010.510.52Flour mill and cereal food mfg2150.000.150.15–0.040.370.410.010.120.11Fruit and vegetable processing; oil and fat mfg213–214
–0.010.530.54–0.010.460.47–0.010.540.55Dairy product mfg2120.000.700.70. .. .. .0.000.810.81Meat and meat product mfg211
–0.011.921.93–0.060.971.030.012.082.07Other mining14–0.153.073.22–0.112.722.83–0.163.133.29Metal ore mining1310.1112.2112.10–0.0750.8550.920.136.035.90Oil and gas extraction120
–0.204.264.46. .. .. .–0.244.945.18Coal mining110–0.010.390.40. .. .. .–0.010.450.46Forestry and logging030–0.020.280.30. .. .. .–0.030.320.35Services to agriculture; hunting and trapping02–0.012.522.53. .. .. .–0.022.922.94Other agriculture011, 014–016–0.045.465.50. .. .. .–0.046.346.38Grain, sheep, beef and dairy cattle farming012–013
Change
Mar Qtr
2012
Dec Qtr
2011Change
Mar Qtr
2012
Dec Qtr
2011Change
Mar Qtr
2012
Dec Qtr
2011
TOTALIMPORTSDOMESTIC
ANZS IC 1993
STAGE OF PRODUCT ION PRICE INDEXES (a) : Pre l im ina r y commod i t i es index poin t s
change9
A B S • P R O D U C E R P R I C E I N D E X E S • 6 4 2 7 . 0 • MA R QT R 2 0 1 2 15

5 The valuation basis for the transactions covered by an output index is basic prices,
defined as the amount received by the producer exclusive of any taxes on products and
transport and trade margins (i.e. the pricing point is ex–factory, ex–farm, ex–service
provider, etc.).
6 On the other hand, an input index has a valuation basis of purchasers' prices, defined
as the amount paid by the purchaser inclusive of any non–deductible taxes on products
and transport and trade margins (i.e. the prices recorded in the index should be those
relating to products delivered into store, delivered on site, etc.).
7 In reality, industry practice may mean that it is sometimes necessary to diverge from
the conceptual ideal in order to obtain actual transaction prices. For example, although
the pricing point for the output index Price Indexes of Articles Produced by
Manufacturing Industries is ex–factory, in cases where costs such as handling and
distribution are built into the manufacturer's selling price, they will be included in the
index.
8 Similarly, for input indexes such as the Price Index of Materials Used In House
Building, which has a pricing point of delivered on site, it has sometimes been necessary
to use the nearest actual transaction price available, e.g. prices of materials supplied and
fixed.
9 The GST is excluded from all the prices recorded in the current producer price
indexes because, in the main, it is deductible on business–to–business transactions. In
the case of service industry output indexes relating to business–to–household
transactions, the GST is also excluded because the pricing basis is basic prices (i.e.
exclusive of product taxes).
Valuat ion basis
4 Producer price indexes can be constructed as either output or input measures. The
output producer price indexes relate to selected products that are primary to a particular
industry, irrespective of the industrial classification of establishments undertaking the
activity. The input producer price indexes relate to selected products used by
establishments classified to particular industries.
Output and input indexes
3 Producer price indexes relate to products that are primary to a particular industry,
irrespective of the industrial classification of establishments undertaking the activity. The
indexes do not represent the activity of establishments classified to a particular industry.
For ease of use, some of the tables relating to producer price indexes carry the title
'Selected output of an ANZSIC Division or Subdivision'. This indicates selected output of
products primary to that ANZSIC Division or Subdivision. The labels for the tables
available on the ABS website <http://www.abs.gov.au> associated with these additional
publications have been shortened. The coverage of these tables is as described in these
explanatory notes.
GE N E R A L
Industry versus product
1 This publication and associated data cubes and time series spreadsheets available on
the ABS website <http://www.abs.gov.au>, contain a range of producer price indexes.
Economy–wide indexes are presented within a stage of production framework in this
publication. A set of other indexes relating to products or services that are primary to
specific industries (selected manufacturing, construction, mining and service industries)
are available on the ABS website <http://www.abs.gov.au>.
2 Index numbers for the stage of production producer price indexes, services and
construction indexes, are primarily calculated on the reference base 1998–99=100.0. The
index numbers for other producer price indexes are primarily calculated on the
reference base 1989–90=100.0. New manufacturing and services indexes, introduced as
part of the ANZSIC 2006 implementation in the September quarter 2009, are calculated
on the reference base 2001–02 = 100.0. (Further information relating to the reference
bases is presented in the Appendix to the March quarter 2009 issue of this publication).
I N T R O D U C T I O N
16 A B S • P R O D U C E R P R I C E I N D E X E S • 6 4 2 7 . 0 • MA R QT R 2 0 1 2
E X P L A N A T O R Y N O T E S

18 As far as possible, the industry indexes have been constructed in accordance with
the Australian and New Zealand Standard Industrial Classification ANZSIC 2006 (cat.
no. 1292.0). Prior to the September quarter 2009, all of the series were based on the
ANZSIC 1993 classification. The stage of production series (tables 5–9 and 24–25) remain
on an ANZSIC 1993 basis. However, from the September quarter 2009 onwards, the
Classi f icat ions
12 The main sources of ongoing price data are samples of businesses. The samples can
relate to either buyers or sellers, or a combination of both. The choice is influenced by
the pricing point of the index (output or input) and practical considerations such as the
relative degree of concentration of buyers, and of sellers, and the implications for sample
sizes and costs.
13 The main pricing methodology used is specification pricing, under which a
manageable sample of precisely specified products is selected, in consultation with each
reporting business, for repeat pricing. In specifying the products, care is taken to ensure
that they are fully defined in terms of all the characteristics which influence their
transaction prices. As such, all the relevant technical characteristics need to be described
(e.g. make, model, features) along with the unit of sale, type of packaging, conditions of
sale (e.g. delivered, payment within 30 days), etc.
14 When the quality or the specifications of an item being priced change over time,
adjustments are made to the reported prices so that the index captures only pure price
change. That is, any element of price change attributable to a change in quality is
removed. If there is an increase (decrease) in the quality of an item, the price is adjusted
downwards (upwards) to reflect the value of the quality change to the provider of the
goods or services. This technique is known as pricing to constant quality.
15 Another very important consideration in establishing and maintaining price
collections is to ensure that the prices reported are actual market transaction prices.
That is, they must reflect the net prices received (or paid) after taking into account all
discounts applied to the transactions whether they be volume discounts, settlement
discounts or competitive price cutting discounts which are likely to fluctuate with market
conditions.
16 Any rebates also need to be considered. The collection of nominal list prices, or
book prices, is unlikely to yield reliable price indexes and could result in quite
misleading results if fluctuations in transaction prices are not captured. The ABS
therefore asks respondent businesses to report details of the discounts they offer so that
actual transaction prices can be calculated. In addition, as many different types of
discounts apply to business–to–business transactions (see paragraph 15), considerable
effort is put into monitoring discount practices in order to identify changes to existing
discounts and the introduction of new ones.
17 Specification pricing is not feasible in cases where the products are unique and not
reproduced over time, e.g. construction industry output and many of the customised
business services. As a result, alternative pricing techniques need to be used, often
involving compromise. Some of the approaches adopted include the use of model
pricing, collecting unit values for reasonably homogeneous components of a good or
service, input pricing and collecting charge–out rates (e.g. for a legal service).
Price measurement
10 The indexes are fixed weighted indexes of the Laspeyres form. The list of items and
the weights are updated periodically to ensure they remain representative. New index
series compiled using updated weights are linked to the previous series to maintain a
continuous series. Broad level weights are derived from an analysis of the latest available
input–output tables as well as other ABS and industry sources.
11 Where prices of items are expected to move in a similar way, many of the directly
priced items carry not only their own weight but also the weight of similar commodities.
Items and weights
A B S • P R O D U C E R P R I C E I N D E X E S • 6 4 2 7 . 0 • MA R QT R 2 0 1 2 17
E X P L A N A T O R Y N O T E S continued

23 The indexes are compiled using the SOP concept. Under this concept flows of
commodities are categorised according to their economic destination on a sequential
basis along the production chain. The basis for the categorisation is the Australian
input–output tables (1996–97). The primary categorisation is between final commodities
(i.e. commodities destined for final consumption, capital formation or export) and
non–final commodities (i.e. commodities that flow into intermediate consumption for
further processing).
24 This initial breakdown of the commodity flows into final and non–final represents a
useful economic dissection of producers' transactions. However, the non–final
commodities can flow into the production of both final and other non–final
commodities. Therefore, to aid analysis, the non–final commodity flows have been
divided on a sequential basis between Stage 1 (or preliminary) commodities and Stage 2
(or intermediate) commodities as illustrated below. This approach results in three
separate stages of production.
The SOP concept
22 In concept the valuation basis of the SOP indexes is basic prices (see paragraphs
5–9). However, the use of component series from existing ABS price collections in some
cases results in the pricing basis diverging from this ideal. For example, imports are
priced on a 'free–on–board' (f.o.b) basis, not 'cost, insurance, freight' (c.i.f), which
approximates basic prices.
Pric ing basis
19 Tables 1–9 and 24–25 present producer price indexes for the supply of
commodities to the Australian economy in a stage of production (SOP) framework. As
such, the indexes cover both domestically produced and imported commodities,
individually and in aggregate. The SOP indexes are compiled from data used in the
industry sector indexes, the international trade indexes and some additional data
collections. The indexes are calculated on the reference base 1998–99=100.0.
20 These indexes are compiled within the statistical framework outlined in
Information Paper: An Analytical Framework for Price Indexes in Australia, 1997 (cat.
no. 6421.0) and are designed to support the study of inflation.
21 A more detailed explanation of the SOP concept is contained in Information Paper:
Producer Price Index Developments, 1999 (cat. no. 6422.0). The index numbers in this
current publication cannot be directly compared with the experimental index numbers
in the information paper because:
! the coverage of the series has been expanded to include selected service and
construction industries; and
! the weighting patterns of the indexes have been updated to 1996–97 and the
reference base of the indexes has been updated to 1998–99=100.0.
ST A G E OF PR O D U C T I O N
(S O P ) PR O D U C E R PR I C E
IN D E X E S
Introduct ion
other producer price indexes relating to products primary to specific industries are
based on ANZSIC 2006. A mapping has been prepared to enable the ANZSIC 2006
producer price indexes to be represented under the ANZSIC 1993 stage of production
framework. Further information on the new industrial classification can be found in the
Appendix to the March quarter 2009 issue of this publication, as well as in Information
Paper: Update on ANZSIC 2006 Implementation for Producer and International Trade
Price Indexes, Australia, 2009 (cat. no. 6427.0.55.002).
Classi f icat ions continued
18 A B S • P R O D U C E R P R I C E I N D E X E S • 6 4 2 7 . 0 • MA R QT R 2 0 1 2
E X P L A N A T O R Y N O T E S continued

31 Producer price indexes conventionally relate to the output primary to domestic
industries, at basic prices, either inclusive or exclusive of exports. As the main focus is on
domestic inflation, exports are excluded from the headline SOP series 'Final (Stage 3)
commodities', as presented in the key figures on the front page and in tables 1–6. Index
series for Final (Stage 3) commodities including exports are available in tables 24 and 25.
32 Imports have also been incorporated within the framework, recognising that they
represent an important potential source of inflationary pressure.
33 In concept, the SOP indexes incorporate all flows of goods and services. However,
currently there is limited coverage of service industries and the construction industry by
the producer price indexes (see sections on construction industry and service industries
producer price indexes below).
34 Price indexes for most Transport and storage services (Division I of ANZSIC 1993)
and Property and business services (Division L of ANZSIC 1993) industries have been
included in the SOP framework. However, price series for most Final (Stage 3) consumer
services are not currently available on a sufficiently timely basis to allow their inclusion in
the indexes. This has the effect of decreasing the relative weight of consumer items
versus capital items in the final stage. It is intended to introduce additional services price
series as they become available, along with the consequential weight changes.
35 Index coverage for the construction industry (Division E of ANZSIC 1993) is
currently limited to the outputs primary to the following ANZSIC 1993 classes:
! 4111 House construction;
! 4112 Residential building construction n.e.c.;
! 4113 Non-residential building construction; and
Scope and coverage
28 The ABS has adopted a transaction flow approach in disaggregating commodity
supply into the various production stages. This approach means that the assignment of a
commodity to a stage is based on the proximity of its use in final demand.
29 Alternative degree of fabrication or principal destination approaches are employed
by statistical agencies in some other countries. These approaches result in the allocation
of particular commodities to one, and only one, stage. This would present particular
problems for Australia due to the openness of the economy, with exports (and imports)
equivalent to about 20% of gross domestic product. Commodities such as wheat, wool,
and iron ore are exported in large volumes as well as being further processed locally. The
allocation of such commodities to a single stage would be very arbitrary by necessity.
30 Adopting the transaction flow approach means, for example, that exported wheat
and domestically used wheat are treated as different commodities for index construction
purposes. Under this approach commodities transactions can be allocated to more than
one stage. Exported wheat is treated as a final (Stage 3) commodity while wheat used
domestically to make the flour used in bread production is considered to be a
preliminary (Stage 1) commodity. Similarly, commodities such as energy and containers
appear under all three categories.
Transact ion flow approach
25 The three stages are not aggregated in order to avoid the potential distorting effects
that may result from multiple counting of changes in transaction prices as commodities
flow through different production processes.
26 Under this framework, preliminary (Stage 1) commodities are used in the
production of intermediate (Stage 2) commodities; in turn intermediate (Stage 2)
commodities flow into the production of final (Stage 3) commodities.
27 The framework allows for analyses of price change as commodities flow through
production processes. Price changes for earlier stages of production may be indicators of
possible future price changes for later stages.
The SOP concept continued
A B S • P R O D U C E R P R I C E I N D E X E S • 6 4 2 7 . 0 • MA R QT R 2 0 1 2 19
E X P L A N A T O R Y N O T E S continued

43 Prior to the September quarter 2009, the manufacturing indexes were constructed
on a net sector basis with intra–sector transactions netted out. The scope of the output
indexes was therefore restricted to transactions in produced articles primary to the
defined sector of the Australian manufacturing industry that were sold or transferred to
domestic establishments outside that sector, or used as capital equipment, or exported.
The scope of the input indexes related to transactions in materials used in defined
sectors of the Australian manufacturing industry that were produced by domestic
establishments outside that sector, or imported.
Scope
39 The manufacturing output producer price indexes relate to selected products (i.e.
articles produced) primary to the manufacturing industry, while the manufacturing input
producer price indexes relate to materials used by establishments classified to the
manufacturing industry. They are important sources of data for the SOP indexes.
40 The manufacturing industry series are available on the ABS website
<http://www.abs.gov.au>. Tables 10 and 11 present the Price Indexes of Articles
Produced by Manufacturing Industries and tables 12–14 present the Price Indexes of
Materials Used in Manufacturing Industries. Basic prices are used for the output index
and purchasers' prices for the input index (see paragraphs 5–9). Therefore, as far as
possible, ex–factory prices are included in the output index. Delivered into factory prices
are included in the input index.
41 Table 30 presents Price Indexes of Copper Materials used in the manufacture of
electrical equipment.
42 The reference base for all of the ANZSIC 2006 classified manufacturing output and
input indexes linked to previous ANZSIC 1993 classified indexes is 1989–90 = 100.0. The
reference base for new manufacturing output and input indexes, introduced as part of
the ANZSIC 2006 implementation in the September quarter 2009, is 2001–02 = 100.0.
(Further information relating to the reference bases is presented in the Appendix to the
March quarter 2009 issue of this publication).
MA N U F A C T U R I N G IN D U S T R Y
PR O D U C E R PR I C E IN D E X E S
Introduct ion
38 Final (Stage 3) indexes are presented for consumer commodities. It should be
noted that this index is not directly comparable with the Consumer Price Index (CPI).
The two indexes differ significantly in concept and coverage. The major differences are:
! the pricing basis for the Final (Stage 3) SOP consumer index is basic prices (see
paragraph 22). The CPI, however, measures changes in purchasers' prices, i.e. the
actual retail prices paid by households for products, inclusive of non–deductible
taxes on products, such as the GST, and any transport and trade margins;
! the coverage of the two indexes differs. Currently the Final (Stage 3) SOP consumer
index mainly measures changes in the prices of goods, i.e. most household services
are currently excluded from the index (see paragraph 34). The CPI covers both
goods and services; and
! the indexes have different weighting bases. The weighting pattern for the Final
(Stage 3) SOP consumer index is based on the 1996–97 input–output tables, while
the CPI weighting pattern is based on the 2003–04 Household Expenditure Survey.
Comparisons with the
Consumer Price Index
37 The items included in the indexes reflect the values of commodity flows, for both
domestic supply and imports, allocated to stages based on an analysis of detailed
1996–97 input–output tables. The index structures and weighting patterns for the SOP
indexes are shown in the Appendix of the December quarter 2002 issue of this
publication.
Items and weights
! 4121 Road and bridge construction.
36 As with services, it is intended to introduce further construction price series as they
become available.
Scope and coverage continued
20 A B S • P R O D U C E R P R I C E I N D E X E S • 6 4 2 7 . 0 • MA R QT R 2 0 1 2
E X P L A N A T O R Y N O T E S continued

48 The manufacturing division output index (table 10), from the September quarter
2009 onwards, measures changes in prices of articles that are primary to ANZSIC 2006
Division C – Manufacturing, that are sold or transferred to domestic establishments
within or outside the manufacturing division for further processing, intermediate use or
used as capital equipment or exported. Prior to the September quarter 2009 this index
was constructed on a net sector basis (see paragraphs 43–47 above).
49 Similarly, the output indexes for articles primary to manufacturing subdivisions and
groups (table 11) measure transactions within and outside the subdivision or group.
Prior to the September quarter 2009 these series were constructed on a net sector basis.
They excluded intermediate transactions in produced articles primary to the specific
manufacturing subdivision or group that were sold or transferred within that subdivision
or group for further processing.
Classi f icat ion
44 From the September quarter 2009, the manufacturing indexes are constructed on a
gross sector basis. The scope of the output indexes includes transactions in produced
articles primary to the defined sector of Australian manufacturing industries that are sold
or transferred to domestic establishments within or outside that sector for further
processing, or used as capital equipment, or exported. Articles are defined as all
products primary to the manufacturing industry excluding commission production
products and general government consumption of fixed capital. The scope of the input
indexes relates to transactions in materials used by establishments classified to the
manufacturing industry. Materials are defined as products primary to ANZSIC 2006
Divisions A – D (ie agriculture, forestry, fishing, mining, manufacturing and electricity,
gas, water and waste services) that are consumed by establishments classified to the
manufacturing industry.
45 An advantage of the net sector approach over the gross sector approach was that it
avoided the potential distorting effects that may have resulted from multiple counting of
changes in transaction prices as commodities flow through different production
processes. However, although conceptually valid, the exclusion of the internal
intermediate transactions from the net sector manufacturing division indexes resulted in
incomplete coverage of the targeted sector of the economy. Prior to the September
quarter 2009, in order to increase coverage, while still avoiding the multiple counting
issue, independent net sector measures were constructed for articles primary to
manufacturing subdivisions and groups on an ANZSIC 1993 basis. While having
intermediate transactions between different manufacturers within a given subdivision or
group netted out, intermediate transactions with manufacturers in other
subdivisions/groups were in–scope.
46 Following further analysis and discussions with key users of the indexes, the ABS
has determined that the potential for distortion from multiple counting of changes in
transaction prices is low. An advantage of the gross sector approach is improved
coverage of transactions primary to the targeted sector of the economy. Intermediate
transactions between manufacturers in other ANZSIC subdivisions or groups and
transactions between different manufacturers within the same ANZSIC subdivision or
group are in–scope. The change in concept from net to gross sector is not expected to
have a material impact, as the same influences affect prices whether transactions occur
within or outside the manufacturing industry.
47 The gross sector approach is more appropriate for use alongside the SOP
framework. Conceptually, the SOP indexes are economy–wide relating to transactions
primary to all the goods and services industries, and the gross sector approach is more
consistent with the system of national accounts.
Scope continued
A B S • P R O D U C E R P R I C E I N D E X E S • 6 4 2 7 . 0 • MA R QT R 2 0 1 2 21
E X P L A N A T O R Y N O T E S continued

58 The construction outputs price indexes (table 15) measure changes in prices of the
outputs primary to selected construction industry classes. Presented in this table is the
ANZSIC 2006 Subdivision (30) – Building construction which consists of three classes:
House construction (3011); Other residential building construction (3019); and
Non–residential building construction (3020). Outputs primary to the class Road and
bridge construction (3101) are also presented in this table.
Scope
54 The construction producer price indexes relate to outputs primary to ANZSIC 2006
Division E. The House building (i.e. material used) input index relates to products used
by establishments classified to ANZSIC 2006 Division E. These indexes are important
sources of data for the SOP index.
55 The construction industry series are available on the ABS website
<http://www.abs.gov.au>. Table 15 presents the Price index of the outputs that are
primary to the building construction subdivision and selected construction industry
classes. Tables 16 and 17 present the price index of Materials used in house building. The
pricing basis is basic prices for the output indexes and purchasers' prices for the input
index (see paragraphs 5–9 above). Therefore, as far as possible, builders' selling prices
are reflected in the output index, and delivered on site prices are reflected in the input
index.
56 Table 31 presents the price indexes for Asphalt supply and Asphalt placed for the
weighted average of six capital cities. These indexes measure changes in the price of the
supply, delivery and placement of selected grades of asphaltic concrete used in road
construction in capital city statistical divisions. As far as possible, actual transaction prices
are used in this index.
57 The output indexes are calculated on the reference base 1998–99=100.0 and the
input indexes on the reference base 1989–90=100.0.
CO N S T R U C T I O N IN D U S T R Y
PR O D U C E R PR I C E IN D E X E S
Introduct ion
52 From the September quarter 2009, the items included in the manufacturing indexes
reflect the values of articles produced and materials used based on an analysis of detailed
2001–02 input–output tables.
53 The index structures and weighting patterns for the manufacturing input and
output division indexes are shown in Appendix 1 of Information Paper: Update on
ANZSIC 2006 Implementation for Producer and International Trade Price Indexes,
Australia, 2009 (cat. no. 6427.0.55.002). Index structures and weighting patterns for the
associated ANZSIC subdivisions and groups are available from the ABS website
<http://www.abs.gov.au> as data cubes in that information paper (cat. no.
6427.0.55.002).
Items and weights
50 The manufacturing division input index (tables 12 and 13), from the September
quarter 2009 onwards, measures changes in prices of materials used in ANZSIC 2006
Division C – Manufacturing, that have been purchased or transferred in from domestic
establishments within or outside the manufacturing division, or imported. Prior to the
September quarter 2009 this index was constructed on a net sector basis (see paragraphs
43–47 above).
51 Similarly, the input indexes for materials used in manufacturing subdivisions and
groups (table 14) measure input purchases or transfers within and outside the
subdivision or group. Prior to the September quarter 2009 these indexes were
constructed on a net sector basis. They excluded intermediate transactions in materials
used in a specific manufacturing subdivision or group that were sold or transferred
within that subdivision or group for further processing.
Classi f icat ion continued
22 A B S • P R O D U C E R P R I C E I N D E X E S • 6 4 2 7 . 0 • MA R QT R 2 0 1 2
E X P L A N A T O R Y N O T E S continued
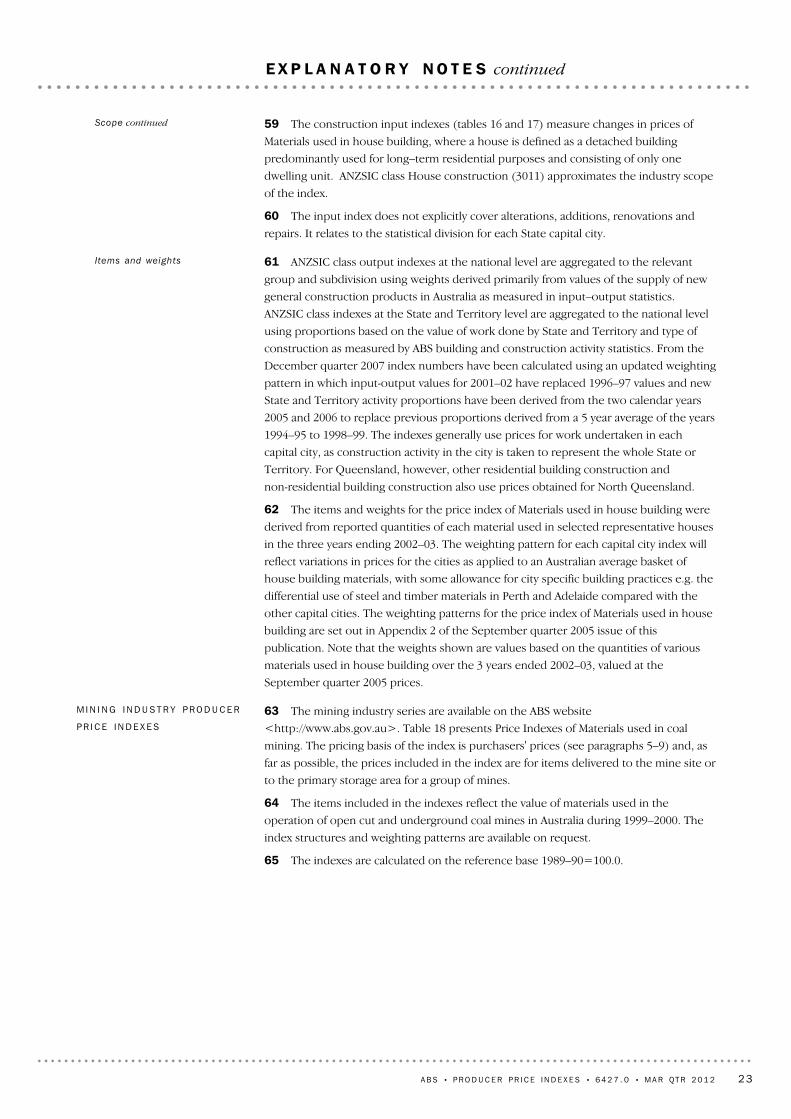
63 The mining industry series are available on the ABS website
<http://www.abs.gov.au>. Table 18 presents Price Indexes of Materials used in coal
mining. The pricing basis of the index is purchasers' prices (see paragraphs 5–9) and, as
far as possible, the prices included in the index are for items delivered to the mine site or
to the primary storage area for a group of mines.
64 The items included in the indexes reflect the value of materials used in the
operation of open cut and underground coal mines in Australia during 1999–2000. The
index structures and weighting patterns are available on request.
65 The indexes are calculated on the reference base 1989–90=100.0.
MI N I N G IN D U S T R Y PR O D U C E R
PR I C E IN D E X E S
61 ANZSIC class output indexes at the national level are aggregated to the relevant
group and subdivision using weights derived primarily from values of the supply of new
general construction products in Australia as measured in input–output statistics.
ANZSIC class indexes at the State and Territory level are aggregated to the national level
using proportions based on the value of work done by State and Territory and type of
construction as measured by ABS building and construction activity statistics. From the
December quarter 2007 index numbers have been calculated using an updated weighting
pattern in which input-output values for 2001–02 have replaced 1996–97 values and new
State and Territory activity proportions have been derived from the two calendar years
2005 and 2006 to replace previous proportions derived from a 5 year average of the years
1994–95 to 1998–99. The indexes generally use prices for work undertaken in each
capital city, as construction activity in the city is taken to represent the whole State or
Territory. For Queensland, however, other residential building construction and
non-residential building construction also use prices obtained for North Queensland.
62 The items and weights for the price index of Materials used in house building were
derived from reported quantities of each material used in selected representative houses
in the three years ending 2002–03. The weighting pattern for each capital city index will
reflect variations in prices for the cities as applied to an Australian average basket of
house building materials, with some allowance for city specific building practices e.g. the
differential use of steel and timber materials in Perth and Adelaide compared with the
other capital cities. The weighting patterns for the price index of Materials used in house
building are set out in Appendix 2 of the September quarter 2005 issue of this
publication. Note that the weights shown are values based on the quantities of various
materials used in house building over the 3 years ended 2002–03, valued at the
September quarter 2005 prices.
Items and weights
59 The construction input indexes (tables 16 and 17) measure changes in prices of
Materials used in house building, where a house is defined as a detached building
predominantly used for long–term residential purposes and consisting of only one
dwelling unit. ANZSIC class House construction (3011) approximates the industry scope
of the index.
60 The input index does not explicitly cover alterations, additions, renovations and
repairs. It relates to the statistical division for each State capital city.
Scope continued
A B S • P R O D U C E R P R I C E I N D E X E S • 6 4 2 7 . 0 • MA R QT R 2 0 1 2 23
E X P L A N A T O R Y N O T E S continued
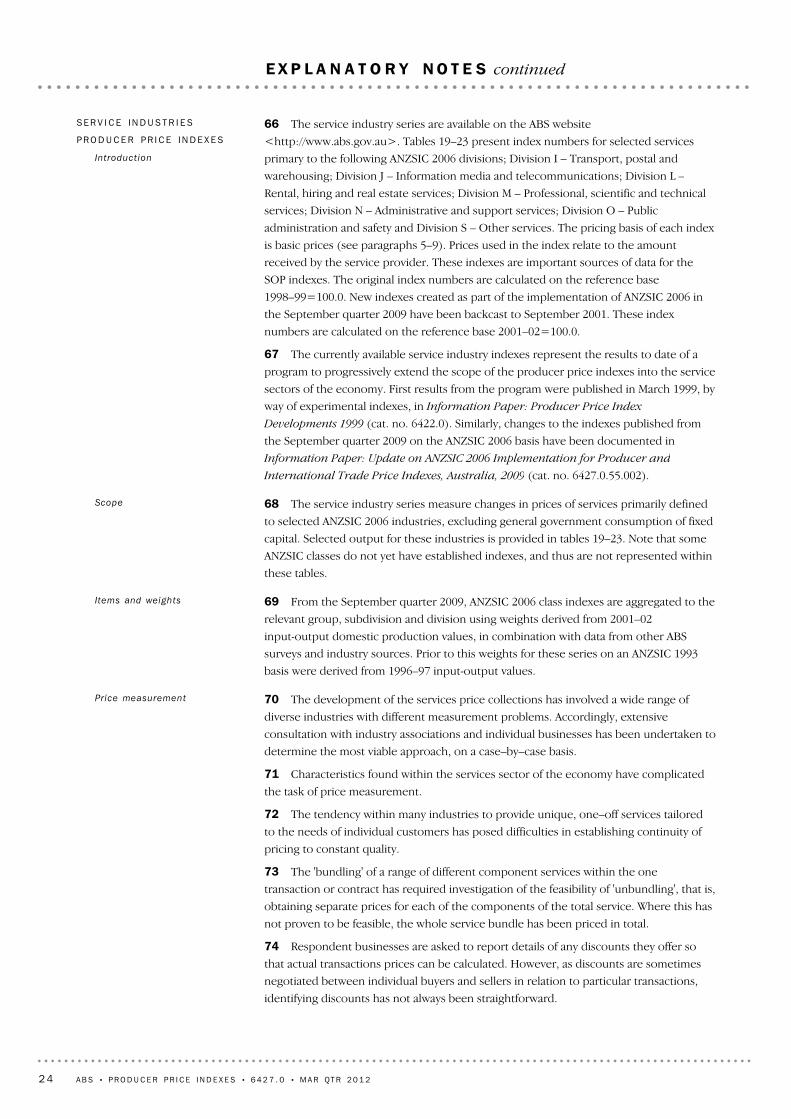
70 The development of the services price collections has involved a wide range of
diverse industries with different measurement problems. Accordingly, extensive
consultation with industry associations and individual businesses has been undertaken to
determine the most viable approach, on a case–by–case basis.
71 Characteristics found within the services sector of the economy have complicated
the task of price measurement.
72 The tendency within many industries to provide unique, one–off services tailored
to the needs of individual customers has posed difficulties in establishing continuity of
pricing to constant quality.
73 The 'bundling' of a range of different component services within the one
transaction or contract has required investigation of the feasibility of 'unbundling', that is,
obtaining separate prices for each of the components of the total service. Where this has
not proven to be feasible, the whole service bundle has been priced in total.
74 Respondent businesses are asked to report details of any discounts they offer so
that actual transactions prices can be calculated. However, as discounts are sometimes
negotiated between individual buyers and sellers in relation to particular transactions,
identifying discounts has not always been straightforward.
Price measurement
69 From the September quarter 2009, ANZSIC 2006 class indexes are aggregated to the
relevant group, subdivision and division using weights derived from 2001–02
input-output domestic production values, in combination with data from other ABS
surveys and industry sources. Prior to this weights for these series on an ANZSIC 1993
basis were derived from 1996–97 input-output values.
Items and weights
68 The service industry series measure changes in prices of services primarily defined
to selected ANZSIC 2006 industries, excluding general government consumption of fixed
capital. Selected output for these industries is provided in tables 19–23. Note that some
ANZSIC classes do not yet have established indexes, and thus are not represented within
these tables.
Scope
66 The service industry series are available on the ABS website
<http://www.abs.gov.au>. Tables 19–23 present index numbers for selected services
primary to the following ANZSIC 2006 divisions; Division I – Transport, postal and
warehousing; Division J – Information media and telecommunications; Division L –
Rental, hiring and real estate services; Division M – Professional, scientific and technical
services; Division N – Administrative and support services; Division O – Public
administration and safety and Division S – Other services. The pricing basis of each index
is basic prices (see paragraphs 5–9). Prices used in the index relate to the amount
received by the service provider. These indexes are important sources of data for the
SOP indexes. The original index numbers are calculated on the reference base
1998–99=100.0. New indexes created as part of the implementation of ANZSIC 2006 in
the September quarter 2009 have been backcast to September 2001. These index
numbers are calculated on the reference base 2001–02=100.0.
67 The currently available service industry indexes represent the results to date of a
program to progressively extend the scope of the producer price indexes into the service
sectors of the economy. First results from the program were published in March 1999, by
way of experimental indexes, in Information Paper: Producer Price Index
Developments 1999 (cat. no. 6422.0). Similarly, changes to the indexes published from
the September quarter 2009 on the ANZSIC 2006 basis have been documented in
Information Paper: Update on ANZSIC 2006 Implementation for Producer and
International Trade Price Indexes, Australia, 2009 (cat. no. 6427.0.55.002).
SE R V I C E IN D U S T R I E S
PR O D U C E R PR I C E IN D E X E S
Introduct ion
24 A B S • P R O D U C E R P R I C E I N D E X E S • 6 4 2 7 . 0 • MA R QT R 2 0 1 2
E X P L A N A T O R Y N O T E S continued
79 Care should be exercised when interpreting quarter–to–quarter movements in the
indexes as short–term movements do not necessarily indicate changes in trend.
80 Movements in indexes from one period to another can be expressed either as
changes in 'index points' or as percentage changes. The following example illustrates the
method of calculating index points changes and percentage changes between any two
periods:
Stage of Production: Total Final commodities index numbers
June quarter 2010 135.2 (see table 1)
less June quarter 2009 133.9 (see table 1)
Change in index points 1.3
Percentage change 1.3/133.9 x 100 = 1.0% (see table 2)
81 Tables 5, 6 and 7 provide analyses of the index points contribution which ANZSIC
groups make to the stage of production final commodities indexes, in total, and then
separately for domestic and imported commodities. For example, in table 5 petroleum
refining contributed 4.18 index points to the Total Final commodities index number of
140.7 for the March quarter 2012 and 0.02 index points to the net change of –0.4 index
points between the December 2011 and March 2012 quarters.
82 Tables 8 and 9 analyse the contributions to the intermediate and preliminary
commodities index numbers, respectively.
AN A L Y S I S OF IN D E X
CH A N G E S
77 Index numbers for financial years are simple averages of the relevant quarterly
index numbers.
78 Indexes for the price index of Materials used in house building are presented
separately for each of the six State capital cities. These city indexes measure price
movements over time for each city. They do not measure differences in price levels
between cities.
I N D E X NU M B E R S
76 It is planned to make available indexes for the majority of remaining ANZSIC 2006
classes within the services divisions after they have been developed from experimental to
production status. At such time these new indexes would contribute to the broader SOP
indexes in this publication and associated outputs available on the ABS website
<http://www.abs.gov.au>.
Future developments
75 The deregulation of some service industries leads to structural changes and more
complex pricing practices. To deal with this, samples are continually updated to
incorporate new businesses and pricing methodologies are reviewed over time.
Price measurement continued
A B S • P R O D U C E R P R I C E I N D E X E S • 6 4 2 7 . 0 • MA R QT R 2 0 1 2 25
E X P L A N A T O R Y N O T E S continued

84 Users may also wish to refer to the following related publications, and other data
products that are available free of charge from the ABS website.
International Trade Price Indexes, Australia (cat. no. 6457.0)
Consumer Price Index, Australia (cat. no. 6401.0)
Labour Price Index, Australia (cat. no. 6345.0)
Australian National Accounts, input/output Tables (cat. no. 5209.0)
Balance of Payments and International Investment Position, Australia
(cat. no. 5302.0)
85 Current publications and other products released by the ABS are listed on the ABS
website <http://www.abs.gov.au>. The ABS also issues a daily Release Advice on the
website which details products to be released in the week ahead.
RE L A T E D PU B L I C A T I O N S
83 Further information on recent price index developments in the ABS is presented in
the following publications:
Information Paper: Producer and International Trade Price Indexes; Concepts,
Sources and Methods, 2006 (cat. no. 6429.0)
Information Paper: Review of the Producer and International Trade Price
Indexes, 2011 (cat. no. 6427.0.55.003)
Information Paper: Outcome of the Review of the Producer and International
Trade Price Indexes, 2012 (cat.no.6427.0.55.004)
Information Paper: An Analytical Framework for Price Indexes in Australia, 1997
(cat. no. 6421.0)
Information Paper: Producer Price Index Developments, 1999 (cat. no. 6422.0)
Information Paper: Review of the Import Price Index and Export Price Index,
Australia, 1999 (cat. no. 6424.0)
Information Paper: Price Indexes and The New Tax System, 2000 (cat. no. 6425.0)
Information Paper: The Introduction of Hedonics Price Indexes for Personal
Computers, 2005 (cat. no. 6458.0)
Information Paper: Changes to the Weights of the Price Indexes for the Output of
the General Construction Industry, Australia, 2008 (cat. no. 6406.0)
Australian and New Zealand Standard Industrial Classification (ANZSIC), 2006,
(Revision 1.0) (cat. no. 1292.0)
Information Paper: Update on ANZSIC 2006 Implementation, Australia, 2008
(cat. no. 1295.0.55.001)
Information Paper: Update on ANZSIC 2006 Implementation for Producer and
International Trade Price Indexes, Australia, 2009 (cat. no. 6427.0.55.002)
FU R T H E R IN F O R M A T I O N
stage of productionSOP
not elsewhere classifiedn.e.c.
manufacturingmfg
free on boardf.o.b.
cost, insurance and freightc.i.f.
Australian and New Zealand Standard Industrial ClassificationANZSIC
Australian Bureau of StatisticsABSAB B R E V I A T I O N S
26 A B S • P R O D U C E R P R I C E I N D E X E S • 6 4 2 7 . 0 • MA R QT R 2 0 1 2
E X P L A N A T O R Y N O T E S continued

The SOP indexes will be presented using the ANZSIC 2006 classification from the
September quarter 2012.
Major outcomes from the implementation of ANZSIC 2006 will include:
! some restructuring and/or renaming of previous ANZSIC 1993 series;
! discontinuation of some series (see below);
! introduction of some new series;
! introduction of a new weighting pattern; and
! a changed presentation and format of Producer Price Indexes, Australia
(cat. no. 6427.0).
The discontinued series for the SOP, Final commodities will be:
! Other food manufacturing (group 217);
! Printing and services to printing (group 241);
! Publishing (group 242);
! Other chemical product manufacturing (group 254);
! Plastic product manufacturing (group 256);
! Iron and steel manufacturing (group 271);
! Sheet metal product manufacturing (group 275);
! Electrical equipment and appliance manufacturing (group 285);
! Industrial machinery and equipment manufacturing (group 286);
! Non–building construction (group 412);
! Services to transport (subdivision 66);
! Technical services (group 782); and
! Computer services (group 783).
The discontinued series for the SOP, Intermediate commodities will be:
! Services to agriculture; hunting and trapping (subdivision 02);
! Other food manufacturing (group 217);
! Printing and services to printing (group 241);
! Publishing (group 242);
! Other chemical product manufacturing (group 254);
! Plastic product manufacturing (group 256);
! Iron and steel manufacturing (group 271);
CH A N G E S FR O M TH E
SE P T E M B E R QU A R T E R 20 1 2
In 2002, the Australian Bureau of Statistics (ABS) and Statistics New Zealand commenced
a review to maintain the currency and relevance of ANZSIC. The review found that since
the release of the original classification in 1993 there had been significant changes in
industrial and business activities in both Australia and New Zealand. The 2006 edition of
ANZSIC was released in February 2006. An electronic version of the ANZSIC 2006
classification is available free of charge from the ABS website, titled Australian and New
Zealand Standard Industrial Classification, (ANZSIC), 2006 (cat. no. 1292.0).
The ABS introduced the PPI and ITPI series (excluding SOP) on an ANZSIC 2006 basis in
the September quarter 2009 (See Information Paper: Update on ANZSIC 2006
Implementation for Producer and International Trade Price Indexes, 2009
(cat. no. 6427.0.55.002)). An overview of the changes relating to the implementation of
ANZSIC 2006 in the PPI and ITPI series was also presented in the Appendix of the March
quarter 2009 issues of Producer Price Indexes, Australia (cat. no. 6427.0) and
International Trade Price Indexes, Australia (cat. no. 6457.0). Correspondences
between the old (ANZSIC 1993) and new (ANZSIC 2006) series are available via the
'Downloads' tab of the March quarter 2009 issues on the ABS website.
BA C K G R O U N D
This Appendix provides information on the changes to the Stage of Production (SOP)
indexes as a result of updating the industrial classification from the 1993 edition to the
2006 edition of the Australian and New Zealand Standard Industrial Classification
(ANZSIC 2006).
I N T R O D U C T I O N
A B S • P R O D U C E R P R I C E I N D E X E S • 6 4 2 7 . 0 • MA R QT R 2 0 1 2 27
A P P E N D I X S T A G E O F P R O D U C T I O N AN D IM P L E M E N T A T I O N O F AN Z S I C 2 0 0 6
! Structural metal product manufacturing (group 274);
! Sheet metal product manufacturing (group 275);
! Electrical equipment and appliance manufacturing (group 285);
! Industrial machinery and equipment manufacturing (group 286);
! Air and space transport (group 640);
! Other transport (group 650);
! Services to transport (group 670);
! Property operators and developers (group 771);
! Technical services (group 782); and
! Computer services (group 783).
The discontinued series for the SOP, Preliminary commodities will be:
! Services to agriculture; hunting and trapping (subdivision 02);
! Other food manufacturing (group 217);
! Printing and services to printing (group 241);
! Publishing (group 242);
! Other chemical product manufacturing (group 254);
! Plastic product manufacturing (group 256);
! Iron and steel manufacturing (group 271);
! Structural metal product manufacturing (group 274);
! Sheet metal product manufacturing (group 275);
! Electrical equipment and appliance manufacturing (group 285);
! Industrial machinery and equipment manufacturing (group 286);
! Air and space transport (group 640);
! Other transport (group 650);
! Services to transport (group 670);
! Property operators and developers (group 771);
! Technical services (group 782); and
! Computer services (group 783).
From the September quarter 2012, the ABS will provide further clarification on the
concept of the SOP indexes in the Explanatory Notes of the publication Producer Price
Indexes, Australia (cat. no. 6427.0) and within an updated Producer and International
Trade Price Indexes: Concepts, Sources and Methods publication, which will be released
in early 2013. To aid in this clarification, the SOP indexes will be renamed as follows:
! Stage 3 (Final) will become Final Demand – Products consumed as Final Demand;
! Stage 2 (Intermediate) will become Intermediate Demand – Products consumed as
inputs into the production of Final Demand; and
! Stage 1 (Preliminary) will become Preliminary Demand – Products consumed as
inputs into the production of Intermediate Demand.
Tables 1, 2 and 3 below provide correspondences between the old (ANZSIC 1993) and
new (ANZSIC 2006) SOP series currently released in Producer Price Indexes, Australia
(cat. no. 6427.0). Discontinued and expected new series are also shown.
The ABS is undertaking detailed analysis of the 2007–08 Input–Output (I–O) tables to
derive new weights for the suite of PPIs and SOP indexes. This analysis will include
examination of all new and existing series to ensure that all published data conforms
with the ABS data release policies. Therefore, the series presented in Tables 1, 2 and 3
below are preliminary and subject to change pending the results of this analysis.
CH A N G E S FR O M TH E
SE P T E M B E R QU A R T E R 20 1 2
continued
28 A B S • P R O D U C E R P R I C E I N D E X E S • 6 4 2 7 . 0 • MA R QT R 2 0 1 2
A P P E N D I X S T A G E O F P R O D U C T I O N AN D IM P L E M E N T A T I O N O F AN Z S I C 2 0 0 6 continued

TABLE 1 — STAGE OF PRODUCTION, FINAL DEMAND, Aust ra l i an and New Zea land
standa rd indus t r i a l c lass i f i ca t i on (ANZS IC ) 1993 to 2006 Cor respondence tab le
(a)Basic non�ferrous metal productmanufacturing214Non�ferrous basic metal product
manufacturing273
(c)Basic ferrous metal productmanufacturing212
Discontinued, included in 212 (part)Iron and steel manufacturing271
(c)Polymer product manufacturing191
Discontinued, included in 191 (part)Plastic product manufacturing256(b)Natural rubber product manufacturing192Rubber product manufacturing255(c)Polymer product manufacturing191
(c)Other basic chemical productmanufacturing189
(c)Cleaning compound and toiletrypreparation manufacturing185
(c)Pharmaceutical and medicinal productmanufacturing184
Discontinued, split into 184, 185, 189, 191Other chemical product manufacturing254(b)Basic polymer manufacturing182Basic chemical manufacturing253
(a)Petroleum refining and petroleum fuelmanufacturing1701Petroleum refining251
(a)Reproduction of recorded media162Recorded media manufacturing andpublishing243
(c)Newspaper, periodical, book anddirectory publishing 541
Discontinued, included in 541Publishing242
(c)Printing and printing support services161
(c)Converted paper product manufacturing 152
Discontinued, split into 152, 161Printing and services to printing241
(b)Other wood, paper and paper productmanufacturing149,15Other wood, paper and paper product
manufacturing232�233
(a)Leather tanning, fur dressing and leatherproduct manufacturing132Leather and leather product
manufacturing226
(a)Footwear manufacturing1352Footwear manufacturing225(a)Clothing manufacturing1351Clothing manufacturing224(a)Knitting product manufacturing134Knitting mills223(a)Textile product manufacturing133Textile product manufacturing222
(a)Textile manufacturing131Textile fibre, yarn and woven fabricmanufacturing221
(a)Cigarette and tobacco productmanufacturing122Tobacco product manufacturing219
(b)Beverage manufacturing121Beverage and malt manufacturing218(c)Other food product manufacturing119
(c)Sugar and confectionery manufacturing118
(c)Seafood processing112
(c)Discontinued, split into 112, 118, 119, 121 (part)Other food manufacturing217(a)Bakery product manufacturing117Bakery product manufacturing216
(a)Grain mill and cereal productmanufacturing116Flour mill and cereal food manufacturing215
(a)Oil and fat manufacturing115Oil and fat manufacturing214(a)Fruit and vegetable processing114Fruit and vegetable processing213(a)Dairy product manufacturing113Dairy product manufacturing212(a)Meat and meat product manufacturing111Meat and meat product manufacturing211(b)Fishing04Commercial fishing04
(b)Other agriculture011�013, 015,017�019Other agriculture011, 014�016
(a)Grain, sheep, beef and dairy cattlefarming014, 016Grain, sheep, beef and dairy cattle
farming012�013
StatusBecomesANZSIC 2006ANZSIC 1993Table 5 of Producer Price Indexes, Australia (cat. no. 6427.0)
A P P E N D I X S T A G E O F P R O D U C T I O N AN D IM P L E M E N T A T I O N O F AN Z S I C 2 0 0 6 continued
A B S • P R O D U C E R P R I C E I N D E X E S • 6 4 2 7 . 0 • MA R QT R 2 0 1 2 29

(c) Expected new series.
(b) Series continuing with compositional change.
(a) Series continuing.
Footnotes:
(b)Legal and accounting services693Legal and accounting services784
(c)Computer system design and relatedservices700
(c)Data processing, web hosting andelectronic information storage services 592
Discontinued, split into 592, 700Computer services783
(c)Architectural, engineering and technicalservices 692
Discontinued, included in 692 (part)Technical services782
(b)Real estate services672Real estate agents772DiscontinuedServices to transport66
(b)Water freight transport481Water, air and space transport630�640(b)Rail freight transport471Rail transport620(b)Road freight transport461Road freight transport611(a)Accommodation44Accommodation571(c)Road and bridge construction3101
DiscontinuedNon�building construction412(a)Building construction30Building construction411(b)Electricity, Gas & Water Supply26�28Electricity, gas and water supply36�37(b)Furniture and other manufacturing25Other manufacturing29
(c)Other machinery and equipmentmanufacturing249
(c)Specialised machinery and equipmentmanufacturing246
(c)Pump, compressor, heating andventilation equipment manufacturing245
Discontinued, split into 245, 246, 249Industrial machinery and equipmentmanufacturing286
(c)Domestic appliance manufacturing244
(c)Electrical equipment manufacturing 243
Discontinued, split into 243, 244Electrical equipment and appliancemanufacturing285
(b)Computer and electronic equipmentmanufacturing242Electronic equipment manufacturing284
(b)Professional and scientific equipmentmanufacturing241Photographic and scientific equipment
manufacturing283
(b)Other transport equipment manufacturing239Other transport equipment manufacturing282
(b)Motor vehicle and motor vehicle partmanufacturing231Motor vehicle and part manufacturing281
(b)Other fabricated metal productmanufacturing229Fabricated metal product manufacturing276
(c)Metal container manufacturing223
Discontinued, included in 223 (part)Sheet metal product manufacturing275
A P P E N D I X S T A G E O F P R O D U C T I O N AN D IM P L E M E N T A T I O N O F AN Z S I C 2 0 0 6 continued
30 A B S • P R O D U C E R P R I C E I N D E X E S • 6 4 2 7 . 0 • MA R QT R 2 0 1 2

TABLE 2 — STAGE OF PRODUCTION, INTERMEDIATE DEMAND, Aust ra l i an and New Zea land
standa rd indus t r i a l c lass i f i ca t i on (ANZS IC ) 1993 to 2006 Cor respondence tab le
Discontinued, included in 222 (part)Structural metal product manufacturing274
(a)Basic non�ferrous metal productmanufacturing214Non�ferrous basic metal product
manufacturing273
(a)Basic non�ferrous metal manufacturing213Basic non�ferrous metal manufacturing272
(c)Basic ferrous metal product manufacturing212
Discontinued, included in 212 (part)Iron and steel manufacturing271
(a)Non�metallic mineral productmanufacturing20Non�metallic mineral product
manufacturing26
(c)Polymer product manufacturing191
Discontinued, included in 191 (part)Plastic product manufacturing256
(b)Natural rubber product manufacturing192Rubber product manufacturing255
(c)Polymer product manufacturing191
(c)Other basic chemical productmanufacturing189
(c)Cleaning compound and toiletrypreparation manufacturing185
(c)Pharmaceutical and medicinal productmanufacturing184
Discontinued, split into 184, 185, 189, 191Other chemical product manufacturing254(b)Basic polymer manufacturing182Basic chemical manufacturing253
(a)Petroleum refining and petroleum fuelmanufacturing1701Petroleum refining251
(c)Newspaper, periodical, book and directorypublishing 541
Discontinued, included in 541Publishing242
(c)Printing and printing support services161
(c)Converted paper product manufacturing 152
Discontinued, split into 152, 161Printing and services to printing241
(b)Pulp, paper and converted paper productmanufacturing15Paper and paper product manufacturing233
(b)Other wood product manufacturing149Other wood product manufacturing232(b)Log sawmilling and timber dressing141Log sawmilling and timber dressing231
(a)Textile, leather, clothing and footwearmanufacturing13Textile, clothing, footwear and leather
manufacturing22
(b)Beverage manufacturing121Beverage and malt manufacturing218(c)Other food product manufacturing119
(c)Sugar and confectionery manufacturing118
(c)Seafood processing112
Discontinued, split into 112, 118, 119, 121 (part)Other food manufacturing217(a)Bakery product manufacturing117Bakery product manufacturing216
(a)Grain mill and cereal productmanufacturing116Flour mill and cereal food manufacturing215
(a)Fruit and vegetable processing; oil and fatmanufacturing114�115Fruit and vegetable processing; oil and fat
manufacturing213�214
(a)Dairy product manufacturing113Dairy product manufacturing212(a)Meat and meat product manufacturing111Meat and meat product manufacturing211
(a)Non�metallic mineral mining andquarrying09Other mining14
(a)Metal ore mining080Metal ore mining131(a)Oil and gas extraction070Oil and gas extraction120(a)Coal mining060Coal mining110(b)Fishing04Commercial fishing04
Discontinued, included in 04 (part)Services to agriculture; hunting andtrapping02
(b)Other agriculture011�013, 015,017�019Other agriculture011, 014�016
(a)Grain, sheep, beef and dairy cattle farming014, 016Grain, sheep, beef and dairy cattle farming012�013StatusBecomesANZSIC 2006ANZSIC 1993
Table 8 of Producer Price Indexes, Australia (cat. no. 6427.0)
A P P E N D I X S T A G E O F P R O D U C T I O N AN D IM P L E M E N T A T I O N O F AN Z S I C 2 0 0 6 continued
A B S • P R O D U C E R P R I C E I N D E X E S • 6 4 2 7 . 0 • MA R QT R 2 0 1 2

(c) Expected new series.
(b) Series continuing with compositional change.
(a) Series continuing.
Footnotes:
(c)Other administrative services729
(c)Employment services721
DiscontinuedOther business services786
(c)Market research and statistical services695
(c)Architectural, engineering and technicalservices 692
Discontinued, split into 692 (part), 695 (part), 696 (part)Marketing and business managementservices785
(b)Legal and accounting services693Legal and accounting services784
(c)Computer system design and relatedservices700
(c)Data processing, web hosting andelectronic information storage services592
Discontinued, split into 592, 700Computer services783
(c)Architectural, engineering and technicalservices 692
Discontinued, included in 692 (part)Technical services782
(b)Rental and hiring services (except realestate) 66Machinery and equipment hiring and
leasing774
(b)Real estate services672Real estate agents772
DiscontinuedProperty operators and developers771
(a)Warehousing and storage services530Storage670
DiscontinuedServices to transport66
DiscontinuedOther transport650
DiscontinuedAir and space transport640(b)Water freight transport481Water transport630(b)Rail freight transport471Rail transport620(b)Road freight transport461Road freight transport611(a)Accommodation44Accommodation571(b)Electricity, Gas & Water Supply26�28Electricity, gas and water supply36�37(b)Furniture and other manufacturing25Other manufacturing29
(c)Other machinery and equipmentmanufacturing249
(c)Specialised machinery and equipmentmanufacturing246
(c)Pump, compressor, heating and ventilationequipment manufacturing245
Discontinued, split into 245, 246, 249Industrial machinery and equipmentmanufacturing286
(c)Domestic appliance manufacturing244
(c)Electrical equipment manufacturing 243
Discontinued, split into 243, 244Electrical equipment and appliancemanufacturing285
(b)Computer and electronic equipmentmanufacturing242Electronic equipment manufacturing284
(b)Professional and scientific equipmentmanufacturing241Photographic and scientific equipment
manufacturing283
(b)Other transport equipment manufacturing239Other transport equipment manufacturing282
(b)Motor vehicle and motor vehicle partmanufacturing231Motor vehicle and part manufacturing281
(b)Other fabricated metal productmanufacturing229Fabricated metal product manufacturing276
(c)Metal container manufacturing223
Discontinued, included in 223 (part)Sheet metal product manufacturing275
(c)Structural metal product manufacturing222
A P P E N D I X S T A G E O F P R O D U C T I O N AN D IM P L E M E N T A T I O N O F AN Z S I C 2 0 0 6 continued
A B S • P R O D U C E R P R I C E I N D E X E S • 6 4 2 7 . 0 • MA R QT R 2 0 1 2

TABLE 3 — STAGE OF PRODUCT ION, PREL IMINARY DEMAND, Aust ra l i an and New Zea land
standa rd indus t r i a l c lass i f i ca t i on (ANZS IC ) 1993 to 2006 Cor respondence tab le
(a)Basic non�ferrous metal productmanufacturing214Non�ferrous basic metal product
manufacturing273
(a)Basic non�ferrous metal manufacturing213Basic non�ferrous metal manufacturing272(c)Basic ferrous metal product manufacturing212
Discontinued, included in 212 (part)Iron and steel manufacturing271
(a)Non�metallic mineral productmanufacturing20Non�metallic mineral product
manufacturing26
(c)Polymer product manufacturing191
Discontinued, included in 191 (part)Plastic product manufacturing256
(b)Natural rubber product manufacturing192Rubber product manufacturing255
(c)Polymer product manufacturing191
(c)Other basic chemical productmanufacturing189
(c)Cleaning compound and toiletrypreparation manufacturing185
(c)Pharmaceutical and medicinal productmanufacturing184
Discontinued, split into 184, 185, 189, 191Other chemical product manufacturing254
(b)Basic polymer manufacturing182Basic chemical manufacturing253
(a)Petroleum refining and petroleum fuelmanufacturing
1701Petroleum refining251
(c)Newspaper, periodical, book and directorypublishing 541
Discontinued, included in 541Publishing242
(c)Printing and printing support services161
(c)Converted paper product manufacturing 152
Discontinued, split into 161, 152Printing and services to printing241
(b)Pulp, paper and converted paper productmanufacturing15Paper and paper product manufacturing233
(b)Other wood product manufacturing149Other wood product manufacturing232(b)Log sawmilling and timber dressing141Log sawmilling and timber dressing231
(a)Textile, leather, clothing and footwearmanufacturing13Textile, clothing, footwear and leather
manufacturing22
(b)Beverage manufacturing121Beverage and malt manufacturing218(c)Other food product manufacturing119
(c)Sugar and confectionery manufacturing118
(c)Seafood processing112
Discontinued, split into 112, 118, 119, 121 (part)Other food manufacturing217(a)Bakery product manufacturing117Bakery product manufacturing216
(a)Grain mill and cereal productmanufacturing116Flour mill and cereal food manufacturing215
(a)Fruit and vegetable processing; oil and fatmanufacturing114�115Fruit and vegetable processing; oil and fat
manufacturing213�214
(a)Dairy product manufacturing113Dairy product manufacturing212(a)Meat and meat product manufacturing111Meat and meat product manufacturing211
(a)Other non�metallic mineral mining andquarrying099Other mining14
(a)Metal ore mining080Metal ore mining131(a)Oil and gas extraction070Oil and gas extraction120(a)Coal mining060Coal mining110(a)Forestry and logging030Forestry and logging030
DiscontinuedServices to agriculture; hunting andtrapping02
(b)Other agriculture011�013, 015, 017�019Other agriculture011, 014�016
(a)Grain, sheep, beef and dairy cattle farming014, 016Grain, sheep, beef and dairy cattle farming012�013StatusBecomesANZSIC 2006ANZSIC 1993
Table 9 of Producer Price Indexes, Australia (cat. no. 6427.0)
A P P E N D I X S T A G E O F P R O D U C T I O N AN D IM P L E M E N T A T I O N O F AN Z S I C 2 0 0 6 continued
A B S • P R O D U C E R P R I C E I N D E X E S • 6 4 2 7 . 0 • MA R QT R 2 0 1 2

(c) Expected new series.
(b) Series continuing with compositional change.
(a) Series continuing.
Footnotes:
(c)Other administrative services729
(c)Employment services721
DiscontinuedOther business services786
(c)Market research and statistical services695
(c)Architectural, engineering and technicalservices 692
Discontinued, split into 692 (part), 695 (part), 696 (part)Marketing and business managementservices785
(b)Legal and accounting services693Legal and accounting services784
(c)Computer system design and relatedservices700
(c)Data processing, web hosting andelectronic information storage services 592
Discontinued, split into 592, 700Computer services783
(c)Architectural, engineering and technicalservices 692
Discontinued, included in 692 (part)Technical services782
(b)Rental and hiring services (except realestate) 66Machinery and equipment hiring and
leasing774
(b)Real estate services672Real estate agents772DiscontinuedProperty operators and developers771
(a)Warehousing and storage services530Storage670
DiscontinuedServices to transport66
DiscontinuedOther transport650
DiscontinuedAir and space transport640(b)Water freight transport481Water transport630(b)Rail freight transport471Rail transport620(b)Road freight transport461Road freight transport611(a)Accommodation44Accommodation571(b)Electricity, Gas & Water Supply26�28Electricity, gas and water supply36�37
(c)Other machinery and equipmentmanufacturing249
(c)Specialised machinery and equipmentmanufacturing246
(c)Pump, compressor, heating and ventilationequipment manufacturing245
Discontinued, split into 245, 246, 249Industrial machinery and equipmentmanufacturing286
(c)Domestic appliance manufacturing244
(c)Electrical equipment manufacturing 243
Discontinued, split into 243, 244Electrical equipment and appliancemanufacturing285
(b)Computer and electronic equipmentmanufacturing242Electronic equipment manufacturing284
(b)Professional and scientific equipmentmanufacturing241Photographic and scientific equipment
manufacturing283
(b)Other transport equipment manufacturing239Other transport equipment manufacturing282
(b)Motor vehicle and motor vehicle partmanufacturing231Motor vehicle and part manufacturing281
(b)Other fabricated metal productmanufacturing229Fabricated metal product manufacturing276
(c)Metal container manufacturing223
Discontinued, included in 223 (part)Sheet metal product manufacturing275
(c)Structural metal product manufacturing222
Discontinued, included in 222 (part)Structural metal product manufacturing274
A P P E N D I X S T A G E O F P R O D U C T I O N AN D IM P L E M E N T A T I O N O F AN Z S I C 2 0 0 6 continued
A B S • P R O D U C E R P R I C E I N D E X E S • 6 4 2 7 . 0 • MA R QT R 2 0 1 2


www.abs.gov.auWEB ADDRESS
All statistics on the ABS website can be downloaded freeof charge.
F R E E A C C E S S T O S T A T I S T I C S
Client Services, ABS, GPO Box 796, Sydney NSW 2001POST
1300 135 211FAX
1300 135 070PHONE
Our consultants can help you access the full range ofinformation published by the ABS that is available free ofcharge from our website. Information tailored to yourneeds can also be requested as a 'user pays' service.Specialists are on hand to help you with analytical ormethodological advice.
I N F O R M A T I O N A N D R E F E R R A L S E R V I C E
www.abs.gov.au the ABS website is the best place fordata from our publications and information about the ABS.
INTERNET
F O R M O R E I N F O R M A T I O N . . .
© Commonwealth of Australia 2012Produced by the Australian Bureau of Statistics
64
27
.0
•
PR
OD
UC
ER
P
RI
CE
IND
EX
ES
, A
US
TR
AL
IA
•
Ma
rc
h Q
ua
rt
er
20
12
ISSN 1445–2618