PRODUCE FOR BETTER HEALTH FOUNDATION PBH … · 100% vegetable juice is more of an acquired taste....
37
1 PBH Foundation - Cluster Analysis 2012 Report: 100% Vegetable Juice Research conducted by: On behalf of: PRODUCE FOR BETTER HEALTH FOUNDATION: Sponsored by:
Transcript of PRODUCE FOR BETTER HEALTH FOUNDATION PBH … · 100% vegetable juice is more of an acquired taste....

1
PBH Foundation - Cluster Analysis 2012 Report: 100% Vegetable Juice
Research conducted by:
On behalf of:
PRODUCE FOR BETTER HEALTH
FOUNDATION:
Sponsored by:
2
Objectives and Methodology
Summary of Key Findings and Observations
Clustering Overview
Cluster Profiles 1. “Young Healthies”
2. “Working Balanceds”
3. “Veggie Lovers”
4. “Average Guilty Janes”
Table of Contents
3
The main objectives of this series of reports are:
To understand those distinct segments within the consumer market for various “forms” of fruits and vegetables based on demographic, attitudinal and behavorial characteristics;
To identify potential marketing opportunities to target these distinct segments.
Research Objectives

4
Research Methodology
The statistical technique of Cluster Analysis was used to classify the consumer market into distinct segments or clusters;
Cluster Analysis is an exploratory data analysis tool for organizing observed data into meaningful segments based on combinations of independent variables, which maximizes the similarity of cases within each cluster while maximizing the dissimilarity between groups that are initially unknown;
For the purposes of this analysis, the following type of Cluster Analysis was performed: Hierarchical Cluster Analysis using Ward’s Method, applying Squared Euclidean Distance;
The data set on which the analysis was run comprised of 1,300 consumer respondents;
81 independent variables were tested.

5
Summary of Key Findings and Observations
6
Summary of Key Findings and Observations
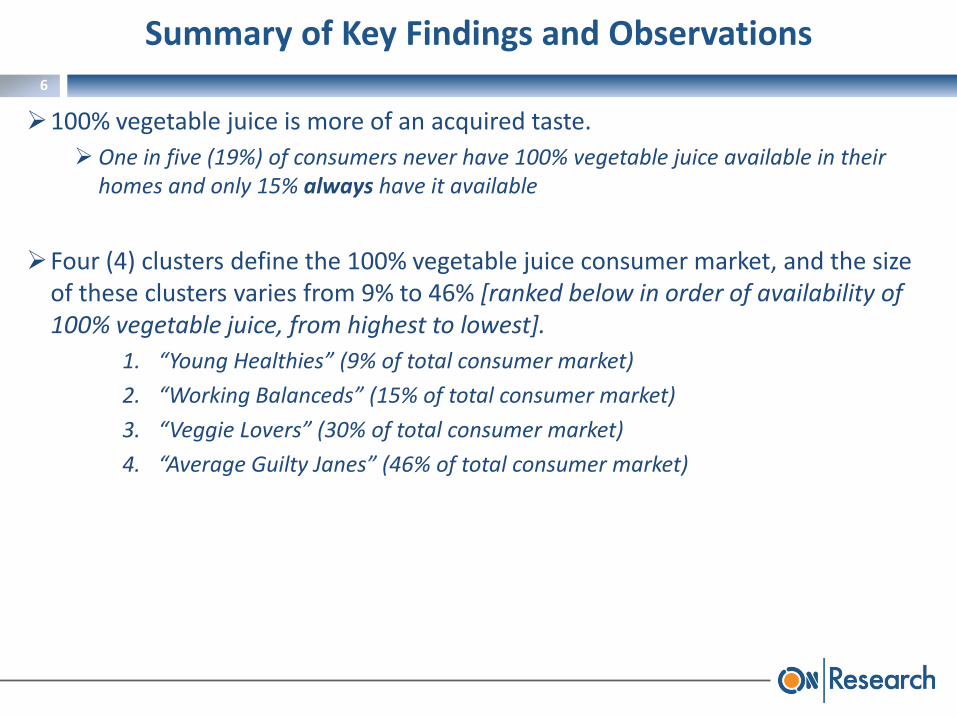
100% vegetable juice is more of an acquired taste.
One in five (19%) of consumers never have 100% vegetable juice available in their homes and only 15% always have it available
Four (4) clusters define the 100% vegetable juice consumer market, and the size of these clusters varies from 9% to 46% [ranked below in order of availability of 100% vegetable juice, from highest to lowest].
1. “Young Healthies” (9% of total consumer market)
2. “Working Balanceds” (15% of total consumer market)
3. “Veggie Lovers” (30% of total consumer market)
4. “Average Guilty Janes” (46% of total consumer market)
7
Summary of Key Findings and Observations
There are several key demographic characteristics that help define the clusters. These can help in targeting consumers within each cluster:
Income,
Work Status,
Ethnicity.
Segmentation of the 100% vegetable juice market is not primarily driven by consumption habits as 3 of the 4 segments share very similar (and above average) consumption amounts. Instead, segmentation is driven by motivations.
Notably, all segments except one self-reported decreasing their consumption of 100% vegetable juice this year compared to last.

8
Summary of Key Findings and Observations
The key communication channels are supermarket displays, supermarket flyers/ads, TV ads and TV news segments as well as the Internet. These key channels do not differ significantly in their importance by cluster. As such, a more mass communications approach can be considered. Since most purchases for 100% vegetable juice are monthly, targeting will be critical.
In terms of targeting, one cluster, in particular, may represent an especially attractive target:
“Average Guilty Janes” (largest segment representing almost half of consumers, lowest consumption of vegetable juice as well as vegetables in general, most likely to feel that they and their families eat too little vegetables).
Key media for the campaign appear to be supermarket displays, TV and magazines as these are the most likely to be self-reported by consumers as the primary ways by which they learned of the campaign.

9
Clustering Overview
10
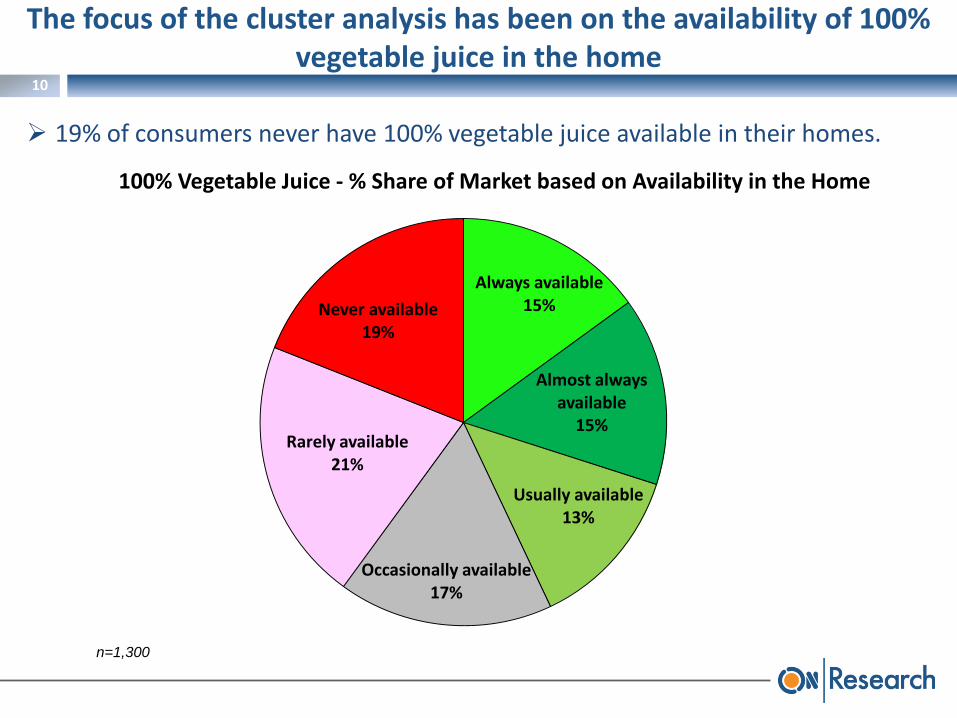
The focus of the cluster analysis has been on the availability of 100% vegetable juice in the home
Always available 15%
Almost always available
15%
Usually available 13%
Occasionally available 17%
Rarely available 21%
Never available 19%
100% Vegetable Juice - % Share of Market based on Availability in the Home
19% of consumers never have 100% vegetable juice available in their homes.
n=1,300

11
Cluster analysis revealed that 36 of the 81 independent variables tested significantly and differentiated segments with the consumer market regarding 100% vegetable juice. These different clusters can be grouped based on those having a higher differentiating value (primary cluster drivers) and a lower differentiating value (secondary cluster drivers) based on their strength in predicting the cluster in question:
Primary Cluster Drivers
• Education, Working Status, Age, Income;
• Consumption occasions;
• Barriers to including fruits and vegetables in meals and snacks.
Secondary Cluster Drivers
• Ethnicity;
• Satisfaction with daily eating habits regarding vegetables;
• Factors when shopping for fruits and vegetables;
• Motivations for eating vegetables;
• Health benefits;
• Amount of time making dinner meal.
Cluster Drivers
12
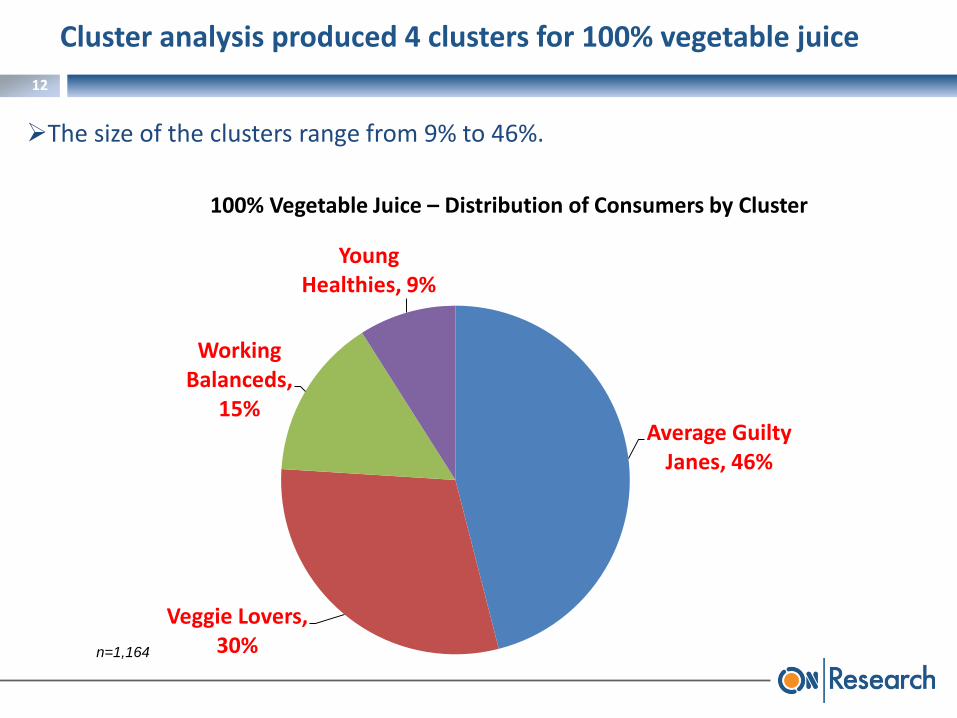
Cluster analysis produced 4 clusters for 100% vegetable juice
Average Guilty Janes, 46%
Veggie Lovers, 30%
Working Balanceds,
15%
Young Healthies, 9%
The size of the clusters range from 9% to 46%.
100% Vegetable Juice – Distribution of Consumers by Cluster
n=1,164

13
46%
30%
15%
9%
Average Guilty Janes
Veggie Lovers
Working Balanceds
Young Healthies
Ranked Order of Clusters by Availability of 100% Vegetable Juice in the Home
The clusters can be ordered in terms of availability of 100% vegetable juice in the home
Each cluster will be profiled in the next section of this report in the order below.
Higher
availability
of 100%
vegetable
juice
Lower
availability
of 100%
vegetable
juice

14
Cluster Profile: “Young Healthies”
15
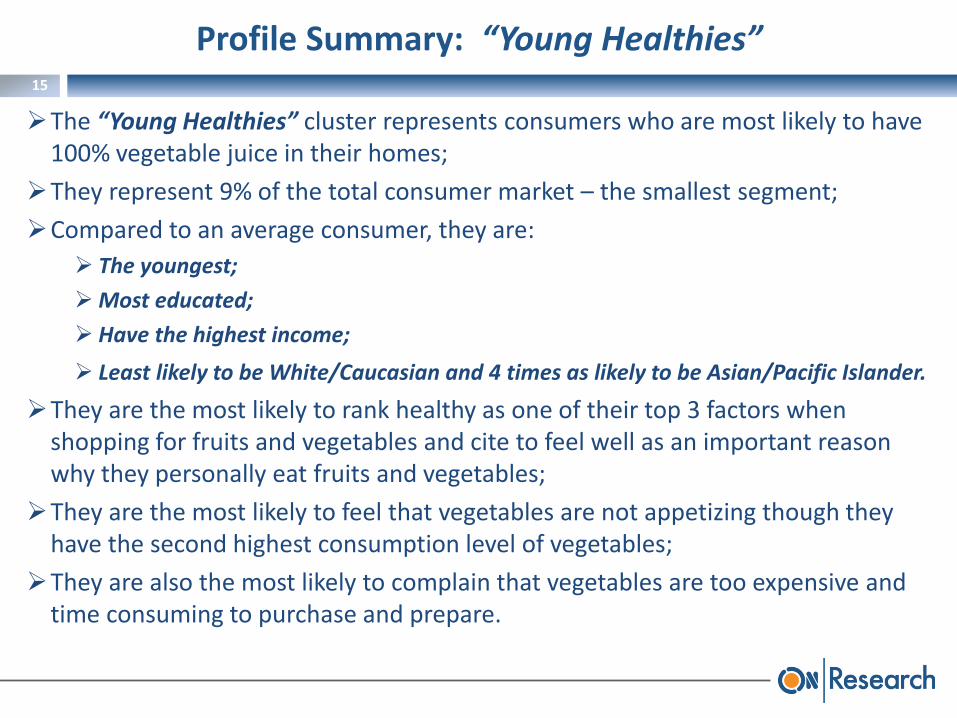
The “Young Healthies” cluster represents consumers who are most likely to have 100% vegetable juice in their homes;
They represent 9% of the total consumer market – the smallest segment;
Compared to an average consumer, they are:
The youngest;
Most educated;
Have the highest income;
Least likely to be White/Caucasian and 4 times as likely to be Asian/Pacific Islander.
They are the most likely to rank healthy as one of their top 3 factors when shopping for fruits and vegetables and cite to feel well as an important reason why they personally eat fruits and vegetables;
They are the most likely to feel that vegetables are not appetizing though they have the second highest consumption level of vegetables;
They are also the most likely to complain that vegetables are too expensive and time consuming to purchase and prepare.
Profile Summary: “Young Healthies”

16
Always/Almost always has 100% vegetable juice available 23% (vs. 15% for all); 25% almost always available (vs. 15% for all)
Second highest daily consumption of cups of vegetables 1.5 cups of vegetables per day (vs. 0.9 cups for all)
Key Characteristics
Youngest, most educated, highest income, least likely to be White/Caucasian (especially most likely to be Asian/Pacific Islander)
Average age: 36 (vs. 45 for all) 28% have completed graduate work (vs. 10% for all) 29% earn $100k+ (vs. 10% for all) 60% are White/Caucasian (vs. 81% for all); 13% Black/African American (vs. 7% for all) , 7% Hispanic (vs. 5% for all), 19% Asian/Pacific Islander (vs. 5% for all)
Most likely to rank healthy as one of their top 3 factors when shopping for fruits and vegetables
50% ranked healthy (vs. 33% for all)
Most likely to eat vegetables daily in a restaurant 28% eat them daily in a restaurant (vs. 5% for all)
Least likely to cite taste and part of a balanced diet as one of the 3 most important reasons why they themselves eat fruits and vegetables and most likely to cite to feel well
31% cited taste (vs. 51% for all) 39% cited part of a balanced diet (vs. 56% for all) 33% cite to feel well (vs. 20% for all)
Least likely to believe that antioxidants in fruits and vegetables may provide health benefits
60% believe in antioxidants (vs. 80% for all)
Most likely to complain about members of their families having different fruit and vegetable likes and dislikes and that fruits and vegetables go bad before they can eat them
79% agree about family members (vs. 50% for all) 70% agree they go bad (vs.36% for all)
Most likely to feel that vegetables are not appetizing , that they are time consuming to purchase and prepare and too expensive
50% agree they are not appetizing (vs. 17% for all) 64% agree they are time consuming (vs. 21% for all) 73% agree they are too expensive (vs. 39% for all)
Most likely to need ideas about new ways to prepare fruits and vegetables
70% agree they need new ideas (vs. 45% for all)
Cluster 4 – “Young Healthies” (9% of total consumer market)

17
The key benefits of 100% vegetable juice for “Young Healthies” are: Healthy (54% citing this benefit),
Tastes good (48% citing this benefit),
Good snack (32% citing this benefit).
They buy their 100% vegetable juice weekly. Daily (12%)
Weekly (44%)
Monthly (22%)
They are buying less compared to last year. 18% buying more 100% vegetable juice in the past 3 months compared to 1 year
earlier, 62% the same, 20% less
They waste a lot more than average. 42% do not throw any of their 100% vegetable juice out (vs. 71% for all)
Key Purchase Behaviors: “Young Healthies”

18
They buy their 100% vegetable juice primarily at the grocery store.
Grocery store (72%)
Supercenter (Wal-mart, Super Target, Meijer) (48%)
Club stores (BJ’s, Sam’s, Costco) (26%)
Intercept them in the supermarket, on TV and online:
Supermarket: 86% would at least scan a sign on a supermarket display and 84% a supermarket flyer/newspaper ad;
TV: 86% would at least listen to a television commercial regarding a type of food that they might enjoy and 83% to a television news segment;
Online: 56% ranked the Internet in their Top 3 places to go to obtain information about how to get themselves or their family to eat more fruits and vegetables (30% ranked it #1).
Key Purchase Behaviors: “Young Healthies”(cont’d)

19
They are less familiar with the Fruits & Veggies – More Matters campaign…
42% stated that they had never seen or heard about it (vs. 52% for all)
…but much more likely to be motivated by it, including to buy.
66% were motivated (vs. 35% for all)
59% stated they were more likely to buy a product after seeing the “More Matters” logo (vs. 44% for all)
The top 3 ways they self-report learning about the campaign are:
Internet (33%),
TV (31%),
Magazines (30%).
Key Purchase Behaviors: “Young Healthies”(cont’d)

20
Cluster Profile: “Working Balanceds”

21
The “Working Balanceds” cluster represents consumers who are the second most likely to have 100% vegetable juice in their homes;
They represent 15% of the total consumer market;
Compared to an average consumer, they:
Are the most likely to work outside the home;
Have the second highest income.
They are the most likely to feel that they and their families eat just enough vegetables and the least likely to complain that their family members have different fruit and vegetable likes and dislikes;
They are the least likely to find vegetables too expensive and the least likely to need ideas about new ways to prepare fruits and vegetables.
Profile Summary: “Working Balanceds”

22
Always/Almost always has 100% vegetable juice available 24% (vs. 15% for all); 23% almost always available (vs. 15% for all)
Highest daily consumption of cups of vegetables 1.7 cups of vegetables per day (vs. 0.9 cups for all)
Key Characteristics
Most likely to work outside the home, second highest income 23% do not work outside the home (vs. 51% for all) 22% earn $100k+ (vs. 14% for all)
Most likely to feel that they and their families eat just enough vegetables
59% agree they eat enough (vs. 43% for all)
Most likely to eat vegetables daily in front of the TV and in a restaurant
42% eat vegetables daily in front of the TV (vs. 20% for all) 28% eat them daily in a restaurant (vs. 5% for all)
Least likely to complain about their families having different fruit and vegetable likes and dislikes
35% agree about their families (vs. 50% for all)
Least likely to agree that vegetables are too expensive 21% agree they are too expensive (vs. 39% for all)
Least likely to need ideas about new ways to prepare fruits and vegetables
33% agree they need new ideas (vs. 45% for all)
Cluster 3 – “Working Balanceds” (15% of total consumer market)
23
Key Purchase Behaviors: “Working Balanceds”
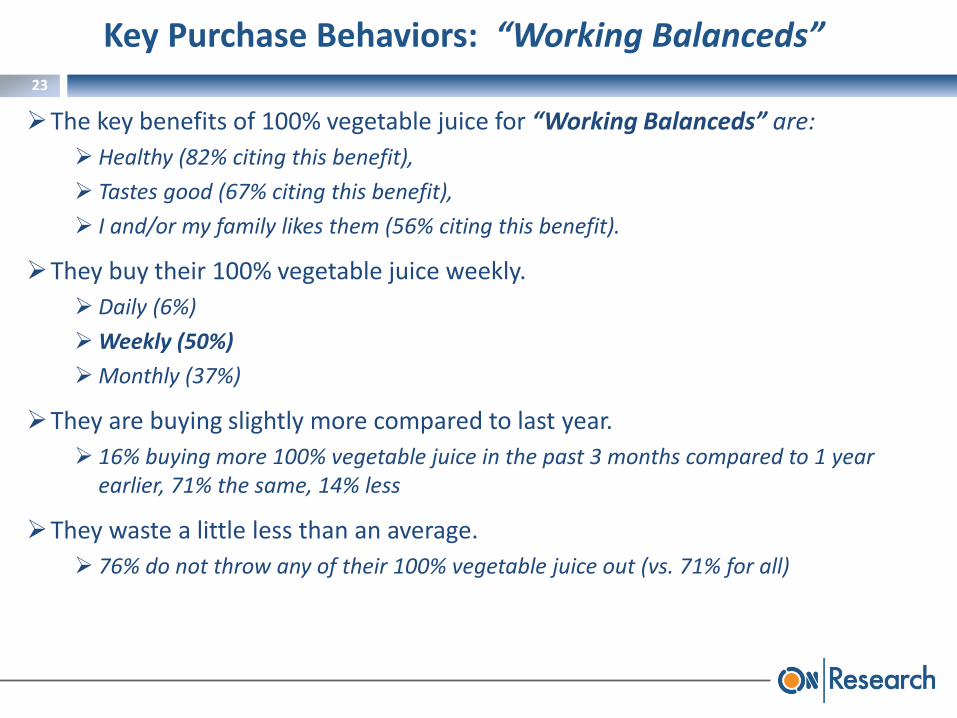
The key benefits of 100% vegetable juice for “Working Balanceds” are:
Healthy (82% citing this benefit),
Tastes good (67% citing this benefit),
I and/or my family likes them (56% citing this benefit).
They buy their 100% vegetable juice weekly.
Daily (6%)
Weekly (50%)
Monthly (37%)
They are buying slightly more compared to last year.
16% buying more 100% vegetable juice in the past 3 months compared to 1 year earlier, 71% the same, 14% less
They waste a little less than an average.
76% do not throw any of their 100% vegetable juice out (vs. 71% for all)
24
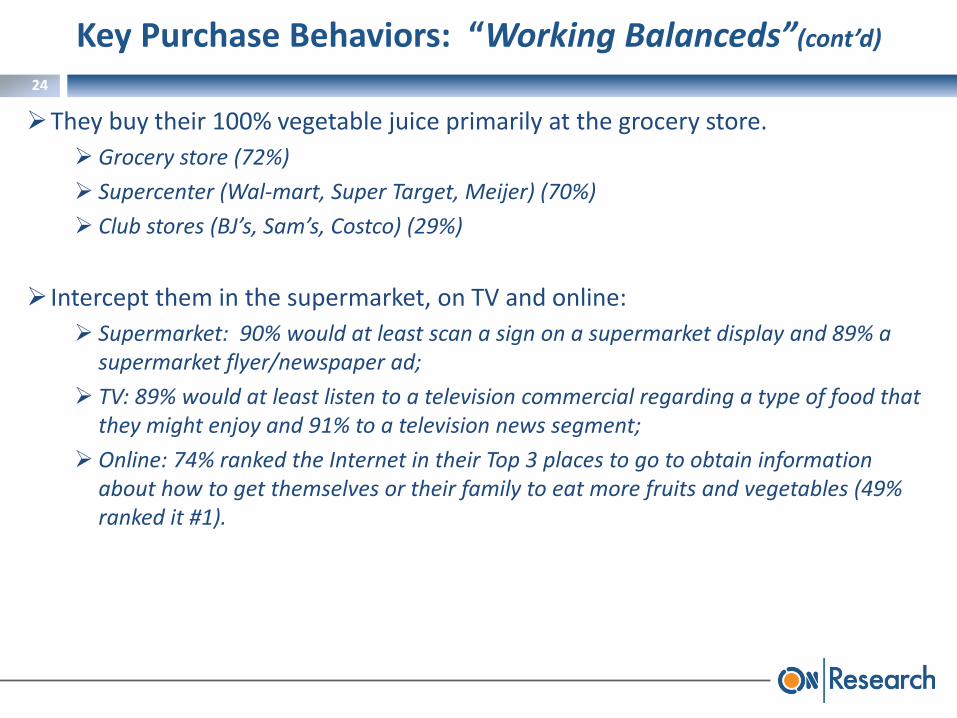
They buy their 100% vegetable juice primarily at the grocery store.
Grocery store (72%)
Supercenter (Wal-mart, Super Target, Meijer) (70%)
Club stores (BJ’s, Sam’s, Costco) (29%)
Intercept them in the supermarket, on TV and online:
Supermarket: 90% would at least scan a sign on a supermarket display and 89% a supermarket flyer/newspaper ad;
TV: 89% would at least listen to a television commercial regarding a type of food that they might enjoy and 91% to a television news segment;
Online: 74% ranked the Internet in their Top 3 places to go to obtain information about how to get themselves or their family to eat more fruits and vegetables (49% ranked it #1).
Key Purchase Behaviors: “Working Balanceds”(cont’d)

25
They are less familiar with the Fruits & Veggies – More Matters campaign…
44% stated that they had never seen or heard about it (vs. 52% for all)
…but more likely to be motivated by it, especially to buy.
46% were motivated (vs. 35% for all)
61% stated they were more likely to buy a product after seeing the “More Matters” logo (vs. 44% for all)
The top 3 ways they self-report learning about the campaign are:
Supermarket display (38%),
Magazines (30%),
Ads (30%).
Key Purchase Behaviors: “Working Balanceds”(cont’d)

26
Cluster Profile: “Lower Income Veggie Lovers”
27
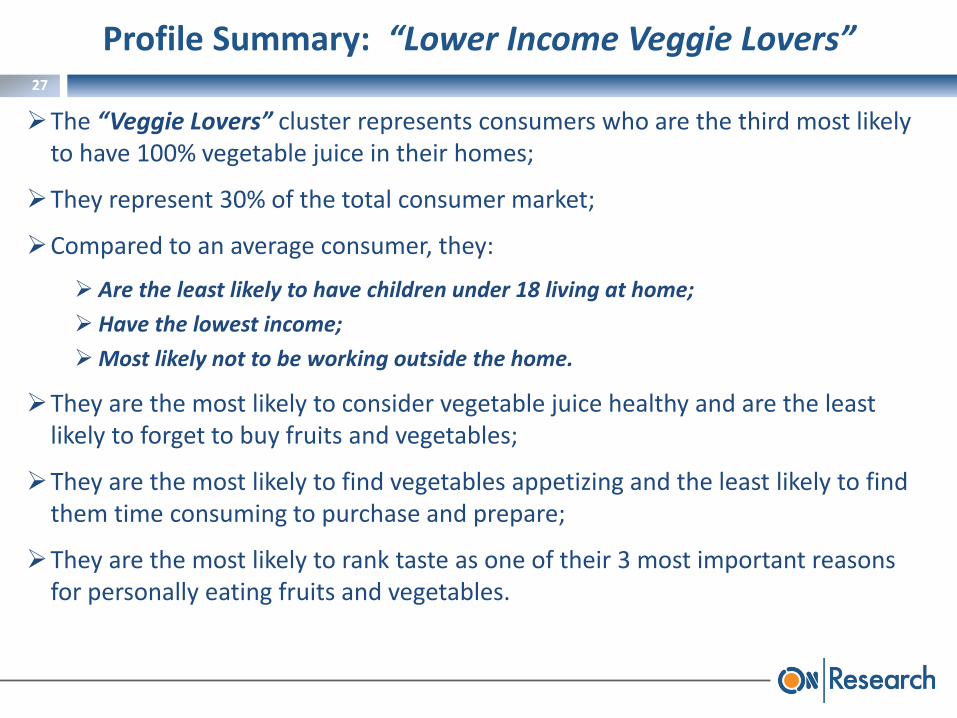
The “Veggie Lovers” cluster represents consumers who are the third most likely to have 100% vegetable juice in their homes;
They represent 30% of the total consumer market;
Compared to an average consumer, they:
Are the least likely to have children under 18 living at home;
Have the lowest income;
Most likely not to be working outside the home.
They are the most likely to consider vegetable juice healthy and are the least likely to forget to buy fruits and vegetables;
They are the most likely to find vegetables appetizing and the least likely to find them time consuming to purchase and prepare;
They are the most likely to rank taste as one of their 3 most important reasons for personally eating fruits and vegetables.
Profile Summary: “Lower Income Veggie Lovers”
28
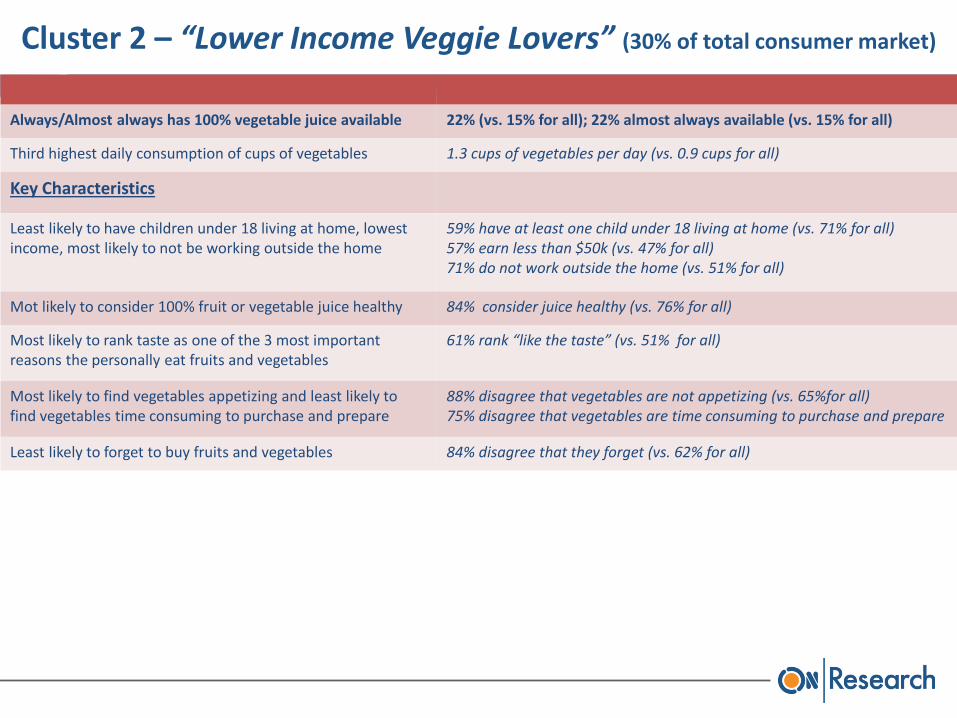
Always/Almost always has 100% vegetable juice available 22% (vs. 15% for all); 22% almost always available (vs. 15% for all)
Third highest daily consumption of cups of vegetables 1.3 cups of vegetables per day (vs. 0.9 cups for all)
Key Characteristics
Least likely to have children under 18 living at home, lowest income, most likely to not be working outside the home
59% have at least one child under 18 living at home (vs. 71% for all) 57% earn less than $50k (vs. 47% for all) 71% do not work outside the home (vs. 51% for all)
Mot likely to consider 100% fruit or vegetable juice healthy 84% consider juice healthy (vs. 76% for all)
Most likely to rank taste as one of the 3 most important reasons the personally eat fruits and vegetables
61% rank “like the taste” (vs. 51% for all)
Most likely to find vegetables appetizing and least likely to find vegetables time consuming to purchase and prepare
88% disagree that vegetables are not appetizing (vs. 65%for all) 75% disagree that vegetables are time consuming to purchase and prepare
Least likely to forget to buy fruits and vegetables 84% disagree that they forget (vs. 62% for all)
Cluster 2 – “Lower Income Veggie Lovers” (30% of total consumer market)

29
The key benefits of 100% vegetable juice for “Lower Income Veggie Lovers” are:
Healthy (76% citing this benefit),
Tastes good (69% citing this benefit),
I and/or my family likes them (66% citing this benefit).
They buy their 100% vegetable juice monthly.
Daily (2%)
Weekly (36%)
Monthly (51%)
They are buying less compared to last year.
11% buying more 100% vegetable juice in the past 3 months compared to 1 year earlier, 75% the same, 15% less
They waste less than average.
80% do not throw any of their 100% vegetable juice out (vs. 71% for all)
Key Purchase Behaviors: “Lower Income Veggie Lovers”

30
They buy their 100% vegetable juice primarily at a grocery store.
Grocery store (84%)
Supercenter (Wal-mart, Super Target, Meijer) (50%)
Club stores (BJ’s, Sam’s, Costco) (16%)
Intercept them in the supermarket, on TV or the radio, on social media and online:
Supermarket: 87% would at least scan a sign on a supermarket display and 91% a supermarket flyer/newspaper ad;
TV: 80% would at least listen to a television commercial regarding a type of food that they might enjoy and 85% to a television news segment;
Online: 72% ranked the Internet in their Top 3 places to go to obtain information about how to get themselves or their family to eat more fruits and vegetables (41% ranked it #1).
Key Purchase Behaviors: “Lower Income Veggie Lovers” (cont’d)
31
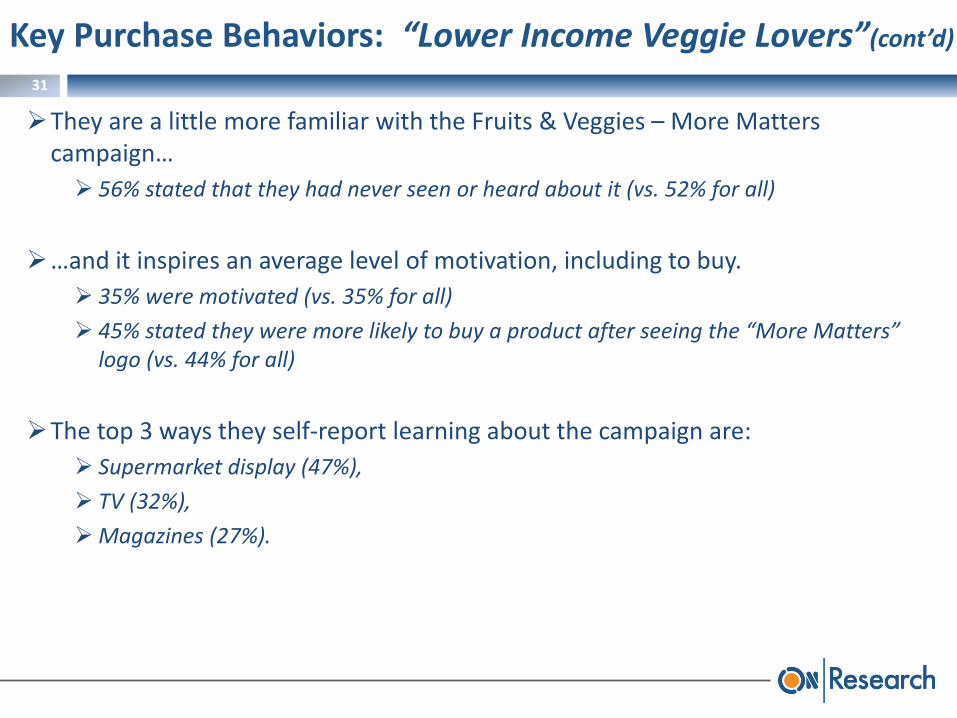
They are a little more familiar with the Fruits & Veggies – More Matters campaign…
56% stated that they had never seen or heard about it (vs. 52% for all)
…and it inspires an average level of motivation, including to buy.
35% were motivated (vs. 35% for all)
45% stated they were more likely to buy a product after seeing the “More Matters” logo (vs. 44% for all)
The top 3 ways they self-report learning about the campaign are:
Supermarket display (47%),
TV (32%),
Magazines (27%).
Key Purchase Behaviors: “Lower Income Veggie Lovers”(cont’d)

32
Cluster Profile: “Average Guilty Janes”

33
The “Average Guilty Janes” cluster represents consumers who are the least likely to have 100% vegetable juice in their homes;
They represent 46% of the total consumer market – the largest segment;
Demographically, they represent an average consumer;
They are the most likely to feel that they and their families eat too little vegetables and are the least likely to eat vegetables daily at the dinner table.
Profile Summary: “Average Guilty Janes”
34
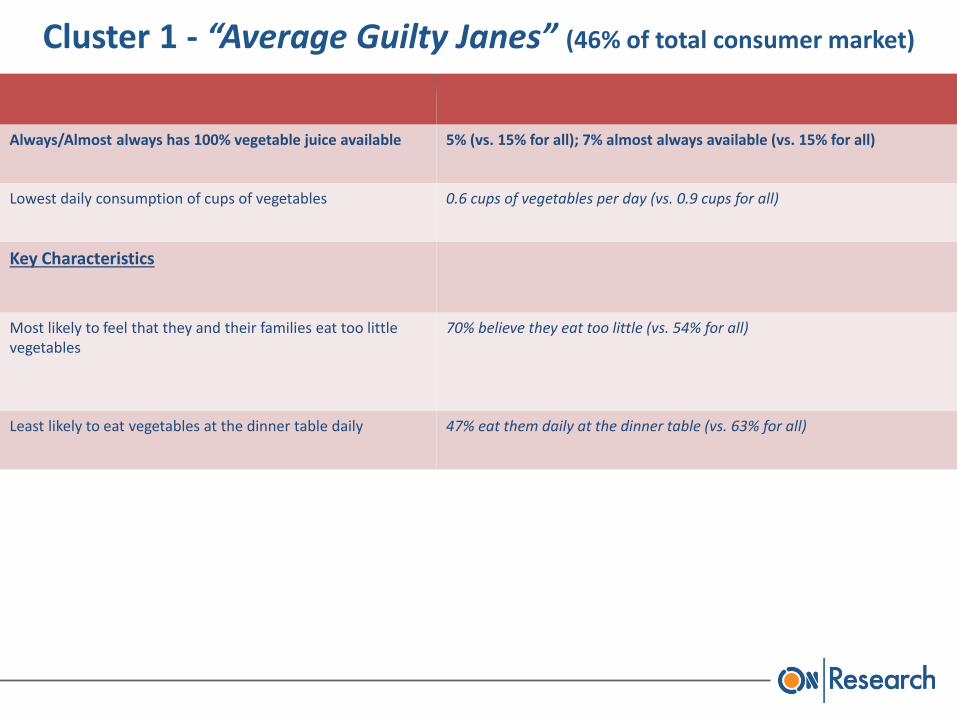
Always/Almost always has 100% vegetable juice available 5% (vs. 15% for all); 7% almost always available (vs. 15% for all)
Lowest daily consumption of cups of vegetables 0.6 cups of vegetables per day (vs. 0.9 cups for all)
Key Characteristics
Most likely to feel that they and their families eat too little vegetables
70% believe they eat too little (vs. 54% for all)
Least likely to eat vegetables at the dinner table daily 47% eat them daily at the dinner table (vs. 63% for all)
Cluster 1 - “Average Guilty Janes” (46% of total consumer market)

35
The key benefits of 100% vegetable juice for “Average Guilty Janes” are:
Healthy (62% citing this benefit),
Tastes good (43% citing this benefit),
I and/or my family likes them (38% citing this benefit).
They buy their 100% vegetable juice monthly.
Daily (0%)
Weekly (29%)
Monthly (40%)
They are less more compared to last year.
5% buying more 100% vegetable juice in the past 3 months compared to 1 year earlier, 68% the same, 28% less
They waste more than average.
65% do not throw any of their 100% vegetable juice out (vs. 71% for all)
Key Purchase Behaviors: “Average Guilty Janes”

36
They buy their 100% vegetable juice primarily at the grocery store.
Grocery store (72%)
Supercenter (Wal-mart, Super Target, Meijer) (47%)
Club stores (BJ’s, Sam’s, Costco) (14%)
Intercept them in the supermarket, on TV and online:
Supermarket: 79% would at least scan a sign on a supermarket display and 83% a supermarket flyer/newspaper ad;
TV: 79% would at least listen to a television commercial regarding a type of food that they might enjoy and 81% to a television news segment;
Online:76% ranked the Internet in their Top 3 places to go to obtain information about how to get themselves or their family to eat more fruits and vegetables (54% ranked it #1).
Key Purchase Behaviors: “Average Guilty Janes”(cont’d)

37
They have an average level of familiarity with the Fruits & Veggies – More Matters campaign…
54% stated that they had never seen or heard about it (vs. 52% for all)
…and are less motivated by it, including to buy.
24% were motivated (vs. 35% for all)
35% stated they were more likely to buy a product after seeing the “More Matters” logo (vs. 44% for all)
The top 3 ways they self-report learning about the campaign are:
Supermarket display (39%),
TV (27%),
Magazines (22%).
Key Purchase Behaviors: “Average Guilty Janes” (cont’d)