Procurement, selection, prequalification, pricing and ...€¦ · Procurement, selection,...
31
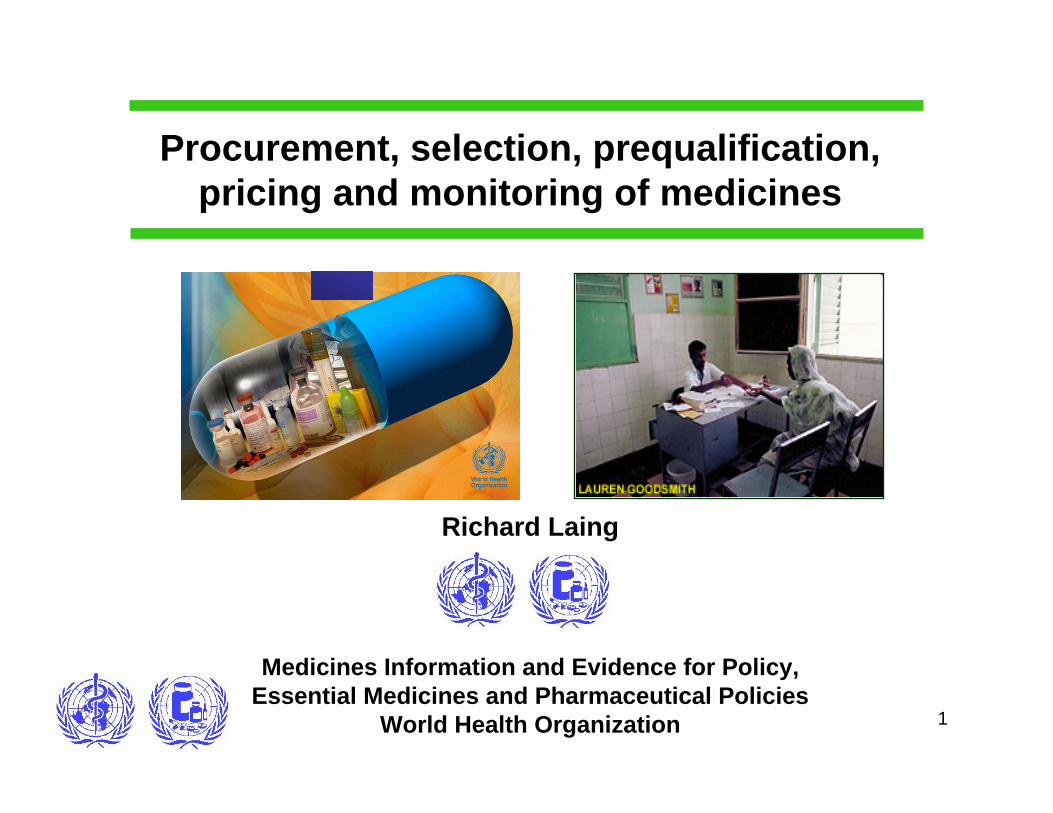
1 Procurement, selection, prequalification, pricing and monitoring of medicines Richard Laing Medicines Information and Evidence for Policy, Essential Medicines and Pharmaceutical Policies World Health Organization
Transcript of Procurement, selection, prequalification, pricing and ...€¦ · Procurement, selection,...
1
Procurement, selection, prequalification, pricing and monitoring of medicines
Richard Laing
Medicines Information and Evidence for Policy,Essential Medicines and Pharmaceutical Policies
World Health Organization
2
Procurement, prequalification, pricing, availability of drugs
• Selection• Quantification• Quality Assurance• Pricing• Monitoring
3
Selection
• First edition 1977• Revised every two years• Now contains 423 medicines
including children's medicines• Patent status NOT considered
in selection• Over time has contained 5% to
10% patent protected medicinesSee http://www.who.int/selection_medicines/en/index.html
4
Quantification
• Estimating requirements is a challenge when expanding programmes or when data collection is weak
• Two methods used– Morbidity based– Consumption based
• Combination of approaches usually used
http://apps.who.int/medicinedocs/en/d/Jh2931e/#Jh2931e

5
Quality Assurance
• Prequalification– Dossier Review– GMP Inspection– Laboratories– Training and Capacity development
• Regulatory Support– Norms and Standards– Country Support
See http://apps.who.int/prequal/
6
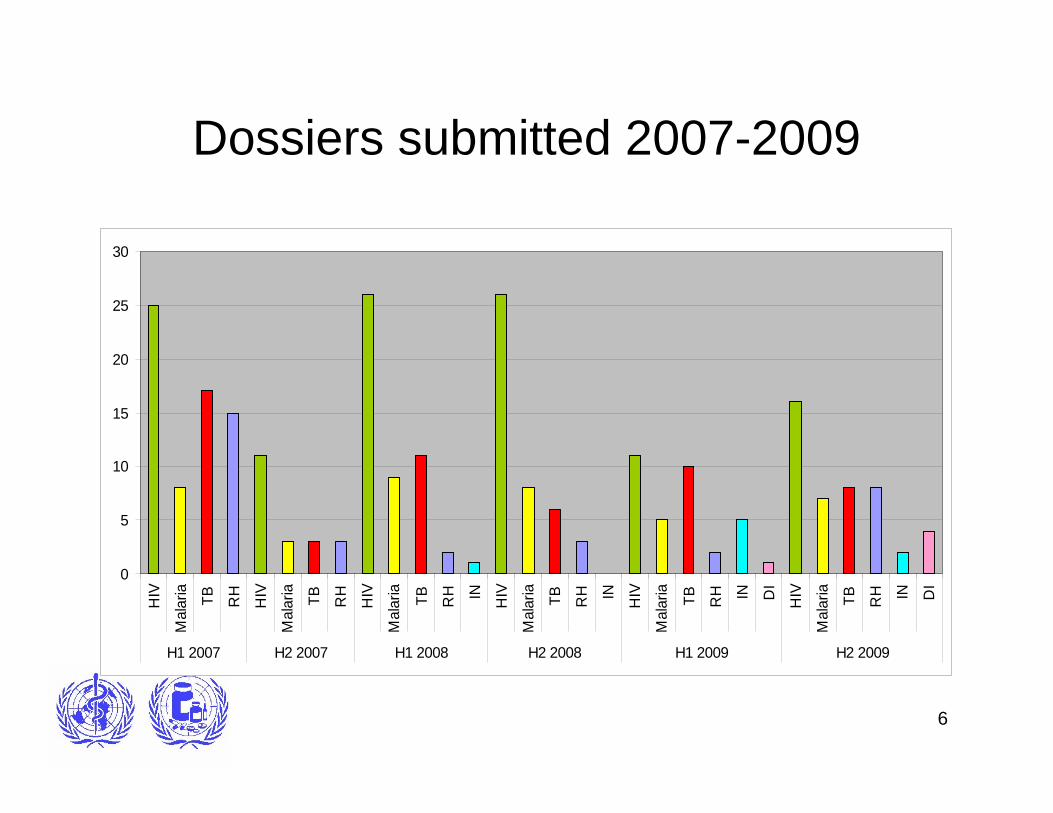
Dossiers submitted 2007-2009
0
5
10
15
20
25
30
HIV
Mal
aria
TB RH
HIV
Mal
aria
TB RH
HIV
Mal
aria
TB RH IN HIV
Mal
aria
TB RH IN HIV
Mal
aria
TB RH IN DI
HIV
Mal
aria
TB RH IN DI
H1 2007 H2 2007 H1 2008 H2 2008 H1 2009 H2 2009
7
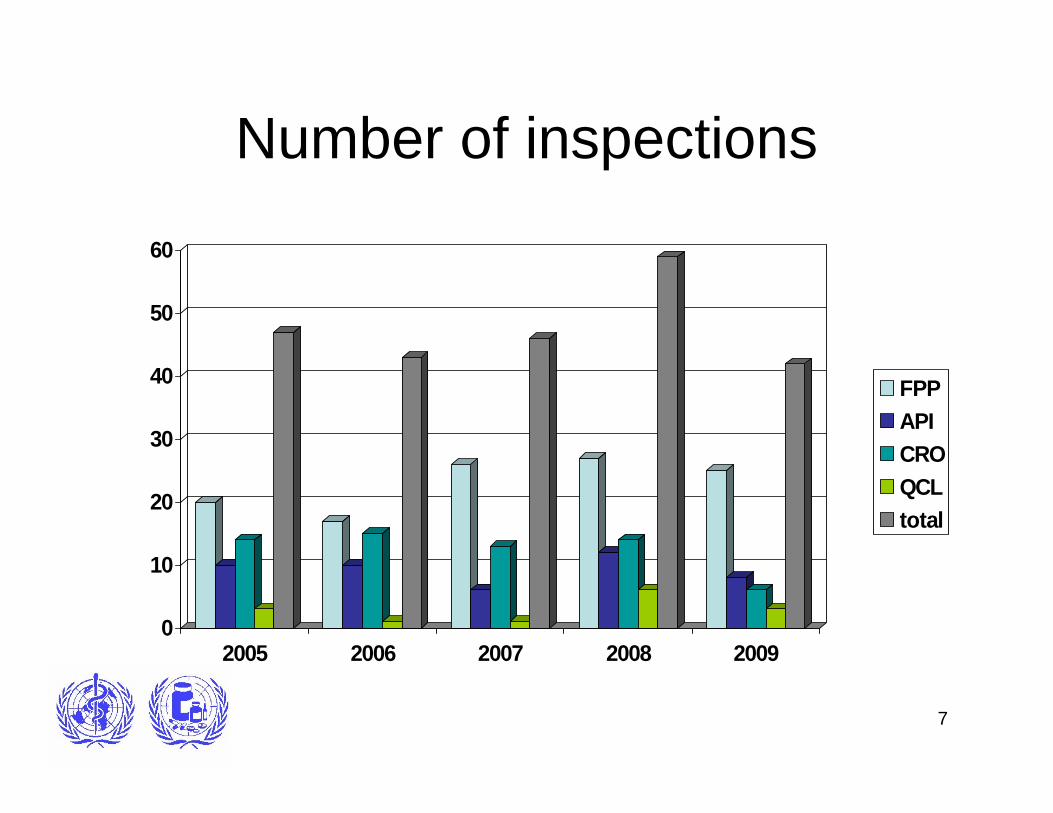
Number of inspections
0
10
20
30
40
50
60
2005 2006 2007 2008 2009
FPPAPICROQCLtotal
8
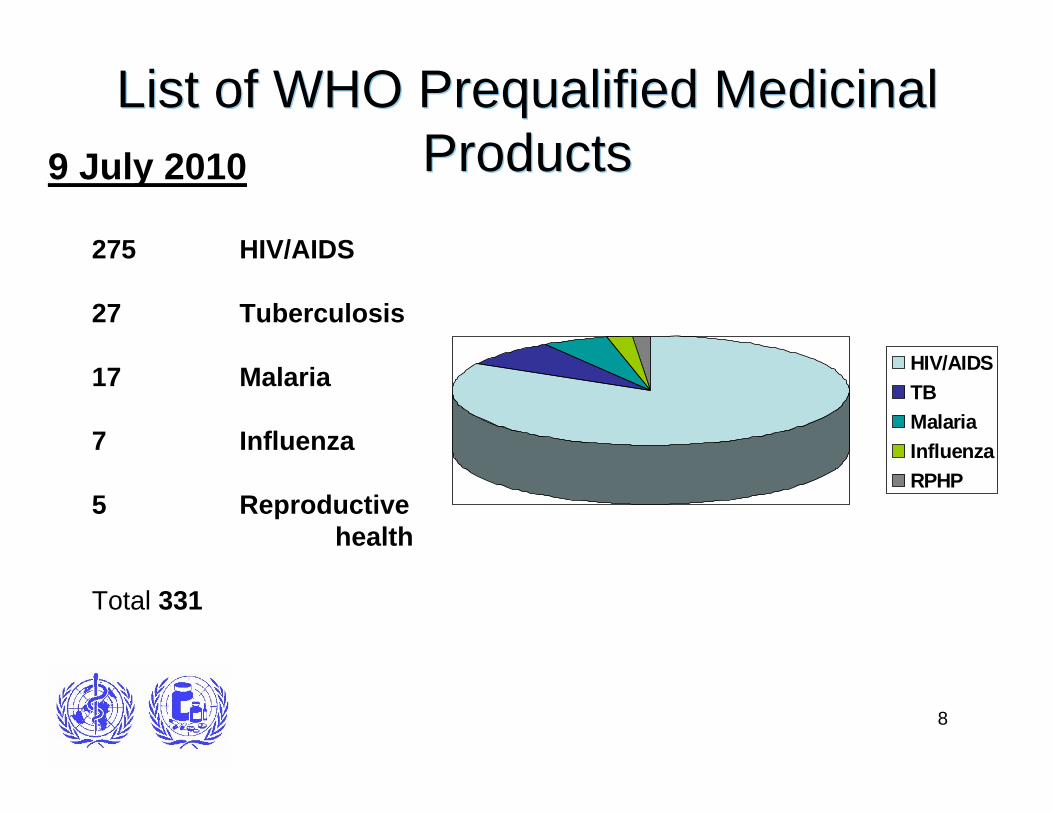
9 July 2010
275 HIV/AIDS
27 Tuberculosis
17 Malaria
7 Influenza
5 Reproductive health
Total 331
List of WHO Prequalified Medicinal Products
List of WHO Prequalified Medicinal Products
HIV/AIDSTBMalariaInfluenzaRPHP
9
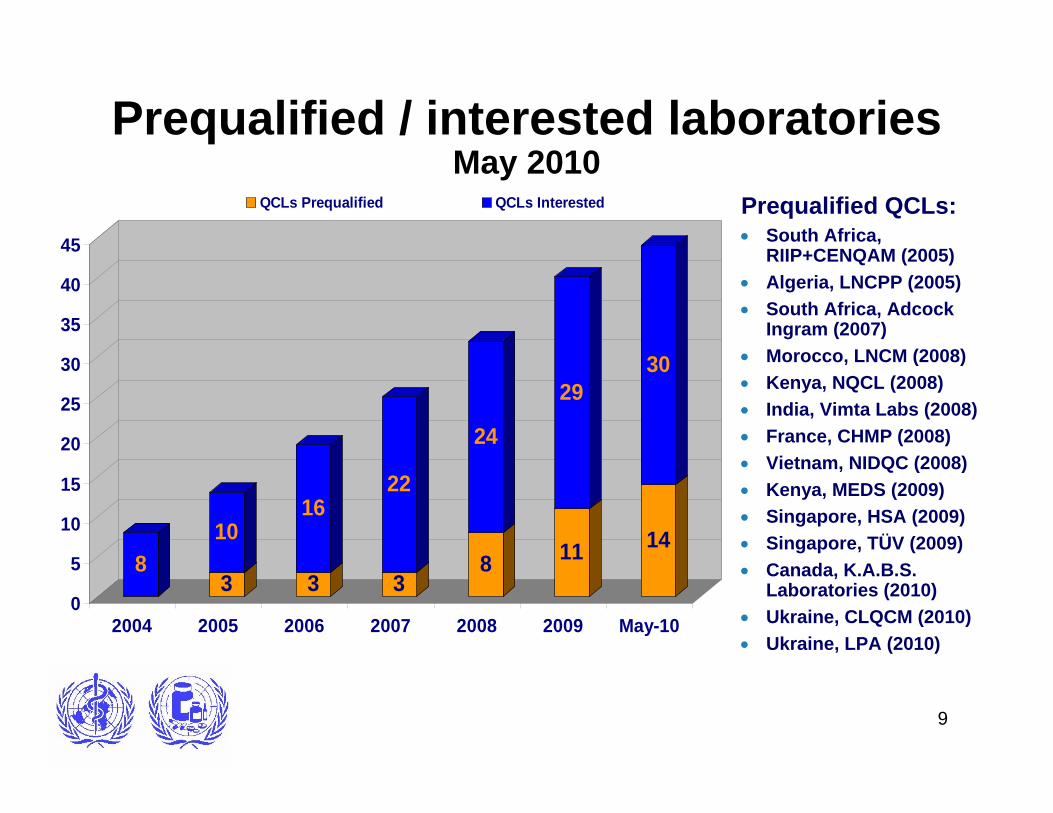
Prequalified / interested laboratories May 2010
Prequalified QCLs:• South Africa,
RIIP+CENQAM (2005)• Algeria, LNCPP (2005)• South Africa, Adcock
Ingram (2007)• Morocco, LNCM (2008)• Kenya, NQCL (2008)• India, Vimta Labs (2008)• France, CHMP (2008)• Vietnam, NIDQC (2008)• Kenya, MEDS (2009)• Singapore, HSA (2009)• Singapore, TÜV (2009)• Canada, K.A.B.S.
Laboratories (2010)• Ukraine, CLQCM (2010)• Ukraine, LPA (2010)
83
10
3
16
3
22
8
24
11
29
14
30
0
5
10
15
20
25
30
35
40
45
2004 2005 2006 2007 2008 2009 May-10
QCLs Prequalified QCLs Interested

10
• Recognition: Donors (Gates, UNITAID) also supported by the Global Fund (QA policy), World Bank etc
• Transparent: Positive and negative outcomes published, Suspension and withdrawals when needed
• Sampling and testing programmes monitor and prove good quality medicines
• Ongoing inspections and investigations, maintenance of products• Harmonization, cooperation (e.g. agreements including with
FDA)• By rotating national inspectors through PQ unit and involvement
in dossier review and GMP inspections national regulatory capacity built
PQ Outcomes . . .
11
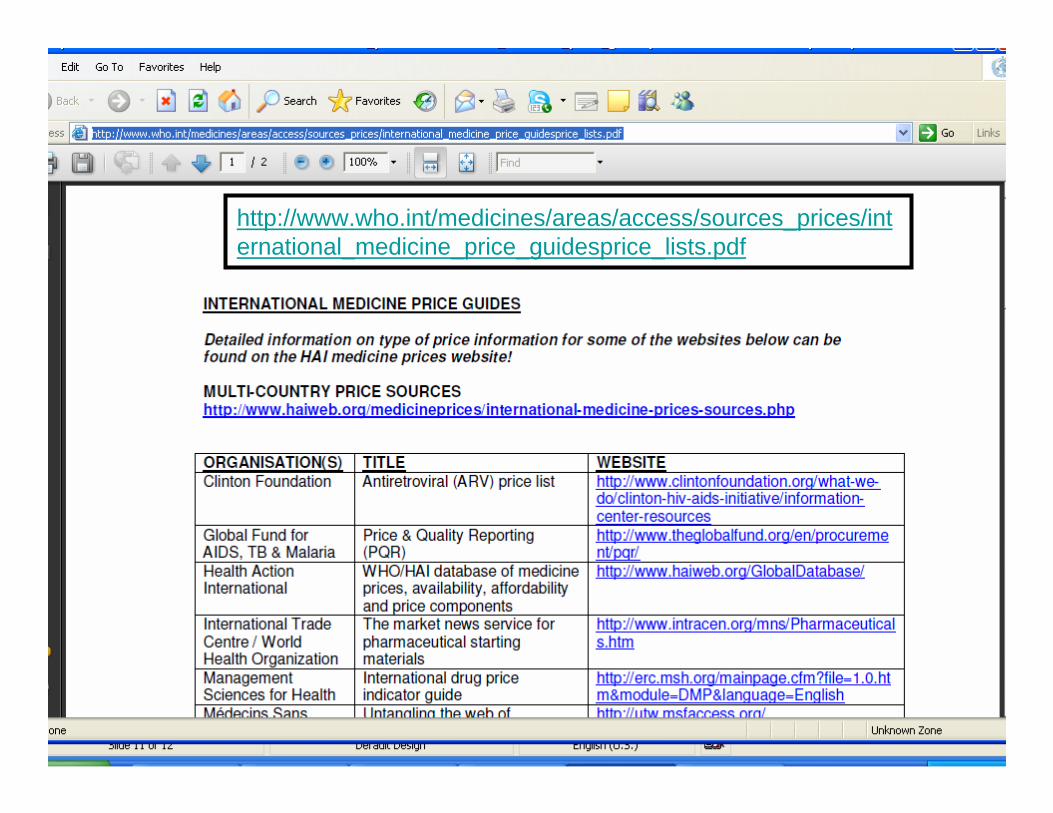
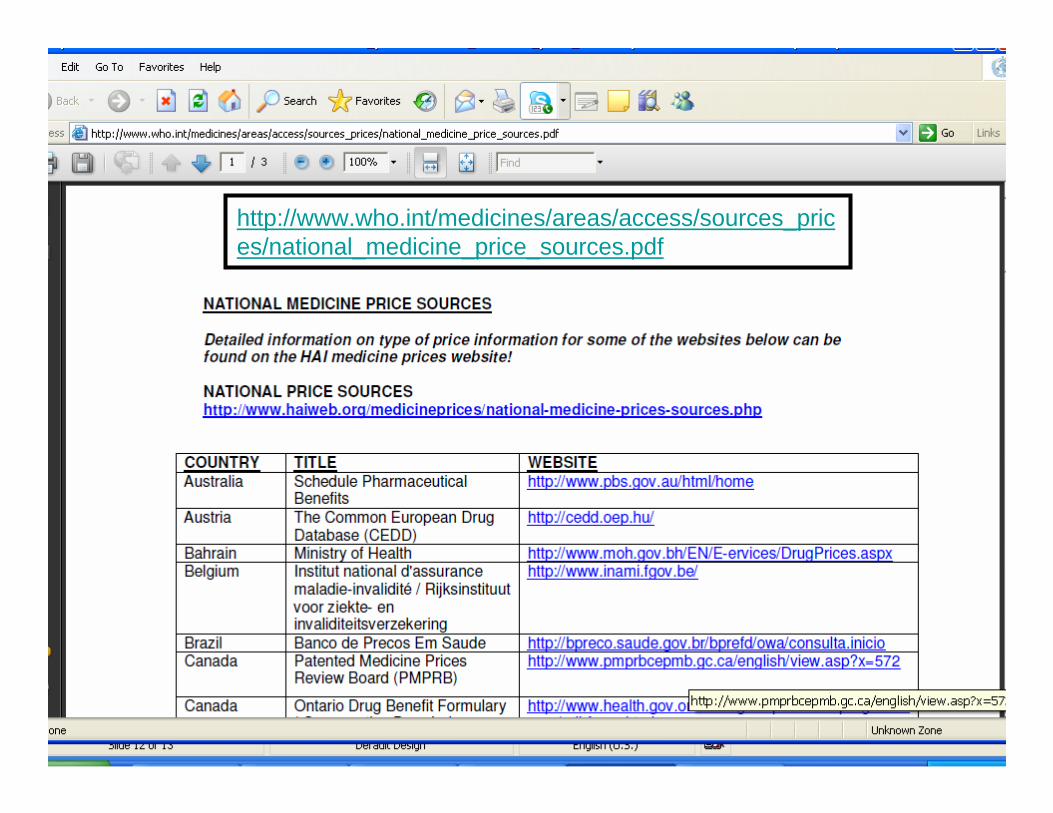
Medicines Pricing
• Sources of Information about prices– WHO website
- International and national sites– Procurement Information Exchange (PIE)
from Western Pacific Region • WHO/HAI Pricing Project• Pricing Analysis of ARVs
http://www.who.int/medicines/areas/access/ecofin/en/index.html
12
http://www.who.int/medicines/areas/access/sources_prices/international_medicine_price_guidesprice_lists.pdf
13
http://www.who.int/medicines/areas/access/sources_prices/national_medicine_price_sources.pdf
14
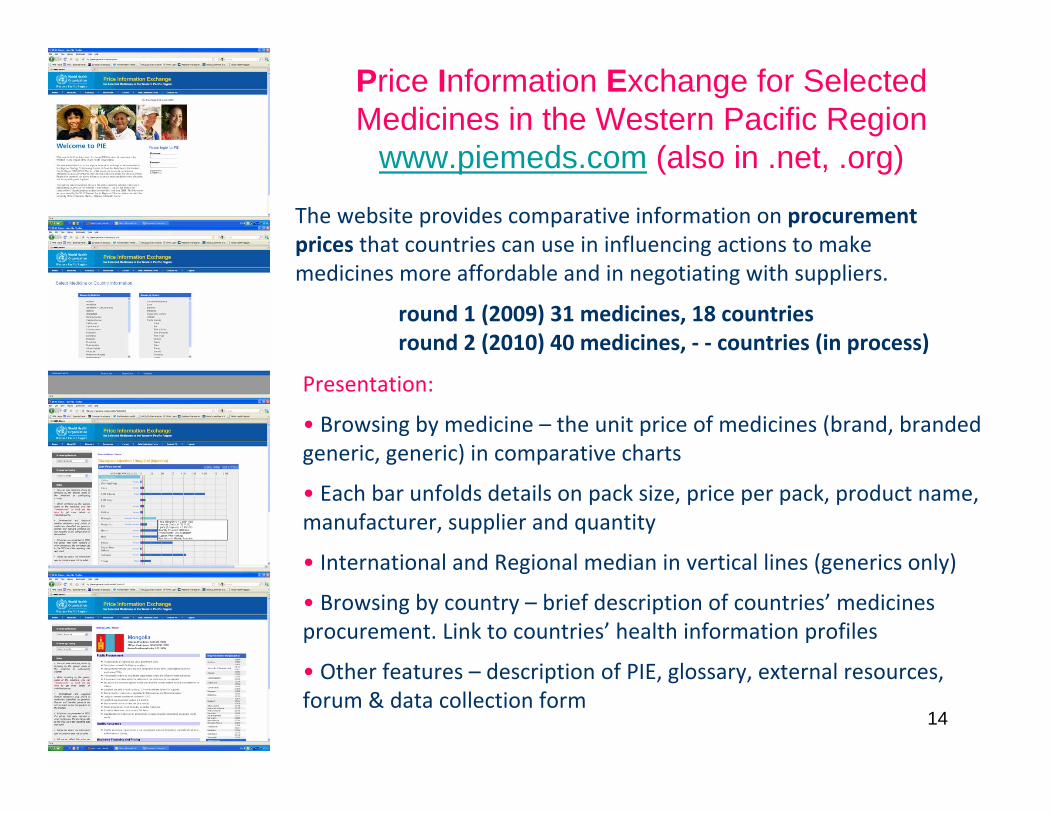
Price Information Exchange for Selected Medicines in the Western Pacific Region
www.piemeds.com (also in .net, .org)
The website provides comparative information on procurement prices that countries can use in influencing actions to make medicines more affordable and in negotiating with suppliers.
round 1 (2009) 31 medicines, 18 countriesround 2 (2010) 40 medicines, ‐ ‐ countries (in process)
Presentation:
• Browsing by medicine – the unit price of medicines (brand, branded generic, generic) in comparative charts
• Each bar unfolds details on pack size, price per pack, product name, manufacturer, supplier and quantity
• International and Regional median in vertical lines (generics only)
• Browsing by country – brief description of countries’ medicines procurement. Link to countries’ health information profiles
• Other features – description of PIE, glossary, external resources, forum & data collection form
15
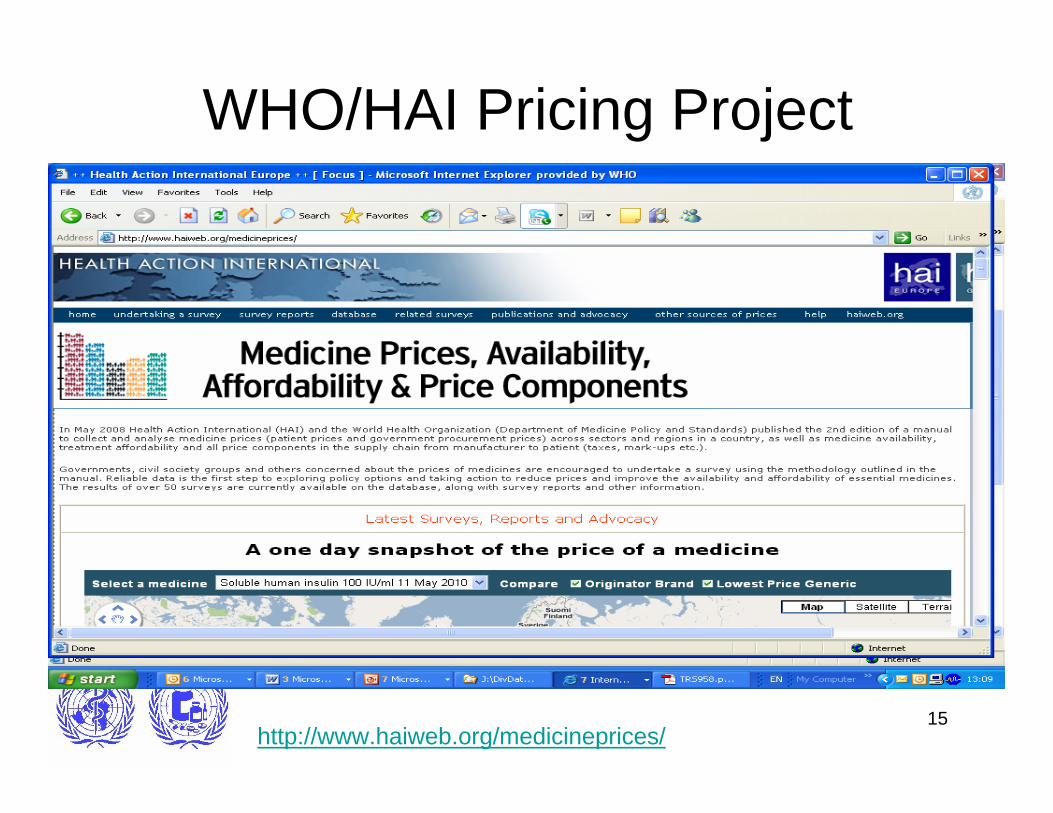
WHO/HAI Pricing Project
http://www.haiweb.org/medicineprices/
16
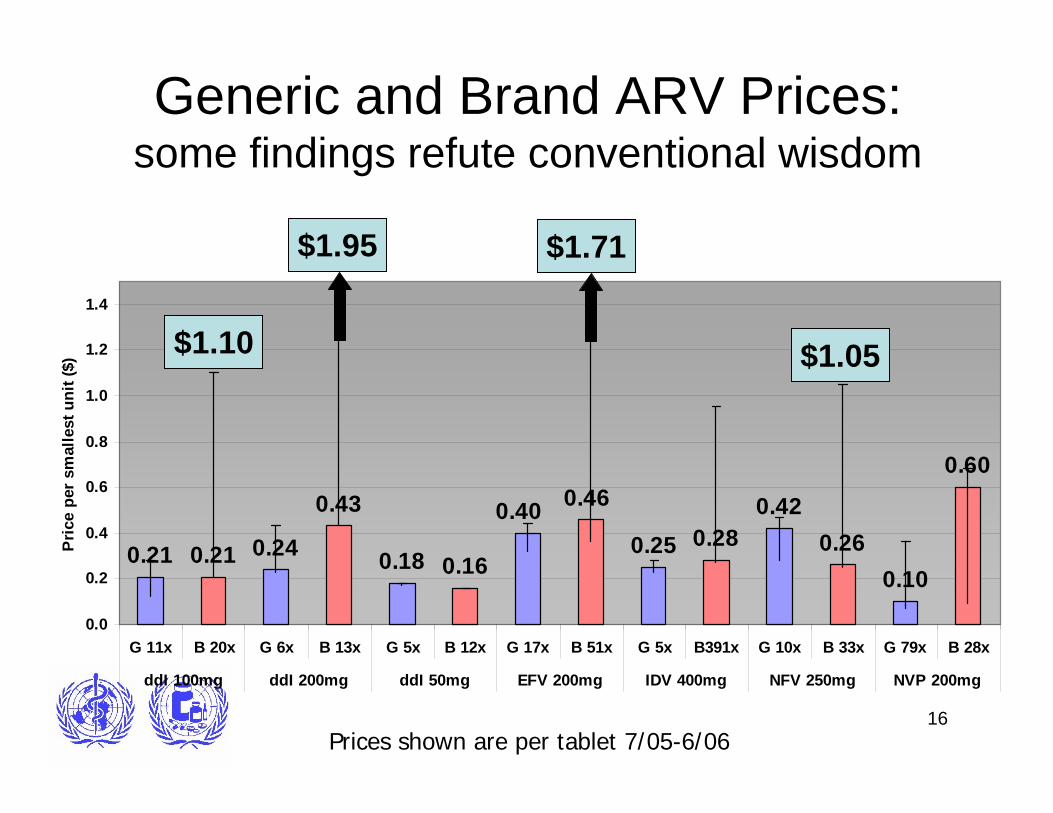
Generic and Brand ARV Prices:some findings refute conventional wisdom
0.21 0.21 0.24
0.43
0.18 0.160.25 0.28
0.420.26
0.10
0.60
0.40 0.46
0.0
0.2
0.4
0.6
0.8
1.0
1.2
1.4
G 11x B 20x G 6x B 13x G 5x B 12x G 17x B 51x G 5x B391x G 10x B 33x G 79x B 28x
ddI 100mg ddI 200mg ddI 50mg EFV 200mg IDV 400mg NFV 250mg NVP 200mg
Pric
e pe
r sm
alle
st u
nit (
$)
$1.95 $1.71
$1.05
Prices shown are per tablet 7/05-6/06
$1.10
17
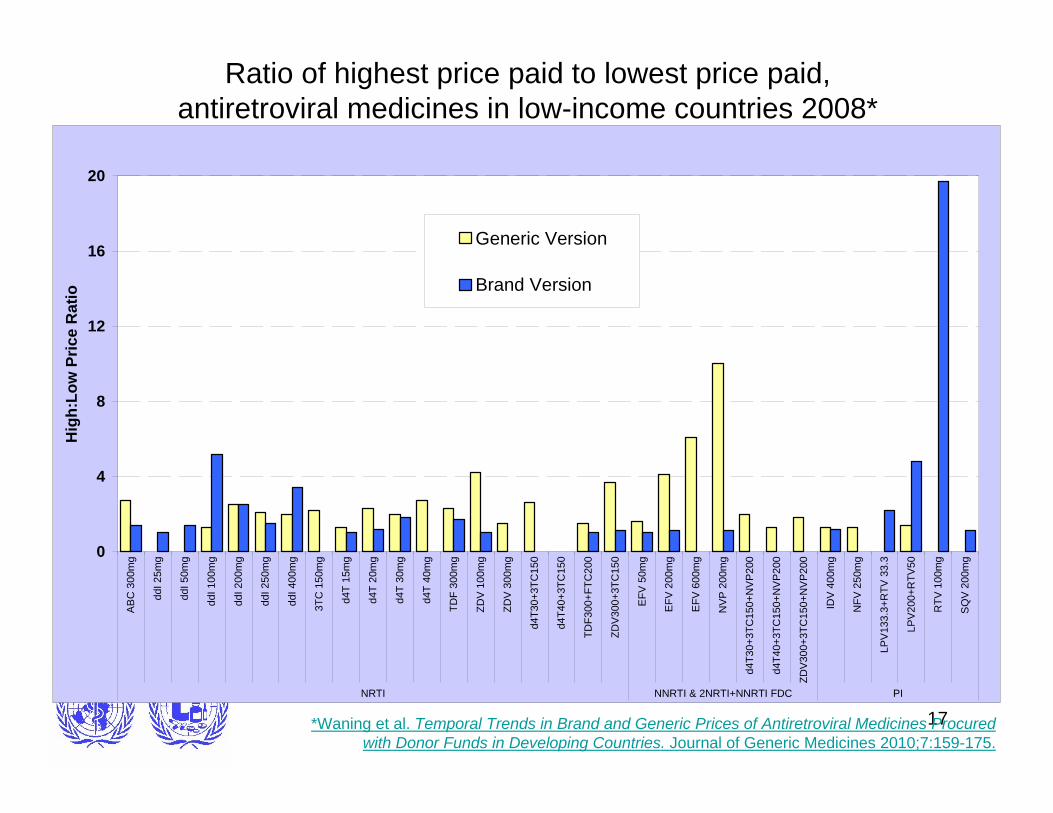
Ratio of highest price paid to lowest price paid,antiretroviral medicines in low-income countries 2008*
0
4
8
12
16
20
AB
C 3
00m
g
ddI 2
5mg
ddI 5
0mg
ddI 1
00m
g
ddI 2
00m
g
ddI 2
50m
g
ddI 4
00m
g
3TC
150
mg
d4T
15m
g
d4T
20m
g
d4T
30m
g
d4T
40m
g
TDF
300m
g
ZDV
100
mg
ZDV
300
mg
d4T3
0+3T
C15
0
d4T4
0+3T
C15
0
TDF3
00+F
TC20
0
ZDV
300+
3TC
150
EFV
50m
g
EFV
200
mg
EFV
600
mg
NV
P 2
00m
g
d4T3
0+3T
C15
0+N
VP
200
d4T4
0+3T
C15
0+N
VP
200
ZDV
300+
3TC
150+
NV
P20
0
IDV
400
mg
NFV
250
mg
LPV
133.
3+R
TV 3
3.3
LPV
200+
RTV
50
RTV
100
mg
SQ
V 2
00m
g
NRTI NNRTI & 2NRTI+NNRTI FDC PI
Hig
h:Lo
w P
rice
Rat
io
Generic Version
Brand Version
*Waning et al. Temporal Trends in Brand and Generic Prices of Antiretroviral Medicines Procured with Donor Funds in Developing Countries. Journal of Generic Medicines 2010;7:159-175.
18
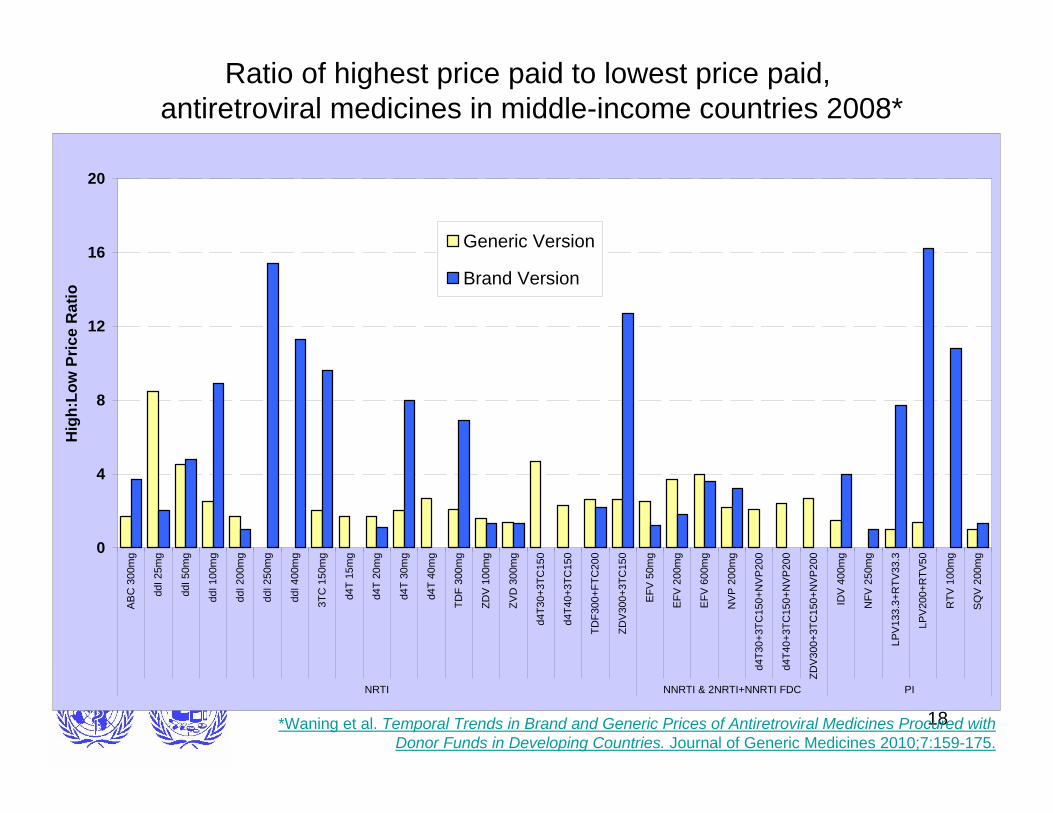
Ratio of highest price paid to lowest price paid,antiretroviral medicines in middle-income countries 2008*
0
4
8
12
16
20
AB
C 3
00m
g
ddI 2
5mg
ddI 5
0mg
ddI 1
00m
g
ddI 2
00m
g
ddI 2
50m
g
ddI 4
00m
g
3TC
150
mg
d4T
15m
g
d4T
20m
g
d4T
30m
g
d4T
40m
g
TDF
300m
g
ZDV
100
mg
ZVD
300
mg
d4T3
0+3T
C15
0
d4T4
0+3T
C15
0
TDF3
00+F
TC20
0
ZDV
300+
3TC
150
EFV
50m
g
EFV
200
mg
EFV
600
mg
NV
P 2
00m
g
d4T3
0+3T
C15
0+N
VP
200
d4T4
0+3T
C15
0+N
VP
200
ZDV
300+
3TC
150+
NV
P20
0
IDV
400
mg
NFV
250
mg
LPV
133.
3+R
TV33
.3
LPV
200+
RTV
50
RTV
100
mg
SQ
V 2
00m
g
NRTI NNRTI & 2NRTI+NNRTI FDC PI
Hig
h:Lo
w P
rice
Rat
io
Generic Version
Brand Version
*Waning et al. Temporal Trends in Brand and Generic Prices of Antiretroviral Medicines Procured with Donor Funds in Developing Countries. Journal of Generic Medicines 2010;7:159-175.
19
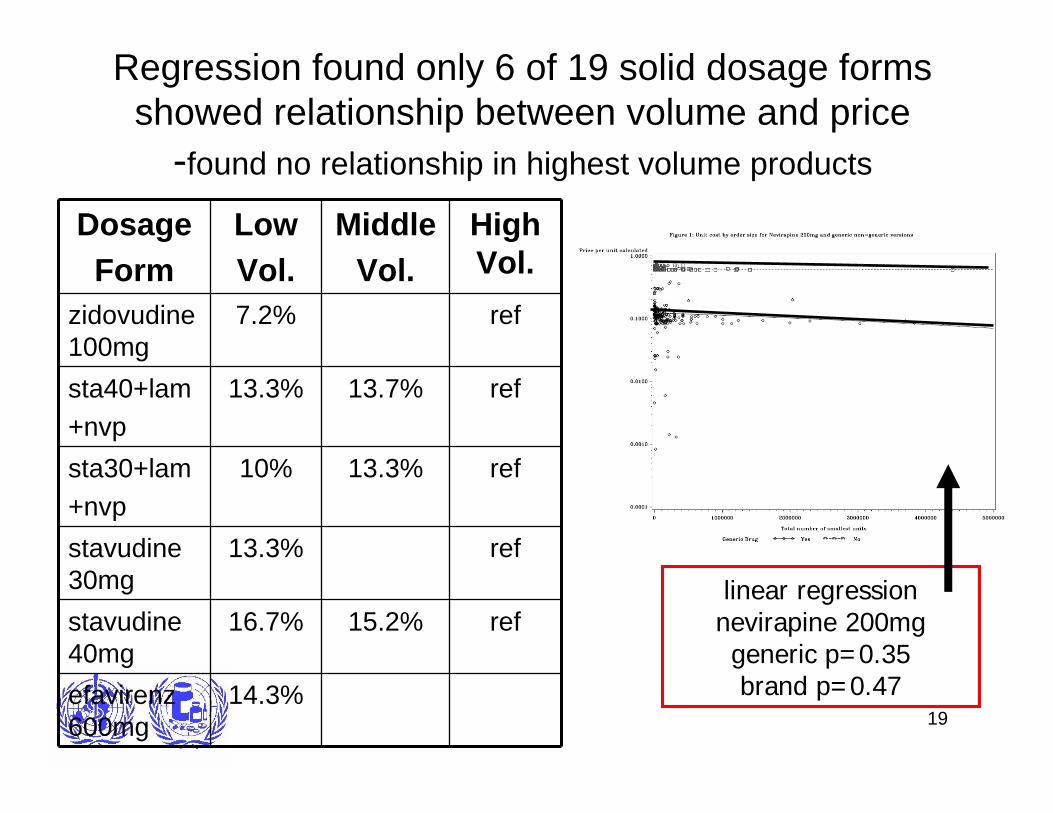
Regression found only 6 of 19 solid dosage forms showed relationship between volume and price
-found no relationship in highest volume products
DosageForm
LowVol.
MiddleVol.
High Vol.
zidovudine 100mg
7.2% ref
sta40+lam+nvp
13.3% 13.7% ref
sta30+lam+nvp
10% 13.3% ref
stavudine 30mg
13.3% ref
stavudine 40mg
16.7% 15.2% ref
efavirenz 600mg
14.3%
linear regression nevirapine 200mg generic p=0.35 brand p=0.47
20
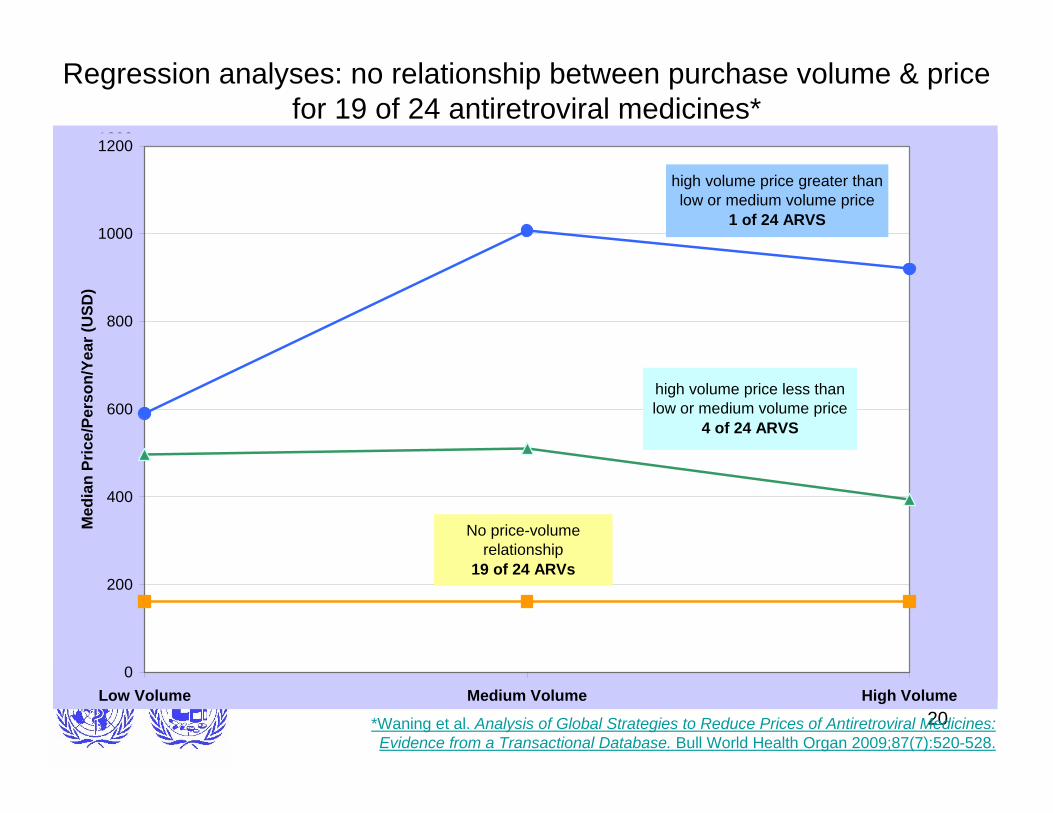
Regression analyses: no relationship between purchase volume & price for 19 of 24 antiretroviral medicines*
*Waning et al. Analysis of Global Strategies to Reduce Prices of Antiretroviral Medicines: Evidence from a Transactional Database. Bull World Health Organ 2009;87(7):520-528.
0
200
400
600
800
1000
1200
Low Volume Medium Volume High Volume
Med
ian
Pric
e/Pe
rson
/Yea
r (U
SD)
high volume price greater than
low or medium volume price1 of 24 ARVS
high volume price less thanlow or medium volume price
4 of 24 ARVS
No price-volumerelationship
19 of 24 ARVs
0
200
400
600
800
1000
1200
Low Volume Medium Volume High Volume
Med
ian
Pric
e/Pe
rson
/Yea
r (U
SD)
high volume price greater thanlow or medium volume price
1 of 24 ARVS
high volume price less thanlow or medium volume price
4 of 24 ARVS
No price-volumerelationship
19 of 24 ARVs
0
200
400
600
800
1000
1200
Low Volume Medium Volume High Volume
Med
ian
Pric
e/Pe
rson
/Yea
r (U
SD)
high volume price greater thanlow or medium volume price
1 of 24 ARVS
high volume price less thanlow or medium volume price
4 of 24 ARVS
No price-volumerelationship
19 of 24 ARVs
21
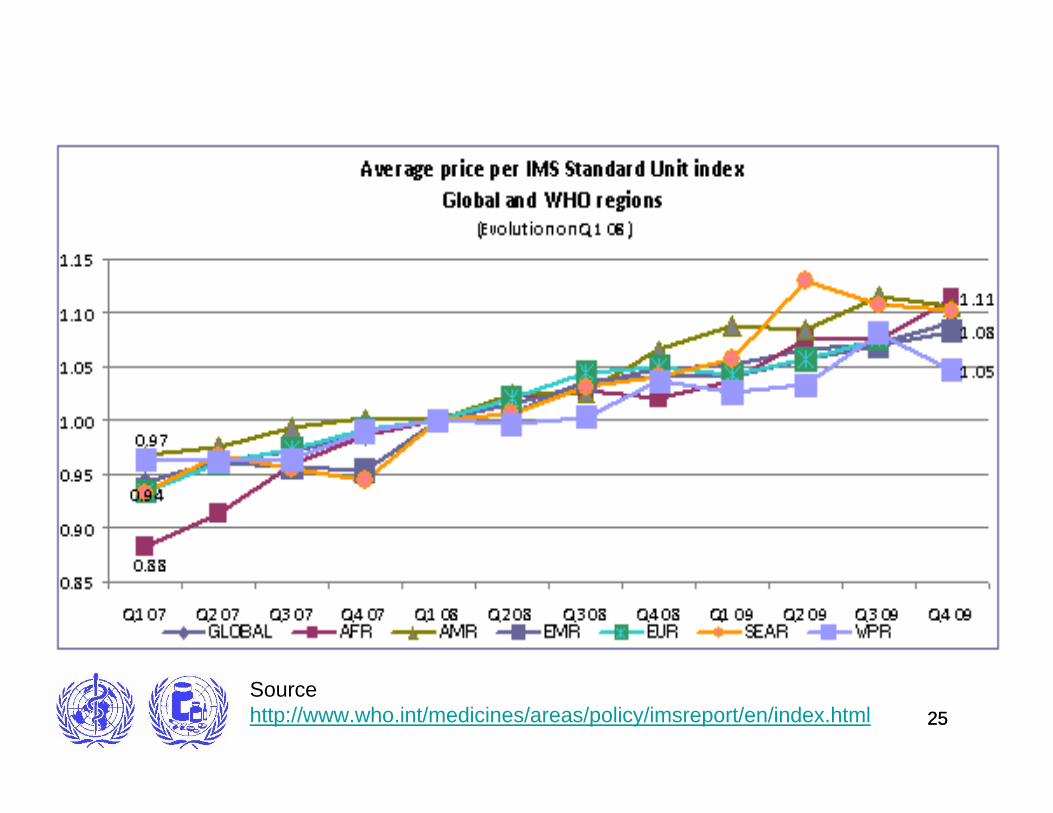
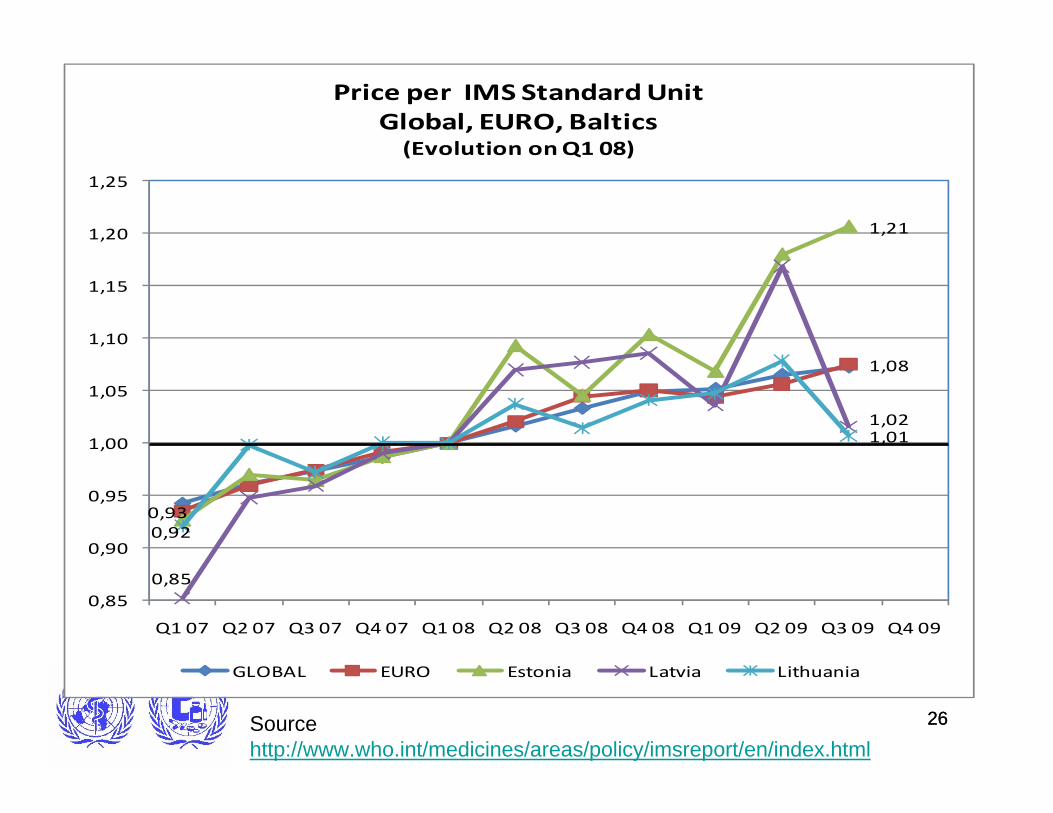
Monitoring Consumption & Prices
• In collaboration with IMS Health WHO has been tracking the impact of the global recession on pharmaceutical consumption, expenditure and prices in 83 countries
• Data shows that only Baltic and eastern European countries have been substantially impacted
• Methods could be used to monitor the impact of policy changes e.g. Data exclusivity
See http://www.who.int/medicines/areas/policy/imsreport/en/index.html

2222Source http://www.who.int/medicines/areas/policy/imsreport/en/index.html
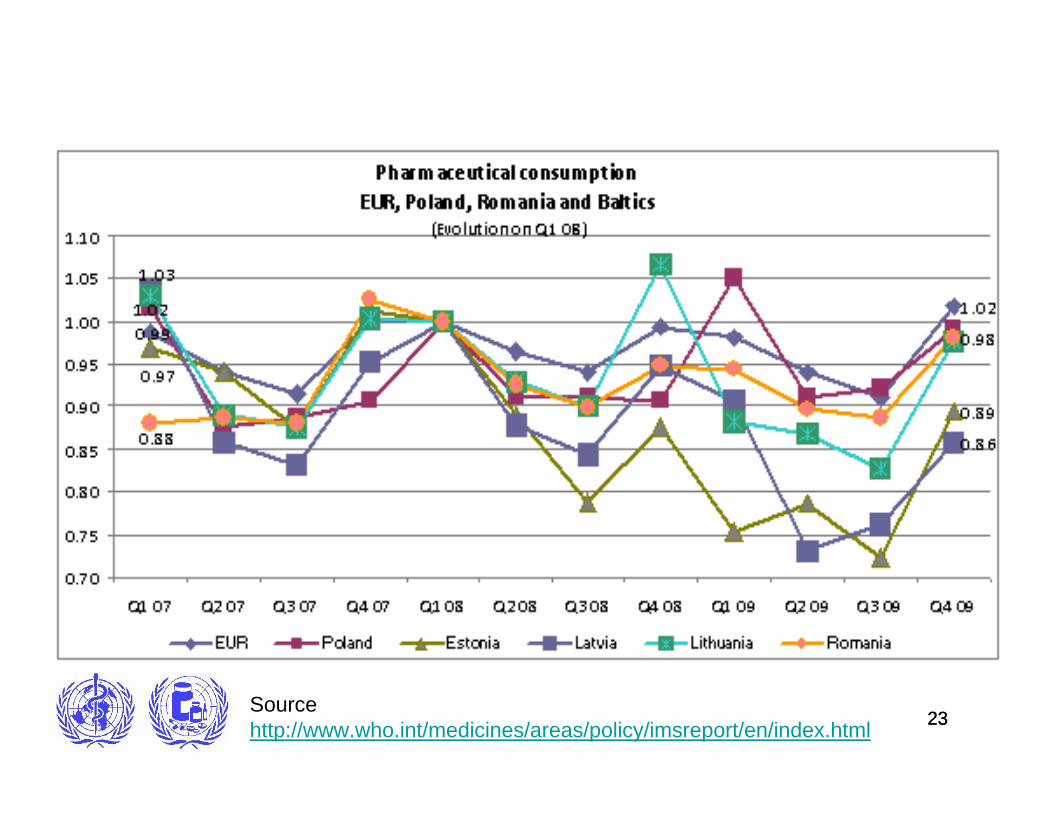
2323Source http://www.who.int/medicines/areas/policy/imsreport/en/index.html
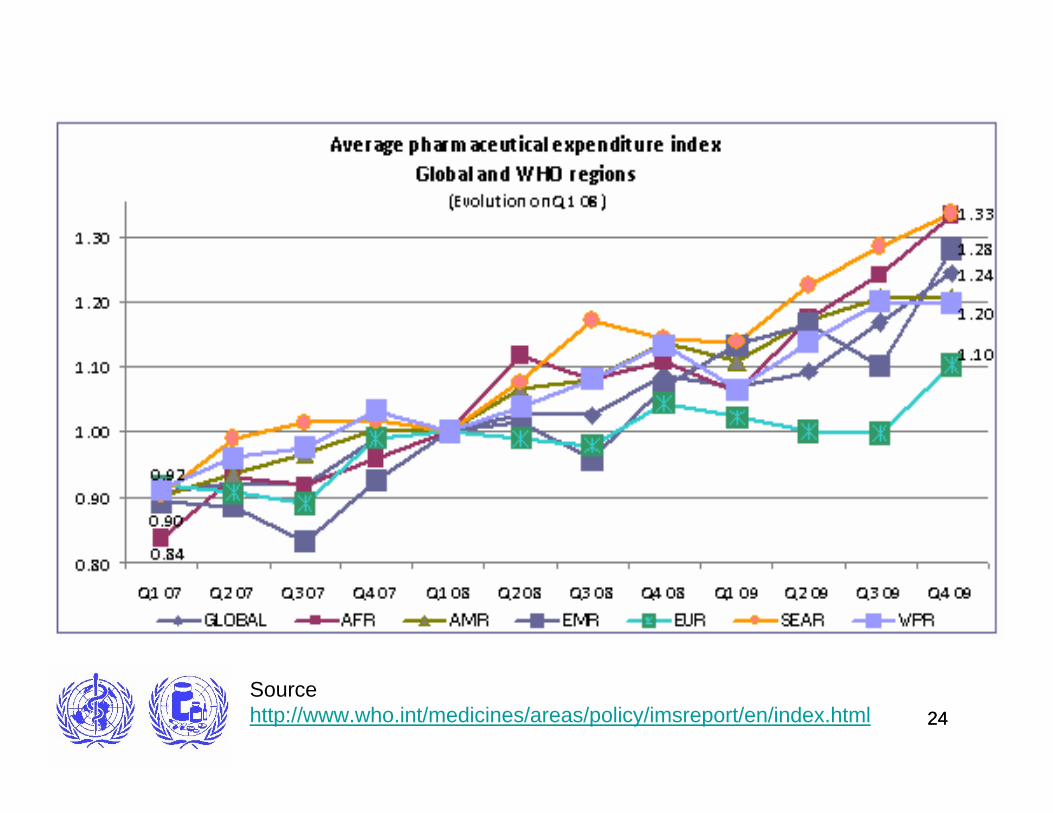
2424Source http://www.who.int/medicines/areas/policy/imsreport/en/index.html
2525Source http://www.who.int/medicines/areas/policy/imsreport/en/index.html
2626
0,93
1,08
1,21
0,85
1,02
0,92
1,01
0,85
0,90
0,95
1,00
1,05
1,10
1,15
1,20
1,25
Q1 07 Q2 07 Q3 07 Q4 07 Q1 08 Q2 08 Q3 08 Q4 08 Q1 09 Q2 09 Q3 09 Q4 09
Price per IMS Standard UnitGlobal, EURO, Baltics (Evolution on Q1 08)
GLOBAL EURO Estonia Latvia Lithuania
Source http://www.who.int/medicines/areas/policy/imsreport/en/index.html
27
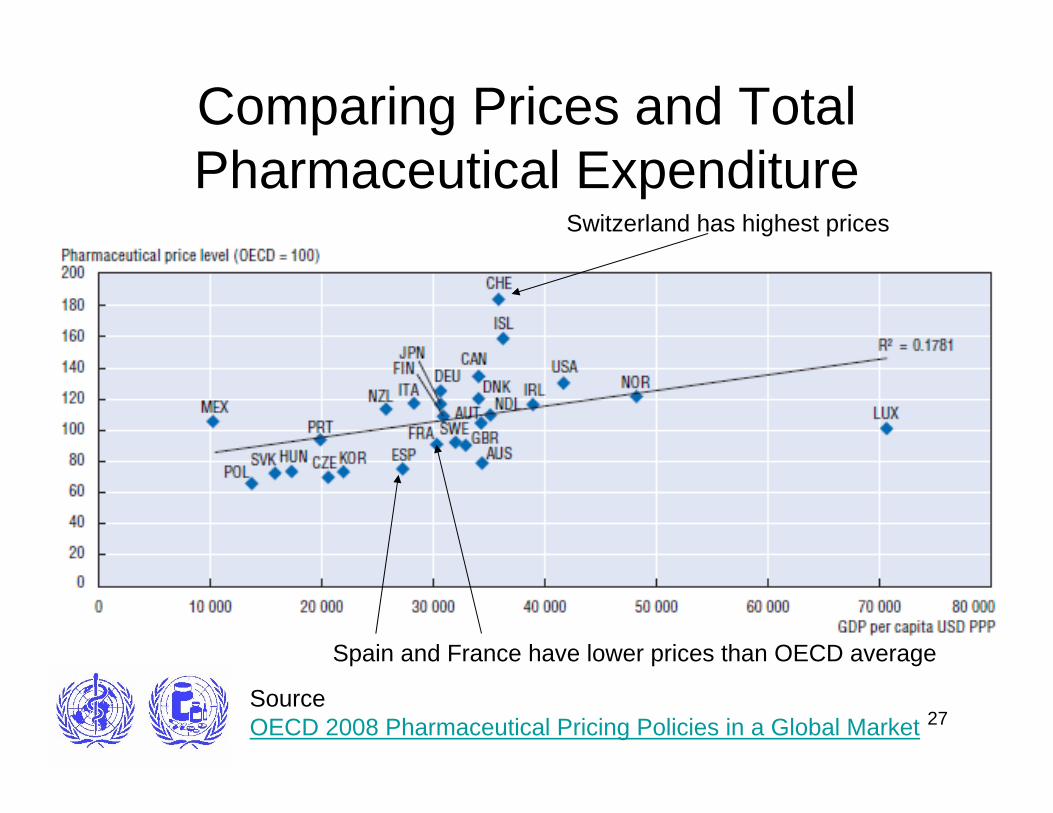
Comparing Prices and Total Pharmaceutical Expenditure
Switzerland has highest prices
Spain and France have lower prices than OECD average
Source OECD 2008 Pharmaceutical Pricing Policies in a Global Market
28
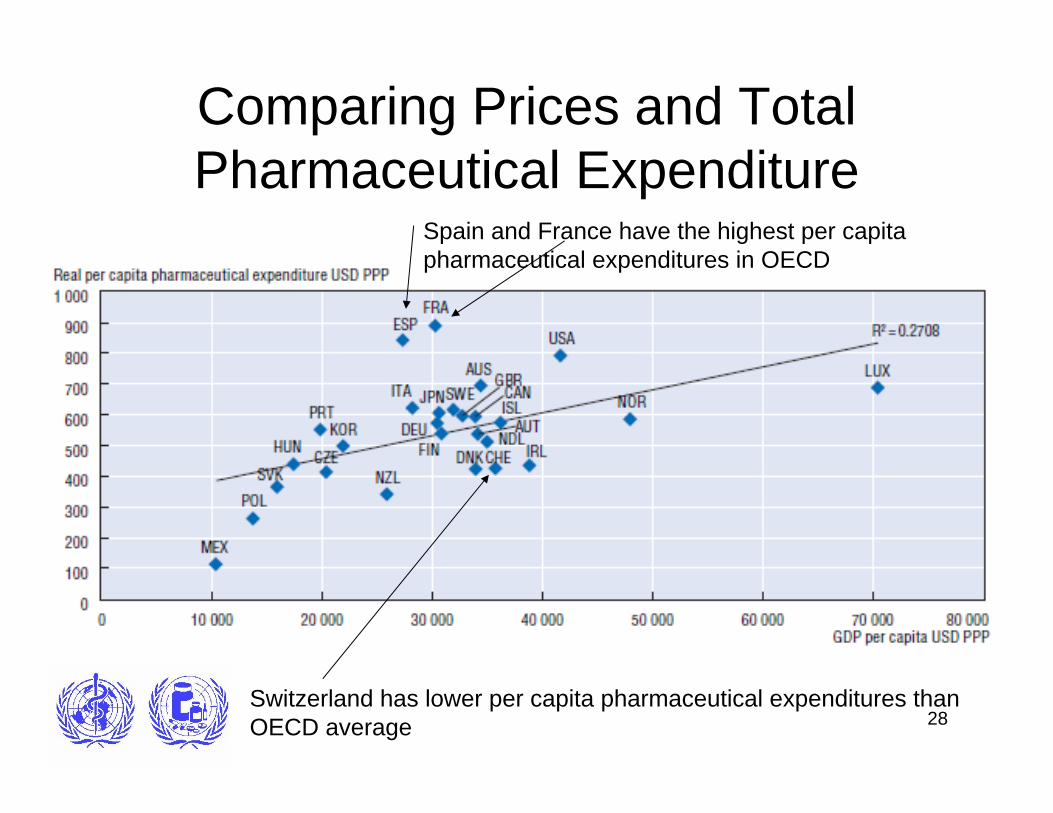
Comparing Prices and Total Pharmaceutical Expenditure
Switzerland has lower per capita pharmaceutical expenditures than OECD average
Spain and France have the highest per capita pharmaceutical expenditures in OECD
29
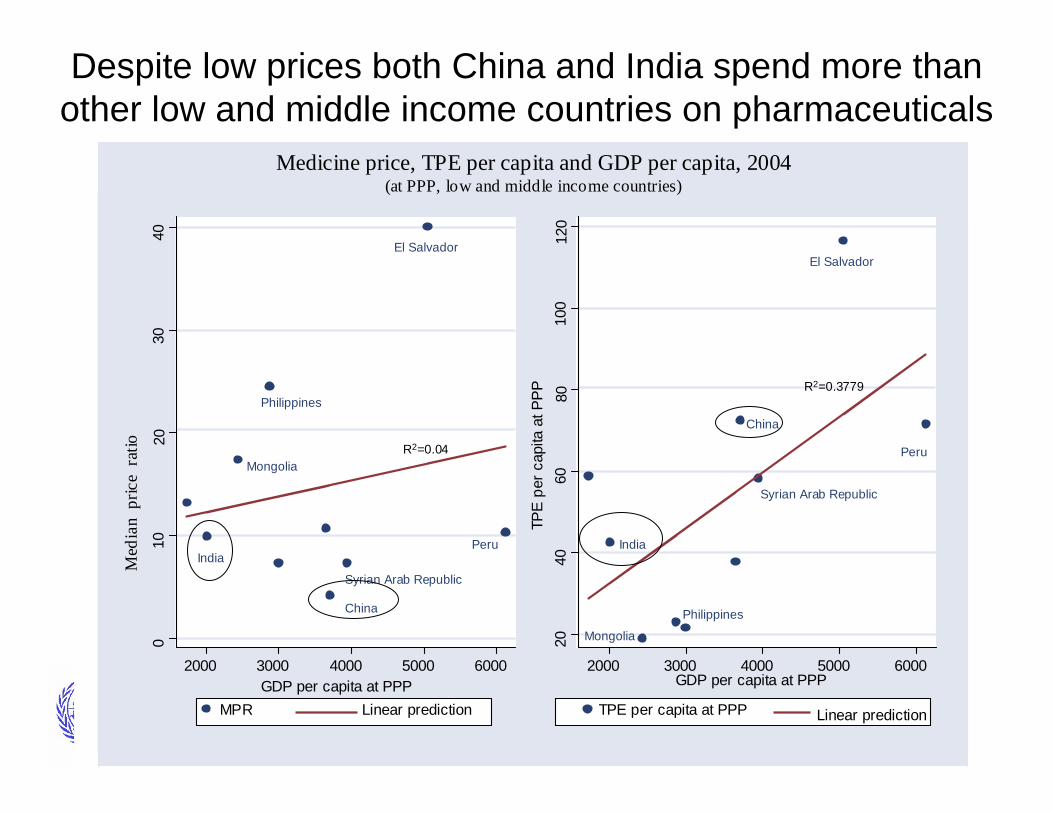
Despite low prices both China and India spend more than other low and middle income countries on pharmaceuticals
Medicine price, TPE per capita and GDP per capita, 2004(at PPP, low and middle income countries)
China
Mongolia
Philippines
India
Syrian Arab Republic
Peru
El Salvador
010
2030
40
Med
ian
pric
e ra
tio
2000 3000 4000 5000 6000GDP per capita at PPP
MPR Linear prediction
China
Mongolia
Philippines
India
Syrian Arab Republic
Peru
El Salvador
2040
6080
100
120
TPE
per c
apita
at P
PP
2000 3000 4000 5000 6000GDP per capita at PPP
TPE per capita at PPP Linear prediction
R2=0.04
R2=0.3779
30
Conclusion• There is much to procurement
beyond patents, copyright and data exclusivity
• Data resources and methods currently available allow evaluation of policy or programmatic actions at global, regional or national levels
• Many opportunities to cooperate at a technical and at a country support level
31
Citations• Waning B, Kyle M, Diedrichsen E, Soucy L, Hochstadt J, Bärnighausen T, Moon S.
Intervening in global markets to improve access to HIV/AIDS treatment: an analysis of international policies and the dynamics of global antiretroviral medicines markets. Globalization and Health 2010:6:9.http://www.globalizationandhealth.com/content/6/1/9
• Waning B, Kaplan W, Fox MP, Boyd-Boffa M, King AC, Lawrence DA, Soucy L, Mahajan S, Leufkens HG, Gokhale M. Temporal Trends in Brand and Generic Prices of Antiretroviral Medicines Procured with Donor Funds in Developing Countries. Journal of Generic Medicines 2010;7:159-175. http://www.palgrave-journals.com/jgm/journal/v7/n2/full/jgm20106a.html
• Waning B, Kaplan W, King AC, Lawrence DA, Leufkens HG, Fox MP. Analysis of Global Strategies to Reduce Prices of Antiretroviral Medicines: Evidence from a Transactional Database. Bull World Health Organ 2009;87(7):520-528.http://www.who.int/bulletin/volumes/87/7/08-058925.pdf