Processing Databases Graph Analytics on Massively Parallel · Graph Analytics on Massively Parallel...
46
Graph Analytics on Massively Parallel Processing Databases Frank McQuillan Feb 2017
Transcript of Processing Databases Graph Analytics on Massively Parallel · Graph Analytics on Massively Parallel...
Graph Analytics on Massively Parallel Processing DatabasesFrank McQuillanFeb 2017
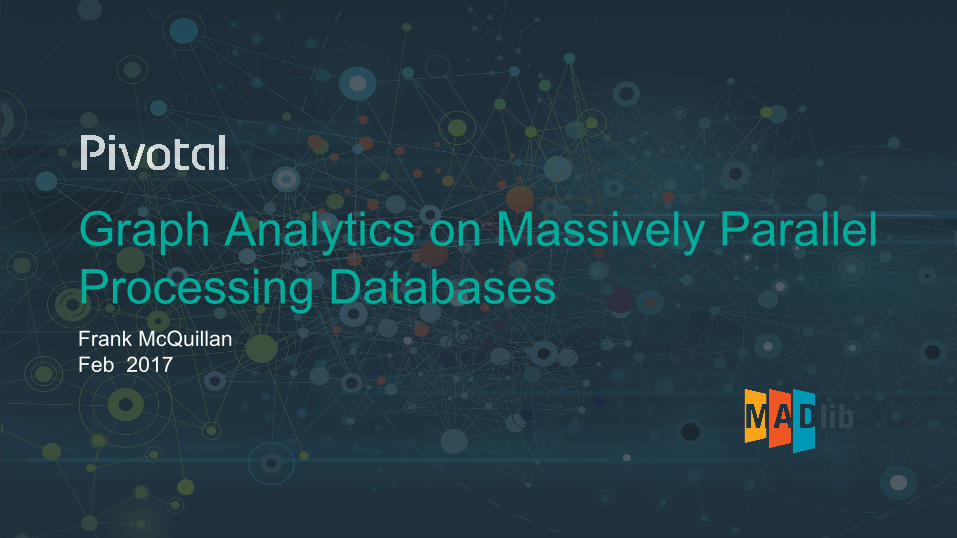
MPP databases effective for graph analytics at scale in the enterprise
2
3
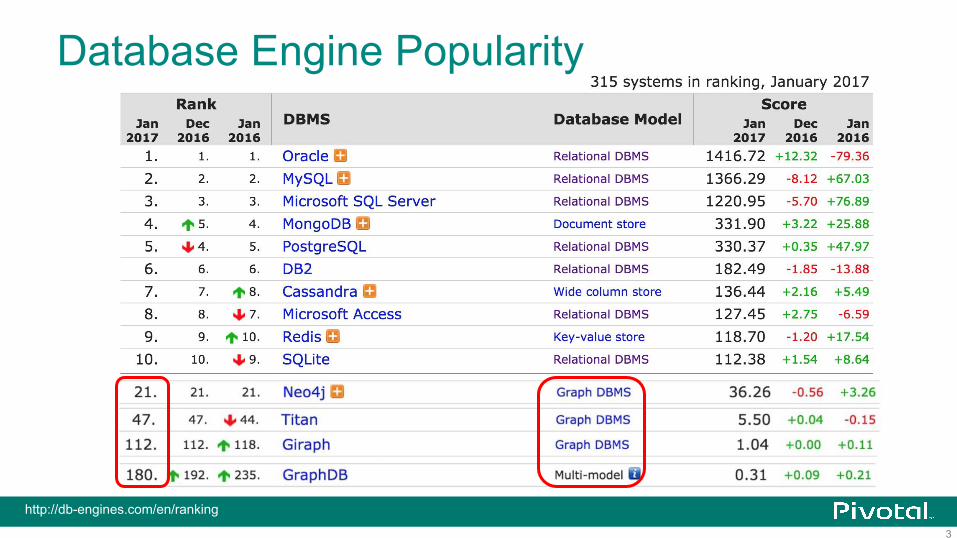
Database Engine Popularity
http://db-engines.com/en/ranking
4
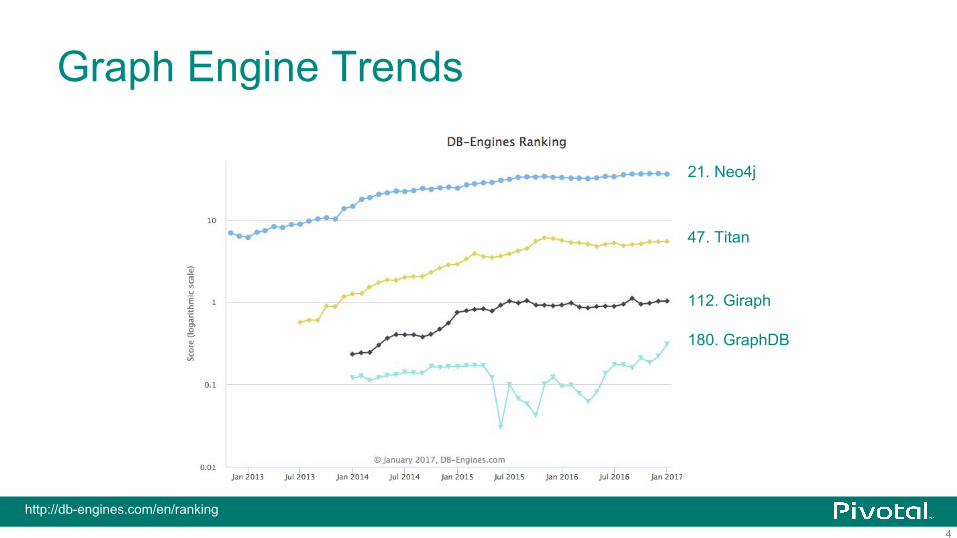
Graph Engine Trends
http://db-engines.com/en/ranking
21. Neo4j
47. Titan
112. Giraph
180. GraphDB
5
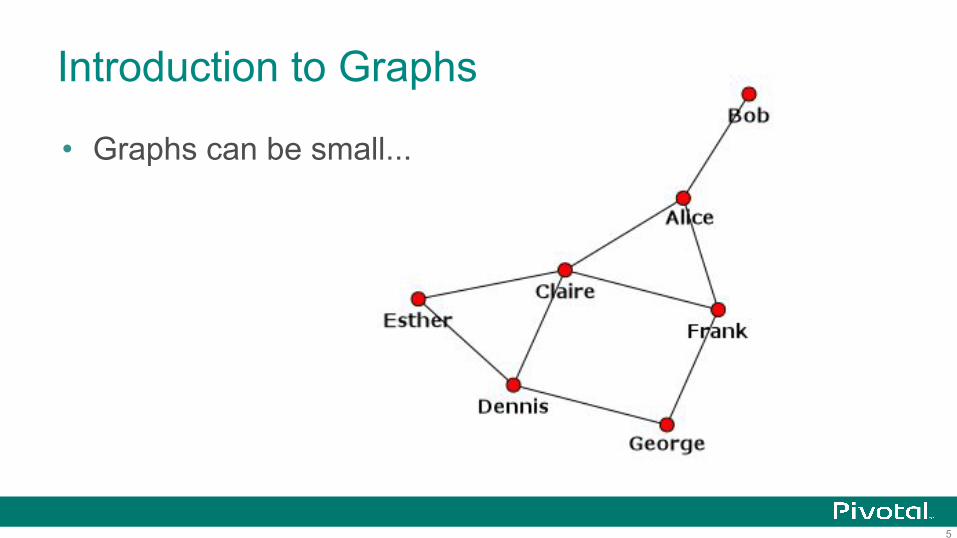
Introduction to Graphs
• Graphs can be small...
6
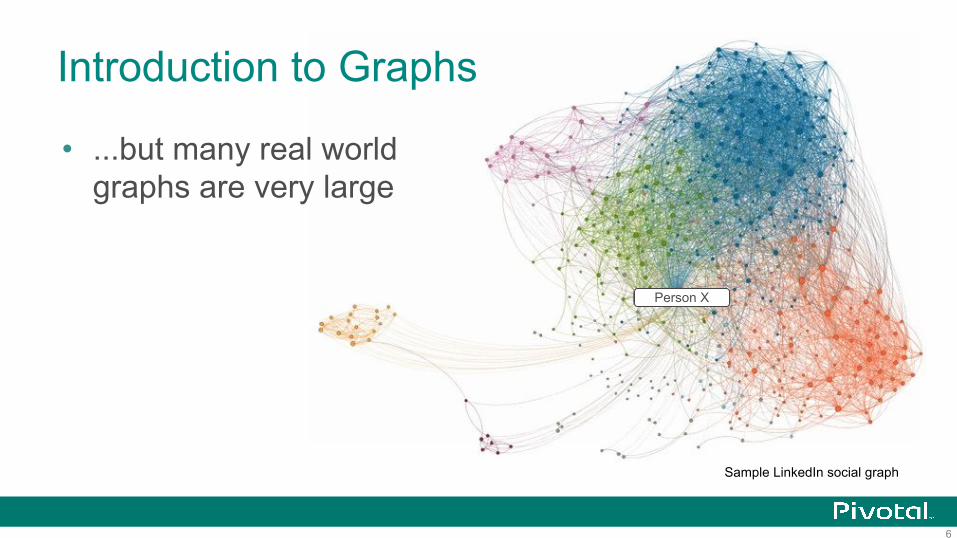
Introduction to Graphs
• ...but many real world graphs are very large
Person X
Sample LinkedIn social graph
7
Why Graph Analytics on MPP Databases?
• MPP is built for very large data sets• Many enterprise use cases combine graph analytics with
other techniques• SQL
– Most common workload in the enterprise– Widely used by analysts and data scientists– Ecosystem of business intelligence applications
8
Why Graph Analytics on MPP Databases?
• Data locality– Cost of replicating, moving and transforming data to an
external system can be high• Policy
– Cost, deployment, oversight, support issues adding a new execution engine
– Convince the CIO to use a specialized system in production
9
But...
Can graph analytic processing be efficiently performed
on relational data in an MPP database?
10
Yes!
• Graph analytic processing on Greenplum database using Apache MADlib can solve for a wide range of real world use cases
11
Apache MADlib (incubating)
12
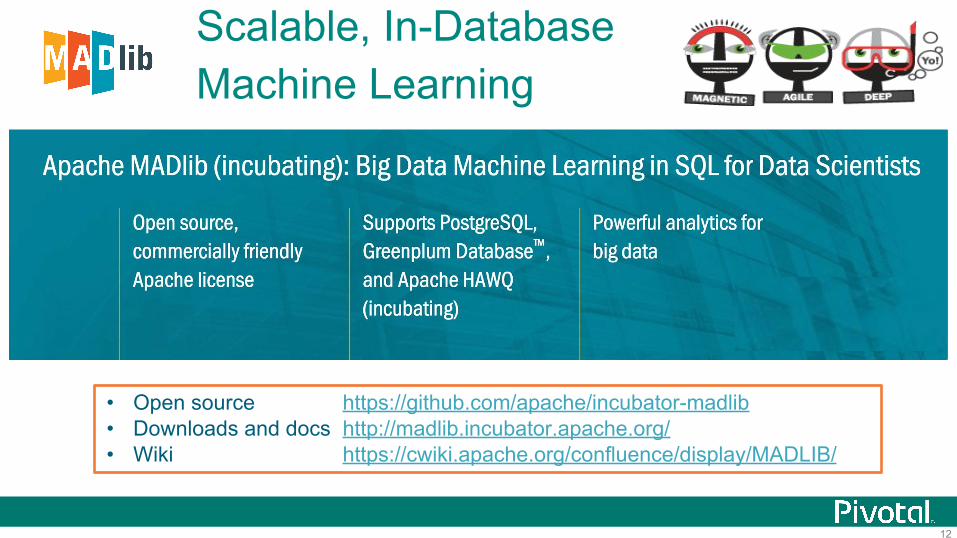
Scalable, In-Database Machine Learning
• Open source https://github.com/apache/incubator-madlib• Downloads and docs http://madlib.incubator.apache.org/• Wiki https://cwiki.apache.org/confluence/display/MADLIB/
13
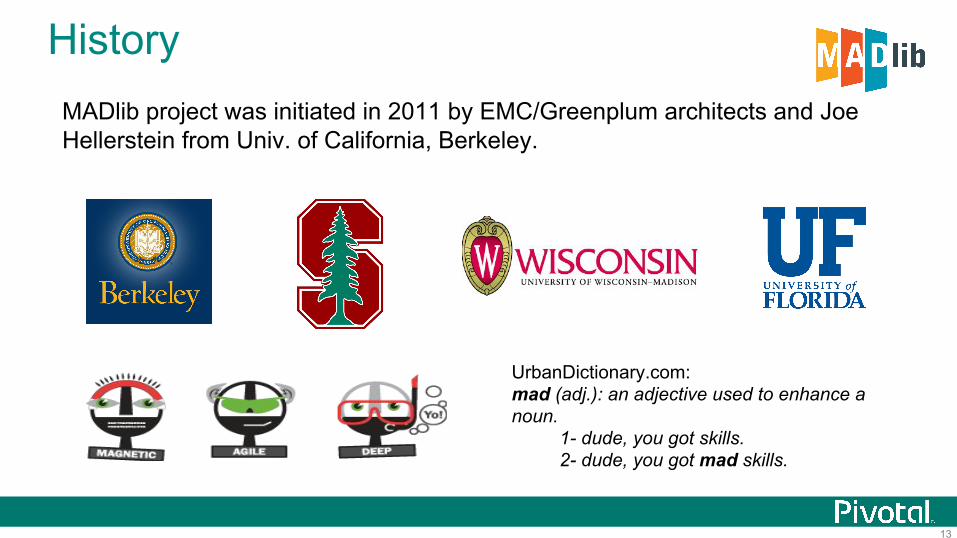
HistoryMADlib project was initiated in 2011 by EMC/Greenplum architects and Joe Hellerstein from Univ. of California, Berkeley.
UrbanDictionary.com:mad (adj.): an adjective used to enhance a noun.
1- dude, you got skills.2- dude, you got mad skills.
14
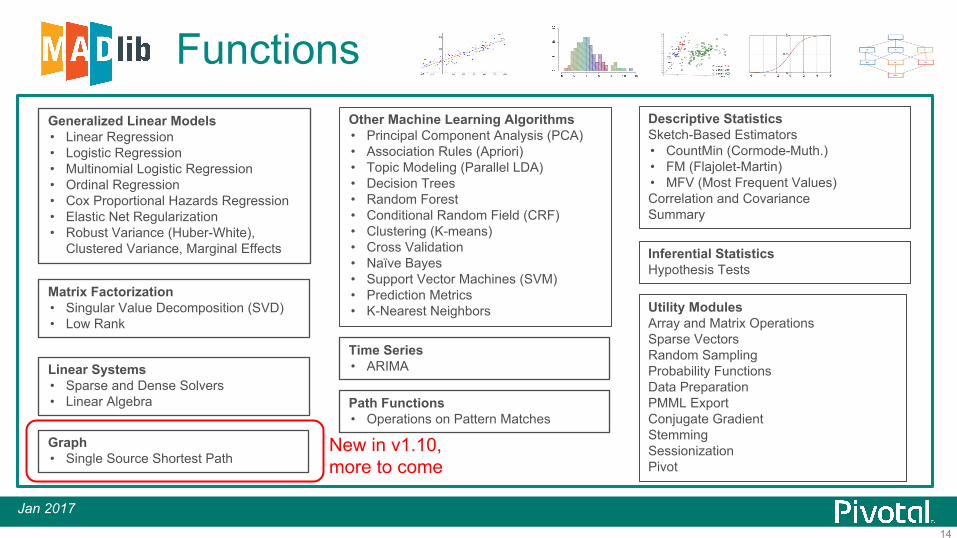
Functions
Linear Systems• Sparse and Dense Solvers• Linear Algebra
Matrix Factorization• Singular Value Decomposition (SVD)• Low Rank
Generalized Linear Models• Linear Regression• Logistic Regression• Multinomial Logistic Regression• Ordinal Regression• Cox Proportional Hazards Regression• Elastic Net Regularization• Robust Variance (Huber-White),
Clustered Variance, Marginal Effects
Other Machine Learning Algorithms• Principal Component Analysis (PCA)• Association Rules (Apriori)• Topic Modeling (Parallel LDA)• Decision Trees• Random Forest• Conditional Random Field (CRF)• Clustering (K-means) • Cross Validation• Naïve Bayes• Support Vector Machines (SVM)• Prediction Metrics• K-Nearest Neighbors
Descriptive StatisticsSketch-Based Estimators• CountMin (Cormode-Muth.)• FM (Flajolet-Martin)• MFV (Most Frequent Values)Correlation and CovarianceSummary
Utility ModulesArray and Matrix OperationsSparse VectorsRandom SamplingProbability FunctionsData PreparationPMML ExportConjugate GradientStemmingSessionizationPivot
Inferential StatisticsHypothesis Tests
Time Series• ARIMA
Jan 2017
Path Functions• Operations on Pattern Matches
Graph• Single Source Shortest Path
New in v1.10, more to come
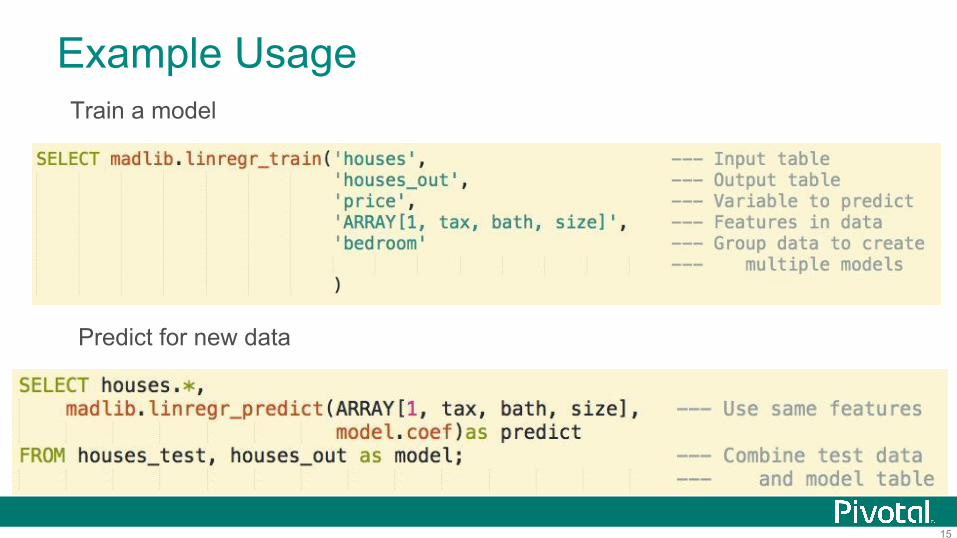
15
Example UsageTrain a model
Predict for new data
16
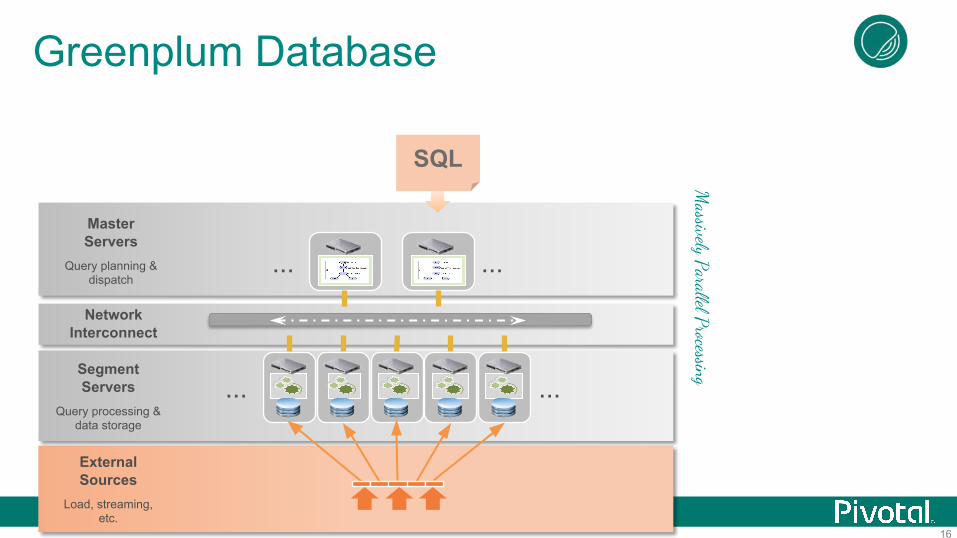
ExternalSources
Load, streaming, etc.
NetworkInterconnect
... ...
......MasterServers
Query planning & dispatch
SegmentServers
Query processing & data storage
SQL
Massively Parallel Processing
Greenplum Database
17
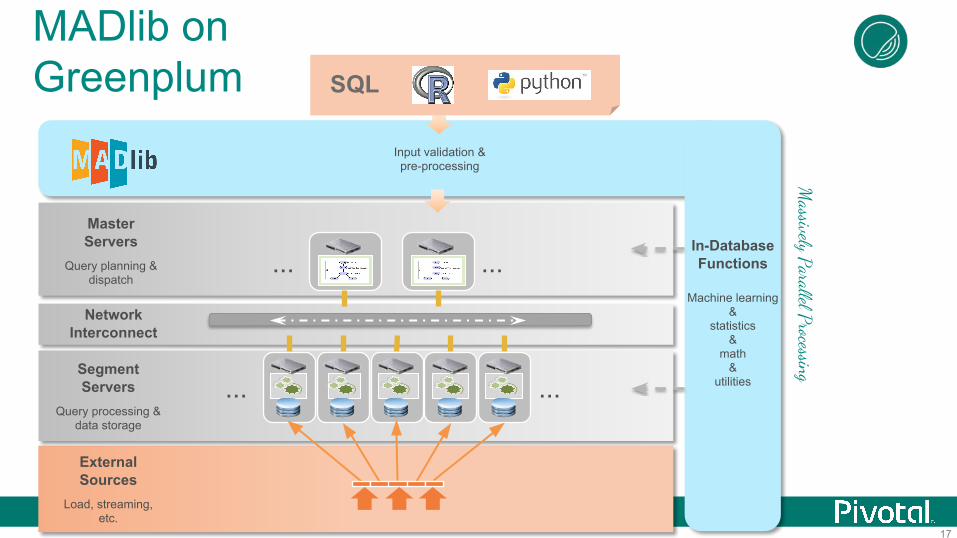
ExternalSources
Load, streaming, etc.
NetworkInterconnect
... ...
......MasterServers
Query planning & dispatch
SegmentServers
Query processing & data storage
In-Database Functions
Machine learning&
statistics&
math&
utilities
Input validation & pre-processing
SQL
Massively Parallel Processing
MADlib on Greenplum
18
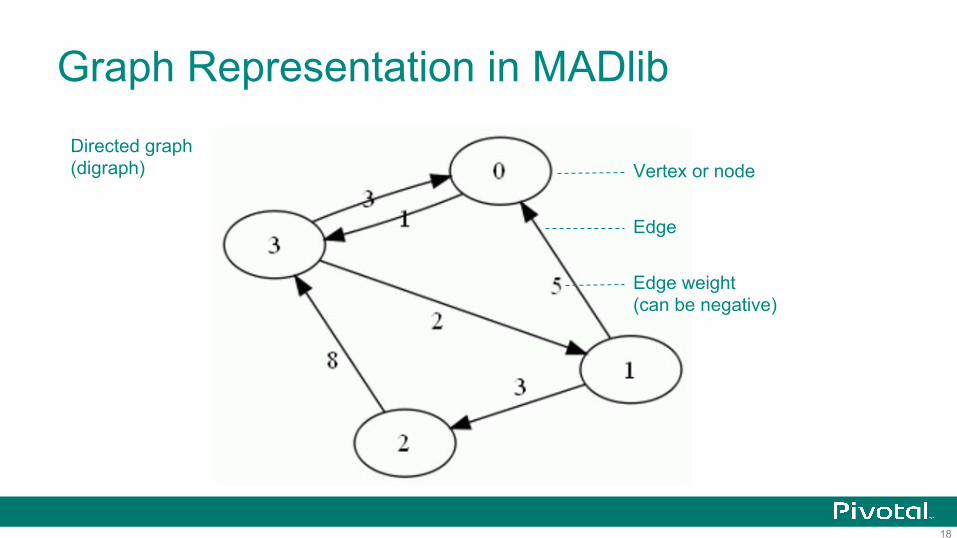
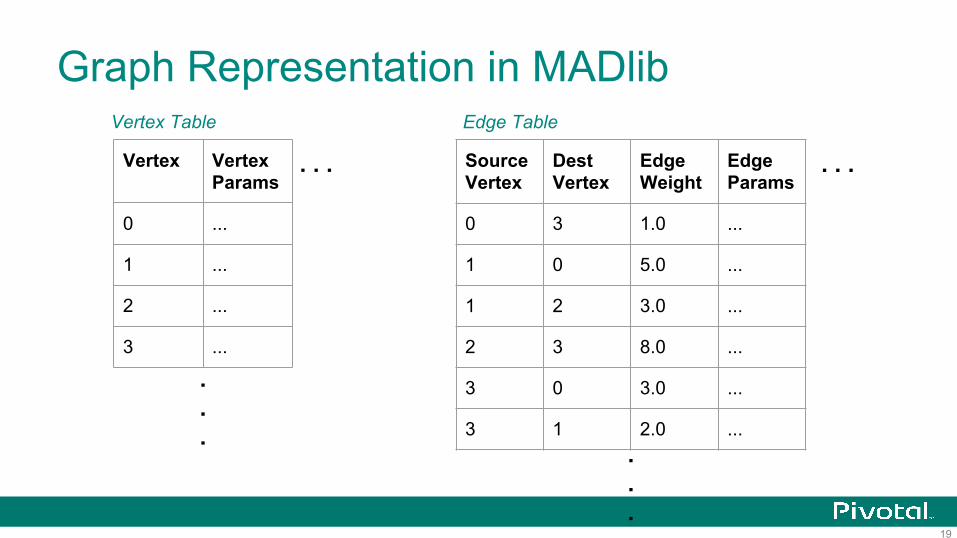
Graph Representation in MADlib
Vertex or node
Edge
Edge weight (can be negative)
Directed graph(digraph)
19
Graph Representation in MADlib
Source Vertex
Dest Vertex
Edge Weight
Edge Params
0 3 1.0 ...
1 0 5.0 ...
1 2 3.0 ...
2 3 8.0 ...
3 0 3.0 ...
3 1 2.0 ...
Vertex VertexParams
0 ...
1 ...
2 ...
3 ...
.
.
....
. . . . . .
Vertex Table Edge Table
20
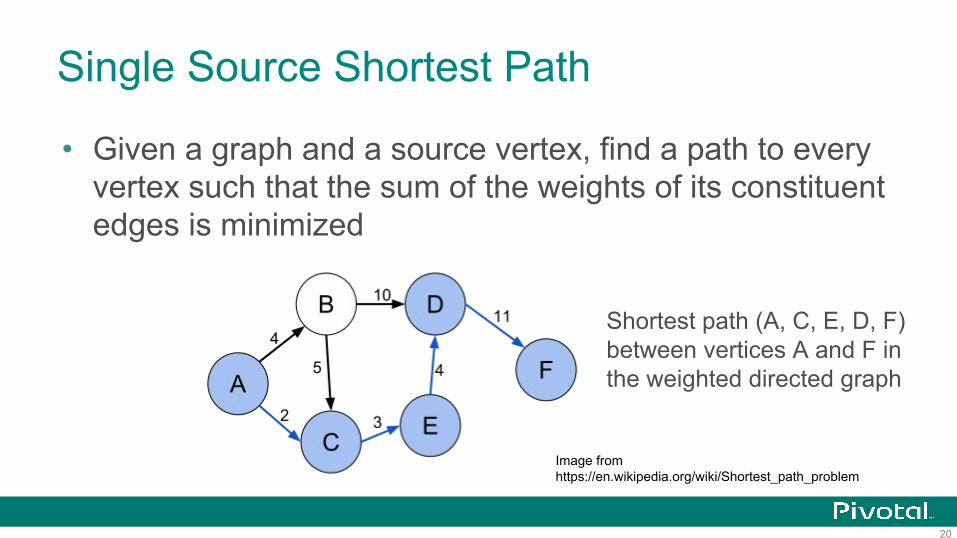
Single Source Shortest Path
• Given a graph and a source vertex, find a path to every vertex such that the sum of the weights of its constituent edges is minimized
Image fromhttps://en.wikipedia.org/wiki/Shortest_path_problem
Shortest path (A, C, E, D, F) between vertices A and F in the weighted directed graph
21
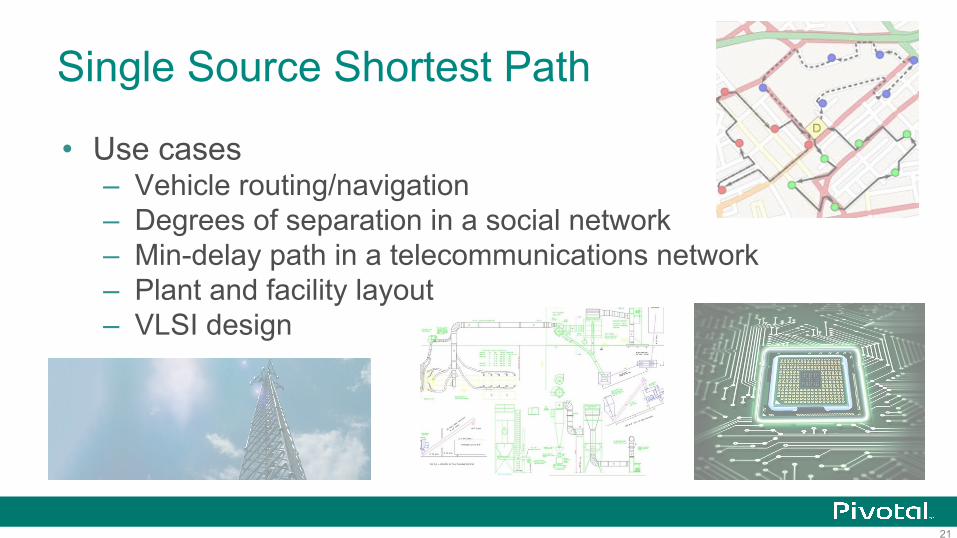
Single Source Shortest Path
• Use cases– Vehicle routing/navigation– Degrees of separation in a social network– Min-delay path in a telecommunications network– Plant and facility layout– VLSI design
22
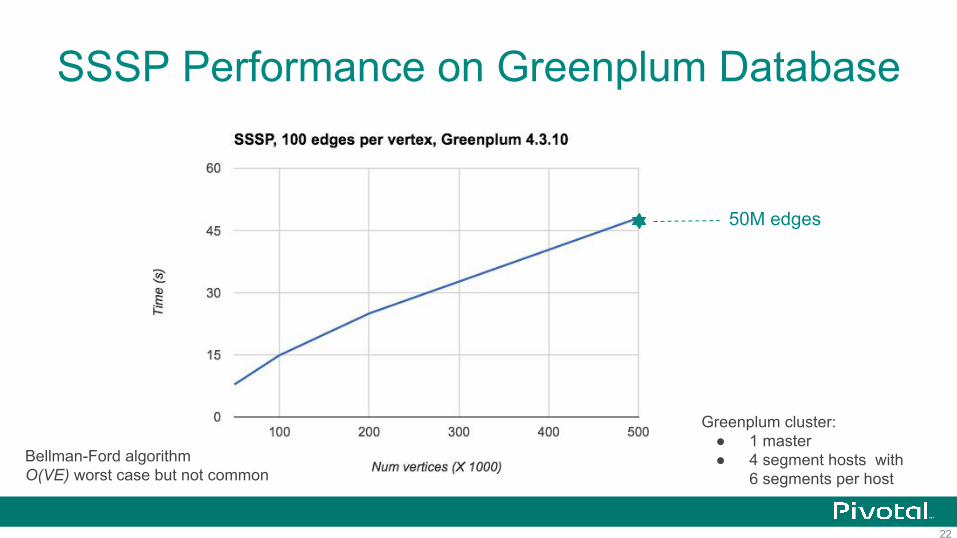
SSSP Performance on Greenplum Database
Greenplum cluster:● 1 master● 4 segment hosts with
6 segments per host
50M edges
Bellman-Ford algorithmO(VE) worst case but not common
23
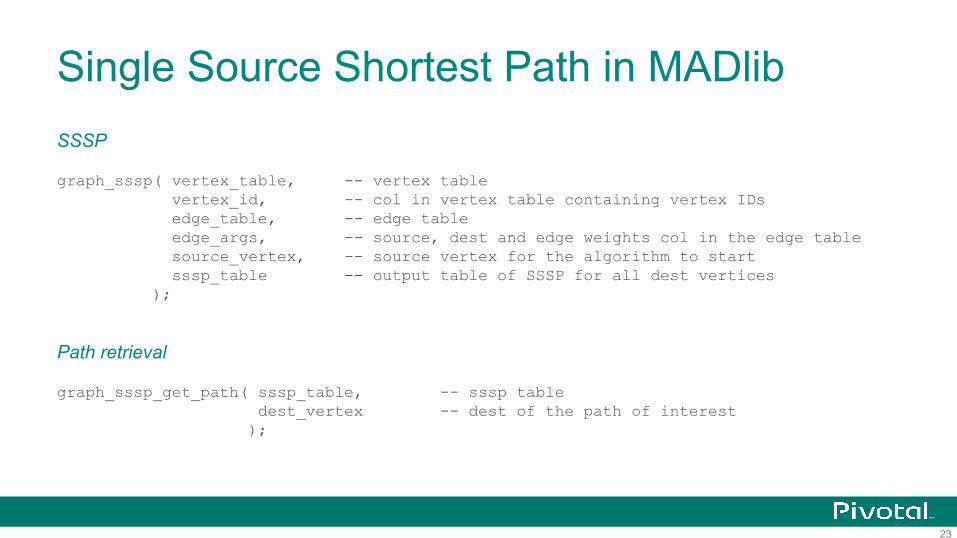
Single Source Shortest Path in MADlibSSSP
graph_sssp( vertex_table, -- vertex table vertex_id, -- col in vertex table containing vertex IDs edge_table, -- edge table edge_args, -- source, dest and edge weights col in the edge table source_vertex, -- source vertex for the algorithm to start sssp_table -- output table of SSSP for all dest vertices
);
Path retrieval
graph_sssp_get_path( sssp_table, -- sssp table dest_vertex -- dest of the path of interest
);
24
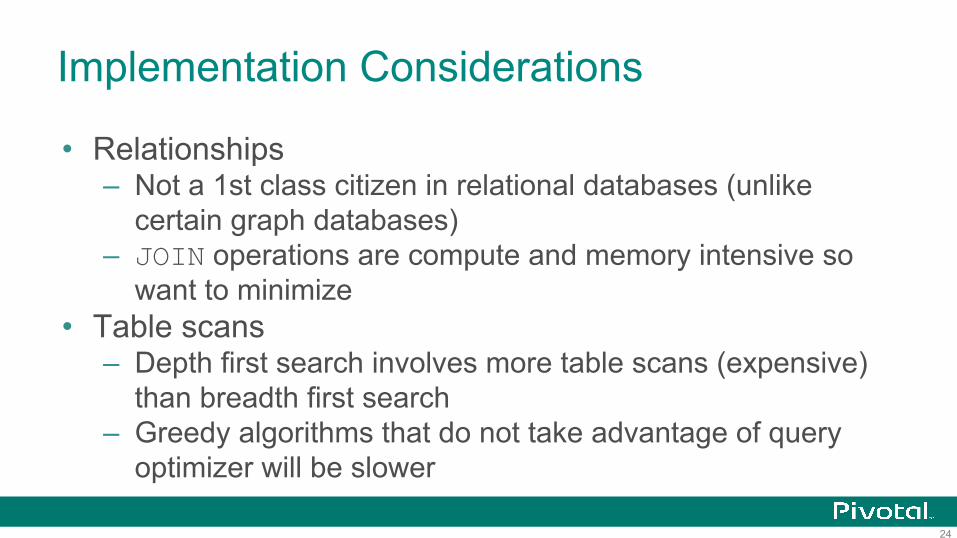
Implementation Considerations
• Relationships– Not a 1st class citizen in relational databases (unlike
certain graph databases)– JOIN operations are compute and memory intensive so
want to minimize• Table scans
– Depth first search involves more table scans (expensive) than breadth first search
– Greedy algorithms that do not take advantage of query optimizer will be slower
25
Implementation Considerations
• Database limits– PostgreSQL limits maximum field size to 1GB
26
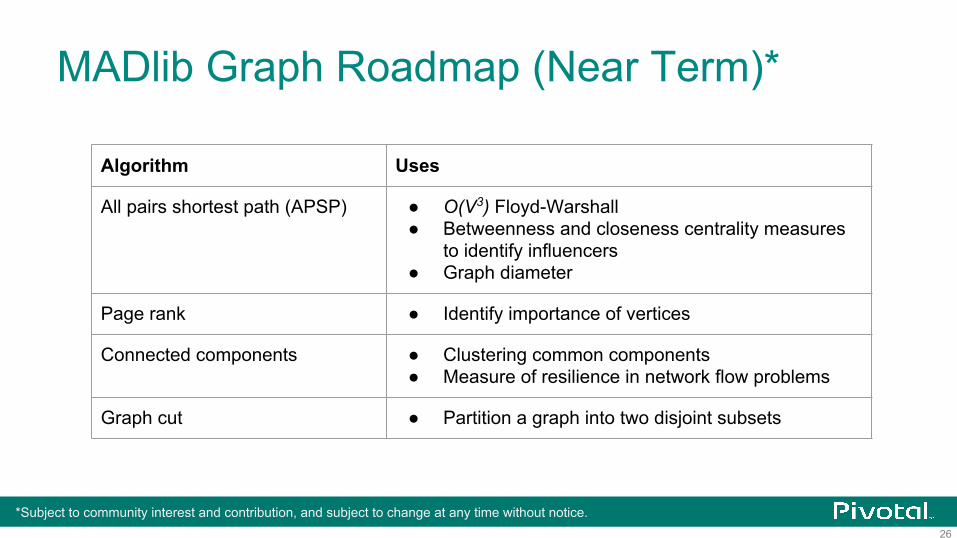
MADlib Graph Roadmap (Near Term)*
*Subject to community interest and contribution, and subject to change at any time without notice.
Algorithm Uses
All pairs shortest path (APSP) ● O(V3) Floyd-Warshall● Betweenness and closeness centrality measures
to identify influencers● Graph diameter
Page rank ● Identify importance of vertices
Connected components ● Clustering common components● Measure of resilience in network flow problems
Graph cut ● Partition a graph into two disjoint subsets
27
Cybersecurity ExampleLateral Movement Detection
cover this square with an image (540 x 480 pixels)
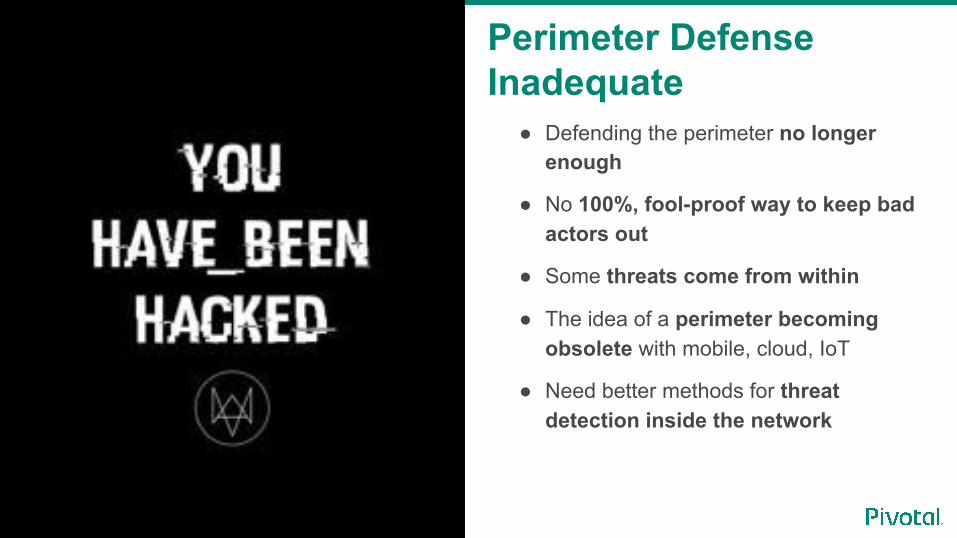
● Defending the perimeter no longer enough
● No 100%, fool-proof way to keep bad actors out
● Some threats come from within
● The idea of a perimeter becoming obsolete with mobile, cloud, IoT
● Need better methods for threat detection inside the network
Perimeter Defense Inadequate
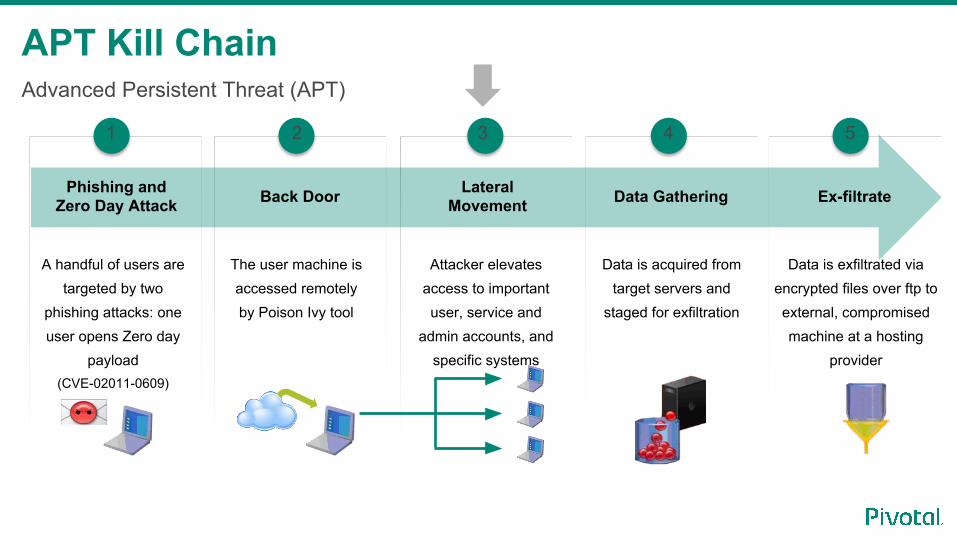
Advanced Persistent Threat (APT)
A handful of users are targeted by two
phishing attacks: one user opens Zero day
payload (CVE-02011-0609)
The user machine is accessed remotely by Poison Ivy tool
Attacker elevates access to important user, service and
admin accounts, and specific systems
Data is acquired from target servers and
staged for exfiltration
Data is exfiltrated via encrypted files over ftp to external, compromised machine at a hosting
provider
Phishing and Zero Day Attack Back Door Lateral
Movement Data Gathering Ex-filtrate
1 2 3 4 5
APT Kill Chain
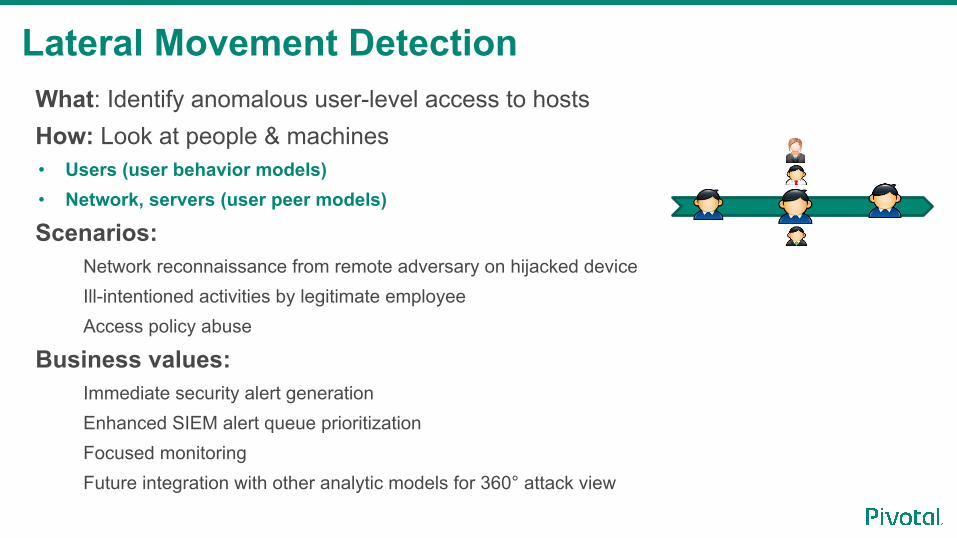
What: Identify anomalous user-level access to hostsHow: Look at people & machines• Users (user behavior models)• Network, servers (user peer models)
Scenarios: Network reconnaissance from remote adversary on hijacked deviceIll-intentioned activities by legitimate employeeAccess policy abuse
Business values:Immediate security alert generation Enhanced SIEM alert queue prioritizationFocused monitoringFuture integration with other analytic models for 360° attack view
Lateral Movement Detection
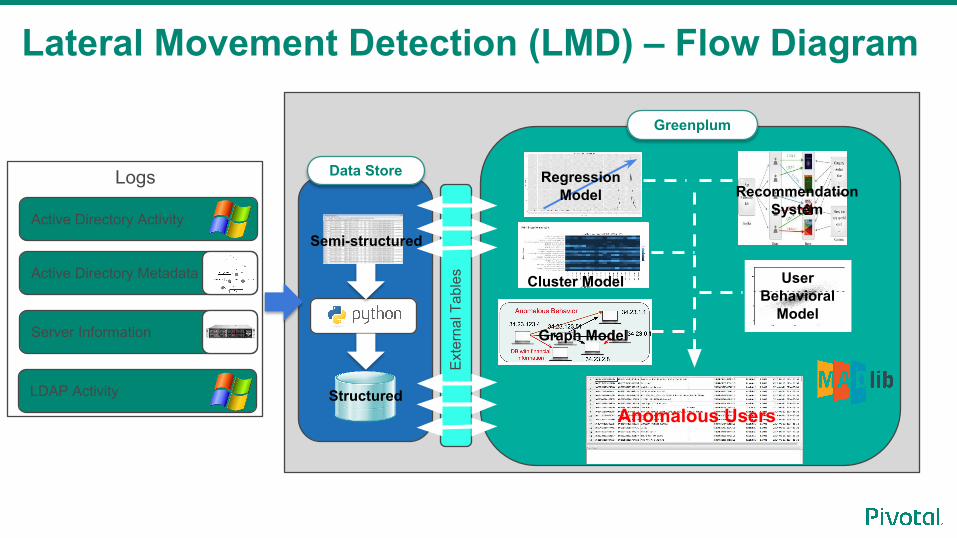
Logs
Active Directory Activity
Active Directory Metadata
Server Information
Structured
Ext
erna
l Tab
les
Semi-structured
Regression Model
Cluster Model
Recommendation System
User Behavioral
Model
Anomalous Users
Greenplum
Data Store
LDAP Activity
Lateral Movement Detection (LMD) – Flow Diagram
Graph Model
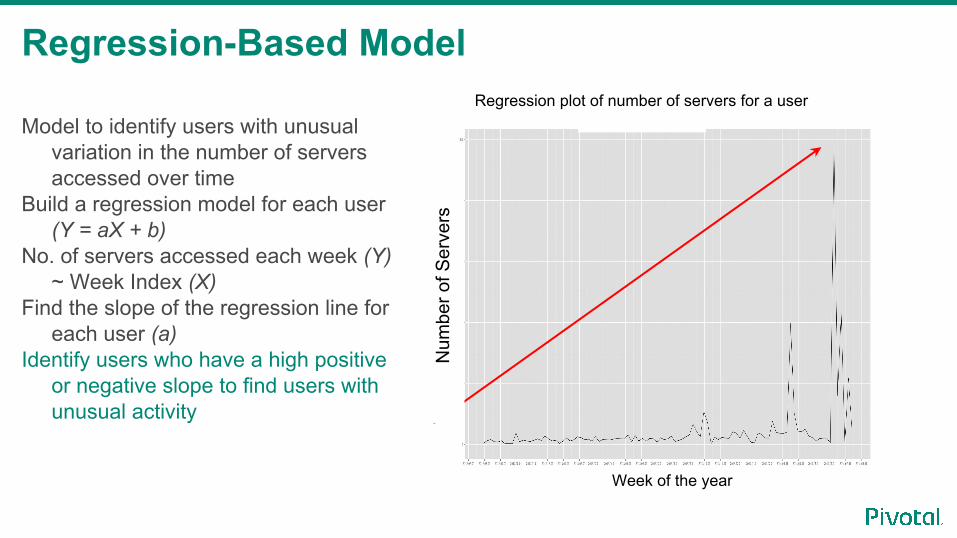
Model to identify users with unusual variation in the number of servers accessed over time
Build a regression model for each user (Y = aX + b)
No. of servers accessed each week (Y) ~ Week Index (X)
Find the slope of the regression line for each user (a)
Identify users who have a high positive or negative slope to find users with unusual activity
Num
ber o
f Ser
vers
Week of the year
Regression plot of number of servers for a user
Regression-Based Model
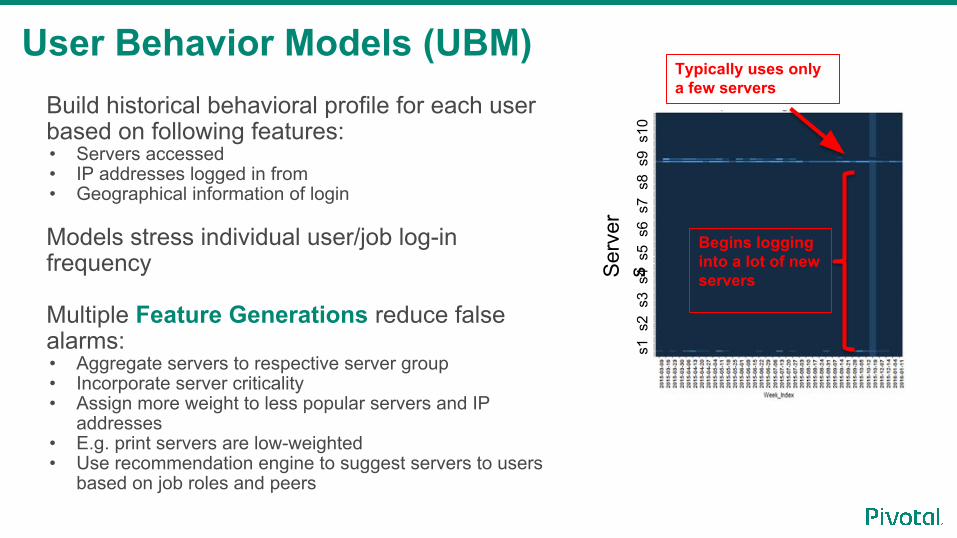
Build historical behavioral profile for each user based on following features:• Servers accessed• IP addresses logged in from• Geographical information of login
Models stress individual user/job log-in frequency
Multiple Feature Generations reduce false alarms:• Aggregate servers to respective server group• Incorporate server criticality • Assign more weight to less popular servers and IP
addresses • E.g. print servers are low-weighted• Use recommendation engine to suggest servers to users
based on job roles and peers
Ser
ver
ss1
s2
s3
s4
s5
s6
s7
s8
s9
s10
Typically uses onlya few servers
Begins logging into a lot of new servers
User Behavior Models (UBM)
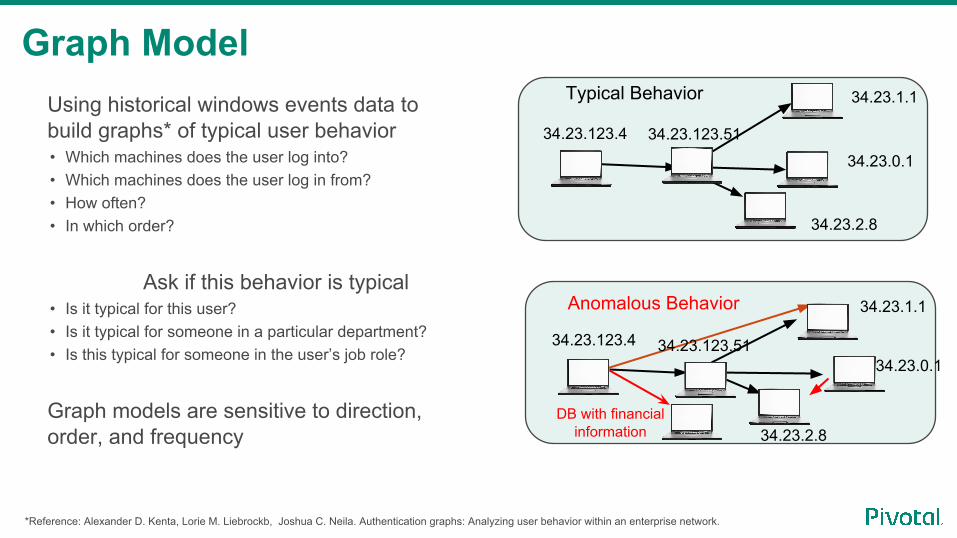
Using historical windows events data to build graphs* of typical user behavior• Which machines does the user log into?• Which machines does the user log in from?• How often?• In which order?
Ask if this behavior is typical• Is it typical for this user?• Is it typical for someone in a particular department?• Is this typical for someone in the user’s job role?
Graph models are sensitive to direction, order, and frequency
34.23.123.4
Typical Behavior
Anomalous Behavior
DB with financialinformation
34.23.123.51
34.23.1.1
34.23.0.1
34.23.2.8
34.23.123.4
34.23.1.1
34.23.0.1
34.23.2.8
34.23.123.51
*Reference: Alexander D. Kenta, Lorie M. Liebrockb, Joshua C. Neila. Authentication graphs: Analyzing user behavior within an enterprise network.
Graph Model

35
• 4th Apache MADlib (incubating) release Feb 2017• Project is moving toward top level status
You are welcome to join us!!!

MPP databases effective for graph analytics at scale in the enterprise
36
37
References[1] The case against specialized graph analytics engineshttp://cidrdb.org/cidr2015/Papers/CIDR15_Paper20.pdfhttp://pages.cs.wisc.edu/~jignesh/publ/Grail-slides.pdf
[2] MADlib papershttp://db.cs.berkeley.edu/papers/vldb09-madskills.pdfhttps://www2.eecs.berkeley.edu/Pubs/TechRpts/2012/EECS-2012-38.pdf
[3] Bellman-Ford algorithmR. Bellman, “On a routing problem,” Quarterly of applied mathematics (1958), pp. 87–90.L. R. Ford Jr, “Network flow theory,” Tech. rep. DTIC Document, 1956.
[4] Alexander D. Kenta, Lorie M. Liebrock, Joshua C. Neila, “Authentication graphs: Analyzing user behavior within an enterprise network”
38
Apache MADlib Resources• Web site
– http://madlib.incubator.apache.org/
• Wiki– http://incubator.apache.org/projects/madli
b.html
• User docs– http://madlib.incubator.apache.org/docs/l
atest/index.html
• Technical docs– http://madlib.incubator.apache.org/design
• Pivotal commercial site– http://pivotal.io/madlib
• Mailing lists and JIRAs– https://mail-archives.apache.org/mod_mb
ox/incubator-madlib-dev/– http://mail-archives.apache.org/mod_mbo
x/incubator-madlib-user/– https://issues.apache.org/jira/browse/MA
DLIB
• PivotalR– https://cran.r-project.org/web/packages/Pi
votalR/index.html
• Github– https://github.com/apache/incubator-madl
ib– https://github.com/pivotalsoftware/Pivotal
R
39
Thank you!
40
Backup Slides
41
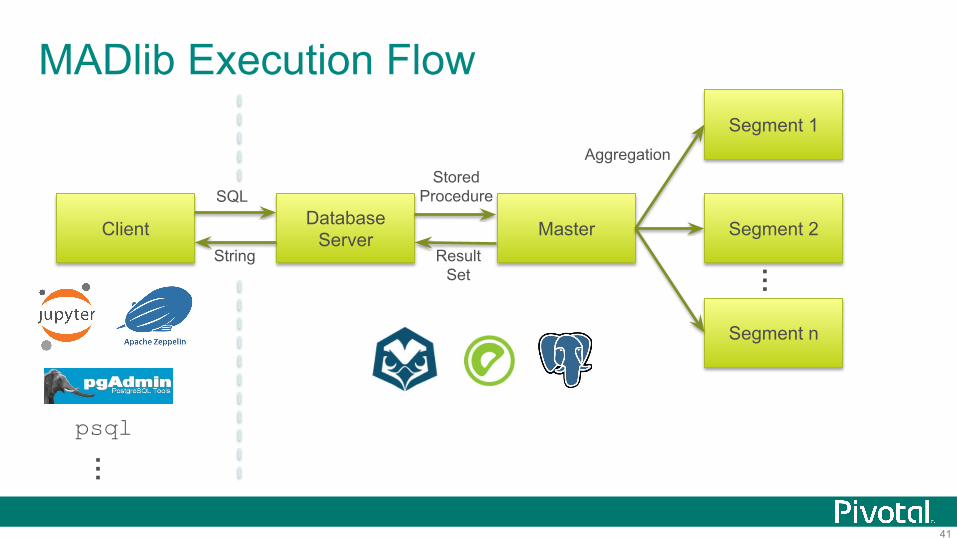
MADlib Execution Flow
Client Database Server Master
Segment 1
Segment 2
Segment n
…SQL
StoredProcedure
ResultSet
String
Aggregation
psql
…
42
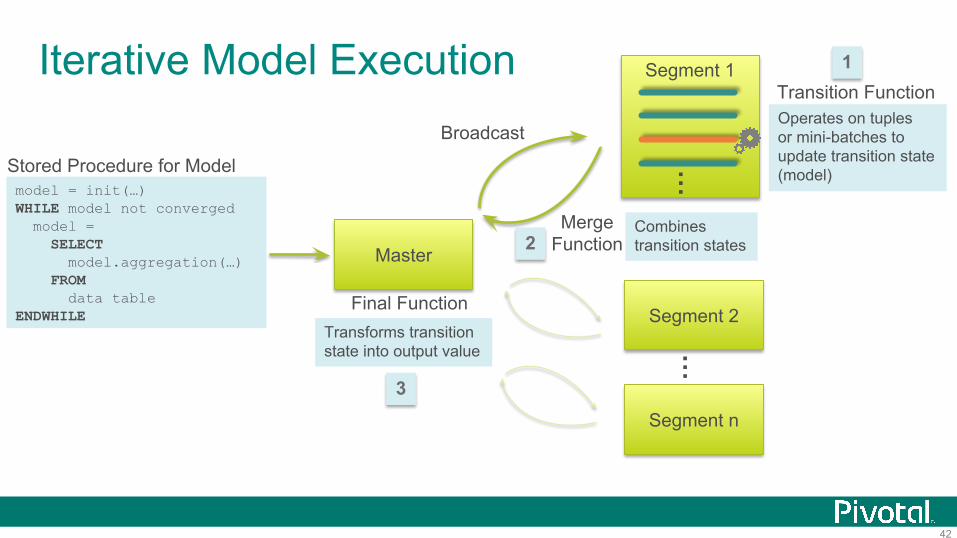
Iterative Model Execution
Master
model = init(…)WHILE model not converged model = SELECT model.aggregation(…) FROM data tableENDWHILE
Stored Procedure for Model …
Broadcast
Segment 2
Segment n
…
Transition FunctionOperates on tuplesor mini-batches to update transition state (model)
1
MergeFunction
Combinestransition states2
Final FunctionTransforms transitionstate into output value
3
Segment 1
43
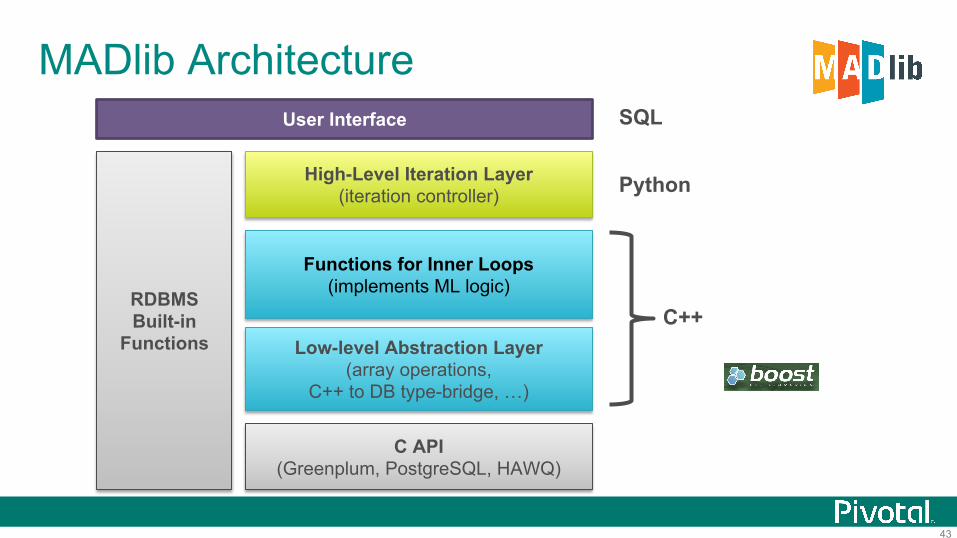
MADlib Architecture
C API(Greenplum, PostgreSQL, HAWQ)
Low-level Abstraction Layer(array operations,
C++ to DB type-bridge, …)
RDBMSBuilt-in
Functions
User Interface
High-Level Iteration Layer(iteration controller)
Functions for Inner Loops(implements ML logic)
Python
SQL
C++
44
POLYMORPHICSTORAGE
HEAP, Append Only, Columnar, External,
Compression
MULTI-VERSIONCONCURRENCY
CONTROL (MVCC)
SYST
EM
AC
CES
SD
ATA
PR
OC
ESSI
NG
DA
TA
STO
RA
GE
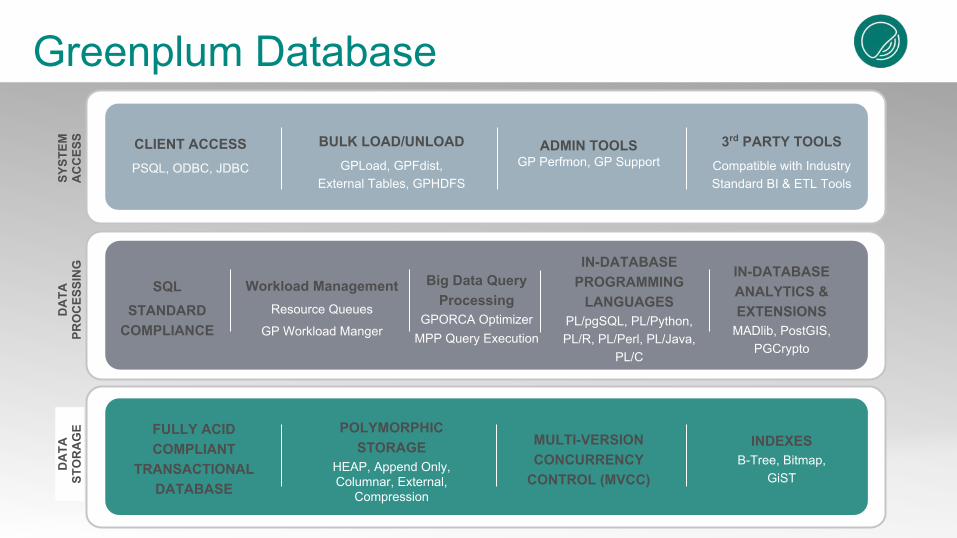
CLIENT ACCESSPSQL, ODBC, JDBC
BULK LOAD/UNLOADGPLoad, GPFdist,
External Tables, GPHDFS
ADMIN TOOLSGP Perfmon, GP Support
3rd PARTY TOOLSCompatible with Industry Standard BI & ETL Tools
SQL STANDARD
COMPLIANCE
Workload ManagementResource Queues
GP Workload Manger
IN-DATABASE PROGRAMMING
LANGUAGESPL/pgSQL, PL/Python,PL/R, PL/Perl, PL/Java,
PL/C
IN-DATABASE ANALYTICS &EXTENSIONS
MADlib, PostGIS,PGCrypto
FULLY ACID COMPLIANT
TRANSACTIONALDATABASE
INDEXESB-Tree, Bitmap,
GiST
Big Data Query Processing
GPORCA OptimizerMPP Query Execution
Greenplum Database
45
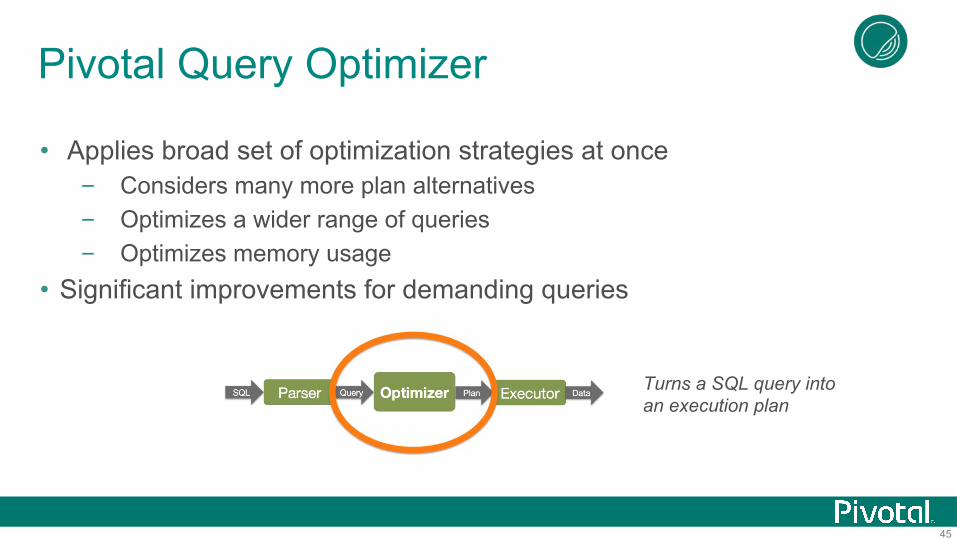
Pivotal Query Optimizer
Turns a SQL query into an execution plan
• Applies broad set of optimization strategies at once– Considers many more plan alternatives– Optimizes a wider range of queries– Optimizes memory usage
• Significant improvements for demanding queries
cover this square with an image (540 x 480 pixels)
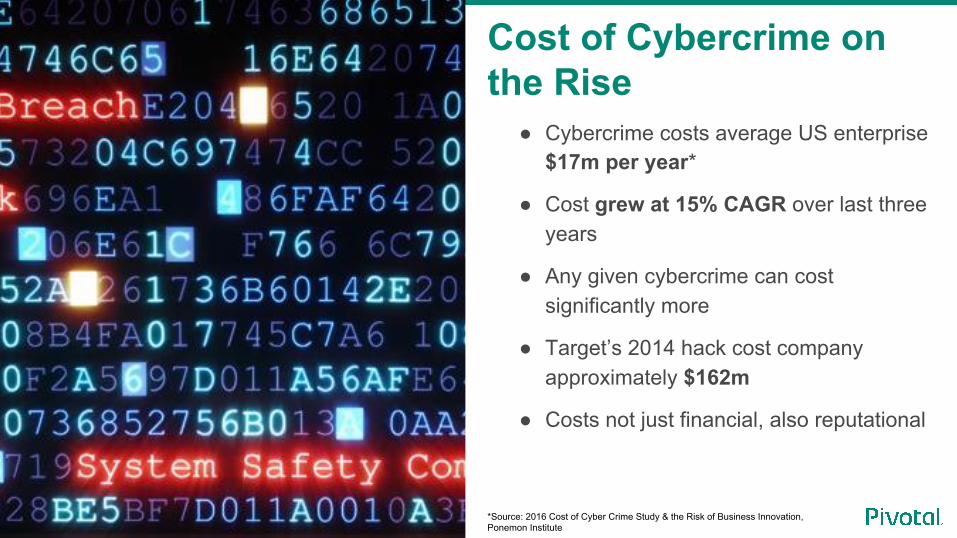
● Cybercrime costs average US enterprise $17m per year*
● Cost grew at 15% CAGR over last three years
● Any given cybercrime can cost significantly more
● Target’s 2014 hack cost company approximately $162m
● Costs not just financial, also reputational
Cost of Cybercrime on the Rise
*Source: 2016 Cost of Cyber Crime Study & the Risk of Business Innovation, Ponemon Institute