Process simulation of manufacturing SS Wiener Sausages
76
Process simulation of manufacturing SS Wiener Sausages Thesis of 30 ECTS credits submitted to the School of Science and Engineering at Reykjavík University in partial fulfillment of the requirements for the degree of Master of Science (M.Sc.) in Engineering Management June 2019 Supervisors: Dr. Páll Jensson, Supervisor Professor, Reykjavík University, Iceland Sigurður Óli Gestsson Engineer, Managing Director, Rhino Aviation, Iceland Examiner: Ingólfur Þór Ágústsson, Examiner Engineer, Director of Manufacturing, Marel, Iceland
Transcript of Process simulation of manufacturing SS Wiener Sausages

Process simulation of manufacturing
SS Wiener Sausages
Thesis of 30 ECTS credits submitted to the School of Science and Engineering
at Reykjavík University in partial fulfillment of the requirements for the degree of
Master of Science (M.Sc.) in Engineering
Management
June 2019
Supervisors:
Dr. Páll Jensson, Supervisor
Professor, Reykjavík University, Iceland
Sigurður Óli Gestsson
Engineer, Managing Director, Rhino Aviation, Iceland
Examiner:
Ingólfur Þór Ágústsson, Examiner
Engineer, Director of Manufacturing, Marel, Iceland

ii
Copyright
Daði Geir Samúelsson
June 2019

iv

Process simulation of manufacturing SS Wiener Sausages
Daði Geir Samúelsson
June 2019
Abstract
Sláturfélag Suðurlands svf is the biggest producer of Wiener Sausages for the
Icelandic market. The sausages are the most valuable brand the company has. The
demand is very seasonal and cannot be stored. Therefore the production must be
able to double over the summertime compared to the wintertime. SS is producing
the sausages every workday over the year. It is essential to have a good overview
of all processes in the system and to know the maximum throughput the system
can handle. Continuous improvements has to be ongoing every day.
Simulation is a useful tool to analyze, investigate, and test new methods and layout
within production systems. The study aims to analyze and simulate the production
process of SS Wiener Sausages in order to gain a better knowledge of the capability
of the process, to know if bottlenecks are in the system, and to be able to test
different scenarios of starting conditions and layouts. The software Simul8 was
used to do the simulation. Based on average yearly production, the current layout
of the process was set up as a model, and the flow analyzed for different starting
conditions. Different setups of the process were tested where new ovens and rapid
cooler were added into the system.
The results indicated that the current system could handle the average production
without any significant problems but when the demand increases some action is
needed to get better throughput. The result also indicated where threats of
bottlenecks are, and possible action is listed to minimize the threats. To be able to
get more throughput and make the flow better to meet increasing demand, one has
to look at more automation and invest in more machines.
Keywords: Simulation, production process, meat processing, sausages, bottlenecks

vi

Hermun framleiðsluferils SS vínarpylsna
Daði Geir Samúelsson
Júní 2019
Útdráttur
Sláturfélag Suðurlands svf framleiðir mikið magn af vínarpylsum á hverju ári á
Íslandsmarkað og eru pylsurnar verðmætasta vörumerkið sem fyrirtækið
framleiðir. Framleiðslan er mjög árstíðabundin og þarf hún að geta allt að
tvöfaldast miðað við vetrartímann til að geta annað eftirspurninni. Þar sem verið er
að framleiða pylsurnar alla virka daga ársins skiptir máli að þekkja vel alla ferla í
kerfinu og hvað er hægt að ná miklum afköstum út úr ferlinu. Einnig þarf stöðugt
að vinna að úrbótum.
Hermun er gott tæki til að greina, fylgjast með og prufa nýjar aðferðir í
framleiðslukerfum. Markmið verkefnisins er að greina og herma framleiðsluferil
SS pylsna til að vita afkösts hans, hvort flöskuhálsar eru í kerfinu og hvaða áhrif
breytingar geta haft á afköst ferilsins. Forritið Simul8 er notað til að herma. Gengið
er út frá meðalframleiðslu á dag yfir árið og er núverandi framleiðsluferill settur
upp sem líkan og greint hvernig flæðið er. Einnig er líkanið greint út frá tvöföldu
magni. Mismunandi uppsetningar á framleiðsluferlinum eru einnig skoðaðar.
Niðurstöður gefa til kynna að núverandi kerfi höndli án mikilla vandræða meðal
framleiðslumagn en þegar magn eykst þarf að grípa til aðgerða. Benda niðurstöður
til þess að bæta þurfi flæði á nokkrum stöðum og tillögur til úrbóta og áhrif þeirra
greind. Til að geta aukið framleiðslu án mikilla vandkvæða þarf að huga að nýjum
tækjabúnaði og tækni.
Lykilorð: Hermun, framleiðsluferill, kjötvinnsla, pylsur, flöskuhálsar

viii

Process simulation of manufacturing
SS Wiener Sausages
Daði Geir Samúelsson
Thesis of 30 ECTS credits submitted to the School of Science and Engineering at Reykjavík University in partial fulfillment of
the requirements for the degree of
Master of Science (M.Sc.) in Engineering Management
June 2019
Student:
Daði Geir Samúelsson
Supervisors:
Dr. Páll Jensson
Supervisors:
Sigurður Óli Gestsson
Examiner:
Ingólfur Þór Ágústson

x

The undersigned hereby grants permission to the Reykjavík University Library to
reproduce single copies of this Thesis entitled Process simulation of manufacturing SS
Wiener Sausages and to lend or sell such copies for private, scholarly or scientific research
purposes only.
The author reserves all other publication and other rights in association with the copyright
in the Thesis, and except as herein before provided, neither the Thesis nor any substantial
portion thereof may be printed or otherwise reproduced in any material form whatsoever
without the author’s prior written permission.
date
Daði Geir Samúelsson
Master of Science

xii

“All models are wrong; some models are useful.”
-George E. P. Box

xiv

Acknowledgements
To my supervisors, Páll Jensson and Sigurður Óli Gestsson, I would like to thank for
their guidance and endless support throughout this project.
To Reynir Björvinsson, Anna Runólfsdóttir, Jónas Helgason, Bjarki Freyr
Sigurjónsson and Hafþór Úlfarsson at SS for providing me with all the information and data
as well for endless pation in answering every question I had regarding the manufacturing
process of making Wiener Sausages.
Special thanks to every other employee at SS that I needed to communicate with, for
always giving me the time and information I needed.
To Berglind Dúna Sigurðardóttir, who took the time to proofread the thesis.
Finally, to my beloved family that always stood beside me, supported and listened to
me, throughout the process.

xvi
Confidential, edited edition
Because of confidentiality, key numbers and description of processes will not be shown

xvii
Contents
Acknowledgements ............................................................................................................ xv
Contents ............................................................................................................................xvii
List of Figures ................................................................................................................... xix
List of Tables ...................................................................................................................... xx
Definitions.......................................................................................................................... xxi
1 Introduction ...................................................................................................................... 1
1.1 Background ............................................................................................................. 1
1.2 Problem Description ............................................................................................... 1
1.2.1 The Aim ...................................................................................................... 2
1.2.2 Research Questions .................................................................................... 2
1.3 Outline of the Thesis ............................................................................................... 3
2 Literature review .............................................................................................................. 4
2.1 Research and Reports in Icelandic Agriculture ...................................................... 4
2.2 Research and Reports in Icelandic Industry using Simulation ............................... 6
3 The Meat Plant.................................................................................................................. 9
3.1 The Wiener Sausages ............................................................................................ 10
3.1.1 The process of making SS Wiener Sausage ............................................. 13
3.2 Data Collection ..................................................................................................... 16
4 The simulation model ..................................................................................................... 19
4.1 Model of Current state .......................................................................................... 19
4.2 Validation and Verification .................................................................................. 26
4.2.1 Validation ................................................................................................. 26
4.2.2 Verification ............................................................................................... 27
5 Results .............................................................................................................................. 28
5.1 The Current Situation............................................................................................ 28
5.1.1 The Average Production ........................................................................... 28
5.1.2 The Extreme Case .................................................................................... 31
5.1.3 The Upper Limit ....................................................................................... 33
5.2 Possible Changes .................................................................................................. 34
5.2.1 The Average Case, Two Rapid Coolers ................................................... 34
5.2.2 Two ovens with rapid cooler included ..................................................... 36
5.2.3 Bottleneck in Packing ............................................................................... 38
6 Conclusion ....................................................................................................................... 41
7 Bibliography .................................................................................................................... 43
8 Appendix A: Data ........................................................................................................... 45
Appendix B: Visual Logic ................................................................................................. 47

xviii
Appendix C: Survey .......................................................................................................... 49
Appendix D: Model ........................................................................................................... 52

xix
List of Figures
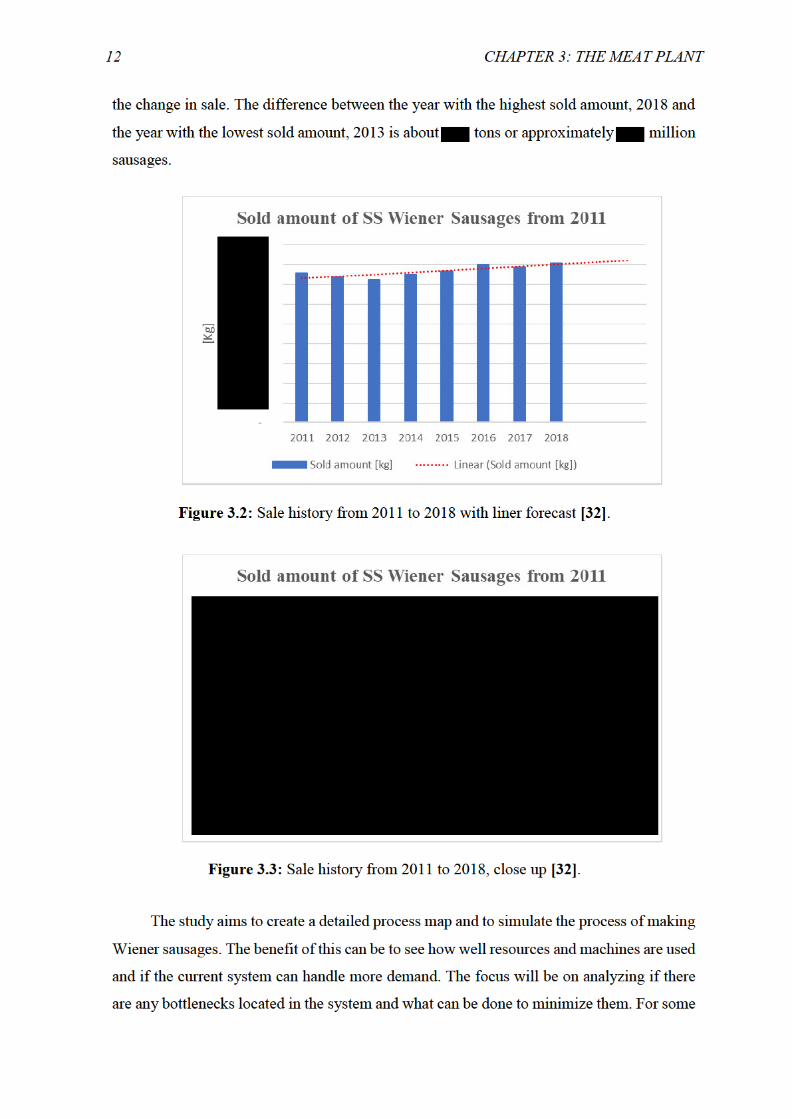
Figure 3.1: Sold sausages per month of 2018 [3]. ................................................................. 11 Figure 3.2: Sale history from 2011 to 2018 with liner forecast [32]. .................................... 12 Figure 3.3: Sale history from 2011 to 2018, close up [32]. ................................................... 12
Figure 3.4: Process flow of Wiener Sausage. ........................................................................ 15
Figure 3.5: Layout and path of Wiener sausage through the facility. ................................... 16
Figure 3.6: Distribution fitting for packaging of 10 sausages. .............................................. 17 Figure 4.1: The Simul8 model of the current SS Wiener Sausages process. ........................ 20 Figure 4.2: The meat mixer ................................................................................................... 22 Figure 4.3: The packaging machine ...................................................................................... 24
Figure 5.1: Simplified process flow. ..................................................................................... 28 Figure 5.2: Changed setup for rapid cooler. .......................................................................... 35
Figure 5.3: Oven with rapid cooler included ......................................................................... 36 Figure 5.4: Average time in the system, current state vs. rapid cooler included in oven. ..... 37 Figure 5.5: Survey results. ..................................................................................................... 39
Figure D.1: Model part I ........................................................................................................ 52 Figure D.2: Model part II ...................................................................................................... 53
Figure D.3: Model part III ..................................................................................................... 53

xx
List of Tables
Table 3.1: Meat Production 2018, Iceland and SS [25] [26, p. 6]. ............................................9
Table 3.2: Sold amount of SS wiener sausages in 2018 [3]. ...................................................10 Table 3.3: Revenue of sold Wiener Sausages 2018 [30]. ........................................................11
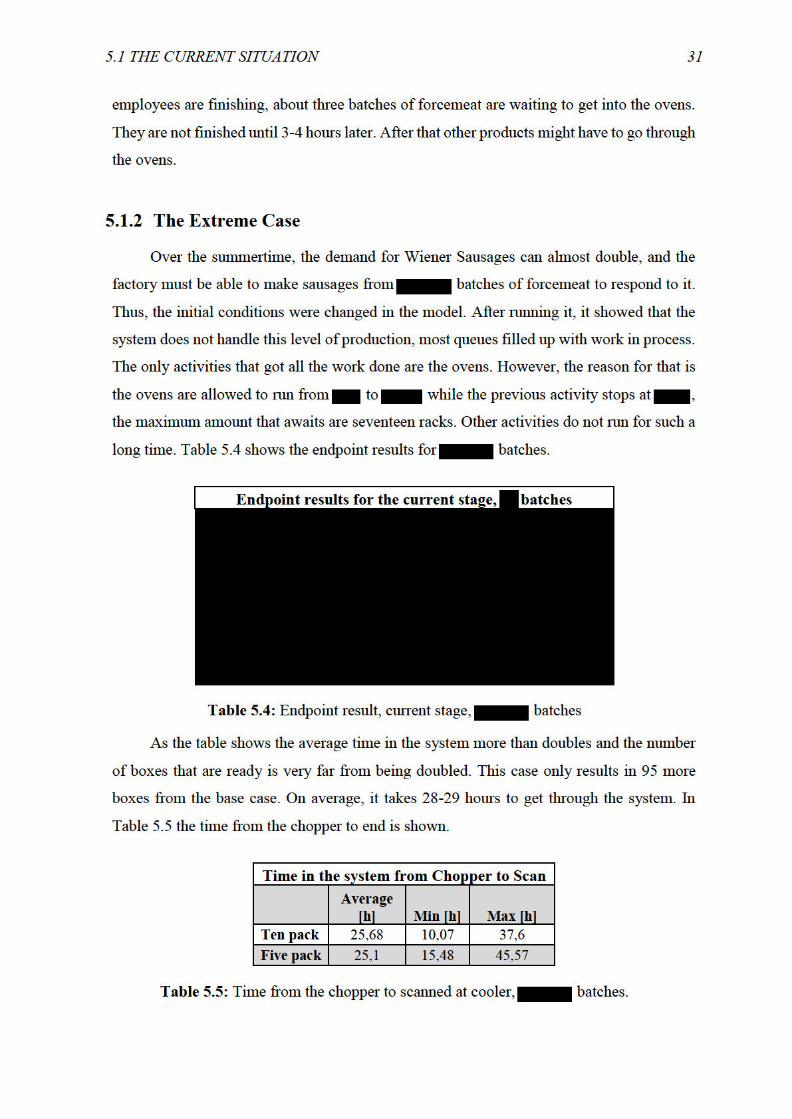
Table 4.1: Resource availability ..............................................................................................25 Table 4.2: Availability during simulation ...............................................................................26 Table 5.1: Endpoint result, current stage, batches of forcemeat ......................................29 Table 5.2: Time from the chopper to scanned at cooler, batches of forcemeat. ..............30
Table 5.3: Resources utilization, batches of forcemeat ...................................................30 Table 5.4: Endpoint result, current stage, batches ....................................................31
Table 5.5: Time from the chopper to scanned at cooler, batches. ............................31 Table 5.6: Resources utilization, batches. ..........................................................................32 Table 5.7: Endpoint result, current stage, batches. ......................................................33
Table 5.8: Resources utilization, batches. ....................................................................33 Table 5.9: Endpoint results for two rapid cooler, batches. ..............................................35
Table 5.10: Time in the system, comparison between one and two rapid coolers. .................36
Table 5.11: Endpoint results for two ovens including rapid cooler, batches. ..................37
Table 5.12: Rough profitability assessment ............................................................................40

xxi
Definitions
Work item: The item that work is being applied to in the simulation.
Start point: The input to the simulation model. Work items flow from the start point
into the model.
Activity: Where work is done on the work items in the model.
Resource: Are items in the simulation that does labor. Some activities require
resources to be able to work on the work item.


1
Chapter 1
Introduction
1.1 Background
Sláturfélag Suðurlands (SS) is a meat processing company that has been operating in
Iceland for over a century. SS is a leading company in its field and is a well-known brand in
Iceland [1]. Their operations are located in two locations in the south part of Iceland, Selfoss,
where the slaughterhouse is located, and Hvolsvöllur, where the meat processing plant is
located [2]. SS’s most valuable product is the SS Wiener Sausage (Icelandic: vínarpylsa)
and has a dominant market share of over 70% in the Icelandic sausages market. The sale of
Wiener sausages has increased over the years and in 2018 about sausages were
sold [3]. The sale is seasonally dependent and doubles over the summertime. Storage is not
possible for more than 7-10 days. Therefore, the production of the sausages has to be able
to meet this fluctuation demand [3].
1.2 Problem Description
The Theory of Constraints [4] looks at manufacturing processes as chains, and the
total throughput can never be more than the weakest link. The theory aim is to identify this
weak link and strengthening it to make the whole chains stronger. This weak link is often
referred to as a bottleneck. It does not help to produce and make a non-bottleneck station
more efficient and more proactive since the bottleneck will always control the total output
of the system.
The Lean Management methodology [5] identifies seven significants wastes that every
company should try to minimize as much as possible. They are:
• Overproduction: making more than is needed.
• Waiting: work-in-process that is waiting to be worked on.
• Transport: movement of raw materials, work-in-process, and finished goods
that is unnecessary.
• Motion: movement of people that do not add value to the product.

2 CHAPTER 1: INTRODUCTION
• Overprocessing: processing more than the customer wants.
• Inventory: more than needed to meet an immediate need.
• Defects: the production that needs rework or is scrap.
The process of making SS Wiener Sausages consists of many different factors that all
play a role in making this locally well-known Icelandic product. Thus, it can be hard to have
a clear overview of all these critical factors. Moreover, the same machines and resources
that are used to make the sausages are used in producing other products.
One of SS’s future goals is to the Wiener sausages. With
the increasing demand, the seasonally depended sales, and SS’s future plans, it is important
to know the current capability of the production process. It is important to investigate the
throughput of the process, the resource usage, bottlenecks, and the process wastes.
Furthermore, the SS Wiener sausage is the company’s most valuable product, and thus
increasing efficiency in the production process can be beneficial.
1.2.1 The Aim
The study aims to give a good overview of the process flow of making the Wiener
Sausages, from raw material to products that are ready for distribution, using discrete event
simulation. Most critical factors will be identified along with bottlenecks and potential
bottlenecks. Advice and possible solutions will be given on what can be done to increase the
process efficiency and capability of handling more throughput. The simulation software
Simul8 will be used to help achieve the goal of the study.
1.2.2 Research Questions
The study will focus on answering the following questions, related to the production
process of Wiener sausages at SS:
1. What does the current process look like?
2. Are there any identifiable bottlenecks in the process?
3. Are there some identifiable wastes in the process?
4. How much production can the current process handle?
5. What can be done to improve the process?

1.3 OUTLINE OF THE THESIS 3
1.3 Outline of the Thesis
This thesis is built up in the following way. Chapter 2 consists of reviews of research
that has been conducted in Iceland within the field of operations research in the agricultural
industry and research in Iceland where simulation has been used. Chapter 3 provides detailed
information about SS as a company, the process of making the Wiener sausages, the layout
of the facility, and the data collection. The simulation model of the current process of
sausage making is described in detail in Chapter 4. The results from the study are presented
in Chapter 5, and finally in Chapter 6 discussion and conclusion is covered.

4 CHAPTER 2: LITERATURE REVIEW
Chapter 2
Literature review
Operations Research methods, like optimization and discrete event simulation, have
not been widely used within the agricultural industry in Iceland. However, some
optimization and simulation research projects have been conducted, both for bigger meat
facilities and the dairy industry. Framleiðnisjóður landbúnaðarins (FL) is a research fund
founded by the Icelandic parliament. The fund’s purpose is to support individuals,
researchers and companies in the agricultural industry doing projects that will potentially
lead to increased productivity and efficiency. FL has been operating every year since the
foundation in 1966 [6]. The fund supported projects for over 120 million ISK in 2017, but
very few of them can be related to the methodology of optimization or simulation [7].
Most of the reports and research that have been made within the field of operational
research in the Icelandic agricultural industry are about optimization models for the dairy
industry. Simulation has not been used as extensively for this purpose. In this chapter, we
will look briefly at some projects that have been conducted in Icelandic agriculture using
Operational Research, and, furthermore, what has been done in other Icelandic industries
using simulation.
2.1 Research and Reports in Icelandic Agriculture
Professor Páll Jensson is one of the most active researchers in the field of using
optimization and simulation in the Icelandic agriculture and fishing industries.
In [8], Páll Jensson et al. (1978) described a project where they designed a
mathematical model, to find economical ways to transport hay from areas that had a good
harvest to areas that needed more grass. They compared the cost of buying hay from another
area to the cost of buying more compound feed instead of hay. They also examined the cost
of purchasing hay to the cost of decreasing the number of livestock, by sending them to
slaughter. Linear optimization was used for the model, where the objective was to find the

2.1 RESEARCH AND REPORTS IN ICELANDIC AGRICULTURE
5
optimal combination between hay transportation, buying compound feed and slaughter.
Constraints, in this case, were the minimum amount of feed each livestock needed, and travel
distance. The result was that hay transportation was not an optimal solution, except when
the distance was very short. This research was probably one of the first documented projects
in Icelandic agriculture, where operation research was used [8].
In [9], Páll Jensson et al. (1980) used linear optimization to make production planning
for dairy farms in Iceland. At the time the study was conducted, overproduction was starting
to be a problem. A mathematical model was created, with the aim of helping farmers to
operate their farms, in the most efficient way as possible. The goal was to minimize the
variable cost with the constraints of maximum production, minimum feed for the cattle,
farmland size, and other factors. They looked at how a bought amount of fertilizer,
harvesting time, farmland size, and compound feed cost could be changed to lower the
operation cost while meeting the demand for maximum milk production. They tried it with
different scenarios to see what factors had the most effect. The model gave farmers a tool
that could help with estimating possible ways to reduce cost but still meet the necessary
demand.
In [10], Páll Jensson (1999) described his work on optimizing the number of dairy
factories in Iceland. At the time the study was conducted, the dairy factories were considered
to be too many compared to the amount of milk produced. The goal was to have fewer but
bigger factories at the optimal locations, that would lead to lower operating and
transportation expenses. These factories would have the capability to produce in larger
scales, and each factory would specialize in fewer products. To solve the problem, a mixed
integer plant location model was developed, that helped with decision making. The modeling
language Mathematical Programming Language (MPL), was used to solve the problem.
Constraints in the model were, for example, the amount of raw milk in each place, demand
for products with low shelf life in each area, and the amount of cream used in production at
each location.
In [11], Þóra Valsdóttir et al. (2010) worked on finding ways to improve the food value
chain, by investigating fresh meat products. The food value chain is known to contain a
significant amount of wastes due to, for example, inadequate logistics, wrong treatment, and
failure in temperature management. The focus was to identify the wastes and develop actions
to reduce them. Optimization was used to find the optimal ordering times and quantity, to
minimize the waste.
In [12], Dr.Sigríður Sigurðardóttir (2011) analyzed how industrial engineering can be
used in dairy production, with a particular focus on cheese production. She developed a

6 CHAPTER 2: LITERATURE REVIEW
solution for production- and management problem within the dairy facility. A simulation
model was developed for the cheese production, and it helped to detect bottlenecks in the
process. The project was done for the dairy facility of Kaupfélag Skagfirðinga.
In [13], Kamilla Reynisdóttir (2012) used linear optimization to maximize the value
of pork products. Mathematical model was developed to get an optimal production plan, and
it was possible to implement it for different types of carcasses. The project was done in
cooperation with the meat facility company SS, the same facility as will be the focus of this
thesis.
2.2 Research and Reports in Icelandic Industry using
Simulation
Simulation is an imitation of a situation, process, or operations of a real process [14].
It is used to evaluate a model numerically by collecting data in order to estimate the actual
characteristics of the model. Simulation can be used to explore how changes will affect
systems, and thus it can be of help when making decisions about potential changes [15, p.
1]. Systems of simulations are often categorized into two groups, continuous, and discrete
simulation models. The main difference, between these groups, is that discrete systems
change intravenously at separate points in time while continuous systems have state
variables continuously changing in respect of time [15, p. 6;707].
In Iceland, simulation has been used to solve problems related to, for example, fishing,
the aluminum industry, and airport operations [16]. One of the first reported simulation
models, in Iceland, was created by Helgi Sigvaldason et al., in 1969 [17]. In that project, a
simulation model of a fishing trawler, as a raw material supplier for freezing plants in
Iceland, was the focus.
In [18], Páll Jensson (1981) made a simulation model of capelin fishing in Iceland.
Capelin is caught around the country, but most of the processing plants were in the north or
east, at that time. Ships often had to wait to be unloaded because of the limited capability of
the processing plants. The aim of the project was to simulate the movement of capelin and,
moreover, to be able to optimize where to allocate the fleet to maximize the total catch of
fish, considering the fuel cost. It was also used to decide where to unload, to minimize the
ships waiting time.
In [19], Páll Jensson and Ingólfur Arnarson (2006) simulated the behavior of economic
agent with particular emphasis on the use of time recourse. The aim was to make a tool, for
analyzing different kinds of problems within the fishing industry, using simulation. These

2.2 RESEARCH AND REPORTS IN ICELANDIC INDUSTRY USING SIMULATION
7
problems varied from decision situations onboard fishing vessels to occurring issues in
fishery management and legislation. The results were that the time factor in fishery plays a
significant role in economic behavior. They also looked at how different quota systems can
affect the benefits and efficiency in the fishing industry.
In [20], Teitur Birgisson (2012) also worked with discrete event simulation, where he
mapped the process flow of the production of carbon fiber prosthetics, at the Icelandic
innovation and manufacturing company Össur hf. He used simulation to find ways to make
the output more efficient, by detecting bottlenecks and possible changes to react to rising
demand. New possible process layouts and designs were simulated with the aim of
increasing the capacity of the process. This simulation model was made in the software
AutoMod.
In [21], Jón Guðjónsson (2013) looked at how simulation can be used to predict the
performance of a salmon portioning cutting line, for the innovation company Marel. He tried
to find out what salmon size was most suitable for each product that was being made. To be
able to see what proportion of salmon fitted the best, different scenarios were applied to the
study. The aim was to see what significant effects it would have and if it would lead to better
efficiency in the offcut of the salmon in the production line. The simulation model made was
a discrete event simulation model, and the software SIMUL8 was used to create it.
In [22], Hanna Hermannsdóttir (2015) optimized how gates are assigned to different
airplanes at the Keflavík International Airport. The base to solving the problem was to make
a binary optimization model with the aim of minimizing the walking distance of passengers,
use of buses and walk-in gates, and assigning plains with heavy freight the best suitable
spots. The result from the model was tested using simulation, using the software ARCport.
The simulation supported the model and helped to develop it further.
In [23], Sigríður Sigurðardóttir (2016) made a simulation model that was to be used
for fisheries management. Fisheries are essential for food security for a big part of the world,
so countries need to be careful of overfishing the oceans. Overfishing can be disastrous for
many people and nature. In the project, a simulation model was used to see how possible
changes in fisheries management would affect fish species, the workforce, and the economy.
Three different types of simulation tools were used and developed: a hybrid system
dynamics-discrete event simulation model, a system dynamics model, and a model from a
new simulation method inspired by agent flocking.
In [24], Erla Þorsteinsdóttir (2017) looked at how simulation can be used in the
manufacturing process of aluminum extrusions billets at the Icelandic factory of ISAL. In
here research the software SIMUL8 was used. The focus was to see how much each machine
8 CHAPTER 2: LITERATURE REVIEW
could produce and what was the utilization of them. The research showed that the throughput
was high and could even handle more input if necessary.


3.1 THE WIENER SAUSAGES 13
time, SS has been considering adding new equipment to the system, and the study will try
to predict what effect that would have on the system itself.
3.1.1 The process of making SS Wiener Sausage

14 CHAPTER 3: THE MEAT PLANT


3.2 DATA COLLECTION 17
happen and activities that managers at SS are not used to measure. The data was compared
to existing time measurements that are used to calculate the margin of the products. Existing
data was not detailed enough to base on the model and there was also a need for updating
the information in existing data. From the data collected, a distribution could be estimated.
In cases where only few measurements were available for an activity, the average time was
used for the model. For an activity that happens often and within a short period of time,
distribution fitting was possible. The data was collected during February and March 2019.
For distribution fitting, the software @Risk was used to find what distribution would
simulate the activity the best. Figure 3.6 shows how @Risk fitted time measurements from
the packaging machine of ten sausages to a known distribution. In this case, normal
distribution simulated the reality the best. The parameters from the fitting were then used in
the simulation model.
Other essential data for the model was the working hours of the operators in the
process. The division managers provided information about the resource schedule. The time
that employees are at work and the time they are actually productive differs. This has to be
taken into consideration when designing the simulation model.
Figure 3.6: Distribution fitting for packaging of 10 sausages.

18 CHAPTER 3: THE MEAT PLANT
Employees that work in a factory on an 8-hour shift get 0,9 hours in breaks for lunch
and coffee time, because of collective agreements. About 0,8 hours goes into getting starting,
go to the bathroom, chat to other employees, go to lunch, etc. Thus, of the 8-hour workday,
6,3 hours are spent on actual work. The number of working days per year also needs to be
taken into consideration. Of 52 weeks, a full-time employee gets 4-5 weeks for summer
break, three weeks for national holidays and around two weeks for sick leave (2 days allowed
each month through collective agreements) [34].
Time measurements that are used in the simulation are shown in Appendix A: Data.

4.1 MODEL OF CURRENT STATE 19
Chapter 4
The simulation model
Simul8 is the software used to make the model of the process of making SS Wiener
Sausages. The software was chosen because it is user-friendly and visualizes discrete event
simulation models of processes. To minimize constraints, regarding the software and to
maximize accuracy, the Professional version of Simul8 was used. The primary attributes in
Simul8 are; Start Point where the item that is simulated arrives in the system, Queues store
the work item before or after getting worked on, if it is not possible for the item to go further,
Activity has a defined distribution that simulates the operation time that takes to do the work,
and in many cases, Resource is needed at an Activity to perform the work. Hereinafter,
Resource will be called Employee for clarity purposes. When the item is at the end of the
simulation process, it arrives at the End, which keeps tracks of the total time in the system.
Routing Arrows are used to connect Start Point, Queue, Activity, and End and thus, make a
flow.
4.1 Model of Current state

20 CHAPTER 4: THE SIMULATION MODEL
Figure 4.1: The Simul8 model of the current SS Wiener Sausages process.

4.1 MODEL OF CURRENT STATE 21
The simulation model of the Wiener Sausages can be seen in Figure 4.1 and in smaller
parts in Appendix D: Model. The simulation represents one working week. The first day is
used to initialize the inventory and to bring the system into balance. The remaining four
days, in the model, are used for data collection. Each day has a duration of fifteen hours, it
starts at 05:00 and ends at 20:00. The model has four start points, one for each main
ingredient: Fresh meat, Frozen meat, Dry ingredients, and Ice cubes and water. The base
unit, in the model, is one batch of forcemeat, that is approximately 400 kg, which gives
around 360 kg of Wiener sausages. The ratio between ingredients, from the start point, in
the mixture is the following:
• Fresh meat:
• Frozen meat:
• Dry ingredients:
• Ice cubes and water:
The simulation starts with the arrival of ingredients at the beginning of the first day.
All the needed fresh meat, for the whole week, arrives at the beginning of the first day. The
other ingredients arrive each day, in a suitable amount for that particular day. From the start
point of Fresh meat, Boning is the first activity and on average there are operators that
can work simultaneously, so the activity is replicated times. Thereafter, the activity Mince
and salt the meat collects 14 units from Boning, and the output is a single batch of forcemeat.
From the start point of Frozen meat, Collect from freezer is the first activity. To
simplify the model, that activity also starts at 05:00 in the simulation model however in real
life, it happens on the day before. The Mixing employee has to go to the freezer and move
the meat to the Chopper. In the model, nine units are collected at each time. Chopper activity
needs one Mixing employee and it collects two units, one from the fresh meat path and one
from the frozen. At the activity, frozen meat is chopped down into two containers, and the
mincemeat is added into the containers and weighted. The output is a single unit, which
represents both of the containers.
From the start point of Dry ingredients, Collect dry in is the first activity, which
requires one Mixing employee. The activity collects twelve units of dry ingredients and
returns twelve units to the following queue. The activity does not collect again until the
queue that follows is empty, then new portions are collected. The constraint is programmed
in Visual Logic (see Appendix B: Visual Logic). From the start point of Ice cubes and water,
Collect ice is the first activity. It has the same condition as Collect dry in, except for the fact
that it collects eight units, instead of twelve.


4.1 MODEL OF CURRENT STATE 23
separate activities in the model, for each oven: Smoke and boil 1a and 1b, and Smoke and
boil 2a and 2b. This is done to control the loading of the ovens, in the model. The duration
of Smoke and boil 1a and 2a is minutes, an if-statement is used in Visual Logic to decide
when the activities are allowed to collect (see Appendix B: Visual Logic). For example, if
Smoke and boil 1a and 1b are empty, the former will not collect again until Smoke and boil
2a is empty as well, which represents the first minutes of the oven process being finished.
The same applies to Smoke and boil 2a and 2b. All the Smoke and boil activities collect three
units and return three units as well (see Figure D.2).
Load Rapid Cooler uses one Moving employee. The activity collects one unit from
oven 1 or 2 and returns one. In this activity,
Visual Logic is used to ensure that the cooler is not loaded again until it has been
unloaded (see Appendix B: Visual Logic).
Rapid Cooling collects three units and returns three. The cooler contains three racks
at a time.
Move to cutting uses one Moving employee. It collects one unit,
and returns two, one for each of the following paths. The unit that
goes to Cutting is a whole rack of sausages. However, the other one is just a single sausage
that goes to Quality test.
Cutting requires one Cut emp employee. It collects one unit,
and returns one unit. At this activity, sausages are cut from each other.
Quality test collects three units, which represent a single sausage from each of the
three racks that contain sausages from the same batch. The activity returns one unit,
Quality result collects test result from Quality test and three units from Cutting, which
represent the racks that were being tested. The activity returns one unit that has three possible
paths. The probability of the unit going each path is:
• Quality out of control:
• Used for 30:
• Num box:
Quality out of control is an endpoint where each batch that did not pass the quality
testing is thrown away. Only quality products are sold.
Used for 30 is an endpoint for sausages that are to be packed in a batch of 30. They
are packed in a machine that will not be considered in this model.

24 CHAPTER 4: THE SIMULATION MODEL
Num box represents a dummy function that does not take any time, made to control
the flow better. It gets one unit from the prior activity and returns eighteen units because
each batch gives on average eighteen boxes of cut sausages.
Move to packaging uses one Pack and Wrap
employee. It collects three units, which represents
3 boxes of cut sausages, and returns 1080 units.
Each box that is collected is estimated to be about
kg, which is approximately sausages.
Visual Logic is used to make sure that the activity
does not collect more boxes until almost all the
sausages have been packed. Two paths are possible
from this activity: to wait for being wrapped and
being taken out of the system because of defects.
Probability is used to estimate the number of
sausages going each way. Unsellable sausages are
about because they are too short, broken, etc.
Moreover, this activity contains the logic for
deciding if the sausages are packed in a batch of five or ten. This is done by using Visual
Logic. These batches are packed using the same machine. For simplicity, the activities of
the machine have their separate activities in the model for each size of the batch. In the
model, batches of five are packed until about of the estimated production of the day
has finished. After that, the route for batches of five closes and the route for batches of ten
opens. The stop condition is calculated from seven batches of sausages arriving for
packaging each day (see Appendix B: Visual Logic).
Packaging 5 and 10 use and Pack and Wrap employees, respectively.
Packaging 5 collects fifteen units and Packaging 10 collects thirty units, which represent
the number of sausages. Both activities return three packages.
The efficiency is set to 95% since some problem and stops happen,
and no machine runs with 100% efficiency. Distribution and parameters of the distribution
were found by using @Risk. Figure 4.3 shows the packaging machine and Figure D.3 shows
the activity in the model.
Put in box uses one Pack and Wrap employee. It collects one unit and returns two, one
for each path. The other
track from the activity is only for counting to be used to control when it is time to switch
from packing batches of five to packing batches of ten.
Figure 4.3: The packaging machine

4.1 MODEL OF CURRENT STATE 25
Put in box 2 uses one Pack and Wrap employee. It collects one unit and returns one.
Box of 5 and 10 collect 76 and 39 units, respectively, and return one. The activities do
not take any time and are used to count the number of boxes of wrapped sausages that are
ready to go into storage cooler.
Move to cooler and Move to cooler 2 use one employee each. They collect five units
and return five. The employee moves boxes that are full of sausages into the storage cooler.
Scan and put in place and Scan and put in place 2 both collect five units and return
five. The employee scans the product into the inventory system and then puts them at the
right place in the storage.
Boxes at cooler 5 is an endpoint that gives information about how many boxes are
ready for sale. Each box contains 76 packages of SS Wiener Sausages (five) that is around
kg. Boxes at cooler 10 is an endpoint that gives information about how many boxes are
ready for sale. Each box contains 39 packages of SS Wiener Sausages (10) that is around
kg.
The model uses six main resources: Boning emp, Mixing, Casing emp, Moving, Cut
emp and, Pack and Wrap. The time that resources are available during each day can be seen
in Table 4.1
Resource From: To: Number
Boning Employ
Mixing
Casing
Moving
Cut employ
Pack and Wrap
Table 4.1: Resource availability
This schedule is put into Resource Schedule in Simul8. A 30 min lunch break for all
resources, except for Moving, is also taken into account. His lunch break is counted in his
availability during the simulation. A coffee break for Boning emp, Mixing and Casing emp,
is also taken into account in the Resource Schedule. The availability of every resource can
be seen in Table 4.2. It counts for smaller breaks when an employee is not working;
washroom visits, chats, walking to brakes, etc.

26 CHAPTER 4: THE SIMULATION MODEL
Resource Availability
Boning emp 90%
Mixing 90%
Casing emp 90%
Moving 80%
Cut employ 85%
Pack and Wrap 85%
Table 4.2: Availability during simulation
4.2 Validation and Verification
Validation and verification are of great importance when making a simulation model.
Validation is the process of determining whether a simulation model is an adequate
representation of the simulated system. Only if the model is valid can it be used to make
decisions about the system [15, p. 247]. Verification is to check if the model works correctly
with given data, i.e., debugging the model [15, p. 246].
4.2.1 Validation
The model was made with the help of so-called Subject-Matter Experts (SMEs). They
are people that have good knowledge of particular parts of the system. They gathered data
for the model and explained how the system works. Data gathering was done by the author
as well, to be able to compare the resulting data to the data from the SMEs and to understand
the process better. Throughout the process of making the simulation model, information was
regularly collected from the SMEs, and they were kept informed about the process as well.
Furthermore, they were asked to provide new data to compare it to the results contained
from the model. The author sat down with them and got them to analyze the model accuracy.
The information gathered in those sessions was used to update the simulation model and re-
test it. The SMEs found the model to give good and rather accurate result after that.

4.2 VALIDATION AND VERIFICATION 27
4.2.2 Verification
The creation of the model was split up into five main sections. The development of a
section did not start until the previous part was finished and was running smoothly. The
simulation was run at a slow speed to make it possible to clearly see what happened during
the run. This process was repeated throughout the process of making the model until all
sections of the model were running successfully together. When more significant problems
arose over the development and testing phase, some advice was received from a specialist
in simulation models within Reykjavik University and from experienced programmers.

28 CHAPTER 5: RESULTS
Chapter 5
Results
The model results will be presented in this chapter. These are results about the current
runtime, utilization of resources and activities. The states of some of the queues, at particular
times in the simulation, will be analyzed. Moreover, the model results from different starting
conditions will be presented. An extreme situation, where the production doubles from the
average production, will be analyzed. With the initial starting conditions, a different layout
of the process will be looked at and compared to the current state.
5.1 The Current Situation
5.1.1 The Average Production
Like mentioned in Chapter 4.1, one batch of forcemeat is a mixture that can be used
to produce around 360 kg of Wiener sausages. The starting conditions of the simulation is
that Wiener sausages are made from batches of forcemeat, each day. Like mentioned
in Chapter 4.1, the first day in the simulation is used to create a normal inventory level. The
remaining four days are then used for the results. Thus, the production, using batches of
forcemeat in total, is simulated.
After running the simulation, it is clear that the system is able to finish all work that
requires to produce the Wiener sausages from the batches of forcemeat, each day. The
Meat mixer employees finish first, before noon. The casing department finishes a little bit
later, or early afternoon. At that point a rather significant inventory of racks, that are waiting
to go into the oven, has been built up. The first oven is loaded and started around in
the morning and the last batch is coming out of the rapid cooler around The packing
Figure 5.1: Simplified process flow.


34 CHAPTER 5: RESULTS
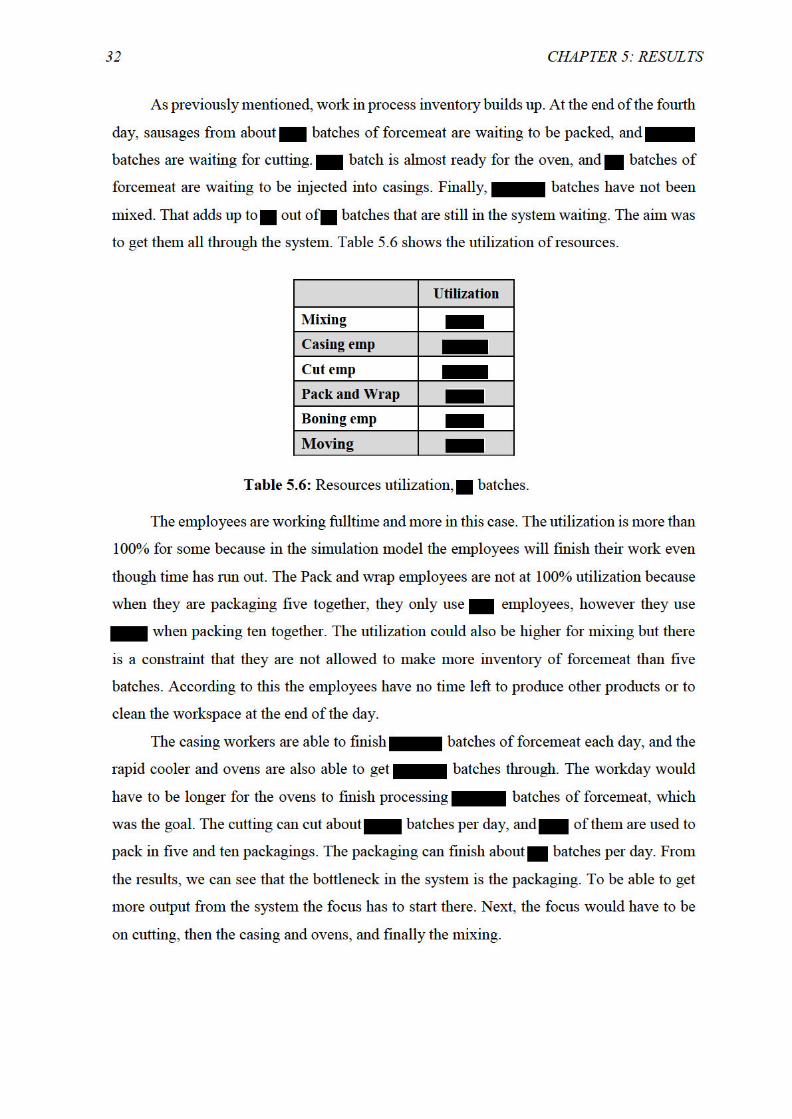
Table 5.8 shows the resources utilization for this case. There it can be seen that the
employees are starting to be overloaded as in the extreme case, however at the same time, it
only differs ten boxes of ready sausages as previously mentioned. Thus, the system can
handle eleven batches of forcemeat daily without building up inventory at bottlenecks.
5.2 Possible Changes
Many possible changes can be made to the system to get more output from it. One of
the simplest suggested change is to have a longer workday at the most critical places in the
system. For the packaging, the shifts could be set up differently, so the machine does not
stop for lunch and other breaks. The information used for the simulation counted for the
packaging having hours for the sausages, hours where it is not working because
of slack, there is hours stop because of lunch and coffee breaks, and hours used for
other products. Within current assumptions, it would be possible for the packaging to run
for more hours. If these hours would have been utilized at the packaging, and if
help would have been sent to the cutting when needed, it would lead to much lower
inventory. However, after a four-day run, in the end, batches would be waiting in front
of the packaging and cutting. Material that is waiting to be mixed or cased is still about
batches. The ovens and rapid cooler can get bathes through on hours. Thus, to be
able to get batches through the ovens they would have to run for about hours.
5.2.1 The Average Case, Two Rapid Coolers
One possible change, to increase the efficiency of the process, is to add another rapid
cooler. The model was changed according to this change. With two rapid coolers, both ovens
could be started immediately. Figure 5.2 shows the update on the model for the second rapid
cooler. A new rapid cooler costs about million ISK [35].


38 CHAPTER 5: RESULTS
5.2.3 Bottleneck in Packing
The main bottleneck in the system is in the packaging part, as previously mentioned.
The easiest way to solve it is to get employees to work longer. However, employees are
expensive and paying overtime is extremely costly. The main work the packaging employees
do is to stand next to conveyor, collect five sausages and put in a container. The containers
will then move forward and are sealed by the machine. This kind of job describes an activity
that a robot should be able to solve.
A robot solution has been examined rather recently for the process. The robot would
only need one employee operating him, and one other would be needed to receive ready
sausages and put them in boxes. Test results showed that the robot had a problem because
the sausages are curved not straight. It was not able to collect five sausages in one move,
and because of it the robot always needed two movements for every five sausages. That led
to lower efficiency and it did not give a desirable output [2]. The robot should be able to get
similar or better throughput in the packaging than the current situation. Moreover, if longer
operation time is needed it would be cheaper than in the current system because only 2-3
employees would need to work longer, not employees. However, for this to work the
process in the casings department has to change so the sausages would be straight instead of
curved. SS has not wanted to change that because they have always been curved and they
want to hold in the traditions of curved sausages. Also, is SS little afraid that the customer
would not like it because they have always been curved.
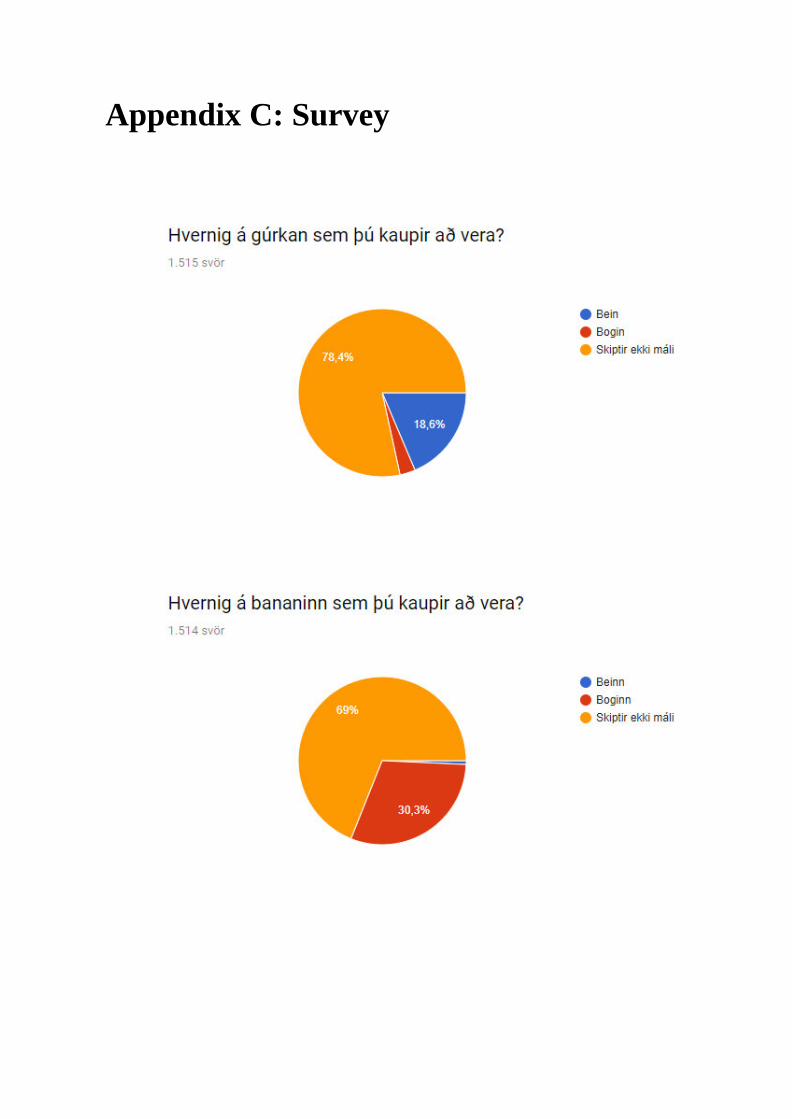
For that reason, the author sent out a survey using a Facebook group for food
enthusiasts in Iceland, to investigate buying habits and what kind of shape people want to
have when it comes to the food products they buy. The questions referred to four different
products though only one product in the survey mattered. The other questions were asked to
get participations to think about the effect of shape on their buying habits from a wider angle.
The questions were about what shapes of food products people prefer. The products were
banana, cucumber, sausages, and cheese. The question for the sausages was: How should
the sausages that you buy be shaped? Possible answers were: straight, curved or it does not
matter. The survey was open for two days, and 1.511 people answered that part of the
question. Figure 5.5 shows the responds. It can be seen that people either do not care about
the shape of the sausages or think that they should be straight. The whole survey results can
be seen in Icelandic in Appendix C: Survey.

40 CHAPTER 5: RESULTS
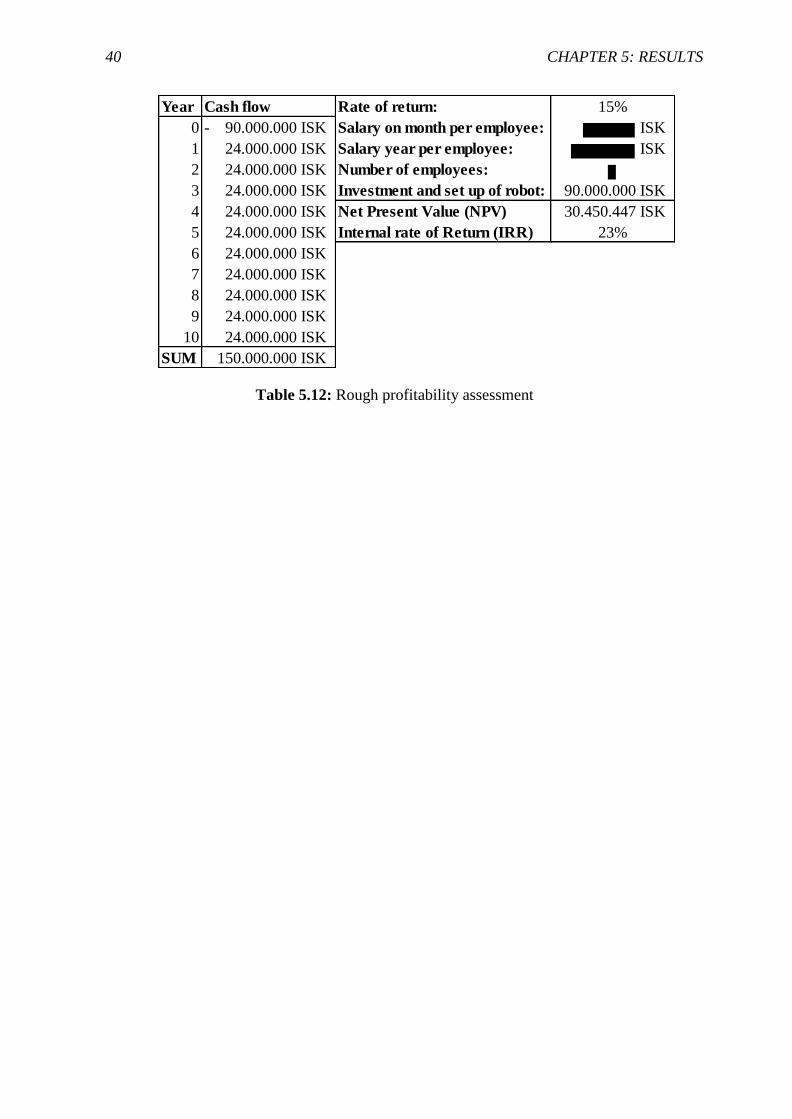
Table 5.12: Rough profitability assessment
Year Cash flow Rate of return: 15%
0 90.000.000 ISK- Salary on month per employee: ISK
1 24.000.000 ISK Salary year per employee: ISK
2 24.000.000 ISK Number of employees:
3 24.000.000 ISK Investment and set up of robot: 90.000.000 ISK
4 24.000.000 ISK Net Present Value (NPV) 30.450.447 ISK
5 24.000.000 ISK Internal rate of Return (IRR) 23%
6 24.000.000 ISK
7 24.000.000 ISK
8 24.000.000 ISK
9 24.000.000 ISK
10 24.000.000 ISK
SUM 150.000.000 ISK

5.2 POSSIBLE CHANGES 41
Chapter 6
Conclusion
In this study, the process of manufacturing SS Wiener sausages has been mapped and
analyzed with the help of simulation. The manufacturing process is long, and many factors
play a role in it. Employees from almost every department play a part in the process. The
process is complicate, and it can be hard to have a clear overview of it. By mapping up the
process of sausages production and use it to make a simulation model, a better insight into
the whole process can be gained.
One of the primary purposes of this thesis was to see if there are bottlenecks in the
system and identify possible risks related to them. To be able to find that out the simulation
model was used. The average production, forcemeat batches per day, was used in the
first phase of the search for bottlenecks. The process was able to finish all the work that was
assigned per day within the constraints of the model. However, there was one point where
inventory started to build up for a longer period of time than at other places over the day.
This was in front of the ovens since each batch of forcemeat needs to go through the oven
and rapid cooler for about min. However, when tested for batches it turned out
that the main bottleneck was the packaging station. Inventory built up there, and it increased
between days. The study was then able to identify bottlenecks in the current system: the
packaging followed by the ovens. Though it must be considered that the ovens were allowed
to run over a longer time than other activities in the model.
To be able to see what the current process can handle without making changes to it,
different scenarios were tested, and the system was analyzed. batches of forcemeat can
go smoothly through the system, but when the batches are , work in process
inventory starts to build up all around the system. batches of forcemeat is the amount
that the system could handle without building up much work in process inventory.
The most significant waste in the process are the sausages that are taken away in the
packaging because of quality issues. From four days batches of forcemeat were taken
away because of quality issues, though the sausages are used again it is still waste of time
and resources. This results in batches of forcemeat needing rework because of quality
issues every year. Since it takes a long time for a single batch of forcemeat to go through the

42 CHAPTER 6: CONCLUSION
system, this is an obvious waste of time and resources. Another waste is the rather long
distances that the ingredients have to travel in the process. This is hard to change without
making significant changes to the layout.
Many changes can be done to get more out of the facility. The simplest is to have
longer work time on bottleneck activities. Furthermore, shifts can be set up so the packaging
machine does not stop during lunch and coffee brakes. To be able to get more through the
ovens per day it is recommended to look into buying a new rapid cooler so the ovens can be
fully utilized. For the packaging, it can be costly to make the workday longer or to add shifts
because it is the activity that needs the most employees and employees are one of the most
expensive resources in the process. Thus, getting a robot to take over the work in packaging
could pay back rather fast if it can lower the need for employees. It is not as expensive to
operate a robot for a long period of time since fewer operators are needed.
The main recommendation in order to make the process more capable of meeting the
growing demand would be to try to minimize as much waste of unsellable sausages.
Consider buying another rapid cooler, so the batches will finish earlier during the day and
have more time to get other products through the ovens. Then thoroughly investigate if
automating the process of packaging is a possibility, both to lower the cost and be more
capable of meeting customer demands, .

43
Bibliography
[1] “SS Söguágrip,” Sláturfélag Suðurlands. [Online]. Available: https://www.ss.is/um-
ss/soguagrip/. [Accessed: 06-Feb-2019].
[2] Anna Brynjólfsdóttir, head of productiondepartment SS, private communication, Jan-2019.
[3] Hafþór Úlfarsson, head of marketing department SS, private communication, Feb-2019.
[4] C. C. Pegels and C. Watrous, “Application of the theory of constraints to a bottleneck operation
in a manufacturing plant,” J. Manuf. Technol. Manag., vol. 16, no. 3, pp. 302–311, Apr. 2005.
[5] “The Essence of Lean is to Eliminate Waste | Lean Production.” [Online]. Available:
https://www.leanproduction.com/intro-to-lean.html. [Accessed: 10-Apr-2019].
[6] “Framleiðnisjóður landbúnaðarins - Um sjóðinn.” [Online]. Available: http://www.fl.is/um-
sjodinn/. [Accessed: 05-Mar-2019].
[7] Þórhildur Þorsteinsdóttir, “Framleiðnisjóður landbúnaðarins - Ársskýrsla Framleiðnisjóðs
landbúnaðarins 2017,” Reykjavík, Mar. 2018.
[8] Páll Jensson, Gunnar Stefánsson, and Stefán Aðalsteinsson, Skipulagning á jöfnun heyforða:
dæmi um hagnýtingu aðgerðagreiningar hjá íslenskum atvinnuvegum. Reykjavík: Rannsóknaráð
ríkisins, sept1978, 1978.
[9] Páll Jensson, Helgi Sigvaldason, Hólmgeir Björnsson, Ketill A. Hannesson, Sigfús Ólafsson, and
Gunnar Sigurðsson, Reiknilíkan af mjólkurframleiðslu kúabúa. Reykjavík: Rannsóknastofnun
landbúnaðarins, jan1980, 1980.
[10] Páll Jensson, “Bestunarlíkan af mjólkurvinnslu á Íslandi,” Assoc. of Chartered Engineers in
Iceland, Reykjavík, 2000.
[11] Þóra Valsdóttir et al., “Umbætur í virðiskeðju matvæla. Samantekt. / Improvements in the food
value chain. Roundup.,” Matís ohf, Reykjavík, Skýrsla Matís 07-10, Mar. 2010.
[12] Sigríður Sigurðardóttir, “Iðnaðarverkfræði og mjólkurvinnsla,” Thesis, University of Iceland,
2011.
[13] Kamilla Reynisdóttir, “Linear optimization model that maximizes the value of pork products,”
Thesis, Reykjavik University, Reykjavik, 2012.
[14] “simulation | Definition of simulation in English by Oxford Dictionaries,” Oxford Dictionaries |
English. [Online]. Available: https://en.oxforddictionaries.com/definition/simulation. [Accessed:
12-Mar-2019].
[15] A. M. Law, Simulation modeling and analysis, Fifth edition. New York: McGraw-Hill, 2015.
[16] Páll Jensson, Department Head at Reykjavik University, private communication, Mar-2019.
[17] Helgi Sigvaldason et al., “A Simulation Model of a Trawler as a Raw Material Supplier for
Freezing Plants in Iceland,” University of Iceland, Reykjavik, Technical report, 1969.
[18] Páll Jensson, “A Simulation Model of the Capelin Fishing in Iceland,” in Applied Operations
Research in Fishing, K. B. Haley, Ed. Boston, MA: Springer US, 1981, pp. 187–198.
[19] Ingólfur Arnarson and Páll Jensson, “Impact of the cost of the time resource on efficiency of
economic processes,” Eur. J. Oper. Res., vol. 172, no. 2, pp. 616–630, Jul. 2006.
[20] Teitur Birgisson, “Hermun á koltrefja framleiðslu Össur hf. Líkanagerð og framleiðslugreining,”
Thesis, University of Iceland, Reykjavík, 2012.
[21] Jón Kolbeinn Guðjónsson, “Using simulation to predict performance of salmon portioning line,”
Thesis, Reykjavik University, Reykjavík, 2013.
[22] Hanna María Hermannsdóttir, “Optimization of the gate assignment problem at Keflavík
International Airport,” Thesis, Reykjavik University, Reykjavik, 2015.
[23] Sigríður Sigurðardóttir, “Modelling and Simulation for Fisheries Management,” Thesis,
University of Iceland, Reykjavik, 2016.
[24] Erla Þorsteinsdóttir, “Simulating the manufacturing process of aluminum extrusion billets at
ISAL casthouse using Simul8,” Thesis, Reykjavik University, Reykjavik, 2017.
44
[25] “Kjötframleiðsla eftir tegundum frá 1983,” Hagstofa Íslands - Talnaefni, 12-Feb-2018. [Online].
Available:
https://px.hagstofa.is:443/pxispxis/pxweb/is/Atvinnuvegir/Atvinnuvegir__landbunadur__landfra
mleidsla/LAN10201.px/. [Accessed: 06-Feb-2019].
[26] Fjármáladeild SS, “Ársskýrsla Sláturfélags Suðurlands 2018,” Sláturfélag Suðurlands,
Reykjavík, Annual Report, Mar. 2019.
[27] Þórhildur Þórhallsdóttir, director of Human Resources SS, private communication, Mar-2019.
[28] “SS pylsan, saga,” Sláturfélag Suðurlands. [Online]. Available: https://www.ss.is/vorur/ss-
pylsan/. [Accessed: 07-Feb-2019].
[29] “Mannfjöldi eftir kyni og aldri 1841-2019,” Hagstofa Íslands - Talnaefni, Jan-2019. [Online].
Available:
https://px.hagstofa.is/pxis/pxweb/is/Ibuar/Ibuar__mannfjoldi__1_yfirlit__Yfirlit_mannfjolda/MA
N00101.px/table/tableViewLayout1/?rxid=c6bc44cf-cff6-485e-8a28-00076edaf4ee. [Accessed:
22-Mar-2019].
[30] Reynir Björgvinsson, agent in quality and production department at SS, private communication,
Feb-2019.
[31] Bjarki Sigurjónsson, head of forcemeat department, private communication, Feb-2019.
[32] Hafþór Úlfarsson, head of marketing department SS, private communication, Apr-2019.
[33] Oddur Árnason, programme director at SS, private communication, Jan-2019.
[34] Páll Kr. Pálsson, Assistant Professor at Reykjavik University and CEO at VARMA, private
communication, Mar-2019.
[35] Benedikt Benediktsson, Production Manager at SS, private communication, Apr-2019.
45
Appendix A: Data

46

Appendix B: Visual Logic

Appendix C: Survey

50


54
Figure D.3: Model part III


![África [sonoma mountain sausages]](https://static.fdocuments.us/doc/165x107/587ded2b1a28abaf6b8b791d/africa-sonoma-mountain-sausages.jpg)