Process Simulation Cup (PSC2018) Increase the Profit of a ... · especially the metabolic reaction...
55
PSC2018_2_Details ©2018 by Chemstations Europe GmbH. All Rights Reserved. www.chemstations.eu Chemstations Europe GmbH Process Simulation Cup (PSC2018) Increase the Profit of a Bacteria-Based PDO Production Facility Part 2: Detailed Model Description
Transcript of Process Simulation Cup (PSC2018) Increase the Profit of a ... · especially the metabolic reaction...

PSC2018_2_Details ©2018 by Chemstations Europe GmbH. All Rights Reserved.
www.chemstations.eu
Chemstations Europe GmbH
Process Simulation Cup (PSC2018)Increase the Profit of a Bacteria-Based PDO Production Facility
Part 2: Detailed Model Description

PSC2018_2_Details ©2018 by Chemstations Europe GmbH. All Rights Reserved.
Please be aware of our copyright
1
• Ownership of copyright: The copyright for this website and the material on this website (including without limitation the text, computer code, flow sheets, artwork, photographs, images, music, audio material, video material and audio-visual material) is owned by Chemstations Europe GmbH or its affiliates (" Chemstations Europe") and its licensors.
• Copyright license: Chemstations Europe grants to you a worldwide non-exclusive royalty-free revocable license to:
– view this website and the material on this website on a computer or mobile device via a web browser;
– copy and store this website and the material on this website in your web browser cache memory; and
– copy and store the flow sheets on this website on a computer.
• Chemstations Europe does not grant you any other rights in relation to this website or the material on this website. In other words, all other rights are reserved.
• For the avoidance of doubt, you must not adapt, edit, change, transform, publish, republish, distribute, redistribute, broadcast, rebroadcast or show or play in public this website or the material on this website (in any form or media) without Chemstations Europe’s prior written permission.

PSC2018_2_Details ©2018 by Chemstations Europe GmbH. All Rights Reserved.
Is this document for me?
• This document is for you, if you want to
– fully understand what was modeled in CHEMCAD
– learn how biotechnology processes can be modeled in a flow sheet simulator, especially the metabolic reaction network, the cross-flow filtration unit op, and the thermodynamic models
• This document
– contains all the main assumptions of the PSC2018 flow sheets
– shows the complete list of 15 design variables of the PSC2018
➢ some design variables may not yet be open for input by the PSC2018 participants
2

PSC2018_2_Details ©2018 by Chemstations Europe GmbH. All Rights Reserved.
Outline
• Motivation
• Process Overview
• Cost Analysis
• Reactor Model
• Cross-Flow Filtration Model
• Thermodynamic Models
3

PSC2018_2_Details ©2018 by Chemstations Europe GmbH. All Rights Reserved.
In Bio-Refineries bulk products for the chemical industry are produced from a renewable feedstock instead of using petroleum.
Motivation
4
©funfunphoto/Fotolia

PSC2018_2_Details ©2018 by Chemstations Europe GmbH. All Rights Reserved.
1,3-Propanediol – A Versatile Molecule
• 1,3-Propanediol is an organic compound, a three-carbon diol, abbreviated to PDO
• It is part of several industrial products like
– Composites
– Adhesives
– Laminates
– Moldings
– Aliphatic polyesters
– Co-polyesters
5
• Or it can be used directly as
– Solvent (e.g. in wood paint) and
– Antifreeze

PSC2018_2_Details ©2018 by Chemstations Europe GmbH. All Rights Reserved.
1,3-Propanediol – Usage as a Co-Polyester
• PDO can be synthesized by fermentation:
6
Terephthalic acid
Harvest Cane juice
Fermenter brothPDOPolymer (Product)
©MB/Fotolia ©utah778/Fotolia
©Hort/Fotolia©sumire8/Fotolia
©BEAUTYofLIFE/Fotolia

PSC2018_2_Details ©2018 by Chemstations Europe GmbH. All Rights Reserved.
1,3-Propanediol – A Versatile BIO Molecule
• Some other PDO products:
7
Composite materials
Wood paint
Adhesive tapes
©Scisetti Alfio/Fotolia
©Saklakova/Fotolia
©benschonewille/Fotolia

PSC2018_2_Details ©2018 by Chemstations Europe GmbH. All Rights Reserved.
Process Overview
8
©sittinan/Fotolia

PSC2018_2_Details ©2018 by Chemstations Europe GmbH. All Rights Reserved.
Aerobic Fermentation of Cane Juice with E. Coli
9
1
1
Air
4
Off-Gas
3
Overflow
2
21
Cane Juice
22
Ammonia28
23
AceticAcid
2
E.Coli
©Maxim Suvorov/Fotolia

PSC2018_2_Details ©2018 by Chemstations Europe GmbH. All Rights Reserved.
Metabolic Reaction Network - Overview
10
S + 4.5 O2 + NH3 + 2 A → 5 X + 6.5 H2O + 5 CO2
5 S + 4 O2 → 6 P + A + 4 H2O + 10 CO2
S + 6 O2 → 6 H2O + 6 CO2
X → DX
Growth
Production
Maintenance
DeathS: Substrate
A: Acetic acid
P: PDO
X: Biomass
DX: Dead biomass

PSC2018_2_Details ©2018 by Chemstations Europe GmbH. All Rights Reserved.
Fed-Batch Fermentation
11
S
P

PSC2018_2_Details ©2018 by Chemstations Europe GmbH. All Rights Reserved.
Fed-Batch Fermentation
12
SP
X
A
DX
N

PSC2018_2_Details ©2018 by Chemstations Europe GmbH. All Rights Reserved.
• A battery of 3 bio-reactors is operated in parallel, each having a volume of 400 m³
• The cycle time is 30 hours
• Every 10 hours the content of one bio-reactor is drained to the intermediate storage tank
• From the intermediate storage tank a continuous stream is fed to the downstream process
Fermentation Section
13

PSC2018_2_Details ©2018 by Chemstations Europe GmbH. All Rights Reserved.
Fermentation Section– Design Variables
14
Biomass growth and PDO productioncan be controlled by adjusting thefeed rates of
F01: Air
F02: Cane Juice (Substrate)
F03: Ammonia
F04: Acetic Acid
All of these feeds also represent costs!However, only reduce them with care,as you might run into a limitation.
And keep an eye on the liquid level ofthe reactor, as the overflow is purged!

PSC2018_2_Details ©2018 by Chemstations Europe GmbH. All Rights Reserved.
Fermentation Section– Design Variables
15
Access designvariables

PSC2018_2_Details ©2018 by Chemstations Europe GmbH. All Rights Reserved.
Fermentation Section– Design Variables
16

PSC2018_2_Details ©2018 by Chemstations Europe GmbH. All Rights Reserved.
Downstream Process - Overview
17
In order to achieve a PDO purityof > 99.9 wt. % the downstreamprocess is separated into threesections:
1. Filtration (biomass removal)
2. Ion Exchange (salt removal)
3. Distillation (PDO purification)

PSC2018_2_Details ©2018 by Chemstations Europe GmbH. All Rights Reserved.
Downstream Process - Filtration
18
Three cross-flow filtration units are used to remove biomass and cell debris
- Micro Filtration 1: Bulk removal of biomass
- Micro Filtration 2: Recovery of concentrate overflow from MF1
- Ultra Filtration 1: Removal of cell debris
MF1 MF2
UF1

PSC2018_2_Details ©2018 by Chemstations Europe GmbH. All Rights Reserved.
Downstream Process - Filtration
19
Power consumption and separation efficiency depend on the transmembrane flux(TMF), the concentration of biomass X and cell debris DX, and on the feedtemperature. The design variables in this section are:
D01: Flowrate of dilution water (Stream 14)
D02: Split of dilution water to MF1 (Stream 15)
D03: Split of dilution water to MF2 (Stream 17)
D04: Pre-heating of dilution water to MF1 (Stream 16)
MF1 MF2
UF1

PSC2018_2_Details ©2018 by Chemstations Europe GmbH. All Rights Reserved.
Downstream Process – Ion Exchange
20
The ion exchanger unit is used to removesalts and proteins. Only ammonia andacetic acid are included in the metabolicreactor model and thus they are the onlyspecies to form salts in the simulation.This is a necessary over-simplification.
The ion exchanger is modelled as areactor which is neutralizing these twodiluted electrolytes with caustic sodaand sulfuric acid.
Water is recycled from the distillationsection. The amount of this recyclestream 41 is the only design variable inthis section:
D05: Flowrate of recycled head productto the ion exchanger section (Stream 41)

PSC2018_2_Details ©2018 by Chemstations Europe GmbH. All Rights Reserved.
Downstream Process - Distillation
21
The PDO is purified by oneevaporation and twodistillation steps.
The pressure is reduced andheat is added in order toremove surplus water in theevaporator EVAP.
In the first distillationcolumn DC1 PDO and waterare separated over headfrom rests of substrate andcontaminants.
In the second distillationcolumn DC2 the finalproduct purity is achieved.
EVAP
DC1
DC2

PSC2018_2_Details ©2018 by Chemstations Europe GmbH. All Rights Reserved.
Downstream Process - Distillation
22
The design variables in thissection are
D06: EVAP pressure
D07: EVAP vapor fraction
D08: Condenser pressure
D09: Condenser temperature
D10: DC1 pressure
D11: DC1 reflux ratio
D12: DC1 bottom temp.
D13: DC2 pressure
D14: DC2 reflux ratio
D15: DC2 bottom temp.
EVAP
DC1
DC2

PSC2018_2_Details ©2018 by Chemstations Europe GmbH. All Rights Reserved.
Downstream Process – Summary of Design Variables
23
Fifteen design variables areavailable in the downstreamprocess in order to maximizethe profit of the PDOproduction.
PSC2018_2_Details ©2018 by Chemstations Europe GmbH. All Rights Reserved.
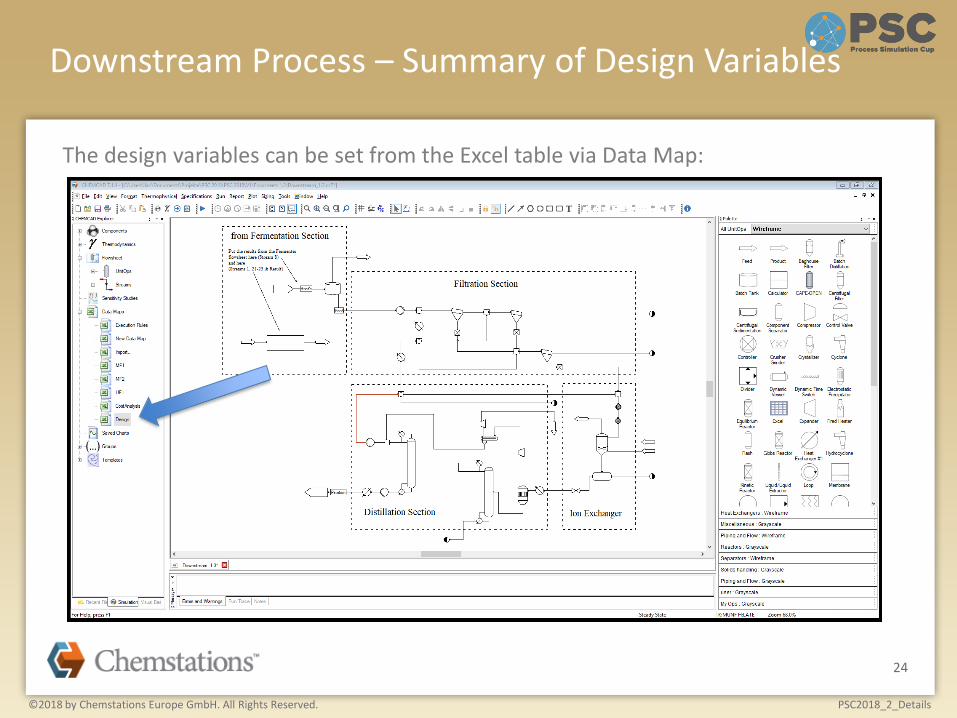
Downstream Process – Summary of Design Variables
24
The design variables can be set from the Excel table via Data Map:

PSC2018_2_Details ©2018 by Chemstations Europe GmbH. All Rights Reserved.
Cost Analysis
25
©Dmitry Sunagatov/Fotolia

PSC2018_2_Details ©2018 by Chemstations Europe GmbH. All Rights Reserved.
The production costs of the PDO process are split into different parts:
• Variable Costs
– Utilities
• Electricity
• Steam
• Cooling water
– Effluents
• Waste water
– Raw materials
• Feed (cane juice, initial reactor charge)
• Chemicals (acetic acid, ammonia, caustic soda, sulfuric acid)
• Fixed Costs
– Capital costs
– Labor
– Maintenance
– Marketing transport and sales
Cost Analysis
26

PSC2018_2_Details ©2018 by Chemstations Europe GmbH. All Rights Reserved.
Cost Analysis
27
Electricity
Steam

PSC2018_2_Details ©2018 by Chemstations Europe GmbH. All Rights Reserved.
Cost Analysis
28
Cooling water
Waste water
PSC2018_2_Details ©2018 by Chemstations Europe GmbH. All Rights Reserved.
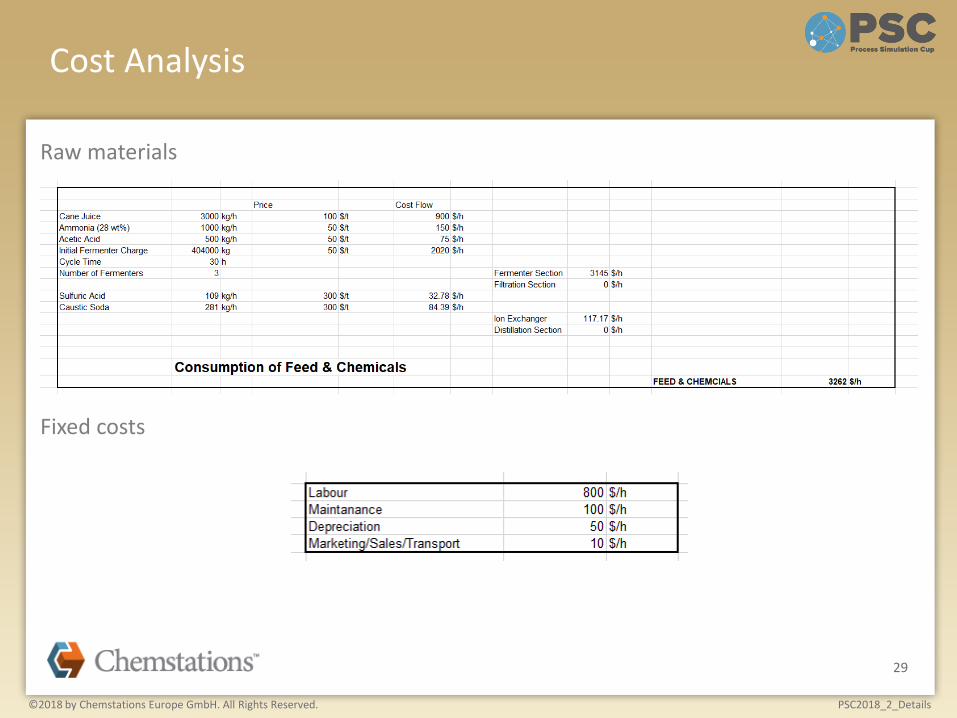
Cost Analysis
29
Raw materials
Fixed costs

PSC2018_2_Details ©2018 by Chemstations Europe GmbH. All Rights Reserved.
Cost Analysis
30
The desired quality of PDO is 99.9 wt. %. A higher quality does not increase the salesprices. However, the PDO can be sold with a lower quality at a reduced price.
The following curve is used for calculation of the sales price:
Purity
Price

PSC2018_2_Details ©2018 by Chemstations Europe GmbH. All Rights Reserved.
Cost Analysis
31
With the specific prices this finally gives the profit of the plant

PSC2018_2_Details ©2018 by Chemstations Europe GmbH. All Rights Reserved.
Cost Analysis
32
The detailed cost analysis and the resulting profit can be found in the Excel table:

PSC2018_2_Details ©2018 by Chemstations Europe GmbH. All Rights Reserved.
Reactor Model
33
©helenedeyun/Fotolia

PSC2018_2_Details ©2018 by Chemstations Europe GmbH. All Rights Reserved.
Simulation Models - Metabolic Reaction Network
34
S + 4.5 O2 + NH3 + 2 A → 5 X + 6.5 H2O + 5 CO2
ሶ𝑟 = 𝜇𝐺,𝑚𝑎𝑥
𝑆
𝐾𝐺 + 𝑆𝑋 ⋅ 𝐿
YX/S = 5 mol/mol = 0.69 kg/kg
YX/A = 2.5 mol/mol = 1.04 kg/kg
YX/N = 5 mol/mol = 7.35 kg/kg
YX/O2 = 1.11 mol/mol = 0.87 kg/kg
S: Substrate
A: Acetic acid
P: PDO
O: dissolved Oxygen
N: dissolved Ammonia
L: Rate limiting factor
X: Biomass
DX: Dead biomass
𝐿 =𝑂
𝐾𝐿 + 𝑂⋅
𝑁
𝐾𝐿 +𝑁⋅
𝐴
𝐾𝐿 + 𝐴
Biomass growth:

PSC2018_2_Details ©2018 by Chemstations Europe GmbH. All Rights Reserved.
Simulation Models - Metabolic Reaction Network
35
5 S + 4 O2 → 6 P + A + 4 H2O + 10 CO2
ሶ𝑟 = 𝜇𝑃,𝑚𝑎𝑥
𝑆
𝐾𝑃 + 𝑆𝑋 ⋅ 𝐿
𝐿 =𝑂
𝐾𝐿 + 𝑂
S: Substrate
A: Acetic acid
P: PDO
O: dissolved Oxygen
N: dissolved Ammonia
L: Rate limiting factor
X: Biomass
DX: Dead biomass
PDO production:
YP/S = 1.2 mol/mol = 0.51 kg/kg
YP/S = 1.5 mol/mol = 3.56 kg/kg
YA/Sof = 0.2 mol/mol = 0.07 kg/kg

PSC2018_2_Details ©2018 by Chemstations Europe GmbH. All Rights Reserved.
Simulation Models - Metabolic Reaction Network
36
S + 6 O2 → 6 H2O + 6 CO2
ሶ𝑟 = 𝑘𝑀 𝑋
S: Substrate
A: Acetic acid
P: PDO
O: dissolved Oxygen
N: dissolved Ammonia
L: Rate limiting factor
X: Biomass
DX: Dead biomass
Biomass maintenance:
PSC2018_2_Details ©2018 by Chemstations Europe GmbH. All Rights Reserved.
Simulation Models - Metabolic Reaction Network
37
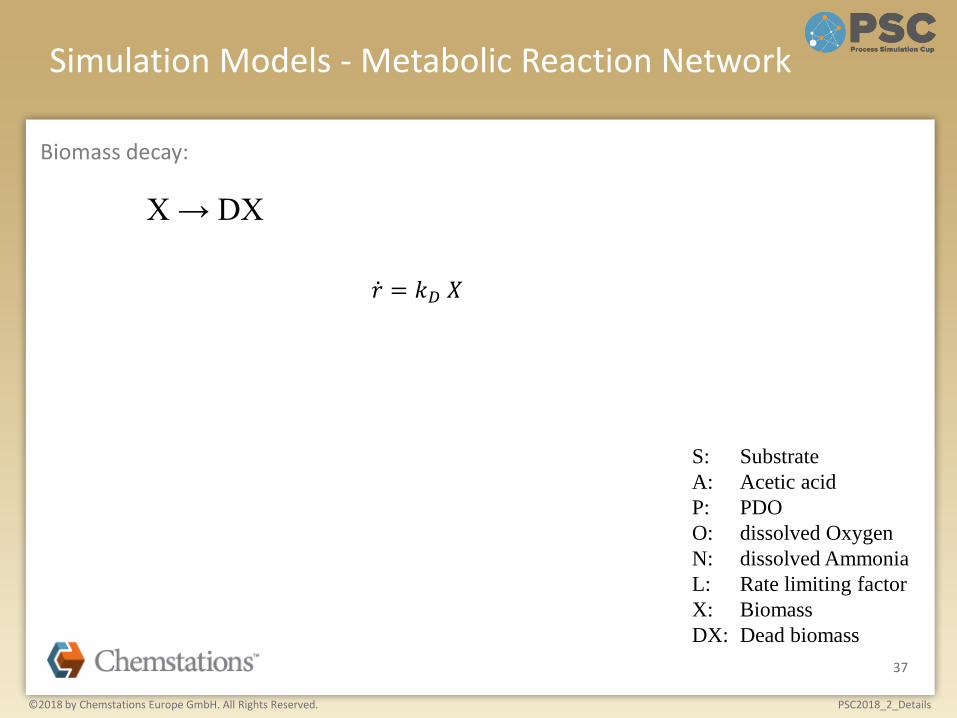
X → DX
ሶ𝑟 = 𝑘𝐷 𝑋
S: Substrate
A: Acetic acid
P: PDO
O: dissolved Oxygen
N: dissolved Ammonia
L: Rate limiting factor
X: Biomass
DX: Dead biomass
Biomass decay:

PSC2018_2_Details ©2018 by Chemstations Europe GmbH. All Rights Reserved.
Cross-Flow Filtration Model
38
©ommbeu/Fotolia

PSC2018_2_Details ©2018 by Chemstations Europe GmbH. All Rights Reserved.
A cross-flow filtration unit operation is mainly consuming electricity. This is used fordriving the pumps to produce the constant transmembrane flux. Commonly cross-flowfiltration units are operated continuous with scheduled cleaning intervals.
Simulation Models – Cross-Flow Filtration
39

PSC2018_2_Details ©2018 by Chemstations Europe GmbH. All Rights Reserved.
In order to derive the electricity consumption a simple model was developed based on a characteristic Transmembrane Flux (TMF) over Transmembrane Pressure (TMP) curve:
This curve depends on specific membrane parameters, but also on the fluidtemperature, the particle concentration, and the particle size distribution of theretained solids.
Simulation Models – Cross-Flow Filtration
40
Transmembrane Pressure
Tran
smem
bra
ne
Flu
x
No particles
Low particle concentration
High particle concentration
PSC2018_2_Details ©2018 by Chemstations Europe GmbH. All Rights Reserved.
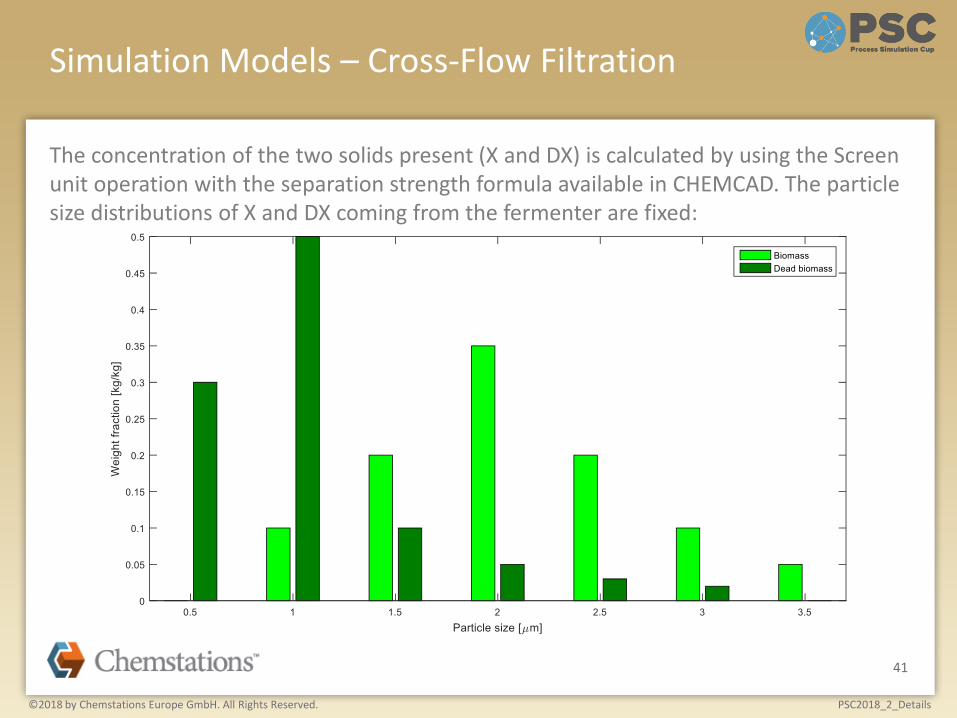
The concentration of the two solids present (X and DX) is calculated by using the Screen unit operation with the separation strength formula available in CHEMCAD. The particle size distributions of X and DX coming from the fermenter are fixed:
Simulation Models – Cross-Flow Filtration
41

PSC2018_2_Details ©2018 by Chemstations Europe GmbH. All Rights Reserved.
The flowsheet simulation is performed in flow-driven mode. The TMF is given and the TMP must be calculated. Thus the TMF-TMP curve must be inverted:
Simulation Models – Cross-Flow Filtration
This curve shape allows multiple solutions for agiven TMF. In order to avoid this, the curve is cut:
TMP = 200 bar
42
Transmembrane Pressure
Tran
smem
bra
ne
Flu
x
Transm
emb
rane P
ressure
Transmembrane Flux

PSC2018_2_Details ©2018 by Chemstations Europe GmbH. All Rights Reserved.
The following equations are used to calculate the TMP:
𝑇𝑀𝑃 = −𝑡𝑓
𝑡𝑐ln 1 −
𝑇𝑀𝐹
𝑇𝑀𝐹𝑚𝑎𝑥
𝑡𝑐 = 1 − exp −𝑇
𝑇𝑚𝑖𝑛
𝑇𝑀𝐹𝑚𝑎𝑥 = 𝑇𝑀𝐹𝑚𝑎𝑥0 − 𝑠𝑓𝑥 ⋅ 𝐶𝑥,𝐹 + 𝑠𝑓𝐷𝑥 ⋅ 𝐶𝐷𝑥,𝐹
Simulation Models – Cross-Flow Filtration
43
Membrane parameters:𝑡𝑓 Temperature factor
𝑇𝑚𝑖𝑛 Recommended min. temperature
𝑇𝑀𝐹𝑚𝑎𝑥0 TMF with clean
membrane𝑠𝑓𝑥 Sludge factor for X𝑠𝑓𝐷𝑥 Sludge factor for DX
or TMP = 200 bar
Process parameters:𝑇 Feed temperature𝐶𝑥,𝐹 Concentration of
biomass in feed𝐶𝐷𝑥,𝐹 Concentration of
dead biomass in feed

PSC2018_2_Details ©2018 by Chemstations Europe GmbH. All Rights Reserved.
𝑃𝐶𝐹𝐹𝐶 =𝑐𝑟 ⋅ ሶ𝑉𝐹𝑒𝑒𝑑 ⋅ 𝑇𝑀𝑃
𝜂𝑃𝑢𝑚𝑝
Simulation Models – Cross-Flow Filtration
44
The power consumption is calculated with the equation
Cross-flow filtration parameters:
𝐴 Active membrane area𝑐𝑟 Cycle rate𝜂𝑃𝑢𝑚𝑝 Cycle pump efficiency

PSC2018_2_Details ©2018 by Chemstations Europe GmbH. All Rights Reserved.
Simulation Models – Cross-Flow Filtration
45
The parameters are specified in a specific screen and the model equations are evaluated in an Excel Sheet by using the CHEMCAD Excel Unit Operation.
Vapor fractions above 0 and TMF larger than TMFmax lead to a TMP of 200 bar!

PSC2018_2_Details ©2018 by Chemstations Europe GmbH. All Rights Reserved.
Simulation Models – Cross-Flow Filtration
46
The membrane performance curve can be evaluated in the same Excel table for different concentration factors:

PSC2018_2_Details ©2018 by Chemstations Europe GmbH. All Rights Reserved.
Simulation Models – Cross-Flow Filtration
47
The related Excel tables can be accessed via the DataMap Explorer:

PSC2018_2_Details ©2018 by Chemstations Europe GmbH. All Rights Reserved.
Thermodynamic Models
48
©Dale/Fotolia

PSC2018_2_Details ©2018 by Chemstations Europe GmbH. All Rights Reserved.
Simulation Models – Distillation
49
The Modified UNIFAC model is used to calculate the vapor-liquid equilibria in thedownstream flowsheet. The following Group Assignment is used:
Latent heat is used as model for the Enthalpy. The coefficients of the related DIPRRequations are taken from the CHEMCAD databank.
The solubility of Ammonia, Carbon Dioxide, Nitrogen and Oxygen in water iscalculated with Henry’s Law.
Biomass, Acetic Acid, Caustic Soda and the resulting salts are removed before the distillation section and thus do not matter for the VLE calculations.
PSC2018_2_Details ©2018 by Chemstations Europe GmbH. All Rights Reserved.
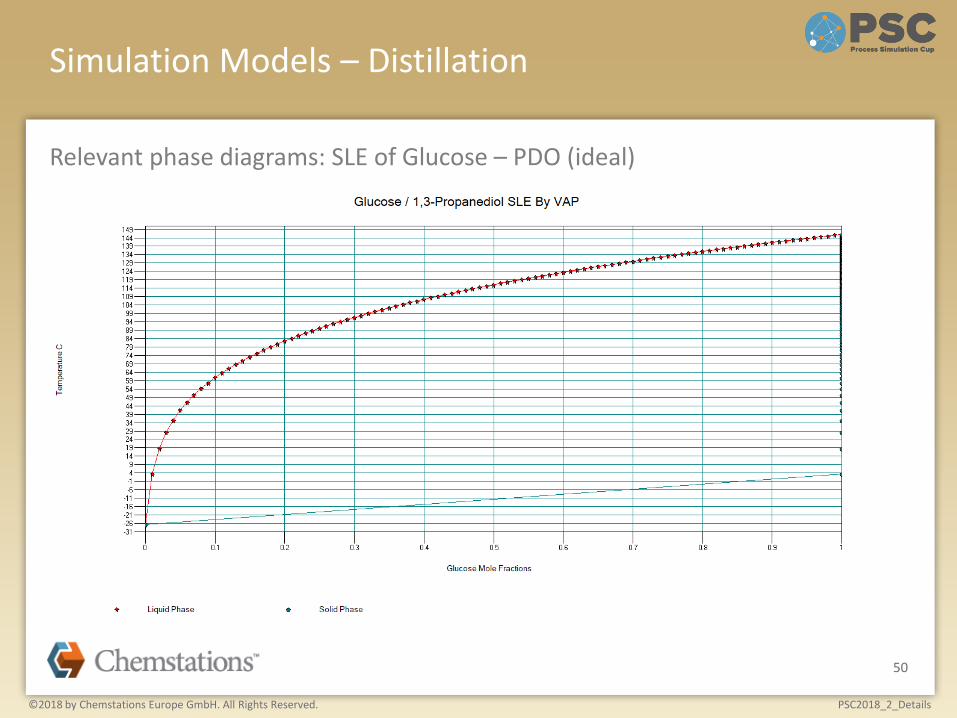
Simulation Models – Distillation
50
Relevant phase diagrams: SLE of Glucose – PDO (ideal)

PSC2018_2_Details ©2018 by Chemstations Europe GmbH. All Rights Reserved.
Simulation Models – Distillation
51
Relevant phase diagrams: VLE of PDO - Glucose

PSC2018_2_Details ©2018 by Chemstations Europe GmbH. All Rights Reserved.
Simulation Models – Distillation
52
Relevant phase diagrams: VLE of Water - PDO

PSC2018_2_Details ©2018 by Chemstations Europe GmbH. All Rights Reserved.
Simulation Models – Distillation
53
Relevant phase diagrams: Residue curves of Water – PDO – Glucose

PSC2018_2_Details ©2018 by Chemstations Europe GmbH. All Rights Reserved.
Simulation Models – Distillation
54
The distillation columns are modelled as equilibrium stage models with 8 stagesincluding condenser and reboiler. The feed is introduced in the middle of the columns.
The reflux ratio is used as condenser spec
The bottom temperature is used asreboiler spec