Process Outcome Objectives SFY2017-2018 MATERNAL...
107
Alamance County SFY2017-2018 MATERNAL HEALTH AGREEMENT ADDENDA DATA Process Outcome Objectives NC Percent or Rate Process Outcome Objectives 1st Percentage of women having live births who had adequate prenatal care as defined by Kessner Index. [1] (Time Periods: 1st - CY13; 2nd - CY14; 3rd - CY15. Most Recent - CY15) 1. 2nd 3rd % Change from 1st period to 3rd period Most Recent Data Num Den Percent or Rate Percentage of Medicaid enrolled pregnant women who deliver who receive prenatal WIC Program services.[3] (Time Periods: 1st - CY07-09; 2nd - CY10-12; 3rd - CY13-15. Most Recent - CY15) 4. Percentage of women with live term singleton births who gained adequate/excessive/ inadequate weight according to the National Academy of Sciences- Institute of Medicine (IOM) 2009 Recommended Total Weight Gain Ranges during Pregnancy.[2] (Time Periods: 1st - CY13 2nd - CY14; 3rd - CY15. Most Recent - CY15) 2. Percentage of women having live births who smoked during pregnancy. [1] (Time Periods: 1st - CY13; 2nd - CY14; 3rd - CY15. Most Recent - CY15) 3. 58.52 59.63 63.21 8.01 1,127 1,783 63.21 29.06 29.40 27.36 -5.85 417 1,524 27.36 Time Period 16.37 12.00 11.44 -30.10 204 1,783 11.44 77.58 75.78 79.49 2.46 735 941 78.11 A. Adequate Weight Gain 48.31 49.97 53.28 10.29 812 1,524 53.28 B. Excessive Weight Gain 19.57 19.02 15.55 -20.54 237 1,524 15.55 C. Inadequate Weight Gain Percentage of infants enrolled in WIC who breastfed at 6 weeks postpartum. (Time Periods: 1st - FY15; 2nd - N/A; 3rd - N/A. Most Recent - FY15) [4] 5. 33.71 359 1,065 33.71 Percentage of Medicaid enrolled pregnant women who deliver who receive a postpartum home visit.[3] (Time Periods: 1st - CY10-12; 2nd - N/A; 3rd - CY13- 15. Most Recent - CY15) 6. 10.20 0.57 -94.41 20 1,142 1.75 62.89 28.75 48.42 19.51 9.35 73.19 25.14 12.21 [2] Recommended total prenatal weight gain range by prepregnancy weight category is 28-40 lbs. for underweight women (BMI<18.5); 25-35 lbs. for normal weight women (BMI 18.5 to 24.9); 15-25 lbs. for overweight women (BMI 25 to 29.9); and 11-20 lbs. for obese women (BMI>=30). [4] Due to Crossroads implementation, data are only available for this time period. This page will be updated to include FY16 data when it becomes available. Also, data for counties composing districts are not available. [1] With the implementation of the 2003 revised US Standard Certificate of Live Birth in NC in August 2010, data on prenatal care initiation and tobacco use prior to 2011 are not comparable. Data sources for these objectives are as follows: 1, 2, & 3 NC Birth Certificates; 4 NC Automated WIC System matched with Medicaid Processed Claims Report; 5 NC Automated WIC System; and 6 Medicaid Processed Claims Report. 3.06 1.62 3.81 24.54 58 1,524 3.81 D. Unknown Weight Gain 3.32 [3] These data exclude women enrolled in Medicaid only for emergency delivery. 2014 Medicaid match includes data from both legacy WIC and Crossroads WIC System. Effective 2015 Prenatal Medicaid match included only Crossroads WIC data.
Transcript of Process Outcome Objectives SFY2017-2018 MATERNAL...

Alamance County
SFY2017-2018 MATERNAL HEALTH AGREEMENT ADDENDA DATAProcess Outcome Objectives
NC Percent or Rate
Process Outcome Objectives1st
Percentage of women having live births who had adequate prenatal care as defined by Kessner Index. [1] (Time Periods: 1st - CY13; 2nd - CY14; 3rd - CY15. Most Recent - CY15)
1.
2nd 3rd
% Change from 1st period to
3rd period
Most Recent Data
Num DenPercent or Rate
Percentage of Medicaid enrolled pregnant women who deliver who receive prenatal WIC Program services.[3] (Time Periods: 1st - CY07-09; 2nd - CY10-12; 3rd - CY13-15. Most Recent - CY15)
4.
Percentage of women with live term singleton births who gained adequate/excessive/ inadequate weight according to the National Academy of Sciences-Institute of Medicine (IOM) 2009 Recommended Total Weight Gain Ranges during Pregnancy.[2] (Time Periods: 1st - CY13 2nd - CY14; 3rd - CY15. Most Recent - CY15)
2.
Percentage of women having live births who smoked during pregnancy. [1] (Time Periods: 1st - CY13; 2nd - CY14; 3rd - CY15. Most Recent - CY15)
3.
58.52 59.63 63.21 8.01 1,127 1,783 63.21
29.06 29.40 27.36 -5.85 417 1,524 27.36
Time Period
16.37 12.00 11.44 -30.10 204 1,783 11.44
77.58 75.78 79.49 2.46 735 941 78.11
A. Adequate Weight Gain
48.31 49.97 53.28 10.29 812 1,524 53.28B. Excessive Weight Gain
19.57 19.02 15.55 -20.54 237 1,524 15.55C. Inadequate Weight Gain
Percentage of infants enrolled in WIC who breastfed at 6 weeks postpartum. (Time Periods: 1st - FY15; 2nd - N/A; 3rd - N/A. Most Recent - FY15) [4]
5.33.71 359 1,065 33.71
Percentage of Medicaid enrolled pregnant women who deliver who receive a postpartum home visit.[3] (Time Periods: 1st - CY10-12; 2nd - N/A; 3rd - CY13-15. Most Recent - CY15)
6.
10.20 0.57 -94.41 20 1,142 1.75
62.89
28.75
48.42
19.51
9.35
73.19
25.14
12.21
[2] Recommended total prenatal weight gain range by prepregnancy weight category is 28-40 lbs. for underweight women (BMI<18.5); 25-35 lbs. for normal weight women (BMI 18.5 to 24.9); 15-25 lbs. for overweight women (BMI 25 to 29.9); and 11-20 lbs. for obese women (BMI>=30).
[4] Due to Crossroads implementation, data are only available for this time period. This page will be updated to include FY16 data when it becomes available. Also, data for counties composing districts are not available.
[1] With the implementation of the 2003 revised US Standard Certificate of Live Birth in NC in August 2010, data on prenatal care initiation and tobacco use prior to 2011 are not comparable.
Data sources for these objectives are as follows: 1, 2, & 3 NC Birth Certificates; 4 NC Automated WIC System matched with Medicaid Processed Claims Report; 5 NC Automated WIC System; and 6 Medicaid Processed Claims Report.
3.06 1.62 3.81 24.54 58 1,524 3.81D. Unknown Weight Gain 3.32
[3] These data exclude women enrolled in Medicaid only for emergency delivery. 2014 Medicaid match includes data from both legacy WIC and Crossroads WIC System. Effective 2015 Prenatal Medicaid match included only Crossroads WIC data.

Albemarle Regional Health Services District
SFY2017-2018 MATERNAL HEALTH AGREEMENT ADDENDA DATAProcess Outcome Objectives
NC Percent or Rate
Process Outcome Objectives1st
Percentage of women having live births who had adequate prenatal care as defined by Kessner Index. [1] (Time Periods: 1st - CY13; 2nd - CY14; 3rd - CY15. Most Recent - CY15)
1.
2nd 3rd
% Change from 1st period to
3rd period
Most Recent Data
Num DenPercent or Rate
Percentage of Medicaid enrolled pregnant women who deliver who receive prenatal WIC Program services.[3] (Time Periods: 1st - CY07-09; 2nd - CY10-12; 3rd - CY13-15. Most Recent - CY15)
4.
Percentage of women with live term singleton births who gained adequate/excessive/ inadequate weight according to the National Academy of Sciences-Institute of Medicine (IOM) 2009 Recommended Total Weight Gain Ranges during Pregnancy.[2] (Time Periods: 1st - CY13 2nd - CY14; 3rd - CY15. Most Recent - CY15)
2.
Percentage of women having live births who smoked during pregnancy. [1] (Time Periods: 1st - CY13; 2nd - CY14; 3rd - CY15. Most Recent - CY15)
3.
53.21 65.82 65.98 24.00 923 1,399 65.98
20.49 27.48 28.12 37.24 338 1,202 28.12
Time Period
10.43 13.05 10.01 -4.05 140 1,399 10.01
71.31 68.28 82.29 15.41 664 794 83.63
A. Adequate Weight Gain
44.57 49.63 50.67 13.67 609 1,202 50.67B. Excessive Weight Gain
14.69 20.34 20.38 38.72 245 1,202 20.38C. Inadequate Weight Gain
Percentage of infants enrolled in WIC who breastfed at 6 weeks postpartum. (Time Periods: 1st - FY15; 2nd - N/A; 3rd - N/A. Most Recent - FY15) [4]
5.23.35 187 801 23.35
Percentage of Medicaid enrolled pregnant women who deliver who receive a postpartum home visit.[3] (Time Periods: 1st - CY10-12; 2nd - N/A; 3rd - CY13-15. Most Recent - CY15)
6.
7.07 7.20 1.80 79 820 9.63
62.89
28.75
48.42
19.51
9.35
73.19
25.14
12.21
[2] Recommended total prenatal weight gain range by prepregnancy weight category is 28-40 lbs. for underweight women (BMI<18.5); 25-35 lbs. for normal weight women (BMI 18.5 to 24.9); 15-25 lbs. for overweight women (BMI 25 to 29.9); and 11-20 lbs. for obese women (BMI>=30).
[4] Due to Crossroads implementation, data are only available for this time period. This page will be updated to include FY16 data when it becomes available. Also, data for counties composing districts are not available.
[1] With the implementation of the 2003 revised US Standard Certificate of Live Birth in NC in August 2010, data on prenatal care initiation and tobacco use prior to 2011 are not comparable.
Data sources for these objectives are as follows: 1, 2, & 3 NC Birth Certificates; 4 NC Automated WIC System matched with Medicaid Processed Claims Report; 5 NC Automated WIC System; and 6 Medicaid Processed Claims Report.
20.24 2.54 0.83 -95.89 10 1,202 0.83D. Unknown Weight Gain 3.32
[3] These data exclude women enrolled in Medicaid only for emergency delivery. 2014 Medicaid match includes data from both legacy WIC and Crossroads WIC System. Effective 2015 Prenatal Medicaid match included only Crossroads WIC data.

Bertie
SFY2017-2018 MATERNAL HEALTH AGREEMENT ADDENDA DATAProcess Outcome Objectives for Counties Composing Districts
NC Percent or Rate
Process Outcome Objectives1st
Percentage of women having live births who had adequate prenatal care as defined by Kessner Index. [1] (Time Periods: 1st - CY13; 2nd - CY14; 3rd - CY15. Most Recent - CY15)
1.
2nd 3rd
% Change from 1st period to
3rd period
Most Recent Data
Num DenPercent or Rate
Percentage of Medicaid enrolled pregnant women who deliver who receive prenatal WIC Program services.[3] (Time Periods: 1st - CY07-09; 2nd - CY10-12; 3rd - CY13-15. Most Recent - CY15)
4.
Percentage of women with live term singleton births who gained adequate/excessive/ inadequate weight according to the National Academy of Sciences-Institute of Medicine (IOM) 2009 Recommended Total Weight Gain Ranges during Pregnancy.[2] (Time Periods: 1st - CY13 2nd - CY14; 3rd - CY15. Most Recent - CY15)
2.
Percentage of women having live births who smoked during pregnancy. [1] (Time Periods: 1st - CY13; 2nd - CY14; 3rd - CY15. Most Recent - CY15)
3.
67.74 72.56 73.37 8.31 124 169 73.37
28.39 20.15 22.46 -20.87 31 138 22.46
Time Period
7.53 12.80 10.06 33.64 17 169 10.06
80.26 80.81 88.01 9.66 115 132 87.12
A. Adequate Weight Gain
44.52 50.00 50.00 12.32 69 138 50.00B. Excessive Weight Gain
26.45 29.10 27.54 4.10 38 138 27.54C. Inadequate Weight Gain
Percentage of infants enrolled in WIC who breastfed at 6 weeks postpartum. (Time Periods: 1st - FY15; 2nd - N/A; 3rd - N/A. Most Recent - FY15) [4]
5.
Percentage of Medicaid enrolled pregnant women who deliver who receive a postpartum home visit.[3] (Time Periods: 1st - CY10-12; 2nd - N/A; 3rd - CY13-15. Most Recent - CY15)
6.
9.59 5.80 -39.49 8 130 6.15
62.89
28.75
48.42
19.51
9.35
73.19
25.14
12.21
[2] Recommended total prenatal weight gain range by prepregnancy weight category is 28-40 lbs. for underweight women (BMI<18.5); 25-35 lbs. for normal weight women (BMI 18.5 to 24.9); 15-25 lbs. for overweight women (BMI 25 to 29.9); and 11-20 lbs. for obese women (BMI>=30).
[4] Due to Crossroads implementation, data are only available for this time period. This page will be updated to include FY16 data when it becomes available. Also, data for counties composing districts are not available.
[1] With the implementation of the 2003 revised US Standard Certificate of Live Birth in NC in August 2010, data on prenatal care initiation and tobacco use prior to 2011 are not comparable.
Data sources for these objectives are as follows: 1, 2, & 3 NC Birth Certificates; 4 NC Automated WIC System matched with Medicaid Processed Claims Report; 5 NC Automated WIC System; and 6 Medicaid Processed Claims Report.
0.65 0.75 0.00 -100.00 0 138 0.00D. Unknown Weight Gain 3.32
[3] These data exclude women enrolled in Medicaid only for emergency delivery. 2014 Medicaid match includes data from both legacy WIC and Crossroads WIC System. Effective 2015 Prenatal Medicaid match included only Crossroads WIC data.

Camden
SFY2017-2018 MATERNAL HEALTH AGREEMENT ADDENDA DATAProcess Outcome Objectives for Counties Composing Districts
NC Percent or Rate
Process Outcome Objectives1st
Percentage of women having live births who had adequate prenatal care as defined by Kessner Index. [1] (Time Periods: 1st - CY13; 2nd - CY14; 3rd - CY15. Most Recent - CY15)
1.
2nd 3rd
% Change from 1st period to
3rd period
Most Recent Data
Num DenPercent or Rate
Percentage of Medicaid enrolled pregnant women who deliver who receive prenatal WIC Program services.[3] (Time Periods: 1st - CY07-09; 2nd - CY10-12; 3rd - CY13-15. Most Recent - CY15)
4.
Percentage of women with live term singleton births who gained adequate/excessive/ inadequate weight according to the National Academy of Sciences-Institute of Medicine (IOM) 2009 Recommended Total Weight Gain Ranges during Pregnancy.[2] (Time Periods: 1st - CY13 2nd - CY14; 3rd - CY15. Most Recent - CY15)
2.
Percentage of women having live births who smoked during pregnancy. [1] (Time Periods: 1st - CY13; 2nd - CY14; 3rd - CY15. Most Recent - CY15)
3.
47.37 69.39 66.67 40.74 60 90 66.67
22.22 29.03 41.56 87.01 32 77 41.56
Time Period
9.47 11.22 12.22 29.01 11 90 12.22
85.39 71.43 72.28 -15.36 19 31 61.29
A. Adequate Weight Gain
39.51 49.46 45.45 15.06 35 77 45.45B. Excessive Weight Gain
11.11 18.28 10.39 -6.49 8 77 10.39C. Inadequate Weight Gain
Percentage of infants enrolled in WIC who breastfed at 6 weeks postpartum. (Time Periods: 1st - FY15; 2nd - N/A; 3rd - N/A. Most Recent - FY15) [4]
5.
Percentage of Medicaid enrolled pregnant women who deliver who receive a postpartum home visit.[3] (Time Periods: 1st - CY10-12; 2nd - N/A; 3rd - CY13-15. Most Recent - CY15)
6.
4.55 5 31 16.13
62.89
28.75
48.42
19.51
9.35
73.19
25.14
12.21
[2] Recommended total prenatal weight gain range by prepregnancy weight category is 28-40 lbs. for underweight women (BMI<18.5); 25-35 lbs. for normal weight women (BMI 18.5 to 24.9); 15-25 lbs. for overweight women (BMI 25 to 29.9); and 11-20 lbs. for obese women (BMI>=30).
[4] Due to Crossroads implementation, data are only available for this time period. This page will be updated to include FY16 data when it becomes available. Also, data for counties composing districts are not available.
[1] With the implementation of the 2003 revised US Standard Certificate of Live Birth in NC in August 2010, data on prenatal care initiation and tobacco use prior to 2011 are not comparable.
Data sources for these objectives are as follows: 1, 2, & 3 NC Birth Certificates; 4 NC Automated WIC System matched with Medicaid Processed Claims Report; 5 NC Automated WIC System; and 6 Medicaid Processed Claims Report.
27.16 3.23 2.60 -90.44 2 77 2.60D. Unknown Weight Gain 3.32
[3] These data exclude women enrolled in Medicaid only for emergency delivery. 2014 Medicaid match includes data from both legacy WIC and Crossroads WIC System. Effective 2015 Prenatal Medicaid match included only Crossroads WIC data.

Chowan
SFY2017-2018 MATERNAL HEALTH AGREEMENT ADDENDA DATAProcess Outcome Objectives for Counties Composing Districts
NC Percent or Rate
Process Outcome Objectives1st
Percentage of women having live births who had adequate prenatal care as defined by Kessner Index. [1] (Time Periods: 1st - CY13; 2nd - CY14; 3rd - CY15. Most Recent - CY15)
1.
2nd 3rd
% Change from 1st period to
3rd period
Most Recent Data
Num DenPercent or Rate
Percentage of Medicaid enrolled pregnant women who deliver who receive prenatal WIC Program services.[3] (Time Periods: 1st - CY07-09; 2nd - CY10-12; 3rd - CY13-15. Most Recent - CY15)
4.
Percentage of women with live term singleton births who gained adequate/excessive/ inadequate weight according to the National Academy of Sciences-Institute of Medicine (IOM) 2009 Recommended Total Weight Gain Ranges during Pregnancy.[2] (Time Periods: 1st - CY13 2nd - CY14; 3rd - CY15. Most Recent - CY15)
2.
Percentage of women having live births who smoked during pregnancy. [1] (Time Periods: 1st - CY13; 2nd - CY14; 3rd - CY15. Most Recent - CY15)
3.
62.87 63.71 68.67 9.23 114 166 68.67
23.70 26.32 31.94 34.77 46 144 31.94
Time Period
14.97 17.74 10.84 -27.57 18 166 10.84
78.90 77.97 86.05 9.07 90 106 84.91
A. Adequate Weight Gain
54.81 54.39 39.58 -27.79 57 144 39.58B. Excessive Weight Gain
18.52 19.30 28.47 53.75 41 144 28.47C. Inadequate Weight Gain
Percentage of infants enrolled in WIC who breastfed at 6 weeks postpartum. (Time Periods: 1st - FY15; 2nd - N/A; 3rd - N/A. Most Recent - FY15) [4]
5.
Percentage of Medicaid enrolled pregnant women who deliver who receive a postpartum home visit.[3] (Time Periods: 1st - CY10-12; 2nd - N/A; 3rd - CY13-15. Most Recent - CY15)
6.
1.61 2 103 1.94
62.89
28.75
48.42
19.51
9.35
73.19
25.14
12.21
[2] Recommended total prenatal weight gain range by prepregnancy weight category is 28-40 lbs. for underweight women (BMI<18.5); 25-35 lbs. for normal weight women (BMI 18.5 to 24.9); 15-25 lbs. for overweight women (BMI 25 to 29.9); and 11-20 lbs. for obese women (BMI>=30).
[4] Due to Crossroads implementation, data are only available for this time period. This page will be updated to include FY16 data when it becomes available. Also, data for counties composing districts are not available.
[1] With the implementation of the 2003 revised US Standard Certificate of Live Birth in NC in August 2010, data on prenatal care initiation and tobacco use prior to 2011 are not comparable.
Data sources for these objectives are as follows: 1, 2, & 3 NC Birth Certificates; 4 NC Automated WIC System matched with Medicaid Processed Claims Report; 5 NC Automated WIC System; and 6 Medicaid Processed Claims Report.
2.96 0.00 0.00 -100.00 0 144 0.00D. Unknown Weight Gain 3.32
[3] These data exclude women enrolled in Medicaid only for emergency delivery. 2014 Medicaid match includes data from both legacy WIC and Crossroads WIC System. Effective 2015 Prenatal Medicaid match included only Crossroads WIC data.

Currituck
SFY2017-2018 MATERNAL HEALTH AGREEMENT ADDENDA DATAProcess Outcome Objectives for Counties Composing Districts
NC Percent or Rate
Process Outcome Objectives1st
Percentage of women having live births who had adequate prenatal care as defined by Kessner Index. [1] (Time Periods: 1st - CY13; 2nd - CY14; 3rd - CY15. Most Recent - CY15)
1.
2nd 3rd
% Change from 1st period to
3rd period
Most Recent Data
Num DenPercent or Rate
Percentage of Medicaid enrolled pregnant women who deliver who receive prenatal WIC Program services.[3] (Time Periods: 1st - CY07-09; 2nd - CY10-12; 3rd - CY13-15. Most Recent - CY15)
4.
Percentage of women with live term singleton births who gained adequate/excessive/ inadequate weight according to the National Academy of Sciences-Institute of Medicine (IOM) 2009 Recommended Total Weight Gain Ranges during Pregnancy.[2] (Time Periods: 1st - CY13 2nd - CY14; 3rd - CY15. Most Recent - CY15)
2.
Percentage of women having live births who smoked during pregnancy. [1] (Time Periods: 1st - CY13; 2nd - CY14; 3rd - CY15. Most Recent - CY15)
3.
33.59 68.46 77.31 130.13 201 260 77.31
12.77 23.21 28.13 120.31 63 224 28.13
Time Period
10.94 15.00 10.00 -8.57 26 260 10.00
73.93 58.61 71.15 -3.76 80 108 74.07
A. Adequate Weight Gain
27.23 47.32 56.25 106.54 126 224 56.25B. Excessive Weight Gain
6.81 19.64 14.29 109.82 32 224 14.29C. Inadequate Weight Gain
Percentage of infants enrolled in WIC who breastfed at 6 weeks postpartum. (Time Periods: 1st - FY15; 2nd - N/A; 3rd - N/A. Most Recent - FY15) [4]
5.
Percentage of Medicaid enrolled pregnant women who deliver who receive a postpartum home visit.[3] (Time Periods: 1st - CY10-12; 2nd - N/A; 3rd - CY13-15. Most Recent - CY15)
6.
101
62.89
28.75
48.42
19.51
9.35
73.19
25.14
12.21
[2] Recommended total prenatal weight gain range by prepregnancy weight category is 28-40 lbs. for underweight women (BMI<18.5); 25-35 lbs. for normal weight women (BMI 18.5 to 24.9); 15-25 lbs. for overweight women (BMI 25 to 29.9); and 11-20 lbs. for obese women (BMI>=30).
[4] Due to Crossroads implementation, data are only available for this time period. This page will be updated to include FY16 data when it becomes available. Also, data for counties composing districts are not available.
[1] With the implementation of the 2003 revised US Standard Certificate of Live Birth in NC in August 2010, data on prenatal care initiation and tobacco use prior to 2011 are not comparable.
Data sources for these objectives are as follows: 1, 2, & 3 NC Birth Certificates; 4 NC Automated WIC System matched with Medicaid Processed Claims Report; 5 NC Automated WIC System; and 6 Medicaid Processed Claims Report.
53.19 9.82 1.34 -97.48 3 224 1.34D. Unknown Weight Gain 3.32
[3] These data exclude women enrolled in Medicaid only for emergency delivery. 2014 Medicaid match includes data from both legacy WIC and Crossroads WIC System. Effective 2015 Prenatal Medicaid match included only Crossroads WIC data.

Gates
SFY2017-2018 MATERNAL HEALTH AGREEMENT ADDENDA DATAProcess Outcome Objectives for Counties Composing Districts
NC Percent or Rate
Process Outcome Objectives1st
Percentage of women having live births who had adequate prenatal care as defined by Kessner Index. [1] (Time Periods: 1st - CY13; 2nd - CY14; 3rd - CY15. Most Recent - CY15)
1.
2nd 3rd
% Change from 1st period to
3rd period
Most Recent Data
Num DenPercent or Rate
Percentage of Medicaid enrolled pregnant women who deliver who receive prenatal WIC Program services.[3] (Time Periods: 1st - CY07-09; 2nd - CY10-12; 3rd - CY13-15. Most Recent - CY15)
4.
Percentage of women with live term singleton births who gained adequate/excessive/ inadequate weight according to the National Academy of Sciences-Institute of Medicine (IOM) 2009 Recommended Total Weight Gain Ranges during Pregnancy.[2] (Time Periods: 1st - CY13 2nd - CY14; 3rd - CY15. Most Recent - CY15)
2.
Percentage of women having live births who smoked during pregnancy. [1] (Time Periods: 1st - CY13; 2nd - CY14; 3rd - CY15. Most Recent - CY15)
3.
26.67 57.69 55.05 106.42 60 109 55.05
8.86 30.86 23.91 169.88 22 92 23.91
Time Period
10.00 11.54 10.09 0.92 11 109 10.09
78.26 48.09 81.33 3.93 45 53 84.91
A. Adequate Weight Gain
21.52 54.32 55.43 157.61 51 92 55.43B. Excessive Weight Gain
7.59 13.58 20.65 171.92 19 92 20.65C. Inadequate Weight Gain
Percentage of infants enrolled in WIC who breastfed at 6 weeks postpartum. (Time Periods: 1st - FY15; 2nd - N/A; 3rd - N/A. Most Recent - FY15) [4]
5.
Percentage of Medicaid enrolled pregnant women who deliver who receive a postpartum home visit.[3] (Time Periods: 1st - CY10-12; 2nd - N/A; 3rd - CY13-15. Most Recent - CY15)
6.
54
62.89
28.75
48.42
19.51
9.35
73.19
25.14
12.21
[2] Recommended total prenatal weight gain range by prepregnancy weight category is 28-40 lbs. for underweight women (BMI<18.5); 25-35 lbs. for normal weight women (BMI 18.5 to 24.9); 15-25 lbs. for overweight women (BMI 25 to 29.9); and 11-20 lbs. for obese women (BMI>=30).
[4] Due to Crossroads implementation, data are only available for this time period. This page will be updated to include FY16 data when it becomes available. Also, data for counties composing districts are not available.
[1] With the implementation of the 2003 revised US Standard Certificate of Live Birth in NC in August 2010, data on prenatal care initiation and tobacco use prior to 2011 are not comparable.
Data sources for these objectives are as follows: 1, 2, & 3 NC Birth Certificates; 4 NC Automated WIC System matched with Medicaid Processed Claims Report; 5 NC Automated WIC System; and 6 Medicaid Processed Claims Report.
62.03 1.23 0.00 -100.00 0 92 0.00D. Unknown Weight Gain 3.32
[3] These data exclude women enrolled in Medicaid only for emergency delivery. 2014 Medicaid match includes data from both legacy WIC and Crossroads WIC System. Effective 2015 Prenatal Medicaid match included only Crossroads WIC data.

Pasquotank
SFY2017-2018 MATERNAL HEALTH AGREEMENT ADDENDA DATAProcess Outcome Objectives for Counties Composing Districts
NC Percent or Rate
Process Outcome Objectives1st
Percentage of women having live births who had adequate prenatal care as defined by Kessner Index. [1] (Time Periods: 1st - CY13; 2nd - CY14; 3rd - CY15. Most Recent - CY15)
1.
2nd 3rd
% Change from 1st period to
3rd period
Most Recent Data
Num DenPercent or Rate
Percentage of Medicaid enrolled pregnant women who deliver who receive prenatal WIC Program services.[3] (Time Periods: 1st - CY07-09; 2nd - CY10-12; 3rd - CY13-15. Most Recent - CY15)
4.
Percentage of women with live term singleton births who gained adequate/excessive/ inadequate weight according to the National Academy of Sciences-Institute of Medicine (IOM) 2009 Recommended Total Weight Gain Ranges during Pregnancy.[2] (Time Periods: 1st - CY13 2nd - CY14; 3rd - CY15. Most Recent - CY15)
2.
Percentage of women having live births who smoked during pregnancy. [1] (Time Periods: 1st - CY13; 2nd - CY14; 3rd - CY15. Most Recent - CY15)
3.
58.59 63.25 59.84 2.13 295 493 59.84
22.14 30.59 26.06 17.67 111 426 26.06
Time Period
9.73 11.01 10.14 4.23 50 493 10.14
59.13 61.63 83.22 40.75 263 299 87.96
A. Adequate Weight Gain
53.57 48.59 52.35 -2.28 223 426 52.35B. Excessive Weight Gain
15.00 19.96 20.42 36.15 87 426 20.42C. Inadequate Weight Gain
Percentage of infants enrolled in WIC who breastfed at 6 weeks postpartum. (Time Periods: 1st - FY15; 2nd - N/A; 3rd - N/A. Most Recent - FY15) [4]
5.
Percentage of Medicaid enrolled pregnant women who deliver who receive a postpartum home visit.[3] (Time Periods: 1st - CY10-12; 2nd - N/A; 3rd - CY13-15. Most Recent - CY15)
6.
14.72 15.06 2.32 62 328 18.90
62.89
28.75
48.42
19.51
9.35
73.19
25.14
12.21
[2] Recommended total prenatal weight gain range by prepregnancy weight category is 28-40 lbs. for underweight women (BMI<18.5); 25-35 lbs. for normal weight women (BMI 18.5 to 24.9); 15-25 lbs. for overweight women (BMI 25 to 29.9); and 11-20 lbs. for obese women (BMI>=30).
[4] Due to Crossroads implementation, data are only available for this time period. This page will be updated to include FY16 data when it becomes available. Also, data for counties composing districts are not available.
[1] With the implementation of the 2003 revised US Standard Certificate of Live Birth in NC in August 2010, data on prenatal care initiation and tobacco use prior to 2011 are not comparable.
Data sources for these objectives are as follows: 1, 2, & 3 NC Birth Certificates; 4 NC Automated WIC System matched with Medicaid Processed Claims Report; 5 NC Automated WIC System; and 6 Medicaid Processed Claims Report.
9.29 0.87 1.17 -87.36 5 426 1.17D. Unknown Weight Gain 3.32
[3] These data exclude women enrolled in Medicaid only for emergency delivery. 2014 Medicaid match includes data from both legacy WIC and Crossroads WIC System. Effective 2015 Prenatal Medicaid match included only Crossroads WIC data.

Perquimans
SFY2017-2018 MATERNAL HEALTH AGREEMENT ADDENDA DATAProcess Outcome Objectives for Counties Composing Districts
NC Percent or Rate
Process Outcome Objectives1st
Percentage of women having live births who had adequate prenatal care as defined by Kessner Index. [1] (Time Periods: 1st - CY13; 2nd - CY14; 3rd - CY15. Most Recent - CY15)
1.
2nd 3rd
% Change from 1st period to
3rd period
Most Recent Data
Num DenPercent or Rate
Percentage of Medicaid enrolled pregnant women who deliver who receive prenatal WIC Program services.[3] (Time Periods: 1st - CY07-09; 2nd - CY10-12; 3rd - CY13-15. Most Recent - CY15)
4.
Percentage of women with live term singleton births who gained adequate/excessive/ inadequate weight according to the National Academy of Sciences-Institute of Medicine (IOM) 2009 Recommended Total Weight Gain Ranges during Pregnancy.[2] (Time Periods: 1st - CY13 2nd - CY14; 3rd - CY15. Most Recent - CY15)
2.
Percentage of women having live births who smoked during pregnancy. [1] (Time Periods: 1st - CY13; 2nd - CY14; 3rd - CY15. Most Recent - CY15)
3.
60.56 68.55 61.61 1.72 69 112 61.61
22.50 29.46 32.67 45.21 33 101 32.67
Time Period
11.27 16.13 6.25 -44.53 7 112 6.25
70.64 74.78 83.77 18.59 52 65 80.00
A. Adequate Weight Gain
54.17 50.00 47.52 -12.26 48 101 47.52B. Excessive Weight Gain
16.67 20.54 19.80 18.81 20 101 19.80C. Inadequate Weight Gain
Percentage of infants enrolled in WIC who breastfed at 6 weeks postpartum. (Time Periods: 1st - FY15; 2nd - N/A; 3rd - N/A. Most Recent - FY15) [4]
5.
Percentage of Medicaid enrolled pregnant women who deliver who receive a postpartum home visit.[3] (Time Periods: 1st - CY10-12; 2nd - N/A; 3rd - CY13-15. Most Recent - CY15)
6.
1.21 1.22 0.41 2 73 2.74
62.89
28.75
48.42
19.51
9.35
73.19
25.14
12.21
[2] Recommended total prenatal weight gain range by prepregnancy weight category is 28-40 lbs. for underweight women (BMI<18.5); 25-35 lbs. for normal weight women (BMI 18.5 to 24.9); 15-25 lbs. for overweight women (BMI 25 to 29.9); and 11-20 lbs. for obese women (BMI>=30).
[4] Due to Crossroads implementation, data are only available for this time period. This page will be updated to include FY16 data when it becomes available. Also, data for counties composing districts are not available.
[1] With the implementation of the 2003 revised US Standard Certificate of Live Birth in NC in August 2010, data on prenatal care initiation and tobacco use prior to 2011 are not comparable.
Data sources for these objectives are as follows: 1, 2, & 3 NC Birth Certificates; 4 NC Automated WIC System matched with Medicaid Processed Claims Report; 5 NC Automated WIC System; and 6 Medicaid Processed Claims Report.
6.67 0.00 0.00 -100.00 0 101 0.00D. Unknown Weight Gain 3.32
[3] These data exclude women enrolled in Medicaid only for emergency delivery. 2014 Medicaid match includes data from both legacy WIC and Crossroads WIC System. Effective 2015 Prenatal Medicaid match included only Crossroads WIC data.

Alexander County
SFY2017-2018 MATERNAL HEALTH AGREEMENT ADDENDA DATAProcess Outcome Objectives
NC Percent or Rate
Process Outcome Objectives1st
Percentage of women having live births who had adequate prenatal care as defined by Kessner Index. [1] (Time Periods: 1st - CY13; 2nd - CY14; 3rd - CY15. Most Recent - CY15)
1.
2nd 3rd
% Change from 1st period to
3rd period
Most Recent Data
Num DenPercent or Rate
Percentage of Medicaid enrolled pregnant women who deliver who receive prenatal WIC Program services.[3] (Time Periods: 1st - CY07-09; 2nd - CY10-12; 3rd - CY13-15. Most Recent - CY15)
4.
Percentage of women with live term singleton births who gained adequate/excessive/ inadequate weight according to the National Academy of Sciences-Institute of Medicine (IOM) 2009 Recommended Total Weight Gain Ranges during Pregnancy.[2] (Time Periods: 1st - CY13 2nd - CY14; 3rd - CY15. Most Recent - CY15)
2.
Percentage of women having live births who smoked during pregnancy. [1] (Time Periods: 1st - CY13; 2nd - CY14; 3rd - CY15. Most Recent - CY15)
3.
71.51 70.94 66.18 -7.45 227 343 66.18
28.25 28.19 30.26 7.14 92 304 30.26
Time Period
19.83 19.09 18.95 -4.45 65 343 18.95
73.27 73.16 70.62 -3.61 150 211 71.09
A. Adequate Weight Gain
56.82 50.00 51.64 -9.11 157 304 51.64B. Excessive Weight Gain
13.31 21.14 17.11 28.50 52 304 17.11C. Inadequate Weight Gain
Percentage of infants enrolled in WIC who breastfed at 6 weeks postpartum. (Time Periods: 1st - FY15; 2nd - N/A; 3rd - N/A. Most Recent - FY15) [4]
5.40.47 87 215 40.47
Percentage of Medicaid enrolled pregnant women who deliver who receive a postpartum home visit.[3] (Time Periods: 1st - CY10-12; 2nd - N/A; 3rd - CY13-15. Most Recent - CY15)
6.
0.95 -100.00 217
62.89
28.75
48.42
19.51
9.35
73.19
25.14
12.21
[2] Recommended total prenatal weight gain range by prepregnancy weight category is 28-40 lbs. for underweight women (BMI<18.5); 25-35 lbs. for normal weight women (BMI 18.5 to 24.9); 15-25 lbs. for overweight women (BMI 25 to 29.9); and 11-20 lbs. for obese women (BMI>=30).
[4] Due to Crossroads implementation, data are only available for this time period. This page will be updated to include FY16 data when it becomes available. Also, data for counties composing districts are not available.
[1] With the implementation of the 2003 revised US Standard Certificate of Live Birth in NC in August 2010, data on prenatal care initiation and tobacco use prior to 2011 are not comparable.
Data sources for these objectives are as follows: 1, 2, & 3 NC Birth Certificates; 4 NC Automated WIC System matched with Medicaid Processed Claims Report; 5 NC Automated WIC System; and 6 Medicaid Processed Claims Report.
1.62 0.67 0.99 -39.21 3 304 0.99D. Unknown Weight Gain 3.32
[3] These data exclude women enrolled in Medicaid only for emergency delivery. 2014 Medicaid match includes data from both legacy WIC and Crossroads WIC System. Effective 2015 Prenatal Medicaid match included only Crossroads WIC data.

Anson County
SFY2017-2018 MATERNAL HEALTH AGREEMENT ADDENDA DATAProcess Outcome Objectives
NC Percent or Rate
Process Outcome Objectives1st
Percentage of women having live births who had adequate prenatal care as defined by Kessner Index. [1] (Time Periods: 1st - CY13; 2nd - CY14; 3rd - CY15. Most Recent - CY15)
1.
2nd 3rd
% Change from 1st period to
3rd period
Most Recent Data
Num DenPercent or Rate
Percentage of Medicaid enrolled pregnant women who deliver who receive prenatal WIC Program services.[3] (Time Periods: 1st - CY07-09; 2nd - CY10-12; 3rd - CY13-15. Most Recent - CY15)
4.
Percentage of women with live term singleton births who gained adequate/excessive/ inadequate weight according to the National Academy of Sciences-Institute of Medicine (IOM) 2009 Recommended Total Weight Gain Ranges during Pregnancy.[2] (Time Periods: 1st - CY13 2nd - CY14; 3rd - CY15. Most Recent - CY15)
2.
Percentage of women having live births who smoked during pregnancy. [1] (Time Periods: 1st - CY13; 2nd - CY14; 3rd - CY15. Most Recent - CY15)
3.
54.20 52.32 57.83 6.69 133 230 57.83
27.35 23.76 20.00 -26.89 40 200 20.00
Time Period
16.79 16.88 13.91 -17.15 32 230 13.91
83.14 84.25 82.36 -0.94 165 190 86.84
A. Adequate Weight Gain
52.91 53.96 51.50 -2.67 103 200 51.50B. Excessive Weight Gain
19.28 22.28 28.00 45.21 56 200 28.00C. Inadequate Weight Gain
Percentage of infants enrolled in WIC who breastfed at 6 weeks postpartum. (Time Periods: 1st - FY15; 2nd - N/A; 3rd - N/A. Most Recent - FY15) [4]
5.44.62 87 195 44.62
Percentage of Medicaid enrolled pregnant women who deliver who receive a postpartum home visit.[3] (Time Periods: 1st - CY10-12; 2nd - N/A; 3rd - CY13-15. Most Recent - CY15)
6.
4.33 -100.00 204
62.89
28.75
48.42
19.51
9.35
73.19
25.14
12.21
[2] Recommended total prenatal weight gain range by prepregnancy weight category is 28-40 lbs. for underweight women (BMI<18.5); 25-35 lbs. for normal weight women (BMI 18.5 to 24.9); 15-25 lbs. for overweight women (BMI 25 to 29.9); and 11-20 lbs. for obese women (BMI>=30).
[4] Due to Crossroads implementation, data are only available for this time period. This page will be updated to include FY16 data when it becomes available. Also, data for counties composing districts are not available.
[1] With the implementation of the 2003 revised US Standard Certificate of Live Birth in NC in August 2010, data on prenatal care initiation and tobacco use prior to 2011 are not comparable.
Data sources for these objectives are as follows: 1, 2, & 3 NC Birth Certificates; 4 NC Automated WIC System matched with Medicaid Processed Claims Report; 5 NC Automated WIC System; and 6 Medicaid Processed Claims Report.
0.45 0.00 0.50 11.50 1 200 0.50D. Unknown Weight Gain 3.32
[3] These data exclude women enrolled in Medicaid only for emergency delivery. 2014 Medicaid match includes data from both legacy WIC and Crossroads WIC System. Effective 2015 Prenatal Medicaid match included only Crossroads WIC data.

Appalachian District
SFY2017-2018 MATERNAL HEALTH AGREEMENT ADDENDA DATAProcess Outcome Objectives
NC Percent or Rate
Process Outcome Objectives1st
Percentage of women having live births who had adequate prenatal care as defined by Kessner Index. [1] (Time Periods: 1st - CY13; 2nd - CY14; 3rd - CY15. Most Recent - CY15)
1.
2nd 3rd
% Change from 1st period to
3rd period
Most Recent Data
Num DenPercent or Rate
Percentage of Medicaid enrolled pregnant women who deliver who receive prenatal WIC Program services.[3] (Time Periods: 1st - CY07-09; 2nd - CY10-12; 3rd - CY13-15. Most Recent - CY15)
4.
Percentage of women with live term singleton births who gained adequate/excessive/ inadequate weight according to the National Academy of Sciences-Institute of Medicine (IOM) 2009 Recommended Total Weight Gain Ranges during Pregnancy.[2] (Time Periods: 1st - CY13 2nd - CY14; 3rd - CY15. Most Recent - CY15)
2.
Percentage of women having live births who smoked during pregnancy. [1] (Time Periods: 1st - CY13; 2nd - CY14; 3rd - CY15. Most Recent - CY15)
3.
78.02 77.60 78.01 -0.02 525 673 78.01
30.91 28.78 29.60 -4.25 169 571 29.60
Time Period
13.57 15.90 13.37 -1.45 90 673 13.37
64.42 73.61 75.96 17.92 267 341 78.30
A. Adequate Weight Gain
46.11 46.02 47.46 2.92 271 571 47.46B. Excessive Weight Gain
19.26 21.79 22.24 15.50 127 571 22.24C. Inadequate Weight Gain
Percentage of infants enrolled in WIC who breastfed at 6 weeks postpartum. (Time Periods: 1st - FY15; 2nd - N/A; 3rd - N/A. Most Recent - FY15) [4]
5.26.34 98 372 26.34
Percentage of Medicaid enrolled pregnant women who deliver who receive a postpartum home visit.[3] (Time Periods: 1st - CY10-12; 2nd - N/A; 3rd - CY13-15. Most Recent - CY15)
6.
6.68 3.11 -53.46 3 387 0.78
62.89
28.75
48.42
19.51
9.35
73.19
25.14
12.21
[2] Recommended total prenatal weight gain range by prepregnancy weight category is 28-40 lbs. for underweight women (BMI<18.5); 25-35 lbs. for normal weight women (BMI 18.5 to 24.9); 15-25 lbs. for overweight women (BMI 25 to 29.9); and 11-20 lbs. for obese women (BMI>=30).
[4] Due to Crossroads implementation, data are only available for this time period. This page will be updated to include FY16 data when it becomes available. Also, data for counties composing districts are not available.
[1] With the implementation of the 2003 revised US Standard Certificate of Live Birth in NC in August 2010, data on prenatal care initiation and tobacco use prior to 2011 are not comparable.
Data sources for these objectives are as follows: 1, 2, & 3 NC Birth Certificates; 4 NC Automated WIC System matched with Medicaid Processed Claims Report; 5 NC Automated WIC System; and 6 Medicaid Processed Claims Report.
3.72 3.41 0.70 -81.15 4 571 0.70D. Unknown Weight Gain 3.32
[3] These data exclude women enrolled in Medicaid only for emergency delivery. 2014 Medicaid match includes data from both legacy WIC and Crossroads WIC System. Effective 2015 Prenatal Medicaid match included only Crossroads WIC data.

Alleghany
SFY2017-2018 MATERNAL HEALTH AGREEMENT ADDENDA DATAProcess Outcome Objectives for Counties Composing Districts
NC Percent or Rate
Process Outcome Objectives1st
Percentage of women having live births who had adequate prenatal care as defined by Kessner Index. [1] (Time Periods: 1st - CY13; 2nd - CY14; 3rd - CY15. Most Recent - CY15)
1.
2nd 3rd
% Change from 1st period to
3rd period
Most Recent Data
Num DenPercent or Rate
Percentage of Medicaid enrolled pregnant women who deliver who receive prenatal WIC Program services.[3] (Time Periods: 1st - CY07-09; 2nd - CY10-12; 3rd - CY13-15. Most Recent - CY15)
4.
Percentage of women with live term singleton births who gained adequate/excessive/ inadequate weight according to the National Academy of Sciences-Institute of Medicine (IOM) 2009 Recommended Total Weight Gain Ranges during Pregnancy.[2] (Time Periods: 1st - CY13 2nd - CY14; 3rd - CY15. Most Recent - CY15)
2.
Percentage of women having live births who smoked during pregnancy. [1] (Time Periods: 1st - CY13; 2nd - CY14; 3rd - CY15. Most Recent - CY15)
3.
54.26 72.73 69.23 27.60 72 104 69.23
25.97 31.03 31.40 20.87 27 86 31.40
Time Period
18.09 30.30 24.04 32.92 25 104 24.04
79.87 70.59 80.81 1.18 61 71 85.92
A. Adequate Weight Gain
38.96 47.13 48.84 25.35 42 86 48.84B. Excessive Weight Gain
15.58 21.84 18.60 19.38 16 86 18.60C. Inadequate Weight Gain
Percentage of infants enrolled in WIC who breastfed at 6 weeks postpartum. (Time Periods: 1st - FY15; 2nd - N/A; 3rd - N/A. Most Recent - FY15) [4]
5.
Percentage of Medicaid enrolled pregnant women who deliver who receive a postpartum home visit.[3] (Time Periods: 1st - CY10-12; 2nd - N/A; 3rd - CY13-15. Most Recent - CY15)
6.
7.73 2.58 -66.68 80
62.89
28.75
48.42
19.51
9.35
73.19
25.14
12.21
[2] Recommended total prenatal weight gain range by prepregnancy weight category is 28-40 lbs. for underweight women (BMI<18.5); 25-35 lbs. for normal weight women (BMI 18.5 to 24.9); 15-25 lbs. for overweight women (BMI 25 to 29.9); and 11-20 lbs. for obese women (BMI>=30).
[4] Due to Crossroads implementation, data are only available for this time period. This page will be updated to include FY16 data when it becomes available. Also, data for counties composing districts are not available.
[1] With the implementation of the 2003 revised US Standard Certificate of Live Birth in NC in August 2010, data on prenatal care initiation and tobacco use prior to 2011 are not comparable.
Data sources for these objectives are as follows: 1, 2, & 3 NC Birth Certificates; 4 NC Automated WIC System matched with Medicaid Processed Claims Report; 5 NC Automated WIC System; and 6 Medicaid Processed Claims Report.
19.48 0.00 1.16 -94.03 1 86 1.16D. Unknown Weight Gain 3.32
[3] These data exclude women enrolled in Medicaid only for emergency delivery. 2014 Medicaid match includes data from both legacy WIC and Crossroads WIC System. Effective 2015 Prenatal Medicaid match included only Crossroads WIC data.

Ashe
SFY2017-2018 MATERNAL HEALTH AGREEMENT ADDENDA DATAProcess Outcome Objectives for Counties Composing Districts
NC Percent or Rate
Process Outcome Objectives1st
Percentage of women having live births who had adequate prenatal care as defined by Kessner Index. [1] (Time Periods: 1st - CY13; 2nd - CY14; 3rd - CY15. Most Recent - CY15)
1.
2nd 3rd
% Change from 1st period to
3rd period
Most Recent Data
Num DenPercent or Rate
Percentage of Medicaid enrolled pregnant women who deliver who receive prenatal WIC Program services.[3] (Time Periods: 1st - CY07-09; 2nd - CY10-12; 3rd - CY13-15. Most Recent - CY15)
4.
Percentage of women with live term singleton births who gained adequate/excessive/ inadequate weight according to the National Academy of Sciences-Institute of Medicine (IOM) 2009 Recommended Total Weight Gain Ranges during Pregnancy.[2] (Time Periods: 1st - CY13 2nd - CY14; 3rd - CY15. Most Recent - CY15)
2.
Percentage of women having live births who smoked during pregnancy. [1] (Time Periods: 1st - CY13; 2nd - CY14; 3rd - CY15. Most Recent - CY15)
3.
80.41 73.54 78.04 -2.95 167 214 78.04
31.43 31.41 20.79 -33.86 37 178 20.79
Time Period
19.18 19.73 12.62 -34.23 27 214 12.62
74.89 74.79 75.06 0.22 93 123 75.61
A. Adequate Weight Gain
46.67 45.03 55.06 17.98 98 178 55.06B. Excessive Weight Gain
20.48 19.90 24.16 17.98 43 178 24.16C. Inadequate Weight Gain
Percentage of infants enrolled in WIC who breastfed at 6 weeks postpartum. (Time Periods: 1st - FY15; 2nd - N/A; 3rd - N/A. Most Recent - FY15) [4]
5.
Percentage of Medicaid enrolled pregnant women who deliver who receive a postpartum home visit.[3] (Time Periods: 1st - CY10-12; 2nd - N/A; 3rd - CY13-15. Most Recent - CY15)
6.
8.24 3.95 -52.05 3 142 2.11
62.89
28.75
48.42
19.51
9.35
73.19
25.14
12.21
[2] Recommended total prenatal weight gain range by prepregnancy weight category is 28-40 lbs. for underweight women (BMI<18.5); 25-35 lbs. for normal weight women (BMI 18.5 to 24.9); 15-25 lbs. for overweight women (BMI 25 to 29.9); and 11-20 lbs. for obese women (BMI>=30).
[4] Due to Crossroads implementation, data are only available for this time period. This page will be updated to include FY16 data when it becomes available. Also, data for counties composing districts are not available.
[1] With the implementation of the 2003 revised US Standard Certificate of Live Birth in NC in August 2010, data on prenatal care initiation and tobacco use prior to 2011 are not comparable.
Data sources for these objectives are as follows: 1, 2, & 3 NC Birth Certificates; 4 NC Automated WIC System matched with Medicaid Processed Claims Report; 5 NC Automated WIC System; and 6 Medicaid Processed Claims Report.
1.43 3.66 0.00 -100.00 0 178 0.00D. Unknown Weight Gain 3.32
[3] These data exclude women enrolled in Medicaid only for emergency delivery. 2014 Medicaid match includes data from both legacy WIC and Crossroads WIC System. Effective 2015 Prenatal Medicaid match included only Crossroads WIC data.

Watauga
SFY2017-2018 MATERNAL HEALTH AGREEMENT ADDENDA DATAProcess Outcome Objectives for Counties Composing Districts
NC Percent or Rate
Process Outcome Objectives1st
Percentage of women having live births who had adequate prenatal care as defined by Kessner Index. [1] (Time Periods: 1st - CY13; 2nd - CY14; 3rd - CY15. Most Recent - CY15)
1.
2nd 3rd
% Change from 1st period to
3rd period
Most Recent Data
Num DenPercent or Rate
Percentage of Medicaid enrolled pregnant women who deliver who receive prenatal WIC Program services.[3] (Time Periods: 1st - CY07-09; 2nd - CY10-12; 3rd - CY13-15. Most Recent - CY15)
4.
Percentage of women with live term singleton births who gained adequate/excessive/ inadequate weight according to the National Academy of Sciences-Institute of Medicine (IOM) 2009 Recommended Total Weight Gain Ranges during Pregnancy.[2] (Time Periods: 1st - CY13 2nd - CY14; 3rd - CY15. Most Recent - CY15)
2.
Percentage of women having live births who smoked during pregnancy. [1] (Time Periods: 1st - CY13; 2nd - CY14; 3rd - CY15. Most Recent - CY15)
3.
82.89 81.35 80.56 -2.81 286 355 80.56
31.80 26.71 34.20 7.54 105 307 34.20
Time Period
8.26 9.73 10.70 29.60 38 355 10.70
49.05 73.52 74.73 52.36 113 147 76.87
A. Adequate Weight Gain
47.54 46.29 42.67 -10.24 131 307 42.67B. Excessive Weight Gain
19.34 22.85 22.15 14.50 68 307 22.15C. Inadequate Weight Gain
Percentage of infants enrolled in WIC who breastfed at 6 weeks postpartum. (Time Periods: 1st - FY15; 2nd - N/A; 3rd - N/A. Most Recent - FY15) [4]
5.
Percentage of Medicaid enrolled pregnant women who deliver who receive a postpartum home visit.[3] (Time Periods: 1st - CY10-12; 2nd - N/A; 3rd - CY13-15. Most Recent - CY15)
6.
4.81 2.55 -46.93 165
62.89
28.75
48.42
19.51
9.35
73.19
25.14
12.21
[2] Recommended total prenatal weight gain range by prepregnancy weight category is 28-40 lbs. for underweight women (BMI<18.5); 25-35 lbs. for normal weight women (BMI 18.5 to 24.9); 15-25 lbs. for overweight women (BMI 25 to 29.9); and 11-20 lbs. for obese women (BMI>=30).
[4] Due to Crossroads implementation, data are only available for this time period. This page will be updated to include FY16 data when it becomes available. Also, data for counties composing districts are not available.
[1] With the implementation of the 2003 revised US Standard Certificate of Live Birth in NC in August 2010, data on prenatal care initiation and tobacco use prior to 2011 are not comparable.
Data sources for these objectives are as follows: 1, 2, & 3 NC Birth Certificates; 4 NC Automated WIC System matched with Medicaid Processed Claims Report; 5 NC Automated WIC System; and 6 Medicaid Processed Claims Report.
1.31 4.15 0.98 -25.49 3 307 0.98D. Unknown Weight Gain 3.32
[3] These data exclude women enrolled in Medicaid only for emergency delivery. 2014 Medicaid match includes data from both legacy WIC and Crossroads WIC System. Effective 2015 Prenatal Medicaid match included only Crossroads WIC data.

Beaufort County
SFY2017-2018 MATERNAL HEALTH AGREEMENT ADDENDA DATAProcess Outcome Objectives
NC Percent or Rate
Process Outcome Objectives1st
Percentage of women having live births who had adequate prenatal care as defined by Kessner Index. [1] (Time Periods: 1st - CY13; 2nd - CY14; 3rd - CY15. Most Recent - CY15)
1.
2nd 3rd
% Change from 1st period to
3rd period
Most Recent Data
Num DenPercent or Rate
Percentage of Medicaid enrolled pregnant women who deliver who receive prenatal WIC Program services.[3] (Time Periods: 1st - CY07-09; 2nd - CY10-12; 3rd - CY13-15. Most Recent - CY15)
4.
Percentage of women with live term singleton births who gained adequate/excessive/ inadequate weight according to the National Academy of Sciences-Institute of Medicine (IOM) 2009 Recommended Total Weight Gain Ranges during Pregnancy.[2] (Time Periods: 1st - CY13 2nd - CY14; 3rd - CY15. Most Recent - CY15)
2.
Percentage of women having live births who smoked during pregnancy. [1] (Time Periods: 1st - CY13; 2nd - CY14; 3rd - CY15. Most Recent - CY15)
3.
76.84 70.02 74.07 -3.60 360 486 74.07
27.38 26.03 26.85 -1.92 105 391 26.85
Time Period
12.91 17.00 16.67 29.10 81 486 16.67
78.76 82.58 86.16 9.41 271 298 90.94
A. Adequate Weight Gain
50.71 44.59 47.31 -6.70 185 391 47.31B. Excessive Weight Gain
17.38 26.29 25.32 45.67 99 391 25.32C. Inadequate Weight Gain
Percentage of infants enrolled in WIC who breastfed at 6 weeks postpartum. (Time Periods: 1st - FY15; 2nd - N/A; 3rd - N/A. Most Recent - FY15) [4]
5.27.71 87 314 27.71
Percentage of Medicaid enrolled pregnant women who deliver who receive a postpartum home visit.[3] (Time Periods: 1st - CY10-12; 2nd - N/A; 3rd - CY13-15. Most Recent - CY15)
6.
21.09 34.88 65.44 166 342 48.54
62.89
28.75
48.42
19.51
9.35
73.19
25.14
12.21
[2] Recommended total prenatal weight gain range by prepregnancy weight category is 28-40 lbs. for underweight women (BMI<18.5); 25-35 lbs. for normal weight women (BMI 18.5 to 24.9); 15-25 lbs. for overweight women (BMI 25 to 29.9); and 11-20 lbs. for obese women (BMI>=30).
[4] Due to Crossroads implementation, data are only available for this time period. This page will be updated to include FY16 data when it becomes available. Also, data for counties composing districts are not available.
[1] With the implementation of the 2003 revised US Standard Certificate of Live Birth in NC in August 2010, data on prenatal care initiation and tobacco use prior to 2011 are not comparable.
Data sources for these objectives are as follows: 1, 2, & 3 NC Birth Certificates; 4 NC Automated WIC System matched with Medicaid Processed Claims Report; 5 NC Automated WIC System; and 6 Medicaid Processed Claims Report.
4.52 3.09 0.51 -88.69 2 391 0.51D. Unknown Weight Gain 3.32
[3] These data exclude women enrolled in Medicaid only for emergency delivery. 2014 Medicaid match includes data from both legacy WIC and Crossroads WIC System. Effective 2015 Prenatal Medicaid match included only Crossroads WIC data.

Bladen County
SFY2017-2018 MATERNAL HEALTH AGREEMENT ADDENDA DATAProcess Outcome Objectives
NC Percent or Rate
Process Outcome Objectives1st
Percentage of women having live births who had adequate prenatal care as defined by Kessner Index. [1] (Time Periods: 1st - CY13; 2nd - CY14; 3rd - CY15. Most Recent - CY15)
1.
2nd 3rd
% Change from 1st period to
3rd period
Most Recent Data
Num DenPercent or Rate
Percentage of Medicaid enrolled pregnant women who deliver who receive prenatal WIC Program services.[3] (Time Periods: 1st - CY07-09; 2nd - CY10-12; 3rd - CY13-15. Most Recent - CY15)
4.
Percentage of women with live term singleton births who gained adequate/excessive/ inadequate weight according to the National Academy of Sciences-Institute of Medicine (IOM) 2009 Recommended Total Weight Gain Ranges during Pregnancy.[2] (Time Periods: 1st - CY13 2nd - CY14; 3rd - CY15. Most Recent - CY15)
2.
Percentage of women having live births who smoked during pregnancy. [1] (Time Periods: 1st - CY13; 2nd - CY14; 3rd - CY15. Most Recent - CY15)
3.
59.23 50.69 56.41 -4.76 198 351 56.41
30.56 33.11 30.39 -0.58 86 283 30.39
Time Period
18.73 15.98 19.66 4.94 69 351 19.66
83.05 83.68 78.65 -5.30 204 256 79.69
A. Adequate Weight Gain
44.19 43.24 41.70 -5.64 118 283 41.70B. Excessive Weight Gain
23.59 22.64 27.56 16.85 78 283 27.56C. Inadequate Weight Gain
Percentage of infants enrolled in WIC who breastfed at 6 weeks postpartum. (Time Periods: 1st - FY15; 2nd - N/A; 3rd - N/A. Most Recent - FY15) [4]
5.26.07 73 280 26.07
Percentage of Medicaid enrolled pregnant women who deliver who receive a postpartum home visit.[3] (Time Periods: 1st - CY10-12; 2nd - N/A; 3rd - CY13-15. Most Recent - CY15)
6.
3.32 9.74 193.43 37 287 12.89
62.89
28.75
48.42
19.51
9.35
73.19
25.14
12.21
[2] Recommended total prenatal weight gain range by prepregnancy weight category is 28-40 lbs. for underweight women (BMI<18.5); 25-35 lbs. for normal weight women (BMI 18.5 to 24.9); 15-25 lbs. for overweight women (BMI 25 to 29.9); and 11-20 lbs. for obese women (BMI>=30).
[4] Due to Crossroads implementation, data are only available for this time period. This page will be updated to include FY16 data when it becomes available. Also, data for counties composing districts are not available.
[1] With the implementation of the 2003 revised US Standard Certificate of Live Birth in NC in August 2010, data on prenatal care initiation and tobacco use prior to 2011 are not comparable.
Data sources for these objectives are as follows: 1, 2, & 3 NC Birth Certificates; 4 NC Automated WIC System matched with Medicaid Processed Claims Report; 5 NC Automated WIC System; and 6 Medicaid Processed Claims Report.
1.66 1.01 0.35 -78.73 1 283 0.35D. Unknown Weight Gain 3.32
[3] These data exclude women enrolled in Medicaid only for emergency delivery. 2014 Medicaid match includes data from both legacy WIC and Crossroads WIC System. Effective 2015 Prenatal Medicaid match included only Crossroads WIC data.

Brunswick County
SFY2017-2018 MATERNAL HEALTH AGREEMENT ADDENDA DATAProcess Outcome Objectives
NC Percent or Rate
Process Outcome Objectives1st
Percentage of women having live births who had adequate prenatal care as defined by Kessner Index. [1] (Time Periods: 1st - CY13; 2nd - CY14; 3rd - CY15. Most Recent - CY15)
1.
2nd 3rd
% Change from 1st period to
3rd period
Most Recent Data
Num DenPercent or Rate
Percentage of Medicaid enrolled pregnant women who deliver who receive prenatal WIC Program services.[3] (Time Periods: 1st - CY07-09; 2nd - CY10-12; 3rd - CY13-15. Most Recent - CY15)
4.
Percentage of women with live term singleton births who gained adequate/excessive/ inadequate weight according to the National Academy of Sciences-Institute of Medicine (IOM) 2009 Recommended Total Weight Gain Ranges during Pregnancy.[2] (Time Periods: 1st - CY13 2nd - CY14; 3rd - CY15. Most Recent - CY15)
2.
Percentage of women having live births who smoked during pregnancy. [1] (Time Periods: 1st - CY13; 2nd - CY14; 3rd - CY15. Most Recent - CY15)
3.
65.27 63.43 56.23 -13.86 587 1,044 56.23
27.44 27.75 27.51 0.27 249 905 27.51
Time Period
15.52 16.61 13.79 -11.14 144 1,044 13.79
76.09 74.10 72.70 -4.47 420 559 75.13
A. Adequate Weight Gain
51.32 53.28 51.82 0.98 469 905 51.82B. Excessive Weight Gain
20.09 18.11 20.22 0.64 183 905 20.22C. Inadequate Weight Gain
Percentage of infants enrolled in WIC who breastfed at 6 weeks postpartum. (Time Periods: 1st - FY15; 2nd - N/A; 3rd - N/A. Most Recent - FY15) [4]
5.25.37 153 603 25.37
Percentage of Medicaid enrolled pregnant women who deliver who receive a postpartum home visit.[3] (Time Periods: 1st - CY10-12; 2nd - N/A; 3rd - CY13-15. Most Recent - CY15)
6.
3.03 0.47 -84.47 4 642 0.62
62.89
28.75
48.42
19.51
9.35
73.19
25.14
12.21
[2] Recommended total prenatal weight gain range by prepregnancy weight category is 28-40 lbs. for underweight women (BMI<18.5); 25-35 lbs. for normal weight women (BMI 18.5 to 24.9); 15-25 lbs. for overweight women (BMI 25 to 29.9); and 11-20 lbs. for obese women (BMI>=30).
[4] Due to Crossroads implementation, data are only available for this time period. This page will be updated to include FY16 data when it becomes available. Also, data for counties composing districts are not available.
[1] With the implementation of the 2003 revised US Standard Certificate of Live Birth in NC in August 2010, data on prenatal care initiation and tobacco use prior to 2011 are not comparable.
Data sources for these objectives are as follows: 1, 2, & 3 NC Birth Certificates; 4 NC Automated WIC System matched with Medicaid Processed Claims Report; 5 NC Automated WIC System; and 6 Medicaid Processed Claims Report.
1.15 0.85 0.44 -61.50 4 905 0.44D. Unknown Weight Gain 3.32
[3] These data exclude women enrolled in Medicaid only for emergency delivery. 2014 Medicaid match includes data from both legacy WIC and Crossroads WIC System. Effective 2015 Prenatal Medicaid match included only Crossroads WIC data.

Buncombe County
SFY2017-2018 MATERNAL HEALTH AGREEMENT ADDENDA DATAProcess Outcome Objectives
NC Percent or Rate
Process Outcome Objectives1st
Percentage of women having live births who had adequate prenatal care as defined by Kessner Index. [1] (Time Periods: 1st - CY13; 2nd - CY14; 3rd - CY15. Most Recent - CY15)
1.
2nd 3rd
% Change from 1st period to
3rd period
Most Recent Data
Num DenPercent or Rate
Percentage of Medicaid enrolled pregnant women who deliver who receive prenatal WIC Program services.[3] (Time Periods: 1st - CY07-09; 2nd - CY10-12; 3rd - CY13-15. Most Recent - CY15)
4.
Percentage of women with live term singleton births who gained adequate/excessive/ inadequate weight according to the National Academy of Sciences-Institute of Medicine (IOM) 2009 Recommended Total Weight Gain Ranges during Pregnancy.[2] (Time Periods: 1st - CY13 2nd - CY14; 3rd - CY15. Most Recent - CY15)
2.
Percentage of women having live births who smoked during pregnancy. [1] (Time Periods: 1st - CY13; 2nd - CY14; 3rd - CY15. Most Recent - CY15)
3.
77.11 84.78 85.68 11.11 2,249 2,625 85.68
28.98 27.38 27.56 -4.91 636 2,308 27.56
Time Period
3.41 4.23 5.18 51.73 136 2,625 5.18
70.86 71.29 72.51 2.34 955 1,357 70.38
A. Adequate Weight Gain
38.61 40.46 37.74 -2.26 871 2,308 37.74B. Excessive Weight Gain
19.92 20.80 17.59 -11.70 406 2,308 17.59C. Inadequate Weight Gain
Percentage of infants enrolled in WIC who breastfed at 6 weeks postpartum. (Time Periods: 1st - FY15; 2nd - N/A; 3rd - N/A. Most Recent - FY15) [4]
5.24.31 301 1,238 24.31
Percentage of Medicaid enrolled pregnant women who deliver who receive a postpartum home visit.[3] (Time Periods: 1st - CY10-12; 2nd - N/A; 3rd - CY13-15. Most Recent - CY15)
6.
9.28 2.01 -78.36 30 1,587 1.89
62.89
28.75
48.42
19.51
9.35
73.19
25.14
12.21
[2] Recommended total prenatal weight gain range by prepregnancy weight category is 28-40 lbs. for underweight women (BMI<18.5); 25-35 lbs. for normal weight women (BMI 18.5 to 24.9); 15-25 lbs. for overweight women (BMI 25 to 29.9); and 11-20 lbs. for obese women (BMI>=30).
[4] Due to Crossroads implementation, data are only available for this time period. This page will be updated to include FY16 data when it becomes available. Also, data for counties composing districts are not available.
[1] With the implementation of the 2003 revised US Standard Certificate of Live Birth in NC in August 2010, data on prenatal care initiation and tobacco use prior to 2011 are not comparable.
Data sources for these objectives are as follows: 1, 2, & 3 NC Birth Certificates; 4 NC Automated WIC System matched with Medicaid Processed Claims Report; 5 NC Automated WIC System; and 6 Medicaid Processed Claims Report.
12.49 11.35 17.11 37.04 395 2,308 17.11D. Unknown Weight Gain 3.32
[3] These data exclude women enrolled in Medicaid only for emergency delivery. 2014 Medicaid match includes data from both legacy WIC and Crossroads WIC System. Effective 2015 Prenatal Medicaid match included only Crossroads WIC data.

Burke County
SFY2017-2018 MATERNAL HEALTH AGREEMENT ADDENDA DATAProcess Outcome Objectives
NC Percent or Rate
Process Outcome Objectives1st
Percentage of women having live births who had adequate prenatal care as defined by Kessner Index. [1] (Time Periods: 1st - CY13; 2nd - CY14; 3rd - CY15. Most Recent - CY15)
1.
2nd 3rd
% Change from 1st period to
3rd period
Most Recent Data
Num DenPercent or Rate
Percentage of Medicaid enrolled pregnant women who deliver who receive prenatal WIC Program services.[3] (Time Periods: 1st - CY07-09; 2nd - CY10-12; 3rd - CY13-15. Most Recent - CY15)
4.
Percentage of women with live term singleton births who gained adequate/excessive/ inadequate weight according to the National Academy of Sciences-Institute of Medicine (IOM) 2009 Recommended Total Weight Gain Ranges during Pregnancy.[2] (Time Periods: 1st - CY13 2nd - CY14; 3rd - CY15. Most Recent - CY15)
2.
Percentage of women having live births who smoked during pregnancy. [1] (Time Periods: 1st - CY13; 2nd - CY14; 3rd - CY15. Most Recent - CY15)
3.
64.22 64.29 62.60 -2.53 564 901 62.60
29.53 27.66 29.17 -1.24 231 792 29.17
Time Period
19.54 19.89 17.43 -10.81 157 901 17.43
71.15 73.37 77.36 8.72 462 614 75.24
A. Adequate Weight Gain
45.05 42.73 37.88 -15.93 300 792 37.88B. Excessive Weight Gain
23.76 24.03 28.41 19.55 225 792 28.41C. Inadequate Weight Gain
Percentage of infants enrolled in WIC who breastfed at 6 weeks postpartum. (Time Periods: 1st - FY15; 2nd - N/A; 3rd - N/A. Most Recent - FY15) [4]
5.31.65 200 632 31.65
Percentage of Medicaid enrolled pregnant women who deliver who receive a postpartum home visit.[3] (Time Periods: 1st - CY10-12; 2nd - N/A; 3rd - CY13-15. Most Recent - CY15)
6.
10.50 9.27 -11.74 18 664 2.71
62.89
28.75
48.42
19.51
9.35
73.19
25.14
12.21
[2] Recommended total prenatal weight gain range by prepregnancy weight category is 28-40 lbs. for underweight women (BMI<18.5); 25-35 lbs. for normal weight women (BMI 18.5 to 24.9); 15-25 lbs. for overweight women (BMI 25 to 29.9); and 11-20 lbs. for obese women (BMI>=30).
[4] Due to Crossroads implementation, data are only available for this time period. This page will be updated to include FY16 data when it becomes available. Also, data for counties composing districts are not available.
[1] With the implementation of the 2003 revised US Standard Certificate of Live Birth in NC in August 2010, data on prenatal care initiation and tobacco use prior to 2011 are not comparable.
Data sources for these objectives are as follows: 1, 2, & 3 NC Birth Certificates; 4 NC Automated WIC System matched with Medicaid Processed Claims Report; 5 NC Automated WIC System; and 6 Medicaid Processed Claims Report.
1.65 5.58 4.55 175.76 36 792 4.55D. Unknown Weight Gain 3.32
[3] These data exclude women enrolled in Medicaid only for emergency delivery. 2014 Medicaid match includes data from both legacy WIC and Crossroads WIC System. Effective 2015 Prenatal Medicaid match included only Crossroads WIC data.

Cabarrus County
SFY2017-2018 MATERNAL HEALTH AGREEMENT ADDENDA DATAProcess Outcome Objectives
NC Percent or Rate
Process Outcome Objectives1st
Percentage of women having live births who had adequate prenatal care as defined by Kessner Index. [1] (Time Periods: 1st - CY13; 2nd - CY14; 3rd - CY15. Most Recent - CY15)
1.
2nd 3rd
% Change from 1st period to
3rd period
Most Recent Data
Num DenPercent or Rate
Percentage of Medicaid enrolled pregnant women who deliver who receive prenatal WIC Program services.[3] (Time Periods: 1st - CY07-09; 2nd - CY10-12; 3rd - CY13-15. Most Recent - CY15)
4.
Percentage of women with live term singleton births who gained adequate/excessive/ inadequate weight according to the National Academy of Sciences-Institute of Medicine (IOM) 2009 Recommended Total Weight Gain Ranges during Pregnancy.[2] (Time Periods: 1st - CY13 2nd - CY14; 3rd - CY15. Most Recent - CY15)
2.
Percentage of women having live births who smoked during pregnancy. [1] (Time Periods: 1st - CY13; 2nd - CY14; 3rd - CY15. Most Recent - CY15)
3.
61.38 57.34 56.79 -7.46 1,396 2,458 56.79
30.06 27.74 27.84 -7.37 593 2,130 27.84
Time Period
9.78 9.29 8.50 -13.02 209 2,458 8.50
69.95 66.08 65.65 -6.15 667 1,051 63.46
A. Adequate Weight Gain
50.03 51.48 49.81 -0.43 1,061 2,130 49.81B. Excessive Weight Gain
18.21 18.76 21.13 15.99 450 2,130 21.13C. Inadequate Weight Gain
Percentage of infants enrolled in WIC who breastfed at 6 weeks postpartum. (Time Periods: 1st - FY15; 2nd - N/A; 3rd - N/A. Most Recent - FY15) [4]
5.24.13 279 1,156 24.13
Percentage of Medicaid enrolled pregnant women who deliver who receive a postpartum home visit.[3] (Time Periods: 1st - CY10-12; 2nd - N/A; 3rd - CY13-15. Most Recent - CY15)
6.
5.58 8.62 54.50 157 1,249 12.57
62.89
28.75
48.42
19.51
9.35
73.19
25.14
12.21
[2] Recommended total prenatal weight gain range by prepregnancy weight category is 28-40 lbs. for underweight women (BMI<18.5); 25-35 lbs. for normal weight women (BMI 18.5 to 24.9); 15-25 lbs. for overweight women (BMI 25 to 29.9); and 11-20 lbs. for obese women (BMI>=30).
[4] Due to Crossroads implementation, data are only available for this time period. This page will be updated to include FY16 data when it becomes available. Also, data for counties composing districts are not available.
[1] With the implementation of the 2003 revised US Standard Certificate of Live Birth in NC in August 2010, data on prenatal care initiation and tobacco use prior to 2011 are not comparable.
Data sources for these objectives are as follows: 1, 2, & 3 NC Birth Certificates; 4 NC Automated WIC System matched with Medicaid Processed Claims Report; 5 NC Automated WIC System; and 6 Medicaid Processed Claims Report.
1.71 2.02 1.22 -28.45 26 2,130 1.22D. Unknown Weight Gain 3.32
[3] These data exclude women enrolled in Medicaid only for emergency delivery. 2014 Medicaid match includes data from both legacy WIC and Crossroads WIC System. Effective 2015 Prenatal Medicaid match included only Crossroads WIC data.

Caldwell County
SFY2017-2018 MATERNAL HEALTH AGREEMENT ADDENDA DATAProcess Outcome Objectives
NC Percent or Rate
Process Outcome Objectives1st
Percentage of women having live births who had adequate prenatal care as defined by Kessner Index. [1] (Time Periods: 1st - CY13; 2nd - CY14; 3rd - CY15. Most Recent - CY15)
1.
2nd 3rd
% Change from 1st period to
3rd period
Most Recent Data
Num DenPercent or Rate
Percentage of Medicaid enrolled pregnant women who deliver who receive prenatal WIC Program services.[3] (Time Periods: 1st - CY07-09; 2nd - CY10-12; 3rd - CY13-15. Most Recent - CY15)
4.
Percentage of women with live term singleton births who gained adequate/excessive/ inadequate weight according to the National Academy of Sciences-Institute of Medicine (IOM) 2009 Recommended Total Weight Gain Ranges during Pregnancy.[2] (Time Periods: 1st - CY13 2nd - CY14; 3rd - CY15. Most Recent - CY15)
2.
Percentage of women having live births who smoked during pregnancy. [1] (Time Periods: 1st - CY13; 2nd - CY14; 3rd - CY15. Most Recent - CY15)
3.
68.93 64.25 66.63 -3.35 533 800 66.63
24.79 29.83 23.43 -5.48 164 700 23.43
Time Period
21.13 23.31 19.38 -8.31 155 800 19.38
72.52 79.43 77.28 6.55 446 573 77.84
A. Adequate Weight Gain
52.83 46.59 54.71 3.56 383 700 54.71B. Excessive Weight Gain
22.10 22.73 20.71 -6.25 145 700 20.71C. Inadequate Weight Gain
Percentage of infants enrolled in WIC who breastfed at 6 weeks postpartum. (Time Periods: 1st - FY15; 2nd - N/A; 3rd - N/A. Most Recent - FY15) [4]
5.40.51 207 511 40.51
Percentage of Medicaid enrolled pregnant women who deliver who receive a postpartum home visit.[3] (Time Periods: 1st - CY10-12; 2nd - N/A; 3rd - CY13-15. Most Recent - CY15)
6.
24.66 4.54 -81.59 28 600 4.67
62.89
28.75
48.42
19.51
9.35
73.19
25.14
12.21
[2] Recommended total prenatal weight gain range by prepregnancy weight category is 28-40 lbs. for underweight women (BMI<18.5); 25-35 lbs. for normal weight women (BMI 18.5 to 24.9); 15-25 lbs. for overweight women (BMI 25 to 29.9); and 11-20 lbs. for obese women (BMI>=30).
[4] Due to Crossroads implementation, data are only available for this time period. This page will be updated to include FY16 data when it becomes available. Also, data for counties composing districts are not available.
[1] With the implementation of the 2003 revised US Standard Certificate of Live Birth in NC in August 2010, data on prenatal care initiation and tobacco use prior to 2011 are not comparable.
Data sources for these objectives are as follows: 1, 2, & 3 NC Birth Certificates; 4 NC Automated WIC System matched with Medicaid Processed Claims Report; 5 NC Automated WIC System; and 6 Medicaid Processed Claims Report.
0.28 0.85 1.14 303.43 8 700 1.14D. Unknown Weight Gain 3.32
[3] These data exclude women enrolled in Medicaid only for emergency delivery. 2014 Medicaid match includes data from both legacy WIC and Crossroads WIC System. Effective 2015 Prenatal Medicaid match included only Crossroads WIC data.

Carteret County
SFY2017-2018 MATERNAL HEALTH AGREEMENT ADDENDA DATAProcess Outcome Objectives
NC Percent or Rate
Process Outcome Objectives1st
Percentage of women having live births who had adequate prenatal care as defined by Kessner Index. [1] (Time Periods: 1st - CY13; 2nd - CY14; 3rd - CY15. Most Recent - CY15)
1.
2nd 3rd
% Change from 1st period to
3rd period
Most Recent Data
Num DenPercent or Rate
Percentage of Medicaid enrolled pregnant women who deliver who receive prenatal WIC Program services.[3] (Time Periods: 1st - CY07-09; 2nd - CY10-12; 3rd - CY13-15. Most Recent - CY15)
4.
Percentage of women with live term singleton births who gained adequate/excessive/ inadequate weight according to the National Academy of Sciences-Institute of Medicine (IOM) 2009 Recommended Total Weight Gain Ranges during Pregnancy.[2] (Time Periods: 1st - CY13 2nd - CY14; 3rd - CY15. Most Recent - CY15)
2.
Percentage of women having live births who smoked during pregnancy. [1] (Time Periods: 1st - CY13; 2nd - CY14; 3rd - CY15. Most Recent - CY15)
3.
75.57 72.81 75.98 0.54 465 612 75.98
27.72 30.72 27.97 0.91 146 522 27.97
Time Period
18.97 17.56 16.67 -12.13 102 612 16.67
66.09 71.87 78.57 18.89 238 311 76.53
A. Adequate Weight Gain
53.26 51.86 55.17 3.59 288 522 55.17B. Excessive Weight Gain
17.93 16.83 16.09 -10.28 84 522 16.09C. Inadequate Weight Gain
Percentage of infants enrolled in WIC who breastfed at 6 weeks postpartum. (Time Periods: 1st - FY15; 2nd - N/A; 3rd - N/A. Most Recent - FY15) [4]
5.23.74 80 337 23.74
Percentage of Medicaid enrolled pregnant women who deliver who receive a postpartum home visit.[3] (Time Periods: 1st - CY10-12; 2nd - N/A; 3rd - CY13-15. Most Recent - CY15)
6.
15.84 22.90 44.62 90 324 27.78
62.89
28.75
48.42
19.51
9.35
73.19
25.14
12.21
[2] Recommended total prenatal weight gain range by prepregnancy weight category is 28-40 lbs. for underweight women (BMI<18.5); 25-35 lbs. for normal weight women (BMI 18.5 to 24.9); 15-25 lbs. for overweight women (BMI 25 to 29.9); and 11-20 lbs. for obese women (BMI>=30).
[4] Due to Crossroads implementation, data are only available for this time period. This page will be updated to include FY16 data when it becomes available. Also, data for counties composing districts are not available.
[1] With the implementation of the 2003 revised US Standard Certificate of Live Birth in NC in August 2010, data on prenatal care initiation and tobacco use prior to 2011 are not comparable.
Data sources for these objectives are as follows: 1, 2, & 3 NC Birth Certificates; 4 NC Automated WIC System matched with Medicaid Processed Claims Report; 5 NC Automated WIC System; and 6 Medicaid Processed Claims Report.
1.09 0.59 0.77 -29.50 4 522 0.77D. Unknown Weight Gain 3.32
[3] These data exclude women enrolled in Medicaid only for emergency delivery. 2014 Medicaid match includes data from both legacy WIC and Crossroads WIC System. Effective 2015 Prenatal Medicaid match included only Crossroads WIC data.

Caswell County
SFY2017-2018 MATERNAL HEALTH AGREEMENT ADDENDA DATAProcess Outcome Objectives
NC Percent or Rate
Process Outcome Objectives1st
Percentage of women having live births who had adequate prenatal care as defined by Kessner Index. [1] (Time Periods: 1st - CY13; 2nd - CY14; 3rd - CY15. Most Recent - CY15)
1.
2nd 3rd
% Change from 1st period to
3rd period
Most Recent Data
Num DenPercent or Rate
Percentage of Medicaid enrolled pregnant women who deliver who receive prenatal WIC Program services.[3] (Time Periods: 1st - CY07-09; 2nd - CY10-12; 3rd - CY13-15. Most Recent - CY15)
4.
Percentage of women with live term singleton births who gained adequate/excessive/ inadequate weight according to the National Academy of Sciences-Institute of Medicine (IOM) 2009 Recommended Total Weight Gain Ranges during Pregnancy.[2] (Time Periods: 1st - CY13 2nd - CY14; 3rd - CY15. Most Recent - CY15)
2.
Percentage of women having live births who smoked during pregnancy. [1] (Time Periods: 1st - CY13; 2nd - CY14; 3rd - CY15. Most Recent - CY15)
3.
51.85 56.67 63.35 22.18 121 191 63.35
24.08 38.55 25.00 3.80 39 156 25.00
Time Period
13.89 20.48 11.52 -17.07 22 191 11.52
82.66 69.39 77.21 -6.60 90 124 72.58
A. Adequate Weight Gain
46.60 41.34 53.21 14.18 83 156 53.21B. Excessive Weight Gain
12.04 17.88 16.67 38.41 26 156 16.67C. Inadequate Weight Gain
Percentage of infants enrolled in WIC who breastfed at 6 weeks postpartum. (Time Periods: 1st - FY15; 2nd - N/A; 3rd - N/A. Most Recent - FY15) [4]
5.42.42 56 132 42.42
Percentage of Medicaid enrolled pregnant women who deliver who receive a postpartum home visit.[3] (Time Periods: 1st - CY10-12; 2nd - N/A; 3rd - CY13-15. Most Recent - CY15)
6.
150
62.89
28.75
48.42
19.51
9.35
73.19
25.14
12.21
[2] Recommended total prenatal weight gain range by prepregnancy weight category is 28-40 lbs. for underweight women (BMI<18.5); 25-35 lbs. for normal weight women (BMI 18.5 to 24.9); 15-25 lbs. for overweight women (BMI 25 to 29.9); and 11-20 lbs. for obese women (BMI>=30).
[4] Due to Crossroads implementation, data are only available for this time period. This page will be updated to include FY16 data when it becomes available. Also, data for counties composing districts are not available.
[1] With the implementation of the 2003 revised US Standard Certificate of Live Birth in NC in August 2010, data on prenatal care initiation and tobacco use prior to 2011 are not comparable.
Data sources for these objectives are as follows: 1, 2, & 3 NC Birth Certificates; 4 NC Automated WIC System matched with Medicaid Processed Claims Report; 5 NC Automated WIC System; and 6 Medicaid Processed Claims Report.
17.28 2.23 5.13 -70.32 8 156 5.13D. Unknown Weight Gain 3.32
[3] These data exclude women enrolled in Medicaid only for emergency delivery. 2014 Medicaid match includes data from both legacy WIC and Crossroads WIC System. Effective 2015 Prenatal Medicaid match included only Crossroads WIC data.

Catawba County
SFY2017-2018 MATERNAL HEALTH AGREEMENT ADDENDA DATAProcess Outcome Objectives
NC Percent or Rate
Process Outcome Objectives1st
Percentage of women having live births who had adequate prenatal care as defined by Kessner Index. [1] (Time Periods: 1st - CY13; 2nd - CY14; 3rd - CY15. Most Recent - CY15)
1.
2nd 3rd
% Change from 1st period to
3rd period
Most Recent Data
Num DenPercent or Rate
Percentage of Medicaid enrolled pregnant women who deliver who receive prenatal WIC Program services.[3] (Time Periods: 1st - CY07-09; 2nd - CY10-12; 3rd - CY13-15. Most Recent - CY15)
4.
Percentage of women with live term singleton births who gained adequate/excessive/ inadequate weight according to the National Academy of Sciences-Institute of Medicine (IOM) 2009 Recommended Total Weight Gain Ranges during Pregnancy.[2] (Time Periods: 1st - CY13 2nd - CY14; 3rd - CY15. Most Recent - CY15)
2.
Percentage of women having live births who smoked during pregnancy. [1] (Time Periods: 1st - CY13; 2nd - CY14; 3rd - CY15. Most Recent - CY15)
3.
69.32 70.82 70.75 2.07 1,241 1,754 70.75
31.88 29.37 29.72 -6.77 455 1,531 29.72
Time Period
16.03 15.84 16.02 -0.05 281 1,754 16.02
73.39 69.91 74.79 1.90 797 1,064 74.91
A. Adequate Weight Gain
46.83 51.30 50.42 7.69 772 1,531 50.42B. Excessive Weight Gain
20.34 19.01 19.01 -6.56 291 1,531 19.01C. Inadequate Weight Gain
Percentage of infants enrolled in WIC who breastfed at 6 weeks postpartum. (Time Periods: 1st - FY15; 2nd - N/A; 3rd - N/A. Most Recent - FY15) [4]
5.28.40 326 1,148 28.40
Percentage of Medicaid enrolled pregnant women who deliver who receive a postpartum home visit.[3] (Time Periods: 1st - CY10-12; 2nd - N/A; 3rd - CY13-15. Most Recent - CY15)
6.
3.77 24.83 558.77 315 1,243 25.34
62.89
28.75
48.42
19.51
9.35
73.19
25.14
12.21
[2] Recommended total prenatal weight gain range by prepregnancy weight category is 28-40 lbs. for underweight women (BMI<18.5); 25-35 lbs. for normal weight women (BMI 18.5 to 24.9); 15-25 lbs. for overweight women (BMI 25 to 29.9); and 11-20 lbs. for obese women (BMI>=30).
[4] Due to Crossroads implementation, data are only available for this time period. This page will be updated to include FY16 data when it becomes available. Also, data for counties composing districts are not available.
[1] With the implementation of the 2003 revised US Standard Certificate of Live Birth in NC in August 2010, data on prenatal care initiation and tobacco use prior to 2011 are not comparable.
Data sources for these objectives are as follows: 1, 2, & 3 NC Birth Certificates; 4 NC Automated WIC System matched with Medicaid Processed Claims Report; 5 NC Automated WIC System; and 6 Medicaid Processed Claims Report.
0.96 0.32 0.85 -11.15 13 1,531 0.85D. Unknown Weight Gain 3.32
[3] These data exclude women enrolled in Medicaid only for emergency delivery. 2014 Medicaid match includes data from both legacy WIC and Crossroads WIC System. Effective 2015 Prenatal Medicaid match included only Crossroads WIC data.

Chatham County
SFY2017-2018 MATERNAL HEALTH AGREEMENT ADDENDA DATAProcess Outcome Objectives
NC Percent or Rate
Process Outcome Objectives1st
Percentage of women having live births who had adequate prenatal care as defined by Kessner Index. [1] (Time Periods: 1st - CY13; 2nd - CY14; 3rd - CY15. Most Recent - CY15)
1.
2nd 3rd
% Change from 1st period to
3rd period
Most Recent Data
Num DenPercent or Rate
Percentage of Medicaid enrolled pregnant women who deliver who receive prenatal WIC Program services.[3] (Time Periods: 1st - CY07-09; 2nd - CY10-12; 3rd - CY13-15. Most Recent - CY15)
4.
Percentage of women with live term singleton births who gained adequate/excessive/ inadequate weight according to the National Academy of Sciences-Institute of Medicine (IOM) 2009 Recommended Total Weight Gain Ranges during Pregnancy.[2] (Time Periods: 1st - CY13 2nd - CY14; 3rd - CY15. Most Recent - CY15)
2.
Percentage of women having live births who smoked during pregnancy. [1] (Time Periods: 1st - CY13; 2nd - CY14; 3rd - CY15. Most Recent - CY15)
3.
52.05 56.39 64.51 23.93 429 665 64.51
33.33 29.92 26.89 -19.33 160 595 26.89
Time Period
7.72 6.39 3.76 -51.29 25 665 3.76
70.52 70.65 72.38 2.64 153 228 67.11
A. Adequate Weight Gain
40.95 42.86 49.41 20.66 294 595 49.41B. Excessive Weight Gain
19.24 23.17 14.29 -25.74 85 595 14.29C. Inadequate Weight Gain
Percentage of infants enrolled in WIC who breastfed at 6 weeks postpartum. (Time Periods: 1st - FY15; 2nd - N/A; 3rd - N/A. Most Recent - FY15) [4]
5.17.46 194 1,111 17.46
Percentage of Medicaid enrolled pregnant women who deliver who receive a postpartum home visit.[3] (Time Periods: 1st - CY10-12; 2nd - N/A; 3rd - CY13-15. Most Recent - CY15)
6.
1.20 0.90 -24.59 2 345 0.58
62.89
28.75
48.42
19.51
9.35
73.19
25.14
12.21
[2] Recommended total prenatal weight gain range by prepregnancy weight category is 28-40 lbs. for underweight women (BMI<18.5); 25-35 lbs. for normal weight women (BMI 18.5 to 24.9); 15-25 lbs. for overweight women (BMI 25 to 29.9); and 11-20 lbs. for obese women (BMI>=30).
[4] Due to Crossroads implementation, data are only available for this time period. This page will be updated to include FY16 data when it becomes available. Also, data for counties composing districts are not available.
[1] With the implementation of the 2003 revised US Standard Certificate of Live Birth in NC in August 2010, data on prenatal care initiation and tobacco use prior to 2011 are not comparable.
Data sources for these objectives are as follows: 1, 2, & 3 NC Birth Certificates; 4 NC Automated WIC System matched with Medicaid Processed Claims Report; 5 NC Automated WIC System; and 6 Medicaid Processed Claims Report.
6.48 4.05 9.41 45.33 56 595 9.41D. Unknown Weight Gain 3.32
[3] These data exclude women enrolled in Medicaid only for emergency delivery. 2014 Medicaid match includes data from both legacy WIC and Crossroads WIC System. Effective 2015 Prenatal Medicaid match included only Crossroads WIC data.

Cherokee County
SFY2017-2018 MATERNAL HEALTH AGREEMENT ADDENDA DATAProcess Outcome Objectives
NC Percent or Rate
Process Outcome Objectives1st
Percentage of women having live births who had adequate prenatal care as defined by Kessner Index. [1] (Time Periods: 1st - CY13; 2nd - CY14; 3rd - CY15. Most Recent - CY15)
1.
2nd 3rd
% Change from 1st period to
3rd period
Most Recent Data
Num DenPercent or Rate
Percentage of Medicaid enrolled pregnant women who deliver who receive prenatal WIC Program services.[3] (Time Periods: 1st - CY07-09; 2nd - CY10-12; 3rd - CY13-15. Most Recent - CY15)
4.
Percentage of women with live term singleton births who gained adequate/excessive/ inadequate weight according to the National Academy of Sciences-Institute of Medicine (IOM) 2009 Recommended Total Weight Gain Ranges during Pregnancy.[2] (Time Periods: 1st - CY13 2nd - CY14; 3rd - CY15. Most Recent - CY15)
2.
Percentage of women having live births who smoked during pregnancy. [1] (Time Periods: 1st - CY13; 2nd - CY14; 3rd - CY15. Most Recent - CY15)
3.
64.32 67.62 74.77 16.26 166 222 74.77
28.11 22.16 31.32 11.42 57 182 31.32
Time Period
22.07 25.24 18.47 -16.30 41 222 18.47
81.30 80.34 80.39 -1.12 125 152 82.24
A. Adequate Weight Gain
49.19 58.52 48.35 -1.70 88 182 48.35B. Excessive Weight Gain
20.54 19.32 19.23 -6.38 35 182 19.23C. Inadequate Weight Gain
Percentage of infants enrolled in WIC who breastfed at 6 weeks postpartum. (Time Periods: 1st - FY15; 2nd - N/A; 3rd - N/A. Most Recent - FY15) [4]
5.40.28 58 144 40.28
Percentage of Medicaid enrolled pregnant women who deliver who receive a postpartum home visit.[3] (Time Periods: 1st - CY10-12; 2nd - N/A; 3rd - CY13-15. Most Recent - CY15)
6.
164
62.89
28.75
48.42
19.51
9.35
73.19
25.14
12.21
[2] Recommended total prenatal weight gain range by prepregnancy weight category is 28-40 lbs. for underweight women (BMI<18.5); 25-35 lbs. for normal weight women (BMI 18.5 to 24.9); 15-25 lbs. for overweight women (BMI 25 to 29.9); and 11-20 lbs. for obese women (BMI>=30).
[4] Due to Crossroads implementation, data are only available for this time period. This page will be updated to include FY16 data when it becomes available. Also, data for counties composing districts are not available.
[1] With the implementation of the 2003 revised US Standard Certificate of Live Birth in NC in August 2010, data on prenatal care initiation and tobacco use prior to 2011 are not comparable.
Data sources for these objectives are as follows: 1, 2, & 3 NC Birth Certificates; 4 NC Automated WIC System matched with Medicaid Processed Claims Report; 5 NC Automated WIC System; and 6 Medicaid Processed Claims Report.
2.16 0.00 1.10 -49.18 2 182 1.10D. Unknown Weight Gain 3.32
[3] These data exclude women enrolled in Medicaid only for emergency delivery. 2014 Medicaid match includes data from both legacy WIC and Crossroads WIC System. Effective 2015 Prenatal Medicaid match included only Crossroads WIC data.

Clay County
SFY2017-2018 MATERNAL HEALTH AGREEMENT ADDENDA DATAProcess Outcome Objectives
NC Percent or Rate
Process Outcome Objectives1st
Percentage of women having live births who had adequate prenatal care as defined by Kessner Index. [1] (Time Periods: 1st - CY13; 2nd - CY14; 3rd - CY15. Most Recent - CY15)
1.
2nd 3rd
% Change from 1st period to
3rd period
Most Recent Data
Num DenPercent or Rate
Percentage of Medicaid enrolled pregnant women who deliver who receive prenatal WIC Program services.[3] (Time Periods: 1st - CY07-09; 2nd - CY10-12; 3rd - CY13-15. Most Recent - CY15)
4.
Percentage of women with live term singleton births who gained adequate/excessive/ inadequate weight according to the National Academy of Sciences-Institute of Medicine (IOM) 2009 Recommended Total Weight Gain Ranges during Pregnancy.[2] (Time Periods: 1st - CY13 2nd - CY14; 3rd - CY15. Most Recent - CY15)
2.
Percentage of women having live births who smoked during pregnancy. [1] (Time Periods: 1st - CY13; 2nd - CY14; 3rd - CY15. Most Recent - CY15)
3.
53.41 75.64 77.11 44.37 64 83 77.11
32.47 22.22 33.82 4.18 23 68 33.82
Time Period
31.82 30.77 25.30 -20.48 21 83 25.30
84.21 76.43 90.59 7.57 46 53 86.79
A. Adequate Weight Gain
45.45 47.62 45.59 0.29 31 68 45.59B. Excessive Weight Gain
15.58 26.98 20.59 32.11 14 68 20.59C. Inadequate Weight Gain
Percentage of infants enrolled in WIC who breastfed at 6 weeks postpartum. (Time Periods: 1st - FY15; 2nd - N/A; 3rd - N/A. Most Recent - FY15) [4]
5.25.53 12 47 25.53
Percentage of Medicaid enrolled pregnant women who deliver who receive a postpartum home visit.[3] (Time Periods: 1st - CY10-12; 2nd - N/A; 3rd - CY13-15. Most Recent - CY15)
6.
19.15 17.58 -8.18 57
62.89
28.75
48.42
19.51
9.35
73.19
25.14
12.21
[2] Recommended total prenatal weight gain range by prepregnancy weight category is 28-40 lbs. for underweight women (BMI<18.5); 25-35 lbs. for normal weight women (BMI 18.5 to 24.9); 15-25 lbs. for overweight women (BMI 25 to 29.9); and 11-20 lbs. for obese women (BMI>=30).
[4] Due to Crossroads implementation, data are only available for this time period. This page will be updated to include FY16 data when it becomes available. Also, data for counties composing districts are not available.
[1] With the implementation of the 2003 revised US Standard Certificate of Live Birth in NC in August 2010, data on prenatal care initiation and tobacco use prior to 2011 are not comparable.
Data sources for these objectives are as follows: 1, 2, & 3 NC Birth Certificates; 4 NC Automated WIC System matched with Medicaid Processed Claims Report; 5 NC Automated WIC System; and 6 Medicaid Processed Claims Report.
6.49 3.17 0.00 -100.00 0 68 0.00D. Unknown Weight Gain 3.32
[3] These data exclude women enrolled in Medicaid only for emergency delivery. 2014 Medicaid match includes data from both legacy WIC and Crossroads WIC System. Effective 2015 Prenatal Medicaid match included only Crossroads WIC data.

Cleveland County
SFY2017-2018 MATERNAL HEALTH AGREEMENT ADDENDA DATAProcess Outcome Objectives
NC Percent or Rate
Process Outcome Objectives1st
Percentage of women having live births who had adequate prenatal care as defined by Kessner Index. [1] (Time Periods: 1st - CY13; 2nd - CY14; 3rd - CY15. Most Recent - CY15)
1.
2nd 3rd
% Change from 1st period to
3rd period
Most Recent Data
Num DenPercent or Rate
Percentage of Medicaid enrolled pregnant women who deliver who receive prenatal WIC Program services.[3] (Time Periods: 1st - CY07-09; 2nd - CY10-12; 3rd - CY13-15. Most Recent - CY15)
4.
Percentage of women with live term singleton births who gained adequate/excessive/ inadequate weight according to the National Academy of Sciences-Institute of Medicine (IOM) 2009 Recommended Total Weight Gain Ranges during Pregnancy.[2] (Time Periods: 1st - CY13 2nd - CY14; 3rd - CY15. Most Recent - CY15)
2.
Percentage of women having live births who smoked during pregnancy. [1] (Time Periods: 1st - CY13; 2nd - CY14; 3rd - CY15. Most Recent - CY15)
3.
62.07 61.14 49.08 -20.93 532 1,084 49.08
25.57 25.91 25.65 0.32 237 924 25.65
Time Period
23.76 21.71 21.31 -10.33 231 1,084 21.31
83.56 84.82 79.92 -4.36 600 770 77.92
A. Adequate Weight Gain
53.72 51.48 52.49 -2.29 485 924 52.49B. Excessive Weight Gain
20.39 22.17 21.54 5.63 199 924 21.54C. Inadequate Weight Gain
Percentage of infants enrolled in WIC who breastfed at 6 weeks postpartum. (Time Periods: 1st - FY15; 2nd - N/A; 3rd - N/A. Most Recent - FY15) [4]
5.22.02 159 722 22.02
Percentage of Medicaid enrolled pregnant women who deliver who receive a postpartum home visit.[3] (Time Periods: 1st - CY10-12; 2nd - N/A; 3rd - CY13-15. Most Recent - CY15)
6.
2.94 25 810 3.09
62.89
28.75
48.42
19.51
9.35
73.19
25.14
12.21
[2] Recommended total prenatal weight gain range by prepregnancy weight category is 28-40 lbs. for underweight women (BMI<18.5); 25-35 lbs. for normal weight women (BMI 18.5 to 24.9); 15-25 lbs. for overweight women (BMI 25 to 29.9); and 11-20 lbs. for obese women (BMI>=30).
[4] Due to Crossroads implementation, data are only available for this time period. This page will be updated to include FY16 data when it becomes available. Also, data for counties composing districts are not available.
[1] With the implementation of the 2003 revised US Standard Certificate of Live Birth in NC in August 2010, data on prenatal care initiation and tobacco use prior to 2011 are not comparable.
Data sources for these objectives are as follows: 1, 2, & 3 NC Birth Certificates; 4 NC Automated WIC System matched with Medicaid Processed Claims Report; 5 NC Automated WIC System; and 6 Medicaid Processed Claims Report.
0.32 0.44 0.32 0.32 3 924 0.32D. Unknown Weight Gain 3.32
[3] These data exclude women enrolled in Medicaid only for emergency delivery. 2014 Medicaid match includes data from both legacy WIC and Crossroads WIC System. Effective 2015 Prenatal Medicaid match included only Crossroads WIC data.

Columbus County
SFY2017-2018 MATERNAL HEALTH AGREEMENT ADDENDA DATAProcess Outcome Objectives
NC Percent or Rate
Process Outcome Objectives1st
Percentage of women having live births who had adequate prenatal care as defined by Kessner Index. [1] (Time Periods: 1st - CY13; 2nd - CY14; 3rd - CY15. Most Recent - CY15)
1.
2nd 3rd
% Change from 1st period to
3rd period
Most Recent Data
Num DenPercent or Rate
Percentage of Medicaid enrolled pregnant women who deliver who receive prenatal WIC Program services.[3] (Time Periods: 1st - CY07-09; 2nd - CY10-12; 3rd - CY13-15. Most Recent - CY15)
4.
Percentage of women with live term singleton births who gained adequate/excessive/ inadequate weight according to the National Academy of Sciences-Institute of Medicine (IOM) 2009 Recommended Total Weight Gain Ranges during Pregnancy.[2] (Time Periods: 1st - CY13 2nd - CY14; 3rd - CY15. Most Recent - CY15)
2.
Percentage of women having live births who smoked during pregnancy. [1] (Time Periods: 1st - CY13; 2nd - CY14; 3rd - CY15. Most Recent - CY15)
3.
47.39 45.72 38.83 -18.06 233 600 38.83
27.32 26.04 27.75 1.55 144 519 27.75
Time Period
16.41 17.27 20.00 21.87 120 600 20.00
72.53 76.05 75.95 4.71 344 459 74.95
A. Adequate Weight Gain
43.17 45.53 43.16 -0.02 224 519 43.16B. Excessive Weight Gain
24.77 23.06 24.47 -1.22 127 519 24.47C. Inadequate Weight Gain
Percentage of infants enrolled in WIC who breastfed at 6 weeks postpartum. (Time Periods: 1st - FY15; 2nd - N/A; 3rd - N/A. Most Recent - FY15) [4]
5.39.43 194 492 39.43
Percentage of Medicaid enrolled pregnant women who deliver who receive a postpartum home visit.[3] (Time Periods: 1st - CY10-12; 2nd - N/A; 3rd - CY13-15. Most Recent - CY15)
6.
1.05 -100.00 522
62.89
28.75
48.42
19.51
9.35
73.19
25.14
12.21
[2] Recommended total prenatal weight gain range by prepregnancy weight category is 28-40 lbs. for underweight women (BMI<18.5); 25-35 lbs. for normal weight women (BMI 18.5 to 24.9); 15-25 lbs. for overweight women (BMI 25 to 29.9); and 11-20 lbs. for obese women (BMI>=30).
[4] Due to Crossroads implementation, data are only available for this time period. This page will be updated to include FY16 data when it becomes available. Also, data for counties composing districts are not available.
[1] With the implementation of the 2003 revised US Standard Certificate of Live Birth in NC in August 2010, data on prenatal care initiation and tobacco use prior to 2011 are not comparable.
Data sources for these objectives are as follows: 1, 2, & 3 NC Birth Certificates; 4 NC Automated WIC System matched with Medicaid Processed Claims Report; 5 NC Automated WIC System; and 6 Medicaid Processed Claims Report.
4.74 5.37 4.62 -2.36 24 519 4.62D. Unknown Weight Gain 3.32
[3] These data exclude women enrolled in Medicaid only for emergency delivery. 2014 Medicaid match includes data from both legacy WIC and Crossroads WIC System. Effective 2015 Prenatal Medicaid match included only Crossroads WIC data.

Craven County
SFY2017-2018 MATERNAL HEALTH AGREEMENT ADDENDA DATAProcess Outcome Objectives
NC Percent or Rate
Process Outcome Objectives1st
Percentage of women having live births who had adequate prenatal care as defined by Kessner Index. [1] (Time Periods: 1st - CY13; 2nd - CY14; 3rd - CY15. Most Recent - CY15)
1.
2nd 3rd
% Change from 1st period to
3rd period
Most Recent Data
Num DenPercent or Rate
Percentage of Medicaid enrolled pregnant women who deliver who receive prenatal WIC Program services.[3] (Time Periods: 1st - CY07-09; 2nd - CY10-12; 3rd - CY13-15. Most Recent - CY15)
4.
Percentage of women with live term singleton births who gained adequate/excessive/ inadequate weight according to the National Academy of Sciences-Institute of Medicine (IOM) 2009 Recommended Total Weight Gain Ranges during Pregnancy.[2] (Time Periods: 1st - CY13 2nd - CY14; 3rd - CY15. Most Recent - CY15)
2.
Percentage of women having live births who smoked during pregnancy. [1] (Time Periods: 1st - CY13; 2nd - CY14; 3rd - CY15. Most Recent - CY15)
3.
67.02 59.07 62.24 -7.13 905 1,454 62.24
28.25 30.46 28.01 -0.83 358 1,278 28.01
Time Period
11.44 10.87 10.32 -9.79 150 1,454 10.32
80.95 84.05 83.64 3.32 509 582 87.46
A. Adequate Weight Gain
50.27 51.22 51.41 2.27 657 1,278 51.41B. Excessive Weight Gain
19.51 17.25 19.56 0.24 250 1,278 19.56C. Inadequate Weight Gain
Percentage of infants enrolled in WIC who breastfed at 6 weeks postpartum. (Time Periods: 1st - FY15; 2nd - N/A; 3rd - N/A. Most Recent - FY15) [4]
5.31.48 271 861 31.48
Percentage of Medicaid enrolled pregnant women who deliver who receive a postpartum home visit.[3] (Time Periods: 1st - CY10-12; 2nd - N/A; 3rd - CY13-15. Most Recent - CY15)
6.
12.54 2.22 -82.30 18 619 2.91
62.89
28.75
48.42
19.51
9.35
73.19
25.14
12.21
[2] Recommended total prenatal weight gain range by prepregnancy weight category is 28-40 lbs. for underweight women (BMI<18.5); 25-35 lbs. for normal weight women (BMI 18.5 to 24.9); 15-25 lbs. for overweight women (BMI 25 to 29.9); and 11-20 lbs. for obese women (BMI>=30).
[4] Due to Crossroads implementation, data are only available for this time period. This page will be updated to include FY16 data when it becomes available. Also, data for counties composing districts are not available.
[1] With the implementation of the 2003 revised US Standard Certificate of Live Birth in NC in August 2010, data on prenatal care initiation and tobacco use prior to 2011 are not comparable.
Data sources for these objectives are as follows: 1, 2, & 3 NC Birth Certificates; 4 NC Automated WIC System matched with Medicaid Processed Claims Report; 5 NC Automated WIC System; and 6 Medicaid Processed Claims Report.
1.97 1.07 1.02 -48.47 13 1,278 1.02D. Unknown Weight Gain 3.32
[3] These data exclude women enrolled in Medicaid only for emergency delivery. 2014 Medicaid match includes data from both legacy WIC and Crossroads WIC System. Effective 2015 Prenatal Medicaid match included only Crossroads WIC data.

Cumberland County
SFY2017-2018 MATERNAL HEALTH AGREEMENT ADDENDA DATAProcess Outcome Objectives
NC Percent or Rate
Process Outcome Objectives1st
Percentage of women having live births who had adequate prenatal care as defined by Kessner Index. [1] (Time Periods: 1st - CY13; 2nd - CY14; 3rd - CY15. Most Recent - CY15)
1.
2nd 3rd
% Change from 1st period to
3rd period
Most Recent Data
Num DenPercent or Rate
Percentage of Medicaid enrolled pregnant women who deliver who receive prenatal WIC Program services.[3] (Time Periods: 1st - CY07-09; 2nd - CY10-12; 3rd - CY13-15. Most Recent - CY15)
4.
Percentage of women with live term singleton births who gained adequate/excessive/ inadequate weight according to the National Academy of Sciences-Institute of Medicine (IOM) 2009 Recommended Total Weight Gain Ranges during Pregnancy.[2] (Time Periods: 1st - CY13 2nd - CY14; 3rd - CY15. Most Recent - CY15)
2.
Percentage of women having live births who smoked during pregnancy. [1] (Time Periods: 1st - CY13; 2nd - CY14; 3rd - CY15. Most Recent - CY15)
3.
74.91 69.37 69.79 -6.83 3,778 5,413 69.79
28.42 28.63 27.56 -3.03 1,264 4,587 27.56
Time Period
11.05 9.51 9.66 -12.58 523 5,413 9.66
75.53 74.73 77.64 2.80 1,753 2,261 77.53
A. Adequate Weight Gain
53.61 51.90 52.47 -2.12 2,407 4,587 52.47B. Excessive Weight Gain
17.42 19.18 19.69 13.00 903 4,587 19.69C. Inadequate Weight Gain
Percentage of infants enrolled in WIC who breastfed at 6 weeks postpartum. (Time Periods: 1st - FY15; 2nd - N/A; 3rd - N/A. Most Recent - FY15) [4]
5.22.69 824 3,631 22.69
Percentage of Medicaid enrolled pregnant women who deliver who receive a postpartum home visit.[3] (Time Periods: 1st - CY10-12; 2nd - N/A; 3rd - CY13-15. Most Recent - CY15)
6.
1.47 4.28 191.71 128 2,391 5.35
62.89
28.75
48.42
19.51
9.35
73.19
25.14
12.21
[2] Recommended total prenatal weight gain range by prepregnancy weight category is 28-40 lbs. for underweight women (BMI<18.5); 25-35 lbs. for normal weight women (BMI 18.5 to 24.9); 15-25 lbs. for overweight women (BMI 25 to 29.9); and 11-20 lbs. for obese women (BMI>=30).
[4] Due to Crossroads implementation, data are only available for this time period. This page will be updated to include FY16 data when it becomes available. Also, data for counties composing districts are not available.
[1] With the implementation of the 2003 revised US Standard Certificate of Live Birth in NC in August 2010, data on prenatal care initiation and tobacco use prior to 2011 are not comparable.
Data sources for these objectives are as follows: 1, 2, & 3 NC Birth Certificates; 4 NC Automated WIC System matched with Medicaid Processed Claims Report; 5 NC Automated WIC System; and 6 Medicaid Processed Claims Report.
0.55 0.29 0.28 -48.55 13 4,587 0.28D. Unknown Weight Gain 3.32
[3] These data exclude women enrolled in Medicaid only for emergency delivery. 2014 Medicaid match includes data from both legacy WIC and Crossroads WIC System. Effective 2015 Prenatal Medicaid match included only Crossroads WIC data.

Dare County
SFY2017-2018 MATERNAL HEALTH AGREEMENT ADDENDA DATAProcess Outcome Objectives
NC Percent or Rate
Process Outcome Objectives1st
Percentage of women having live births who had adequate prenatal care as defined by Kessner Index. [1] (Time Periods: 1st - CY13; 2nd - CY14; 3rd - CY15. Most Recent - CY15)
1.
2nd 3rd
% Change from 1st period to
3rd period
Most Recent Data
Num DenPercent or Rate
Percentage of Medicaid enrolled pregnant women who deliver who receive prenatal WIC Program services.[3] (Time Periods: 1st - CY07-09; 2nd - CY10-12; 3rd - CY13-15. Most Recent - CY15)
4.
Percentage of women with live term singleton births who gained adequate/excessive/ inadequate weight according to the National Academy of Sciences-Institute of Medicine (IOM) 2009 Recommended Total Weight Gain Ranges during Pregnancy.[2] (Time Periods: 1st - CY13 2nd - CY14; 3rd - CY15. Most Recent - CY15)
2.
Percentage of women having live births who smoked during pregnancy. [1] (Time Periods: 1st - CY13; 2nd - CY14; 3rd - CY15. Most Recent - CY15)
3.
63.72 74.36 69.54 9.14 242 348 69.54
31.42 30.29 34.21 8.89 104 304 34.21
Time Period
10.03 10.83 8.91 -11.18 31 348 8.91
65.41 64.57 68.35 4.49 104 143 72.73
A. Adequate Weight Gain
40.20 42.02 46.38 15.37 141 304 46.38B. Excessive Weight Gain
17.23 22.15 18.42 6.91 56 304 18.42C. Inadequate Weight Gain
Percentage of infants enrolled in WIC who breastfed at 6 weeks postpartum. (Time Periods: 1st - FY15; 2nd - N/A; 3rd - N/A. Most Recent - FY15) [4]
5.23.89 43 180 23.89
Percentage of Medicaid enrolled pregnant women who deliver who receive a postpartum home visit.[3] (Time Periods: 1st - CY10-12; 2nd - N/A; 3rd - CY13-15. Most Recent - CY15)
6.
20.12 31.63 57.23 66 195 33.85
62.89
28.75
48.42
19.51
9.35
73.19
25.14
12.21
[2] Recommended total prenatal weight gain range by prepregnancy weight category is 28-40 lbs. for underweight women (BMI<18.5); 25-35 lbs. for normal weight women (BMI 18.5 to 24.9); 15-25 lbs. for overweight women (BMI 25 to 29.9); and 11-20 lbs. for obese women (BMI>=30).
[4] Due to Crossroads implementation, data are only available for this time period. This page will be updated to include FY16 data when it becomes available. Also, data for counties composing districts are not available.
[1] With the implementation of the 2003 revised US Standard Certificate of Live Birth in NC in August 2010, data on prenatal care initiation and tobacco use prior to 2011 are not comparable.
Data sources for these objectives are as follows: 1, 2, & 3 NC Birth Certificates; 4 NC Automated WIC System matched with Medicaid Processed Claims Report; 5 NC Automated WIC System; and 6 Medicaid Processed Claims Report.
11.15 5.54 0.99 -91.15 3 304 0.99D. Unknown Weight Gain 3.32
[3] These data exclude women enrolled in Medicaid only for emergency delivery. 2014 Medicaid match includes data from both legacy WIC and Crossroads WIC System. Effective 2015 Prenatal Medicaid match included only Crossroads WIC data.

Davidson County
SFY2017-2018 MATERNAL HEALTH AGREEMENT ADDENDA DATAProcess Outcome Objectives
NC Percent or Rate
Process Outcome Objectives1st
Percentage of women having live births who had adequate prenatal care as defined by Kessner Index. [1] (Time Periods: 1st - CY13; 2nd - CY14; 3rd - CY15. Most Recent - CY15)
1.
2nd 3rd
% Change from 1st period to
3rd period
Most Recent Data
Num DenPercent or Rate
Percentage of Medicaid enrolled pregnant women who deliver who receive prenatal WIC Program services.[3] (Time Periods: 1st - CY07-09; 2nd - CY10-12; 3rd - CY13-15. Most Recent - CY15)
4.
Percentage of women with live term singleton births who gained adequate/excessive/ inadequate weight according to the National Academy of Sciences-Institute of Medicine (IOM) 2009 Recommended Total Weight Gain Ranges during Pregnancy.[2] (Time Periods: 1st - CY13 2nd - CY14; 3rd - CY15. Most Recent - CY15)
2.
Percentage of women having live births who smoked during pregnancy. [1] (Time Periods: 1st - CY13; 2nd - CY14; 3rd - CY15. Most Recent - CY15)
3.
73.28 66.57 60.43 -17.52 1,057 1,749 60.43
28.96 29.24 25.43 -12.18 383 1,506 25.43
Time Period
18.55 17.94 15.78 -14.93 276 1,749 15.78
70.83 73.98 75.70 6.88 815 1,082 75.32
A. Adequate Weight Gain
51.29 50.42 49.80 -2.91 750 1,506 49.80B. Excessive Weight Gain
18.09 18.14 21.38 18.18 322 1,506 21.38C. Inadequate Weight Gain
Percentage of infants enrolled in WIC who breastfed at 6 weeks postpartum. (Time Periods: 1st - FY15; 2nd - N/A; 3rd - N/A. Most Recent - FY15) [4]
5.32.02 350 1,093 32.02
Percentage of Medicaid enrolled pregnant women who deliver who receive a postpartum home visit.[3] (Time Periods: 1st - CY10-12; 2nd - N/A; 3rd - CY13-15. Most Recent - CY15)
6.
13.37 12.95 -3.09 166 1,207 13.75
62.89
28.75
48.42
19.51
9.35
73.19
25.14
12.21
[2] Recommended total prenatal weight gain range by prepregnancy weight category is 28-40 lbs. for underweight women (BMI<18.5); 25-35 lbs. for normal weight women (BMI 18.5 to 24.9); 15-25 lbs. for overweight women (BMI 25 to 29.9); and 11-20 lbs. for obese women (BMI>=30).
[4] Due to Crossroads implementation, data are only available for this time period. This page will be updated to include FY16 data when it becomes available. Also, data for counties composing districts are not available.
[1] With the implementation of the 2003 revised US Standard Certificate of Live Birth in NC in August 2010, data on prenatal care initiation and tobacco use prior to 2011 are not comparable.
Data sources for these objectives are as follows: 1, 2, & 3 NC Birth Certificates; 4 NC Automated WIC System matched with Medicaid Processed Claims Report; 5 NC Automated WIC System; and 6 Medicaid Processed Claims Report.
1.66 2.19 3.39 104.41 51 1,506 3.39D. Unknown Weight Gain 3.32
[3] These data exclude women enrolled in Medicaid only for emergency delivery. 2014 Medicaid match includes data from both legacy WIC and Crossroads WIC System. Effective 2015 Prenatal Medicaid match included only Crossroads WIC data.

Davie County
SFY2017-2018 MATERNAL HEALTH AGREEMENT ADDENDA DATAProcess Outcome Objectives
NC Percent or Rate
Process Outcome Objectives1st
Percentage of women having live births who had adequate prenatal care as defined by Kessner Index. [1] (Time Periods: 1st - CY13; 2nd - CY14; 3rd - CY15. Most Recent - CY15)
1.
2nd 3rd
% Change from 1st period to
3rd period
Most Recent Data
Num DenPercent or Rate
Percentage of Medicaid enrolled pregnant women who deliver who receive prenatal WIC Program services.[3] (Time Periods: 1st - CY07-09; 2nd - CY10-12; 3rd - CY13-15. Most Recent - CY15)
4.
Percentage of women with live term singleton births who gained adequate/excessive/ inadequate weight according to the National Academy of Sciences-Institute of Medicine (IOM) 2009 Recommended Total Weight Gain Ranges during Pregnancy.[2] (Time Periods: 1st - CY13 2nd - CY14; 3rd - CY15. Most Recent - CY15)
2.
Percentage of women having live births who smoked during pregnancy. [1] (Time Periods: 1st - CY13; 2nd - CY14; 3rd - CY15. Most Recent - CY15)
3.
80.65 72.58 59.02 -26.82 229 388 59.02
31.73 27.41 28.24 -11.02 96 340 28.24
Time Period
10.35 12.74 9.02 -12.88 35 388 9.02
71.02 70.00 74.32 4.65 153 193 79.27
A. Adequate Weight Gain
44.55 48.29 48.24 8.27 164 340 48.24B. Excessive Weight Gain
20.51 17.76 15.29 -25.44 52 340 15.29C. Inadequate Weight Gain
Percentage of infants enrolled in WIC who breastfed at 6 weeks postpartum. (Time Periods: 1st - FY15; 2nd - N/A; 3rd - N/A. Most Recent - FY15) [4]
5.27.06 59 218 27.06
Percentage of Medicaid enrolled pregnant women who deliver who receive a postpartum home visit.[3] (Time Periods: 1st - CY10-12; 2nd - N/A; 3rd - CY13-15. Most Recent - CY15)
6.
1.56 1.65 5.86 9 228 3.95
62.89
28.75
48.42
19.51
9.35
73.19
25.14
12.21
[2] Recommended total prenatal weight gain range by prepregnancy weight category is 28-40 lbs. for underweight women (BMI<18.5); 25-35 lbs. for normal weight women (BMI 18.5 to 24.9); 15-25 lbs. for overweight women (BMI 25 to 29.9); and 11-20 lbs. for obese women (BMI>=30).
[4] Due to Crossroads implementation, data are only available for this time period. This page will be updated to include FY16 data when it becomes available. Also, data for counties composing districts are not available.
[1] With the implementation of the 2003 revised US Standard Certificate of Live Birth in NC in August 2010, data on prenatal care initiation and tobacco use prior to 2011 are not comparable.
Data sources for these objectives are as follows: 1, 2, & 3 NC Birth Certificates; 4 NC Automated WIC System matched with Medicaid Processed Claims Report; 5 NC Automated WIC System; and 6 Medicaid Processed Claims Report.
3.21 6.54 8.24 156.94 28 340 8.24D. Unknown Weight Gain 3.32
[3] These data exclude women enrolled in Medicaid only for emergency delivery. 2014 Medicaid match includes data from both legacy WIC and Crossroads WIC System. Effective 2015 Prenatal Medicaid match included only Crossroads WIC data.

Duplin County
SFY2017-2018 MATERNAL HEALTH AGREEMENT ADDENDA DATAProcess Outcome Objectives
NC Percent or Rate
Process Outcome Objectives1st
Percentage of women having live births who had adequate prenatal care as defined by Kessner Index. [1] (Time Periods: 1st - CY13; 2nd - CY14; 3rd - CY15. Most Recent - CY15)
1.
2nd 3rd
% Change from 1st period to
3rd period
Most Recent Data
Num DenPercent or Rate
Percentage of Medicaid enrolled pregnant women who deliver who receive prenatal WIC Program services.[3] (Time Periods: 1st - CY07-09; 2nd - CY10-12; 3rd - CY13-15. Most Recent - CY15)
4.
Percentage of women with live term singleton births who gained adequate/excessive/ inadequate weight according to the National Academy of Sciences-Institute of Medicine (IOM) 2009 Recommended Total Weight Gain Ranges during Pregnancy.[2] (Time Periods: 1st - CY13 2nd - CY14; 3rd - CY15. Most Recent - CY15)
2.
Percentage of women having live births who smoked during pregnancy. [1] (Time Periods: 1st - CY13; 2nd - CY14; 3rd - CY15. Most Recent - CY15)
3.
56.22 59.97 60.29 7.24 451 748 60.29
28.20 30.92 27.70 -1.78 177 639 27.70
Time Period
7.63 10.10 8.42 10.38 63 748 8.42
72.44 71.47 76.81 6.04 315 408 77.21
A. Adequate Weight Gain
42.84 46.01 46.95 9.60 300 639 46.95B. Excessive Weight Gain
22.10 22.34 24.88 12.57 159 639 24.88C. Inadequate Weight Gain
Percentage of infants enrolled in WIC who breastfed at 6 weeks postpartum. (Time Periods: 1st - FY15; 2nd - N/A; 3rd - N/A. Most Recent - FY15) [4]
5.15.30 88 575 15.30
Percentage of Medicaid enrolled pregnant women who deliver who receive a postpartum home visit.[3] (Time Periods: 1st - CY10-12; 2nd - N/A; 3rd - CY13-15. Most Recent - CY15)
6.
4.66 -100.00 633
62.89
28.75
48.42
19.51
9.35
73.19
25.14
12.21
[2] Recommended total prenatal weight gain range by prepregnancy weight category is 28-40 lbs. for underweight women (BMI<18.5); 25-35 lbs. for normal weight women (BMI 18.5 to 24.9); 15-25 lbs. for overweight women (BMI 25 to 29.9); and 11-20 lbs. for obese women (BMI>=30).
[4] Due to Crossroads implementation, data are only available for this time period. This page will be updated to include FY16 data when it becomes available. Also, data for counties composing districts are not available.
[1] With the implementation of the 2003 revised US Standard Certificate of Live Birth in NC in August 2010, data on prenatal care initiation and tobacco use prior to 2011 are not comparable.
Data sources for these objectives are as follows: 1, 2, & 3 NC Birth Certificates; 4 NC Automated WIC System matched with Medicaid Processed Claims Report; 5 NC Automated WIC System; and 6 Medicaid Processed Claims Report.
6.86 0.74 0.47 -93.16 3 639 0.47D. Unknown Weight Gain 3.32
[3] These data exclude women enrolled in Medicaid only for emergency delivery. 2014 Medicaid match includes data from both legacy WIC and Crossroads WIC System. Effective 2015 Prenatal Medicaid match included only Crossroads WIC data.

Durham County
SFY2017-2018 MATERNAL HEALTH AGREEMENT ADDENDA DATAProcess Outcome Objectives
NC Percent or Rate
Process Outcome Objectives1st
Percentage of women having live births who had adequate prenatal care as defined by Kessner Index. [1] (Time Periods: 1st - CY13; 2nd - CY14; 3rd - CY15. Most Recent - CY15)
1.
2nd 3rd
% Change from 1st period to
3rd period
Most Recent Data
Num DenPercent or Rate
Percentage of Medicaid enrolled pregnant women who deliver who receive prenatal WIC Program services.[3] (Time Periods: 1st - CY07-09; 2nd - CY10-12; 3rd - CY13-15. Most Recent - CY15)
4.
Percentage of women with live term singleton births who gained adequate/excessive/ inadequate weight according to the National Academy of Sciences-Institute of Medicine (IOM) 2009 Recommended Total Weight Gain Ranges during Pregnancy.[2] (Time Periods: 1st - CY13 2nd - CY14; 3rd - CY15. Most Recent - CY15)
2.
Percentage of women having live births who smoked during pregnancy. [1] (Time Periods: 1st - CY13; 2nd - CY14; 3rd - CY15. Most Recent - CY15)
3.
44.25 52.70 64.31 45.33 2,721 4,231 64.31
28.56 29.18 27.58 -3.43 1,006 3,648 27.58
Time Period
5.22 4.86 4.49 -14.04 190 4,231 4.49
62.39 65.26 70.43 12.89 1,060 1,473 71.96
A. Adequate Weight Gain
45.99 42.82 45.15 -1.82 1,647 3,648 45.15B. Excessive Weight Gain
17.48 19.33 17.98 2.85 656 3,648 17.98C. Inadequate Weight Gain
Percentage of infants enrolled in WIC who breastfed at 6 weeks postpartum. (Time Periods: 1st - FY15; 2nd - N/A; 3rd - N/A. Most Recent - FY15) [4]
5.19.28 374 1,940 19.28
Percentage of Medicaid enrolled pregnant women who deliver who receive a postpartum home visit.[3] (Time Periods: 1st - CY10-12; 2nd - N/A; 3rd - CY13-15. Most Recent - CY15)
6.
9.47 13.12 38.45 362 2,107 17.18
62.89
28.75
48.42
19.51
9.35
73.19
25.14
12.21
[2] Recommended total prenatal weight gain range by prepregnancy weight category is 28-40 lbs. for underweight women (BMI<18.5); 25-35 lbs. for normal weight women (BMI 18.5 to 24.9); 15-25 lbs. for overweight women (BMI 25 to 29.9); and 11-20 lbs. for obese women (BMI>=30).
[4] Due to Crossroads implementation, data are only available for this time period. This page will be updated to include FY16 data when it becomes available. Also, data for counties composing districts are not available.
[1] With the implementation of the 2003 revised US Standard Certificate of Live Birth in NC in August 2010, data on prenatal care initiation and tobacco use prior to 2011 are not comparable.
Data sources for these objectives are as follows: 1, 2, & 3 NC Birth Certificates; 4 NC Automated WIC System matched with Medicaid Processed Claims Report; 5 NC Automated WIC System; and 6 Medicaid Processed Claims Report.
7.97 8.67 9.29 16.53 339 3,648 9.29D. Unknown Weight Gain 3.32
[3] These data exclude women enrolled in Medicaid only for emergency delivery. 2014 Medicaid match includes data from both legacy WIC and Crossroads WIC System. Effective 2015 Prenatal Medicaid match included only Crossroads WIC data.

Edgecombe County
SFY2017-2018 MATERNAL HEALTH AGREEMENT ADDENDA DATAProcess Outcome Objectives
NC Percent or Rate
Process Outcome Objectives1st
Percentage of women having live births who had adequate prenatal care as defined by Kessner Index. [1] (Time Periods: 1st - CY13; 2nd - CY14; 3rd - CY15. Most Recent - CY15)
1.
2nd 3rd
% Change from 1st period to
3rd period
Most Recent Data
Num DenPercent or Rate
Percentage of Medicaid enrolled pregnant women who deliver who receive prenatal WIC Program services.[3] (Time Periods: 1st - CY07-09; 2nd - CY10-12; 3rd - CY13-15. Most Recent - CY15)
4.
Percentage of women with live term singleton births who gained adequate/excessive/ inadequate weight according to the National Academy of Sciences-Institute of Medicine (IOM) 2009 Recommended Total Weight Gain Ranges during Pregnancy.[2] (Time Periods: 1st - CY13 2nd - CY14; 3rd - CY15. Most Recent - CY15)
2.
Percentage of women having live births who smoked during pregnancy. [1] (Time Periods: 1st - CY13; 2nd - CY14; 3rd - CY15. Most Recent - CY15)
3.
50.16 46.92 47.18 -5.94 301 638 47.18
22.16 23.90 20.84 -5.94 114 547 20.84
Time Period
17.56 14.98 17.24 -1.83 110 638 17.24
84.44 84.98 86.42 2.35 429 508 84.45
A. Adequate Weight Gain
48.55 52.99 55.58 14.46 304 547 55.58B. Excessive Weight Gain
26.78 21.91 21.94 -18.09 120 547 21.94C. Inadequate Weight Gain
Percentage of infants enrolled in WIC who breastfed at 6 weeks postpartum. (Time Periods: 1st - FY15; 2nd - N/A; 3rd - N/A. Most Recent - FY15) [4]
5.19.74 91 461 19.74
Percentage of Medicaid enrolled pregnant women who deliver who receive a postpartum home visit.[3] (Time Periods: 1st - CY10-12; 2nd - N/A; 3rd - CY13-15. Most Recent - CY15)
6.
562
62.89
28.75
48.42
19.51
9.35
73.19
25.14
12.21
[2] Recommended total prenatal weight gain range by prepregnancy weight category is 28-40 lbs. for underweight women (BMI<18.5); 25-35 lbs. for normal weight women (BMI 18.5 to 24.9); 15-25 lbs. for overweight women (BMI 25 to 29.9); and 11-20 lbs. for obese women (BMI>=30).
[4] Due to Crossroads implementation, data are only available for this time period. This page will be updated to include FY16 data when it becomes available. Also, data for counties composing districts are not available.
[1] With the implementation of the 2003 revised US Standard Certificate of Live Birth in NC in August 2010, data on prenatal care initiation and tobacco use prior to 2011 are not comparable.
Data sources for these objectives are as follows: 1, 2, & 3 NC Birth Certificates; 4 NC Automated WIC System matched with Medicaid Processed Claims Report; 5 NC Automated WIC System; and 6 Medicaid Processed Claims Report.
2.50 1.20 1.65 -34.31 9 547 1.65D. Unknown Weight Gain 3.32
[3] These data exclude women enrolled in Medicaid only for emergency delivery. 2014 Medicaid match includes data from both legacy WIC and Crossroads WIC System. Effective 2015 Prenatal Medicaid match included only Crossroads WIC data.

Forsyth County
SFY2017-2018 MATERNAL HEALTH AGREEMENT ADDENDA DATAProcess Outcome Objectives
NC Percent or Rate
Process Outcome Objectives1st
Percentage of women having live births who had adequate prenatal care as defined by Kessner Index. [1] (Time Periods: 1st - CY13; 2nd - CY14; 3rd - CY15. Most Recent - CY15)
1.
2nd 3rd
% Change from 1st period to
3rd period
Most Recent Data
Num DenPercent or Rate
Percentage of Medicaid enrolled pregnant women who deliver who receive prenatal WIC Program services.[3] (Time Periods: 1st - CY07-09; 2nd - CY10-12; 3rd - CY13-15. Most Recent - CY15)
4.
Percentage of women with live term singleton births who gained adequate/excessive/ inadequate weight according to the National Academy of Sciences-Institute of Medicine (IOM) 2009 Recommended Total Weight Gain Ranges during Pregnancy.[2] (Time Periods: 1st - CY13 2nd - CY14; 3rd - CY15. Most Recent - CY15)
2.
Percentage of women having live births who smoked during pregnancy. [1] (Time Periods: 1st - CY13; 2nd - CY14; 3rd - CY15. Most Recent - CY15)
3.
83.52 71.75 59.19 -29.13 2,569 4,340 59.19
29.08 26.48 27.29 -6.16 1,012 3,708 27.29
Time Period
6.79 5.06 5.41 -20.24 235 4,340 5.41
67.02 72.46 70.63 5.39 1,489 2,029 73.39
A. Adequate Weight Gain
46.17 48.13 45.69 -1.04 1,694 3,708 45.69B. Excessive Weight Gain
20.42 16.19 16.91 -17.17 627 3,708 16.91C. Inadequate Weight Gain
Percentage of infants enrolled in WIC who breastfed at 6 weeks postpartum. (Time Periods: 1st - FY15; 2nd - N/A; 3rd - N/A. Most Recent - FY15) [4]
5.31.64 760 2,402 31.64
Percentage of Medicaid enrolled pregnant women who deliver who receive a postpartum home visit.[3] (Time Periods: 1st - CY10-12; 2nd - N/A; 3rd - CY13-15. Most Recent - CY15)
6.
3.92 -100.00 2,495
62.89
28.75
48.42
19.51
9.35
73.19
25.14
12.21
[2] Recommended total prenatal weight gain range by prepregnancy weight category is 28-40 lbs. for underweight women (BMI<18.5); 25-35 lbs. for normal weight women (BMI 18.5 to 24.9); 15-25 lbs. for overweight women (BMI 25 to 29.9); and 11-20 lbs. for obese women (BMI>=30).
[4] Due to Crossroads implementation, data are only available for this time period. This page will be updated to include FY16 data when it becomes available. Also, data for counties composing districts are not available.
[1] With the implementation of the 2003 revised US Standard Certificate of Live Birth in NC in August 2010, data on prenatal care initiation and tobacco use prior to 2011 are not comparable.
Data sources for these objectives are as follows: 1, 2, & 3 NC Birth Certificates; 4 NC Automated WIC System matched with Medicaid Processed Claims Report; 5 NC Automated WIC System; and 6 Medicaid Processed Claims Report.
4.33 9.20 10.11 133.32 375 3,708 10.11D. Unknown Weight Gain 3.32
[3] These data exclude women enrolled in Medicaid only for emergency delivery. 2014 Medicaid match includes data from both legacy WIC and Crossroads WIC System. Effective 2015 Prenatal Medicaid match included only Crossroads WIC data.

Franklin County
SFY2017-2018 MATERNAL HEALTH AGREEMENT ADDENDA DATAProcess Outcome Objectives
NC Percent or Rate
Process Outcome Objectives1st
Percentage of women having live births who had adequate prenatal care as defined by Kessner Index. [1] (Time Periods: 1st - CY13; 2nd - CY14; 3rd - CY15. Most Recent - CY15)
1.
2nd 3rd
% Change from 1st period to
3rd period
Most Recent Data
Num DenPercent or Rate
Percentage of Medicaid enrolled pregnant women who deliver who receive prenatal WIC Program services.[3] (Time Periods: 1st - CY07-09; 2nd - CY10-12; 3rd - CY13-15. Most Recent - CY15)
4.
Percentage of women with live term singleton births who gained adequate/excessive/ inadequate weight according to the National Academy of Sciences-Institute of Medicine (IOM) 2009 Recommended Total Weight Gain Ranges during Pregnancy.[2] (Time Periods: 1st - CY13 2nd - CY14; 3rd - CY15. Most Recent - CY15)
2.
Percentage of women having live births who smoked during pregnancy. [1] (Time Periods: 1st - CY13; 2nd - CY14; 3rd - CY15. Most Recent - CY15)
3.
48.22 39.91 49.66 2.98 360 725 49.66
23.25 25.09 27.70 19.14 172 621 27.70
Time Period
11.72 12.20 10.21 -12.92 74 725 10.21
68.84 65.13 65.67 -4.59 264 392 67.35
A. Adequate Weight Gain
51.28 53.26 47.99 -6.43 298 621 47.99B. Excessive Weight Gain
19.49 16.67 19.97 2.47 124 621 19.97C. Inadequate Weight Gain
Percentage of infants enrolled in WIC who breastfed at 6 weeks postpartum. (Time Periods: 1st - FY15; 2nd - N/A; 3rd - N/A. Most Recent - FY15) [4]
5.7.20 28 389 7.20
Percentage of Medicaid enrolled pregnant women who deliver who receive a postpartum home visit.[3] (Time Periods: 1st - CY10-12; 2nd - N/A; 3rd - CY13-15. Most Recent - CY15)
6.
10.50 11.95 13.86 95 446 21.30
62.89
28.75
48.42
19.51
9.35
73.19
25.14
12.21
[2] Recommended total prenatal weight gain range by prepregnancy weight category is 28-40 lbs. for underweight women (BMI<18.5); 25-35 lbs. for normal weight women (BMI 18.5 to 24.9); 15-25 lbs. for overweight women (BMI 25 to 29.9); and 11-20 lbs. for obese women (BMI>=30).
[4] Due to Crossroads implementation, data are only available for this time period. This page will be updated to include FY16 data when it becomes available. Also, data for counties composing districts are not available.
[1] With the implementation of the 2003 revised US Standard Certificate of Live Birth in NC in August 2010, data on prenatal care initiation and tobacco use prior to 2011 are not comparable.
Data sources for these objectives are as follows: 1, 2, & 3 NC Birth Certificates; 4 NC Automated WIC System matched with Medicaid Processed Claims Report; 5 NC Automated WIC System; and 6 Medicaid Processed Claims Report.
5.98 4.98 4.35 -27.33 27 621 4.35D. Unknown Weight Gain 3.32
[3] These data exclude women enrolled in Medicaid only for emergency delivery. 2014 Medicaid match includes data from both legacy WIC and Crossroads WIC System. Effective 2015 Prenatal Medicaid match included only Crossroads WIC data.
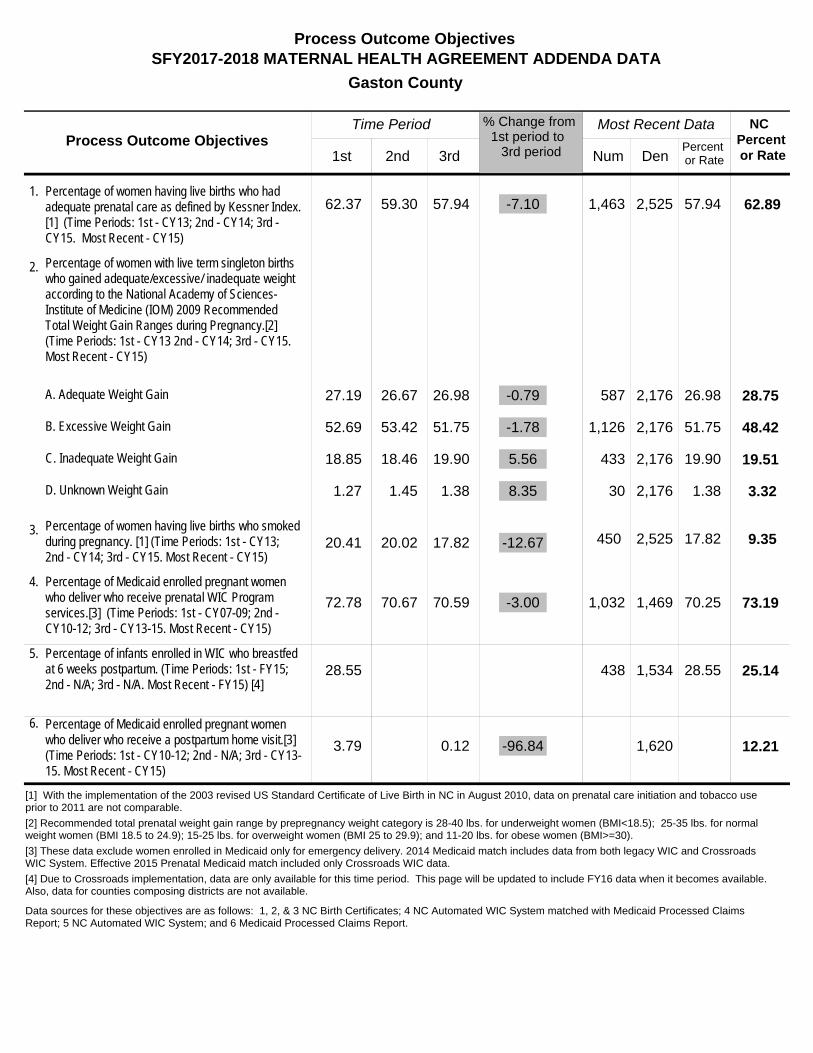
Gaston County
SFY2017-2018 MATERNAL HEALTH AGREEMENT ADDENDA DATAProcess Outcome Objectives
NC Percent or Rate
Process Outcome Objectives1st
Percentage of women having live births who had adequate prenatal care as defined by Kessner Index. [1] (Time Periods: 1st - CY13; 2nd - CY14; 3rd - CY15. Most Recent - CY15)
1.
2nd 3rd
% Change from 1st period to
3rd period
Most Recent Data
Num DenPercent or Rate
Percentage of Medicaid enrolled pregnant women who deliver who receive prenatal WIC Program services.[3] (Time Periods: 1st - CY07-09; 2nd - CY10-12; 3rd - CY13-15. Most Recent - CY15)
4.
Percentage of women with live term singleton births who gained adequate/excessive/ inadequate weight according to the National Academy of Sciences-Institute of Medicine (IOM) 2009 Recommended Total Weight Gain Ranges during Pregnancy.[2] (Time Periods: 1st - CY13 2nd - CY14; 3rd - CY15. Most Recent - CY15)
2.
Percentage of women having live births who smoked during pregnancy. [1] (Time Periods: 1st - CY13; 2nd - CY14; 3rd - CY15. Most Recent - CY15)
3.
62.37 59.30 57.94 -7.10 1,463 2,525 57.94
27.19 26.67 26.98 -0.79 587 2,176 26.98
Time Period
20.41 20.02 17.82 -12.67 450 2,525 17.82
72.78 70.67 70.59 -3.00 1,032 1,469 70.25
A. Adequate Weight Gain
52.69 53.42 51.75 -1.78 1,126 2,176 51.75B. Excessive Weight Gain
18.85 18.46 19.90 5.56 433 2,176 19.90C. Inadequate Weight Gain
Percentage of infants enrolled in WIC who breastfed at 6 weeks postpartum. (Time Periods: 1st - FY15; 2nd - N/A; 3rd - N/A. Most Recent - FY15) [4]
5.28.55 438 1,534 28.55
Percentage of Medicaid enrolled pregnant women who deliver who receive a postpartum home visit.[3] (Time Periods: 1st - CY10-12; 2nd - N/A; 3rd - CY13-15. Most Recent - CY15)
6.
3.79 0.12 -96.84 1,620
62.89
28.75
48.42
19.51
9.35
73.19
25.14
12.21
[2] Recommended total prenatal weight gain range by prepregnancy weight category is 28-40 lbs. for underweight women (BMI<18.5); 25-35 lbs. for normal weight women (BMI 18.5 to 24.9); 15-25 lbs. for overweight women (BMI 25 to 29.9); and 11-20 lbs. for obese women (BMI>=30).
[4] Due to Crossroads implementation, data are only available for this time period. This page will be updated to include FY16 data when it becomes available. Also, data for counties composing districts are not available.
[1] With the implementation of the 2003 revised US Standard Certificate of Live Birth in NC in August 2010, data on prenatal care initiation and tobacco use prior to 2011 are not comparable.
Data sources for these objectives are as follows: 1, 2, & 3 NC Birth Certificates; 4 NC Automated WIC System matched with Medicaid Processed Claims Report; 5 NC Automated WIC System; and 6 Medicaid Processed Claims Report.
1.27 1.45 1.38 8.35 30 2,176 1.38D. Unknown Weight Gain 3.32
[3] These data exclude women enrolled in Medicaid only for emergency delivery. 2014 Medicaid match includes data from both legacy WIC and Crossroads WIC System. Effective 2015 Prenatal Medicaid match included only Crossroads WIC data.

Graham County
SFY2017-2018 MATERNAL HEALTH AGREEMENT ADDENDA DATAProcess Outcome Objectives
NC Percent or Rate
Process Outcome Objectives1st
Percentage of women having live births who had adequate prenatal care as defined by Kessner Index. [1] (Time Periods: 1st - CY13; 2nd - CY14; 3rd - CY15. Most Recent - CY15)
1.
2nd 3rd
% Change from 1st period to
3rd period
Most Recent Data
Num DenPercent or Rate
Percentage of Medicaid enrolled pregnant women who deliver who receive prenatal WIC Program services.[3] (Time Periods: 1st - CY07-09; 2nd - CY10-12; 3rd - CY13-15. Most Recent - CY15)
4.
Percentage of women with live term singleton births who gained adequate/excessive/ inadequate weight according to the National Academy of Sciences-Institute of Medicine (IOM) 2009 Recommended Total Weight Gain Ranges during Pregnancy.[2] (Time Periods: 1st - CY13 2nd - CY14; 3rd - CY15. Most Recent - CY15)
2.
Percentage of women having live births who smoked during pregnancy. [1] (Time Periods: 1st - CY13; 2nd - CY14; 3rd - CY15. Most Recent - CY15)
3.
67.78 71.11 74.03 9.22 57 77 74.03
24.69 36.00 30.30 22.73 20 66 30.30
Time Period
30.00 34.44 32.47 8.23 25 77 32.47
77.01 87.00 89.56 16.29 45 53 84.91
A. Adequate Weight Gain
59.26 42.67 46.97 -20.74 31 66 46.97B. Excessive Weight Gain
12.35 21.33 19.70 59.55 13 66 19.70C. Inadequate Weight Gain
Percentage of infants enrolled in WIC who breastfed at 6 weeks postpartum. (Time Periods: 1st - FY15; 2nd - N/A; 3rd - N/A. Most Recent - FY15) [4]
5.16.13 10 62 16.13
Percentage of Medicaid enrolled pregnant women who deliver who receive a postpartum home visit.[3] (Time Periods: 1st - CY10-12; 2nd - N/A; 3rd - CY13-15. Most Recent - CY15)
6.
5.65 2.53 -55.32 57
62.89
28.75
48.42
19.51
9.35
73.19
25.14
12.21
[2] Recommended total prenatal weight gain range by prepregnancy weight category is 28-40 lbs. for underweight women (BMI<18.5); 25-35 lbs. for normal weight women (BMI 18.5 to 24.9); 15-25 lbs. for overweight women (BMI 25 to 29.9); and 11-20 lbs. for obese women (BMI>=30).
[4] Due to Crossroads implementation, data are only available for this time period. This page will be updated to include FY16 data when it becomes available. Also, data for counties composing districts are not available.
[1] With the implementation of the 2003 revised US Standard Certificate of Live Birth in NC in August 2010, data on prenatal care initiation and tobacco use prior to 2011 are not comparable.
Data sources for these objectives are as follows: 1, 2, & 3 NC Birth Certificates; 4 NC Automated WIC System matched with Medicaid Processed Claims Report; 5 NC Automated WIC System; and 6 Medicaid Processed Claims Report.
3.70 0.00 3.03 -18.18 2 66 3.03D. Unknown Weight Gain 3.32
[3] These data exclude women enrolled in Medicaid only for emergency delivery. 2014 Medicaid match includes data from both legacy WIC and Crossroads WIC System. Effective 2015 Prenatal Medicaid match included only Crossroads WIC data.

Granville-Vance District
SFY2017-2018 MATERNAL HEALTH AGREEMENT ADDENDA DATAProcess Outcome Objectives
NC Percent or Rate
Process Outcome Objectives1st
Percentage of women having live births who had adequate prenatal care as defined by Kessner Index. [1] (Time Periods: 1st - CY13; 2nd - CY14; 3rd - CY15. Most Recent - CY15)
1.
2nd 3rd
% Change from 1st period to
3rd period
Most Recent Data
Num DenPercent or Rate
Percentage of Medicaid enrolled pregnant women who deliver who receive prenatal WIC Program services.[3] (Time Periods: 1st - CY07-09; 2nd - CY10-12; 3rd - CY13-15. Most Recent - CY15)
4.
Percentage of women with live term singleton births who gained adequate/excessive/ inadequate weight according to the National Academy of Sciences-Institute of Medicine (IOM) 2009 Recommended Total Weight Gain Ranges during Pregnancy.[2] (Time Periods: 1st - CY13 2nd - CY14; 3rd - CY15. Most Recent - CY15)
2.
Percentage of women having live births who smoked during pregnancy. [1] (Time Periods: 1st - CY13; 2nd - CY14; 3rd - CY15. Most Recent - CY15)
3.
48.69 50.50 53.17 9.20 596 1,121 53.17
26.68 26.69 23.43 -12.18 224 956 23.43
Time Period
12.85 14.49 12.67 -1.43 142 1,121 12.67
75.88 72.85 73.77 -2.78 519 736 70.52
A. Adequate Weight Gain
47.17 44.16 48.12 2.00 460 956 48.12B. Excessive Weight Gain
24.01 24.76 24.48 1.93 234 956 24.48C. Inadequate Weight Gain
Percentage of infants enrolled in WIC who breastfed at 6 weeks postpartum. (Time Periods: 1st - FY15; 2nd - N/A; 3rd - N/A. Most Recent - FY15) [4]
5.17.05 125 733 17.05
Percentage of Medicaid enrolled pregnant women who deliver who receive a postpartum home visit.[3] (Time Periods: 1st - CY10-12; 2nd - N/A; 3rd - CY13-15. Most Recent - CY15)
6.
28.21 31.89 13.05 218 813 26.81
62.89
28.75
48.42
19.51
9.35
73.19
25.14
12.21
[2] Recommended total prenatal weight gain range by prepregnancy weight category is 28-40 lbs. for underweight women (BMI<18.5); 25-35 lbs. for normal weight women (BMI 18.5 to 24.9); 15-25 lbs. for overweight women (BMI 25 to 29.9); and 11-20 lbs. for obese women (BMI>=30).
[4] Due to Crossroads implementation, data are only available for this time period. This page will be updated to include FY16 data when it becomes available. Also, data for counties composing districts are not available.
[1] With the implementation of the 2003 revised US Standard Certificate of Live Birth in NC in August 2010, data on prenatal care initiation and tobacco use prior to 2011 are not comparable.
Data sources for these objectives are as follows: 1, 2, & 3 NC Birth Certificates; 4 NC Automated WIC System matched with Medicaid Processed Claims Report; 5 NC Automated WIC System; and 6 Medicaid Processed Claims Report.
2.13 4.39 3.97 86.22 38 956 3.97D. Unknown Weight Gain 3.32
[3] These data exclude women enrolled in Medicaid only for emergency delivery. 2014 Medicaid match includes data from both legacy WIC and Crossroads WIC System. Effective 2015 Prenatal Medicaid match included only Crossroads WIC data.

Granville
SFY2017-2018 MATERNAL HEALTH AGREEMENT ADDENDA DATAProcess Outcome Objectives for Counties Composing Districts
NC Percent or Rate
Process Outcome Objectives1st
Percentage of women having live births who had adequate prenatal care as defined by Kessner Index. [1] (Time Periods: 1st - CY13; 2nd - CY14; 3rd - CY15. Most Recent - CY15)
1.
2nd 3rd
% Change from 1st period to
3rd period
Most Recent Data
Num DenPercent or Rate
Percentage of Medicaid enrolled pregnant women who deliver who receive prenatal WIC Program services.[3] (Time Periods: 1st - CY07-09; 2nd - CY10-12; 3rd - CY13-15. Most Recent - CY15)
4.
Percentage of women with live term singleton births who gained adequate/excessive/ inadequate weight according to the National Academy of Sciences-Institute of Medicine (IOM) 2009 Recommended Total Weight Gain Ranges during Pregnancy.[2] (Time Periods: 1st - CY13 2nd - CY14; 3rd - CY15. Most Recent - CY15)
2.
Percentage of women having live births who smoked during pregnancy. [1] (Time Periods: 1st - CY13; 2nd - CY14; 3rd - CY15. Most Recent - CY15)
3.
54.37 53.64 61.10 12.38 355 581 61.10
27.67 27.27 24.85 -10.19 124 499 24.85
Time Period
12.55 11.82 10.84 -13.58 63 581 10.84
75.85 74.37 74.23 -2.14 227 313 72.52
A. Adequate Weight Gain
48.15 44.82 50.30 4.47 251 499 50.30B. Excessive Weight Gain
21.35 22.83 20.44 -4.26 102 499 20.44C. Inadequate Weight Gain
Percentage of infants enrolled in WIC who breastfed at 6 weeks postpartum. (Time Periods: 1st - FY15; 2nd - N/A; 3rd - N/A. Most Recent - FY15) [4]
5.
Percentage of Medicaid enrolled pregnant women who deliver who receive a postpartum home visit.[3] (Time Periods: 1st - CY10-12; 2nd - N/A; 3rd - CY13-15. Most Recent - CY15)
6.
64.18 79.06 23.17 218 341 63.93
62.89
28.75
48.42
19.51
9.35
73.19
25.14
12.21
[2] Recommended total prenatal weight gain range by prepregnancy weight category is 28-40 lbs. for underweight women (BMI<18.5); 25-35 lbs. for normal weight women (BMI 18.5 to 24.9); 15-25 lbs. for overweight women (BMI 25 to 29.9); and 11-20 lbs. for obese women (BMI>=30).
[4] Due to Crossroads implementation, data are only available for this time period. This page will be updated to include FY16 data when it becomes available. Also, data for counties composing districts are not available.
[1] With the implementation of the 2003 revised US Standard Certificate of Live Birth in NC in August 2010, data on prenatal care initiation and tobacco use prior to 2011 are not comparable.
Data sources for these objectives are as follows: 1, 2, & 3 NC Birth Certificates; 4 NC Automated WIC System matched with Medicaid Processed Claims Report; 5 NC Automated WIC System; and 6 Medicaid Processed Claims Report.
2.83 5.07 4.41 55.67 22 499 4.41D. Unknown Weight Gain 3.32
[3] These data exclude women enrolled in Medicaid only for emergency delivery. 2014 Medicaid match includes data from both legacy WIC and Crossroads WIC System. Effective 2015 Prenatal Medicaid match included only Crossroads WIC data.

Vance
SFY2017-2018 MATERNAL HEALTH AGREEMENT ADDENDA DATAProcess Outcome Objectives for Counties Composing Districts
NC Percent or Rate
Process Outcome Objectives1st
Percentage of women having live births who had adequate prenatal care as defined by Kessner Index. [1] (Time Periods: 1st - CY13; 2nd - CY14; 3rd - CY15. Most Recent - CY15)
1.
2nd 3rd
% Change from 1st period to
3rd period
Most Recent Data
Num DenPercent or Rate
Percentage of Medicaid enrolled pregnant women who deliver who receive prenatal WIC Program services.[3] (Time Periods: 1st - CY07-09; 2nd - CY10-12; 3rd - CY13-15. Most Recent - CY15)
4.
Percentage of women with live term singleton births who gained adequate/excessive/ inadequate weight according to the National Academy of Sciences-Institute of Medicine (IOM) 2009 Recommended Total Weight Gain Ranges during Pregnancy.[2] (Time Periods: 1st - CY13 2nd - CY14; 3rd - CY15. Most Recent - CY15)
2.
Percentage of women having live births who smoked during pregnancy. [1] (Time Periods: 1st - CY13; 2nd - CY14; 3rd - CY15. Most Recent - CY15)
3.
43.52 47.42 44.63 2.54 241 540 44.63
25.73 26.09 21.88 -14.96 100 457 21.88
Time Period
13.13 17.11 14.63 11.45 79 540 14.63
75.90 71.78 73.44 -3.24 292 423 69.03
A. Adequate Weight Gain
46.23 43.48 45.73 -1.08 209 457 45.73B. Excessive Weight Gain
26.57 26.74 28.88 8.71 132 457 28.88C. Inadequate Weight Gain
Percentage of infants enrolled in WIC who breastfed at 6 weeks postpartum. (Time Periods: 1st - FY15; 2nd - N/A; 3rd - N/A. Most Recent - FY15) [4]
5.
Percentage of Medicaid enrolled pregnant women who deliver who receive a postpartum home visit.[3] (Time Periods: 1st - CY10-12; 2nd - N/A; 3rd - CY13-15. Most Recent - CY15)
6.
3.48 -100.00 472
62.89
28.75
48.42
19.51
9.35
73.19
25.14
12.21
[2] Recommended total prenatal weight gain range by prepregnancy weight category is 28-40 lbs. for underweight women (BMI<18.5); 25-35 lbs. for normal weight women (BMI 18.5 to 24.9); 15-25 lbs. for overweight women (BMI 25 to 29.9); and 11-20 lbs. for obese women (BMI>=30).
[4] Due to Crossroads implementation, data are only available for this time period. This page will be updated to include FY16 data when it becomes available. Also, data for counties composing districts are not available.
[1] With the implementation of the 2003 revised US Standard Certificate of Live Birth in NC in August 2010, data on prenatal care initiation and tobacco use prior to 2011 are not comparable.
Data sources for these objectives are as follows: 1, 2, & 3 NC Birth Certificates; 4 NC Automated WIC System matched with Medicaid Processed Claims Report; 5 NC Automated WIC System; and 6 Medicaid Processed Claims Report.
1.46 3.70 3.50 139.07 16 457 3.50D. Unknown Weight Gain 3.32
[3] These data exclude women enrolled in Medicaid only for emergency delivery. 2014 Medicaid match includes data from both legacy WIC and Crossroads WIC System. Effective 2015 Prenatal Medicaid match included only Crossroads WIC data.

Greene County
SFY2017-2018 MATERNAL HEALTH AGREEMENT ADDENDA DATAProcess Outcome Objectives
NC Percent or Rate
Process Outcome Objectives1st
Percentage of women having live births who had adequate prenatal care as defined by Kessner Index. [1] (Time Periods: 1st - CY13; 2nd - CY14; 3rd - CY15. Most Recent - CY15)
1.
2nd 3rd
% Change from 1st period to
3rd period
Most Recent Data
Num DenPercent or Rate
Percentage of Medicaid enrolled pregnant women who deliver who receive prenatal WIC Program services.[3] (Time Periods: 1st - CY07-09; 2nd - CY10-12; 3rd - CY13-15. Most Recent - CY15)
4.
Percentage of women with live term singleton births who gained adequate/excessive/ inadequate weight according to the National Academy of Sciences-Institute of Medicine (IOM) 2009 Recommended Total Weight Gain Ranges during Pregnancy.[2] (Time Periods: 1st - CY13 2nd - CY14; 3rd - CY15. Most Recent - CY15)
2.
Percentage of women having live births who smoked during pregnancy. [1] (Time Periods: 1st - CY13; 2nd - CY14; 3rd - CY15. Most Recent - CY15)
3.
68.29 68.52 63.55 -6.95 129 203 63.55
27.17 27.81 28.73 5.75 52 181 28.73
Time Period
13.66 15.28 13.79 0.99 28 203 13.79
82.28 77.64 82.09 -0.22 95 122 77.87
A. Adequate Weight Gain
52.02 48.13 46.96 -9.73 85 181 46.96B. Excessive Weight Gain
20.23 22.99 23.20 14.70 42 181 23.20C. Inadequate Weight Gain
Percentage of infants enrolled in WIC who breastfed at 6 weeks postpartum. (Time Periods: 1st - FY15; 2nd - N/A; 3rd - N/A. Most Recent - FY15) [4]
5.35.15 58 165 35.15
Percentage of Medicaid enrolled pregnant women who deliver who receive a postpartum home visit.[3] (Time Periods: 1st - CY10-12; 2nd - N/A; 3rd - CY13-15. Most Recent - CY15)
6.
169
62.89
28.75
48.42
19.51
9.35
73.19
25.14
12.21
[2] Recommended total prenatal weight gain range by prepregnancy weight category is 28-40 lbs. for underweight women (BMI<18.5); 25-35 lbs. for normal weight women (BMI 18.5 to 24.9); 15-25 lbs. for overweight women (BMI 25 to 29.9); and 11-20 lbs. for obese women (BMI>=30).
[4] Due to Crossroads implementation, data are only available for this time period. This page will be updated to include FY16 data when it becomes available. Also, data for counties composing districts are not available.
[1] With the implementation of the 2003 revised US Standard Certificate of Live Birth in NC in August 2010, data on prenatal care initiation and tobacco use prior to 2011 are not comparable.
Data sources for these objectives are as follows: 1, 2, & 3 NC Birth Certificates; 4 NC Automated WIC System matched with Medicaid Processed Claims Report; 5 NC Automated WIC System; and 6 Medicaid Processed Claims Report.
0.58 1.07 1.10 91.16 2 181 1.10D. Unknown Weight Gain 3.32
[3] These data exclude women enrolled in Medicaid only for emergency delivery. 2014 Medicaid match includes data from both legacy WIC and Crossroads WIC System. Effective 2015 Prenatal Medicaid match included only Crossroads WIC data.

Guilford County
SFY2017-2018 MATERNAL HEALTH AGREEMENT ADDENDA DATAProcess Outcome Objectives
NC Percent or Rate
Process Outcome Objectives1st
Percentage of women having live births who had adequate prenatal care as defined by Kessner Index. [1] (Time Periods: 1st - CY13; 2nd - CY14; 3rd - CY15. Most Recent - CY15)
1.
2nd 3rd
% Change from 1st period to
3rd period
Most Recent Data
Num DenPercent or Rate
Percentage of Medicaid enrolled pregnant women who deliver who receive prenatal WIC Program services.[3] (Time Periods: 1st - CY07-09; 2nd - CY10-12; 3rd - CY13-15. Most Recent - CY15)
4.
Percentage of women with live term singleton births who gained adequate/excessive/ inadequate weight according to the National Academy of Sciences-Institute of Medicine (IOM) 2009 Recommended Total Weight Gain Ranges during Pregnancy.[2] (Time Periods: 1st - CY13 2nd - CY14; 3rd - CY15. Most Recent - CY15)
2.
Percentage of women having live births who smoked during pregnancy. [1] (Time Periods: 1st - CY13; 2nd - CY14; 3rd - CY15. Most Recent - CY15)
3.
62.23 56.42 58.21 -6.46 3,548 6,095 58.21
29.39 30.69 27.87 -5.18 1,466 5,261 27.87
Time Period
6.78 6.34 5.94 -12.35 362 6,095 5.94
63.63 60.57 66.33 4.25 2,224 3,273 67.95
A. Adequate Weight Gain
45.74 47.14 47.69 4.28 2,509 5,261 47.69B. Excessive Weight Gain
18.01 17.63 19.86 10.27 1,045 5,261 19.86C. Inadequate Weight Gain
Percentage of infants enrolled in WIC who breastfed at 6 weeks postpartum. (Time Periods: 1st - FY15; 2nd - N/A; 3rd - N/A. Most Recent - FY15) [4]
5.27.73 915 3,300 27.73
Percentage of Medicaid enrolled pregnant women who deliver who receive a postpartum home visit.[3] (Time Periods: 1st - CY10-12; 2nd - N/A; 3rd - CY13-15. Most Recent - CY15)
6.
48.06 44.66 -7.09 1,674 3,753 44.60
62.89
28.75
48.42
19.51
9.35
73.19
25.14
12.21
[2] Recommended total prenatal weight gain range by prepregnancy weight category is 28-40 lbs. for underweight women (BMI<18.5); 25-35 lbs. for normal weight women (BMI 18.5 to 24.9); 15-25 lbs. for overweight women (BMI 25 to 29.9); and 11-20 lbs. for obese women (BMI>=30).
[4] Due to Crossroads implementation, data are only available for this time period. This page will be updated to include FY16 data when it becomes available. Also, data for counties composing districts are not available.
[1] With the implementation of the 2003 revised US Standard Certificate of Live Birth in NC in August 2010, data on prenatal care initiation and tobacco use prior to 2011 are not comparable.
Data sources for these objectives are as follows: 1, 2, & 3 NC Birth Certificates; 4 NC Automated WIC System matched with Medicaid Processed Claims Report; 5 NC Automated WIC System; and 6 Medicaid Processed Claims Report.
6.86 4.54 4.58 -33.27 241 5,261 4.58D. Unknown Weight Gain 3.32
[3] These data exclude women enrolled in Medicaid only for emergency delivery. 2014 Medicaid match includes data from both legacy WIC and Crossroads WIC System. Effective 2015 Prenatal Medicaid match included only Crossroads WIC data.

Halifax County
SFY2017-2018 MATERNAL HEALTH AGREEMENT ADDENDA DATAProcess Outcome Objectives
NC Percent or Rate
Process Outcome Objectives1st
Percentage of women having live births who had adequate prenatal care as defined by Kessner Index. [1] (Time Periods: 1st - CY13; 2nd - CY14; 3rd - CY15. Most Recent - CY15)
1.
2nd 3rd
% Change from 1st period to
3rd period
Most Recent Data
Num DenPercent or Rate
Percentage of Medicaid enrolled pregnant women who deliver who receive prenatal WIC Program services.[3] (Time Periods: 1st - CY07-09; 2nd - CY10-12; 3rd - CY13-15. Most Recent - CY15)
4.
Percentage of women with live term singleton births who gained adequate/excessive/ inadequate weight according to the National Academy of Sciences-Institute of Medicine (IOM) 2009 Recommended Total Weight Gain Ranges during Pregnancy.[2] (Time Periods: 1st - CY13 2nd - CY14; 3rd - CY15. Most Recent - CY15)
2.
Percentage of women having live births who smoked during pregnancy. [1] (Time Periods: 1st - CY13; 2nd - CY14; 3rd - CY15. Most Recent - CY15)
3.
61.11 60.71 60.80 -0.51 349 574 60.80
25.90 24.59 27.94 7.87 133 476 27.94
Time Period
14.52 14.00 13.76 -5.19 79 574 13.76
82.46 83.12 83.52 1.29 371 437 84.90
A. Adequate Weight Gain
50.53 53.46 50.63 0.20 241 476 50.63B. Excessive Weight Gain
21.44 21.14 20.38 -4.97 97 476 20.38C. Inadequate Weight Gain
Percentage of infants enrolled in WIC who breastfed at 6 weeks postpartum. (Time Periods: 1st - FY15; 2nd - N/A; 3rd - N/A. Most Recent - FY15) [4]
5.34.73 157 452 34.73
Percentage of Medicaid enrolled pregnant women who deliver who receive a postpartum home visit.[3] (Time Periods: 1st - CY10-12; 2nd - N/A; 3rd - CY13-15. Most Recent - CY15)
6.
22.91 17.37 -24.17 51 472 10.81
62.89
28.75
48.42
19.51
9.35
73.19
25.14
12.21
[2] Recommended total prenatal weight gain range by prepregnancy weight category is 28-40 lbs. for underweight women (BMI<18.5); 25-35 lbs. for normal weight women (BMI 18.5 to 24.9); 15-25 lbs. for overweight women (BMI 25 to 29.9); and 11-20 lbs. for obese women (BMI>=30).
[4] Due to Crossroads implementation, data are only available for this time period. This page will be updated to include FY16 data when it becomes available. Also, data for counties composing districts are not available.
[1] With the implementation of the 2003 revised US Standard Certificate of Live Birth in NC in August 2010, data on prenatal care initiation and tobacco use prior to 2011 are not comparable.
Data sources for these objectives are as follows: 1, 2, & 3 NC Birth Certificates; 4 NC Automated WIC System matched with Medicaid Processed Claims Report; 5 NC Automated WIC System; and 6 Medicaid Processed Claims Report.
2.12 0.81 1.05 -50.53 5 476 1.05D. Unknown Weight Gain 3.32
[3] These data exclude women enrolled in Medicaid only for emergency delivery. 2014 Medicaid match includes data from both legacy WIC and Crossroads WIC System. Effective 2015 Prenatal Medicaid match included only Crossroads WIC data.
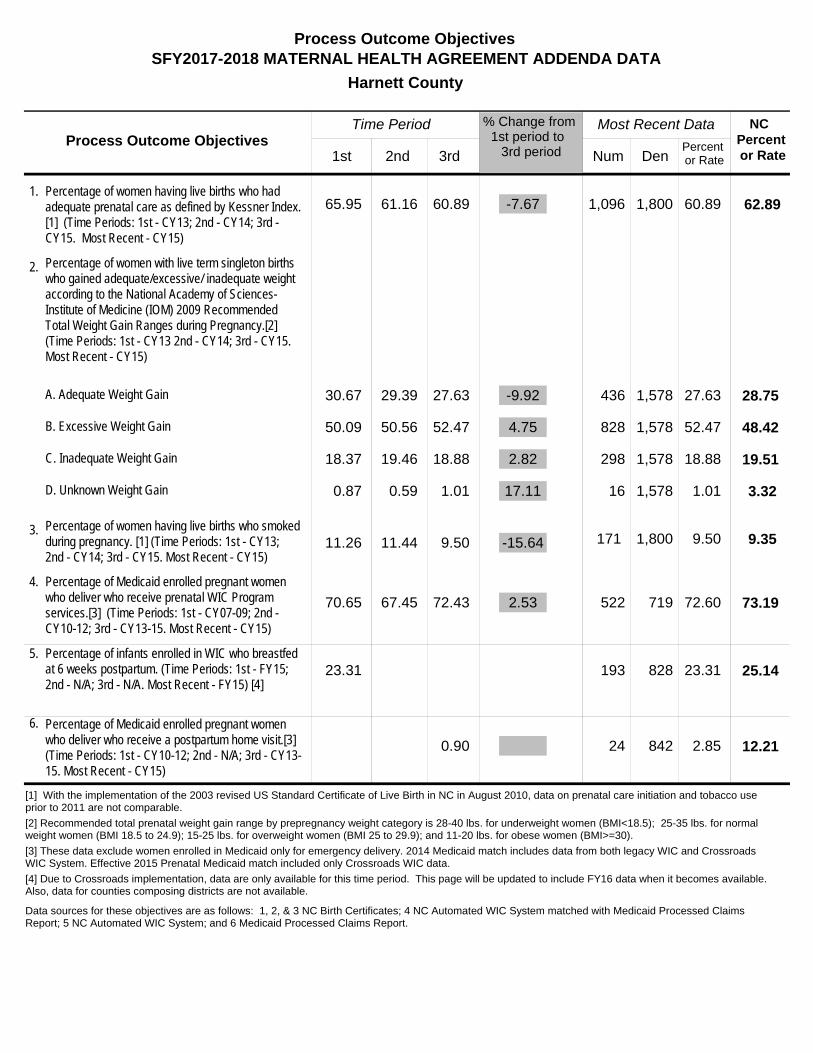
Harnett County
SFY2017-2018 MATERNAL HEALTH AGREEMENT ADDENDA DATAProcess Outcome Objectives
NC Percent or Rate
Process Outcome Objectives1st
Percentage of women having live births who had adequate prenatal care as defined by Kessner Index. [1] (Time Periods: 1st - CY13; 2nd - CY14; 3rd - CY15. Most Recent - CY15)
1.
2nd 3rd
% Change from 1st period to
3rd period
Most Recent Data
Num DenPercent or Rate
Percentage of Medicaid enrolled pregnant women who deliver who receive prenatal WIC Program services.[3] (Time Periods: 1st - CY07-09; 2nd - CY10-12; 3rd - CY13-15. Most Recent - CY15)
4.
Percentage of women with live term singleton births who gained adequate/excessive/ inadequate weight according to the National Academy of Sciences-Institute of Medicine (IOM) 2009 Recommended Total Weight Gain Ranges during Pregnancy.[2] (Time Periods: 1st - CY13 2nd - CY14; 3rd - CY15. Most Recent - CY15)
2.
Percentage of women having live births who smoked during pregnancy. [1] (Time Periods: 1st - CY13; 2nd - CY14; 3rd - CY15. Most Recent - CY15)
3.
65.95 61.16 60.89 -7.67 1,096 1,800 60.89
30.67 29.39 27.63 -9.92 436 1,578 27.63
Time Period
11.26 11.44 9.50 -15.64 171 1,800 9.50
70.65 67.45 72.43 2.53 522 719 72.60
A. Adequate Weight Gain
50.09 50.56 52.47 4.75 828 1,578 52.47B. Excessive Weight Gain
18.37 19.46 18.88 2.82 298 1,578 18.88C. Inadequate Weight Gain
Percentage of infants enrolled in WIC who breastfed at 6 weeks postpartum. (Time Periods: 1st - FY15; 2nd - N/A; 3rd - N/A. Most Recent - FY15) [4]
5.23.31 193 828 23.31
Percentage of Medicaid enrolled pregnant women who deliver who receive a postpartum home visit.[3] (Time Periods: 1st - CY10-12; 2nd - N/A; 3rd - CY13-15. Most Recent - CY15)
6.
0.90 24 842 2.85
62.89
28.75
48.42
19.51
9.35
73.19
25.14
12.21
[2] Recommended total prenatal weight gain range by prepregnancy weight category is 28-40 lbs. for underweight women (BMI<18.5); 25-35 lbs. for normal weight women (BMI 18.5 to 24.9); 15-25 lbs. for overweight women (BMI 25 to 29.9); and 11-20 lbs. for obese women (BMI>=30).
[4] Due to Crossroads implementation, data are only available for this time period. This page will be updated to include FY16 data when it becomes available. Also, data for counties composing districts are not available.
[1] With the implementation of the 2003 revised US Standard Certificate of Live Birth in NC in August 2010, data on prenatal care initiation and tobacco use prior to 2011 are not comparable.
Data sources for these objectives are as follows: 1, 2, & 3 NC Birth Certificates; 4 NC Automated WIC System matched with Medicaid Processed Claims Report; 5 NC Automated WIC System; and 6 Medicaid Processed Claims Report.
0.87 0.59 1.01 17.11 16 1,578 1.01D. Unknown Weight Gain 3.32
[3] These data exclude women enrolled in Medicaid only for emergency delivery. 2014 Medicaid match includes data from both legacy WIC and Crossroads WIC System. Effective 2015 Prenatal Medicaid match included only Crossroads WIC data.

Haywood County
SFY2017-2018 MATERNAL HEALTH AGREEMENT ADDENDA DATAProcess Outcome Objectives
NC Percent or Rate
Process Outcome Objectives1st
Percentage of women having live births who had adequate prenatal care as defined by Kessner Index. [1] (Time Periods: 1st - CY13; 2nd - CY14; 3rd - CY15. Most Recent - CY15)
1.
2nd 3rd
% Change from 1st period to
3rd period
Most Recent Data
Num DenPercent or Rate
Percentage of Medicaid enrolled pregnant women who deliver who receive prenatal WIC Program services.[3] (Time Periods: 1st - CY07-09; 2nd - CY10-12; 3rd - CY13-15. Most Recent - CY15)
4.
Percentage of women with live term singleton births who gained adequate/excessive/ inadequate weight according to the National Academy of Sciences-Institute of Medicine (IOM) 2009 Recommended Total Weight Gain Ranges during Pregnancy.[2] (Time Periods: 1st - CY13 2nd - CY14; 3rd - CY15. Most Recent - CY15)
2.
Percentage of women having live births who smoked during pregnancy. [1] (Time Periods: 1st - CY13; 2nd - CY14; 3rd - CY15. Most Recent - CY15)
3.
72.48 74.56 75.21 3.77 449 597 75.21
29.06 26.13 22.41 -22.87 117 522 22.41
Time Period
20.55 18.51 15.08 -26.64 90 597 15.08
70.01 78.72 76.87 9.80 276 380 72.63
A. Adequate Weight Gain
48.50 51.23 45.40 -6.40 237 522 45.40B. Excessive Weight Gain
18.16 18.31 22.41 23.41 117 522 22.41C. Inadequate Weight Gain
Percentage of infants enrolled in WIC who breastfed at 6 weeks postpartum. (Time Periods: 1st - FY15; 2nd - N/A; 3rd - N/A. Most Recent - FY15) [4]
5.41.48 151 364 41.48
Percentage of Medicaid enrolled pregnant women who deliver who receive a postpartum home visit.[3] (Time Periods: 1st - CY10-12; 2nd - N/A; 3rd - CY13-15. Most Recent - CY15)
6.
7.36 -100.00 390
62.89
28.75
48.42
19.51
9.35
73.19
25.14
12.21
[2] Recommended total prenatal weight gain range by prepregnancy weight category is 28-40 lbs. for underweight women (BMI<18.5); 25-35 lbs. for normal weight women (BMI 18.5 to 24.9); 15-25 lbs. for overweight women (BMI 25 to 29.9); and 11-20 lbs. for obese women (BMI>=30).
[4] Due to Crossroads implementation, data are only available for this time period. This page will be updated to include FY16 data when it becomes available. Also, data for counties composing districts are not available.
[1] With the implementation of the 2003 revised US Standard Certificate of Live Birth in NC in August 2010, data on prenatal care initiation and tobacco use prior to 2011 are not comparable.
Data sources for these objectives are as follows: 1, 2, & 3 NC Birth Certificates; 4 NC Automated WIC System matched with Medicaid Processed Claims Report; 5 NC Automated WIC System; and 6 Medicaid Processed Claims Report.
4.27 4.32 9.77 128.62 51 522 9.77D. Unknown Weight Gain 3.32
[3] These data exclude women enrolled in Medicaid only for emergency delivery. 2014 Medicaid match includes data from both legacy WIC and Crossroads WIC System. Effective 2015 Prenatal Medicaid match included only Crossroads WIC data.

Henderson County
SFY2017-2018 MATERNAL HEALTH AGREEMENT ADDENDA DATAProcess Outcome Objectives
NC Percent or Rate
Process Outcome Objectives1st
Percentage of women having live births who had adequate prenatal care as defined by Kessner Index. [1] (Time Periods: 1st - CY13; 2nd - CY14; 3rd - CY15. Most Recent - CY15)
1.
2nd 3rd
% Change from 1st period to
3rd period
Most Recent Data
Num DenPercent or Rate
Percentage of Medicaid enrolled pregnant women who deliver who receive prenatal WIC Program services.[3] (Time Periods: 1st - CY07-09; 2nd - CY10-12; 3rd - CY13-15. Most Recent - CY15)
4.
Percentage of women with live term singleton births who gained adequate/excessive/ inadequate weight according to the National Academy of Sciences-Institute of Medicine (IOM) 2009 Recommended Total Weight Gain Ranges during Pregnancy.[2] (Time Periods: 1st - CY13 2nd - CY14; 3rd - CY15. Most Recent - CY15)
2.
Percentage of women having live births who smoked during pregnancy. [1] (Time Periods: 1st - CY13; 2nd - CY14; 3rd - CY15. Most Recent - CY15)
3.
76.34 75.14 76.24 -0.13 815 1,069 76.24
31.33 30.51 31.05 -0.87 295 950 31.05
Time Period
10.34 9.82 9.45 -8.67 101 1,069 9.45
46.97 51.36 61.70 31.35 356 549 64.85
A. Adequate Weight Gain
43.48 45.35 42.53 -2.20 404 950 42.53B. Excessive Weight Gain
19.82 19.96 19.68 -0.71 187 950 19.68C. Inadequate Weight Gain
Percentage of infants enrolled in WIC who breastfed at 6 weeks postpartum. (Time Periods: 1st - FY15; 2nd - N/A; 3rd - N/A. Most Recent - FY15) [4]
5.26.56 170 640 26.56
Percentage of Medicaid enrolled pregnant women who deliver who receive a postpartum home visit.[3] (Time Periods: 1st - CY10-12; 2nd - N/A; 3rd - CY13-15. Most Recent - CY15)
6.
11.72 2.80 -76.15 5 662 0.76
62.89
28.75
48.42
19.51
9.35
73.19
25.14
12.21
[2] Recommended total prenatal weight gain range by prepregnancy weight category is 28-40 lbs. for underweight women (BMI<18.5); 25-35 lbs. for normal weight women (BMI 18.5 to 24.9); 15-25 lbs. for overweight women (BMI 25 to 29.9); and 11-20 lbs. for obese women (BMI>=30).
[4] Due to Crossroads implementation, data are only available for this time period. This page will be updated to include FY16 data when it becomes available. Also, data for counties composing districts are not available.
[1] With the implementation of the 2003 revised US Standard Certificate of Live Birth in NC in August 2010, data on prenatal care initiation and tobacco use prior to 2011 are not comparable.
Data sources for these objectives are as follows: 1, 2, & 3 NC Birth Certificates; 4 NC Automated WIC System matched with Medicaid Processed Claims Report; 5 NC Automated WIC System; and 6 Medicaid Processed Claims Report.
5.37 4.18 6.74 25.53 64 950 6.74D. Unknown Weight Gain 3.32
[3] These data exclude women enrolled in Medicaid only for emergency delivery. 2014 Medicaid match includes data from both legacy WIC and Crossroads WIC System. Effective 2015 Prenatal Medicaid match included only Crossroads WIC data.

Hertford County
SFY2017-2018 MATERNAL HEALTH AGREEMENT ADDENDA DATAProcess Outcome Objectives
NC Percent or Rate
Process Outcome Objectives1st
Percentage of women having live births who had adequate prenatal care as defined by Kessner Index. [1] (Time Periods: 1st - CY13; 2nd - CY14; 3rd - CY15. Most Recent - CY15)
1.
2nd 3rd
% Change from 1st period to
3rd period
Most Recent Data
Num DenPercent or Rate
Percentage of Medicaid enrolled pregnant women who deliver who receive prenatal WIC Program services.[3] (Time Periods: 1st - CY07-09; 2nd - CY10-12; 3rd - CY13-15. Most Recent - CY15)
4.
Percentage of women with live term singleton births who gained adequate/excessive/ inadequate weight according to the National Academy of Sciences-Institute of Medicine (IOM) 2009 Recommended Total Weight Gain Ranges during Pregnancy.[2] (Time Periods: 1st - CY13 2nd - CY14; 3rd - CY15. Most Recent - CY15)
2.
Percentage of women having live births who smoked during pregnancy. [1] (Time Periods: 1st - CY13; 2nd - CY14; 3rd - CY15. Most Recent - CY15)
3.
65.56 73.54 71.97 9.77 172 239 71.97
20.51 26.63 30.00 46.25 57 190 30.00
Time Period
9.96 11.66 13.39 34.45 32 239 13.39
78.45 74.95 84.10 7.21 155 171 90.64
A. Adequate Weight Gain
36.92 44.57 33.68 -8.77 64 190 33.68B. Excessive Weight Gain
31.28 26.09 34.74 11.04 66 190 34.74C. Inadequate Weight Gain
Percentage of infants enrolled in WIC who breastfed at 6 weeks postpartum. (Time Periods: 1st - FY15; 2nd - N/A; 3rd - N/A. Most Recent - FY15) [4]
5.26.18 50 191 26.18
Percentage of Medicaid enrolled pregnant women who deliver who receive a postpartum home visit.[3] (Time Periods: 1st - CY10-12; 2nd - N/A; 3rd - CY13-15. Most Recent - CY15)
6.
1.60 -100.00 186
62.89
28.75
48.42
19.51
9.35
73.19
25.14
12.21
[2] Recommended total prenatal weight gain range by prepregnancy weight category is 28-40 lbs. for underweight women (BMI<18.5); 25-35 lbs. for normal weight women (BMI 18.5 to 24.9); 15-25 lbs. for overweight women (BMI 25 to 29.9); and 11-20 lbs. for obese women (BMI>=30).
[4] Due to Crossroads implementation, data are only available for this time period. This page will be updated to include FY16 data when it becomes available. Also, data for counties composing districts are not available.
[1] With the implementation of the 2003 revised US Standard Certificate of Live Birth in NC in August 2010, data on prenatal care initiation and tobacco use prior to 2011 are not comparable.
Data sources for these objectives are as follows: 1, 2, & 3 NC Birth Certificates; 4 NC Automated WIC System matched with Medicaid Processed Claims Report; 5 NC Automated WIC System; and 6 Medicaid Processed Claims Report.
11.28 2.72 1.58 -86.00 3 190 1.58D. Unknown Weight Gain 3.32
[3] These data exclude women enrolled in Medicaid only for emergency delivery. 2014 Medicaid match includes data from both legacy WIC and Crossroads WIC System. Effective 2015 Prenatal Medicaid match included only Crossroads WIC data.

Hoke County
SFY2017-2018 MATERNAL HEALTH AGREEMENT ADDENDA DATAProcess Outcome Objectives
NC Percent or Rate
Process Outcome Objectives1st
Percentage of women having live births who had adequate prenatal care as defined by Kessner Index. [1] (Time Periods: 1st - CY13; 2nd - CY14; 3rd - CY15. Most Recent - CY15)
1.
2nd 3rd
% Change from 1st period to
3rd period
Most Recent Data
Num DenPercent or Rate
Percentage of Medicaid enrolled pregnant women who deliver who receive prenatal WIC Program services.[3] (Time Periods: 1st - CY07-09; 2nd - CY10-12; 3rd - CY13-15. Most Recent - CY15)
4.
Percentage of women with live term singleton births who gained adequate/excessive/ inadequate weight according to the National Academy of Sciences-Institute of Medicine (IOM) 2009 Recommended Total Weight Gain Ranges during Pregnancy.[2] (Time Periods: 1st - CY13 2nd - CY14; 3rd - CY15. Most Recent - CY15)
2.
Percentage of women having live births who smoked during pregnancy. [1] (Time Periods: 1st - CY13; 2nd - CY14; 3rd - CY15. Most Recent - CY15)
3.
74.42 69.20 73.12 -1.75 699 956 73.12
28.90 30.19 32.76 13.37 268 818 32.76
Time Period
10.12 9.28 9.21 -9.06 88 956 9.21
74.44 71.58 75.08 0.85 247 347 71.18
A. Adequate Weight Gain
52.69 49.40 49.88 -5.33 408 818 49.88B. Excessive Weight Gain
17.88 20.05 17.11 -4.26 140 818 17.11C. Inadequate Weight Gain
Percentage of infants enrolled in WIC who breastfed at 6 weeks postpartum. (Time Periods: 1st - FY15; 2nd - N/A; 3rd - N/A. Most Recent - FY15) [4]
5.8.53 44 516 8.53
Percentage of Medicaid enrolled pregnant women who deliver who receive a postpartum home visit.[3] (Time Periods: 1st - CY10-12; 2nd - N/A; 3rd - CY13-15. Most Recent - CY15)
6.
0.25 404
62.89
28.75
48.42
19.51
9.35
73.19
25.14
12.21
[2] Recommended total prenatal weight gain range by prepregnancy weight category is 28-40 lbs. for underweight women (BMI<18.5); 25-35 lbs. for normal weight women (BMI 18.5 to 24.9); 15-25 lbs. for overweight women (BMI 25 to 29.9); and 11-20 lbs. for obese women (BMI>=30).
[4] Due to Crossroads implementation, data are only available for this time period. This page will be updated to include FY16 data when it becomes available. Also, data for counties composing districts are not available.
[1] With the implementation of the 2003 revised US Standard Certificate of Live Birth in NC in August 2010, data on prenatal care initiation and tobacco use prior to 2011 are not comparable.
Data sources for these objectives are as follows: 1, 2, & 3 NC Birth Certificates; 4 NC Automated WIC System matched with Medicaid Processed Claims Report; 5 NC Automated WIC System; and 6 Medicaid Processed Claims Report.
0.54 0.36 0.24 -54.52 2 818 0.24D. Unknown Weight Gain 3.32
[3] These data exclude women enrolled in Medicaid only for emergency delivery. 2014 Medicaid match includes data from both legacy WIC and Crossroads WIC System. Effective 2015 Prenatal Medicaid match included only Crossroads WIC data.

Hyde County
SFY2017-2018 MATERNAL HEALTH AGREEMENT ADDENDA DATAProcess Outcome Objectives
NC Percent or Rate
Process Outcome Objectives1st
Percentage of women having live births who had adequate prenatal care as defined by Kessner Index. [1] (Time Periods: 1st - CY13; 2nd - CY14; 3rd - CY15. Most Recent - CY15)
1.
2nd 3rd
% Change from 1st period to
3rd period
Most Recent Data
Num DenPercent or Rate
Percentage of Medicaid enrolled pregnant women who deliver who receive prenatal WIC Program services.[3] (Time Periods: 1st - CY07-09; 2nd - CY10-12; 3rd - CY13-15. Most Recent - CY15)
4.
Percentage of women with live term singleton births who gained adequate/excessive/ inadequate weight according to the National Academy of Sciences-Institute of Medicine (IOM) 2009 Recommended Total Weight Gain Ranges during Pregnancy.[2] (Time Periods: 1st - CY13 2nd - CY14; 3rd - CY15. Most Recent - CY15)
2.
Percentage of women having live births who smoked during pregnancy. [1] (Time Periods: 1st - CY13; 2nd - CY14; 3rd - CY15. Most Recent - CY15)
3.
72.41 67.57 79.59 9.91 39 49 79.59
27.27 21.21 26.19 -3.97 11 42 26.19
Time Period
15.52 5.41 12.24 -21.09 6 49 12.24
71.21 79.12 89.02 25.01 26 28 92.86
A. Adequate Weight Gain
50.00 36.36 54.76 9.52 23 42 54.76B. Excessive Weight Gain
13.64 42.42 19.05 39.68 8 42 19.05C. Inadequate Weight Gain
Percentage of infants enrolled in WIC who breastfed at 6 weeks postpartum. (Time Periods: 1st - FY15; 2nd - N/A; 3rd - N/A. Most Recent - FY15) [4]
5.17.24 5 29 17.24
Percentage of Medicaid enrolled pregnant women who deliver who receive a postpartum home visit.[3] (Time Periods: 1st - CY10-12; 2nd - N/A; 3rd - CY13-15. Most Recent - CY15)
6.
4.90 5 34 14.71
62.89
28.75
48.42
19.51
9.35
73.19
25.14
12.21
[2] Recommended total prenatal weight gain range by prepregnancy weight category is 28-40 lbs. for underweight women (BMI<18.5); 25-35 lbs. for normal weight women (BMI 18.5 to 24.9); 15-25 lbs. for overweight women (BMI 25 to 29.9); and 11-20 lbs. for obese women (BMI>=30).
[4] Due to Crossroads implementation, data are only available for this time period. This page will be updated to include FY16 data when it becomes available. Also, data for counties composing districts are not available.
[1] With the implementation of the 2003 revised US Standard Certificate of Live Birth in NC in August 2010, data on prenatal care initiation and tobacco use prior to 2011 are not comparable.
Data sources for these objectives are as follows: 1, 2, & 3 NC Birth Certificates; 4 NC Automated WIC System matched with Medicaid Processed Claims Report; 5 NC Automated WIC System; and 6 Medicaid Processed Claims Report.
9.09 0.00 0.00 -100.00 0 42 0.00D. Unknown Weight Gain 3.32
[3] These data exclude women enrolled in Medicaid only for emergency delivery. 2014 Medicaid match includes data from both legacy WIC and Crossroads WIC System. Effective 2015 Prenatal Medicaid match included only Crossroads WIC data.

Iredell County
SFY2017-2018 MATERNAL HEALTH AGREEMENT ADDENDA DATAProcess Outcome Objectives
NC Percent or Rate
Process Outcome Objectives1st
Percentage of women having live births who had adequate prenatal care as defined by Kessner Index. [1] (Time Periods: 1st - CY13; 2nd - CY14; 3rd - CY15. Most Recent - CY15)
1.
2nd 3rd
% Change from 1st period to
3rd period
Most Recent Data
Num DenPercent or Rate
Percentage of Medicaid enrolled pregnant women who deliver who receive prenatal WIC Program services.[3] (Time Periods: 1st - CY07-09; 2nd - CY10-12; 3rd - CY13-15. Most Recent - CY15)
4.
Percentage of women with live term singleton births who gained adequate/excessive/ inadequate weight according to the National Academy of Sciences-Institute of Medicine (IOM) 2009 Recommended Total Weight Gain Ranges during Pregnancy.[2] (Time Periods: 1st - CY13 2nd - CY14; 3rd - CY15. Most Recent - CY15)
2.
Percentage of women having live births who smoked during pregnancy. [1] (Time Periods: 1st - CY13; 2nd - CY14; 3rd - CY15. Most Recent - CY15)
3.
61.53 62.96 60.88 -1.06 1,178 1,935 60.88
31.08 29.85 30.23 -2.71 504 1,667 30.23
Time Period
12.21 12.25 11.21 -8.19 217 1,935 11.21
77.34 76.22 71.73 -7.25 676 957 70.64
A. Adequate Weight Gain
49.61 50.67 48.95 -1.32 816 1,667 48.95B. Excessive Weight Gain
18.59 18.91 20.16 8.40 336 1,667 20.16C. Inadequate Weight Gain
Percentage of infants enrolled in WIC who breastfed at 6 weeks postpartum. (Time Periods: 1st - FY15; 2nd - N/A; 3rd - N/A. Most Recent - FY15) [4]
5.27.62 256 927 27.62
Percentage of Medicaid enrolled pregnant women who deliver who receive a postpartum home visit.[3] (Time Periods: 1st - CY10-12; 2nd - N/A; 3rd - CY13-15. Most Recent - CY15)
6.
0.13 2 1,048 0.19
62.89
28.75
48.42
19.51
9.35
73.19
25.14
12.21
[2] Recommended total prenatal weight gain range by prepregnancy weight category is 28-40 lbs. for underweight women (BMI<18.5); 25-35 lbs. for normal weight women (BMI 18.5 to 24.9); 15-25 lbs. for overweight women (BMI 25 to 29.9); and 11-20 lbs. for obese women (BMI>=30).
[4] Due to Crossroads implementation, data are only available for this time period. This page will be updated to include FY16 data when it becomes available. Also, data for counties composing districts are not available.
[1] With the implementation of the 2003 revised US Standard Certificate of Live Birth in NC in August 2010, data on prenatal care initiation and tobacco use prior to 2011 are not comparable.
Data sources for these objectives are as follows: 1, 2, & 3 NC Birth Certificates; 4 NC Automated WIC System matched with Medicaid Processed Claims Report; 5 NC Automated WIC System; and 6 Medicaid Processed Claims Report.
0.72 0.57 0.66 -8.70 11 1,667 0.66D. Unknown Weight Gain 3.32
[3] These data exclude women enrolled in Medicaid only for emergency delivery. 2014 Medicaid match includes data from both legacy WIC and Crossroads WIC System. Effective 2015 Prenatal Medicaid match included only Crossroads WIC data.

Jackson County
SFY2017-2018 MATERNAL HEALTH AGREEMENT ADDENDA DATAProcess Outcome Objectives
NC Percent or Rate
Process Outcome Objectives1st
Percentage of women having live births who had adequate prenatal care as defined by Kessner Index. [1] (Time Periods: 1st - CY13; 2nd - CY14; 3rd - CY15. Most Recent - CY15)
1.
2nd 3rd
% Change from 1st period to
3rd period
Most Recent Data
Num DenPercent or Rate
Percentage of Medicaid enrolled pregnant women who deliver who receive prenatal WIC Program services.[3] (Time Periods: 1st - CY07-09; 2nd - CY10-12; 3rd - CY13-15. Most Recent - CY15)
4.
Percentage of women with live term singleton births who gained adequate/excessive/ inadequate weight according to the National Academy of Sciences-Institute of Medicine (IOM) 2009 Recommended Total Weight Gain Ranges during Pregnancy.[2] (Time Periods: 1st - CY13 2nd - CY14; 3rd - CY15. Most Recent - CY15)
2.
Percentage of women having live births who smoked during pregnancy. [1] (Time Periods: 1st - CY13; 2nd - CY14; 3rd - CY15. Most Recent - CY15)
3.
62.26 70.68 65.75 5.61 263 400 65.75
24.46 27.41 26.22 7.19 91 347 26.22
Time Period
23.97 17.29 19.00 -20.72 76 400 19.00
80.20 78.05 74.21 -7.47 168 264 63.64
A. Adequate Weight Gain
57.80 53.06 54.18 -6.26 188 347 54.18B. Excessive Weight Gain
15.60 17.49 16.43 5.32 57 347 16.43C. Inadequate Weight Gain
Percentage of infants enrolled in WIC who breastfed at 6 weeks postpartum. (Time Periods: 1st - FY15; 2nd - N/A; 3rd - N/A. Most Recent - FY15) [4]
5.5.24 11 210 5.24
Percentage of Medicaid enrolled pregnant women who deliver who receive a postpartum home visit.[3] (Time Periods: 1st - CY10-12; 2nd - N/A; 3rd - CY13-15. Most Recent - CY15)
6.
0.57 0.11 -80.33 290
62.89
28.75
48.42
19.51
9.35
73.19
25.14
12.21
[2] Recommended total prenatal weight gain range by prepregnancy weight category is 28-40 lbs. for underweight women (BMI<18.5); 25-35 lbs. for normal weight women (BMI 18.5 to 24.9); 15-25 lbs. for overweight women (BMI 25 to 29.9); and 11-20 lbs. for obese women (BMI>=30).
[4] Due to Crossroads implementation, data are only available for this time period. This page will be updated to include FY16 data when it becomes available. Also, data for counties composing districts are not available.
[1] With the implementation of the 2003 revised US Standard Certificate of Live Birth in NC in August 2010, data on prenatal care initiation and tobacco use prior to 2011 are not comparable.
Data sources for these objectives are as follows: 1, 2, & 3 NC Birth Certificates; 4 NC Automated WIC System matched with Medicaid Processed Claims Report; 5 NC Automated WIC System; and 6 Medicaid Processed Claims Report.
2.14 2.04 3.17 48.09 11 347 3.17D. Unknown Weight Gain 3.32
[3] These data exclude women enrolled in Medicaid only for emergency delivery. 2014 Medicaid match includes data from both legacy WIC and Crossroads WIC System. Effective 2015 Prenatal Medicaid match included only Crossroads WIC data.

Johnston County
SFY2017-2018 MATERNAL HEALTH AGREEMENT ADDENDA DATAProcess Outcome Objectives
NC Percent or Rate
Process Outcome Objectives1st
Percentage of women having live births who had adequate prenatal care as defined by Kessner Index. [1] (Time Periods: 1st - CY13; 2nd - CY14; 3rd - CY15. Most Recent - CY15)
1.
2nd 3rd
% Change from 1st period to
3rd period
Most Recent Data
Num DenPercent or Rate
Percentage of Medicaid enrolled pregnant women who deliver who receive prenatal WIC Program services.[3] (Time Periods: 1st - CY07-09; 2nd - CY10-12; 3rd - CY13-15. Most Recent - CY15)
4.
Percentage of women with live term singleton births who gained adequate/excessive/ inadequate weight according to the National Academy of Sciences-Institute of Medicine (IOM) 2009 Recommended Total Weight Gain Ranges during Pregnancy.[2] (Time Periods: 1st - CY13 2nd - CY14; 3rd - CY15. Most Recent - CY15)
2.
Percentage of women having live births who smoked during pregnancy. [1] (Time Periods: 1st - CY13; 2nd - CY14; 3rd - CY15. Most Recent - CY15)
3.
63.00 62.31 66.39 5.37 1,505 2,267 66.39
27.68 26.84 27.67 -0.01 546 1,973 27.67
Time Period
9.61 9.01 8.34 -13.22 189 2,267 8.34
54.65 63.92 70.23 28.51 728 1,041 69.93
A. Adequate Weight Gain
52.43 53.59 51.39 -1.97 1,014 1,973 51.39B. Excessive Weight Gain
17.75 17.68 17.13 -3.51 338 1,973 17.13C. Inadequate Weight Gain
Percentage of infants enrolled in WIC who breastfed at 6 weeks postpartum. (Time Periods: 1st - FY15; 2nd - N/A; 3rd - N/A. Most Recent - FY15) [4]
5.21.88 235 1,074 21.88
Percentage of Medicaid enrolled pregnant women who deliver who receive a postpartum home visit.[3] (Time Periods: 1st - CY10-12; 2nd - N/A; 3rd - CY13-15. Most Recent - CY15)
6.
0.20 -100.00 1,289
62.89
28.75
48.42
19.51
9.35
73.19
25.14
12.21
[2] Recommended total prenatal weight gain range by prepregnancy weight category is 28-40 lbs. for underweight women (BMI<18.5); 25-35 lbs. for normal weight women (BMI 18.5 to 24.9); 15-25 lbs. for overweight women (BMI 25 to 29.9); and 11-20 lbs. for obese women (BMI>=30).
[4] Due to Crossroads implementation, data are only available for this time period. This page will be updated to include FY16 data when it becomes available. Also, data for counties composing districts are not available.
[1] With the implementation of the 2003 revised US Standard Certificate of Live Birth in NC in August 2010, data on prenatal care initiation and tobacco use prior to 2011 are not comparable.
Data sources for these objectives are as follows: 1, 2, & 3 NC Birth Certificates; 4 NC Automated WIC System matched with Medicaid Processed Claims Report; 5 NC Automated WIC System; and 6 Medicaid Processed Claims Report.
2.14 1.89 3.80 77.55 75 1,973 3.80D. Unknown Weight Gain 3.32
[3] These data exclude women enrolled in Medicaid only for emergency delivery. 2014 Medicaid match includes data from both legacy WIC and Crossroads WIC System. Effective 2015 Prenatal Medicaid match included only Crossroads WIC data.

Jones County
SFY2017-2018 MATERNAL HEALTH AGREEMENT ADDENDA DATAProcess Outcome Objectives
NC Percent or Rate
Process Outcome Objectives1st
Percentage of women having live births who had adequate prenatal care as defined by Kessner Index. [1] (Time Periods: 1st - CY13; 2nd - CY14; 3rd - CY15. Most Recent - CY15)
1.
2nd 3rd
% Change from 1st period to
3rd period
Most Recent Data
Num DenPercent or Rate
Percentage of Medicaid enrolled pregnant women who deliver who receive prenatal WIC Program services.[3] (Time Periods: 1st - CY07-09; 2nd - CY10-12; 3rd - CY13-15. Most Recent - CY15)
4.
Percentage of women with live term singleton births who gained adequate/excessive/ inadequate weight according to the National Academy of Sciences-Institute of Medicine (IOM) 2009 Recommended Total Weight Gain Ranges during Pregnancy.[2] (Time Periods: 1st - CY13 2nd - CY14; 3rd - CY15. Most Recent - CY15)
2.
Percentage of women having live births who smoked during pregnancy. [1] (Time Periods: 1st - CY13; 2nd - CY14; 3rd - CY15. Most Recent - CY15)
3.
66.67 53.33 65.56 -1.67 59 90 65.56
31.87 29.55 32.47 1.88 25 77 32.47
Time Period
15.63 13.33 11.11 -28.89 10 90 11.11
79.74 89.60 84.21 5.61 38 46 82.61
A. Adequate Weight Gain
43.96 51.14 51.95 18.18 40 77 51.95B. Excessive Weight Gain
21.98 18.18 14.29 -35.00 11 77 14.29C. Inadequate Weight Gain
Percentage of infants enrolled in WIC who breastfed at 6 weeks postpartum. (Time Periods: 1st - FY15; 2nd - N/A; 3rd - N/A. Most Recent - FY15) [4]
5.32.84 22 67 32.84
Percentage of Medicaid enrolled pregnant women who deliver who receive a postpartum home visit.[3] (Time Periods: 1st - CY10-12; 2nd - N/A; 3rd - CY13-15. Most Recent - CY15)
6.
4.98 -100.00 48
62.89
28.75
48.42
19.51
9.35
73.19
25.14
12.21
[2] Recommended total prenatal weight gain range by prepregnancy weight category is 28-40 lbs. for underweight women (BMI<18.5); 25-35 lbs. for normal weight women (BMI 18.5 to 24.9); 15-25 lbs. for overweight women (BMI 25 to 29.9); and 11-20 lbs. for obese women (BMI>=30).
[4] Due to Crossroads implementation, data are only available for this time period. This page will be updated to include FY16 data when it becomes available. Also, data for counties composing districts are not available.
[1] With the implementation of the 2003 revised US Standard Certificate of Live Birth in NC in August 2010, data on prenatal care initiation and tobacco use prior to 2011 are not comparable.
Data sources for these objectives are as follows: 1, 2, & 3 NC Birth Certificates; 4 NC Automated WIC System matched with Medicaid Processed Claims Report; 5 NC Automated WIC System; and 6 Medicaid Processed Claims Report.
2.20 1.14 1.30 -40.91 1 77 1.30D. Unknown Weight Gain 3.32
[3] These data exclude women enrolled in Medicaid only for emergency delivery. 2014 Medicaid match includes data from both legacy WIC and Crossroads WIC System. Effective 2015 Prenatal Medicaid match included only Crossroads WIC data.

Lee County
SFY2017-2018 MATERNAL HEALTH AGREEMENT ADDENDA DATAProcess Outcome Objectives
NC Percent or Rate
Process Outcome Objectives1st
Percentage of women having live births who had adequate prenatal care as defined by Kessner Index. [1] (Time Periods: 1st - CY13; 2nd - CY14; 3rd - CY15. Most Recent - CY15)
1.
2nd 3rd
% Change from 1st period to
3rd period
Most Recent Data
Num DenPercent or Rate
Percentage of Medicaid enrolled pregnant women who deliver who receive prenatal WIC Program services.[3] (Time Periods: 1st - CY07-09; 2nd - CY10-12; 3rd - CY13-15. Most Recent - CY15)
4.
Percentage of women with live term singleton births who gained adequate/excessive/ inadequate weight according to the National Academy of Sciences-Institute of Medicine (IOM) 2009 Recommended Total Weight Gain Ranges during Pregnancy.[2] (Time Periods: 1st - CY13 2nd - CY14; 3rd - CY15. Most Recent - CY15)
2.
Percentage of women having live births who smoked during pregnancy. [1] (Time Periods: 1st - CY13; 2nd - CY14; 3rd - CY15. Most Recent - CY15)
3.
49.29 50.95 51.38 4.23 373 726 51.38
29.94 30.11 26.75 -10.65 168 628 26.75
Time Period
13.26 14.87 12.95 -2.33 94 726 12.95
66.28 64.42 76.69 15.70 297 381 77.95
A. Adequate Weight Gain
45.96 47.62 47.13 2.56 296 628 47.13B. Excessive Weight Gain
22.16 20.12 21.18 -4.41 133 628 21.18C. Inadequate Weight Gain
Percentage of infants enrolled in WIC who breastfed at 6 weeks postpartum. (Time Periods: 1st - FY15; 2nd - N/A; 3rd - N/A. Most Recent - FY15) [4]
5.13.18 63 478 13.18
Percentage of Medicaid enrolled pregnant women who deliver who receive a postpartum home visit.[3] (Time Periods: 1st - CY10-12; 2nd - N/A; 3rd - CY13-15. Most Recent - CY15)
6.
3.56 6.59 85.12 31 508 6.10
62.89
28.75
48.42
19.51
9.35
73.19
25.14
12.21
[2] Recommended total prenatal weight gain range by prepregnancy weight category is 28-40 lbs. for underweight women (BMI<18.5); 25-35 lbs. for normal weight women (BMI 18.5 to 24.9); 15-25 lbs. for overweight women (BMI 25 to 29.9); and 11-20 lbs. for obese women (BMI>=30).
[4] Due to Crossroads implementation, data are only available for this time period. This page will be updated to include FY16 data when it becomes available. Also, data for counties composing districts are not available.
[1] With the implementation of the 2003 revised US Standard Certificate of Live Birth in NC in August 2010, data on prenatal care initiation and tobacco use prior to 2011 are not comparable.
Data sources for these objectives are as follows: 1, 2, & 3 NC Birth Certificates; 4 NC Automated WIC System matched with Medicaid Processed Claims Report; 5 NC Automated WIC System; and 6 Medicaid Processed Claims Report.
1.95 2.15 4.94 153.65 31 628 4.94D. Unknown Weight Gain 3.32
[3] These data exclude women enrolled in Medicaid only for emergency delivery. 2014 Medicaid match includes data from both legacy WIC and Crossroads WIC System. Effective 2015 Prenatal Medicaid match included only Crossroads WIC data.

Lenoir County
SFY2017-2018 MATERNAL HEALTH AGREEMENT ADDENDA DATAProcess Outcome Objectives
NC Percent or Rate
Process Outcome Objectives1st
Percentage of women having live births who had adequate prenatal care as defined by Kessner Index. [1] (Time Periods: 1st - CY13; 2nd - CY14; 3rd - CY15. Most Recent - CY15)
1.
2nd 3rd
% Change from 1st period to
3rd period
Most Recent Data
Num DenPercent or Rate
Percentage of Medicaid enrolled pregnant women who deliver who receive prenatal WIC Program services.[3] (Time Periods: 1st - CY07-09; 2nd - CY10-12; 3rd - CY13-15. Most Recent - CY15)
4.
Percentage of women with live term singleton births who gained adequate/excessive/ inadequate weight according to the National Academy of Sciences-Institute of Medicine (IOM) 2009 Recommended Total Weight Gain Ranges during Pregnancy.[2] (Time Periods: 1st - CY13 2nd - CY14; 3rd - CY15. Most Recent - CY15)
2.
Percentage of women having live births who smoked during pregnancy. [1] (Time Periods: 1st - CY13; 2nd - CY14; 3rd - CY15. Most Recent - CY15)
3.
56.15 57.12 59.87 6.64 379 633 59.87
26.98 27.18 24.95 -7.50 134 537 24.95
Time Period
15.33 17.62 16.75 9.26 106 633 16.75
72.52 72.78 79.66 9.86 363 461 78.74
A. Adequate Weight Gain
48.63 46.50 49.91 2.64 268 537 49.91B. Excessive Weight Gain
22.68 24.96 23.84 5.10 128 537 23.84C. Inadequate Weight Gain
Percentage of infants enrolled in WIC who breastfed at 6 weeks postpartum. (Time Periods: 1st - FY15; 2nd - N/A; 3rd - N/A. Most Recent - FY15) [4]
5.26.92 140 520 26.92
Percentage of Medicaid enrolled pregnant women who deliver who receive a postpartum home visit.[3] (Time Periods: 1st - CY10-12; 2nd - N/A; 3rd - CY13-15. Most Recent - CY15)
6.
1.20 0.30 -75.10 518
62.89
28.75
48.42
19.51
9.35
73.19
25.14
12.21
[2] Recommended total prenatal weight gain range by prepregnancy weight category is 28-40 lbs. for underweight women (BMI<18.5); 25-35 lbs. for normal weight women (BMI 18.5 to 24.9); 15-25 lbs. for overweight women (BMI 25 to 29.9); and 11-20 lbs. for obese women (BMI>=30).
[4] Due to Crossroads implementation, data are only available for this time period. This page will be updated to include FY16 data when it becomes available. Also, data for counties composing districts are not available.
[1] With the implementation of the 2003 revised US Standard Certificate of Live Birth in NC in August 2010, data on prenatal care initiation and tobacco use prior to 2011 are not comparable.
Data sources for these objectives are as follows: 1, 2, & 3 NC Birth Certificates; 4 NC Automated WIC System matched with Medicaid Processed Claims Report; 5 NC Automated WIC System; and 6 Medicaid Processed Claims Report.
1.72 1.37 1.30 -24.13 7 537 1.30D. Unknown Weight Gain 3.32
[3] These data exclude women enrolled in Medicaid only for emergency delivery. 2014 Medicaid match includes data from both legacy WIC and Crossroads WIC System. Effective 2015 Prenatal Medicaid match included only Crossroads WIC data.

Lincoln County
SFY2017-2018 MATERNAL HEALTH AGREEMENT ADDENDA DATAProcess Outcome Objectives
NC Percent or Rate
Process Outcome Objectives1st
Percentage of women having live births who had adequate prenatal care as defined by Kessner Index. [1] (Time Periods: 1st - CY13; 2nd - CY14; 3rd - CY15. Most Recent - CY15)
1.
2nd 3rd
% Change from 1st period to
3rd period
Most Recent Data
Num DenPercent or Rate
Percentage of Medicaid enrolled pregnant women who deliver who receive prenatal WIC Program services.[3] (Time Periods: 1st - CY07-09; 2nd - CY10-12; 3rd - CY13-15. Most Recent - CY15)
4.
Percentage of women with live term singleton births who gained adequate/excessive/ inadequate weight according to the National Academy of Sciences-Institute of Medicine (IOM) 2009 Recommended Total Weight Gain Ranges during Pregnancy.[2] (Time Periods: 1st - CY13 2nd - CY14; 3rd - CY15. Most Recent - CY15)
2.
Percentage of women having live births who smoked during pregnancy. [1] (Time Periods: 1st - CY13; 2nd - CY14; 3rd - CY15. Most Recent - CY15)
3.
71.18 68.54 70.42 -1.07 557 791 70.42
32.43 26.49 29.28 -9.70 200 683 29.28
Time Period
16.47 13.46 15.93 -3.27 126 791 15.93
73.44 73.66 77.52 5.56 324 416 77.88
A. Adequate Weight Gain
53.09 55.48 53.73 1.21 367 683 53.73B. Excessive Weight Gain
13.57 17.75 16.84 24.04 115 683 16.84C. Inadequate Weight Gain
Percentage of infants enrolled in WIC who breastfed at 6 weeks postpartum. (Time Periods: 1st - FY15; 2nd - N/A; 3rd - N/A. Most Recent - FY15) [4]
5.25.45 113 444 25.45
Percentage of Medicaid enrolled pregnant women who deliver who receive a postpartum home visit.[3] (Time Periods: 1st - CY10-12; 2nd - N/A; 3rd - CY13-15. Most Recent - CY15)
6.
5.05 -100.00 442
62.89
28.75
48.42
19.51
9.35
73.19
25.14
12.21
[2] Recommended total prenatal weight gain range by prepregnancy weight category is 28-40 lbs. for underweight women (BMI<18.5); 25-35 lbs. for normal weight women (BMI 18.5 to 24.9); 15-25 lbs. for overweight women (BMI 25 to 29.9); and 11-20 lbs. for obese women (BMI>=30).
[4] Due to Crossroads implementation, data are only available for this time period. This page will be updated to include FY16 data when it becomes available. Also, data for counties composing districts are not available.
[1] With the implementation of the 2003 revised US Standard Certificate of Live Birth in NC in August 2010, data on prenatal care initiation and tobacco use prior to 2011 are not comparable.
Data sources for these objectives are as follows: 1, 2, & 3 NC Birth Certificates; 4 NC Automated WIC System matched with Medicaid Processed Claims Report; 5 NC Automated WIC System; and 6 Medicaid Processed Claims Report.
0.90 0.28 0.15 -83.82 1 683 0.15D. Unknown Weight Gain 3.32
[3] These data exclude women enrolled in Medicaid only for emergency delivery. 2014 Medicaid match includes data from both legacy WIC and Crossroads WIC System. Effective 2015 Prenatal Medicaid match included only Crossroads WIC data.

Macon County
SFY2017-2018 MATERNAL HEALTH AGREEMENT ADDENDA DATAProcess Outcome Objectives
NC Percent or Rate
Process Outcome Objectives1st
Percentage of women having live births who had adequate prenatal care as defined by Kessner Index. [1] (Time Periods: 1st - CY13; 2nd - CY14; 3rd - CY15. Most Recent - CY15)
1.
2nd 3rd
% Change from 1st period to
3rd period
Most Recent Data
Num DenPercent or Rate
Percentage of Medicaid enrolled pregnant women who deliver who receive prenatal WIC Program services.[3] (Time Periods: 1st - CY07-09; 2nd - CY10-12; 3rd - CY13-15. Most Recent - CY15)
4.
Percentage of women with live term singleton births who gained adequate/excessive/ inadequate weight according to the National Academy of Sciences-Institute of Medicine (IOM) 2009 Recommended Total Weight Gain Ranges during Pregnancy.[2] (Time Periods: 1st - CY13 2nd - CY14; 3rd - CY15. Most Recent - CY15)
2.
Percentage of women having live births who smoked during pregnancy. [1] (Time Periods: 1st - CY13; 2nd - CY14; 3rd - CY15. Most Recent - CY15)
3.
71.98 78.14 71.23 -1.03 260 365 71.23
28.76 30.34 26.47 -7.97 81 306 26.47
Time Period
20.06 21.56 18.63 -7.12 68 365 18.63
61.94 68.25 79.85 28.91 180 227 79.30
A. Adequate Weight Gain
45.82 47.59 47.06 2.71 144 306 47.06B. Excessive Weight Gain
23.41 21.03 24.51 4.69 75 306 24.51C. Inadequate Weight Gain
Percentage of infants enrolled in WIC who breastfed at 6 weeks postpartum. (Time Periods: 1st - FY15; 2nd - N/A; 3rd - N/A. Most Recent - FY15) [4]
5.17.07 42 246 17.07
Percentage of Medicaid enrolled pregnant women who deliver who receive a postpartum home visit.[3] (Time Periods: 1st - CY10-12; 2nd - N/A; 3rd - CY13-15. Most Recent - CY15)
6.
1.23 -100.00 269
62.89
28.75
48.42
19.51
9.35
73.19
25.14
12.21
[2] Recommended total prenatal weight gain range by prepregnancy weight category is 28-40 lbs. for underweight women (BMI<18.5); 25-35 lbs. for normal weight women (BMI 18.5 to 24.9); 15-25 lbs. for overweight women (BMI 25 to 29.9); and 11-20 lbs. for obese women (BMI>=30).
[4] Due to Crossroads implementation, data are only available for this time period. This page will be updated to include FY16 data when it becomes available. Also, data for counties composing districts are not available.
[1] With the implementation of the 2003 revised US Standard Certificate of Live Birth in NC in August 2010, data on prenatal care initiation and tobacco use prior to 2011 are not comparable.
Data sources for these objectives are as follows: 1, 2, & 3 NC Birth Certificates; 4 NC Automated WIC System matched with Medicaid Processed Claims Report; 5 NC Automated WIC System; and 6 Medicaid Processed Claims Report.
2.01 1.03 1.96 -2.29 6 306 1.96D. Unknown Weight Gain 3.32
[3] These data exclude women enrolled in Medicaid only for emergency delivery. 2014 Medicaid match includes data from both legacy WIC and Crossroads WIC System. Effective 2015 Prenatal Medicaid match included only Crossroads WIC data.

Madison County
SFY2017-2018 MATERNAL HEALTH AGREEMENT ADDENDA DATAProcess Outcome Objectives
NC Percent or Rate
Process Outcome Objectives1st
Percentage of women having live births who had adequate prenatal care as defined by Kessner Index. [1] (Time Periods: 1st - CY13; 2nd - CY14; 3rd - CY15. Most Recent - CY15)
1.
2nd 3rd
% Change from 1st period to
3rd period
Most Recent Data
Num DenPercent or Rate
Percentage of Medicaid enrolled pregnant women who deliver who receive prenatal WIC Program services.[3] (Time Periods: 1st - CY07-09; 2nd - CY10-12; 3rd - CY13-15. Most Recent - CY15)
4.
Percentage of women with live term singleton births who gained adequate/excessive/ inadequate weight according to the National Academy of Sciences-Institute of Medicine (IOM) 2009 Recommended Total Weight Gain Ranges during Pregnancy.[2] (Time Periods: 1st - CY13 2nd - CY14; 3rd - CY15. Most Recent - CY15)
2.
Percentage of women having live births who smoked during pregnancy. [1] (Time Periods: 1st - CY13; 2nd - CY14; 3rd - CY15. Most Recent - CY15)
3.
80.21 86.73 85.90 7.09 201 234 85.90
24.71 27.49 25.13 1.70 50 199 25.13
Time Period
8.02 9.18 11.97 49.17 28 234 11.97
70.09 71.35 77.40 10.42 125 156 80.13
A. Adequate Weight Gain
43.53 40.35 40.70 -6.49 81 199 40.70B. Excessive Weight Gain
24.12 24.56 20.60 -14.57 41 199 20.60C. Inadequate Weight Gain
Percentage of infants enrolled in WIC who breastfed at 6 weeks postpartum. (Time Periods: 1st - FY15; 2nd - N/A; 3rd - N/A. Most Recent - FY15) [4]
5.34.21 52 152 34.21
Percentage of Medicaid enrolled pregnant women who deliver who receive a postpartum home visit.[3] (Time Periods: 1st - CY10-12; 2nd - N/A; 3rd - CY13-15. Most Recent - CY15)
6.
21.95 4.35 -80.19 1 150 0.67
62.89
28.75
48.42
19.51
9.35
73.19
25.14
12.21
[2] Recommended total prenatal weight gain range by prepregnancy weight category is 28-40 lbs. for underweight women (BMI<18.5); 25-35 lbs. for normal weight women (BMI 18.5 to 24.9); 15-25 lbs. for overweight women (BMI 25 to 29.9); and 11-20 lbs. for obese women (BMI>=30).
[4] Due to Crossroads implementation, data are only available for this time period. This page will be updated to include FY16 data when it becomes available. Also, data for counties composing districts are not available.
[1] With the implementation of the 2003 revised US Standard Certificate of Live Birth in NC in August 2010, data on prenatal care initiation and tobacco use prior to 2011 are not comparable.
Data sources for these objectives are as follows: 1, 2, & 3 NC Birth Certificates; 4 NC Automated WIC System matched with Medicaid Processed Claims Report; 5 NC Automated WIC System; and 6 Medicaid Processed Claims Report.
7.65 7.60 13.57 77.43 27 199 13.57D. Unknown Weight Gain 3.32
[3] These data exclude women enrolled in Medicaid only for emergency delivery. 2014 Medicaid match includes data from both legacy WIC and Crossroads WIC System. Effective 2015 Prenatal Medicaid match included only Crossroads WIC data.

Martin-Tyrrell-Washington District
SFY2017-2018 MATERNAL HEALTH AGREEMENT ADDENDA DATAProcess Outcome Objectives
NC Percent or Rate
Process Outcome Objectives1st
Percentage of women having live births who had adequate prenatal care as defined by Kessner Index. [1] (Time Periods: 1st - CY13; 2nd - CY14; 3rd - CY15. Most Recent - CY15)
1.
2nd 3rd
% Change from 1st period to
3rd period
Most Recent Data
Num DenPercent or Rate
Percentage of Medicaid enrolled pregnant women who deliver who receive prenatal WIC Program services.[3] (Time Periods: 1st - CY07-09; 2nd - CY10-12; 3rd - CY13-15. Most Recent - CY15)
4.
Percentage of women with live term singleton births who gained adequate/excessive/ inadequate weight according to the National Academy of Sciences-Institute of Medicine (IOM) 2009 Recommended Total Weight Gain Ranges during Pregnancy.[2] (Time Periods: 1st - CY13 2nd - CY14; 3rd - CY15. Most Recent - CY15)
2.
Percentage of women having live births who smoked during pregnancy. [1] (Time Periods: 1st - CY13; 2nd - CY14; 3rd - CY15. Most Recent - CY15)
3.
68.12 67.10 70.75 3.87 300 424 70.75
28.74 22.22 26.32 -8.43 95 361 26.32
Time Period
16.51 15.68 15.57 -5.74 66 424 15.57
86.56 83.24 84.56 -2.30 263 306 85.95
A. Adequate Weight Gain
50.44 54.05 47.92 -4.99 173 361 47.92B. Excessive Weight Gain
19.65 23.42 25.76 31.12 93 361 25.76C. Inadequate Weight Gain
Percentage of infants enrolled in WIC who breastfed at 6 weeks postpartum. (Time Periods: 1st - FY15; 2nd - N/A; 3rd - N/A. Most Recent - FY15) [4]
5.15.08 46 305 15.08
Percentage of Medicaid enrolled pregnant women who deliver who receive a postpartum home visit.[3] (Time Periods: 1st - CY10-12; 2nd - N/A; 3rd - CY13-15. Most Recent - CY15)
6.
7.29 7.40 1.47 21 344 6.10
62.89
28.75
48.42
19.51
9.35
73.19
25.14
12.21
[2] Recommended total prenatal weight gain range by prepregnancy weight category is 28-40 lbs. for underweight women (BMI<18.5); 25-35 lbs. for normal weight women (BMI 18.5 to 24.9); 15-25 lbs. for overweight women (BMI 25 to 29.9); and 11-20 lbs. for obese women (BMI>=30).
[4] Due to Crossroads implementation, data are only available for this time period. This page will be updated to include FY16 data when it becomes available. Also, data for counties composing districts are not available.
[1] With the implementation of the 2003 revised US Standard Certificate of Live Birth in NC in August 2010, data on prenatal care initiation and tobacco use prior to 2011 are not comparable.
Data sources for these objectives are as follows: 1, 2, & 3 NC Birth Certificates; 4 NC Automated WIC System matched with Medicaid Processed Claims Report; 5 NC Automated WIC System; and 6 Medicaid Processed Claims Report.
1.17 0.30 0.00 -100.00 0 361 0.00D. Unknown Weight Gain 3.32
[3] These data exclude women enrolled in Medicaid only for emergency delivery. 2014 Medicaid match includes data from both legacy WIC and Crossroads WIC System. Effective 2015 Prenatal Medicaid match included only Crossroads WIC data.

Martin
SFY2017-2018 MATERNAL HEALTH AGREEMENT ADDENDA DATAProcess Outcome Objectives for Counties Composing Districts
NC Percent or Rate
Process Outcome Objectives1st
Percentage of women having live births who had adequate prenatal care as defined by Kessner Index. [1] (Time Periods: 1st - CY13; 2nd - CY14; 3rd - CY15. Most Recent - CY15)
1.
2nd 3rd
% Change from 1st period to
3rd period
Most Recent Data
Num DenPercent or Rate
Percentage of Medicaid enrolled pregnant women who deliver who receive prenatal WIC Program services.[3] (Time Periods: 1st - CY07-09; 2nd - CY10-12; 3rd - CY13-15. Most Recent - CY15)
4.
Percentage of women with live term singleton births who gained adequate/excessive/ inadequate weight according to the National Academy of Sciences-Institute of Medicine (IOM) 2009 Recommended Total Weight Gain Ranges during Pregnancy.[2] (Time Periods: 1st - CY13 2nd - CY14; 3rd - CY15. Most Recent - CY15)
2.
Percentage of women having live births who smoked during pregnancy. [1] (Time Periods: 1st - CY13; 2nd - CY14; 3rd - CY15. Most Recent - CY15)
3.
73.09 69.83 74.44 1.84 198 266 74.44
25.65 20.71 26.43 3.03 60 227 26.43
Time Period
16.87 18.53 15.79 -6.39 42 266 15.79
84.02 82.83 83.40 -0.74 156 185 84.32
A. Adequate Weight Gain
52.88 53.54 50.66 -4.20 115 227 50.66B. Excessive Weight Gain
21.47 25.25 22.91 6.72 52 227 22.91C. Inadequate Weight Gain
Percentage of infants enrolled in WIC who breastfed at 6 weeks postpartum. (Time Periods: 1st - FY15; 2nd - N/A; 3rd - N/A. Most Recent - FY15) [4]
5.
Percentage of Medicaid enrolled pregnant women who deliver who receive a postpartum home visit.[3] (Time Periods: 1st - CY10-12; 2nd - N/A; 3rd - CY13-15. Most Recent - CY15)
6.
196
62.89
28.75
48.42
19.51
9.35
73.19
25.14
12.21
[2] Recommended total prenatal weight gain range by prepregnancy weight category is 28-40 lbs. for underweight women (BMI<18.5); 25-35 lbs. for normal weight women (BMI 18.5 to 24.9); 15-25 lbs. for overweight women (BMI 25 to 29.9); and 11-20 lbs. for obese women (BMI>=30).
[4] Due to Crossroads implementation, data are only available for this time period. This page will be updated to include FY16 data when it becomes available. Also, data for counties composing districts are not available.
[1] With the implementation of the 2003 revised US Standard Certificate of Live Birth in NC in August 2010, data on prenatal care initiation and tobacco use prior to 2011 are not comparable.
Data sources for these objectives are as follows: 1, 2, & 3 NC Birth Certificates; 4 NC Automated WIC System matched with Medicaid Processed Claims Report; 5 NC Automated WIC System; and 6 Medicaid Processed Claims Report.
0.00 0.51 0.00 0 227 0.00D. Unknown Weight Gain 3.32
[3] These data exclude women enrolled in Medicaid only for emergency delivery. 2014 Medicaid match includes data from both legacy WIC and Crossroads WIC System. Effective 2015 Prenatal Medicaid match included only Crossroads WIC data.

Tyrrell
SFY2017-2018 MATERNAL HEALTH AGREEMENT ADDENDA DATAProcess Outcome Objectives for Counties Composing Districts
NC Percent or Rate
Process Outcome Objectives1st
Percentage of women having live births who had adequate prenatal care as defined by Kessner Index. [1] (Time Periods: 1st - CY13; 2nd - CY14; 3rd - CY15. Most Recent - CY15)
1.
2nd 3rd
% Change from 1st period to
3rd period
Most Recent Data
Num DenPercent or Rate
Percentage of Medicaid enrolled pregnant women who deliver who receive prenatal WIC Program services.[3] (Time Periods: 1st - CY07-09; 2nd - CY10-12; 3rd - CY13-15. Most Recent - CY15)
4.
Percentage of women with live term singleton births who gained adequate/excessive/ inadequate weight according to the National Academy of Sciences-Institute of Medicine (IOM) 2009 Recommended Total Weight Gain Ranges during Pregnancy.[2] (Time Periods: 1st - CY13 2nd - CY14; 3rd - CY15. Most Recent - CY15)
2.
Percentage of women having live births who smoked during pregnancy. [1] (Time Periods: 1st - CY13; 2nd - CY14; 3rd - CY15. Most Recent - CY15)
3.
75.56 65.85 74.36 -1.58 29 39 74.36
41.46 18.18 20.00 -51.76 7 35 20.00
Time Period
22.22 9.76 17.95 -19.23 7 39 17.95
90.91 81.94 85.51 -5.94 19 21 90.48
A. Adequate Weight Gain
41.46 66.67 51.43 24.03 18 35 51.43B. Excessive Weight Gain
14.63 15.15 28.57 95.24 10 35 28.57C. Inadequate Weight Gain
Percentage of infants enrolled in WIC who breastfed at 6 weeks postpartum. (Time Periods: 1st - FY15; 2nd - N/A; 3rd - N/A. Most Recent - FY15) [4]
5.
Percentage of Medicaid enrolled pregnant women who deliver who receive a postpartum home visit.[3] (Time Periods: 1st - CY10-12; 2nd - N/A; 3rd - CY13-15. Most Recent - CY15)
6.
29
62.89
28.75
48.42
19.51
9.35
73.19
25.14
12.21
[2] Recommended total prenatal weight gain range by prepregnancy weight category is 28-40 lbs. for underweight women (BMI<18.5); 25-35 lbs. for normal weight women (BMI 18.5 to 24.9); 15-25 lbs. for overweight women (BMI 25 to 29.9); and 11-20 lbs. for obese women (BMI>=30).
[4] Due to Crossroads implementation, data are only available for this time period. This page will be updated to include FY16 data when it becomes available. Also, data for counties composing districts are not available.
[1] With the implementation of the 2003 revised US Standard Certificate of Live Birth in NC in August 2010, data on prenatal care initiation and tobacco use prior to 2011 are not comparable.
Data sources for these objectives are as follows: 1, 2, & 3 NC Birth Certificates; 4 NC Automated WIC System matched with Medicaid Processed Claims Report; 5 NC Automated WIC System; and 6 Medicaid Processed Claims Report.
2.44 0.00 0.00 -100.00 0 35 0.00D. Unknown Weight Gain 3.32
[3] These data exclude women enrolled in Medicaid only for emergency delivery. 2014 Medicaid match includes data from both legacy WIC and Crossroads WIC System. Effective 2015 Prenatal Medicaid match included only Crossroads WIC data.

Washington
SFY2017-2018 MATERNAL HEALTH AGREEMENT ADDENDA DATAProcess Outcome Objectives for Counties Composing Districts
NC Percent or Rate
Process Outcome Objectives1st
Percentage of women having live births who had adequate prenatal care as defined by Kessner Index. [1] (Time Periods: 1st - CY13; 2nd - CY14; 3rd - CY15. Most Recent - CY15)
1.
2nd 3rd
% Change from 1st period to
3rd period
Most Recent Data
Num DenPercent or Rate
Percentage of Medicaid enrolled pregnant women who deliver who receive prenatal WIC Program services.[3] (Time Periods: 1st - CY07-09; 2nd - CY10-12; 3rd - CY13-15. Most Recent - CY15)
4.
Percentage of women with live term singleton births who gained adequate/excessive/ inadequate weight according to the National Academy of Sciences-Institute of Medicine (IOM) 2009 Recommended Total Weight Gain Ranges during Pregnancy.[2] (Time Periods: 1st - CY13 2nd - CY14; 3rd - CY15. Most Recent - CY15)
2.
Percentage of women having live births who smoked during pregnancy. [1] (Time Periods: 1st - CY13; 2nd - CY14; 3rd - CY15. Most Recent - CY15)
3.
57.04 62.07 61.34 7.54 73 119 61.34
29.36 26.47 28.28 -3.66 28 99 28.28
Time Period
14.08 12.07 14.29 1.43 17 119 14.29
89.60 84.18 86.42 -3.54 88 100 88.00
A. Adequate Weight Gain
49.54 50.98 40.40 -18.44 40 99 40.40B. Excessive Weight Gain
18.35 22.55 31.31 70.66 31 99 31.31C. Inadequate Weight Gain
Percentage of infants enrolled in WIC who breastfed at 6 weeks postpartum. (Time Periods: 1st - FY15; 2nd - N/A; 3rd - N/A. Most Recent - FY15) [4]
5.
Percentage of Medicaid enrolled pregnant women who deliver who receive a postpartum home visit.[3] (Time Periods: 1st - CY10-12; 2nd - N/A; 3rd - CY13-15. Most Recent - CY15)
6.
20.82 22.38 7.50 21 119 17.65
62.89
28.75
48.42
19.51
9.35
73.19
25.14
12.21
[2] Recommended total prenatal weight gain range by prepregnancy weight category is 28-40 lbs. for underweight women (BMI<18.5); 25-35 lbs. for normal weight women (BMI 18.5 to 24.9); 15-25 lbs. for overweight women (BMI 25 to 29.9); and 11-20 lbs. for obese women (BMI>=30).
[4] Due to Crossroads implementation, data are only available for this time period. This page will be updated to include FY16 data when it becomes available. Also, data for counties composing districts are not available.
[1] With the implementation of the 2003 revised US Standard Certificate of Live Birth in NC in August 2010, data on prenatal care initiation and tobacco use prior to 2011 are not comparable.
Data sources for these objectives are as follows: 1, 2, & 3 NC Birth Certificates; 4 NC Automated WIC System matched with Medicaid Processed Claims Report; 5 NC Automated WIC System; and 6 Medicaid Processed Claims Report.
2.75 0.00 0.00 -100.00 0 99 0.00D. Unknown Weight Gain 3.32
[3] These data exclude women enrolled in Medicaid only for emergency delivery. 2014 Medicaid match includes data from both legacy WIC and Crossroads WIC System. Effective 2015 Prenatal Medicaid match included only Crossroads WIC data.

Mecklenburg County
SFY2017-2018 MATERNAL HEALTH AGREEMENT ADDENDA DATAProcess Outcome Objectives
NC Percent or Rate
Process Outcome Objectives1st
Percentage of women having live births who had adequate prenatal care as defined by Kessner Index. [1] (Time Periods: 1st - CY13; 2nd - CY14; 3rd - CY15. Most Recent - CY15)
1.
2nd 3rd
% Change from 1st period to
3rd period
Most Recent Data
Num DenPercent or Rate
Percentage of Medicaid enrolled pregnant women who deliver who receive prenatal WIC Program services.[3] (Time Periods: 1st - CY07-09; 2nd - CY10-12; 3rd - CY13-15. Most Recent - CY15)
4.
Percentage of women with live term singleton births who gained adequate/excessive/ inadequate weight according to the National Academy of Sciences-Institute of Medicine (IOM) 2009 Recommended Total Weight Gain Ranges during Pregnancy.[2] (Time Periods: 1st - CY13 2nd - CY14; 3rd - CY15. Most Recent - CY15)
2.
Percentage of women having live births who smoked during pregnancy. [1] (Time Periods: 1st - CY13; 2nd - CY14; 3rd - CY15. Most Recent - CY15)
3.
67.27 62.08 61.73 -8.23 9,168 14,851 61.73
30.30 31.72 31.77 4.85 4,091 12,876 31.77
Time Period
3.81 3.55 3.34 -12.25 496 14,851 3.34
63.95 64.72 59.88 -6.36 3,577 5,621 63.64
A. Adequate Weight Gain
45.62 46.29 46.99 3.00 6,050 12,876 46.99B. Excessive Weight Gain
19.25 19.13 18.70 -2.82 2,408 12,876 18.70C. Inadequate Weight Gain
Percentage of infants enrolled in WIC who breastfed at 6 weeks postpartum. (Time Periods: 1st - FY15; 2nd - N/A; 3rd - N/A. Most Recent - FY15) [4]
5.22.27 1,374 6,171 22.27
Percentage of Medicaid enrolled pregnant women who deliver who receive a postpartum home visit.[3] (Time Periods: 1st - CY10-12; 2nd - N/A; 3rd - CY13-15. Most Recent - CY15)
6.
6.80 9.58 40.92 780 7,280 10.71
62.89
28.75
48.42
19.51
9.35
73.19
25.14
12.21
[2] Recommended total prenatal weight gain range by prepregnancy weight category is 28-40 lbs. for underweight women (BMI<18.5); 25-35 lbs. for normal weight women (BMI 18.5 to 24.9); 15-25 lbs. for overweight women (BMI 25 to 29.9); and 11-20 lbs. for obese women (BMI>=30).
[4] Due to Crossroads implementation, data are only available for this time period. This page will be updated to include FY16 data when it becomes available. Also, data for counties composing districts are not available.
[1] With the implementation of the 2003 revised US Standard Certificate of Live Birth in NC in August 2010, data on prenatal care initiation and tobacco use prior to 2011 are not comparable.
Data sources for these objectives are as follows: 1, 2, & 3 NC Birth Certificates; 4 NC Automated WIC System matched with Medicaid Processed Claims Report; 5 NC Automated WIC System; and 6 Medicaid Processed Claims Report.
4.84 2.86 2.54 -47.49 327 12,876 2.54D. Unknown Weight Gain 3.32
[3] These data exclude women enrolled in Medicaid only for emergency delivery. 2014 Medicaid match includes data from both legacy WIC and Crossroads WIC System. Effective 2015 Prenatal Medicaid match included only Crossroads WIC data.

Montgomery County
SFY2017-2018 MATERNAL HEALTH AGREEMENT ADDENDA DATAProcess Outcome Objectives
NC Percent or Rate
Process Outcome Objectives1st
Percentage of women having live births who had adequate prenatal care as defined by Kessner Index. [1] (Time Periods: 1st - CY13; 2nd - CY14; 3rd - CY15. Most Recent - CY15)
1.
2nd 3rd
% Change from 1st period to
3rd period
Most Recent Data
Num DenPercent or Rate
Percentage of Medicaid enrolled pregnant women who deliver who receive prenatal WIC Program services.[3] (Time Periods: 1st - CY07-09; 2nd - CY10-12; 3rd - CY13-15. Most Recent - CY15)
4.
Percentage of women with live term singleton births who gained adequate/excessive/ inadequate weight according to the National Academy of Sciences-Institute of Medicine (IOM) 2009 Recommended Total Weight Gain Ranges during Pregnancy.[2] (Time Periods: 1st - CY13 2nd - CY14; 3rd - CY15. Most Recent - CY15)
2.
Percentage of women having live births who smoked during pregnancy. [1] (Time Periods: 1st - CY13; 2nd - CY14; 3rd - CY15. Most Recent - CY15)
3.
58.19 53.77 55.06 -5.38 174 316 55.06
30.97 28.36 26.52 -14.36 74 279 26.52
Time Period
14.38 16.35 16.46 14.42 52 316 16.46
73.67 77.08 83.66 13.57 174 210 82.86
A. Adequate Weight Gain
41.04 42.91 44.09 7.41 123 279 44.09B. Excessive Weight Gain
27.61 27.99 28.67 3.85 80 279 28.67C. Inadequate Weight Gain
Percentage of infants enrolled in WIC who breastfed at 6 weeks postpartum. (Time Periods: 1st - FY15; 2nd - N/A; 3rd - N/A. Most Recent - FY15) [4]
5.28.16 78 277 28.16
Percentage of Medicaid enrolled pregnant women who deliver who receive a postpartum home visit.[3] (Time Periods: 1st - CY10-12; 2nd - N/A; 3rd - CY13-15. Most Recent - CY15)
6.
266
62.89
28.75
48.42
19.51
9.35
73.19
25.14
12.21
[2] Recommended total prenatal weight gain range by prepregnancy weight category is 28-40 lbs. for underweight women (BMI<18.5); 25-35 lbs. for normal weight women (BMI 18.5 to 24.9); 15-25 lbs. for overweight women (BMI 25 to 29.9); and 11-20 lbs. for obese women (BMI>=30).
[4] Due to Crossroads implementation, data are only available for this time period. This page will be updated to include FY16 data when it becomes available. Also, data for counties composing districts are not available.
[1] With the implementation of the 2003 revised US Standard Certificate of Live Birth in NC in August 2010, data on prenatal care initiation and tobacco use prior to 2011 are not comparable.
Data sources for these objectives are as follows: 1, 2, & 3 NC Birth Certificates; 4 NC Automated WIC System matched with Medicaid Processed Claims Report; 5 NC Automated WIC System; and 6 Medicaid Processed Claims Report.
0.37 0.75 0.72 92.11 2 279 0.72D. Unknown Weight Gain 3.32
[3] These data exclude women enrolled in Medicaid only for emergency delivery. 2014 Medicaid match includes data from both legacy WIC and Crossroads WIC System. Effective 2015 Prenatal Medicaid match included only Crossroads WIC data.

Moore County
SFY2017-2018 MATERNAL HEALTH AGREEMENT ADDENDA DATAProcess Outcome Objectives
NC Percent or Rate
Process Outcome Objectives1st
Percentage of women having live births who had adequate prenatal care as defined by Kessner Index. [1] (Time Periods: 1st - CY13; 2nd - CY14; 3rd - CY15. Most Recent - CY15)
1.
2nd 3rd
% Change from 1st period to
3rd period
Most Recent Data
Num DenPercent or Rate
Percentage of Medicaid enrolled pregnant women who deliver who receive prenatal WIC Program services.[3] (Time Periods: 1st - CY07-09; 2nd - CY10-12; 3rd - CY13-15. Most Recent - CY15)
4.
Percentage of women with live term singleton births who gained adequate/excessive/ inadequate weight according to the National Academy of Sciences-Institute of Medicine (IOM) 2009 Recommended Total Weight Gain Ranges during Pregnancy.[2] (Time Periods: 1st - CY13 2nd - CY14; 3rd - CY15. Most Recent - CY15)
2.
Percentage of women having live births who smoked during pregnancy. [1] (Time Periods: 1st - CY13; 2nd - CY14; 3rd - CY15. Most Recent - CY15)
3.
60.90 60.22 64.08 5.23 678 1,058 64.08
29.13 31.65 30.89 6.02 282 913 30.89
Time Period
12.32 10.85 11.15 -9.48 118 1,058 11.15
50.12 66.80 75.55 50.74 328 442 74.21
A. Adequate Weight Gain
47.98 44.67 51.92 8.21 474 913 51.92B. Excessive Weight Gain
22.43 23.34 16.10 -28.21 147 913 16.10C. Inadequate Weight Gain
Percentage of infants enrolled in WIC who breastfed at 6 weeks postpartum. (Time Periods: 1st - FY15; 2nd - N/A; 3rd - N/A. Most Recent - FY15) [4]
5.25.00 124 496 25.00
Percentage of Medicaid enrolled pregnant women who deliver who receive a postpartum home visit.[3] (Time Periods: 1st - CY10-12; 2nd - N/A; 3rd - CY13-15. Most Recent - CY15)
6.
2.11 -100.00 493
62.89
28.75
48.42
19.51
9.35
73.19
25.14
12.21
[2] Recommended total prenatal weight gain range by prepregnancy weight category is 28-40 lbs. for underweight women (BMI<18.5); 25-35 lbs. for normal weight women (BMI 18.5 to 24.9); 15-25 lbs. for overweight women (BMI 25 to 29.9); and 11-20 lbs. for obese women (BMI>=30).
[4] Due to Crossroads implementation, data are only available for this time period. This page will be updated to include FY16 data when it becomes available. Also, data for counties composing districts are not available.
[1] With the implementation of the 2003 revised US Standard Certificate of Live Birth in NC in August 2010, data on prenatal care initiation and tobacco use prior to 2011 are not comparable.
Data sources for these objectives are as follows: 1, 2, & 3 NC Birth Certificates; 4 NC Automated WIC System matched with Medicaid Processed Claims Report; 5 NC Automated WIC System; and 6 Medicaid Processed Claims Report.
0.46 0.34 1.10 136.86 10 913 1.10D. Unknown Weight Gain 3.32
[3] These data exclude women enrolled in Medicaid only for emergency delivery. 2014 Medicaid match includes data from both legacy WIC and Crossroads WIC System. Effective 2015 Prenatal Medicaid match included only Crossroads WIC data.

Nash County
SFY2017-2018 MATERNAL HEALTH AGREEMENT ADDENDA DATAProcess Outcome Objectives
NC Percent or Rate
Process Outcome Objectives1st
Percentage of women having live births who had adequate prenatal care as defined by Kessner Index. [1] (Time Periods: 1st - CY13; 2nd - CY14; 3rd - CY15. Most Recent - CY15)
1.
2nd 3rd
% Change from 1st period to
3rd period
Most Recent Data
Num DenPercent or Rate
Percentage of Medicaid enrolled pregnant women who deliver who receive prenatal WIC Program services.[3] (Time Periods: 1st - CY07-09; 2nd - CY10-12; 3rd - CY13-15. Most Recent - CY15)
4.
Percentage of women with live term singleton births who gained adequate/excessive/ inadequate weight according to the National Academy of Sciences-Institute of Medicine (IOM) 2009 Recommended Total Weight Gain Ranges during Pregnancy.[2] (Time Periods: 1st - CY13 2nd - CY14; 3rd - CY15. Most Recent - CY15)
2.
Percentage of women having live births who smoked during pregnancy. [1] (Time Periods: 1st - CY13; 2nd - CY14; 3rd - CY15. Most Recent - CY15)
3.
55.53 50.87 51.47 -7.30 541 1,051 51.47
26.27 25.73 25.58 -2.61 231 903 25.58
Time Period
12.76 11.29 12.65 -0.81 133 1,051 12.65
78.07 78.54 83.56 7.02 569 676 84.17
A. Adequate Weight Gain
49.12 50.56 51.27 4.38 463 903 51.27B. Excessive Weight Gain
20.89 20.99 22.26 6.56 201 903 22.26C. Inadequate Weight Gain
Percentage of infants enrolled in WIC who breastfed at 6 weeks postpartum. (Time Periods: 1st - FY15; 2nd - N/A; 3rd - N/A. Most Recent - FY15) [4]
5.23.66 186 786 23.66
Percentage of Medicaid enrolled pregnant women who deliver who receive a postpartum home visit.[3] (Time Periods: 1st - CY10-12; 2nd - N/A; 3rd - CY13-15. Most Recent - CY15)
6.
7.01 1.76 -74.98 768
62.89
28.75
48.42
19.51
9.35
73.19
25.14
12.21
[2] Recommended total prenatal weight gain range by prepregnancy weight category is 28-40 lbs. for underweight women (BMI<18.5); 25-35 lbs. for normal weight women (BMI 18.5 to 24.9); 15-25 lbs. for overweight women (BMI 25 to 29.9); and 11-20 lbs. for obese women (BMI>=30).
[4] Due to Crossroads implementation, data are only available for this time period. This page will be updated to include FY16 data when it becomes available. Also, data for counties composing districts are not available.
[1] With the implementation of the 2003 revised US Standard Certificate of Live Birth in NC in August 2010, data on prenatal care initiation and tobacco use prior to 2011 are not comparable.
Data sources for these objectives are as follows: 1, 2, & 3 NC Birth Certificates; 4 NC Automated WIC System matched with Medicaid Processed Claims Report; 5 NC Automated WIC System; and 6 Medicaid Processed Claims Report.
3.72 2.71 0.89 -76.20 8 903 0.89D. Unknown Weight Gain 3.32
[3] These data exclude women enrolled in Medicaid only for emergency delivery. 2014 Medicaid match includes data from both legacy WIC and Crossroads WIC System. Effective 2015 Prenatal Medicaid match included only Crossroads WIC data.

New Hanover County
SFY2017-2018 MATERNAL HEALTH AGREEMENT ADDENDA DATAProcess Outcome Objectives
NC Percent or Rate
Process Outcome Objectives1st
Percentage of women having live births who had adequate prenatal care as defined by Kessner Index. [1] (Time Periods: 1st - CY13; 2nd - CY14; 3rd - CY15. Most Recent - CY15)
1.
2nd 3rd
% Change from 1st period to
3rd period
Most Recent Data
Num DenPercent or Rate
Percentage of Medicaid enrolled pregnant women who deliver who receive prenatal WIC Program services.[3] (Time Periods: 1st - CY07-09; 2nd - CY10-12; 3rd - CY13-15. Most Recent - CY15)
4.
Percentage of women with live term singleton births who gained adequate/excessive/ inadequate weight according to the National Academy of Sciences-Institute of Medicine (IOM) 2009 Recommended Total Weight Gain Ranges during Pregnancy.[2] (Time Periods: 1st - CY13 2nd - CY14; 3rd - CY15. Most Recent - CY15)
2.
Percentage of women having live births who smoked during pregnancy. [1] (Time Periods: 1st - CY13; 2nd - CY14; 3rd - CY15. Most Recent - CY15)
3.
67.38 62.64 57.77 -14.27 1,335 2,311 57.77
30.01 28.59 28.08 -6.43 568 2,023 28.08
Time Period
8.21 8.85 8.61 4.88 199 2,311 8.61
73.41 72.77 72.62 -1.07 726 1,005 72.24
A. Adequate Weight Gain
50.49 54.54 52.55 4.07 1,063 2,023 52.55B. Excessive Weight Gain
18.17 16.27 18.54 2.03 375 2,023 18.54C. Inadequate Weight Gain
Percentage of infants enrolled in WIC who breastfed at 6 weeks postpartum. (Time Periods: 1st - FY15; 2nd - N/A; 3rd - N/A. Most Recent - FY15) [4]
5.23.31 241 1,034 23.31
Percentage of Medicaid enrolled pregnant women who deliver who receive a postpartum home visit.[3] (Time Periods: 1st - CY10-12; 2nd - N/A; 3rd - CY13-15. Most Recent - CY15)
6.
13.89 9.46 -31.90 95 1,179 8.06
62.89
28.75
48.42
19.51
9.35
73.19
25.14
12.21
[2] Recommended total prenatal weight gain range by prepregnancy weight category is 28-40 lbs. for underweight women (BMI<18.5); 25-35 lbs. for normal weight women (BMI 18.5 to 24.9); 15-25 lbs. for overweight women (BMI 25 to 29.9); and 11-20 lbs. for obese women (BMI>=30).
[4] Due to Crossroads implementation, data are only available for this time period. This page will be updated to include FY16 data when it becomes available. Also, data for counties composing districts are not available.
[1] With the implementation of the 2003 revised US Standard Certificate of Live Birth in NC in August 2010, data on prenatal care initiation and tobacco use prior to 2011 are not comparable.
Data sources for these objectives are as follows: 1, 2, & 3 NC Birth Certificates; 4 NC Automated WIC System matched with Medicaid Processed Claims Report; 5 NC Automated WIC System; and 6 Medicaid Processed Claims Report.
1.34 0.60 0.84 -37.20 17 2,023 0.84D. Unknown Weight Gain 3.32
[3] These data exclude women enrolled in Medicaid only for emergency delivery. 2014 Medicaid match includes data from both legacy WIC and Crossroads WIC System. Effective 2015 Prenatal Medicaid match included only Crossroads WIC data.

Northampton County
SFY2017-2018 MATERNAL HEALTH AGREEMENT ADDENDA DATAProcess Outcome Objectives
NC Percent or Rate
Process Outcome Objectives1st
Percentage of women having live births who had adequate prenatal care as defined by Kessner Index. [1] (Time Periods: 1st - CY13; 2nd - CY14; 3rd - CY15. Most Recent - CY15)
1.
2nd 3rd
% Change from 1st period to
3rd period
Most Recent Data
Num DenPercent or Rate
Percentage of Medicaid enrolled pregnant women who deliver who receive prenatal WIC Program services.[3] (Time Periods: 1st - CY07-09; 2nd - CY10-12; 3rd - CY13-15. Most Recent - CY15)
4.
Percentage of women with live term singleton births who gained adequate/excessive/ inadequate weight according to the National Academy of Sciences-Institute of Medicine (IOM) 2009 Recommended Total Weight Gain Ranges during Pregnancy.[2] (Time Periods: 1st - CY13 2nd - CY14; 3rd - CY15. Most Recent - CY15)
2.
Percentage of women having live births who smoked during pregnancy. [1] (Time Periods: 1st - CY13; 2nd - CY14; 3rd - CY15. Most Recent - CY15)
3.
59.43 63.03 64.41 8.38 114 177 64.41
26.21 26.28 33.77 28.88 51 151 33.77
Time Period
9.14 15.76 15.82 73.02 28 177 15.82
77.07 83.01 86.57 12.33 122 141 86.52
A. Adequate Weight Gain
45.52 45.26 44.37 -2.52 67 151 44.37B. Excessive Weight Gain
24.83 25.55 21.19 -14.64 32 151 21.19C. Inadequate Weight Gain
Percentage of infants enrolled in WIC who breastfed at 6 weeks postpartum. (Time Periods: 1st - FY15; 2nd - N/A; 3rd - N/A. Most Recent - FY15) [4]
5.24.82 34 137 24.82
Percentage of Medicaid enrolled pregnant women who deliver who receive a postpartum home visit.[3] (Time Periods: 1st - CY10-12; 2nd - N/A; 3rd - CY13-15. Most Recent - CY15)
6.
9.75 4.73 -51.46 11 141 7.80
62.89
28.75
48.42
19.51
9.35
73.19
25.14
12.21
[2] Recommended total prenatal weight gain range by prepregnancy weight category is 28-40 lbs. for underweight women (BMI<18.5); 25-35 lbs. for normal weight women (BMI 18.5 to 24.9); 15-25 lbs. for overweight women (BMI 25 to 29.9); and 11-20 lbs. for obese women (BMI>=30).
[4] Due to Crossroads implementation, data are only available for this time period. This page will be updated to include FY16 data when it becomes available. Also, data for counties composing districts are not available.
[1] With the implementation of the 2003 revised US Standard Certificate of Live Birth in NC in August 2010, data on prenatal care initiation and tobacco use prior to 2011 are not comparable.
Data sources for these objectives are as follows: 1, 2, & 3 NC Birth Certificates; 4 NC Automated WIC System matched with Medicaid Processed Claims Report; 5 NC Automated WIC System; and 6 Medicaid Processed Claims Report.
3.45 2.92 0.66 -80.79 1 151 0.66D. Unknown Weight Gain 3.32
[3] These data exclude women enrolled in Medicaid only for emergency delivery. 2014 Medicaid match includes data from both legacy WIC and Crossroads WIC System. Effective 2015 Prenatal Medicaid match included only Crossroads WIC data.

Onslow County
SFY2017-2018 MATERNAL HEALTH AGREEMENT ADDENDA DATAProcess Outcome Objectives
NC Percent or Rate
Process Outcome Objectives1st
Percentage of women having live births who had adequate prenatal care as defined by Kessner Index. [1] (Time Periods: 1st - CY13; 2nd - CY14; 3rd - CY15. Most Recent - CY15)
1.
2nd 3rd
% Change from 1st period to
3rd period
Most Recent Data
Num DenPercent or Rate
Percentage of Medicaid enrolled pregnant women who deliver who receive prenatal WIC Program services.[3] (Time Periods: 1st - CY07-09; 2nd - CY10-12; 3rd - CY13-15. Most Recent - CY15)
4.
Percentage of women with live term singleton births who gained adequate/excessive/ inadequate weight according to the National Academy of Sciences-Institute of Medicine (IOM) 2009 Recommended Total Weight Gain Ranges during Pregnancy.[2] (Time Periods: 1st - CY13 2nd - CY14; 3rd - CY15. Most Recent - CY15)
2.
Percentage of women having live births who smoked during pregnancy. [1] (Time Periods: 1st - CY13; 2nd - CY14; 3rd - CY15. Most Recent - CY15)
3.
63.54 61.07 69.04 8.65 2,881 4,173 69.04
30.10 30.63 29.31 -2.63 1,095 3,736 29.31
Time Period
7.53 6.87 6.61 -12.19 276 4,173 6.61
74.84 76.17 77.28 3.26 832 1,092 76.19
A. Adequate Weight Gain
54.09 53.97 54.42 0.60 2,033 3,736 54.42B. Excessive Weight Gain
15.35 15.15 15.63 1.87 584 3,736 15.63C. Inadequate Weight Gain
Percentage of infants enrolled in WIC who breastfed at 6 weeks postpartum. (Time Periods: 1st - FY15; 2nd - N/A; 3rd - N/A. Most Recent - FY15) [4]
5.17.97 432 2,404 17.97
Percentage of Medicaid enrolled pregnant women who deliver who receive a postpartum home visit.[3] (Time Periods: 1st - CY10-12; 2nd - N/A; 3rd - CY13-15. Most Recent - CY15)
6.
20.11 27.95 38.99 324 1,140 28.42
62.89
28.75
48.42
19.51
9.35
73.19
25.14
12.21
[2] Recommended total prenatal weight gain range by prepregnancy weight category is 28-40 lbs. for underweight women (BMI<18.5); 25-35 lbs. for normal weight women (BMI 18.5 to 24.9); 15-25 lbs. for overweight women (BMI 25 to 29.9); and 11-20 lbs. for obese women (BMI>=30).
[4] Due to Crossroads implementation, data are only available for this time period. This page will be updated to include FY16 data when it becomes available. Also, data for counties composing districts are not available.
[1] With the implementation of the 2003 revised US Standard Certificate of Live Birth in NC in August 2010, data on prenatal care initiation and tobacco use prior to 2011 are not comparable.
Data sources for these objectives are as follows: 1, 2, & 3 NC Birth Certificates; 4 NC Automated WIC System matched with Medicaid Processed Claims Report; 5 NC Automated WIC System; and 6 Medicaid Processed Claims Report.
0.46 0.25 0.64 39.54 24 3,736 0.64D. Unknown Weight Gain 3.32
[3] These data exclude women enrolled in Medicaid only for emergency delivery. 2014 Medicaid match includes data from both legacy WIC and Crossroads WIC System. Effective 2015 Prenatal Medicaid match included only Crossroads WIC data.

Orange County
SFY2017-2018 MATERNAL HEALTH AGREEMENT ADDENDA DATAProcess Outcome Objectives
NC Percent or Rate
Process Outcome Objectives1st
Percentage of women having live births who had adequate prenatal care as defined by Kessner Index. [1] (Time Periods: 1st - CY13; 2nd - CY14; 3rd - CY15. Most Recent - CY15)
1.
2nd 3rd
% Change from 1st period to
3rd period
Most Recent Data
Num DenPercent or Rate
Percentage of Medicaid enrolled pregnant women who deliver who receive prenatal WIC Program services.[3] (Time Periods: 1st - CY07-09; 2nd - CY10-12; 3rd - CY13-15. Most Recent - CY15)
4.
Percentage of women with live term singleton births who gained adequate/excessive/ inadequate weight according to the National Academy of Sciences-Institute of Medicine (IOM) 2009 Recommended Total Weight Gain Ranges during Pregnancy.[2] (Time Periods: 1st - CY13 2nd - CY14; 3rd - CY15. Most Recent - CY15)
2.
Percentage of women having live births who smoked during pregnancy. [1] (Time Periods: 1st - CY13; 2nd - CY14; 3rd - CY15. Most Recent - CY15)
3.
57.72 57.45 64.95 12.54 784 1,207 64.95
32.90 33.55 32.39 -1.55 342 1,056 32.39
Time Period
5.54 4.20 3.31 -40.15 40 1,207 3.31
68.75 67.85 71.17 3.52 263 374 70.32
A. Adequate Weight Gain
40.65 39.87 41.10 1.09 434 1,056 41.10B. Excessive Weight Gain
20.00 22.03 17.05 -14.77 180 1,056 17.05C. Inadequate Weight Gain
Percentage of infants enrolled in WIC who breastfed at 6 weeks postpartum. (Time Periods: 1st - FY15; 2nd - N/A; 3rd - N/A. Most Recent - FY15) [4]
5.17.46 194 1,111 17.46
Percentage of Medicaid enrolled pregnant women who deliver who receive a postpartum home visit.[3] (Time Periods: 1st - CY10-12; 2nd - N/A; 3rd - CY13-15. Most Recent - CY15)
6.
15.77 10.67 -32.36 54 485 11.13
62.89
28.75
48.42
19.51
9.35
73.19
25.14
12.21
[2] Recommended total prenatal weight gain range by prepregnancy weight category is 28-40 lbs. for underweight women (BMI<18.5); 25-35 lbs. for normal weight women (BMI 18.5 to 24.9); 15-25 lbs. for overweight women (BMI 25 to 29.9); and 11-20 lbs. for obese women (BMI>=30).
[4] Due to Crossroads implementation, data are only available for this time period. This page will be updated to include FY16 data when it becomes available. Also, data for counties composing districts are not available.
[1] With the implementation of the 2003 revised US Standard Certificate of Live Birth in NC in August 2010, data on prenatal care initiation and tobacco use prior to 2011 are not comparable.
Data sources for these objectives are as follows: 1, 2, & 3 NC Birth Certificates; 4 NC Automated WIC System matched with Medicaid Processed Claims Report; 5 NC Automated WIC System; and 6 Medicaid Processed Claims Report.
6.45 4.55 9.47 46.85 100 1,056 9.47D. Unknown Weight Gain 3.32
[3] These data exclude women enrolled in Medicaid only for emergency delivery. 2014 Medicaid match includes data from both legacy WIC and Crossroads WIC System. Effective 2015 Prenatal Medicaid match included only Crossroads WIC data.

Pamlico County
SFY2017-2018 MATERNAL HEALTH AGREEMENT ADDENDA DATAProcess Outcome Objectives
NC Percent or Rate
Process Outcome Objectives1st
Percentage of women having live births who had adequate prenatal care as defined by Kessner Index. [1] (Time Periods: 1st - CY13; 2nd - CY14; 3rd - CY15. Most Recent - CY15)
1.
2nd 3rd
% Change from 1st period to
3rd period
Most Recent Data
Num DenPercent or Rate
Percentage of Medicaid enrolled pregnant women who deliver who receive prenatal WIC Program services.[3] (Time Periods: 1st - CY07-09; 2nd - CY10-12; 3rd - CY13-15. Most Recent - CY15)
4.
Percentage of women with live term singleton births who gained adequate/excessive/ inadequate weight according to the National Academy of Sciences-Institute of Medicine (IOM) 2009 Recommended Total Weight Gain Ranges during Pregnancy.[2] (Time Periods: 1st - CY13 2nd - CY14; 3rd - CY15. Most Recent - CY15)
2.
Percentage of women having live births who smoked during pregnancy. [1] (Time Periods: 1st - CY13; 2nd - CY14; 3rd - CY15. Most Recent - CY15)
3.
62.03 61.54 52.38 -15.55 44 84 52.38
26.09 17.57 24.66 -5.48 18 73 24.66
Time Period
17.72 13.19 25.00 41.07 21 84 25.00
90.36 81.77 89.94 -0.46 52 56 92.86
A. Adequate Weight Gain
37.68 55.41 52.05 38.15 38 73 52.05B. Excessive Weight Gain
34.78 25.68 21.92 -36.99 16 73 21.92C. Inadequate Weight Gain
Percentage of infants enrolled in WIC who breastfed at 6 weeks postpartum. (Time Periods: 1st - FY15; 2nd - N/A; 3rd - N/A. Most Recent - FY15) [4]
5.34.29 24 70 34.29
Percentage of Medicaid enrolled pregnant women who deliver who receive a postpartum home visit.[3] (Time Periods: 1st - CY10-12; 2nd - N/A; 3rd - CY13-15. Most Recent - CY15)
6.
2.45 -100.00 75
62.89
28.75
48.42
19.51
9.35
73.19
25.14
12.21
[2] Recommended total prenatal weight gain range by prepregnancy weight category is 28-40 lbs. for underweight women (BMI<18.5); 25-35 lbs. for normal weight women (BMI 18.5 to 24.9); 15-25 lbs. for overweight women (BMI 25 to 29.9); and 11-20 lbs. for obese women (BMI>=30).
[4] Due to Crossroads implementation, data are only available for this time period. This page will be updated to include FY16 data when it becomes available. Also, data for counties composing districts are not available.
[1] With the implementation of the 2003 revised US Standard Certificate of Live Birth in NC in August 2010, data on prenatal care initiation and tobacco use prior to 2011 are not comparable.
Data sources for these objectives are as follows: 1, 2, & 3 NC Birth Certificates; 4 NC Automated WIC System matched with Medicaid Processed Claims Report; 5 NC Automated WIC System; and 6 Medicaid Processed Claims Report.
1.45 1.35 1.37 -5.48 1 73 1.37D. Unknown Weight Gain 3.32
[3] These data exclude women enrolled in Medicaid only for emergency delivery. 2014 Medicaid match includes data from both legacy WIC and Crossroads WIC System. Effective 2015 Prenatal Medicaid match included only Crossroads WIC data.

Pender County
SFY2017-2018 MATERNAL HEALTH AGREEMENT ADDENDA DATAProcess Outcome Objectives
NC Percent or Rate
Process Outcome Objectives1st
Percentage of women having live births who had adequate prenatal care as defined by Kessner Index. [1] (Time Periods: 1st - CY13; 2nd - CY14; 3rd - CY15. Most Recent - CY15)
1.
2nd 3rd
% Change from 1st period to
3rd period
Most Recent Data
Num DenPercent or Rate
Percentage of Medicaid enrolled pregnant women who deliver who receive prenatal WIC Program services.[3] (Time Periods: 1st - CY07-09; 2nd - CY10-12; 3rd - CY13-15. Most Recent - CY15)
4.
Percentage of women with live term singleton births who gained adequate/excessive/ inadequate weight according to the National Academy of Sciences-Institute of Medicine (IOM) 2009 Recommended Total Weight Gain Ranges during Pregnancy.[2] (Time Periods: 1st - CY13 2nd - CY14; 3rd - CY15. Most Recent - CY15)
2.
Percentage of women having live births who smoked during pregnancy. [1] (Time Periods: 1st - CY13; 2nd - CY14; 3rd - CY15. Most Recent - CY15)
3.
58.41 55.84 54.63 -6.46 336 615 54.63
27.35 30.04 29.79 8.94 157 527 29.79
Time Period
10.23 13.09 11.71 14.49 72 615 11.71
70.00 65.85 73.58 5.11 227 301 75.42
A. Adequate Weight Gain
51.43 49.29 51.23 -0.38 270 527 51.23B. Excessive Weight Gain
18.37 19.61 18.03 -1.86 95 527 18.03C. Inadequate Weight Gain
Percentage of infants enrolled in WIC who breastfed at 6 weeks postpartum. (Time Periods: 1st - FY15; 2nd - N/A; 3rd - N/A. Most Recent - FY15) [4]
5.31.45 106 337 31.45
Percentage of Medicaid enrolled pregnant women who deliver who receive a postpartum home visit.[3] (Time Periods: 1st - CY10-12; 2nd - N/A; 3rd - CY13-15. Most Recent - CY15)
6.
4.06 14.95 268.62 36 366 9.84
62.89
28.75
48.42
19.51
9.35
73.19
25.14
12.21
[2] Recommended total prenatal weight gain range by prepregnancy weight category is 28-40 lbs. for underweight women (BMI<18.5); 25-35 lbs. for normal weight women (BMI 18.5 to 24.9); 15-25 lbs. for overweight women (BMI 25 to 29.9); and 11-20 lbs. for obese women (BMI>=30).
[4] Due to Crossroads implementation, data are only available for this time period. This page will be updated to include FY16 data when it becomes available. Also, data for counties composing districts are not available.
[1] With the implementation of the 2003 revised US Standard Certificate of Live Birth in NC in August 2010, data on prenatal care initiation and tobacco use prior to 2011 are not comparable.
Data sources for these objectives are as follows: 1, 2, & 3 NC Birth Certificates; 4 NC Automated WIC System matched with Medicaid Processed Claims Report; 5 NC Automated WIC System; and 6 Medicaid Processed Claims Report.
2.86 1.06 0.95 -66.79 5 527 0.95D. Unknown Weight Gain 3.32
[3] These data exclude women enrolled in Medicaid only for emergency delivery. 2014 Medicaid match includes data from both legacy WIC and Crossroads WIC System. Effective 2015 Prenatal Medicaid match included only Crossroads WIC data.

Person County
SFY2017-2018 MATERNAL HEALTH AGREEMENT ADDENDA DATAProcess Outcome Objectives
NC Percent or Rate
Process Outcome Objectives1st
Percentage of women having live births who had adequate prenatal care as defined by Kessner Index. [1] (Time Periods: 1st - CY13; 2nd - CY14; 3rd - CY15. Most Recent - CY15)
1.
2nd 3rd
% Change from 1st period to
3rd period
Most Recent Data
Num DenPercent or Rate
Percentage of Medicaid enrolled pregnant women who deliver who receive prenatal WIC Program services.[3] (Time Periods: 1st - CY07-09; 2nd - CY10-12; 3rd - CY13-15. Most Recent - CY15)
4.
Percentage of women with live term singleton births who gained adequate/excessive/ inadequate weight according to the National Academy of Sciences-Institute of Medicine (IOM) 2009 Recommended Total Weight Gain Ranges during Pregnancy.[2] (Time Periods: 1st - CY13 2nd - CY14; 3rd - CY15. Most Recent - CY15)
2.
Percentage of women having live births who smoked during pregnancy. [1] (Time Periods: 1st - CY13; 2nd - CY14; 3rd - CY15. Most Recent - CY15)
3.
53.26 51.49 66.00 23.94 266 403 66.00
25.00 21.58 29.51 18.05 103 349 29.51
Time Period
18.14 14.48 14.14 -22.03 57 403 14.14
83.60 83.61 81.72 -2.26 206 251 82.07
A. Adequate Weight Gain
45.83 51.58 44.70 -2.47 156 349 44.70B. Excessive Weight Gain
24.22 21.84 21.78 -10.08 76 349 21.78C. Inadequate Weight Gain
Percentage of infants enrolled in WIC who breastfed at 6 weeks postpartum. (Time Periods: 1st - FY15; 2nd - N/A; 3rd - N/A. Most Recent - FY15) [4]
5.33.47 84 251 33.47
Percentage of Medicaid enrolled pregnant women who deliver who receive a postpartum home visit.[3] (Time Periods: 1st - CY10-12; 2nd - N/A; 3rd - CY13-15. Most Recent - CY15)
6.
61.54 49.58 -19.43 67 265 25.28
62.89
28.75
48.42
19.51
9.35
73.19
25.14
12.21
[2] Recommended total prenatal weight gain range by prepregnancy weight category is 28-40 lbs. for underweight women (BMI<18.5); 25-35 lbs. for normal weight women (BMI 18.5 to 24.9); 15-25 lbs. for overweight women (BMI 25 to 29.9); and 11-20 lbs. for obese women (BMI>=30).
[4] Due to Crossroads implementation, data are only available for this time period. This page will be updated to include FY16 data when it becomes available. Also, data for counties composing districts are not available.
[1] With the implementation of the 2003 revised US Standard Certificate of Live Birth in NC in August 2010, data on prenatal care initiation and tobacco use prior to 2011 are not comparable.
Data sources for these objectives are as follows: 1, 2, & 3 NC Birth Certificates; 4 NC Automated WIC System matched with Medicaid Processed Claims Report; 5 NC Automated WIC System; and 6 Medicaid Processed Claims Report.
4.95 5.00 4.01 -18.93 14 349 4.01D. Unknown Weight Gain 3.32
[3] These data exclude women enrolled in Medicaid only for emergency delivery. 2014 Medicaid match includes data from both legacy WIC and Crossroads WIC System. Effective 2015 Prenatal Medicaid match included only Crossroads WIC data.

Pitt County
SFY2017-2018 MATERNAL HEALTH AGREEMENT ADDENDA DATAProcess Outcome Objectives
NC Percent or Rate
Process Outcome Objectives1st
Percentage of women having live births who had adequate prenatal care as defined by Kessner Index. [1] (Time Periods: 1st - CY13; 2nd - CY14; 3rd - CY15. Most Recent - CY15)
1.
2nd 3rd
% Change from 1st period to
3rd period
Most Recent Data
Num DenPercent or Rate
Percentage of Medicaid enrolled pregnant women who deliver who receive prenatal WIC Program services.[3] (Time Periods: 1st - CY07-09; 2nd - CY10-12; 3rd - CY13-15. Most Recent - CY15)
4.
Percentage of women with live term singleton births who gained adequate/excessive/ inadequate weight according to the National Academy of Sciences-Institute of Medicine (IOM) 2009 Recommended Total Weight Gain Ranges during Pregnancy.[2] (Time Periods: 1st - CY13 2nd - CY14; 3rd - CY15. Most Recent - CY15)
2.
Percentage of women having live births who smoked during pregnancy. [1] (Time Periods: 1st - CY13; 2nd - CY14; 3rd - CY15. Most Recent - CY15)
3.
74.23 75.25 75.13 1.21 1,625 2,163 75.13
27.92 28.70 29.12 4.30 530 1,820 29.12
Time Period
11.61 10.16 10.12 -12.76 219 2,163 10.12
75.50 75.02 74.12 -1.83 917 1,210 75.79
A. Adequate Weight Gain
52.59 52.17 50.38 -4.20 917 1,820 50.38B. Excessive Weight Gain
18.69 18.63 20.11 7.60 366 1,820 20.11C. Inadequate Weight Gain
Percentage of infants enrolled in WIC who breastfed at 6 weeks postpartum. (Time Periods: 1st - FY15; 2nd - N/A; 3rd - N/A. Most Recent - FY15) [4]
5.18.82 224 1,190 18.82
Percentage of Medicaid enrolled pregnant women who deliver who receive a postpartum home visit.[3] (Time Periods: 1st - CY10-12; 2nd - N/A; 3rd - CY13-15. Most Recent - CY15)
6.
31.42 29.33 -6.65 463 1,307 35.42
62.89
28.75
48.42
19.51
9.35
73.19
25.14
12.21
[2] Recommended total prenatal weight gain range by prepregnancy weight category is 28-40 lbs. for underweight women (BMI<18.5); 25-35 lbs. for normal weight women (BMI 18.5 to 24.9); 15-25 lbs. for overweight women (BMI 25 to 29.9); and 11-20 lbs. for obese women (BMI>=30).
[4] Due to Crossroads implementation, data are only available for this time period. This page will be updated to include FY16 data when it becomes available. Also, data for counties composing districts are not available.
[1] With the implementation of the 2003 revised US Standard Certificate of Live Birth in NC in August 2010, data on prenatal care initiation and tobacco use prior to 2011 are not comparable.
Data sources for these objectives are as follows: 1, 2, & 3 NC Birth Certificates; 4 NC Automated WIC System matched with Medicaid Processed Claims Report; 5 NC Automated WIC System; and 6 Medicaid Processed Claims Report.
0.80 0.50 0.38 -51.79 7 1,820 0.38D. Unknown Weight Gain 3.32
[3] These data exclude women enrolled in Medicaid only for emergency delivery. 2014 Medicaid match includes data from both legacy WIC and Crossroads WIC System. Effective 2015 Prenatal Medicaid match included only Crossroads WIC data.

Randolph County
SFY2017-2018 MATERNAL HEALTH AGREEMENT ADDENDA DATAProcess Outcome Objectives
NC Percent or Rate
Process Outcome Objectives1st
Percentage of women having live births who had adequate prenatal care as defined by Kessner Index. [1] (Time Periods: 1st - CY13; 2nd - CY14; 3rd - CY15. Most Recent - CY15)
1.
2nd 3rd
% Change from 1st period to
3rd period
Most Recent Data
Num DenPercent or Rate
Percentage of Medicaid enrolled pregnant women who deliver who receive prenatal WIC Program services.[3] (Time Periods: 1st - CY07-09; 2nd - CY10-12; 3rd - CY13-15. Most Recent - CY15)
4.
Percentage of women with live term singleton births who gained adequate/excessive/ inadequate weight according to the National Academy of Sciences-Institute of Medicine (IOM) 2009 Recommended Total Weight Gain Ranges during Pregnancy.[2] (Time Periods: 1st - CY13 2nd - CY14; 3rd - CY15. Most Recent - CY15)
2.
Percentage of women having live births who smoked during pregnancy. [1] (Time Periods: 1st - CY13; 2nd - CY14; 3rd - CY15. Most Recent - CY15)
3.
53.49 52.78 55.26 3.31 861 1,558 55.26
27.28 28.38 27.68 1.47 377 1,362 27.68
Time Period
14.79 14.72 14.18 -4.09 221 1,558 14.18
69.13 73.21 72.78 5.28 684 925 73.95
A. Adequate Weight Gain
48.76 50.53 50.73 4.04 691 1,362 50.73B. Excessive Weight Gain
19.29 18.75 18.65 -3.34 254 1,362 18.65C. Inadequate Weight Gain
Percentage of infants enrolled in WIC who breastfed at 6 weeks postpartum. (Time Periods: 1st - FY15; 2nd - N/A; 3rd - N/A. Most Recent - FY15) [4]
5.36.23 342 944 36.23
Percentage of Medicaid enrolled pregnant women who deliver who receive a postpartum home visit.[3] (Time Periods: 1st - CY10-12; 2nd - N/A; 3rd - CY13-15. Most Recent - CY15)
6.
6.27 -100.00 1,061
62.89
28.75
48.42
19.51
9.35
73.19
25.14
12.21
[2] Recommended total prenatal weight gain range by prepregnancy weight category is 28-40 lbs. for underweight women (BMI<18.5); 25-35 lbs. for normal weight women (BMI 18.5 to 24.9); 15-25 lbs. for overweight women (BMI 25 to 29.9); and 11-20 lbs. for obese women (BMI>=30).
[4] Due to Crossroads implementation, data are only available for this time period. This page will be updated to include FY16 data when it becomes available. Also, data for counties composing districts are not available.
[1] With the implementation of the 2003 revised US Standard Certificate of Live Birth in NC in August 2010, data on prenatal care initiation and tobacco use prior to 2011 are not comparable.
Data sources for these objectives are as follows: 1, 2, & 3 NC Birth Certificates; 4 NC Automated WIC System matched with Medicaid Processed Claims Report; 5 NC Automated WIC System; and 6 Medicaid Processed Claims Report.
4.66 2.34 2.94 -37.04 40 1,362 2.94D. Unknown Weight Gain 3.32
[3] These data exclude women enrolled in Medicaid only for emergency delivery. 2014 Medicaid match includes data from both legacy WIC and Crossroads WIC System. Effective 2015 Prenatal Medicaid match included only Crossroads WIC data.

Richmond County
SFY2017-2018 MATERNAL HEALTH AGREEMENT ADDENDA DATAProcess Outcome Objectives
NC Percent or Rate
Process Outcome Objectives1st
Percentage of women having live births who had adequate prenatal care as defined by Kessner Index. [1] (Time Periods: 1st - CY13; 2nd - CY14; 3rd - CY15. Most Recent - CY15)
1.
2nd 3rd
% Change from 1st period to
3rd period
Most Recent Data
Num DenPercent or Rate
Percentage of Medicaid enrolled pregnant women who deliver who receive prenatal WIC Program services.[3] (Time Periods: 1st - CY07-09; 2nd - CY10-12; 3rd - CY13-15. Most Recent - CY15)
4.
Percentage of women with live term singleton births who gained adequate/excessive/ inadequate weight according to the National Academy of Sciences-Institute of Medicine (IOM) 2009 Recommended Total Weight Gain Ranges during Pregnancy.[2] (Time Periods: 1st - CY13 2nd - CY14; 3rd - CY15. Most Recent - CY15)
2.
Percentage of women having live births who smoked during pregnancy. [1] (Time Periods: 1st - CY13; 2nd - CY14; 3rd - CY15. Most Recent - CY15)
3.
58.40 59.52 51.71 -11.46 288 557 51.71
27.49 26.51 23.40 -14.88 110 470 23.40
Time Period
24.25 23.81 24.42 0.67 136 557 24.42
77.68 79.28 84.50 8.78 367 441 83.22
A. Adequate Weight Gain
49.22 46.05 50.43 2.44 237 470 50.43B. Excessive Weight Gain
23.06 27.21 25.11 8.87 118 470 25.11C. Inadequate Weight Gain
Percentage of infants enrolled in WIC who breastfed at 6 weeks postpartum. (Time Periods: 1st - FY15; 2nd - N/A; 3rd - N/A. Most Recent - FY15) [4]
5.22.44 92 410 22.44
Percentage of Medicaid enrolled pregnant women who deliver who receive a postpartum home visit.[3] (Time Periods: 1st - CY10-12; 2nd - N/A; 3rd - CY13-15. Most Recent - CY15)
6.
17.60 1.21 -93.15 488
62.89
28.75
48.42
19.51
9.35
73.19
25.14
12.21
[2] Recommended total prenatal weight gain range by prepregnancy weight category is 28-40 lbs. for underweight women (BMI<18.5); 25-35 lbs. for normal weight women (BMI 18.5 to 24.9); 15-25 lbs. for overweight women (BMI 25 to 29.9); and 11-20 lbs. for obese women (BMI>=30).
[4] Due to Crossroads implementation, data are only available for this time period. This page will be updated to include FY16 data when it becomes available. Also, data for counties composing districts are not available.
[1] With the implementation of the 2003 revised US Standard Certificate of Live Birth in NC in August 2010, data on prenatal care initiation and tobacco use prior to 2011 are not comparable.
Data sources for these objectives are as follows: 1, 2, & 3 NC Birth Certificates; 4 NC Automated WIC System matched with Medicaid Processed Claims Report; 5 NC Automated WIC System; and 6 Medicaid Processed Claims Report.
0.22 0.23 1.06 379.79 5 470 1.06D. Unknown Weight Gain 3.32
[3] These data exclude women enrolled in Medicaid only for emergency delivery. 2014 Medicaid match includes data from both legacy WIC and Crossroads WIC System. Effective 2015 Prenatal Medicaid match included only Crossroads WIC data.

Robeson County
SFY2017-2018 MATERNAL HEALTH AGREEMENT ADDENDA DATAProcess Outcome Objectives
NC Percent or Rate
Process Outcome Objectives1st
Percentage of women having live births who had adequate prenatal care as defined by Kessner Index. [1] (Time Periods: 1st - CY13; 2nd - CY14; 3rd - CY15. Most Recent - CY15)
1.
2nd 3rd
% Change from 1st period to
3rd period
Most Recent Data
Num DenPercent or Rate
Percentage of Medicaid enrolled pregnant women who deliver who receive prenatal WIC Program services.[3] (Time Periods: 1st - CY07-09; 2nd - CY10-12; 3rd - CY13-15. Most Recent - CY15)
4.
Percentage of women with live term singleton births who gained adequate/excessive/ inadequate weight according to the National Academy of Sciences-Institute of Medicine (IOM) 2009 Recommended Total Weight Gain Ranges during Pregnancy.[2] (Time Periods: 1st - CY13 2nd - CY14; 3rd - CY15. Most Recent - CY15)
2.
Percentage of women having live births who smoked during pregnancy. [1] (Time Periods: 1st - CY13; 2nd - CY14; 3rd - CY15. Most Recent - CY15)
3.
54.45 54.92 46.30 -14.96 820 1,771 46.30
29.46 29.04 28.83 -2.15 431 1,495 28.83
Time Period
19.54 18.64 17.73 -9.29 314 1,771 17.73
75.06 72.20 74.08 -1.31 1,028 1,363 75.42
A. Adequate Weight Gain
41.20 38.44 40.54 -1.61 606 1,495 40.54B. Excessive Weight Gain
28.23 30.95 29.70 5.21 444 1,495 29.70C. Inadequate Weight Gain
Percentage of infants enrolled in WIC who breastfed at 6 weeks postpartum. (Time Periods: 1st - FY15; 2nd - N/A; 3rd - N/A. Most Recent - FY15) [4]
5.30.01 401 1,336 30.01
Percentage of Medicaid enrolled pregnant women who deliver who receive a postpartum home visit.[3] (Time Periods: 1st - CY10-12; 2nd - N/A; 3rd - CY13-15. Most Recent - CY15)
6.
7.01 4.01 -42.82 103 1,541 6.68
62.89
28.75
48.42
19.51
9.35
73.19
25.14
12.21
[2] Recommended total prenatal weight gain range by prepregnancy weight category is 28-40 lbs. for underweight women (BMI<18.5); 25-35 lbs. for normal weight women (BMI 18.5 to 24.9); 15-25 lbs. for overweight women (BMI 25 to 29.9); and 11-20 lbs. for obese women (BMI>=30).
[4] Due to Crossroads implementation, data are only available for this time period. This page will be updated to include FY16 data when it becomes available. Also, data for counties composing districts are not available.
[1] With the implementation of the 2003 revised US Standard Certificate of Live Birth in NC in August 2010, data on prenatal care initiation and tobacco use prior to 2011 are not comparable.
Data sources for these objectives are as follows: 1, 2, & 3 NC Birth Certificates; 4 NC Automated WIC System matched with Medicaid Processed Claims Report; 5 NC Automated WIC System; and 6 Medicaid Processed Claims Report.
1.11 1.58 0.94 -15.77 14 1,495 0.94D. Unknown Weight Gain 3.32
[3] These data exclude women enrolled in Medicaid only for emergency delivery. 2014 Medicaid match includes data from both legacy WIC and Crossroads WIC System. Effective 2015 Prenatal Medicaid match included only Crossroads WIC data.

Rockingham County
SFY2017-2018 MATERNAL HEALTH AGREEMENT ADDENDA DATAProcess Outcome Objectives
NC Percent or Rate
Process Outcome Objectives1st
Percentage of women having live births who had adequate prenatal care as defined by Kessner Index. [1] (Time Periods: 1st - CY13; 2nd - CY14; 3rd - CY15. Most Recent - CY15)
1.
2nd 3rd
% Change from 1st period to
3rd period
Most Recent Data
Num DenPercent or Rate
Percentage of Medicaid enrolled pregnant women who deliver who receive prenatal WIC Program services.[3] (Time Periods: 1st - CY07-09; 2nd - CY10-12; 3rd - CY13-15. Most Recent - CY15)
4.
Percentage of women with live term singleton births who gained adequate/excessive/ inadequate weight according to the National Academy of Sciences-Institute of Medicine (IOM) 2009 Recommended Total Weight Gain Ranges during Pregnancy.[2] (Time Periods: 1st - CY13 2nd - CY14; 3rd - CY15. Most Recent - CY15)
2.
Percentage of women having live births who smoked during pregnancy. [1] (Time Periods: 1st - CY13; 2nd - CY14; 3rd - CY15. Most Recent - CY15)
3.
78.91 68.43 72.93 -7.58 660 905 72.93
25.06 28.54 25.16 0.39 198 787 25.16
Time Period
17.21 14.95 14.70 -14.60 133 905 14.70
78.63 78.34 78.00 -0.79 450 597 75.38
A. Adequate Weight Gain
51.93 50.77 51.97 0.08 409 787 51.97B. Excessive Weight Gain
18.07 18.67 20.84 15.31 164 787 20.84C. Inadequate Weight Gain
Percentage of infants enrolled in WIC who breastfed at 6 weeks postpartum. (Time Periods: 1st - FY15; 2nd - N/A; 3rd - N/A. Most Recent - FY15) [4]
5.43.23 249 576 43.23
Percentage of Medicaid enrolled pregnant women who deliver who receive a postpartum home visit.[3] (Time Periods: 1st - CY10-12; 2nd - N/A; 3rd - CY13-15. Most Recent - CY15)
6.
31.79 28.66 -9.83 147 649 22.65
62.89
28.75
48.42
19.51
9.35
73.19
25.14
12.21
[2] Recommended total prenatal weight gain range by prepregnancy weight category is 28-40 lbs. for underweight women (BMI<18.5); 25-35 lbs. for normal weight women (BMI 18.5 to 24.9); 15-25 lbs. for overweight women (BMI 25 to 29.9); and 11-20 lbs. for obese women (BMI>=30).
[4] Due to Crossroads implementation, data are only available for this time period. This page will be updated to include FY16 data when it becomes available. Also, data for counties composing districts are not available.
[1] With the implementation of the 2003 revised US Standard Certificate of Live Birth in NC in August 2010, data on prenatal care initiation and tobacco use prior to 2011 are not comparable.
Data sources for these objectives are as follows: 1, 2, & 3 NC Birth Certificates; 4 NC Automated WIC System matched with Medicaid Processed Claims Report; 5 NC Automated WIC System; and 6 Medicaid Processed Claims Report.
4.94 2.02 2.03 -58.84 16 787 2.03D. Unknown Weight Gain 3.32
[3] These data exclude women enrolled in Medicaid only for emergency delivery. 2014 Medicaid match includes data from both legacy WIC and Crossroads WIC System. Effective 2015 Prenatal Medicaid match included only Crossroads WIC data.

Rowan County
SFY2017-2018 MATERNAL HEALTH AGREEMENT ADDENDA DATAProcess Outcome Objectives
NC Percent or Rate
Process Outcome Objectives1st
Percentage of women having live births who had adequate prenatal care as defined by Kessner Index. [1] (Time Periods: 1st - CY13; 2nd - CY14; 3rd - CY15. Most Recent - CY15)
1.
2nd 3rd
% Change from 1st period to
3rd period
Most Recent Data
Num DenPercent or Rate
Percentage of Medicaid enrolled pregnant women who deliver who receive prenatal WIC Program services.[3] (Time Periods: 1st - CY07-09; 2nd - CY10-12; 3rd - CY13-15. Most Recent - CY15)
4.
Percentage of women with live term singleton births who gained adequate/excessive/ inadequate weight according to the National Academy of Sciences-Institute of Medicine (IOM) 2009 Recommended Total Weight Gain Ranges during Pregnancy.[2] (Time Periods: 1st - CY13 2nd - CY14; 3rd - CY15. Most Recent - CY15)
2.
Percentage of women having live births who smoked during pregnancy. [1] (Time Periods: 1st - CY13; 2nd - CY14; 3rd - CY15. Most Recent - CY15)
3.
55.04 52.55 54.21 -1.50 869 1,603 54.21
28.01 28.02 28.77 2.71 397 1,380 28.77
Time Period
18.04 17.09 15.66 -13.19 251 1,603 15.66
69.24 68.94 67.86 -1.99 662 961 68.89
A. Adequate Weight Gain
51.26 50.33 49.28 -3.88 680 1,380 49.28B. Excessive Weight Gain
19.69 20.48 21.01 6.74 290 1,380 21.01C. Inadequate Weight Gain
Percentage of infants enrolled in WIC who breastfed at 6 weeks postpartum. (Time Periods: 1st - FY15; 2nd - N/A; 3rd - N/A. Most Recent - FY15) [4]
5.35.24 321 911 35.24
Percentage of Medicaid enrolled pregnant women who deliver who receive a postpartum home visit.[3] (Time Periods: 1st - CY10-12; 2nd - N/A; 3rd - CY13-15. Most Recent - CY15)
6.
1,063
62.89
28.75
48.42
19.51
9.35
73.19
25.14
12.21
[2] Recommended total prenatal weight gain range by prepregnancy weight category is 28-40 lbs. for underweight women (BMI<18.5); 25-35 lbs. for normal weight women (BMI 18.5 to 24.9); 15-25 lbs. for overweight women (BMI 25 to 29.9); and 11-20 lbs. for obese women (BMI>=30).
[4] Due to Crossroads implementation, data are only available for this time period. This page will be updated to include FY16 data when it becomes available. Also, data for counties composing districts are not available.
[1] With the implementation of the 2003 revised US Standard Certificate of Live Birth in NC in August 2010, data on prenatal care initiation and tobacco use prior to 2011 are not comparable.
Data sources for these objectives are as follows: 1, 2, & 3 NC Birth Certificates; 4 NC Automated WIC System matched with Medicaid Processed Claims Report; 5 NC Automated WIC System; and 6 Medicaid Processed Claims Report.
1.04 1.17 0.94 -9.43 13 1,380 0.94D. Unknown Weight Gain 3.32
[3] These data exclude women enrolled in Medicaid only for emergency delivery. 2014 Medicaid match includes data from both legacy WIC and Crossroads WIC System. Effective 2015 Prenatal Medicaid match included only Crossroads WIC data.

Rutherford-Polk-McDowell District
SFY2017-2018 MATERNAL HEALTH AGREEMENT ADDENDA DATAProcess Outcome Objectives
NC Percent or Rate
Process Outcome Objectives1st
Percentage of women having live births who had adequate prenatal care as defined by Kessner Index. [1] (Time Periods: 1st - CY13; 2nd - CY14; 3rd - CY15. Most Recent - CY15)
1.
2nd 3rd
% Change from 1st period to
3rd period
Most Recent Data
Num DenPercent or Rate
Percentage of Medicaid enrolled pregnant women who deliver who receive prenatal WIC Program services.[3] (Time Periods: 1st - CY07-09; 2nd - CY10-12; 3rd - CY13-15. Most Recent - CY15)
4.
Percentage of women with live term singleton births who gained adequate/excessive/ inadequate weight according to the National Academy of Sciences-Institute of Medicine (IOM) 2009 Recommended Total Weight Gain Ranges during Pregnancy.[2] (Time Periods: 1st - CY13 2nd - CY14; 3rd - CY15. Most Recent - CY15)
2.
Percentage of women having live births who smoked during pregnancy. [1] (Time Periods: 1st - CY13; 2nd - CY14; 3rd - CY15. Most Recent - CY15)
3.
71.61 71.76 68.85 -3.84 902 1,310 68.85
29.34 28.70 27.00 -7.96 310 1,148 27.00
Time Period
22.67 21.25 20.00 -11.76 262 1,310 20.00
71.72 78.92 81.80 14.05 751 925 81.19
A. Adequate Weight Gain
48.75 46.48 49.74 2.03 571 1,148 49.74B. Excessive Weight Gain
20.93 23.29 20.99 0.30 241 1,148 20.99C. Inadequate Weight Gain
Percentage of infants enrolled in WIC who breastfed at 6 weeks postpartum. (Time Periods: 1st - FY15; 2nd - N/A; 3rd - N/A. Most Recent - FY15) [4]
5.24.20 218 901 24.20
Percentage of Medicaid enrolled pregnant women who deliver who receive a postpartum home visit.[3] (Time Periods: 1st - CY10-12; 2nd - N/A; 3rd - CY13-15. Most Recent - CY15)
6.
36.51 38.42 5.25 322 975 33.03
62.89
28.75
48.42
19.51
9.35
73.19
25.14
12.21
[2] Recommended total prenatal weight gain range by prepregnancy weight category is 28-40 lbs. for underweight women (BMI<18.5); 25-35 lbs. for normal weight women (BMI 18.5 to 24.9); 15-25 lbs. for overweight women (BMI 25 to 29.9); and 11-20 lbs. for obese women (BMI>=30).
[4] Due to Crossroads implementation, data are only available for this time period. This page will be updated to include FY16 data when it becomes available. Also, data for counties composing districts are not available.
[1] With the implementation of the 2003 revised US Standard Certificate of Live Birth in NC in August 2010, data on prenatal care initiation and tobacco use prior to 2011 are not comparable.
Data sources for these objectives are as follows: 1, 2, & 3 NC Birth Certificates; 4 NC Automated WIC System matched with Medicaid Processed Claims Report; 5 NC Automated WIC System; and 6 Medicaid Processed Claims Report.
0.98 1.53 2.26 130.19 26 1,148 2.26D. Unknown Weight Gain 3.32
[3] These data exclude women enrolled in Medicaid only for emergency delivery. 2014 Medicaid match includes data from both legacy WIC and Crossroads WIC System. Effective 2015 Prenatal Medicaid match included only Crossroads WIC data.

Rutherford
SFY2017-2018 MATERNAL HEALTH AGREEMENT ADDENDA DATAProcess Outcome Objectives for Counties Composing Districts
NC Percent or Rate
Process Outcome Objectives1st
Percentage of women having live births who had adequate prenatal care as defined by Kessner Index. [1] (Time Periods: 1st - CY13; 2nd - CY14; 3rd - CY15. Most Recent - CY15)
1.
2nd 3rd
% Change from 1st period to
3rd period
Most Recent Data
Num DenPercent or Rate
Percentage of Medicaid enrolled pregnant women who deliver who receive prenatal WIC Program services.[3] (Time Periods: 1st - CY07-09; 2nd - CY10-12; 3rd - CY13-15. Most Recent - CY15)
4.
Percentage of women with live term singleton births who gained adequate/excessive/ inadequate weight according to the National Academy of Sciences-Institute of Medicine (IOM) 2009 Recommended Total Weight Gain Ranges during Pregnancy.[2] (Time Periods: 1st - CY13 2nd - CY14; 3rd - CY15. Most Recent - CY15)
2.
Percentage of women having live births who smoked during pregnancy. [1] (Time Periods: 1st - CY13; 2nd - CY14; 3rd - CY15. Most Recent - CY15)
3.
71.49 69.05 63.29 -11.48 431 681 63.29
28.21 26.88 25.33 -10.20 152 600 25.33
Time Period
23.53 21.58 21.73 -7.64 148 681 21.73
71.14 83.66 83.91 17.95 440 517 85.11
A. Adequate Weight Gain
48.14 49.58 55.17 14.59 331 600 55.17B. Excessive Weight Gain
23.48 22.87 18.50 -21.21 111 600 18.50C. Inadequate Weight Gain
Percentage of infants enrolled in WIC who breastfed at 6 weeks postpartum. (Time Periods: 1st - FY15; 2nd - N/A; 3rd - N/A. Most Recent - FY15) [4]
5.
Percentage of Medicaid enrolled pregnant women who deliver who receive a postpartum home visit.[3] (Time Periods: 1st - CY10-12; 2nd - N/A; 3rd - CY13-15. Most Recent - CY15)
6.
64.03 71.08 11.00 322 521 61.80
62.89
28.75
48.42
19.51
9.35
73.19
25.14
12.21
[2] Recommended total prenatal weight gain range by prepregnancy weight category is 28-40 lbs. for underweight women (BMI<18.5); 25-35 lbs. for normal weight women (BMI 18.5 to 24.9); 15-25 lbs. for overweight women (BMI 25 to 29.9); and 11-20 lbs. for obese women (BMI>=30).
[4] Due to Crossroads implementation, data are only available for this time period. This page will be updated to include FY16 data when it becomes available. Also, data for counties composing districts are not available.
[1] With the implementation of the 2003 revised US Standard Certificate of Live Birth in NC in August 2010, data on prenatal care initiation and tobacco use prior to 2011 are not comparable.
Data sources for these objectives are as follows: 1, 2, & 3 NC Birth Certificates; 4 NC Automated WIC System matched with Medicaid Processed Claims Report; 5 NC Automated WIC System; and 6 Medicaid Processed Claims Report.
0.17 0.67 1.00 492.00 6 600 1.00D. Unknown Weight Gain 3.32
[3] These data exclude women enrolled in Medicaid only for emergency delivery. 2014 Medicaid match includes data from both legacy WIC and Crossroads WIC System. Effective 2015 Prenatal Medicaid match included only Crossroads WIC data.
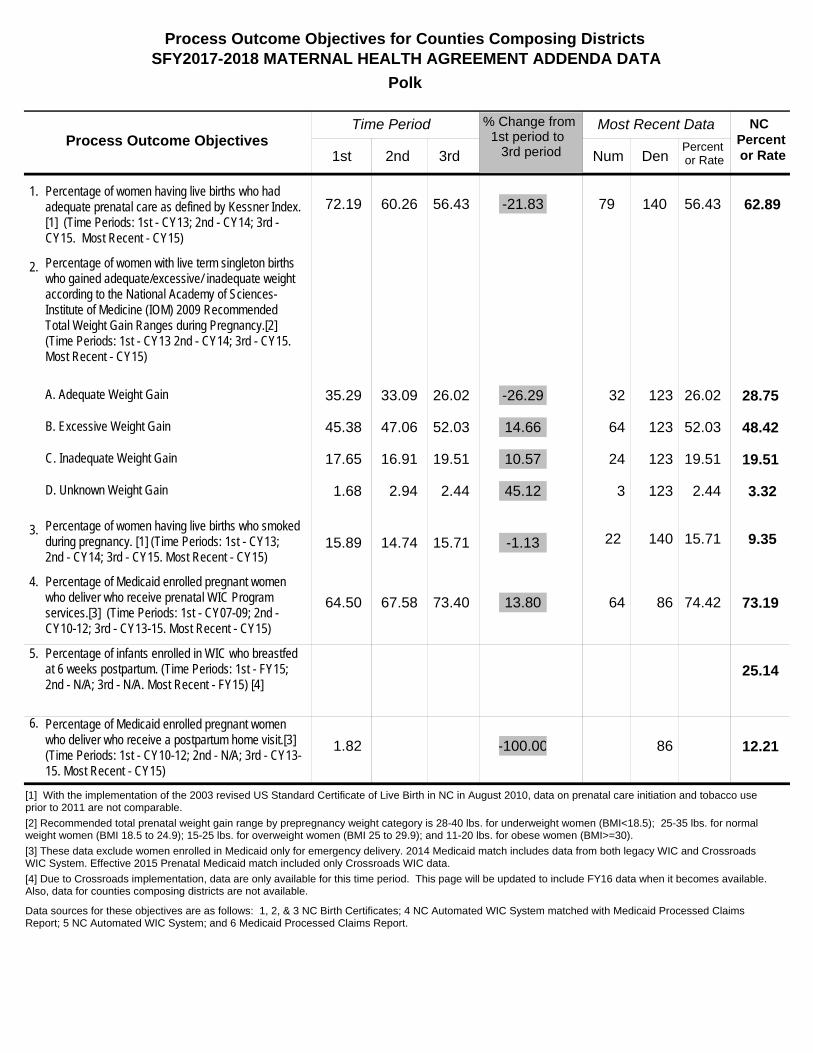
Polk
SFY2017-2018 MATERNAL HEALTH AGREEMENT ADDENDA DATAProcess Outcome Objectives for Counties Composing Districts
NC Percent or Rate
Process Outcome Objectives1st
Percentage of women having live births who had adequate prenatal care as defined by Kessner Index. [1] (Time Periods: 1st - CY13; 2nd - CY14; 3rd - CY15. Most Recent - CY15)
1.
2nd 3rd
% Change from 1st period to
3rd period
Most Recent Data
Num DenPercent or Rate
Percentage of Medicaid enrolled pregnant women who deliver who receive prenatal WIC Program services.[3] (Time Periods: 1st - CY07-09; 2nd - CY10-12; 3rd - CY13-15. Most Recent - CY15)
4.
Percentage of women with live term singleton births who gained adequate/excessive/ inadequate weight according to the National Academy of Sciences-Institute of Medicine (IOM) 2009 Recommended Total Weight Gain Ranges during Pregnancy.[2] (Time Periods: 1st - CY13 2nd - CY14; 3rd - CY15. Most Recent - CY15)
2.
Percentage of women having live births who smoked during pregnancy. [1] (Time Periods: 1st - CY13; 2nd - CY14; 3rd - CY15. Most Recent - CY15)
3.
72.19 60.26 56.43 -21.83 79 140 56.43
35.29 33.09 26.02 -26.29 32 123 26.02
Time Period
15.89 14.74 15.71 -1.13 22 140 15.71
64.50 67.58 73.40 13.80 64 86 74.42
A. Adequate Weight Gain
45.38 47.06 52.03 14.66 64 123 52.03B. Excessive Weight Gain
17.65 16.91 19.51 10.57 24 123 19.51C. Inadequate Weight Gain
Percentage of infants enrolled in WIC who breastfed at 6 weeks postpartum. (Time Periods: 1st - FY15; 2nd - N/A; 3rd - N/A. Most Recent - FY15) [4]
5.
Percentage of Medicaid enrolled pregnant women who deliver who receive a postpartum home visit.[3] (Time Periods: 1st - CY10-12; 2nd - N/A; 3rd - CY13-15. Most Recent - CY15)
6.
1.82 -100.00 86
62.89
28.75
48.42
19.51
9.35
73.19
25.14
12.21
[2] Recommended total prenatal weight gain range by prepregnancy weight category is 28-40 lbs. for underweight women (BMI<18.5); 25-35 lbs. for normal weight women (BMI 18.5 to 24.9); 15-25 lbs. for overweight women (BMI 25 to 29.9); and 11-20 lbs. for obese women (BMI>=30).
[4] Due to Crossroads implementation, data are only available for this time period. This page will be updated to include FY16 data when it becomes available. Also, data for counties composing districts are not available.
[1] With the implementation of the 2003 revised US Standard Certificate of Live Birth in NC in August 2010, data on prenatal care initiation and tobacco use prior to 2011 are not comparable.
Data sources for these objectives are as follows: 1, 2, & 3 NC Birth Certificates; 4 NC Automated WIC System matched with Medicaid Processed Claims Report; 5 NC Automated WIC System; and 6 Medicaid Processed Claims Report.
1.68 2.94 2.44 45.12 3 123 2.44D. Unknown Weight Gain 3.32
[3] These data exclude women enrolled in Medicaid only for emergency delivery. 2014 Medicaid match includes data from both legacy WIC and Crossroads WIC System. Effective 2015 Prenatal Medicaid match included only Crossroads WIC data.

McDowell
SFY2017-2018 MATERNAL HEALTH AGREEMENT ADDENDA DATAProcess Outcome Objectives for Counties Composing Districts
NC Percent or Rate
Process Outcome Objectives1st
Percentage of women having live births who had adequate prenatal care as defined by Kessner Index. [1] (Time Periods: 1st - CY13; 2nd - CY14; 3rd - CY15. Most Recent - CY15)
1.
2nd 3rd
% Change from 1st period to
3rd period
Most Recent Data
Num DenPercent or Rate
Percentage of Medicaid enrolled pregnant women who deliver who receive prenatal WIC Program services.[3] (Time Periods: 1st - CY07-09; 2nd - CY10-12; 3rd - CY13-15. Most Recent - CY15)
4.
Percentage of women with live term singleton births who gained adequate/excessive/ inadequate weight according to the National Academy of Sciences-Institute of Medicine (IOM) 2009 Recommended Total Weight Gain Ranges during Pregnancy.[2] (Time Periods: 1st - CY13 2nd - CY14; 3rd - CY15. Most Recent - CY15)
2.
Percentage of women having live births who smoked during pregnancy. [1] (Time Periods: 1st - CY13; 2nd - CY14; 3rd - CY15. Most Recent - CY15)
3.
71.58 79.87 80.16 11.99 392 489 80.16
29.24 30.03 29.65 1.40 126 425 29.65
Time Period
23.64 23.04 18.81 -20.43 92 489 18.81
74.62 74.15 80.95 8.49 247 322 76.71
A. Adequate Weight Gain
50.61 41.29 41.41 -18.18 176 425 41.41B. Excessive Weight Gain
18.18 26.27 24.94 37.18 106 425 24.94C. Inadequate Weight Gain
Percentage of infants enrolled in WIC who breastfed at 6 weeks postpartum. (Time Periods: 1st - FY15; 2nd - N/A; 3rd - N/A. Most Recent - FY15) [4]
5.
Percentage of Medicaid enrolled pregnant women who deliver who receive a postpartum home visit.[3] (Time Periods: 1st - CY10-12; 2nd - N/A; 3rd - CY13-15. Most Recent - CY15)
6.
3.58 -100.00 368
62.89
28.75
48.42
19.51
9.35
73.19
25.14
12.21
[2] Recommended total prenatal weight gain range by prepregnancy weight category is 28-40 lbs. for underweight women (BMI<18.5); 25-35 lbs. for normal weight women (BMI 18.5 to 24.9); 15-25 lbs. for overweight women (BMI 25 to 29.9); and 11-20 lbs. for obese women (BMI>=30).
[4] Due to Crossroads implementation, data are only available for this time period. This page will be updated to include FY16 data when it becomes available. Also, data for counties composing districts are not available.
[1] With the implementation of the 2003 revised US Standard Certificate of Live Birth in NC in August 2010, data on prenatal care initiation and tobacco use prior to 2011 are not comparable.
Data sources for these objectives are as follows: 1, 2, & 3 NC Birth Certificates; 4 NC Automated WIC System matched with Medicaid Processed Claims Report; 5 NC Automated WIC System; and 6 Medicaid Processed Claims Report.
1.97 2.41 4.00 103.50 17 425 4.00D. Unknown Weight Gain 3.32
[3] These data exclude women enrolled in Medicaid only for emergency delivery. 2014 Medicaid match includes data from both legacy WIC and Crossroads WIC System. Effective 2015 Prenatal Medicaid match included only Crossroads WIC data.

Sampson County
SFY2017-2018 MATERNAL HEALTH AGREEMENT ADDENDA DATAProcess Outcome Objectives
NC Percent or Rate
Process Outcome Objectives1st
Percentage of women having live births who had adequate prenatal care as defined by Kessner Index. [1] (Time Periods: 1st - CY13; 2nd - CY14; 3rd - CY15. Most Recent - CY15)
1.
2nd 3rd
% Change from 1st period to
3rd period
Most Recent Data
Num DenPercent or Rate
Percentage of Medicaid enrolled pregnant women who deliver who receive prenatal WIC Program services.[3] (Time Periods: 1st - CY07-09; 2nd - CY10-12; 3rd - CY13-15. Most Recent - CY15)
4.
Percentage of women with live term singleton births who gained adequate/excessive/ inadequate weight according to the National Academy of Sciences-Institute of Medicine (IOM) 2009 Recommended Total Weight Gain Ranges during Pregnancy.[2] (Time Periods: 1st - CY13 2nd - CY14; 3rd - CY15. Most Recent - CY15)
2.
Percentage of women having live births who smoked during pregnancy. [1] (Time Periods: 1st - CY13; 2nd - CY14; 3rd - CY15. Most Recent - CY15)
3.
64.75 66.90 67.55 4.31 562 832 67.55
29.86 27.46 27.06 -9.38 200 739 27.06
Time Period
12.53 11.67 12.02 -4.07 100 832 12.02
78.68 71.92 76.16 -3.21 384 469 81.88
A. Adequate Weight Gain
45.68 47.61 49.53 8.43 366 739 49.53B. Excessive Weight Gain
22.97 23.24 21.92 -4.58 162 739 21.92C. Inadequate Weight Gain
Percentage of infants enrolled in WIC who breastfed at 6 weeks postpartum. (Time Periods: 1st - FY15; 2nd - N/A; 3rd - N/A. Most Recent - FY15) [4]
5.5.46 29 531 5.46
Percentage of Medicaid enrolled pregnant women who deliver who receive a postpartum home visit.[3] (Time Periods: 1st - CY10-12; 2nd - N/A; 3rd - CY13-15. Most Recent - CY15)
6.
8.62 8.88 3.04 77 658 11.70
62.89
28.75
48.42
19.51
9.35
73.19
25.14
12.21
[2] Recommended total prenatal weight gain range by prepregnancy weight category is 28-40 lbs. for underweight women (BMI<18.5); 25-35 lbs. for normal weight women (BMI 18.5 to 24.9); 15-25 lbs. for overweight women (BMI 25 to 29.9); and 11-20 lbs. for obese women (BMI>=30).
[4] Due to Crossroads implementation, data are only available for this time period. This page will be updated to include FY16 data when it becomes available. Also, data for counties composing districts are not available.
[1] With the implementation of the 2003 revised US Standard Certificate of Live Birth in NC in August 2010, data on prenatal care initiation and tobacco use prior to 2011 are not comparable.
Data sources for these objectives are as follows: 1, 2, & 3 NC Birth Certificates; 4 NC Automated WIC System matched with Medicaid Processed Claims Report; 5 NC Automated WIC System; and 6 Medicaid Processed Claims Report.
1.49 1.69 1.49 0.14 11 739 1.49D. Unknown Weight Gain 3.32
[3] These data exclude women enrolled in Medicaid only for emergency delivery. 2014 Medicaid match includes data from both legacy WIC and Crossroads WIC System. Effective 2015 Prenatal Medicaid match included only Crossroads WIC data.

Scotland County
SFY2017-2018 MATERNAL HEALTH AGREEMENT ADDENDA DATAProcess Outcome Objectives
NC Percent or Rate
Process Outcome Objectives1st
Percentage of women having live births who had adequate prenatal care as defined by Kessner Index. [1] (Time Periods: 1st - CY13; 2nd - CY14; 3rd - CY15. Most Recent - CY15)
1.
2nd 3rd
% Change from 1st period to
3rd period
Most Recent Data
Num DenPercent or Rate
Percentage of Medicaid enrolled pregnant women who deliver who receive prenatal WIC Program services.[3] (Time Periods: 1st - CY07-09; 2nd - CY10-12; 3rd - CY13-15. Most Recent - CY15)
4.
Percentage of women with live term singleton births who gained adequate/excessive/ inadequate weight according to the National Academy of Sciences-Institute of Medicine (IOM) 2009 Recommended Total Weight Gain Ranges during Pregnancy.[2] (Time Periods: 1st - CY13 2nd - CY14; 3rd - CY15. Most Recent - CY15)
2.
Percentage of women having live births who smoked during pregnancy. [1] (Time Periods: 1st - CY13; 2nd - CY14; 3rd - CY15. Most Recent - CY15)
3.
75.89 68.18 58.01 -23.56 257 443 58.01
26.91 34.70 14.05 -47.78 52 370 14.05
Time Period
21.43 21.82 18.06 -15.73 80 443 18.06
84.25 84.52 86.09 2.18 316 368 85.87
A. Adequate Weight Gain
42.74 40.98 70.00 63.77 259 370 70.00B. Excessive Weight Gain
29.82 23.77 15.68 -47.42 58 370 15.68C. Inadequate Weight Gain
Percentage of infants enrolled in WIC who breastfed at 6 weeks postpartum. (Time Periods: 1st - FY15; 2nd - N/A; 3rd - N/A. Most Recent - FY15) [4]
5.20.52 87 424 20.52
Percentage of Medicaid enrolled pregnant women who deliver who receive a postpartum home visit.[3] (Time Periods: 1st - CY10-12; 2nd - N/A; 3rd - CY13-15. Most Recent - CY15)
6.
15.98 -100.00 385
62.89
28.75
48.42
19.51
9.35
73.19
25.14
12.21
[2] Recommended total prenatal weight gain range by prepregnancy weight category is 28-40 lbs. for underweight women (BMI<18.5); 25-35 lbs. for normal weight women (BMI 18.5 to 24.9); 15-25 lbs. for overweight women (BMI 25 to 29.9); and 11-20 lbs. for obese women (BMI>=30).
[4] Due to Crossroads implementation, data are only available for this time period. This page will be updated to include FY16 data when it becomes available. Also, data for counties composing districts are not available.
[1] With the implementation of the 2003 revised US Standard Certificate of Live Birth in NC in August 2010, data on prenatal care initiation and tobacco use prior to 2011 are not comparable.
Data sources for these objectives are as follows: 1, 2, & 3 NC Birth Certificates; 4 NC Automated WIC System matched with Medicaid Processed Claims Report; 5 NC Automated WIC System; and 6 Medicaid Processed Claims Report.
0.53 0.55 0.27 -48.78 1 370 0.27D. Unknown Weight Gain 3.32
[3] These data exclude women enrolled in Medicaid only for emergency delivery. 2014 Medicaid match includes data from both legacy WIC and Crossroads WIC System. Effective 2015 Prenatal Medicaid match included only Crossroads WIC data.

Stanly County
SFY2017-2018 MATERNAL HEALTH AGREEMENT ADDENDA DATAProcess Outcome Objectives
NC Percent or Rate
Process Outcome Objectives1st
Percentage of women having live births who had adequate prenatal care as defined by Kessner Index. [1] (Time Periods: 1st - CY13; 2nd - CY14; 3rd - CY15. Most Recent - CY15)
1.
2nd 3rd
% Change from 1st period to
3rd period
Most Recent Data
Num DenPercent or Rate
Percentage of Medicaid enrolled pregnant women who deliver who receive prenatal WIC Program services.[3] (Time Periods: 1st - CY07-09; 2nd - CY10-12; 3rd - CY13-15. Most Recent - CY15)
4.
Percentage of women with live term singleton births who gained adequate/excessive/ inadequate weight according to the National Academy of Sciences-Institute of Medicine (IOM) 2009 Recommended Total Weight Gain Ranges during Pregnancy.[2] (Time Periods: 1st - CY13 2nd - CY14; 3rd - CY15. Most Recent - CY15)
2.
Percentage of women having live births who smoked during pregnancy. [1] (Time Periods: 1st - CY13; 2nd - CY14; 3rd - CY15. Most Recent - CY15)
3.
69.75 64.07 66.37 -4.84 450 678 66.37
30.43 30.00 34.26 12.60 197 575 34.26
Time Period
12.07 13.79 16.08 33.21 109 678 16.08
81.71 76.71 74.92 -8.31 316 425 74.35
A. Adequate Weight Gain
51.60 50.16 47.65 -7.65 274 575 47.65B. Excessive Weight Gain
17.79 19.68 18.09 1.65 104 575 18.09C. Inadequate Weight Gain
Percentage of infants enrolled in WIC who breastfed at 6 weeks postpartum. (Time Periods: 1st - FY15; 2nd - N/A; 3rd - N/A. Most Recent - FY15) [4]
5.34.55 152 440 34.55
Percentage of Medicaid enrolled pregnant women who deliver who receive a postpartum home visit.[3] (Time Periods: 1st - CY10-12; 2nd - N/A; 3rd - CY13-15. Most Recent - CY15)
6.
2.40 1.24 -48.26 16 457 3.50
62.89
28.75
48.42
19.51
9.35
73.19
25.14
12.21
[2] Recommended total prenatal weight gain range by prepregnancy weight category is 28-40 lbs. for underweight women (BMI<18.5); 25-35 lbs. for normal weight women (BMI 18.5 to 24.9); 15-25 lbs. for overweight women (BMI 25 to 29.9); and 11-20 lbs. for obese women (BMI>=30).
[4] Due to Crossroads implementation, data are only available for this time period. This page will be updated to include FY16 data when it becomes available. Also, data for counties composing districts are not available.
[1] With the implementation of the 2003 revised US Standard Certificate of Live Birth in NC in August 2010, data on prenatal care initiation and tobacco use prior to 2011 are not comparable.
Data sources for these objectives are as follows: 1, 2, & 3 NC Birth Certificates; 4 NC Automated WIC System matched with Medicaid Processed Claims Report; 5 NC Automated WIC System; and 6 Medicaid Processed Claims Report.
0.18 0.16 0.00 -100.00 0 575 0.00D. Unknown Weight Gain 3.32
[3] These data exclude women enrolled in Medicaid only for emergency delivery. 2014 Medicaid match includes data from both legacy WIC and Crossroads WIC System. Effective 2015 Prenatal Medicaid match included only Crossroads WIC data.

Stokes County
SFY2017-2018 MATERNAL HEALTH AGREEMENT ADDENDA DATAProcess Outcome Objectives
NC Percent or Rate
Process Outcome Objectives1st
Percentage of women having live births who had adequate prenatal care as defined by Kessner Index. [1] (Time Periods: 1st - CY13; 2nd - CY14; 3rd - CY15. Most Recent - CY15)
1.
2nd 3rd
% Change from 1st period to
3rd period
Most Recent Data
Num DenPercent or Rate
Percentage of Medicaid enrolled pregnant women who deliver who receive prenatal WIC Program services.[3] (Time Periods: 1st - CY07-09; 2nd - CY10-12; 3rd - CY13-15. Most Recent - CY15)
4.
Percentage of women with live term singleton births who gained adequate/excessive/ inadequate weight according to the National Academy of Sciences-Institute of Medicine (IOM) 2009 Recommended Total Weight Gain Ranges during Pregnancy.[2] (Time Periods: 1st - CY13 2nd - CY14; 3rd - CY15. Most Recent - CY15)
2.
Percentage of women having live births who smoked during pregnancy. [1] (Time Periods: 1st - CY13; 2nd - CY14; 3rd - CY15. Most Recent - CY15)
3.
87.20 73.38 63.50 -27.17 261 411 63.50
29.05 19.67 26.51 -8.74 92 347 26.51
Time Period
19.47 14.18 14.11 -27.51 58 411 14.11
76.00 69.33 72.71 -4.32 163 241 67.63
A. Adequate Weight Gain
48.93 55.74 44.38 -9.30 154 347 44.38B. Excessive Weight Gain
19.27 16.67 19.60 1.72 68 347 19.60C. Inadequate Weight Gain
Percentage of infants enrolled in WIC who breastfed at 6 weeks postpartum. (Time Periods: 1st - FY15; 2nd - N/A; 3rd - N/A. Most Recent - FY15) [4]
5.36.44 86 236 36.44
Percentage of Medicaid enrolled pregnant women who deliver who receive a postpartum home visit.[3] (Time Periods: 1st - CY10-12; 2nd - N/A; 3rd - CY13-15. Most Recent - CY15)
6.
1.16 255
62.89
28.75
48.42
19.51
9.35
73.19
25.14
12.21
[2] Recommended total prenatal weight gain range by prepregnancy weight category is 28-40 lbs. for underweight women (BMI<18.5); 25-35 lbs. for normal weight women (BMI 18.5 to 24.9); 15-25 lbs. for overweight women (BMI 25 to 29.9); and 11-20 lbs. for obese women (BMI>=30).
[4] Due to Crossroads implementation, data are only available for this time period. This page will be updated to include FY16 data when it becomes available. Also, data for counties composing districts are not available.
[1] With the implementation of the 2003 revised US Standard Certificate of Live Birth in NC in August 2010, data on prenatal care initiation and tobacco use prior to 2011 are not comparable.
Data sources for these objectives are as follows: 1, 2, & 3 NC Birth Certificates; 4 NC Automated WIC System matched with Medicaid Processed Claims Report; 5 NC Automated WIC System; and 6 Medicaid Processed Claims Report.
2.75 7.92 9.51 245.53 33 347 9.51D. Unknown Weight Gain 3.32
[3] These data exclude women enrolled in Medicaid only for emergency delivery. 2014 Medicaid match includes data from both legacy WIC and Crossroads WIC System. Effective 2015 Prenatal Medicaid match included only Crossroads WIC data.

Surry County
SFY2017-2018 MATERNAL HEALTH AGREEMENT ADDENDA DATAProcess Outcome Objectives
NC Percent or Rate
Process Outcome Objectives1st
Percentage of women having live births who had adequate prenatal care as defined by Kessner Index. [1] (Time Periods: 1st - CY13; 2nd - CY14; 3rd - CY15. Most Recent - CY15)
1.
2nd 3rd
% Change from 1st period to
3rd period
Most Recent Data
Num DenPercent or Rate
Percentage of Medicaid enrolled pregnant women who deliver who receive prenatal WIC Program services.[3] (Time Periods: 1st - CY07-09; 2nd - CY10-12; 3rd - CY13-15. Most Recent - CY15)
4.
Percentage of women with live term singleton births who gained adequate/excessive/ inadequate weight according to the National Academy of Sciences-Institute of Medicine (IOM) 2009 Recommended Total Weight Gain Ranges during Pregnancy.[2] (Time Periods: 1st - CY13 2nd - CY14; 3rd - CY15. Most Recent - CY15)
2.
Percentage of women having live births who smoked during pregnancy. [1] (Time Periods: 1st - CY13; 2nd - CY14; 3rd - CY15. Most Recent - CY15)
3.
79.39 71.11 68.00 -14.35 510 750 68.00
26.74 30.41 29.61 10.72 188 635 29.61
Time Period
21.44 21.37 25.33 18.17 190 750 25.33
68.41 70.69 73.40 7.31 377 510 73.92
A. Adequate Weight Gain
49.53 48.39 48.35 -2.38 307 635 48.35B. Excessive Weight Gain
22.15 18.71 18.27 -17.53 116 635 18.27C. Inadequate Weight Gain
Percentage of infants enrolled in WIC who breastfed at 6 weeks postpartum. (Time Periods: 1st - FY15; 2nd - N/A; 3rd - N/A. Most Recent - FY15) [4]
5.25.25 124 491 25.25
Percentage of Medicaid enrolled pregnant women who deliver who receive a postpartum home visit.[3] (Time Periods: 1st - CY10-12; 2nd - N/A; 3rd - CY13-15. Most Recent - CY15)
6.
51.40 31.88 -37.98 168 575 29.22
62.89
28.75
48.42
19.51
9.35
73.19
25.14
12.21
[2] Recommended total prenatal weight gain range by prepregnancy weight category is 28-40 lbs. for underweight women (BMI<18.5); 25-35 lbs. for normal weight women (BMI 18.5 to 24.9); 15-25 lbs. for overweight women (BMI 25 to 29.9); and 11-20 lbs. for obese women (BMI>=30).
[4] Due to Crossroads implementation, data are only available for this time period. This page will be updated to include FY16 data when it becomes available. Also, data for counties composing districts are not available.
[1] With the implementation of the 2003 revised US Standard Certificate of Live Birth in NC in August 2010, data on prenatal care initiation and tobacco use prior to 2011 are not comparable.
Data sources for these objectives are as follows: 1, 2, & 3 NC Birth Certificates; 4 NC Automated WIC System matched with Medicaid Processed Claims Report; 5 NC Automated WIC System; and 6 Medicaid Processed Claims Report.
1.58 2.49 3.78 138.87 24 635 3.78D. Unknown Weight Gain 3.32
[3] These data exclude women enrolled in Medicaid only for emergency delivery. 2014 Medicaid match includes data from both legacy WIC and Crossroads WIC System. Effective 2015 Prenatal Medicaid match included only Crossroads WIC data.

Swain County
SFY2017-2018 MATERNAL HEALTH AGREEMENT ADDENDA DATAProcess Outcome Objectives
NC Percent or Rate
Process Outcome Objectives1st
Percentage of women having live births who had adequate prenatal care as defined by Kessner Index. [1] (Time Periods: 1st - CY13; 2nd - CY14; 3rd - CY15. Most Recent - CY15)
1.
2nd 3rd
% Change from 1st period to
3rd period
Most Recent Data
Num DenPercent or Rate
Percentage of Medicaid enrolled pregnant women who deliver who receive prenatal WIC Program services.[3] (Time Periods: 1st - CY07-09; 2nd - CY10-12; 3rd - CY13-15. Most Recent - CY15)
4.
Percentage of women with live term singleton births who gained adequate/excessive/ inadequate weight according to the National Academy of Sciences-Institute of Medicine (IOM) 2009 Recommended Total Weight Gain Ranges during Pregnancy.[2] (Time Periods: 1st - CY13 2nd - CY14; 3rd - CY15. Most Recent - CY15)
2.
Percentage of women having live births who smoked during pregnancy. [1] (Time Periods: 1st - CY13; 2nd - CY14; 3rd - CY15. Most Recent - CY15)
3.
55.83 61.00 56.16 0.61 123 219 56.16
28.11 24.55 28.65 1.92 53 185 28.65
Time Period
26.70 29.00 25.11 -5.94 55 219 25.11
85.38 77.88 66.13 -22.55 83 169 49.11
A. Adequate Weight Gain
54.59 58.08 44.32 -18.81 82 185 44.32B. Excessive Weight Gain
16.22 16.17 23.78 46.67 44 185 23.78C. Inadequate Weight Gain
Percentage of infants enrolled in WIC who breastfed at 6 weeks postpartum. (Time Periods: 1st - FY15; 2nd - N/A; 3rd - N/A. Most Recent - FY15) [4]
5.24.69 20 81 24.69
Percentage of Medicaid enrolled pregnant women who deliver who receive a postpartum home visit.[3] (Time Periods: 1st - CY10-12; 2nd - N/A; 3rd - CY13-15. Most Recent - CY15)
6.
0.62 2.15 248.76 2 170 1.18
62.89
28.75
48.42
19.51
9.35
73.19
25.14
12.21
[2] Recommended total prenatal weight gain range by prepregnancy weight category is 28-40 lbs. for underweight women (BMI<18.5); 25-35 lbs. for normal weight women (BMI 18.5 to 24.9); 15-25 lbs. for overweight women (BMI 25 to 29.9); and 11-20 lbs. for obese women (BMI>=30).
[4] Due to Crossroads implementation, data are only available for this time period. This page will be updated to include FY16 data when it becomes available. Also, data for counties composing districts are not available.
[1] With the implementation of the 2003 revised US Standard Certificate of Live Birth in NC in August 2010, data on prenatal care initiation and tobacco use prior to 2011 are not comparable.
Data sources for these objectives are as follows: 1, 2, & 3 NC Birth Certificates; 4 NC Automated WIC System matched with Medicaid Processed Claims Report; 5 NC Automated WIC System; and 6 Medicaid Processed Claims Report.
1.08 1.20 3.24 200.00 6 185 3.24D. Unknown Weight Gain 3.32
[3] These data exclude women enrolled in Medicaid only for emergency delivery. 2014 Medicaid match includes data from both legacy WIC and Crossroads WIC System. Effective 2015 Prenatal Medicaid match included only Crossroads WIC data.

Toe River District
SFY2017-2018 MATERNAL HEALTH AGREEMENT ADDENDA DATAProcess Outcome Objectives
NC Percent or Rate
Process Outcome Objectives1st
Percentage of women having live births who had adequate prenatal care as defined by Kessner Index. [1] (Time Periods: 1st - CY13; 2nd - CY14; 3rd - CY15. Most Recent - CY15)
1.
2nd 3rd
% Change from 1st period to
3rd period
Most Recent Data
Num DenPercent or Rate
Percentage of Medicaid enrolled pregnant women who deliver who receive prenatal WIC Program services.[3] (Time Periods: 1st - CY07-09; 2nd - CY10-12; 3rd - CY13-15. Most Recent - CY15)
4.
Percentage of women with live term singleton births who gained adequate/excessive/ inadequate weight according to the National Academy of Sciences-Institute of Medicine (IOM) 2009 Recommended Total Weight Gain Ranges during Pregnancy.[2] (Time Periods: 1st - CY13 2nd - CY14; 3rd - CY15. Most Recent - CY15)
2.
Percentage of women having live births who smoked during pregnancy. [1] (Time Periods: 1st - CY13; 2nd - CY14; 3rd - CY15. Most Recent - CY15)
3.
69.91 71.56 74.38 6.38 357 480 74.38
26.46 29.18 26.03 -1.62 107 411 26.03
Time Period
16.81 20.75 19.38 15.23 93 480 19.38
72.00 73.54 78.57 9.13 220 283 77.74
A. Adequate Weight Gain
45.29 45.62 47.20 4.22 194 411 47.20B. Excessive Weight Gain
25.45 21.22 21.17 -16.81 87 411 21.17C. Inadequate Weight Gain
Percentage of infants enrolled in WIC who breastfed at 6 weeks postpartum. (Time Periods: 1st - FY15; 2nd - N/A; 3rd - N/A. Most Recent - FY15) [4]
5.32.35 99 306 32.35
Percentage of Medicaid enrolled pregnant women who deliver who receive a postpartum home visit.[3] (Time Periods: 1st - CY10-12; 2nd - N/A; 3rd - CY13-15. Most Recent - CY15)
6.
1.65 0.62 -62.38 323
62.89
28.75
48.42
19.51
9.35
73.19
25.14
12.21
[2] Recommended total prenatal weight gain range by prepregnancy weight category is 28-40 lbs. for underweight women (BMI<18.5); 25-35 lbs. for normal weight women (BMI 18.5 to 24.9); 15-25 lbs. for overweight women (BMI 25 to 29.9); and 11-20 lbs. for obese women (BMI>=30).
[4] Due to Crossroads implementation, data are only available for this time period. This page will be updated to include FY16 data when it becomes available. Also, data for counties composing districts are not available.
[1] With the implementation of the 2003 revised US Standard Certificate of Live Birth in NC in August 2010, data on prenatal care initiation and tobacco use prior to 2011 are not comparable.
Data sources for these objectives are as follows: 1, 2, & 3 NC Birth Certificates; 4 NC Automated WIC System matched with Medicaid Processed Claims Report; 5 NC Automated WIC System; and 6 Medicaid Processed Claims Report.
2.80 3.98 5.60 99.93 23 411 5.60D. Unknown Weight Gain 3.32
[3] These data exclude women enrolled in Medicaid only for emergency delivery. 2014 Medicaid match includes data from both legacy WIC and Crossroads WIC System. Effective 2015 Prenatal Medicaid match included only Crossroads WIC data.

Avery
SFY2017-2018 MATERNAL HEALTH AGREEMENT ADDENDA DATAProcess Outcome Objectives for Counties Composing Districts
NC Percent or Rate
Process Outcome Objectives1st
Percentage of women having live births who had adequate prenatal care as defined by Kessner Index. [1] (Time Periods: 1st - CY13; 2nd - CY14; 3rd - CY15. Most Recent - CY15)
1.
2nd 3rd
% Change from 1st period to
3rd period
Most Recent Data
Num DenPercent or Rate
Percentage of Medicaid enrolled pregnant women who deliver who receive prenatal WIC Program services.[3] (Time Periods: 1st - CY07-09; 2nd - CY10-12; 3rd - CY13-15. Most Recent - CY15)
4.
Percentage of women with live term singleton births who gained adequate/excessive/ inadequate weight according to the National Academy of Sciences-Institute of Medicine (IOM) 2009 Recommended Total Weight Gain Ranges during Pregnancy.[2] (Time Periods: 1st - CY13 2nd - CY14; 3rd - CY15. Most Recent - CY15)
2.
Percentage of women having live births who smoked during pregnancy. [1] (Time Periods: 1st - CY13; 2nd - CY14; 3rd - CY15. Most Recent - CY15)
3.
75.66 73.68 79.59 5.20 117 147 79.59
34.62 23.23 23.20 -32.98 29 125 23.20
Time Period
13.82 16.67 14.97 8.33 22 147 14.97
73.68 72.76 86.29 17.11 72 83 86.75
A. Adequate Weight Gain
45.38 49.49 52.80 16.34 66 125 52.80B. Excessive Weight Gain
18.46 23.23 22.40 21.33 28 125 22.40C. Inadequate Weight Gain
Percentage of infants enrolled in WIC who breastfed at 6 weeks postpartum. (Time Periods: 1st - FY15; 2nd - N/A; 3rd - N/A. Most Recent - FY15) [4]
5.
Percentage of Medicaid enrolled pregnant women who deliver who receive a postpartum home visit.[3] (Time Periods: 1st - CY10-12; 2nd - N/A; 3rd - CY13-15. Most Recent - CY15)
6.
3.28 1.67 -49.00 102
62.89
28.75
48.42
19.51
9.35
73.19
25.14
12.21
[2] Recommended total prenatal weight gain range by prepregnancy weight category is 28-40 lbs. for underweight women (BMI<18.5); 25-35 lbs. for normal weight women (BMI 18.5 to 24.9); 15-25 lbs. for overweight women (BMI 25 to 29.9); and 11-20 lbs. for obese women (BMI>=30).
[4] Due to Crossroads implementation, data are only available for this time period. This page will be updated to include FY16 data when it becomes available. Also, data for counties composing districts are not available.
[1] With the implementation of the 2003 revised US Standard Certificate of Live Birth in NC in August 2010, data on prenatal care initiation and tobacco use prior to 2011 are not comparable.
Data sources for these objectives are as follows: 1, 2, & 3 NC Birth Certificates; 4 NC Automated WIC System matched with Medicaid Processed Claims Report; 5 NC Automated WIC System; and 6 Medicaid Processed Claims Report.
1.54 4.04 1.60 4.00 2 125 1.60D. Unknown Weight Gain 3.32
[3] These data exclude women enrolled in Medicaid only for emergency delivery. 2014 Medicaid match includes data from both legacy WIC and Crossroads WIC System. Effective 2015 Prenatal Medicaid match included only Crossroads WIC data.

Mitchell
SFY2017-2018 MATERNAL HEALTH AGREEMENT ADDENDA DATAProcess Outcome Objectives for Counties Composing Districts
NC Percent or Rate
Process Outcome Objectives1st
Percentage of women having live births who had adequate prenatal care as defined by Kessner Index. [1] (Time Periods: 1st - CY13; 2nd - CY14; 3rd - CY15. Most Recent - CY15)
1.
2nd 3rd
% Change from 1st period to
3rd period
Most Recent Data
Num DenPercent or Rate
Percentage of Medicaid enrolled pregnant women who deliver who receive prenatal WIC Program services.[3] (Time Periods: 1st - CY07-09; 2nd - CY10-12; 3rd - CY13-15. Most Recent - CY15)
4.
Percentage of women with live term singleton births who gained adequate/excessive/ inadequate weight according to the National Academy of Sciences-Institute of Medicine (IOM) 2009 Recommended Total Weight Gain Ranges during Pregnancy.[2] (Time Periods: 1st - CY13 2nd - CY14; 3rd - CY15. Most Recent - CY15)
2.
Percentage of women having live births who smoked during pregnancy. [1] (Time Periods: 1st - CY13; 2nd - CY14; 3rd - CY15. Most Recent - CY15)
3.
64.79 64.79 72.85 12.44 110 151 72.85
22.76 33.61 28.91 26.98 37 128 28.91
Time Period
16.20 26.76 25.83 59.46 39 151 25.83
74.09 75.93 74.73 0.86 64 93 68.82
A. Adequate Weight Gain
42.28 49.18 46.09 9.03 59 128 46.09B. Excessive Weight Gain
29.27 13.93 21.88 -25.26 28 128 21.88C. Inadequate Weight Gain
Percentage of infants enrolled in WIC who breastfed at 6 weeks postpartum. (Time Periods: 1st - FY15; 2nd - N/A; 3rd - N/A. Most Recent - FY15) [4]
5.
Percentage of Medicaid enrolled pregnant women who deliver who receive a postpartum home visit.[3] (Time Periods: 1st - CY10-12; 2nd - N/A; 3rd - CY13-15. Most Recent - CY15)
6.
1.07 -100.00 99
62.89
28.75
48.42
19.51
9.35
73.19
25.14
12.21
[2] Recommended total prenatal weight gain range by prepregnancy weight category is 28-40 lbs. for underweight women (BMI<18.5); 25-35 lbs. for normal weight women (BMI 18.5 to 24.9); 15-25 lbs. for overweight women (BMI 25 to 29.9); and 11-20 lbs. for obese women (BMI>=30).
[4] Due to Crossroads implementation, data are only available for this time period. This page will be updated to include FY16 data when it becomes available. Also, data for counties composing districts are not available.
[1] With the implementation of the 2003 revised US Standard Certificate of Live Birth in NC in August 2010, data on prenatal care initiation and tobacco use prior to 2011 are not comparable.
Data sources for these objectives are as follows: 1, 2, & 3 NC Birth Certificates; 4 NC Automated WIC System matched with Medicaid Processed Claims Report; 5 NC Automated WIC System; and 6 Medicaid Processed Claims Report.
5.69 3.28 3.13 -45.09 4 128 3.13D. Unknown Weight Gain 3.32
[3] These data exclude women enrolled in Medicaid only for emergency delivery. 2014 Medicaid match includes data from both legacy WIC and Crossroads WIC System. Effective 2015 Prenatal Medicaid match included only Crossroads WIC data.

Yancey
SFY2017-2018 MATERNAL HEALTH AGREEMENT ADDENDA DATAProcess Outcome Objectives for Counties Composing Districts
NC Percent or Rate
Process Outcome Objectives1st
Percentage of women having live births who had adequate prenatal care as defined by Kessner Index. [1] (Time Periods: 1st - CY13; 2nd - CY14; 3rd - CY15. Most Recent - CY15)
1.
2nd 3rd
% Change from 1st period to
3rd period
Most Recent Data
Num DenPercent or Rate
Percentage of Medicaid enrolled pregnant women who deliver who receive prenatal WIC Program services.[3] (Time Periods: 1st - CY07-09; 2nd - CY10-12; 3rd - CY13-15. Most Recent - CY15)
4.
Percentage of women with live term singleton births who gained adequate/excessive/ inadequate weight according to the National Academy of Sciences-Institute of Medicine (IOM) 2009 Recommended Total Weight Gain Ranges during Pregnancy.[2] (Time Periods: 1st - CY13 2nd - CY14; 3rd - CY15. Most Recent - CY15)
2.
Percentage of women having live births who smoked during pregnancy. [1] (Time Periods: 1st - CY13; 2nd - CY14; 3rd - CY15. Most Recent - CY15)
3.
68.99 75.72 71.43 3.54 130 182 71.43
22.14 29.49 25.95 17.19 41 158 25.95
Time Period
20.25 18.50 17.58 -13.19 32 182 17.58
68.64 72.42 75.98 10.69 84 107 78.50
A. Adequate Weight Gain
47.86 40.38 43.67 -8.75 69 158 43.67B. Excessive Weight Gain
28.57 25.64 19.62 -31.33 31 158 19.62C. Inadequate Weight Gain
Percentage of infants enrolled in WIC who breastfed at 6 weeks postpartum. (Time Periods: 1st - FY15; 2nd - N/A; 3rd - N/A. Most Recent - FY15) [4]
5.
Percentage of Medicaid enrolled pregnant women who deliver who receive a postpartum home visit.[3] (Time Periods: 1st - CY10-12; 2nd - N/A; 3rd - CY13-15. Most Recent - CY15)
6.
0.78 0.26 -66.05 122
62.89
28.75
48.42
19.51
9.35
73.19
25.14
12.21
[2] Recommended total prenatal weight gain range by prepregnancy weight category is 28-40 lbs. for underweight women (BMI<18.5); 25-35 lbs. for normal weight women (BMI 18.5 to 24.9); 15-25 lbs. for overweight women (BMI 25 to 29.9); and 11-20 lbs. for obese women (BMI>=30).
[4] Due to Crossroads implementation, data are only available for this time period. This page will be updated to include FY16 data when it becomes available. Also, data for counties composing districts are not available.
[1] With the implementation of the 2003 revised US Standard Certificate of Live Birth in NC in August 2010, data on prenatal care initiation and tobacco use prior to 2011 are not comparable.
Data sources for these objectives are as follows: 1, 2, & 3 NC Birth Certificates; 4 NC Automated WIC System matched with Medicaid Processed Claims Report; 5 NC Automated WIC System; and 6 Medicaid Processed Claims Report.
1.43 4.49 10.76 653.16 17 158 10.76D. Unknown Weight Gain 3.32
[3] These data exclude women enrolled in Medicaid only for emergency delivery. 2014 Medicaid match includes data from both legacy WIC and Crossroads WIC System. Effective 2015 Prenatal Medicaid match included only Crossroads WIC data.

Transylvania County
SFY2017-2018 MATERNAL HEALTH AGREEMENT ADDENDA DATAProcess Outcome Objectives
NC Percent or Rate
Process Outcome Objectives1st
Percentage of women having live births who had adequate prenatal care as defined by Kessner Index. [1] (Time Periods: 1st - CY13; 2nd - CY14; 3rd - CY15. Most Recent - CY15)
1.
2nd 3rd
% Change from 1st period to
3rd period
Most Recent Data
Num DenPercent or Rate
Percentage of Medicaid enrolled pregnant women who deliver who receive prenatal WIC Program services.[3] (Time Periods: 1st - CY07-09; 2nd - CY10-12; 3rd - CY13-15. Most Recent - CY15)
4.
Percentage of women with live term singleton births who gained adequate/excessive/ inadequate weight according to the National Academy of Sciences-Institute of Medicine (IOM) 2009 Recommended Total Weight Gain Ranges during Pregnancy.[2] (Time Periods: 1st - CY13 2nd - CY14; 3rd - CY15. Most Recent - CY15)
2.
Percentage of women having live births who smoked during pregnancy. [1] (Time Periods: 1st - CY13; 2nd - CY14; 3rd - CY15. Most Recent - CY15)
3.
77.54 76.82 79.93 3.07 219 274 79.93
33.20 24.80 30.25 -8.88 72 238 30.25
Time Period
13.33 15.57 9.49 -28.83 26 274 9.49
71.43 68.14 71.79 0.50 131 183 71.58
A. Adequate Weight Gain
44.40 49.59 42.86 -3.47 102 238 42.86B. Excessive Weight Gain
20.40 21.95 15.55 -23.79 37 238 15.55C. Inadequate Weight Gain
Percentage of infants enrolled in WIC who breastfed at 6 weeks postpartum. (Time Periods: 1st - FY15; 2nd - N/A; 3rd - N/A. Most Recent - FY15) [4]
5.30.73 55 179 30.73
Percentage of Medicaid enrolled pregnant women who deliver who receive a postpartum home visit.[3] (Time Periods: 1st - CY10-12; 2nd - N/A; 3rd - CY13-15. Most Recent - CY15)
6.
4.96 3.86 -22.28 5 203 2.46
62.89
28.75
48.42
19.51
9.35
73.19
25.14
12.21
[2] Recommended total prenatal weight gain range by prepregnancy weight category is 28-40 lbs. for underweight women (BMI<18.5); 25-35 lbs. for normal weight women (BMI 18.5 to 24.9); 15-25 lbs. for overweight women (BMI 25 to 29.9); and 11-20 lbs. for obese women (BMI>=30).
[4] Due to Crossroads implementation, data are only available for this time period. This page will be updated to include FY16 data when it becomes available. Also, data for counties composing districts are not available.
[1] With the implementation of the 2003 revised US Standard Certificate of Live Birth in NC in August 2010, data on prenatal care initiation and tobacco use prior to 2011 are not comparable.
Data sources for these objectives are as follows: 1, 2, & 3 NC Birth Certificates; 4 NC Automated WIC System matched with Medicaid Processed Claims Report; 5 NC Automated WIC System; and 6 Medicaid Processed Claims Report.
2.00 3.66 11.34 467.23 27 238 11.34D. Unknown Weight Gain 3.32
[3] These data exclude women enrolled in Medicaid only for emergency delivery. 2014 Medicaid match includes data from both legacy WIC and Crossroads WIC System. Effective 2015 Prenatal Medicaid match included only Crossroads WIC data.

Union County
SFY2017-2018 MATERNAL HEALTH AGREEMENT ADDENDA DATAProcess Outcome Objectives
NC Percent or Rate
Process Outcome Objectives1st
Percentage of women having live births who had adequate prenatal care as defined by Kessner Index. [1] (Time Periods: 1st - CY13; 2nd - CY14; 3rd - CY15. Most Recent - CY15)
1.
2nd 3rd
% Change from 1st period to
3rd period
Most Recent Data
Num DenPercent or Rate
Percentage of Medicaid enrolled pregnant women who deliver who receive prenatal WIC Program services.[3] (Time Periods: 1st - CY07-09; 2nd - CY10-12; 3rd - CY13-15. Most Recent - CY15)
4.
Percentage of women with live term singleton births who gained adequate/excessive/ inadequate weight according to the National Academy of Sciences-Institute of Medicine (IOM) 2009 Recommended Total Weight Gain Ranges during Pregnancy.[2] (Time Periods: 1st - CY13 2nd - CY14; 3rd - CY15. Most Recent - CY15)
2.
Percentage of women having live births who smoked during pregnancy. [1] (Time Periods: 1st - CY13; 2nd - CY14; 3rd - CY15. Most Recent - CY15)
3.
64.74 67.24 66.60 2.86 1,571 2,359 66.60
30.53 30.55 31.15 2.01 641 2,058 31.15
Time Period
7.65 6.77 7.12 -6.85 168 2,359 7.12
54.76 59.46 60.63 10.71 492 857 57.41
A. Adequate Weight Gain
50.35 50.07 49.27 -2.13 1,014 2,058 49.27B. Excessive Weight Gain
18.38 18.66 19.19 4.43 395 2,058 19.19C. Inadequate Weight Gain
Percentage of infants enrolled in WIC who breastfed at 6 weeks postpartum. (Time Periods: 1st - FY15; 2nd - N/A; 3rd - N/A. Most Recent - FY15) [4]
5.30.04 304 1,012 30.04
Percentage of Medicaid enrolled pregnant women who deliver who receive a postpartum home visit.[3] (Time Periods: 1st - CY10-12; 2nd - N/A; 3rd - CY13-15. Most Recent - CY15)
6.
8.58 7.88 -8.11 88 1,108 7.94
62.89
28.75
48.42
19.51
9.35
73.19
25.14
12.21
[2] Recommended total prenatal weight gain range by prepregnancy weight category is 28-40 lbs. for underweight women (BMI<18.5); 25-35 lbs. for normal weight women (BMI 18.5 to 24.9); 15-25 lbs. for overweight women (BMI 25 to 29.9); and 11-20 lbs. for obese women (BMI>=30).
[4] Due to Crossroads implementation, data are only available for this time period. This page will be updated to include FY16 data when it becomes available. Also, data for counties composing districts are not available.
[1] With the implementation of the 2003 revised US Standard Certificate of Live Birth in NC in August 2010, data on prenatal care initiation and tobacco use prior to 2011 are not comparable.
Data sources for these objectives are as follows: 1, 2, & 3 NC Birth Certificates; 4 NC Automated WIC System matched with Medicaid Processed Claims Report; 5 NC Automated WIC System; and 6 Medicaid Processed Claims Report.
0.74 0.72 0.39 -47.55 8 2,058 0.39D. Unknown Weight Gain 3.32
[3] These data exclude women enrolled in Medicaid only for emergency delivery. 2014 Medicaid match includes data from both legacy WIC and Crossroads WIC System. Effective 2015 Prenatal Medicaid match included only Crossroads WIC data.

Wake County
SFY2017-2018 MATERNAL HEALTH AGREEMENT ADDENDA DATAProcess Outcome Objectives
NC Percent or Rate
Process Outcome Objectives1st
Percentage of women having live births who had adequate prenatal care as defined by Kessner Index. [1] (Time Periods: 1st - CY13; 2nd - CY14; 3rd - CY15. Most Recent - CY15)
1.
2nd 3rd
% Change from 1st period to
3rd period
Most Recent Data
Num DenPercent or Rate
Percentage of Medicaid enrolled pregnant women who deliver who receive prenatal WIC Program services.[3] (Time Periods: 1st - CY07-09; 2nd - CY10-12; 3rd - CY13-15. Most Recent - CY15)
4.
Percentage of women with live term singleton births who gained adequate/excessive/ inadequate weight according to the National Academy of Sciences-Institute of Medicine (IOM) 2009 Recommended Total Weight Gain Ranges during Pregnancy.[2] (Time Periods: 1st - CY13 2nd - CY14; 3rd - CY15. Most Recent - CY15)
2.
Percentage of women having live births who smoked during pregnancy. [1] (Time Periods: 1st - CY13; 2nd - CY14; 3rd - CY15. Most Recent - CY15)
3.
55.49 54.47 60.78 9.55 7,821 12,867 60.78
32.13 30.99 30.97 -3.61 3,494 11,282 30.97
Time Period
3.18 2.79 2.75 -13.58 354 12,867 2.75
68.67 68.98 67.82 -1.24 2,554 3,675 69.50
A. Adequate Weight Gain
45.50 48.34 46.89 3.05 5,290 11,282 46.89B. Excessive Weight Gain
18.71 17.54 17.47 -6.61 1,971 11,282 17.47C. Inadequate Weight Gain
Percentage of infants enrolled in WIC who breastfed at 6 weeks postpartum. (Time Periods: 1st - FY15; 2nd - N/A; 3rd - N/A. Most Recent - FY15) [4]
5.26.18 1,089 4,160 26.18
Percentage of Medicaid enrolled pregnant women who deliver who receive a postpartum home visit.[3] (Time Periods: 1st - CY10-12; 2nd - N/A; 3rd - CY13-15. Most Recent - CY15)
6.
21.46 27.62 28.75 1,355 4,716 28.73
62.89
28.75
48.42
19.51
9.35
73.19
25.14
12.21
[2] Recommended total prenatal weight gain range by prepregnancy weight category is 28-40 lbs. for underweight women (BMI<18.5); 25-35 lbs. for normal weight women (BMI 18.5 to 24.9); 15-25 lbs. for overweight women (BMI 25 to 29.9); and 11-20 lbs. for obese women (BMI>=30).
[4] Due to Crossroads implementation, data are only available for this time period. This page will be updated to include FY16 data when it becomes available. Also, data for counties composing districts are not available.
[1] With the implementation of the 2003 revised US Standard Certificate of Live Birth in NC in August 2010, data on prenatal care initiation and tobacco use prior to 2011 are not comparable.
Data sources for these objectives are as follows: 1, 2, & 3 NC Birth Certificates; 4 NC Automated WIC System matched with Medicaid Processed Claims Report; 5 NC Automated WIC System; and 6 Medicaid Processed Claims Report.
3.66 3.13 4.67 27.47 527 11,282 4.67D. Unknown Weight Gain 3.32
[3] These data exclude women enrolled in Medicaid only for emergency delivery. 2014 Medicaid match includes data from both legacy WIC and Crossroads WIC System. Effective 2015 Prenatal Medicaid match included only Crossroads WIC data.

Warren County
SFY2017-2018 MATERNAL HEALTH AGREEMENT ADDENDA DATAProcess Outcome Objectives
NC Percent or Rate
Process Outcome Objectives1st
Percentage of women having live births who had adequate prenatal care as defined by Kessner Index. [1] (Time Periods: 1st - CY13; 2nd - CY14; 3rd - CY15. Most Recent - CY15)
1.
2nd 3rd
% Change from 1st period to
3rd period
Most Recent Data
Num DenPercent or Rate
Percentage of Medicaid enrolled pregnant women who deliver who receive prenatal WIC Program services.[3] (Time Periods: 1st - CY07-09; 2nd - CY10-12; 3rd - CY13-15. Most Recent - CY15)
4.
Percentage of women with live term singleton births who gained adequate/excessive/ inadequate weight according to the National Academy of Sciences-Institute of Medicine (IOM) 2009 Recommended Total Weight Gain Ranges during Pregnancy.[2] (Time Periods: 1st - CY13 2nd - CY14; 3rd - CY15. Most Recent - CY15)
2.
Percentage of women having live births who smoked during pregnancy. [1] (Time Periods: 1st - CY13; 2nd - CY14; 3rd - CY15. Most Recent - CY15)
3.
44.09 44.44 56.99 29.27 106 186 56.99
25.63 24.68 21.52 -16.02 34 158 21.52
Time Period
15.05 16.16 12.90 -14.29 24 186 12.90
85.78 81.39 82.49 -3.83 131 148 88.51
A. Adequate Weight Gain
51.25 44.30 50.63 -1.20 80 158 50.63B. Excessive Weight Gain
18.13 25.32 25.95 43.17 41 158 25.95C. Inadequate Weight Gain
Percentage of infants enrolled in WIC who breastfed at 6 weeks postpartum. (Time Periods: 1st - FY15; 2nd - N/A; 3rd - N/A. Most Recent - FY15) [4]
5.26.35 39 148 26.35
Percentage of Medicaid enrolled pregnant women who deliver who receive a postpartum home visit.[3] (Time Periods: 1st - CY10-12; 2nd - N/A; 3rd - CY13-15. Most Recent - CY15)
6.
1.10 1.41 28.40 157
62.89
28.75
48.42
19.51
9.35
73.19
25.14
12.21
[2] Recommended total prenatal weight gain range by prepregnancy weight category is 28-40 lbs. for underweight women (BMI<18.5); 25-35 lbs. for normal weight women (BMI 18.5 to 24.9); 15-25 lbs. for overweight women (BMI 25 to 29.9); and 11-20 lbs. for obese women (BMI>=30).
[4] Due to Crossroads implementation, data are only available for this time period. This page will be updated to include FY16 data when it becomes available. Also, data for counties composing districts are not available.
[1] With the implementation of the 2003 revised US Standard Certificate of Live Birth in NC in August 2010, data on prenatal care initiation and tobacco use prior to 2011 are not comparable.
Data sources for these objectives are as follows: 1, 2, & 3 NC Birth Certificates; 4 NC Automated WIC System matched with Medicaid Processed Claims Report; 5 NC Automated WIC System; and 6 Medicaid Processed Claims Report.
5.00 5.70 1.90 -62.03 3 158 1.90D. Unknown Weight Gain 3.32
[3] These data exclude women enrolled in Medicaid only for emergency delivery. 2014 Medicaid match includes data from both legacy WIC and Crossroads WIC System. Effective 2015 Prenatal Medicaid match included only Crossroads WIC data.

Wayne County
SFY2017-2018 MATERNAL HEALTH AGREEMENT ADDENDA DATAProcess Outcome Objectives
NC Percent or Rate
Process Outcome Objectives1st
Percentage of women having live births who had adequate prenatal care as defined by Kessner Index. [1] (Time Periods: 1st - CY13; 2nd - CY14; 3rd - CY15. Most Recent - CY15)
1.
2nd 3rd
% Change from 1st period to
3rd period
Most Recent Data
Num DenPercent or Rate
Percentage of Medicaid enrolled pregnant women who deliver who receive prenatal WIC Program services.[3] (Time Periods: 1st - CY07-09; 2nd - CY10-12; 3rd - CY13-15. Most Recent - CY15)
4.
Percentage of women with live term singleton births who gained adequate/excessive/ inadequate weight according to the National Academy of Sciences-Institute of Medicine (IOM) 2009 Recommended Total Weight Gain Ranges during Pregnancy.[2] (Time Periods: 1st - CY13 2nd - CY14; 3rd - CY15. Most Recent - CY15)
2.
Percentage of women having live births who smoked during pregnancy. [1] (Time Periods: 1st - CY13; 2nd - CY14; 3rd - CY15. Most Recent - CY15)
3.
62.38 59.93 56.75 -9.03 925 1,630 56.75
28.80 31.11 29.63 2.88 416 1,404 29.63
Time Period
10.15 9.73 10.43 2.73 170 1,630 10.43
77.03 73.03 74.12 -3.77 675 912 74.01
A. Adequate Weight Gain
48.64 46.93 44.66 -8.19 627 1,404 44.66B. Excessive Weight Gain
21.83 21.75 25.21 15.49 354 1,404 25.21C. Inadequate Weight Gain
Percentage of infants enrolled in WIC who breastfed at 6 weeks postpartum. (Time Periods: 1st - FY15; 2nd - N/A; 3rd - N/A. Most Recent - FY15) [4]
5.10.17 116 1,141 10.17
Percentage of Medicaid enrolled pregnant women who deliver who receive a postpartum home visit.[3] (Time Periods: 1st - CY10-12; 2nd - N/A; 3rd - CY13-15. Most Recent - CY15)
6.
22.41 23.50 4.85 250 1,082 23.11
62.89
28.75
48.42
19.51
9.35
73.19
25.14
12.21
[2] Recommended total prenatal weight gain range by prepregnancy weight category is 28-40 lbs. for underweight women (BMI<18.5); 25-35 lbs. for normal weight women (BMI 18.5 to 24.9); 15-25 lbs. for overweight women (BMI 25 to 29.9); and 11-20 lbs. for obese women (BMI>=30).
[4] Due to Crossroads implementation, data are only available for this time period. This page will be updated to include FY16 data when it becomes available. Also, data for counties composing districts are not available.
[1] With the implementation of the 2003 revised US Standard Certificate of Live Birth in NC in August 2010, data on prenatal care initiation and tobacco use prior to 2011 are not comparable.
Data sources for these objectives are as follows: 1, 2, & 3 NC Birth Certificates; 4 NC Automated WIC System matched with Medicaid Processed Claims Report; 5 NC Automated WIC System; and 6 Medicaid Processed Claims Report.
0.73 0.20 0.50 -31.70 7 1,404 0.50D. Unknown Weight Gain 3.32
[3] These data exclude women enrolled in Medicaid only for emergency delivery. 2014 Medicaid match includes data from both legacy WIC and Crossroads WIC System. Effective 2015 Prenatal Medicaid match included only Crossroads WIC data.

Wilkes County
SFY2017-2018 MATERNAL HEALTH AGREEMENT ADDENDA DATAProcess Outcome Objectives
NC Percent or Rate
Process Outcome Objectives1st
Percentage of women having live births who had adequate prenatal care as defined by Kessner Index. [1] (Time Periods: 1st - CY13; 2nd - CY14; 3rd - CY15. Most Recent - CY15)
1.
2nd 3rd
% Change from 1st period to
3rd period
Most Recent Data
Num DenPercent or Rate
Percentage of Medicaid enrolled pregnant women who deliver who receive prenatal WIC Program services.[3] (Time Periods: 1st - CY07-09; 2nd - CY10-12; 3rd - CY13-15. Most Recent - CY15)
4.
Percentage of women with live term singleton births who gained adequate/excessive/ inadequate weight according to the National Academy of Sciences-Institute of Medicine (IOM) 2009 Recommended Total Weight Gain Ranges during Pregnancy.[2] (Time Periods: 1st - CY13 2nd - CY14; 3rd - CY15. Most Recent - CY15)
2.
Percentage of women having live births who smoked during pregnancy. [1] (Time Periods: 1st - CY13; 2nd - CY14; 3rd - CY15. Most Recent - CY15)
3.
75.04 69.53 72.46 -3.43 521 719 72.46
33.15 27.35 29.30 -11.63 179 611 29.30
Time Period
18.91 19.68 19.47 2.94 140 719 19.47
81.06 77.73 79.65 -1.74 383 477 80.29
A. Adequate Weight Gain
44.69 46.62 46.81 4.74 286 611 46.81B. Excessive Weight Gain
21.43 25.37 23.08 7.69 141 611 23.08C. Inadequate Weight Gain
Percentage of infants enrolled in WIC who breastfed at 6 weeks postpartum. (Time Periods: 1st - FY15; 2nd - N/A; 3rd - N/A. Most Recent - FY15) [4]
5.33.19 154 464 33.19
Percentage of Medicaid enrolled pregnant women who deliver who receive a postpartum home visit.[3] (Time Periods: 1st - CY10-12; 2nd - N/A; 3rd - CY13-15. Most Recent - CY15)
6.
31.75 14.37 -54.73 102 521 19.58
62.89
28.75
48.42
19.51
9.35
73.19
25.14
12.21
[2] Recommended total prenatal weight gain range by prepregnancy weight category is 28-40 lbs. for underweight women (BMI<18.5); 25-35 lbs. for normal weight women (BMI 18.5 to 24.9); 15-25 lbs. for overweight women (BMI 25 to 29.9); and 11-20 lbs. for obese women (BMI>=30).
[4] Due to Crossroads implementation, data are only available for this time period. This page will be updated to include FY16 data when it becomes available. Also, data for counties composing districts are not available.
[1] With the implementation of the 2003 revised US Standard Certificate of Live Birth in NC in August 2010, data on prenatal care initiation and tobacco use prior to 2011 are not comparable.
Data sources for these objectives are as follows: 1, 2, & 3 NC Birth Certificates; 4 NC Automated WIC System matched with Medicaid Processed Claims Report; 5 NC Automated WIC System; and 6 Medicaid Processed Claims Report.
0.73 0.66 0.82 11.70 5 611 0.82D. Unknown Weight Gain 3.32
[3] These data exclude women enrolled in Medicaid only for emergency delivery. 2014 Medicaid match includes data from both legacy WIC and Crossroads WIC System. Effective 2015 Prenatal Medicaid match included only Crossroads WIC data.

Wilson County
SFY2017-2018 MATERNAL HEALTH AGREEMENT ADDENDA DATAProcess Outcome Objectives
NC Percent or Rate
Process Outcome Objectives1st
Percentage of women having live births who had adequate prenatal care as defined by Kessner Index. [1] (Time Periods: 1st - CY13; 2nd - CY14; 3rd - CY15. Most Recent - CY15)
1.
2nd 3rd
% Change from 1st period to
3rd period
Most Recent Data
Num DenPercent or Rate
Percentage of Medicaid enrolled pregnant women who deliver who receive prenatal WIC Program services.[3] (Time Periods: 1st - CY07-09; 2nd - CY10-12; 3rd - CY13-15. Most Recent - CY15)
4.
Percentage of women with live term singleton births who gained adequate/excessive/ inadequate weight according to the National Academy of Sciences-Institute of Medicine (IOM) 2009 Recommended Total Weight Gain Ranges during Pregnancy.[2] (Time Periods: 1st - CY13 2nd - CY14; 3rd - CY15. Most Recent - CY15)
2.
Percentage of women having live births who smoked during pregnancy. [1] (Time Periods: 1st - CY13; 2nd - CY14; 3rd - CY15. Most Recent - CY15)
3.
60.98 55.13 57.05 -6.44 554 971 57.05
28.04 27.81 28.05 0.03 230 820 28.05
Time Period
11.19 10.68 8.86 -20.88 86 971 8.86
84.30 83.62 80.43 -4.59 477 606 78.71
A. Adequate Weight Gain
47.89 47.74 41.71 -12.91 342 820 41.71B. Excessive Weight Gain
23.05 23.67 29.51 28.05 242 820 29.51C. Inadequate Weight Gain
Percentage of infants enrolled in WIC who breastfed at 6 weeks postpartum. (Time Periods: 1st - FY15; 2nd - N/A; 3rd - N/A. Most Recent - FY15) [4]
5.15.42 101 655 15.42
Percentage of Medicaid enrolled pregnant women who deliver who receive a postpartum home visit.[3] (Time Periods: 1st - CY10-12; 2nd - N/A; 3rd - CY13-15. Most Recent - CY15)
6.
5.60 2.10 -62.50 724
62.89
28.75
48.42
19.51
9.35
73.19
25.14
12.21
[2] Recommended total prenatal weight gain range by prepregnancy weight category is 28-40 lbs. for underweight women (BMI<18.5); 25-35 lbs. for normal weight women (BMI 18.5 to 24.9); 15-25 lbs. for overweight women (BMI 25 to 29.9); and 11-20 lbs. for obese women (BMI>=30).
[4] Due to Crossroads implementation, data are only available for this time period. This page will be updated to include FY16 data when it becomes available. Also, data for counties composing districts are not available.
[1] With the implementation of the 2003 revised US Standard Certificate of Live Birth in NC in August 2010, data on prenatal care initiation and tobacco use prior to 2011 are not comparable.
Data sources for these objectives are as follows: 1, 2, & 3 NC Birth Certificates; 4 NC Automated WIC System matched with Medicaid Processed Claims Report; 5 NC Automated WIC System; and 6 Medicaid Processed Claims Report.
1.02 0.78 0.73 -28.57 6 820 0.73D. Unknown Weight Gain 3.32
[3] These data exclude women enrolled in Medicaid only for emergency delivery. 2014 Medicaid match includes data from both legacy WIC and Crossroads WIC System. Effective 2015 Prenatal Medicaid match included only Crossroads WIC data.

Yadkin County
SFY2017-2018 MATERNAL HEALTH AGREEMENT ADDENDA DATAProcess Outcome Objectives
NC Percent or Rate
Process Outcome Objectives1st
Percentage of women having live births who had adequate prenatal care as defined by Kessner Index. [1] (Time Periods: 1st - CY13; 2nd - CY14; 3rd - CY15. Most Recent - CY15)
1.
2nd 3rd
% Change from 1st period to
3rd period
Most Recent Data
Num DenPercent or Rate
Percentage of Medicaid enrolled pregnant women who deliver who receive prenatal WIC Program services.[3] (Time Periods: 1st - CY07-09; 2nd - CY10-12; 3rd - CY13-15. Most Recent - CY15)
4.
Percentage of women with live term singleton births who gained adequate/excessive/ inadequate weight according to the National Academy of Sciences-Institute of Medicine (IOM) 2009 Recommended Total Weight Gain Ranges during Pregnancy.[2] (Time Periods: 1st - CY13 2nd - CY14; 3rd - CY15. Most Recent - CY15)
2.
Percentage of women having live births who smoked during pregnancy. [1] (Time Periods: 1st - CY13; 2nd - CY14; 3rd - CY15. Most Recent - CY15)
3.
75.94 68.33 59.07 -22.22 228 386 59.07
29.36 27.87 27.27 -7.11 93 341 27.27
Time Period
18.30 16.42 12.95 -29.20 50 386 12.95
73.81 77.15 73.57 -0.32 159 216 73.61
A. Adequate Weight Gain
44.19 48.52 49.56 12.16 169 341 49.56B. Excessive Weight Gain
22.09 19.02 17.89 -19.03 61 341 17.89C. Inadequate Weight Gain
Percentage of infants enrolled in WIC who breastfed at 6 weeks postpartum. (Time Periods: 1st - FY15; 2nd - N/A; 3rd - N/A. Most Recent - FY15) [4]
5.30.88 67 217 30.88
Percentage of Medicaid enrolled pregnant women who deliver who receive a postpartum home visit.[3] (Time Periods: 1st - CY10-12; 2nd - N/A; 3rd - CY13-15. Most Recent - CY15)
6.
254
62.89
28.75
48.42
19.51
9.35
73.19
25.14
12.21
[2] Recommended total prenatal weight gain range by prepregnancy weight category is 28-40 lbs. for underweight women (BMI<18.5); 25-35 lbs. for normal weight women (BMI 18.5 to 24.9); 15-25 lbs. for overweight women (BMI 25 to 29.9); and 11-20 lbs. for obese women (BMI>=30).
[4] Due to Crossroads implementation, data are only available for this time period. This page will be updated to include FY16 data when it becomes available. Also, data for counties composing districts are not available.
[1] With the implementation of the 2003 revised US Standard Certificate of Live Birth in NC in August 2010, data on prenatal care initiation and tobacco use prior to 2011 are not comparable.
Data sources for these objectives are as follows: 1, 2, & 3 NC Birth Certificates; 4 NC Automated WIC System matched with Medicaid Processed Claims Report; 5 NC Automated WIC System; and 6 Medicaid Processed Claims Report.
4.36 4.59 5.28 21.06 18 341 5.28D. Unknown Weight Gain 3.32
[3] These data exclude women enrolled in Medicaid only for emergency delivery. 2014 Medicaid match includes data from both legacy WIC and Crossroads WIC System. Effective 2015 Prenatal Medicaid match included only Crossroads WIC data.

North Carolina
SFY2017-2018 MATERNAL HEALTH AGREEMENT ADDENDA DATAProcess Outcome Objectives
Process Outcome Objectives1st
Percentage of women having live births who had adequate prenatal care as defined by Kessner Index. [1] (Time Periods: 1st - CY13; 2nd - CY14; 3rd - CY15. Most Recent - CY15)
1.
2nd 3rd
% Change from 1st period to
3rd period
Most Recent Data
Num DenPercent or Rate
Percentage of Medicaid enrolled pregnant women who deliver who receive prenatal WIC Program services.[3] (Time Periods: 1st - CY07-09; 2nd - CY10-12; 3rd - CY13-15. Most Recent - CY15)
4.
Percentage of women with live term singleton births who gained adequate/excessive/ inadequate weight according to the National Academy of Sciences-Institute of Medicine (IOM) 2009 Recommended Total Weight Gain Ranges during Pregnancy.[2] (Time Periods: 1st - CY13 2nd - CY14; 3rd - CY15. Most Recent - CY15)
2.
Percentage of women having live births who smoked during pregnancy. [1] (Time Periods: 1st - CY13; 2nd - CY14; 3rd - CY15. Most Recent - CY15)
3.
64.17 62.04 62.89 -2.00 75,984 120,826 62.89
29.24 29.26 28.75 -1.70 30,040 104,501 28.75
Time Period
10.29 9.84 9.35 -9.13 11,297 120,826 9.35
71.39 71.53 72.76 1.91 42,516 58,086 73.19
A. Adequate Weight Gain
47.91 48.53 48.42 1.05 50,597 104,501 48.42B. Excessive Weight Gain
19.37 19.42 19.51 0.75 20,392 104,501 19.51C. Inadequate Weight Gain
Percentage of infants enrolled in WIC who breastfed at 6 weeks postpartum. (Time Periods: 1st - FY15; 2nd - N/A; 3rd - N/A. Most Recent - FY15) [4]
5.25.14 16,449 65,434 25.14
Percentage of Medicaid enrolled pregnant women who deliver who receive a postpartum home visit.[3] (Time Periods: 1st - CY10-12; 2nd - N/A; 3rd - CY13-15. Most Recent - CY15)
6.
12.19 11.79 -3.31 8,315 68,077 12.21
3.48 2.79 3.32 -4.41 3,472 104,501 3.32D. Unknown Weight Gain
[2] Recommended total prenatal weight gain range by prepregnancy weight category is 28-40 lbs. for underweight women (BMI<18.5); 25-35 lbs. for normal weight women (BMI 18.5 to 24.9); 15-25 lbs. for overweight women (BMI 25 to 29.9); and 11-20 lbs. for obese women (BMI>=30).
[4] Due to Crossroads implementation, data are only available for this time period. This page will be updated to include FY16 data when it becomes available. Also, data for counties composing districts are not available.
[1] With the implementation of the 2003 revised US Standard Certificate of Live Birth in NC in August 2010, data on prenatal care initiation and tobacco use prior to 2011 are not comparable.
Data sources for these objectives are as follows: 1, 2, & 3 NC Birth Certificates; 4 NC Automated WIC System matched with Medicaid Processed Claims Report; 5 NC Automated WIC System; and 6 Medicaid Processed Claims Report.
[3] These data exclude women enrolled in Medicaid only for emergency delivery. 2014 Medicaid match includes data from both legacy WIC and Crossroads WIC System. Effective 2015 Prenatal Medicaid match included only Crossroads WIC data.