Process Monitoring of Resistance Spot Welding Using … the Dynamic Resistance Signature ... contact...
10
Introduction Resistance spot welding (RSW) is a ubiquitous joining technique for pro- ducing sheet metal parts. The short cy- cle time, lack of consumables, and suit- ability for automation have made RSW a mainstay in the automotive industry. With an estimated 4000–6000 welds in new vehicles (Ref. 1), the quality of spot welds is critical to the structural integrity and safety of the car. Quality monitoring of these spot welds is, therefore, of high importance with the emphasis placed on passenger safety in industry. The assurance of quality in RSW processes remains a challenge in industry as welds cannot be easily inspected. Quality testing of resistance spot welds is typically divid- ed into two categories: destructive and nondestructive testing. Both destruc- tive and nondestructive testing of parts are expensive and time consum- ing, with destructive testing directly reducing the output of production. As such, destructive and nondestructive testing cannot be performed on every part and so the quality of all welds in production is not known (Ref. 2). To alleviate the risks posed by an individual faulty weld, auto manufac- turers use additional welds to ensure the strength of their vehicles, with up to 30% of all spot welds redundant (Ref. 1). This inefficient practice amounts to significant increases in production time and costs, creating a strong driver for the development of better methods for quality assurance and control. In RSW, signals related to the weld- ing process can be used to infer the quality of the weld. This reduces the need for off-line destructive and non- destructive testing in industry. Many measured signals in RSW have been related to weld quality for quality monitoring purposes including dy- namic resistance (Refs. 3–6), electrode displacement (Refs. 7–9), electrode force (Ref. 10), acoustic and sonic emissions (Ref. 11), and electrical im- pedance (Ref. 12). However, robust signal-based quality monitoring meth- ods are difficult to achieve in RSW due to the constantly changing variables such as material properties, welding geometries, and electrode condition. Signal-based quality monitoring techniques in RSW are not often equipped with the ability to detect when a process has fallen out of con- trol, or to diagnose the causes of poor quality welds. Monitoring quality and process control with fault diagnostics allows for a greater understanding of the causes of poor quality and the state of the system. To produce such a system in RSW signal analysis that in- corporates fault detection, in-line weld quality assessment, identification of the variables responsible for a fault, and the diagnosis of the specific cause of the fault is required. This paper WELDING RESEARCH NOVEMBER 2017 / WELDING JOURNAL 403-s SUPPLEMENT TO THE WELDING JOURNAL, NOVEMBER 2017 Sponsored by the American Welding Society and the Welding Research Council Process Monitoring of Resistance Spot Welding Using the Dynamic Resistance Signature A technique was developed that allows for complete monitoring of the spot welding process including weld strength and electrode tip wear BY C. D. E. SUMMERVILLE, D. ADAMS, P. COMPSTON, AND M. DOOLAN ABSTRACT The quality of resistance spot welds used to manufacture automobiles is critical to their safety. Monitoring of spot welds during production is, therefore, a high priority for ensuring quality control. Interactions between the mechanical, thermal, and electrical processes involved in resistance spot welding (RSW) make the prediction of weld quality difficult. This complexity is confounded by the changing process variables in RSW that must be monitored in-process to monitor the quality of spot welds, such as electrode wear, physical setup, and surface contamination. This paper presents a complete process monitoring method for RSW, including models for weld quality and process condition. Information is extracted from the dynamic resistance signature (DRS) collected during welding. The method allows for quick, in-line detection of faults, identification of the responsible variables, and diagnosis of the cause of the abnormal behavior without requiring parts to be removed from the production line. KEYWORDS • Resistance Spot Welding • Process Monitoring • Quality Monitoring • Joining Technologies • Principal Component Analysis
Transcript of Process Monitoring of Resistance Spot Welding Using … the Dynamic Resistance Signature ... contact...

Introduction Resistance spot welding (RSW) is aubiquitous joining technique for pro-ducing sheet metal parts. The short cy-cle time, lack of consumables, and suit-ability for automation have made RSWa mainstay in the automotive industry.With an estimated 4000–6000 welds innew vehicles (Ref. 1), the quality ofspot welds is critical to the structuralintegrity and safety of the car. Quality monitoring of these spotwelds is, therefore, of high importancewith the emphasis placed on passengersafety in industry. The assurance ofquality in RSW processes remains achallenge in industry as welds cannot
be easily inspected. Quality testing ofresistance spot welds is typically divid-ed into two categories: destructive andnondestructive testing. Both destruc-tive and nondestructive testing ofparts are expensive and time consum-ing, with destructive testing directlyreducing the output of production. Assuch, destructive and nondestructivetesting cannot be performed on everypart and so the quality of all welds inproduction is not known (Ref. 2). To alleviate the risks posed by anindividual faulty weld, auto manufac-turers use additional welds to ensurethe strength of their vehicles, with upto 30% of all spot welds redundant(Ref. 1). This inefficient practice
amounts to significant increases inproduction time and costs, creating astrong driver for the development ofbetter methods for quality assuranceand control. In RSW, signals related to the weld-ing process can be used to infer thequality of the weld. This reduces theneed for off-line destructive and non-destructive testing in industry. Manymeasured signals in RSW have beenrelated to weld quality for qualitymonitoring purposes including dy-namic resistance (Refs. 3–6), electrodedisplacement (Refs. 7–9), electrodeforce (Ref. 10), acoustic and sonicemissions (Ref. 11), and electrical im-pedance (Ref. 12). However, robustsignal-based quality monitoring meth-ods are difficult to achieve in RSW dueto the constantly changing variablessuch as material properties, weldinggeometries, and electrode condition. Signal-based quality monitoringtechniques in RSW are not oftenequipped with the ability to detectwhen a process has fallen out of con-trol, or to diagnose the causes of poorquality welds. Monitoring quality andprocess control with fault diagnosticsallows for a greater understanding ofthe causes of poor quality and thestate of the system. To produce such asystem in RSW signal analysis that in-corporates fault detection, in-line weldquality assessment, identification ofthe variables responsible for a fault,and the diagnosis of the specific causeof the fault is required. This paper
WELDING RESEARCH
NOVEMBER 2017 / WELDING JOURNAL 403-s
SUPPLEMENT TO THE WELDING JOURNAL, NOVEMBER 2017Sponsored by the American Welding Society and the Welding Research Council
Process Monitoring of Resistance Spot WeldingUsing the Dynamic Resistance SignatureA technique was developed that allows for complete monitoring of the spot welding process including weld strength and electrode tip wear
BY C. D. E. SUMMERVILLE, D. ADAMS, P. COMPSTON, AND M. DOOLAN
ABSTRACT The quality of resistance spot welds used to manufacture automobiles is critical totheir safety. Monitoring of spot welds during production is, therefore, a high priority forensuring quality control. Interactions between the mechanical, thermal, and electricalprocesses involved in resistance spot welding (RSW) make the prediction of weld qualitydifficult. This complexity is confounded by the changing process variables in RSW thatmust be monitored inprocess to monitor the quality of spot welds, such as electrodewear, physical setup, and surface contamination. This paper presents a complete process monitoring method for RSW, including modelsfor weld quality and process condition. Information is extracted from the dynamic resistancesignature (DRS) collected during welding. The method allows for quick, inline detection offaults, identification of the responsible variables, and diagnosis of the cause of the abnormalbehavior without requiring parts to be removed from the production line.
KEYWORDS • Resistance Spot Welding • Process Monitoring • Quality Monitoring • Joining Technologies • Principal Component Analysis
Summerville Paper 201706 November 2017.qxp_Layout 1 10/10/17 4:59 PM Page 403

presents a process monitoring methodusing information drawn from the dy-namic resistance signature (DRS). The process monitoring techniquepresented is combined with the abilityto predict the quality of each weld andstate of the welding system in-line,without requiring parts to be removedfrom the production line. Analysisconducted in this manner allows forthe following: 1. A potential fault to be identifiedin real time from the dynamic resist-ance signature, 2. The quality of both faulty andnormal welds to be reliably checked byinferring the weld strength from thedynamic resistance signature, 3. Further analysis into the cause ofa fault by calculating the electrode-tipcontact area used to create the weldfrom the dynamic resistance signature.
Background Effective process monitoring tech-niques aim to understand the state ofcontrol of a given process, by monitor-ing the variables in the system oftenthrough the use of control charts (Ref.13). Successful process monitoringtechniques are characterized by severalproperties discussed in the literature(Ref. 14): • Fault detection/detection of out-of-
control status,• Identification of responsible
variables,• Diagnosis of the cause of abnormal
behavior. Process monitoring techniques
have been successfully applied in manymanufacturing processes to detect,identify the responsible variables, anddiagnose the causes of faults, giving abetter understanding of the outputand the variables that are changing inthe process. Specific examples ofprocess monitoring in manufacturinginclude the thermal annealing processin semiconductor manufacture inwhich a new recursive principal com-ponent analysis (PCA) technique wasdeveloped (Ref. 15) and a multiblockprojection to latent structures methodwas applied to the manufacture of low-density polyethylene (Ref. 16). A number of potential faults can oc-cur in resistance spot welding andhave been studied in the literature, in-cluding electrode misalignment (Ref.17), shunting (Ref. 18), part gap, and
surface contamination (Ref. 19). Thesespecific studies do not include faults inweld quality monitoring techniques. In RSW, process monitoring tech-niques were applied to assess electrodedisplacement curves detecting highelectrode wear and expulsion during awelding operation (Ref. 20). Expulsionmonitoring in RSW (a form of processmonitoring) has reached maturity dueto the significant effects on a numberof the available signals (Ref. 21) andthe potentially undesirable effects onsurface finish. Expulsion monitoringin RSW has met two of the three crite-ria above using various signatures todetect and identify expulsion (Refs.21, 22). However, this informationwas not used to diagnose the causes ofchanging behavior in the spot weldingprocess. Although expulsion monitor-
WELDING RESEARCH
WELDING JOURNAL / NOVEMBER 2017, VOL. 96404-s
Fig. 1 — Welding setup schematic. Fig. 2 — Electrode dimensions.
Fig. 3 — Misalignment of electrode tips to replicate poor part alignment.
Summerville Paper 201706 November 2017.qxp_Layout 1 10/10/17 4:59 PM Page 404

ing has reached maturity in RSW, thepresence or absence of expulsion can-not be used as a sole metric for weldquality. As such, further work in theapplication of process monitoring toRSW is required to ensure that everyweld produced is of acceptable quality. A number of signal-based weldquality prediction techniques havebeen developed in the RSW field usingmore definitive quality metrics. Amethod for predicting joint strengthfrom the dynamic resistance and elec-trode displacement was developed byLee et al., in which signature featureswere passed through a fuzzy neuralnetwork (Ref. 23). A similar methodwas developed using an artificial neu-ral network and the input electricalimpedance to classify the tensilestrength of spot welds and detect ex-pulsion in welding (Ref. 12). Althoughboth systems were capable of detect-ing expulsion from the signatures, akey process monitoring attribute, theydid not allow for diagnosis of the caus-es of poor quality welds. For the application of process mon-itoring techniques in resistance spotwelding, there are a number of impor-tant variables that require careful con-sideration. These include electrodetemperature, electrode-tip contactarea, electrode-part alignment, mate-rial properties, and surface conditionand contamination (Refs. 2, 24), all ofwhich can be strongly linked to theelectrode-workpiece interface. Assuch, the electrode-tip area is identi-fied as an important variable, govern-ing the final quality of the weld, mak-
ing it important to monitor for identi-fying the variables responsible for afault and diagnosing the cause in aspot welding process (Ref. 25). The electrode-tip area is greatly af-fected by electrode wear, which in turnchanges the current density deliveredto the workpiece. However, measuringelectrode-tip wear in-line is difficult,with suggested methods ranging fromelectrode imaging, requiring addition-al apparatus to be attached to thewelding machine (Ref. 26), to assess-ment of carbon paper imprints that in-crease welding cycle times (Ref. 27). To monitor both the quality of theweld and the state of the welding sys-tem in-line, careful signal selection isrequired. The dynamic resistance is di-rectly related to the electrode-tip areathrough the electrode-sheet interface,and has been shown to be useful inpredicting the quality of the weld. Thedynamic resistance is also inherentlyeasy to measure with most modernweld controllers measuring it by de-fault. All these factors make the dy-namic resistance an ideal signal forprocess monitoring, with the addedbenefits of being able to assess boththe quality of the weld, and the condi-tion of the electrode-part interface,which changes with electrode-tip wear. To address the criteria of an effec-tive process monitoring technique, ap-plicable to resistance spot welding,this paper presents a method for mon-itoring the spot welding process by an-alyzing the DRS. To analyze the resist-ance signatures, Principal ComponentAnalysis (PCA) is used to represent the
major components of variation of a setof DRSs, allowing for extraction of thevariation most relevant for processmonitoring purposes. In addition, theinformation extracted is utilized topredict the tensile strength and elec-trode-tip contact area of each weld in-line, allowing for the quality of theweld and the state of the welding sys-tem to be monitored as well. This com-bined approach allows for completemonitoring of RSW by monitoring thequality of the welds produced, as wellas the three key aspects ofan effective process monitoringtechnique:• Fault detection using features of thedynamic resistance signature fromPCA
• Identification of the variablesresponsible for a fault throughelectrode-tip condition monitoringfrom the PCA results
• Diagnosis of the cause of theabnormal behavior throughelectrode-tip condition monitoring.
With these features, the monitor-ing technique can reduce the need fortrained ultrasound technicians to testspot welds for quality control. With anincreased confidence in the quality ofthe welds produced, car designs can bemade more efficient with fewer redun-dant welds, reducing manufacturingtime and increasing profit.
MethodExperimental Procedure
To evaluate the process monitoring
WELDING RESEARCH
NOVEMBER 2017 / WELDING JOURNAL 405-s
Fig. 4 — Example of dynamic resistance signatures. Fig. 5 — Signature set alignment.
Summerville Paper 201706 November 2017.qxp_Layout 1 10/10/17 4:59 PM Page 405

technique outlined above, two sets ofwelds were created, each allowing theelectrode tips to wear (without re-dressing) over the course of approxi-mately 170 welds. At this point, thewelding system began to producewelds with no fusion, denoting theend of electrode life without tip dress-ing or current stepping. The weldingparameters of electrode-tip face diam-eter and force that produced accept-able quality welds were experimentallydetermined for the specific weldingmachine used in this study. The weld-ing parameters chosen, notably elec-trode force and tip face diameter, alsoproduced accelerated electrode wearthat could be monitored using theprocess monitoring technique devel-oped. The strength of all welds wasabove the minimum shear strength forthe material thickness as stated by theAmerican Welding Society WeldingHandbook (Ref. 28). The first set of 170 welds was usedas a training set to define the principalcomponent matrix for PCA (referredto as the ‘training set’ from here onin). The second set of 170 welds (re-ferred to as the ‘validation set’) weremonitored using relationships deter-mined from the training data. As a proof of concept and to assessthe ability of the process monitoringtechnique to deal with unknownfaults, a single fault was introduced inthe validation set in the form of 13welds with misaligned electrodes (set-up shown in Fig. 2). Each of the 13welds were performed with the sheetmisaligned by 10 deg from the elec-trodes to simulate poor part alignment
in a productionenvironment
that could be caused by either a weld-ing operator error or poor setup in anautomated line. The misaligned speci-mens were introduced to the valida-tion set with the intention of creatingfaults in the process for developmentof fault diagnosis. It should be notedthat this fault data was not included inthe training set to test whether themethod presented could identify faultsoutside its training data for robust-ness and generality. Welds were created on 0.6-mm hot-dipped zinc-coated steel (Zincanneal®G2S) with a chemical composition of0.1% C, 0.025% P, 0.45% Mn, and0.03% S. The welding machine usedwas a single-phase, 3-kVA AC machinerunning at 50 Hz and a 100% firingangle, controlled by a simple digitalweld timer (shown in Fig. 1). Eachweld series was started with new elec-trode tips (made from Copper 101 Al-loy) with 2.4-mm electrode tip face di-ameters (shown in Fig. 2). Each weldwas created using 3-kA RMS, with anelectrode tip force of 162 N, over 25cycles of a 50-Hz wave. Magnetic noisein the voltage data was reduced by us-ing equal length, twisted pair voltagesensing wires that were attached tothe electrodes for good electrical con-tact (Ref. 29). During each weld, AC voltage andcurrent in the welding machine’s sec-ondary circuit were measured at asampling rate of 1000 Hz. To calcu-late dynamic resistance, the absolutevalue of both signals was calculated,and peak values were used to calcu-late the resistance at each half cycleusing Ohm’s Law. The inductive
phase shift between the current andvoltage was accounted for by takingthe peaks of each AC signal to calcu-late the dynamic resistance, as this isthe point in the signal with zero rateof change of current, and thus no in-ductive component (Ref. 29). Eachdynamic resistance signature is thenrepresented as a vector of 50 points,one for the resistance at each half cycle. Examples of the DRS in this studyare shown in Fig. 4. There was a no-table lack in secondary peak (or betapeak) as found in other studies (Refs.30, 31). This is due to the low bulk andinterface resistances of the thin zinc-coated material. The result is minimalchanges in resistance due to the in-crease in resistivity with temperature,which explains the absence of a promi-nent beta-peak (Ref. 32). After each weld, the electrode-tipcontact area was measured by taking atip imprint in carbon paper for use inthe models produced later. Each weldwas then destructively tested in a lap-shear test in an Instron 5500r univer-sal tensile testing machine, at a testingrate of 3 mm/min. Peak force duringthis test was recorded as a value forweld strength.
Analysis Method
To monitor the spot weldingprocess from the DRS, first the dimen-sionality of the signature set is re-duced using PCA. Given that PCA re-states the data in order of highest vari-ance, the results are particularly usefulfor efficiently monitoring the process.In addition, these features can also beused to monitor specific outputs such
WELDING RESEARCH
WELDING JOURNAL / NOVEMBER 2017, VOL. 96406-s
Fig. 6 — Measured electrode contact area.
Fig. 7 — Measured weld strength values.
Summerville Paper 201706 November 2017.qxp_Layout 1 10/10/17 4:59 PM Page 406
as the weld strength and electrode-tipcontact area as will be shown below. To determine which parts of the DRSare important for predicting the out-puts, a two-stage process is employed.First, features of the signatures are ex-tracted using PCA, then Pearson corre-lation coefficients (Ref. 33) are calculat-ed between these features and the weldstrength (a measure of quality) (Ref.34), and electrode-tip condition (thestate of the welding system). The level of each signature compo-nent in a particular DRS is given bythe signature’s principal componentscore vector bi, shown in Equation 1.
where P+ is the pseudo-inverse of theprincipal component matrix, xi is anyDRS from the set X, and X is the meansignature of X. Variations in the signa-tures that vary along the principal com-ponents with minute eigenvalues (smallvariance) can be removed without sig-nificant loss of information. Efficientprocess monitoring of individual weldscan be achieved once the matrix P is de-fined in training with computationalcomplexity of O(n2) where P is an n × nmatrix and bi is an n × 1 matrix.
Modeling the Welding Processfrom the DRS
Once the signature componentssignificantly correlated to an output
variable are determined, the relationbetween each of those signature com-ponents and the output variable canbe approximated using stepwise linearregression with interactions. The gen-eral case for the model equation forweld strength, if principal componentsm and n were found to be significantlycorrelated to weld strength, would be:
Si = Tbm,i + Ubn,i + V(bm,i bn,i) + W (2)
where Si is the strength of weld i (inNewtons), and T, U, V, and W are coef-ficients determined through stepwiselinear regression. While bm,i and bn,i areprincipal component scores of the mth
and nth principal components for a par-ticular resistance signature xi. To use the models created for moni-toring future welds, principal compo-nent score vectors b can be calculatedfor any resistance signature (xi) of thesame length, using the principal com-ponent matrix, P, and the mean signa-ture of the training set, X. Values for weld strength and elec-trode tip contact area can then be cal-culated for subsequent welds using themodels from the training data and thecalculated b. This allows for monitor-ing of the state of process control fromcontrol charts, monitoring of weldquality, and fault identification and diagnosis from monitoring the electrode-tip area from the dynamicresistance signatures alone.
Accounting for ElectrodeTipChanges
To account for any differences inthe average signature height of thetwo sets (which can occur when chang-ing electrodes), the difference betweenthe mean values of each set’s mean sig-nature was subtracted from all resist-ance signatures in the validation set,shown in Fig. 3. The average value ofthe mean signature from the valida-tion set was estimated from the firstfew welds. Electrode tip area was measured us-ing carbon paper imprints to aid in di-agnosing the causes of faulty weldsfrom the process monitoring. The car-bon paper imprints were digitized, andthe area in pixels was measured withImageJ (Ref. 35). The tip area was ex-pressed in mm2 by first measuring areference object of known size to pro-
�bi = P
+ xi � X( ) 1( )
WELDING RESEARCH
NOVEMBER 2017 / WELDING JOURNAL 407-s
Table 1 — Principal Component Variation Percentage
Principal Component Percent Variation (%)
1 89.3 2 4.84 3 3.06 4 1.79
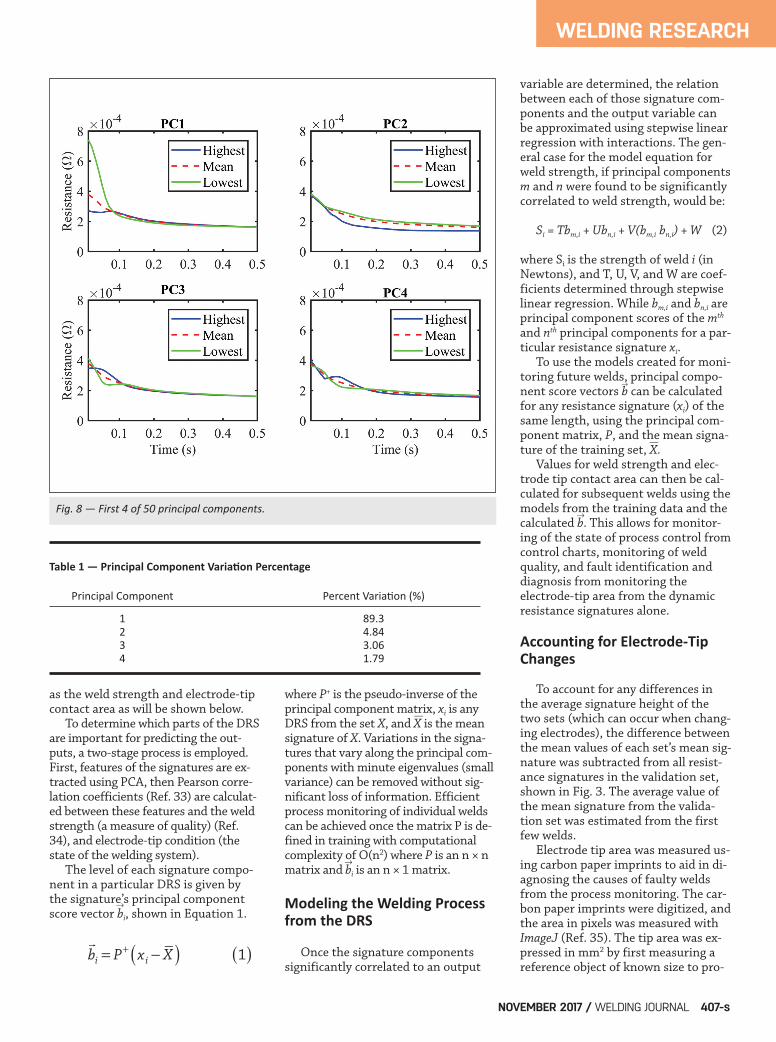
Fig. 8 — First 4 of 50 principal components.
—
—
Summerville Paper 201706 November 2017.qxp_Layout 1 10/10/17 4:59 PM Page 407
duce a calibration value (mm/pixel) re-stating pixels from the scanned imagein mm. The number of pixels in eachtip imprint was then used to calculatethe final contact area.
Results Data was collected for the two weld-ing series to test the process monitor-ing technique presented previously.The electrode-tip contact area (Fig. 4)and tensile shear strength (Fig. 5)were recorded for every weld in bothseries. The training data was collectedfor the purpose of creating the modelsfor electrode-tip area and weldstrength, while the validation data wascollected so that it could be monitoredusing the information gathered. Thecontact area measured from tip im-prints increased as the electrode faceswear after an initial wear-in phase thattook approximately 25 welds (shownin Fig. 4). The wear-in phase is an arti-fact of the measurement techniquethat conforms to the electrode surface,and the flatness of the electrode tipsurfaces, which are not perfectly paral-lel at the beginning of each series. Assuch, the electrode tip area is largeruntil the electrode tip surfaces becomeparallel, at which point it begins towear naturally.
Signature Variation
To find the major components ofthe signature set variation, the P ma-
trix was calculated for the training setdynamic resistance signatures, produc-ing 50 principal components describ-ing the various types of signature vari-ations. The principal components canbe represented by the amount of sig-nature set variation that is encapsulat-ed by each. The first four principalcomponents and their percent varia-tion are shown in Table 1. The firstprincipal component, which encapsu-
lated the highest signature variance, isideal for process monitoring of thewelding process as it summarizes themost information in one principalcomponent score for each weld. All principal components that indi-vidually described more than 1% ofsignature set variation (the first four,shown in Table 1) were used in furtheranalysis. The other 46 principal com-ponents combined capture the remain-
WELDING RESEARCH
WELDING JOURNAL / NOVEMBER 2017, VOL. 96408-s
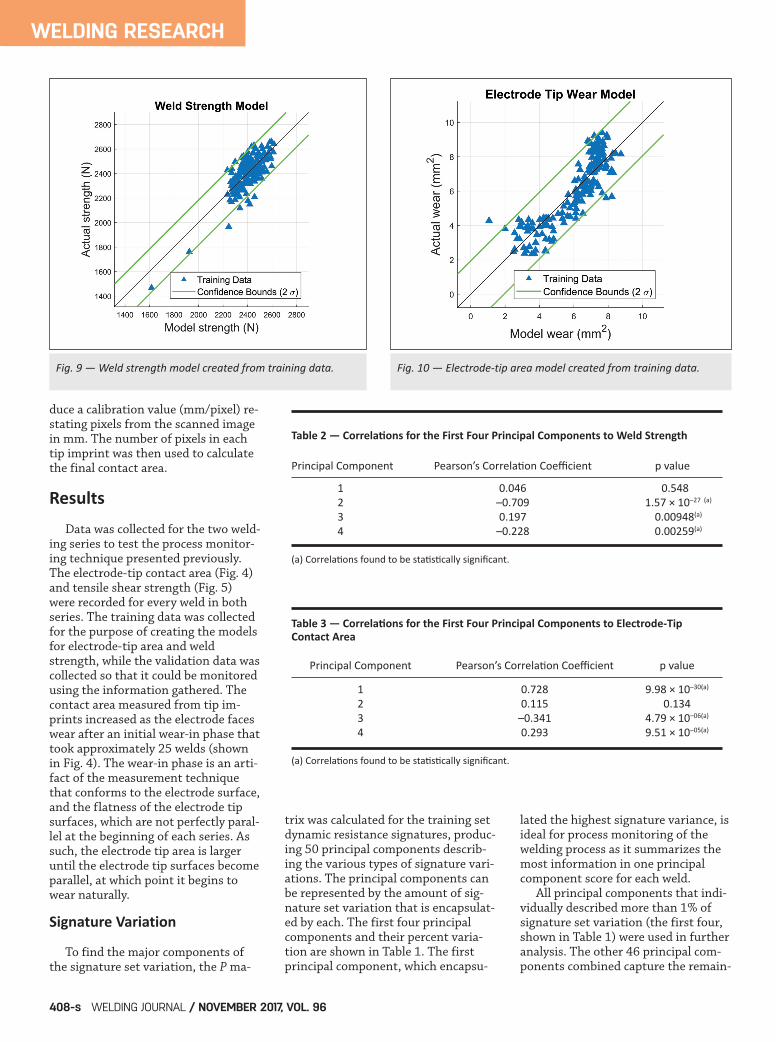
Fig. 9 — Weld strength model created from training data. Fig. 10 — Electrodetip area model created from training data.
Table 2 — Correlations for the First Four Principal Components to Weld Strength
Principal Component Pearson’s Correlation Coefficient p value
1 0.046 0.548 2 –0.709 1.57 × 10⁻²⁷ (a)
3 0.197 0.00948(a)
4 –0.228 0.00259(a)
(a) Correlations found to be statistically significant.
Table 3 — Correlations for the First Four Principal Components to ElectrodeTip Contact Area
Principal Component Pearson’s Correlation Coefficient p value
1 0.728 9.98 × 10⁻³⁰(a)
2 0.115 0.134 3 –0.341 4.79 × 10–06(a)
4 0.293 9.51 × 10–05(a)
(a) Correlations found to be statistically significant.
Summerville Paper 201706 November 2017.qxp_Layout 1 10/10/17 4:59 PM Page 408

ing 1% of variation in the signatureset and were removed from furtheranalysis. The signature components of thefirst four principal components are de-picted in Fig. 6 using high and lowprincipal component scores for thatprincipal component only. The firstfour collectively describe more than99% of the variation in the signatureset, drastically reducing the dimen-sionality of the signatures with mini-mal information loss. Each weld’s DRScan then be represented by four princi-pal component scores, which can beeasily correlated with the measuredoutputs such as electrode-tip area andstrength.
Weld Strength and ElectrodeTip Area Monitoring Models
Correlation coefficients for bothelectrode-tip contact area and weldstrength to the principal componentscores were calculated so that the val-ues for electrode-tip contact area andweld strength could be inferred for fu-ture welds from the DRS alone. Thecorrelation coefficients for electrode-tip area and strength to the first fourprincipal components are shown in Ta-bles 2 and 3. Consistent with commonstatistical convention, the hypotheseswith p values of less than 0.05 for a
given output parameter were deemedto be statistically significant. From the correlation tests, princi-pal components 2–4 were found to besignificantly correlated to weldstrength, and principal components 1,3, and 4 were significantly correlatedto electrode tip area. Models were cre-ated using the electrode-tip contactarea and weld strength in terms of therespective significantly correlatedprincipal component scores for eachweld using stepwise linear regressionwith interactions. A comparison of the predicted val-ues from the models to the measuredvalues of the training data are shownin Figs. 7 and 8. The confidencebounds that encapsulate two standarddeviations of the data are 184 N forthe weld strength and 1.93 mm2 forthe electrode-tip contact area. These models can then be used tocalculate values for electrode-tip contactarea and weld strength for the valida-tion series welds. To achieve this, b arecalculated for the validation welds, rep-resenting them in terms of the signifi-cant principal components of the thetraining data. The b for each weld in thevalidation series contains weighting val-ues for each significantly correlatedprincipal component calculated fromthe training data. This allows values forelectrode-tip area and weld strength to
be calculated for new welds directlyfrom their dynamic resistance signatureusing the calculated b.
Process Monitoring
To monitor changes in the processfrom weld-to-weld, the first principalcomponent scores (b1) for each weld inthe training set were used to createcontrol limits for a moving rangechart. A moving range chart was cho-sen to identify quick changes in theprocess such as welding setup or sur-face contamination. If the goal was tomonitor slow changes such as elec-trode wear, an x control chart couldeasily be implemented. Using the control limits determinedfrom the training set, the validationseries welds were monitored from theb1 values of the DRS, the results ofwhich are shown in Fig. 9. All valuesabove the upper control limit (UCL)are considered to be out of control dueto some significant change in theprocess. To aid in the analysis of thechart, the misaligned specimens (out-liers) have also been plotted. Therange of the welds that were directlyafter a weld declared to be out of con-trol was calculated using theweld before the out-of-control statusdeclaration.
Analysis and Discussion From the principal componentscores calculated for the validation se-ries welds, the welding process can befully monitored by detecting faults,identifying the variables responsible,and diagnosing the cause of the fault.
Fault Detection
The validation series welds weremonitored using the control limits setout by the training series data in Fig.9. A number of welds were found to beout of control using the first principalcomponent score values of the DRSs,indicating that a fault had occurred ora significant variable in the weldingprocess had changed. Using the mod-els for electrode-tip contact area andweld strength, these out-of-controlwelds were investigated further usingthe first four principal componentscores calculated in-line.
WELDING RESEARCH
NOVEMBER 2017 / WELDING JOURNAL 409-s
Fig. 11 — Moving range chart of the validation series welds b1 values.
Summerville Paper 201706 November 2017.qxp_Layout 1 10/10/17 4:59 PM Page 409

The immediate effects to the quali-ty of the weld produced can be as-sessed using the weld strength modeland principal component scores 2–4(those shown to be significantly corre-lated to the strength of the weld). Theweld strength values for the validationseries were inferred from the DRS,shown in Fig. 10, without requiringadditional physical testing. The weldsfound to be faulty (or out of control)from the process monitoring phase areshown in green and the specimens cre-ated with electrode-sheet misalign-ment are denoted by black crosses. There are a number of welds(known to be misaligned) that wereidentified as out of control with weldstrengths higher than the generaltrend, indicating a change in theprocess had occurred but the conse-quences for weld quality were not se-vere. Type II error (indicated as faultywithout having that fault occur) can beseen in Fig. 10 as green circles withoutcrosses, which were not part of the in-troduced misaligned specimens andhave strength values entirely congru-ent with the emerging trend. Giventhat the out-of-control welds appear tobe of similar or better quality to thosearound them, further investigationinto the fault is required given that asignificant change in the resistancesignatures has occurred.
Fault Variable Identification
Using the electrode-tip area model,the out-of-control welds can be furtheranalyzed. A number of them can be
seen to have very low inferred elec-trode-tip contact area values (thosethat were also misaligned). From thevery low inferred electrode-tip areavalues, it can be concluded that a sig-nificant change in the process has oc-curred. The inferred electrode-tip ar-eas that are below zero indicate thatthose particular DRSs are outside thepredictive bounds of the model creat-ed from the training set. Given thatthe training set was created in con-trolled circumstances, this indicates apotential fault that relates to the electrode-tip-sheet interface. The out-of-control welds with verylow inferred electrode-tip area and ahigher weld strength indicate that achange in contact area between thesheet and electrode had occurred. Giv-en that this interface governs the cur-rent density to the weld, it is intuitivethat (at a point of relatively high elec-trode wear for the welding machine) asudden reduction in the contact areashould increase the strength of thewelds produced. The variable responsi-ble for the fault detected in weldstrength of the welds can, therefore, beidentified as the current density deliv-ered to the specimen during welding.
Fault Diagnosis
The misaligned specimens are clear-ly responsible for the welds later in thevalidation series that have been deter-mined to be out of control. However, ifthe weld number of the misalignedspecimens were not known in advance,a potential diagnosis of the fault could
still be achieved. The prediction of low electrode-tipcontact area is indicative of a changein the electrode-sheet interface area. Areduction in the electrode-sheet inter-face is likely to be caused by one of twocircumstances:• Severe electrode-tip pitting, in whicha large portion of the electrode face isleft behind on a part, or,
• Electrode-sheet alignment. In the case of severe electrode pit-ting, the low electrode-tip contact areawould be expected to continue at a rel-atively constant rate for several weldsthereafter. This is not the case withthe welds in Fig. 11, as the very nextweld in the series has a predicted elec-trode-tip area consistent with the gen-eral trend.
Discussion
There are many phenomena thatdrive changes in the dynamic resist-ance curve in RSW; however, not allthese changes affect the strength ofthe weld. Therefore, there is no reasonto assume that simply because a prin-cipal component describes a largeamount of variation it should bestrongly correlated with the strengthof the weld. Rather the principal com-ponent space describes an orthogonalset of descriptive shapes of the dy-namic resistance from which the mostdescriptive for estimating strength canbe determined. In this study, the firstprincipal component, which described89.3% of the variation between welds,was not significantly correlated to
WELDING RESEARCH
WELDING JOURNAL / NOVEMBER 2017, VOL. 96410-s
Fig. 13 — Validation series inferred electrodetip area.Fig. 12 — Validation series inferred weld strength values.
Summerville Paper 201706 November 2017.qxp_Layout 1 10/10/17 4:59 PM Page 410

weld strength, with a correlation coef-ficient of 0.046, while the second prin-cipal component (accounting for4.84% of signature variation) wasfound to be strongly correlated to weldstrength. The shape of this first principalcomponent is dominated by the initialcontact resistance, which was notfound to be significantly correlatedwith weld strength. The first principalcomponent was, however, found to besignificantly correlated to electrode-tip contact area, which governs theinitial contact resistance and resist-ance at the start of the DRS. The sec-ond principal component, which de-scribed variation in the height of theDR curve after the initial peak, wasfound to be highly correlated withweld strength with a correlation coef-ficient of –0.709. This represents astrong link between the growth and fi-nal condition of the weld nugget andthe variation described by the secondprincipal component. In this way, re-ducing the dimensionality of the sig-natures through PCA allows for varia-tion related to a given variable to befound in any given signature set. The introduction of misalignedspecimens in the validation set wasfound to change the resistance spotwelding process significantly as identi-fied through the signature analysis. Al-though the higher than normalstrength welds that were produced arenot usually considered a fault in RSW,the misalignment of spot welds onparts can cause poor surface finish,potential difficulties in painting, andaccelerated electrode wear. The RSW process monitoring tech-nique in this paper presents an effec-tive use of the data available in the dy-namic resistance signature. By con-ducting PCA on the DRS, informationuseful for monitoring the process, andinferring the weld quality and state ofthe welding system, is extracted. Usingtraining data, control limits forprocess monitoring, and models forweld strength and electrode-tip con-tact area from measured data wasproduced. This allows for the quality of thewelds to be monitored in-line, withoutthe need for destructive testing. Withthe addition of the electrode-tip contact area model as a proxy for elec-trode-tip wear, faults in a spot welding
process can be identified and informa-tion that could lead to a diagnosis canbe provided. This method has clear benefits forindustry allowing operators to judgethe quality of a weld from the DRSrather than inferring that informationfrom the results of destructive testingother parts. The addition of signature-based electrode-tip wear also allowsfor monitoring of one of the most im-portant variables for spot weld qualityand understanding the condition ofthe welding system. Both variablesmodelled in this paper are considereddifficult to measure in a productionenvironment, with weld strength re-quiring parts to be destroyed, and elec-trode-tip condition monitoring typi-cally requiring modifications to thewelding apparatus or significant in-creases in welding cycle times. In the present study, the magnitudeof the given fault of electrode-sheetmisalignment cannot be determinedfrom the process monitoring tech-nique nor can “fault-free” reconstruc-tion be completed. However, with fur-ther experimentation and the inclu-sion of differing levels of misalign-ment this could be achieved so that afault vector could be determined.The process monitoring technique pre-sented can be applied to any fault inRSW, using training data from normalwelds. The changes caused by elec-trode-sheet misalignment are likely tobe unique and distinguishable fromother causes of faults such as shuntingor surface contamination. This wouldallow for extension of this method to abroadly applicable process monitoringtechnique for RSW. Future workshould attempt to reduce the size ofthe training sets, and increase the un-derstanding of the effects of addition-al faults.
Conclusion This paper presented a processmonitoring technique that allows effi-cient monitoring of the weld strengthand electrode-tip contact area of indi-vidual welds from the dynamic resist-ance signature alone. To achieve this,the resistance signatures for two setsof ~170 welds were collected. Information from the signatureswas used to create control limits forthe welding process as well as create
models to monitor weld strength andelectrode-tip contact area during awelding process. These models werethen used to infer the weld strengthand electrode-tip contact area of thesecond weld series for process moni-toring and quality assessment. Faultswere introduced and detected in thesecond weld series in the form of elec-trode-sheet misalignment using thecontrol limits defined by the trainingdata. The variables responsible for thefaults were identified using the elec-trode-tip contact area model, allowingfor a strong link to current density tobe shown. The cause of the fault wasable to be diagnosed as electrode-sheetcontact area change, consistent withelectrode-sheet misalignment throughanalysis of the electrode-tip contactarea model results. For the automotive industry thisresults in a reduced requirement fordestructive testing, given that thestrength of the weld can be inferredfrom the resistance signature alone.The results of this technique showpromise for the diagnosis of new faultsgiven the links between electrode-tipcondition and a number of variablesknown to produce poor quality weldsdiscussed previously. Future work willbroaden the approach to identify dif-ferent fault types providing a highlyeffective in-line process monitoringtechnique for RSW and further vali-date the proposed method. Additional-ly, this work can be expanded to in-clude and advise regular tip dressingcycles and preprogrammed currentstepping schedules that are commontechniques in industry for dealing withelectrode wear.
This research was supported underthe Australian Research Council’sLinkage Programme funding scheme(project number LP130101001).
Nomenclature
P Principal component matrixP+ Pseudo-inverse of the principalcomponent matrixbi principal component score vectorX Set of dynamic resistance
WELDING RESEARCH
NOVEMBER 2017 / WELDING JOURNAL 411-s
Acknowledgments
Summerville Paper 201706 November 2017.qxp_Layout 1 10/10/17 4:59 PM Page 411
signaturesX Mean dynamic resistance signaturexi Any individual dynamic resistancesignature
1. Williams, N. T., and Parker, J. D.2004. Review of resistance spot welding ofsteel sheets. Part 1. Modelling and controlof weld nugget formation. Int. Mater. Rev.49(2): 45–75. 2. Ma, Y., Wu, P., Xuan, C., Zhang, Y.,and Su, H. 2013. Review on techniques foron-line monitoring of resistance spot weld-ing process. Adv. Mater. Sci. Eng. pp. 1–5. 3. Sun, H., Zhang, Y., Lai, X., and Chen,G. 2008. On-line inspection of weld qualitybased on dynamic resistance curve in re-sistance spot welding and weldbonding.Proceedings of SPIE doi:10.1117/12.819597. 4. Luo, Y., Wan, R., Yang, Z., and Xie, X.2016. Study on the nugget growth in sin-gle-phase AC resistance spot welding onthe calculation of dynamic resistance. J.Mater. Process Technol. 229: 492–500. 5. Cho, Y., and Rhee, S. 2000. New tech-nology for measuring dynamic resistanceand estimating strength in resistance spotwelding. Meas. Sci. Technol. 11: 1173–1178. 6. Cho, Y., Kim, Y., and Rhee, S. 2001.Development of a quality estimation mod-el using multivariate analysis during resist-ance spot welding. J. Eng. Manuf. 215(11):1529–1538. 7. Ji, C. T., and Zhou, Y. 2004. Dynamicelectrode force and displacement in resist-ance spot welding of aluminum. J. Manuf.Sci. Eng. 126: 605–610. 8. Zhang, H., Hou, Y., Zhang, J., Qi, X.,and Wang, F. 2015. A new method for non-destructive quality evaluation of the resist-ance spot welding based on the radar chartmethod and the decision tree classifier. Int.J. Adv. Manuf. Technol. 78(5–8): 841–851. 9. Simončič, S., and Podržaj, P. 2014.Resistance spot weld strength estimationbased on electrode tip displacement/veloc-ity curve obtained by image processing. Sci.Technol. Weld. Join. 19(6): 468–475. 10. Podržaj, P., and Simončič, S. 2013.Welding force as a variable in resistance spotwelding control. Proc. 2013 2nd Int Conf.Meas. Inf. Control ICMIC 2013 2: 818–821. 11. Podržaj, P., Polajnar, I., Diaci, J., and
Kariž, Z. 2005. Estimating the strength ofresistance spot welds based on sonic emis-sion. Sci .Technol. Weld. Join. 10(4): 399–405. 12. Ling, S. F., Wan, L. X., Wong, Y. R.,and Li, D. N. 2010. Input electrical imped-ance as quality monitoring signature forcharacterizing resistance spot welding.NDT&E Int. 43(3): 200–205. 13. Qin, J. S. 2003. Statistical processmonitoring: Basics and beyond. J. Chemom17(8–9): 480–502. 14. Raich, A., and Çinar, A. 1996. Sta-tistical process monitoring and distur-bance diagnosis in multivariable continu-ous processes. AIChE J. 42(4): 995–1009. 15. Li, W., Yue, H. H., Valle-Cervantes,S., and Qin, S. J. 2000. Recursive PCA foradaptive process monitoring. J. ProcessControl 10(5): 471–486. 16. MacGregor, J. F., Jaeckle, C.,Kiparissides, C., and Koutoudi, M. 1994.Process monitoring and diagnosis bymultiblock PLS methods. AIChE J. 40(5):826–838. 17. Wen, J., Wang, C. S., Xu, G. C., andZhang, X. Q. 2009. Real time monitoringweld quality of resistance spot welding forstainless steel. ISIJ Int. 49(4): 553–556. 18. Vardanjani, M. J., and Senkara, J.2016. A review of shunting effect in resist-ance spot welding. PRZEGLĄD Spaw 88:46–50. 19. Ashadudzzaman, M., Choi, I. D.,Kim, J. W., Nam, D. G., and Park, Y. D.2015. Effect of initial ( reference ) weldingcurrent for adaptive control and its opti-mization to secure proper weld propertiesin resistance spot welding. J. Weld Join.33(6): 13–20. 20. Wang, H., Zhang, Y., and Chen, G.2009. Resistance spot welding processingmonitoring based on electrode displace-ment curve using moving range chart.Meas. J. Int. Meas. Confed 42(7): 1032–1038. 21. Hao, M., Osman, K. A., Boomer, D.R., Newton, C. J., and Sheasby, P. G. 1996.On-line nugget expulsion detection for alu-minium spot welding and weldbonding.SAE Tech Paper. 22. Jou, M. 2003. Real time monitoringweld quality of resistance spot welding forthe fabrication of sheet metal assemblies.J. Mater. Process. Technol. 132(1–3): 102–113. 23. Lee, S. R., Choo, Y. J., Lee, T. Y.,Kim, M. H., and Choi, S. K. 2001. A qualityassurance technique for resistance spotwelding using a neuro-fuzzy algorithm. J.
Manuf. Syst. 20(5): 320–328. 24. Podržaj, P., Polajnar, I., Diaci, J., andKariž, Z. 2008. Overview of resistance spotwelding control. Sci. Technol. Weld. Join.13(3): 215–224. 25. Williams, N. T., and Parker, J. D.2004. Review of resistance spot welding ofsteel sheets. Part 2. Factors influencingelectrode life. Int. Mater. Rev. 49(2): 77–108. 26. Zhang, X. Q., Chen, G. L., andZhang, Y. S. 2008. On-line evaluation ofelectrode wear by servo gun in resistancespot welding. Int. J. Adv. Manuf. Technol.36: 681–688. 27. Rashid, M., Fukumoto, S., Medley,J. B., Villafuerte, J., and Zhou, Y. 2007. In-fluence of lubricants on electrode life in re-sistance spot welding of aluminum alloys.Welding Journal 86(3): 62-s to 70-s. 28. Welding Handbook, 5th Edition, Sec-tion 2: Welding Processes Gas, Arc and Re-sistance, ed. A. L. Phillips. 1966. AmericanWelding Society, p. 30–55. 29. Gedeon, S. A., Sorensen, C. D., Ul-rich, K. T., and Eagar, T. W. 1987. Measure-ment of dynamic electrical and mechanicalproperties of resistance spot welds. Weld-ing Journal 66(12): 378-s to 385-s. 30. Dickinson, D. W., Franklin, J. E.,and Stanya, A. 1980. Characterization ofspot welding behavior by dynamic electri-cal parameter monitoring. Welding Journal59(6): 170-s to 176-s. 31. Cho, Y., and Rhee, S. 2002. Primarycircuit dynamic resistance monitoring andits application to quality estimation duringresistance spot welding. Welding Journal81(6): 104-s to 111-s. 32. Wan, X., Wang, Y., and Zhao, D.2016. Quality monitoring based on dy-namic resistance and principal componentanalysis in small scale resistance spot weld-ing process. Int. J. Adv. Manuf. Technol.30(6): 3443–3451. 33. Pearson, K. 1900. On the Correla-tion of characters not quantitatively meas-urable. Math Contrib. to Theory Evol. 195:1–47. 34. Adams, D. W., Summerville, C. D. E.,Voss, B. M., Jeswiet, J., and Doolan, M. C.2017. Correlating variations in the dynam-ic resistance signature to weld strength inresistance spot welding using principalcomponent analysis. J. Manuf. Sci. EngTrans. ASME 139(4): 1–4. 35. Schneider, C. A., Rasband, W. S.,and Eliceiri, K. W. 2012. NIH image to Im-ageJ: 25 years of image analysis. Nat Meth-ods 9(7): 671–675.
WELDING RESEARCH
WELDING JOURNAL / NOVEMBER 2017, VOL. 96412-s
CAMERON D. E. SUMMERVILLE ([email protected]), DAVID ADAMS, PAUL COMPSTON, and MATTHEW DOOLAN arewith the Research School of Engineering, Australian National University, Canberra, Australia.
References
Summerville Paper 201706 November 2017.qxp_Layout 1 10/10/17 4:59 PM Page 412