Process mapping for microinsurance operations
66
Process mapping for microinsurance operations A toolkit for understanding and improving business processes and client value “Developing partnerships to insure the world’s poor” MICRO INSURANCE CENTRE
Transcript of Process mapping for microinsurance operations

Process mapping for microinsurance operationsA toolkit for understanding and improvingbusiness processes and client value
“Developing partnerships to insure the world’s poor”
MICROINSURANCECENTRE


Process mapping for microinsurance operationsA toolkit for understanding and improvingbusiness processes and client value
“Developing partnerships to insure the world’s poor”
MICROINSURANCECENTRE
by
Roland SteinmannMicroInsurance Centre, LLC
Provided as part of the IFAD project Facilitating Widespread Access toMicroinsurance Services, managed by the Microfinance Centre and implemented by the Microinsurance Centre, LLC.

© 2012 by the International Fund for Agricultural Development (IFAD)
The opinions expressed in this publication are those of the authors and do not necessarilyrepresent those of the International Fund for Agricultural Development (IFAD). Thedesignations employed and the presentation of material in this publication do not implythe expression of any opinion whatsoever on the part of IFAD concerning the legal statusof any country, territory, city or area or of its authorities, or concerning the delimitation ofits frontiers or boundaries. The designations “developed” and “developing” countries areintended for statistical convenience and do not necessarily express a judgement about thestage reached by a particular country or area in the development process.
ISBN 9789290723325
October 2012
Cover Photo: ©IFAD/Asad Zaidi
Table of contents
FOREWORD 4
1. OVERVIEW 5 Introduction 6 What is a process map? 6 Why process mapping? 8
2. PROCESS MAPPING 9 The mapping cycle: ‘as-is’ and ‘should-be’ maps 10 ‘As-is’ maps 10 ‘Should-be’ maps 11 Approaches and styles 12 The basics 12 Components of a process map 13 Symbols 14 Tools and software 15 Required resources 15
3. THE SIX STEPS TO CREATING A PROCESS MAP 17 Step 1: Clarify the purpose 19 What purpose? 19 Which processes? 21 Step 2: Create the business case; get backing from the top 23 Step 3: Assemble a team; structure the mapping procedure 25 The team and the team leader 25 Structure the mapping process 26 Step 4: Outline the process and gather data 27 Outline the process 27 Gather data 30 Step 5: Draw a detailed map 31 Step 6: Finalize the map 34
4. THE ART OF ANALYSING AND IMPROVING PROCESSES 39 Involving the team 40 Finding areas of concern 41 Reducing complexity 41 Analysing responsibilities 43 Analysing risk 44 Analysing the timeline 46 Analysing costs 49 Drawing the ‘should-be’ map 54
5. REVISED PROCESSES 59 Implementation 60 Revision of processes 61
FURTHER RESOURCES 62
FIGURES 39 Figure 1: Example of a process overview 7 Figure 2: The mapping and process improvement cycle 12 Figure 3: Detail of sample process map 14 Figure 4: Commonly-used symbols 15 Figure 5: Outlining the claims process 28 Figure 6: As-is map for claims process: YES Hospital Cash 34 Figure 7: As-is map with bottlenecks and areas for improvement highlighted 50 Figure 8: Should-be map for claims processes: YES Hospital Cash 54

4
This manual is intended as an aid to microinsurance institutions. It presents a
technique called ‘process mapping’ that can support institutions in self-analysis
by assisting them in understanding, developing and improving business processes.
Although the concepts presented may be used for many types of projects and
processes, this manual was specifically developed as a supplement to
Microinsurance product development for microfinance providers (McCord 2012).
The manual describes how a process map can be drawn, analysed and adapted
for the microinsurance sector. It offers practical guidance about which processes
to concentrate on, and guides the reader through the task of improving these
processes, first on paper and then in practice.
In order to make process-mapping concepts more ‘real’, this manual uses a
fictitious case study of medical claims processing to walk the reader though the
steps of creating a process map. It is hoped that using this study will illuminate
the advantages of using process mapping and highlight the important rules of
thumb. Although creating process maps is not especially difficult, it is important
to keep in mind how to create them and how they can be used to best advantage.
The manual does not provide benchmarks on optimal microinsurance
processes. It concentrates rather on operational aspects. Once process mapping is
widely applied in the microinsurance industry, it will open the way for the
development of benchmarks. The author welcomes feedback, and the reader is
encouraged to share process maps that are developed as a result of this manual.
Submissions will be treated as confidential, and permission will be requested
before any use. If submissions are used or published in any way, they will be
anonymous.
Feedback can be sent to Roland Steinmann at
www.MicroInsuranceCentre.org
Foreword
5
©IFAD/M
wanzo M
illinga
55
1. Overview
©IFAD/Aub
rey Wad
e

IntroductionProcess mapping is a simple and valuable tool for improving and streamlining
existing business processes or designing and communicating new ones. It uses
charts with symbols and arrows to visualize an organization’s core processes and
their attributes, such as sequence, duration, costs, risks and responsibilities. Process
maps can illustrate more clearly than written procedures how a business is
conducted, where value is added to a product or service, and where inefficiencies
might be occurring. Although the process-mapping technique originated in
industrial operations, it has many benefits for streamlining any business, including
those in the insurance sector.
Frank and Lillian Gilbreth developed the first structured approach to visualizing
processes in 1921 with Process charts: First steps in finding the one best way to do work
– mainly to optimize industrial engineering processes (Gilbreth and Gilbreth
1921). Since then, many different process-mapping methods have been developed,
with a variety of approaches, techniques and symbols. Today, the Gilbreths’
simple system is used in a variety of industries to better understand and
improve operations.
What is a process map?A process map1 is a graphic representation of the tasks and procedures (the
processes) followed in the course of doing business (figure 1). A process is defined
as any action that has an input at its starting point and an output at its end.
Processes consist of a sequence of single interrelated steps or tasks. They
are described by an active verb and a noun, for example ‘file claims form’ or
‘sign receipt’.
1. Overview
6
1 Until now, no universally accepted terminology for this approach has emerged. Another frequently used termis ‘flow charting’. While the terms can be used as synonyms, in this manual the activity is called ‘processmapping’ and the product a ‘process map’.

7
PROCESS MAPPING FOR MICROINSURANCE OPERATIONS
Figure 1. Example of a process overview
Clientpurchasesinsurance
Client suffersloss/damage
Client filesclaim
Client receivesindemnity
An accurate process map presents a clear picture of what happens in a process,
but it is much more than a record of the sequence of process steps. It can answer
important questions about the business, such as:
For the whole process:
• Where does the process start and where does it end?
• What are the inputs and outputs of the process?
• What are the individual steps involved in the process?
• Who executes which step?
For each process step:
• What happens in this step?
• Where does it fit into the sequence of process steps?
• Who carries it out and who (which position or department) is
responsible for it?
• What are the inputs and outputs of each step?
• How long does it take?
• How much does it cost?
A process map can be a high-level map that shows only the broad outline of steps
(as in figure 1) or it can be a very detailed diagram. For example, the third step in
figure 1 is ‘Client files claim’; this step might easily be made into several more
detailed steps, such as ‘Client obtains claims form’, ‘Client fills out form’ and
‘Client sends form to insurer’. The level of detail used in a process map typically
depends on the purpose of the map.

8
1. OVERVIEW
Why process mapping?The nineteenth-century Russian writer Turgenev wrote: “A picture shows me at a
glance what it takes dozens of pages of a book to expound.” In the same way, a
process map enables people to visualize complex sequences of activities and tasks.
And beyond simple visualization, a process map facilitates the careful analysis
needed to streamline and improve a process.
Why process mapping?
• To document how business is (or should be) done
• To understand and simplify a process
• To understand and minimize cost and time factors
• To understand and mitigate risks
• To understand and clarify responsibilities
• For training and/or communication (internal and external)
• To improve customer satisfaction
• To plan and introduce new processes
A process map can help an organization institutionalize the knowledge of
how its business is done. This is especially important for businesses where
staff turnover is high and/or only a few employees are knowledgeable about a
given process.

99
2. Process mapping
©IFAD/R. R
amasom
anana

The mapping cycle: ‘as-is’ and ‘should-be’ mapsTo reap its full benefits, process mapping should be an evolving process rather
than a one-off task. Typically, the starting point is to draw a map that mirrors what
is currently being done, and the end point is a map of an optimized process. This
theoretical optimal process then has to be tested, and only when it actually works
on the ground can the map be adjusted and the mapping process considered
finished. But even this end point is temporary, as the cycle of actual and optimized
processes must begin again in an iterative practice of continuous improvement.
We distinguish two different types of maps, each in a certain phase in the
mapping cycle:
• As-is map: depicting the way business is currently being done, which serves
as the basis for analysis and optimization;
• Should-be map: this depicts the plan for an improved way of doing business.
Ideally, process mapping is embedded in a comprehensive quality-management
strategy. Alternatively, it can be implemented by the institution’s internal audit
department. A fall-back solution is to put it under the department responsible for
operations. However, bear in mind that ‘operations’ may not be the best
department to recognize the need for fundamental change – as it is, after all, the
department responsible for the existing set-up.
‘As-is’ mapsThe as-is map mirrors what is currently happening in the organization. It is
generated by interviewing the people involved and getting them to explain exactly
what they do, how they do it and why. The resulting map should highlight (rather
than gloss over) any inefficiencies or process steps that are not clearly defined.
2. Process mapping
10

11
PROCESS MAPPING FOR MICROINSURANCE OPERATIONS
‘Should-be’ mapsAfter drawing your as-is map, it will probably become clear that certain steps in the
business process need to change. After a thorough analysis, you will then draw a
should-be process map, which will depict the optimal version of your business
processes. This map is thus a proposal of how the existing processes might be
improved. Should-be maps are also created whenever you want to introduce a
new process.
Eventually, the should-be map has to be tested in reality. As it is a theoretical
construct, one cannot expect reality to work exactly as planned. Thus, after a certain
trial period, the as-is and should-be maps must be compared and the differences
between them assessed. It could be that aspects of the should-be map have not been
implemented because the change would be unacceptable; for example, people may
prefer to continue doing things the way they always have been done. On the other
hand, some should-be map ideas may not have been implemented because they
were impracticable. In this case, the should-be map has to be adapted to what is
realistic and doable on the ground.
The resulting revised should-be map then becomes the document of reference
according to which future processes are carried out. There will still be a need for
internal audits or other checks to identify disjunctions between the should-be map
and reality. Adaptation will then be necessary once more, whether on the side of
the process or of the map.
The six steps of process mapping and improvement
Step 1 Draw the as-is situation. The as-is map shows how business is done in
reality and is the basis for subsequent analysis.
Step 2 Analyse the as-is map to find room for improvement (e.g. reduced
turnaround time, costs, better risk management).
Step 3 Draw the should-be map, showing the proposed improvements.
Step 4 Pilot test any major change in processes to avoid surprises on a
large scale.
Step 5 Carefully analyse the results of the pilot test.
Step 6: If pilot test results are satisfactory, or if only minor changes are
required, implement the new process throughout the whole
organization. If major problems are detected, then go back to step 4
and test an improved process again.
Note: in cases where a completely new process is being mapped (for example,
for a new product or delivery channel), one would start directly with step 3.

12
2. PROCESS MAPPING
Approaches and styles
The basicsThere are many ways to visualize processes. To get the best results, the style of the
map must be adapted for the particular industry and to the level of detail needed.
In principle, there is no right or wrong method, as long as the methodology is
consistent and serves the intended purpose. However, the following basic
principles have proved helpful:
• Use simple symbols that are easy to understand. In theory, you can use any
symbols you like, but the symbols presented in this manual are widely used
and understood and will therefore facilitate communication with your peers.
• The flow of the process should be presented from left to right and/or top
to bottom.
• Arrows should not intersect.
• Each symbol should be named concisely.
• It should be clear from the title whether the process is an as-is map depicting
what really happens, or a should-be map representing the ideal process.
Figure 2. The mapping and process improvement cycle
1. Drawas-is map
4. Pilot testshould-be map
2. Analyseas-is map
6. Reviewshould-be map
and retestsignificant changes
3. Drawimproved map:should-be map
5. Analysis ofpilot-tested
process
13
PROCESS MAPPING FOR MICROINSURANCE OPERATIONS
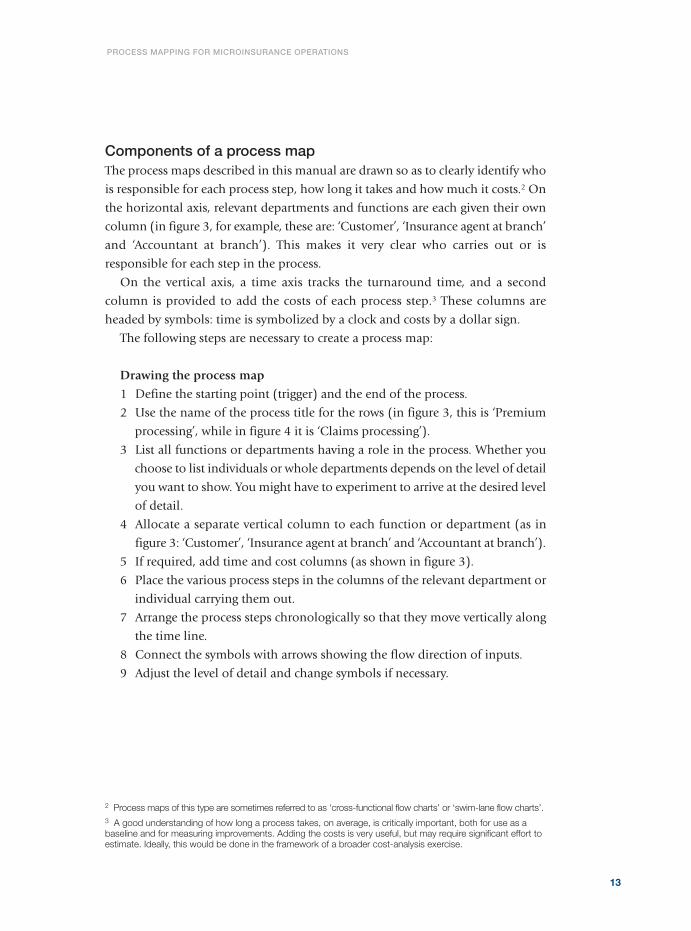
Components of a process mapThe process maps described in this manual are drawn so as to clearly identify who
is responsible for each process step, how long it takes and how much it costs.2 On
the horizontal axis, relevant departments and functions are each given their own
column (in figure 3, for example, these are: ‘Customer’, ‘Insurance agent at branch’
and ‘Accountant at branch’). This makes it very clear who carries out or is
responsible for each step in the process.
On the vertical axis, a time axis tracks the turnaround time, and a second
column is provided to add the costs of each process step.3 These columns are
headed by symbols: time is symbolized by a clock and costs by a dollar sign.
The following steps are necessary to create a process map:
Drawing the process map
1 Define the starting point (trigger) and the end of the process.
2 Use the name of the process title for the rows (in figure 3, this is ‘Premium
processing’, while in figure 4 it is ‘Claims processing’).
3 List all functions or departments having a role in the process. Whether you
choose to list individuals or whole departments depends on the level of detail
you want to show. You might have to experiment to arrive at the desired level
of detail.
4 Allocate a separate vertical column to each function or department (as in
figure 3: ‘Customer’, ‘Insurance agent at branch’ and ‘Accountant at branch’).
5 If required, add time and cost columns (as shown in figure 3).
6 Place the various process steps in the columns of the relevant department or
individual carrying them out.
7 Arrange the process steps chronologically so that they move vertically along
the time line.
8 Connect the symbols with arrows showing the flow direction of inputs.
9 Adjust the level of detail and change symbols if necessary.
2 Process maps of this type are sometimes referred to as ‘cross-functional flow charts’ or ‘swim-lane flow charts’.3 A good understanding of how long a process takes, on average, is critically important, both for use as abaseline and for measuring improvements. Adding the costs is very useful, but may require significant effort toestimate. Ideally, this would be done in the framework of a broader cost-analysis exercise.

2. PROCESS MAPPING
14
Figure 3. Detail of sample process map
$ Insurance agent at branchCustomer Accountant at branch
Pre
miu
m p
roce
ssin
g
daily report
insurance certificate
Trigger: claimant walks into branch to make a
premium payment
receives signed receipt
premium receipt
daily report
presents insurance certificate and hands over
cash
counts cash, signs receipt
premium receipt
0.1h
0.25h
transfers daily report and premium to accountant
prepares daily premium report for accountant
premium receipt
check daily report, receipts and cash
not completecomplete
1h
PROCESS MAPPING FOR MICROINSURANCE OPERATIONS
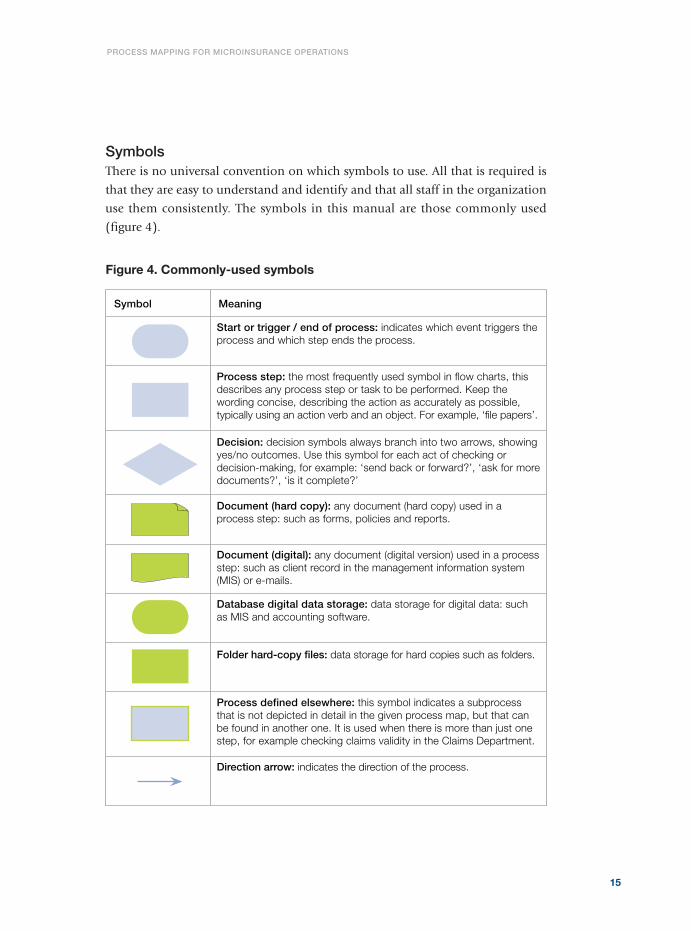
SymbolsThere is no universal convention on which symbols to use. All that is required is
that they are easy to understand and identify and that all staff in the organization
use them consistently. The symbols in this manual are those commonly used
(figure 4).
15
Figure 4. Commonly-used symbols
Symbol Meaning
Start or trigger / end of process: indicates which event triggers the process and which step ends the process.
Document (digital): any document (digital version) used in a process step: such as client record in the management information system (MIS) or e-mails.
Document (hard copy): any document (hard copy) used in a process step: such as forms, policies and reports.
Database digital data storage: data storage for digital data: such as MIS and accounting software.
Folder hard-copy files: data storage for hard copies such as folders.
Direction arrow: indicates the direction of the process.
Process step: the most frequently used symbol in flow charts, this describes any process step or task to be performed. Keep the wording concise, describing the action as accurately as possible, typically using an action verb and an object. For example, ‘file papers’.
Process defined elsewhere: this symbol indicates a subprocess that is not depicted in detail in the given process map, but that can be found in another one. It is used when there is more than just one step, for example checking claims validity in the Claims Department.
Decision: decision symbols always branch into two arrows, showing yes/no outcomes. Use this symbol for each act of checking or decision-making, for example: ‘send back or forward?’, ‘ask for more documents?’, ‘is it complete?’

2. PROCESS MAPPING
Tools and softwareThere are many software applications for drawing process maps and they each have
their advantages and disadvantages. Choosing the right one depends mainly on
how familiar you already are with one product. It also depends on how often you
will use it afterwards – buying and learning how to use new software just to create
one process map is not very efficient.
Widely used software applications that can be used to recreate drawings like
those depicted in this manual include OmniGraffle, Visio and SmartDraw. Each of
these tools allows you to create maps that look professional. If you have just started
exploring process mapping and are unlikely to use it often, then Microsoft Excel
(yes, Excel!) is sufficient to start with (Microsoft Word and PowerPoint can also be
used, but Excel is by far the best tool for this).
Process maps can also be drawn on paper, or on a whiteboard, or laid out on a
table using cards, or created with sticky notes. Using cards or sticky notes has the
advantage of great flexibility and visibility to a team. You may find this method
very helpful at the start, especially if you are extracting information from a group
of people. Once the group agrees on the map, you can transfer the information to
a digital or a properly drawn hard-copy form.
Required resourcesMapping an existing process can take a couple of days or as long as two weeks – it
depends how many people and departments are involved. Another factor is
whether the processes are already well documented, whether documents and cases
are already being tracked and processing times are known. If this documentation
has not been done, you will first need to gather the information through interviews
and workshops in representative branches. Documenting the current way of doing
business and creating the as-is map are only the first steps – the basis for subsequent
analysis and improvements. Each change should be carefully discussed with the
parties involved and pilot tested.
The technique of process mapping is easy to learn. However, in some cases it
may prove more efficient, or even critically necessary, to engage an outside person
to do the first mapping and analysis – for example where human resources are
limited, or where an unbiased perspective, fresh ideas or on-the-job training
is needed.
16

171717
3. The six steps in creating aprocess map
©IFAD/Susan Beccio

This section discusses the steps required to create an effective process map. It uses
a fictitious case study of a medical claims process to illuminate the important areas.
The six steps are:
1 Clarify the purpose
2 Create the business case
3 Assemble the team
4 Outline the process and gather data
5 Draw a detailed map
6 Finalize the map
3. The six steps in creating aprocess map
18
Box 1General information – case study: YES Hospital Cash
The reputable insurance company Your Everlasting Security (YES) has developed amedical cash insurance product in close collaboration with the dynamic microfinanceinstitution (MFI) Bright Future Credit (BFC). The product, to be offered exclusively to BFCclients, includes the following main features:
• Voluntary insurance
• Subscription: at loan application
• Premium payment: with monthly loan instalments
• Coverage: US$5 per night at a public hospital
• Trigger: overnight stay at hospital
• Claims documentation required: hospital discharge certificate, signed by treating doctor
After collecting feedback from clients through six focus group discussions, YES finalizedthe product and BFC began offering the product at all its branches. BFC serves 54,000clients through 23 branches, covering all provinces of the country.
Note: Unfortunately, BFC did not follow best practice in product development: it did nopilot test in a limited number of branches and thus there was no client feedback that couldbe used to refine the product.

PROCESS MAPPING FOR MICROINSURANCE OPERATIONS
Step 1: Clarify the purpose The first step is always to clarify the purpose(s) of the project, because the purpose
defines how the mapping is to be done. The purpose also helps define the level of
detail a process map should show. An overview map for an annual business report
will certainly be less detailed than a map used to familiarize new employees with
their tasks.
Finding the appropriate level of detail is not always easy. Drawing maps for all
processes of an organization is very time consuming, so it is important to be clear
about which part(s) of the business you want to include and the level of detail
you want.
What purpose?There are a number of possible purposes for making a process map. The most
common ones are to understand a process, to analyse and improve a process, to
train people and to design new processes.
• Process mapping to understand a process. To analyse and improve a process, it is
valuable first to gain a clear understanding of how the details of the business
are carried out. Business processes can be complex. Often processes have
evolved ‘organically’ to the point where not even management understands
the detail. Sometimes one finds that the whole process has never been
analysed. Careful analysis will show which processes should be mapped:
where does performance lag behind customer expectations, benchmarks
or competitiveness?
• Process mapping to analyse and improve a process. We do this when we want to
identify bottlenecks or risks (related to fraud, security or reputation).
Shortcomings regarding customer satisfaction, national or international
standards and benchmarks, and the general competitiveness of a company,
may lead to the decision to analyse and improve the processes involved.
Several factors may be analysed and shown using a process map:
• Cost factors: how much does each step cost?
• Time factors: how long does a step take?
• Responsibilities: Who is responsible for the step?
• Risks: Many factors can contribute to risk, so the more details shown in
the map, the more likely that underlying risks will become apparent. In
order to identify as many risks and inefficiencies as possible, detailed
maps are indispensable.
19

3. THE SIX STEPS IN CREATING A PROCESS MAP
• Process mapping for training. Process maps make excellent communication
tools to familiarize new employees with processes and tasks. Such maps must
be detailed – at least in relation to the tasks that the new employee must
carry out. Process maps with less detail can be used to give employees a good
overview of the whole business.
• Process mapping to design new processes. If you are designing an entirely new
process, you will want to create a clear basis before proposing any changes,
whether these are for a new business, new practices or additional tasks.
Process maps are excellent means to think through new processes before
starting a pilot phase. Many risks and bottlenecks can be detected on paper
before money and time are spent (or wasted) testing them in the field.
20
Box 2Goal setting – case study: YES Hospital Cash
After eight months of running YES Medical Cash, Mr Doït, the project leader at YES,learned that clients were dissatisfied with customer service. The company’s advertisingpromised claims settlement within 48 hours, but in reality it took three to four weeks untilclaims were paid out. Most worryingly, some clients who had filed claims complained thatthere had been no response at all from the company. In addition to these customercomplaints, the chief operations officer of BFC, Ms Bold, expressed serious concern thatthe hospital cash insurance product was absorbing too much of her staff’s time.
In order to better understand where the issues came from and what should bechanged, as the project leader at YES, Mr Doït decided to invest in a process-mappingexercise in order to identify the causes of the complaints and which areas could beimproved. He contacted Ms Bold to discuss the issues.
It very soon became clear that neither of them really knew what was happening on theground. Obviously, front-end staff were not following predefined processes, otherwisethere wouldn't have been a problem. They realized that what they needed first was a clearpicture of how claims processing was actually being done. They agreed that processingtime and responsibilities should be closely analysed in the mapping, as both dimensionshad given rise to complaints. Other activities, such as premium collection and financialreconciliation between YES and BFC, were deliberately excluded.
For Mr Doït and Ms Bold the goal was clear: improve client satisfaction while reducingthe administrative burden on both BFC and YES in order to secure financial viability. Theyagreed to take a fresh unbiased look at how business was currently being done and howit could be done more efficiently.

PROCESS MAPPING FOR MICROINSURANCE OPERATIONS
With new processes it is also important to get the level of detail right. If a map is
drawn to secure support from management for a new idea, less detail is likely to
be necessary than for a map introducing a new process. On the other hand, a map
used to instruct people on what to do should contain sufficient information for
the person to do the work correctly. The level of detail to include is often as much
art as it is common sense. ‘Provide insurance’ is far too broad a step; whereas ‘pick
up the pencil’ is far too detailed. The rule of thumb to remember is to provide no
more and no less information than is needed for your particular audience.
Which processes?As a general rule, it is easier to draw maps for new processes than for existing ones.
However, the mapping of existing processes may reap huge efficiency gains. For
microinsurance processes, it usually makes sense to start with claims
administration or premium collection, as these processes are critical to customer
satisfaction, efficiency and fraud detection.
• Start with rough processes and add detail as needed.
• Prioritize important processes, because mapping the process flow of a whole
business in detail is a lot of work.
Mapping can take place at the macro- or microlevel. However, it is not always
obvious where to draw the line between the two (and there is no strict right
or wrong).
• Macroprocesses are the core processes within an organization, and a
macroprocess map is drawn with a certain level of abstraction. It is an
overview map that shows what a company does, without all the
details reflected.
• Microprocesses or subprocesses describe details within macroprocesses, for
example showing how authorization for a certain task is obtained.
Describing microprocesses is very useful in improving efficiency and
quality. Examples are shown and discussed in section 3.5.
For higher management, an overview map depicting all macroprocesses can be
very useful in locating problems and identifying the processes in which they occur.
21
3. THE SIX STEPS IN CREATING A PROCESS MAP
Typical macroprocesses in microinsurance
From a high-level perspective, microinsurance operations are no different
than any general insurance operation: policies have to be sold, premiums
collected, contracts renewed and claims paid. In microinsurance there is often
an additional operation, which is the institutional interaction between the
risk-taking insurance company and the delivery channel.
In a more complex case, a broker might be involved, who will likely have
to deal with both institutions. Simpler processes are also possible, such as
mutual funds owned by an MFI. For the purpose of explaining the principles
of process mapping, the intermediate level of complexity found in a
partner/agent model with a voluntary product is presented in our case study.
Typical macroprocesses in microinsurance are:
• Sales: This macroprocess covers activities from the first client contact
through to successfully registering him or her as a new client and delivering
an insurance certificate. Related microprocesses include marketing,
clarification of questions, applying for microinsurance, closing the sale,
getting the application to the insurer, receiving the policy document,
collecting the first premium payment and distributing the policy document
to the client.
• Premium collection: This macroprocess covers everything related to
collecting premiums from the client and transmitting them to the risk-
taking partner (normally an insurance company) and checking for clients
with outstanding premium payments.
• Renewals: Renewing an insurance contract is not the same as enrolling a
new client. It requires reminding the client of upcoming renewals,
collecting new premiums and providing an updated insurance certificate.
• Claims processing: Claims payment is one of the most important processes
in insurance: low-income clients in particular expect swift payment, as they
usually need funds immediately. This macroprocess covers all steps from
informing the agent of the claim, to submitting the required documents,
checking validity, registering in the MIS, approval/rejection and ultimately
disbursement and final filing.
22

PROCESS MAPPING FOR MICROINSURANCE OPERATIONS
Step 2: Create the business case, get backing from the topProcess mapping is not something to be squeezed between other tasks. It must be
allocated enough resources and time; otherwise it is likely to fail. It is crucial that
process mapping has support from management and that everyone participating
is able to allocate time for it.
In order to get full support from management, you probably need to design a
full project or business case to show why a process-mapping exercise is important.
If so, include the following:
Gains for the organization:
• Improved transparency
• Identification of inefficiencies: greater efficiency means cost reductions
• Risk reduction
• Improved customer satisfaction
• Basis for training new staff, communication
Costs:
• Estimate resources (time, people) for mapping, analysis and implementation
• Software
23
3. THE SIX STEPS IN CREATING A PROCESS MAP
24
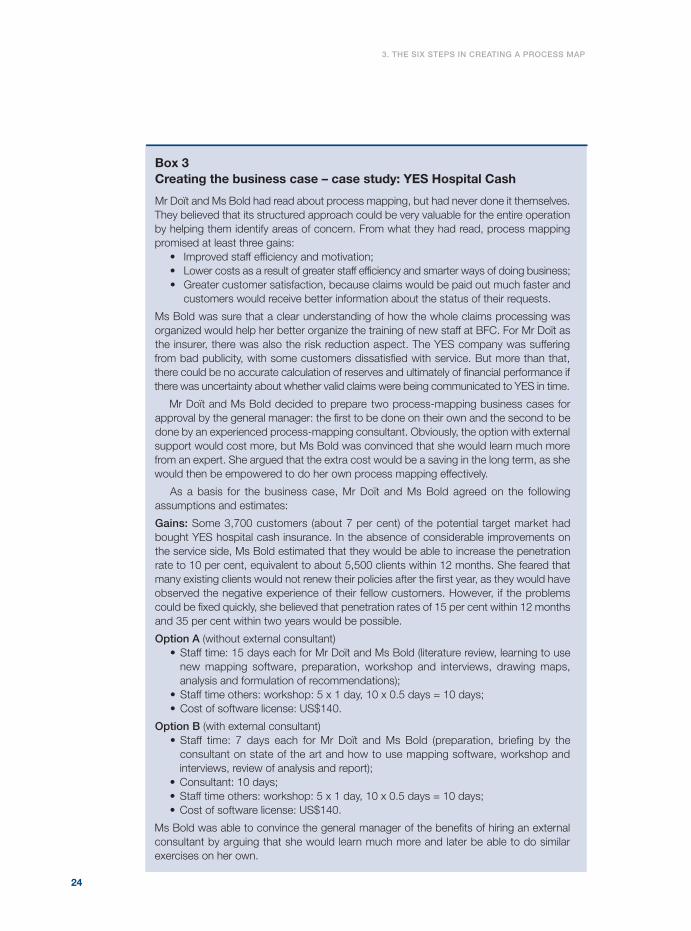
Box 3Creating the business case – case study: YES Hospital Cash
Mr Doït and Ms Bold had read about process mapping, but had never done it themselves.They believed that its structured approach could be very valuable for the entire operationby helping them identify areas of concern. From what they had read, process mappingpromised at least three gains:
• Improved staff efficiency and motivation;• Lower costs as a result of greater staff efficiency and smarter ways of doing business;• Greater customer satisfaction, because claims would be paid out much faster and
customers would receive better information about the status of their requests.
Ms Bold was sure that a clear understanding of how the whole claims processing wasorganized would help her better organize the training of new staff at BFC. For Mr Doït asthe insurer, there was also the risk reduction aspect. The YES company was sufferingfrom bad publicity, with some customers dissatisfied with service. But more than that,there could be no accurate calculation of reserves and ultimately of financial performance ifthere was uncertainty about whether valid claims were being communicated to YES in time.
Mr Doït and Ms Bold decided to prepare two process-mapping business cases forapproval by the general manager: the first to be done on their own and the second to bedone by an experienced process-mapping consultant. Obviously, the option with externalsupport would cost more, but Ms Bold was convinced that she would learn much morefrom an expert. She argued that the extra cost would be a saving in the long term, as shewould then be empowered to do her own process mapping effectively.
As a basis for the business case, Mr Doït and Ms Bold agreed on the followingassumptions and estimates:
Gains: Some 3,700 customers (about 7 per cent) of the potential target market hadbought YES hospital cash insurance. In the absence of considerable improvements onthe service side, Ms Bold estimated that they would be able to increase the penetrationrate to 10 per cent, equivalent to about 5,500 clients within 12 months. She feared thatmany existing clients would not renew their policies after the first year, as they would haveobserved the negative experience of their fellow customers. However, if the problemscould be fixed quickly, she believed that penetration rates of 15 per cent within 12 monthsand 35 per cent within two years would be possible.
Option A (without external consultant)• Staff time: 15 days each for Mr Doït and Ms Bold (literature review, learning to usenew mapping software, preparation, workshop and interviews, drawing maps,analysis and formulation of recommendations);
• Staff time others: workshop: 5 x 1 day, 10 x 0.5 days = 10 days;• Cost of software license: US$140.
Option B (with external consultant)• Staff time: 7 days each for Mr Doït and Ms Bold (preparation, briefing by theconsultant on state of the art and how to use mapping software, workshop andinterviews, review of analysis and report);
• Consultant: 10 days;• Staff time others: workshop: 5 x 1 day, 10 x 0.5 days = 10 days;• Cost of software license: US$140.
Ms Bold was able to convince the general manager of the benefits of hiring an externalconsultant by arguing that she would learn much more and later be able to do similarexercises on her own.
PROCESS MAPPING FOR MICROINSURANCE OPERATIONS
Step 3: Assemble a team, structure the mapping procedureA process map should not be produced by one person alone, especially when
mapping an already existing process. Putting together a team is crucial to the
success of the exercise, although someone does need to take a clear leadership role.
If your organization has an internal audit department, that is probably the right
place to locate process mapping. Alternatively, you can outsource it. This will cost
more, but may prove more efficient and lead to better results, because an outsider
will probably take a fresh and unbiased look at your organization.
The team and the team leader The person responsible for the whole process-mapping exercise (referred to as the
‘leader’ or the ‘team leader’) needs to be sufficiently empowered for the task. An
important aspect to consider when choosing a leader is his or her objectivity. For
example, the operations manager would not normally be a good choice, as s/he is
responsible for the processes currently in place and may even have set them up.
Also bear in mind that staff may be reluctant to be completely honest when
interviewed by their boss.
Ideally, the team leader will have a good general understanding of the
organization, be motivated to question old practices and be generally respected,
with enough influence to later drive the implementation of changes. The leader
should also be someone with good communication skills and experience in group
interviews or focus-group discussions.
For large and diverse organizations, a relatively small core team representing
the different branches and departments should assist and complement the leader
and help conduct interviews. In smaller organizations, it may be possible to
assemble a team whose members represent every step of the process and every
organizational level. Whether the organization is small or large, team members
should be encouraged to question processes and eventually improve them. Thus
they should be experienced staff that understand the business beyond the
boundaries of the single process they are engaged in. If you are designing an
entirely new process, the team can be smaller and made up of staff who know
similar processes. The more participatory the designing of a new process, the more
likely is a smooth implementation and the greater the ‘buy-in’ by people affected
by the change.
Mapping an existing process may take up to 10 working days, although few of
the individuals involved will need to put in that much time. All team members
and all staff interviewed should get thorough training in process mapping and be
given enough time to carry out the task properly. Without sufficient time and
25

3. THE SIX STEPS IN CREATING A PROCESS MAP
motivation, there is danger that not enough work and thought will be put into
the mapping.
Interviews can be carried out with individuals or with groups. Group interviews
are advisable only if the leader is an experienced facilitator and has the skills to
manage group discussions. It is important that there are no negative consequences
if the individuals interviewed explain honestly how certain processes are carried
out. Employees who are not carrying out their tasks efficiently might be reluctant
to be honest about this. In such cases, an explanatory message from the chief
executive officer could help: announcing why process mapping is done; that the
aim is to help both staff and the overall organization; that honest answers are really
valuable; and that there will be some level of confidentiality.
Structure the mapping processA kick-off meeting with the whole team is usually very positive: the team leader can
explain the overall task and divide the work according to knowledge and skills.
The following should be prepared beforehand and clarified at the meeting:
• List people who need to be interviewed to obtain further information.
• Set a time line, milestones and outputs (and decide who is responsible
for what).
• Decide on the working format: sticky notes, cards, pen and paper, software.
26
Box 4Assembling a process-mapping team – case study: YES Hospital Cash
Mr Doït and Ms Bold agreed to do the process mapping together. They decided that afterinitial preparations undertaken by project leaders, they would hold a kick-off meeting withthe newly appointed core process-mapping team. This would be followed by an initialprocess-mapping workshop, for which the core team would organize and select suitableparticipants. The findings of the workshop would then be discussed in one-to-oneinterviews with peers.
• Core process-mapping team: The team consisted of Ms Bold and Mr Doït, a seniorcredit officer from BFC, a senior claims officer from BFC and a senior claims officerfrom YES. This team was to be responsible for preparing and steering the wholeproject, organizing workshops and making recommendations.
• Participants in the initial process-mapping workshop: In addition to the coreteam members, Mr Doït and Ms Bold planned to invite two credit officers working ata southern branch, a senior credit officer managing a northern branch and a claimsofficer at BFC headquarters (HQ). A claims officer from YES completed the workshopcrew, bringing the number of workshop participants to 10.
• One-on-one interviews: The outcome of the process-mapping workshop wouldbe a map reflecting how business is currently done. Before proposing any changes,this map would need to be validated by others involved. It was decided that the mapwould be discussed with the senior credit officer and/or the credit officers of fourother branches and an additional claims officer from YES.
PROCESS MAPPING FOR MICROINSURANCE OPERATIONS
Step 4: Outline the process and gather data
Outline the processBefore embarking on detailed action, the process(es) under consideration should
be clearly outlined according to these steps:
1. Give the process a concise name that stands for the action performed
within it.
2. Define the boundaries of each process: how is it triggered? (starting point);
how does it end? (output).
3. Determine which parties or departments are to be involved. If you are
mapping a subprocess, determine which functions are to be involved.
4. Define the major process steps and give them concise names.
27
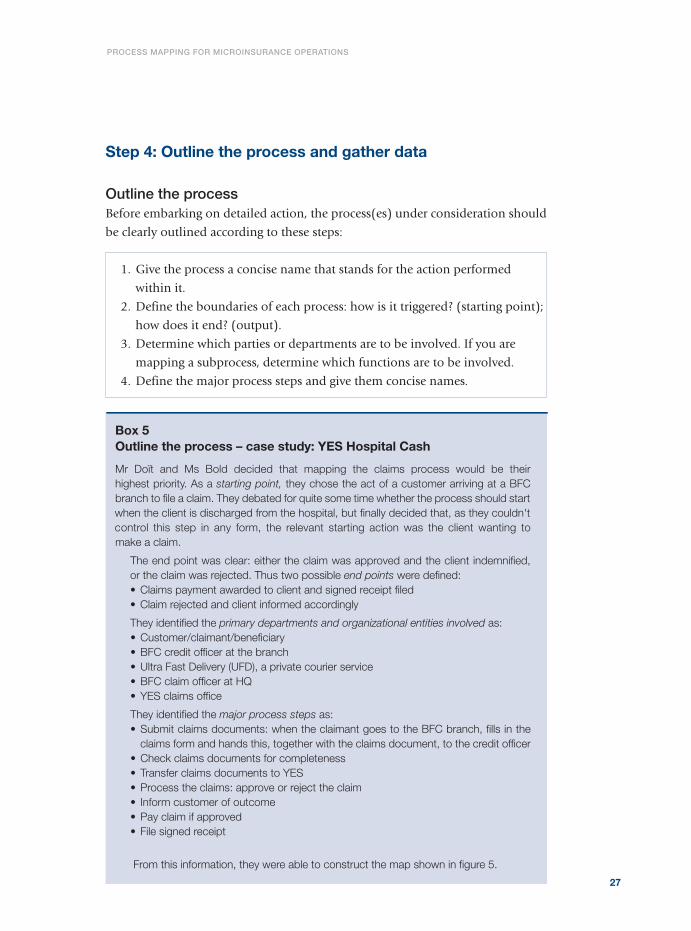
Box 5Outline the process – case study: YES Hospital Cash
Mr Doït and Ms Bold decided that mapping the claims process would be their highest priority. As a starting point, they chose the act of a customer arriving at a BFCbranch to file a claim. They debated for quite some time whether the process should startwhen the client is discharged from the hospital, but finally decided that, as they couldn'tcontrol this step in any form, the relevant starting action was the client wanting to make a claim.
The end point was clear: either the claim was approved and the client indemnified, or the claim was rejected. Thus two possible end points were defined:• Claims payment awarded to client and signed receipt filed• Claim rejected and client informed accordingly
They identified the primary departments and organizational entities involved as:• Customer/claimant/beneficiary• BFC credit officer at the branch• Ultra Fast Delivery (UFD), a private courier service• BFC claim officer at HQ• YES claims office
They identified the major process steps as: • Submit claims documents: when the claimant goes to the BFC branch, fills in theclaims form and hands this, together with the claims document, to the credit officer
• Check claims documents for completeness• Transfer claims documents to YES• Process the claims: approve or reject the claim• Inform customer of outcome• Pay claim if approved• File signed receipt
From this information, they were able to construct the map shown in figure 5.

3. THE SIX STEPS IN CREATING A PROCESS MAP
$ BFC credit officer at branchClaimant
Cla
ims
pro
cess
ing
Trigger: claimant walks into BFC
branch to make a claim
End: claim rejection is
communicated to claimant
checks claims documents for completeness
t
fills in claims documents
p
where the process starts
time linecosts
macro process
UFD
d
claims form
hard copy document
28
Figure 5. Outlining the claims process
PROCESS MAPPING FOR MICROINSURANCE OPERATIONS
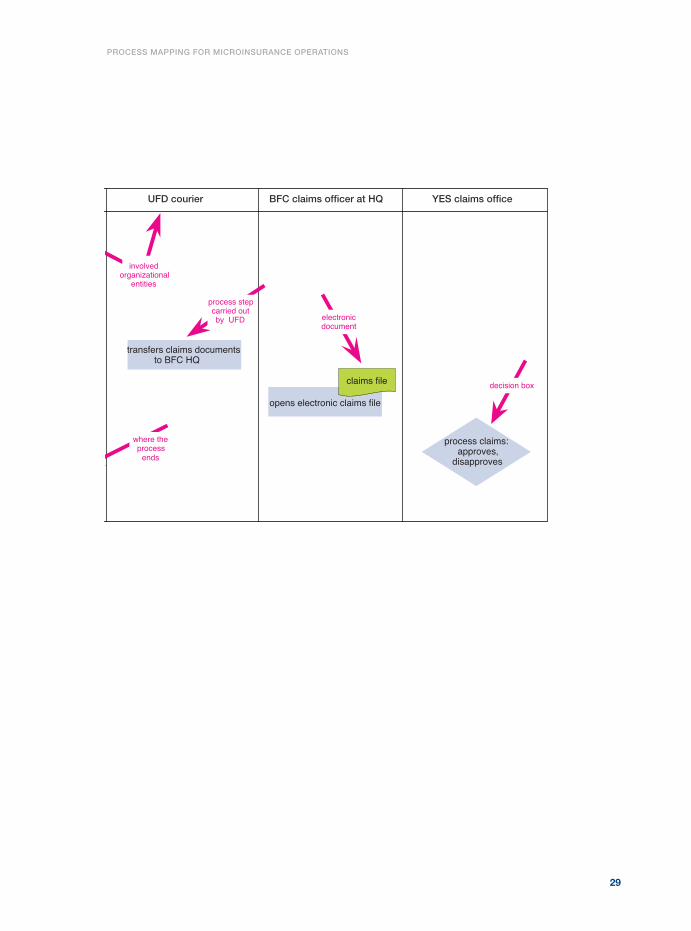
29
YES claims officeBFC claims officer at HQ UFD courier
transfers claims documents to BFC HQ
process claims: approves,
disapproves
involved organizational
entities
process step carried out by UFD
decision box
where the process
ends
opens electronic claims file
claims file
electronic document
3. THE SIX STEPS IN CREATING A PROCESS MAP
Gather dataIt is probably best to start off with a brainstorming session with the team on the
process(es) to be mapped. Alternatively, the facilitator could present a rough
version of the process and map in one-on-one meetings with team members,
gradually improving the map as the discussion proceeds. Maps of existing processes
should be based on actual findings, never on existing manuals or process maps.
If the whole team works together from the outset, unclear or overlapping tasks
and responsibilities can be discussed immediately. However, this approach requires
that the leader has strong facilitating skills or that an additional facilitator is
involved. It also might prove difficult to bring everyone together at one time for a
workshop. The approach used depends largely on the experience and preference
of the team leader, as well as on the complexity of the process to be mapped.
Whichever approach is used, it is essential that team members really feel
consulted and truly participate in the mapping process. They must feel that they
are being taken seriously and must feel comfortable telling the truth. This requires
diplomacy, honesty and clear communication, as many people interpret ‘more
efficient’ as code for ‘fewer jobs’. The emphasis should be on how an improved
process can assist all involved staff, making their lives easier and helping them
concentrate on core tasks.
If your mapping process includes field surveys, a questionnaire covering at least
the following points will prove helpful:
• Process descriptor;
• Person/position carrying it out/responsible for it;
• Frequency of process (how often it is performed per day or per week);
• Time taken to carry out the process steps fully;
• Inputs required (such as documents and signatures);
• Outputs produced (such as new files and system entries);
• Costs other than wage costs (for example costs of communications
and printing).
When gathering data, you will probably encounter gaps or suspected deviations
from the ‘normal’ process. If a manual exists for any of the processes you are
mapping, you will have to assess whether the process is following the method
given. The manual may, for example, describe steps that are important for control
purposes, while front-line staff may be taking shortcuts to make business processes
more ‘efficient’. Understanding the reasons behind these deviations may shed light
on important aspects of the process.
30

PROCESS MAPPING FOR MICROINSURANCE OPERATIONS
31
The map should be verified by interviewing several front-line staff in order to
capture all variants of how business is being done. If variations are detected, several
as-is maps should be drawn. It is advisable that only one person, normally the
process-mapping leader, actually draw the map(s), so that there is consistency of
style and logic.
Step 5: Draw a detailed mapIt is recommended that your process maps show the departments involved, the
time taken and the costs per step. This approach leads to maps that are easy to
read, yet contain a wealth of information.
In drawing the details of your map, each process step should cover the
following questions:
What is happening in this step?
Main or macroprocesses may be divided into subprocesses or single process
steps (tasks), which may or may not be described in detail. The level of detail
always depends on the purpose of the map. If you want to analyse risks involved
in the whole macro process, it makes sense to depict each step in detail. On the
other hand, if you are preparing a manual specifically for staff that deal with
clients, you do not need to describe in detail what other employees do.
When is it happening?
The process steps or subprocesses have to be put in the right sequence, starting
at the top and finishing at the bottom of the page.
Who does it?
The process step symbol is always placed in the column for the function,
individual or department that performs it. Unless specified otherwise, the one
that performs the task is also responsible for it.
What are the inputs and outputs?
This information captures the interface between the different process steps.
What kind of document is handed over, and in what form (hard copy, digital)?
Is there a special documentation step that defines the input or output of this
step (e.g. entry in database) or does an existing document within the process
serve this function?

How much time does it take?
How much time is spent on this process step? In many cases, daily workflow
may not be smooth, but organized in batches: for example, sending documents
twice a week to head office, or a claims committee meeting every Wednesday.
This should be shown on the map. Simply indicate hours and weekdays
where appropriate.
Three different types of time can be distinguished:
• Active, value-adding time: at the end of the step, the information status is altered,
new insights are gained, a new document or data entry into an MIS is created;
• Dead time: passage of time in which there is no actual processing of the
content or storing of a document (e.g. waiting periods, batching of
applications, shipping and mailing);
• Client time: time taken for a client to travel to a branch or wait in the queue.
When designing processes, all too often the client’s time and efforts are
forgotten, because they do not cost the business directly. However, an
important factor for making a product attractive to the client is that minimal
effort is needed from the client side.
Although these three types of time help to identify bottlenecks and time-
wasting steps, they also add complexity to the map. They should therefore
be differentiated on the map only if really needed.
How much does it cost?
Similar to the time line, an axis for costs can be introduced, if required, showing
how much each step costs. Costs include external costs such as fees to external
service providers (for example, for cashing checks), stationery (forms, documents,
letters) and office supplies (toner, ink cartridges, disks), communications costs
(phone, fax, e-mail) and internal costs, such as employee work time.
The cost axis will include some sensitive data, such as employees’ wages. Thus it
may be preferable to insert the cost component for analysis and discussion with
higher management, but delete it in the process map sent for general distribution.
Why is it happening?
Try to understand the reason why a specific step is done the way it is. Ask those
performing an action for their view and their thoughts as to how it could be
done more conveniently – for them, as well as for the client.
Some doubling up of tasks is required in microinsurance, especially for control
purposes. The map should make explicit which tasks are done for control
purposes only, as opposed to those tasks focused on the content level.
3. THE SIX STEPS IN CREATING A PROCESS MAP
32

PROCESS MAPPING FOR MICROINSURANCE OPERATIONS
33
Box 6Detail the map – case study: YES Hospital Cash
Mr Doït and Ms Bold’s workshop aimed to really understand what was going on at everylevel during the claims process. The final list of participants consisted of: two credit officersworking at a southern branch, a senior credit officer managing a northern branch and aclaims officer at BFC HQ. From YES, two claims officers working in the claims departmentand the senior claims officer were invited.
After a long and tumultuous discussion, the following picture emerged:• To make a claim, clients are requested to go to a BFC branch. There, uponpresentation of their insurance certificate, they get a claims form from the creditofficer, fill it in and, together with the hospital discharge form, hand it back to thecredit officer. Including waiting time, this takes on average 30 minutes.
• The credit officer briefly checks the forms submitted by the client for completeness(on average 15 minutes) and batches all of them for shipment to BFC HQ throughthe courier service UFD. Shipments are done daily. Mail is picked up at 10 a.m. anddelivered within 24 hours.
• At BFC HQ, the claims officer again checks the claims documents (though oftenonly the next day). Documents that appear to be incorrect or incomplete are sentback to the branch. If everything is in order, the claims officer opens an electronicclaims file in the MIS (average time 30 minutes) and then sends the physicaldocuments through UFD to YES. Shipments are done daily, with mail picked up at6 p.m. and delivered at 9 a.m. the next day.
• At YES, the claims officer checks the validity of the claim. Normal cases can beprocessed within two working days, but if there are inconsistencies or questions, itcan take more than a week. The senior claims officer then signs off on all decisionsmade by the claims officer. Average turnaround time is estimated at 10 days,although there is no direct proof of this, as there is no claims tracking systemcurrently in place.
• Claim documents for approved claims are filed at YES, while rejected claims are sentback to BFC.
• At 5 p.m. of each working day, YES e-mails a consolidated list of all newly approvedand rejected claims to BFC’s claims officer.
• The claims officer at BFC makes the necessary entries in the MIS and e-mails thecredit officer responsible for the clients concerned. Normally this takes 6 hours forthe whole batch of claims.
• The credit officer informs his/her client of the decision (10 minutes on average, assometimes s/he has to make multiple calls or explain the process).
• Clients whose claims are approved have to come to the BFC branch to receive thepayment from the credit officer. Most clients come in the same day they are informed,or the day after.
• The credit officer sends the receipts through UFD to the claims manager at BFC HQ(24 hours).
• BFC's claims manager enters the date of settlement into the MIS and files thereceipts, which typically takes 5 hours per batch.

Step 6: Finalize the mapAfter the first complete draft of a map has been drawn, the team needs to look at
it and give further feedback. Does it really mirror what is happening or does it
gloss over inefficiencies or lack of clarity?
3. THE SIX STEPS IN CREATING A PROCESS MAP
34
$ BFC credit officer at branchClaimant
Cla
ims
pro
cess
ing
Trigger: claimant walks into BFC branch to make
a claim
checksclaims documents for
completeness
t
fill in claims form
batch for dailydelivery by UFD
complete
not complete
presents insurancecertificate
hands over claims form0.5h
0.25h
24-47h
up to 24h
0.5h
claims form
insurancecertificate
hospitaldischarge
form
Figure 6. As-is map for claims process: YES Hospital Cash

PROCESS MAPPING FOR MICROINSURANCE OPERATIONS
For certain process steps there may be different versions, especially if different
people carry out the same task in different branches or locations. No matter how
many versions, make sure they are all mapped and explicitly labelled. Mapping
several existing versions of a process can be very useful when you will later try to
optimize the process. You can map certain subprocesses separately, or use dotted
arrows and different colours for different versions of the same process.
35
YES claims officeBFC claims officer at HQ UFD courier
transfers claimsdocuments to BFC HQ
not complete
complete
openselectronic claims file
claims file
batch for daily deliveryby UFD
claims
documents
claims documents
checksclaims documents for
completeness

3. THE SIX STEPS IN CREATING A PROCESS MAP
36
$ BFC credit officer at branchClaimant
Cla
ims
pro
cess
ing
up to 240h
6h
End2: claimant accepts claim
rejection
claimant goes to BFC branch to collect money
and sign receipt
c
credit officerinforms client
approved claims
rejected claims
claim is paid
receipt
t
15-24h
0.15h
5h
24h
Figure 6. As-is map for claims process: YES Hospital Cash
YES Hospital Cash claims process as-is map, 31 August 2009.

PROCESS MAPPING FOR MICROINSURANCE OPERATIONS
37
YES claims officeBFC claims officer at HQ UFD courier
claim information
End1: signed claim receipt is filed
approved
consolidates list ofapprovals and denials
and sends to BFC
processesclaims: checks,
approves, disapproves
chief claims officerconfirms decision
not approved
list ofclaims
enters in MIS and informs credit officer by e-mail
transfers claimsdocuments to YES HQ
receiptpayment date isentered in MIS
transfers claims documents to YES HQ
approved claim documents
claims documents


4. The art of analysing andimproving processes
©IFAD/G.M
.B.Akash

The main goal of process mapping is to improve an existing process or set up an
optimal new process. In order to achieve this, a detailed analysis of the map is
necessary, and all relevant aspects of the map must be scrutinized.
The purpose of the analysis is to uncover inefficiencies, risks, bottlenecks and
unnecessary complexities. This is the basis for an improved version of the map,
known as the should-be map. This map is established in two stages. First, an
idealized should-be map is produced, then it is tested in reality, and after a certain
trial period a final should-be map is established.
Analysis is always done on an as-is map. However, even if you are mapping a
new process or revising a should-be map, a thorough analysis must be carried out
as discussed below.
Involving the teamIt is best to involve the whole mapping team in process analysis. Employees often
already know which processes are inefficient and they have ideas about how to
improve them. But even if they don’t have such ideas, the mere fact of staff
participating in the optimization process will mean that there is a greater chance
that implementation of the new process will proceed smoothly.
4. The art of analysing andimproving processes
40

PROCESS MAPPING FOR MICROINSURANCE OPERATIONS
41
Finding areas of concernReducing complexityProcesses often grow ‘organically’ without thorough planning, and process maps
can reveal how surprisingly complex such processes have become. It is always worth
asking whether the existing level of complexity is necessary and whether it is
possible to simplify a process.
Questions to ask to reduce complexity:
• Are all process steps necessary? (Excessive handover of work, in particular,
adds unnecessary complexity.)
• Are the tasks sufficiently consolidated? (One wants to avoid
over-specialization.)
• Do all people currently involved really need to be involved?
• Are all supervision and control points really adding to quality?
• Does the order of process steps make sense, or can you reduce complexity
by changing it?
• Are the same data being manually captured on more than one system?
Measures to take:
• Eliminate unnecessary process steps.
• Consolidate tasks.
• Reduce excessive control and supervision (multiple approvals).
• Simplify the sequence of steps.
• Reduce manual steps between computer systems.
• Eliminate double registration, such as entering the same data twice in
separate IT systems.

4. THE ART OF ANALYSING AND IMPROVING PROCESSES
42
Box 7Analyse complexity – case study: YES Hospital Cash
The as-is map derived from the BFC/YES mapping workshop was confirmed throughseveral one-on-one interviews. It showed at least two areas where processes could be streamlined:
• Issue 1: Checking of claims documents. Currently claims checking is done threetimes: in a first step by the credit officer at the branch, then by the claims officer atBFC HQ and finally by the claims officer at YES. The analysis showed that while YESreturns only 1-2 per cent of all submitted claims to BFC's claims officer, the rate ofincomplete claims handed in by the credit officers to BFC is about 25 per cent.
Solution 1: Credit officers should be better trained in claims handling, as the currentprocess adds significantly to work and delays. As things stand now, claims officershave no real incentive to do a good job, because they know that HQ staff will checkeach case again. Ms Bold proposed adding a small bonus element to encouragecareful claims handling, with penalties if the rejection rate rises above 5 per cent.
Solution 2: A more radical proposal was that the claims office should be eliminatedcompletely, as all documents will be checked again by YES. This proposal wouldobviously change the claims process substantially.
• Issue 2: Senior claims officer at YES. The added value of signing off on the claimsdecisions made by claims officers turned out to be minimal for microinsuranceclaims. There were hardly any cases where the senior claims officer didn't agree withthe proposed decision. Yet because he was so busy, waiting for his approval priorto informing BFC about the outcome was causing an average delay of up to a week.
Solution: Empower the claims officers to decide on YES hospital cash claims withoutfurther approval. Instead of systematic sign-offs, initiate periodic claims analysis bythe internal audit department. This will cost less and speed up the claims process.

PROCESS MAPPING FOR MICROINSURANCE OPERATIONS
Analysing responsibilitiesMany delays or errors in processes occur because people’s responsibilities are not
clearly defined. For any business process, it should be obvious who does what and
who is accountable for it.
Questions to ask to reduce complexity:
• Is there a person who is clearly responsible and accountable for each
processing step?
• Who signs the relevant document(s)?
• Is there anyone who has to be consulted for a task to be completed?
• Is there anyone who needs to be informed for a task to be completed?
• Are there deputies for each task if someone is ill, on leave or resigns?
Measures to take:
• Every process step must clearly specify who is responsible for carrying out
the task and who is responsible for seeing that the task is completed (this
is often the same person).
• Clarify who can authorize what.
• Set clear rules about the communication flow.
• Appoint (and plan to train) deputies for each position.
43
Box 8Analyse responsibilities – case study: YES Hospital Cash
In general, the process map showed that the responsibilities were clear. Everyone knewwhat his/her tasks and responsibilities were. There was, however, one area whereresponsibility did not seem to be distributed wisely – in the checking of claims documents.
• Issue: Checking of claims documents. As mentioned above, this step is donethree times. There are two possible causes for the poor performance of credit officerswhen handling claims documents. First, they may not feel fully responsible forchecking the documents, as they know that the claims officer at HQ will check again.Second, they may lack proper training to carry out this task.
Solution: If the credit officers get better training in claims handling, they should be able to improve their performance and assume the whole responsibility forchecking claims documents within BFC branches. The check at BFC HQ could thenbe eliminated.
4. PROTOTYPE DESIGN AND TESTING
44
Analysing riskOften a primary goal for the whole process-mapping exercise is to reduce and
control the various types of risk. Some, such as fraudulent claims, have direct
financial consequences. Others are more difficult to quantify, such as poor
customer service.
Risks can be classified according to their probability of occurrence and the
weight of their impact. Those with high probability and high impact should be
tackled first. Second priority should be given to those with low probability and
high impact.
Properly designed microinsurance processes will minimize at least three areas
of risk: fraud, data inconsistency and tarnished reputation. Even though these are
all closely interrelated, it may be useful to analyse them separately.
• Fraud tends to occur either with the handling of cash (premiums as well as
claims) or with forged documents. Two crucial tasks here are client
identification and making sure that the documents supporting a claim are
really connected to the claimant. Bear in mind that it is not only insurance
clients who may be trying to deceive you, but possibly employees of your
own business and partnering institutions. People handling cash are especially
prone to the risk of fraud. There are also other fraud risks besides simple cash
transactions, for example in medical insurance fraud occurs through patient
substitution or over-treatment by physicians.
• Data inconsistencies may result from multiple data entry into different
systems or from data sets containing conflicting entries. Keying the same data
into separate systems will inevitably lead to inconsistencies. Thus one should
aim to have data captured once and then transferred among IT applications.
Conflicting entries can occur when, for example, premium payments are
erroneously booked to a person who is no longer a customer, or claim
payments are made to a customer who did not file a claim. Such conflicting
entries are best dealt with through consistency checks built into the IT
system itself.

PROCESS MAPPING FOR MICROINSURANCE OPERATIONS
45
• Reputation. It is common wisdom that a good reputation is much more
easily lost than gained. Reputation is closely tied to client satisfaction, which
is based on proper information, competent answers to clients’ questions and
living up to promises made. Keeping clients informed at each interaction is
crucial, from the sales process up to when they file a claim. Client satisfaction
can be thought of as expectation management: after the interaction, clients
should know what they might expect (what the next step will be or how long
it will take to have a response). Documents should be easy to track down, so
that any potential questions can be answered properly. Clients should receive
receipts for all documents they hand in. Lost documents will definitely not
inspire client confidence.
Questions to ask in order to minimize risk:
• What is the business’s experience with risk? Has anything gone wrong before?
• How would you be able to cheat the system if you were a client, or if you
were an employee?
• Is there any step in your process that relies solely on honesty?
• What data are captured and where? Are there ways to avoid double
data entry?
• Is it possible to create an inconsistent data file in your system?
• What happens with your client records when clients cancel their insurance?
• Do you make sure that clients know what they may expect – and by when?
• Do you hand out receipts for each item (premium, claims documents) you
receive from your clients?
• Is there a traceability system in place that allows you to identify where a
certain document should be found or where it may have been lost?
Measures to take:
• Impose double signature (the four-eye principle) for steps that rely too
much on the honesty of a sole actor.
• Identify your client clearly.
• Transfer data electronically rather than key them in anew.
• Build consistency checks into your IT system and run periodic analyses.
• Give clients written receipts.
• Give clients the name and contact information of a person to whom they
can address complaints and further questions.
• When sending physical documents, make sure you can trace them.
4. PROTOTYPE DESIGN AND TESTING
46
Analysing the time lineThe time a process takes can affect both customer satisfaction and cost. One major
influence on the time a process takes is, of course, complexity. Reducing
unnecessary complexity in a process usually also saves time.
The main goals of time reduction should be that:
• The overall time is within the range of ‘best practice’;4
• The customer accepts the overall time.
Box 9Analyse risks – case study: YES Hospital Cash
The claims process map for BFC/YES showed some distinct opportunities for reducing risk:
• Issue: Double data entry. BFC's claims officer currently sends a hard-copy list ofall new claims along with the claims documents to YES. The YES claims officer thenhas to enter all these data anew into his or her IT system. This adds to costs and isa source of data inconsistency.
Solution: An immediate solution would be to send the data by e-mail to YES. Forthe mid-term future, both companies should consider partial integration of theirrespective IT systems in order to exchange data easily.
• Issue 2: Lost claims documents. Ms Bold reported several cases of clientscomplaining that their claims had never been settled. But as the clients had notreceived receipts when filing their claims, they could not prove having done so. MsBold checked BFC’s MIS and could not find any claims file opened for these clients.Thus, either the clients had tried to cheat by pretending that they had filed a claim,or the claim documents got lost during shipment from the branch to BFC HQ.
Solution 1: Two measures could help remedy this issue. First, all clients handing inclaims documents should receive a receipt. Second, shipments of documentsthrough UFD should be accompanied by a list detailing all documents included. Thecourier should then sign a copy and the receiving party should check and sign thatthe documents had been delivered.
Solution 2: A more radical solution would be to eliminate the courier servicealtogether and replace it with an entirely digital system. Instead of sending the claimsdocuments by courier, the credit officer could enter the claims details directly intothe MIS, scan the documents and send them by e-mail to BFC HQ. HQ would thenbe responsible for ensuring that the entries in the MIS and the documents sentcorrespond. (This solution is considered in more detail in the discussion about costs below.)
4 Best practice’ in microinsurance has been difficult to determine, as very little data are available. This situationshould improve with more organizations monitoring and tracking their performance indicators. To give anexample, clients usually consider 2-5 days an acceptable time for receiving compensation for a claim.

PROCESS MAPPING FOR MICROINSURANCE OPERATIONS
47
Non value-adding process steps (‘dead time’)
It is useful to distinguish between value-adding time – the time in a process step
that actually adds value to the product – and ‘dead time’, meaning the delays or
process steps that customers would not normally be willing to pay for. This does
not mean that all dead time is spent uselessly or can be avoided. But it makes
sense to analyse each of the steps contributing to dead time to see if they are
really necessary.
Examples of dead time include requiring that a certain document has to be
checked several times by senior employees, or that senior employees have to sign
off on a certain document often without checking its content in detail. In principle,
dead time actions do not directly add value to the product. The process-mapping
team should question whether the time lost as a result of such procedures is
well invested.
Delays due to bottlenecks
Time inefficiency also occurs because of bottlenecks. These could be due to staff
shortages, or because of badly coordinated processes that do not always deliver a
necessary input at the required time. Batched processing of documents at fixed
intervals (such as the weekly meeting of a claims committee) is a frequent
source of delays. Most bottlenecks can be easily spotted if the time line reflects
reality accurately.
Questions to help reduce time:
• Where is most of the time spent? Why?
• Does each step add value either for the customer or the service provider?
If not, what is its purpose?
• Is there any ‘dead time’ that could be reduced?
• Is the process unnecessarily complex?
• Do you lose time due to bottlenecks?
Measures to take:
• Minimize complexity.
• Minimize ‘dead time’.
• Eliminate bottlenecks.

4. PROTOTYPE DESIGN AND TESTING
48
Box 10Analyse the time line – case study: YES Hospital Cash
When the core mapping team looked at the as-is map, it became obvious that there wasno way that processing claims within 48 hours could be done as promised in the YESHospital Cash product leaflet. It was agreed that, before simply deleting this statement fromthe leaflet, the time for the claims process should be optimized and clients asked whetherthe resulting processing time would be acceptable.
The mapping team identified several ways of speeding up the claims process:
• Area 1: Checking claims documents. As noted above (box 7: Analyse complexity),in 25 per cent of all cases, significant time could be saved if the branch credit officerswould check the claims documents properly.
Solution: Eliminate the loop between the credit officer and BFC's claims officer. Thiswill easily reduce process time by three working days.
• Area 2: Shipment of claims documents. UFD picks up mail at 10 a.m. at thebranch and delivers it within 24 hours. This means that the documents received inthe branch after 10 a.m. on day 1 are only shipped on day 2 and arrive atheadquarters on day 3.
Solution 1:Move the mail pick-up time from 10 a.m. to 5 p.m. and let the shipmentto BFC HQ go overnight. This would save a whole day of processing time.
Solution 2: A more radical change would be to not ship the documents at all, butto scan and e-mail them. If the courier was replaced by e-mailing of digitaldocuments, this would save twice the delivery time of 24-48 hours and holds thepotential of considerable time and cost savings. It would mean that YES could startworking on a claim the same day that it was presented by the client. However, thismethod does have its disadvantages. First, all branches would have to be equippedwith a scanner, and this would only be economical if BFC used scanners in its dailycredit business. Second, YES may sometimes still require the physical document tocheck for fraud (e.g. to see if a white-out pen has been used). In some countries itis illegal to accept a claim without seeing a physical document as proof.
• Area 3: Signature of YES chief claims officer. As discussed in box 7, the signatureof the senior claims officer does not add any value, yet it delays claims processingon average by up to a week.
Solution: This step could be eliminated entirely and replaced by periodic claimsaudits. Obtaining this signature is a severe bottleneck, and eliminating this step couldeasily speed up the process by a whole week.
PROCESS MAPPING FOR MICROINSURANCE OPERATIONS
49
Analysing costsCosts have to be minimized for at least two reasons. First, reducing costs has a
direct positive contribution to the bottom line. Second, microinsurance customers
are very price-sensitive: the lower the price, the more customers can be attracted.
As microinsurance sustainability is based on large client numbers, keeping costs
low is critical.
The mapping team should ask these questions:
• Is the price of the service in the should-be map within an acceptable range for
the client?
• Is the client willing to pay this price?
• Is the margin for the company at this price acceptable?
• Is the product competitive in the market?
• Are there wasted expenditures that provide limited value or could be done
more cost- effectively?
• Can costs be reduced while maintaining appropriate levels of controls and
process speed?
Analyse the costs for each step. Are all costs necessary? What are the costly steps
and is there a way to make them cheaper?
Questions to ask to reduce costs:
• Which process step is the most costly? Why?
• How can costs be reduced without compromising quality?
Measures to take:
• Try to reduce steps that are expensive, but add no value to the product.
• Making processes simpler usually reduces costs as well.

4. PROTOTYPE DESIGN AND TESTING
50
$ BFC credit officer at branchClaimant
Cla
ims
pro
cess
ing
Trigger: claimant walks into BFC branch to make
a claim
checksclaims documents for
completeness
t
fill in claims form
batch for dailydelivery by UFD
complete
not complete
presents insurancecertificate
hands over claims form0.5h
0.25h
24-47h
up to 24h
0.5h
claims form
insurancecertificate
hospitaldischarge
form
3x check
3
no receipt for claimant
h
too long, especially if it has to be repeated
i
Figure 7: As-is map with bottlenecks and areas for improvement highlighted

PROCESS MAPPING FOR MICROINSURANCE OPERATIONS
51
YES claims officeBFC claims officer at HQ UFD courier
transfers claimsdocuments to BFC HQ
not complete
complete
openselectronic claims file
claims file
batch for daily deliveryby UFD
claims
documents
claims documents
checksclaims documents for
completeness
3x check
n
high rate of incomplete claims
t
inconvenient pick-up time
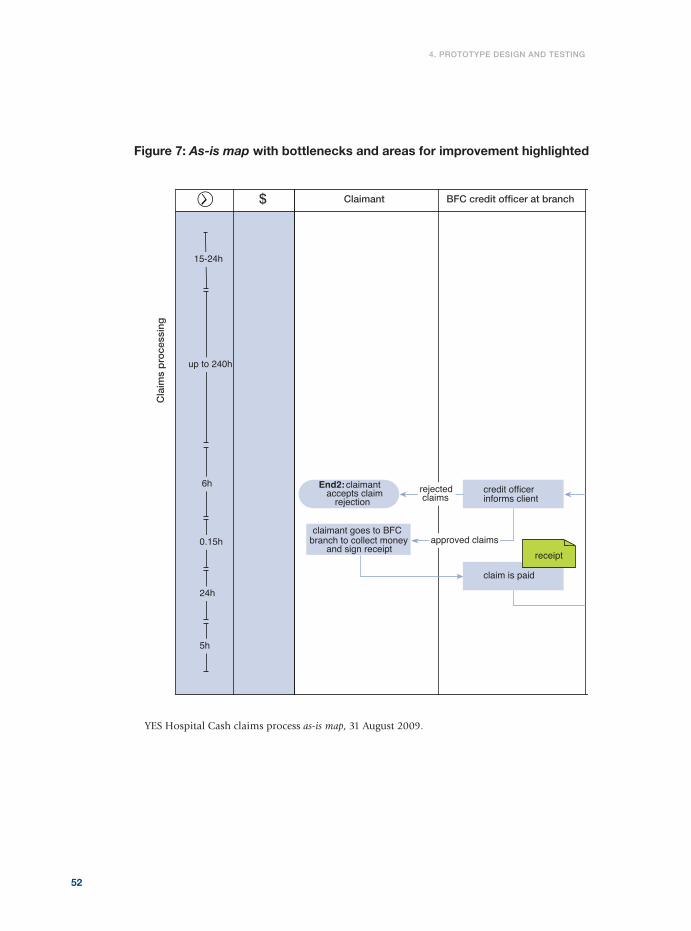
4. PROTOTYPE DESIGN AND TESTING
52
$ BFC credit officer at branchClaimant
Cla
ims
pro
cess
ing
End2: claimant accepts claim
rejection
claimant goes to BFC branch to collect money
and sign receipt
c
credit officerinforms client
approved claims
rejected claims
claim is paid
receipt
t
up to 240h
6h
15-24h
0.15h
5h
24h
Figure 7: As-is map with bottlenecks and areas for improvement highlighted
YES Hospital Cash claims process as-is map, 31 August 2009.

PROCESS MAPPING FOR MICROINSURANCE OPERATIONS
53
YES claims officeBFC claims officer at HQ UFD courier
claim information
End1: signed claim receipts is filed
approved
consolidates list ofapprovals and denialsand sends to BFC
processes claims: checks, approves,
disapproves
chief claims officerconfirms decision
not approved
list ofclaims
enters in MIS and informs credit officer by e-mail
transfers claimsdocuments to YES HQ
receipts
payment date isentered in MIS
transfers claimsdocuments
to YES HQ
approved claim documents
claims documents
3x check
step with low benefit
transfer of hard copy requires double data entry
u

4. PROTOTYPE DESIGN AND TESTING
Drawing the ‘should-be’ mapAfter the bottlenecks, risks and inefficiencies have been detected, the map can be
transformed from an as-is map to a should-be map. It is not always obvious how to
54
$ BFC credit officer at branchClaimant
Cla
ims
pro
cess
ing
hands out receipt to claimant
scans claims documents and opens electronic claims file in MIS and sends all to YES and the BFC claims office by
e-mail claims file
Trigger: claimant walks into BFC branch to make
a claim
checksclaims documents for
completeness
fills in claims formhospital
dischargeform
complete
not complete
presents insurance certificate
hands over claims form
claims form
0.5h
0.25h
0.5h
insurance certificate
receipt
claims documents
Figure 8: Should-be map for claims processes: YES Hospital Cash
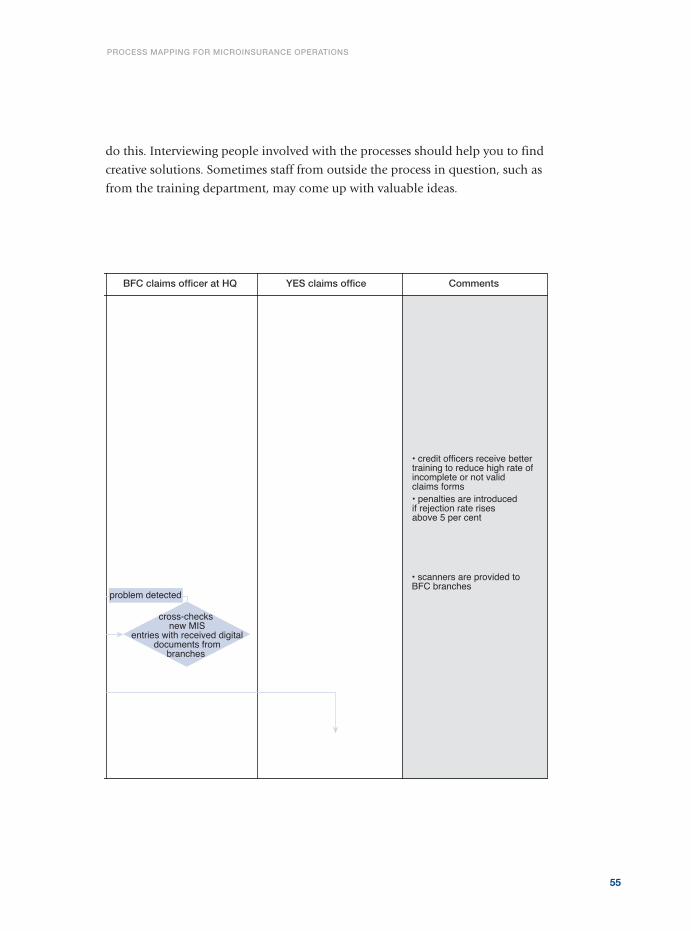
PROCESS MAPPING FOR MICROINSURANCE OPERATIONS
do this. Interviewing people involved with the processes should help you to find
creative solutions. Sometimes staff from outside the process in question, such as
from the training department, may come up with valuable ideas.
55
YES claims officeBFC claims officer at HQ Comments
• credit officers receive bettertraining to reduce high rate ofincomplete or not validclaims forms • penalties are introducedif rejection rate risesabove 5 per cent
• scanners are provided toBFC branches
cross-checks new MIS
entries with received digitaldocuments from
branches
problem detected
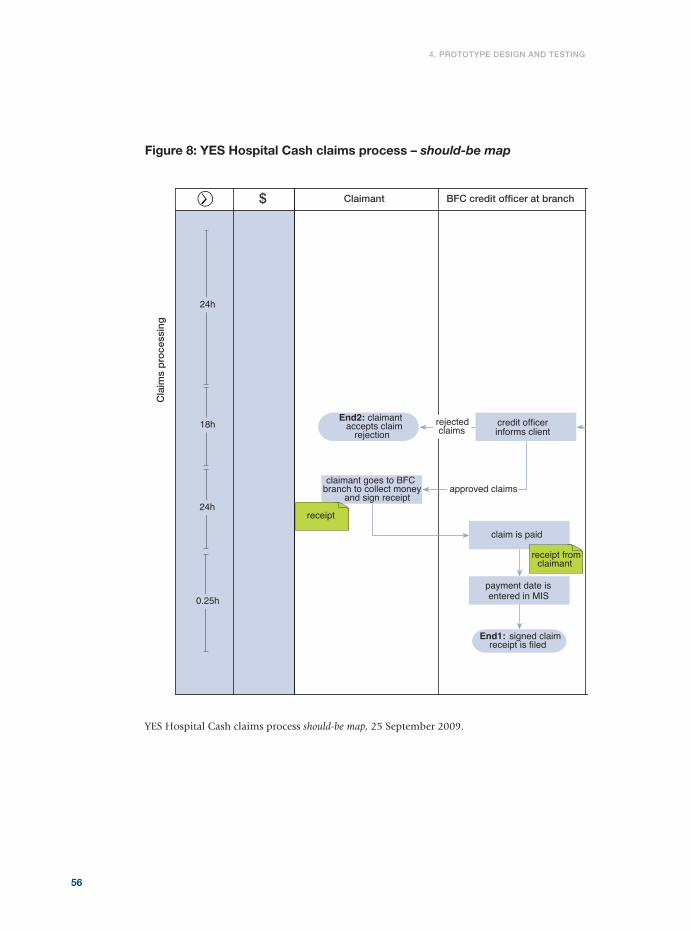
4. PROTOTYPE DESIGN AND TESTING
56
$ BFC credit officer at branchClaimant
Cla
ims
pro
cess
ing
End1: signed claim receipt is filed
End2: claimant accepts claim
rejection
claimant goes to BFC branch to collect money
and sign receipt
credit officerinforms client
approved claims
rejected claims
claim is paid
receipt from claimant
payment date is entered in MIS
24h
18h
receipt
24h
0.25h
Figure 8: YES Hospital Cash claims process – should-be map
YES Hospital Cash claims process should-be map, 25 September 2009.

PROCESS MAPPING FOR MICROINSURANCE OPERATIONS
57
YES claims officeBFC claims officer at HQ Comments
sends consolidated list of approvals and denials to BFC HQ and branch by
processes claims: checks, approves, disapproves
list of claims
enters in MIS
• the YES claims officer hasto process the claim within24 hours (1 working day).S/he is entitled to approveor deny
• the BFC credit officer hasto immediately notify theclaimant (max up to half aworking day later)
enters claim datain YES MIS
• the claimant can collecthis/her money immediatelyafter notification
• the chief claims officerdoes not sign off on the claims anymore. Instead regularinternal audits replace thequality check
claim information

4. PROTOTYPE DESIGN AND TESTING
58
Box 11The should-be map – case study: YES Hospital Cash
After Mr Doït and Ms Bold presented their analyses of the claims process to their respectivemanagements, the following changes were agreed to:
• Improve training for credit officers at the BFC branches and make them responsiblefor properly filled-in claims documents. Penalties are to be introduced if the rejectionrate at YES rises above 5 per cent, and a small bonus will be paid to claims officers ifit stays below 1.5 per cent. These measures will eliminate the check at BFC HQ.
• After a long discussion, BFC and YES management decided to further digitize thewhole process. They agreed to buy scanners for the branch offices, which will allowthe credit officers to directly enter claims data into the MIS. The service of the UFDcourier becomes redundant, which substantially reduces time and potential risks, aswell as costs.
• YES management agreed that the senior claims officer would no longer have to signoff on every claim. Instead, regular internal audits will ensure quality. As this step usedto be a severe bottleneck, this change will speed up the process by up to a week.
• All claimants will receive receipts for submitted documents.
The measures agreed to will speed up the process considerably. Previously, claimants hadto wait for at least two weeks to be paid (often much more). The original promise, asadvertised, was to pay within 48 hours, which was hopelessly misleading to clients. Thechanged process would make it possible to meet this promise, although even here, thiscould only be guaranteed in cases where all process steps worked perfectly. To be on thesafe side, YES decided to change their advertisement and promise payment within seven days.

5. Revised processes
©IFAD/Gerd Lud
wig

ImplementationA positive side effect of the whole process-mapping procedure – whatever the
analysis and the changes – should be that the process itself has involved staff at
all organizational levels. If they have the further chance to contribute their
expertise, opinions and ideas to the revised process, this should greatly facilitate
its implementation.
If an entirely new process is introduced or an existing one is to be changed
substantially, it would be a good idea to explain these changes in a workshop with
the help of the new should-be map. All changes and the reasons for them must
be explained in detail and all staff involved should have the opportunity to
ask questions.
However, even the most simple and innovative map is useless if not enough
effort is put into its implementation on the ground. The following points have to
be clearly communicated:
• What: What are the changes and for whom?
• When: From what point in time onwards do they have to be implemented?
• How: How will people be trained to implement the new processes?
• Troubleshooting: Who will answer questions about the new process?
• Feedback: How to give feedback about the new process?
• Revision: How long will the trial period be before a revised should-be map
is introduced?
5. Revised processes
60
5 See, for example, Wipf and Garand (2010).
Revision of processes The introduction of a should-be process should always begin with a pilot test. After
a certain time, feedback from this test should be consolidated and the final
should-be map can be drawn, which then becomes a reference for everyone.
Even this final should-be map is only temporary. All processes will continue to
be regularly checked. Internal audits are an appropriate way of checking whether
processes are in line with all requirements and relevant standards. Continuous
monitoring of key performance indicators5 will clearly help steer a microinsurance
business and detect deviations early on.
61
PROCESS MAPPING FOR MICROINSURANCE OPERATIONS
Box 12Implement changes – case study: YES Hospital Cash
The changes decided by management would alter some staff tasks substantially. It wasthus decided that team leaders should first speak with BFC claims officers, whose taskswould be considerably diminished. This proved to be no major problem, as the claimsofficers were overloaded with work anyway. They would now have time to take on anotherinsurance product recently introduced by BFC.
Convincing the senior claims officer at YES proved to be harder. Although severelyoverloaded with work, he insisted on the importance of his signature. Only after he wasshown the analysis of the process map did he agree on changing the procedure.
As the annual meeting of the BFC branch offices was just about to take place, Ms Boldorganized a workshop with the staff to explain the details of the new process. In order tomanage the increased workload, new staff had to be employed at larger branches. Beforechanging over to the new process, training was organized for the credit officers, whichrepeated the requirements of the claims process and introduced them to the MIS and thenew scanners.

Gilbreth, F.B., and Gilbreth, L.M. 1921. Process charts: First steps in finding the one best way to do work. Presentation given to the annual meeting of the AmericanSociety of Mechanical Engineers (ASME), New York, 5-9 December.
McCord, M.J. 2012. Microinsurance product development for microfinance providers.Rome: IFAD.
Wipf, J., and D. Garand. 2010. Performance indicators for microinsurance: A handbookfor microinsurance practitioners, 2nd ed. Luxembourg: Appui au DeveloppementAutonome (ADA).
Further resources
62


International Fund for Agricultural DevelopmentVia Paolo di Dono 4400142 Rome, ItalyTel: +39 06 54591Fax: +39 06 5043463E-mail: [email protected]
Microfinance Centre(MFC)ul.Noakowskiego 10/3800-666 Warsaw, PolandTel: +48 22 622 34 65Fax: +48 22 622 34 85E-mail: [email protected]
MICROINSURANCECENTRE
MicroInsurance Centre 1045 N Lynndale Drive, Suite 2EAppleton, WI 54914 USATel: +1 920 257-2179E-mail:[email protected]
October 2012