Process Layout
31
© 2007 Pearson Education D D D D G G G G G G M M M M M M A A A A L L L L L L L L Process La yo ut Chapter 8
-
Upload
jessie-radaza-tutor -
Category
Documents
-
view
17 -
download
0
description
LaYOUT
Transcript of Process Layout

7/15/2019 Process Layout
http://slidepdf.com/reader/full/process-layout-5633826ff0a4b 1/31
© 2007 Pearson Education
D D
D D
G G
G G
G G
M M
M M
M M
A A
A A
L
L L
L L
L L
L
Process Layout
Chapter 8

7/15/2019 Process Layout
http://slidepdf.com/reader/full/process-layout-5633826ff0a4b 2/31
© 2007 Pearson Education
How Process Layout
f i ts the Operat ions Management
Phi losophy
Operations As a Competitive
Weapon
Operations StrategyProject Management Process Strategy
Process Analysis
Process Performance and Quality
Constraint Management
Process Layout
Lean Systems
Supply Chain Strategy
Location
Inventory Management
Forecasting
Sales and Operations Planning
Resource Planning
Scheduling

7/15/2019 Process Layout
http://slidepdf.com/reader/full/process-layout-5633826ff0a4b 3/31
© 2007 Pearson Education
Layou t Plann ing
Layout planning is planning that involves decisions
about the physical arrangement of economic activity
centers needed by a facility’s various processes.
Layout plans translate the broader decisions about the
competitive priorities, process strategy, quality, and capacity
of its processes into actual physical arrangements.
Economic activity center : Anything that consumes
space -- a person or a group of people, a customer reception area, a teller window, a machine, a
workstation, a department, an aisle, or a storage
room.

7/15/2019 Process Layout
http://slidepdf.com/reader/full/process-layout-5633826ff0a4b 4/31
© 2007 Pearson Education
Before a manager can make decisions
regarding physical arrangement, four
questions must be addressed.
1. What centers should the layout include?
2. How much space and capacity does
each center need?
3. How should each center’s space be
configured?
4. Where should each center be located?
Layou t Plann ing
Quest ions

7/15/2019 Process Layout
http://slidepdf.com/reader/full/process-layout-5633826ff0a4b 5/31
© 2007 Pearson Education
Strateg ic Issues Impact and Implications
Layout choices can help communicate anorganization’s product plans and competitivepriorities.
Altering a layout can affect an organization and howwell it meets its competitive priorities in the followingways:
1. Increasing customer satisfaction and sales at a retail store.
2. Facilitating the flow of materials and information.
3. Increasing the efficient utilization of labor and equipment.4. Reducing hazards to workers.
5. Improving employee morale.
6. Improving communication.
7/15/2019 Process Layout
http://slidepdf.com/reader/full/process-layout-5633826ff0a4b 6/31
© 2007 Pearson Education
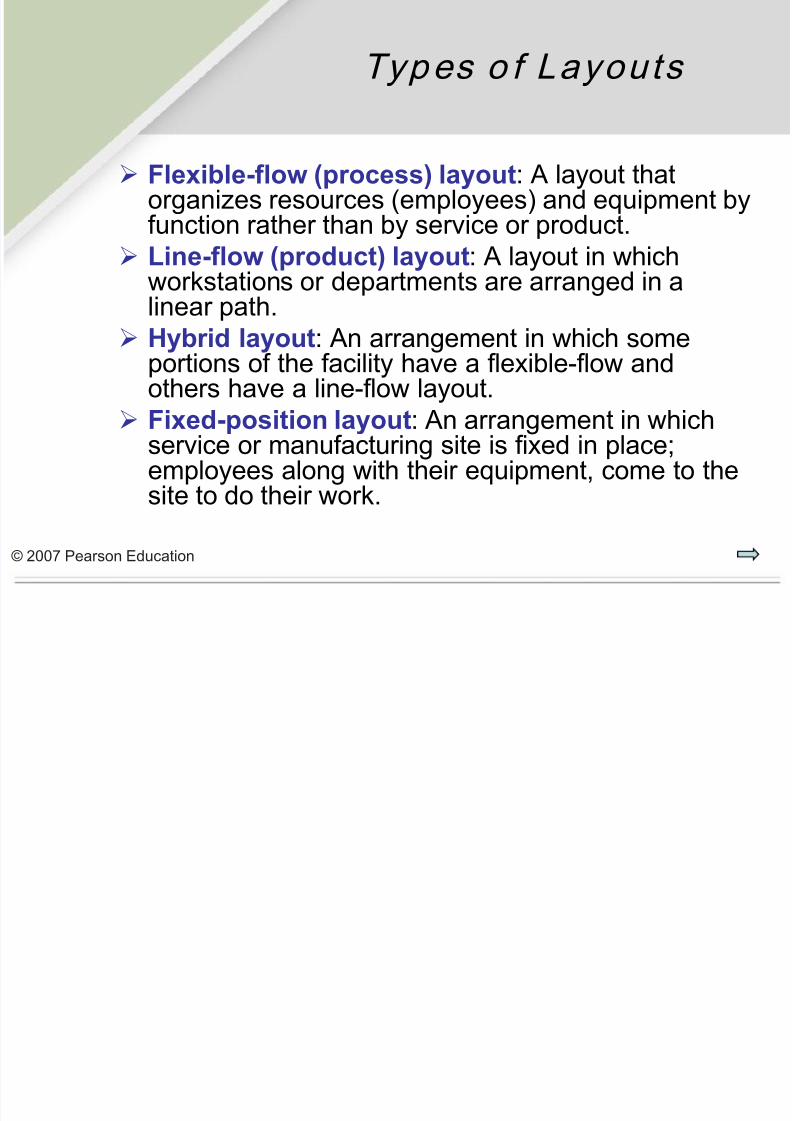
Types o f Layouts
Flexible-flow (process) layout: A layout thatorganizes resources (employees) and equipment byfunction rather than by service or product.
Line-flow (product) layout: A layout in whichworkstations or departments are arranged in alinear path.
Hybrid layout: An arrangement in which someportions of the facility have a flexible-flow andothers have a line-flow layout.
Fixed-position layout: An arrangement in whichservice or manufacturing site is fixed in place;employees along with their equipment, come to thesite to do their work.

7/15/2019 Process Layout
http://slidepdf.com/reader/full/process-layout-5633826ff0a4b 7/31
© 2007 Pearson Education
A Flexib le Flow Layou t
FoundryMilling
machines
LathesGrinding
Painting Drills
Office
Welding
Forging
A job shop has a flexible-flow layout.

7/15/2019 Process Layout
http://slidepdf.com/reader/full/process-layout-5633826ff0a4b 8/31
© 2007 Pearson Education
Line Flow Layout
Station 1 Station 2 Station 3 Station 4
A production line has a line-flow layout.
i

7/15/2019 Process Layout
http://slidepdf.com/reader/full/process-layout-5633826ff0a4b 9/31
© 2007 Pearson Education Ch 7 - 9© 2000 by Prentice-Hall Inc Russell/Taylor Oper Mgt 3/e
ompar ison
Produc t And Process
Layouts PRODUCT LAYOUT PROCESS LAYOUT
1. Description Sequential arrangement Functional grouping
of machines of machines
2. Type of Process Continuous, mass Intermittent, job shop
production, mainly batch production,
assembly mainly fabrication
3. Product Standardized Varied,
made to stock made to order
4. Demand Stable Fluctuating5. Volume High Low
6. Equipment Special purpose General purpose
7. Workers Limited skills Varied skills
i

7/15/2019 Process Layout
http://slidepdf.com/reader/full/process-layout-5633826ff0a4b 10/31
© 2007 Pearson Education Ch 7 - 10© 2000 by Prentice-Hall Inc Russell/Taylor Oper Mgt 3/e
ompar ison
Produc t And Process
Layouts PRODUCT LAYOUT PROCESS LAYOUT
8. Inventory Low in-process, High in-process,
high finished goods low finished goods
9. Storage space Small Large
10. Material Fixed path Variable pathhandling (conveyor) (forklift)
11. Aisles Narrow Wide
12. Scheduling Part of balancing Dynamic
13. Layout decision Line balancing Machine location
14. Goal Equalize work at Minimize material
each station handling cost
15. Advantage Efficiency Flexibility
7/15/2019 Process Layout
http://slidepdf.com/reader/full/process-layout-5633826ff0a4b 11/31
© 2007 Pearson Education
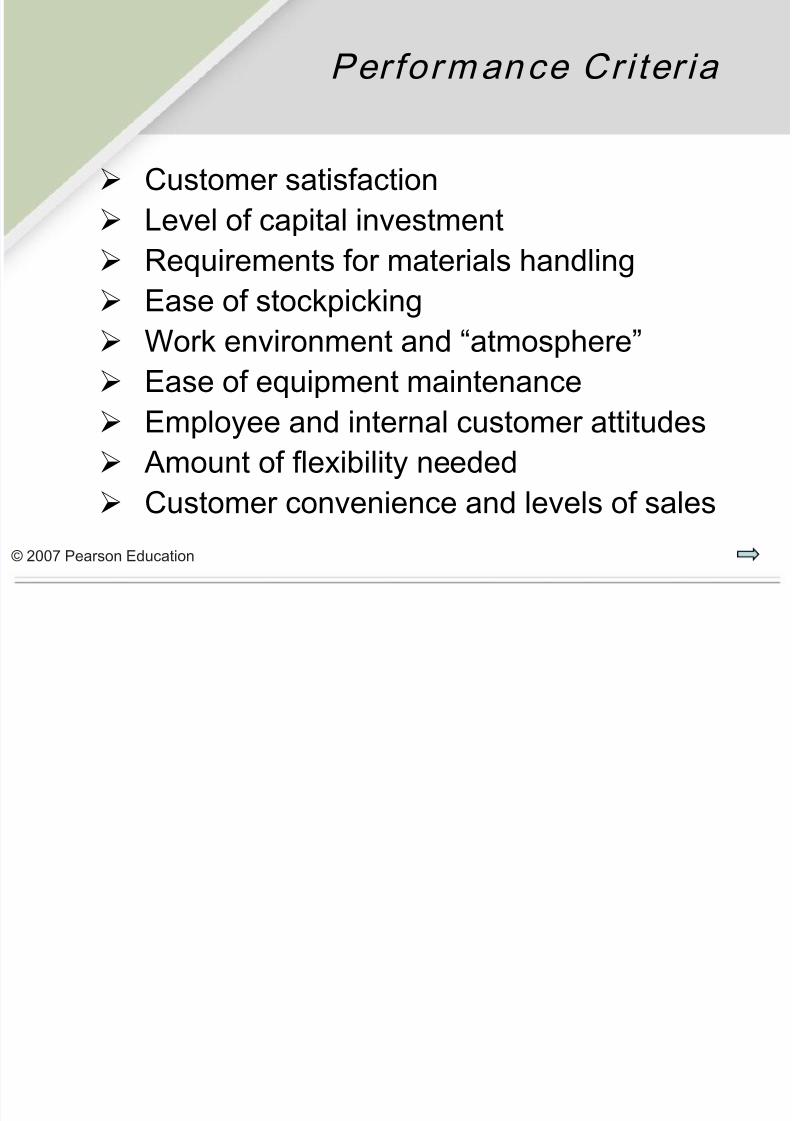
Performance Cri ter ia
Customer satisfaction
Level of capital investment
Requirements for materials handling
Ease of stockpicking
Work environment and “atmosphere”
Ease of equipment maintenance
Employee and internal customer attitudes Amount of flexibility needed
Customer convenience and levels of sales

7/15/2019 Process Layout
http://slidepdf.com/reader/full/process-layout-5633826ff0a4b 12/31
© 2007 Pearson Education
Creat ing Hyb r id Layouts
Layout flexibility is the property of a facility to
remain desirable after significant changes occur or to
be easily and inexpensively adopted in response to
changes.
A One-worker, multiple-machines (OWMM) cell is
a one-person cell in which a worker operates several
different machines simultaneously to achieve a line
flow.
A Cell is two or more dissimilar workstations located
close together through which a limited number of
parts or models are processed with line flows.

7/15/2019 Process Layout
http://slidepdf.com/reader/full/process-layout-5633826ff0a4b 13/31
© 2007 Pearson Education
Machine
1
Machine
2Machine
3
Machine
4Machine
5
Materials in
Finished
goods out
One Worker,
Mult ip le Mach ines

7/15/2019 Process Layout
http://slidepdf.com/reader/full/process-layout-5633826ff0a4b 14/31
© 2007 Pearson Education
Group Techno logy (GT)
Group Technology (GT) is an option for
achieving line-flow layouts with low-volume
processes; this technique creates cells not
limited to just one worker and has a unique
way of selecting work to be done by the cell.
The GT method groups parts or products
with similar characteristics into families and
sets aside groups of machines for their
production.

7/15/2019 Process Layout
http://slidepdf.com/reader/full/process-layout-5633826ff0a4b 15/31
© 2007 Pearson Education
Before Group Techno logy
Drilling
D D
D D
Grinding
G G
G G
G G
Milling
M M
M M
M M
Assembly
A A
A A
Lathing
Receiving and
shipping
L
L L
L L
L L
L
Jumbled f lows in a job sho p w ithout GT cells

7/15/2019 Process Layout
http://slidepdf.com/reader/full/process-layout-5633826ff0a4b 16/31
© 2007 Pearson Education
App l ied Group Techno logy
Line f lows in a job shop w ith three GT cel ls
Cell 3
L M G G
Cell 1 Cell 2
Assembly
area
A A
L M DL
L MShipping
D
Receiving
G

7/15/2019 Process Layout
http://slidepdf.com/reader/full/process-layout-5633826ff0a4b 17/31
© 2007 Pearson Education
Source: Organization for Industrial Research Inc.
Class i f icat ion and Cod ing
System

7/15/2019 Process Layout
http://slidepdf.com/reader/full/process-layout-5633826ff0a4b 18/31
© 2007 Pearson Education Ch 7 - 34© 2000 by Prentice-Hall Inc Russell/Taylor Oper Mgt 3/e
Original Process
Layout
12
1
2
3
4
5
6 7
8
9
10
11
A B C Raw materials
Assembly

7/15/2019 Process Layout
http://slidepdf.com/reader/full/process-layout-5633826ff0a4b 19/31
© 2007 Pearson Education Ch 7 - 37© 2000 by Prentice-Hall Inc Russell/Taylor Oper Mgt 3/e
Cel lu lar Layou t
Solut ion
12
12 3
4
5
6
7
8 910
11
A BCRaw materials
Cell1Cell 2 Cell 3
Assembly
7/15/2019 Process Layout
http://slidepdf.com/reader/full/process-layout-5633826ff0a4b 20/31
© 2007 Pearson Education
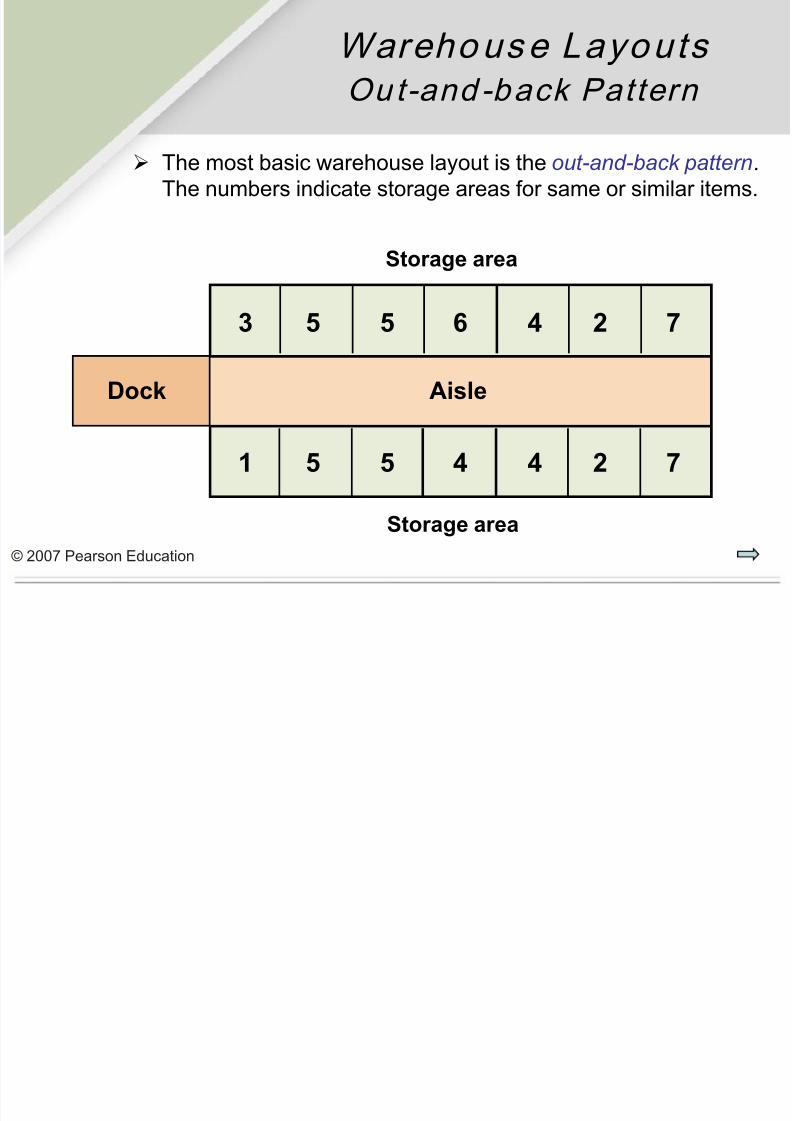
Warehouse Layouts
Out-and -back Pattern
The most basic warehouse layout is the out-and-back pattern.
The numbers indicate storage areas for same or similar items.
Dock Aisle
Storage area
Storage area
3 5 5 6 4 2 7
1 5 5 4 4 2 7

7/15/2019 Process Layout
http://slidepdf.com/reader/full/process-layout-5633826ff0a4b 21/31
© 2007 Pearson Education
Warehouse Layouts
Zone Sys tem
Click to add t i t le
Zones Zones Control
station Shipping
doors
Tractor
trailer
Tractor
trailer
Overflow
Feeder
linesFeeder
lines

7/15/2019 Process Layout
http://slidepdf.com/reader/full/process-layout-5633826ff0a4b 22/31
© 2007 Pearson Education
Off ice Layou ts
Most formal procedures for designing office layouts
try to maximize the proximity of workers whose jobs
require frequent interaction.
Privacy is another key factor in office design.
Four common office layouts:
1. Traditional layouts
2. Office landscaping (cubicles/movable partitions)3. Activity settings
4. Electronic cottages (Telecommuting)

7/15/2019 Process Layout
http://slidepdf.com/reader/full/process-layout-5633826ff0a4b 23/31
© 2007 Pearson Education
Designing
Line-Flow Layou ts
Line balancing is the assignment of work to
stations in a line so as to achieve the desired output
rate with the smallest number of workstations.
Work elements are the smallest units of work thatcan be performed independently.
Immediate predecessors are work elements that
must be done before the next element can begin.
Precedence diagram allows one to visualizeimmediate predecessors better; work elements are
denoted by circles, with the time required to perform
the work shown below each circle.

7/15/2019 Process Layout
http://slidepdf.com/reader/full/process-layout-5633826ff0a4b 24/31
© 2007 Pearson Education
Line Balanc ing Examp le 8.3
Green Grass, Inc., a manufacturer of lawn & garden equipment,
is designing an assembly line to produce a new fertilizer spreader,
the Big Broadcaster. Using the following information, construct a
precedence diagram for the Big Broadcaster.

7/15/2019 Process Layout
http://slidepdf.com/reader/full/process-layout-5633826ff0a4b 25/31
© 2007 Pearson Education © 2007 Pearson Education
Line Balanc ing Green Grass , Inc.
6
E
20
H
18
I
40
D
30
B
25
F
50
C40
A
15
G
A Bolt leg frame to hopper 40 None
B Insert impeller shaft 30 A
C Attach axle 50 A
D Attach agitator 40 B
E Attach drive wheel 6 BF Attach free wheel 25 C
G Mount lower post 15 C
H Attach controls 20 D, E
I Mount nameplate 18 F, G
Total 244
Work Time Immediate
Element Description (sec) Predecessor(s)

7/15/2019 Process Layout
http://slidepdf.com/reader/full/process-layout-5633826ff0a4b 26/31
© 2007 Pearson Education
Desired Outpu t and
Cyc le Time
Desired output rate, r must be matched to the
staffing or production plan.
Cycle time, c is the maximum time allowed for
work on a unit at each station: 1
r c =

7/15/2019 Process Layout
http://slidepdf.com/reader/full/process-layout-5633826ff0a4b 27/31
© 2007 Pearson Education
Theoret ical Minimum
Theoretical minimum (TM ) is a benchmark or goal
for the smallest number of stations possible, where
total time required to assemble each unit (the sum of
all work-element standard times) is divided by the
cycle time. It must be rounded up
Idle time is the total unproductive time for all
stations in the assembly of each unit.
Efficiency (%) is the ratio of productive time tototal time.
Balance Delay is the amount by which efficiency
falls short of 100%.

7/15/2019 Process Layout
http://slidepdf.com/reader/full/process-layout-5633826ff0a4b 28/31
© 2007 Pearson Education
Outpu t Rate and Cyc le Time
Example 8.4
Green Grass, Inc. Desired output rate, r = 2400 /week
Plant operates 40 hours/week
r = 2400 /40 = 60 units/hour
Cycle time, c = 1/60
= 1 minute/unit
= 60 seconds/unit
1
r

7/15/2019 Process Layout
http://slidepdf.com/reader/full/process-layout-5633826ff0a4b 29/31
© 2007 Pearson Education
Calcu lat ions for
Examp le 8.4 cont inued
Theoretical minimum (TM ) - sum of all work-element
standard times divided by the cycle time.
TM = 244 seconds/60 seconds = 4.067
It must be rounded up to 5 stat ions
Cycle time: c = 1/60 = 1 minute/unit = 60 seconds/unit
Efficiency (%) - ratio of productive time to total time.
Efficiency = [244 /5(60)]100 = 81.3%
Balance Delay - amount by which efficiency falls short of 100%.
(100 − 81.3) = 18.7%
G G I

7/15/2019 Process Layout
http://slidepdf.com/reader/full/process-layout-5633826ff0a4b 30/31
© 2007 Pearson Education © 2007 Pearson Education
S1
S2
S3
S5S4 6
E
20
H
18
I
40
D
30
B
25
F
50
C40
A
15
G
Green Grass , Inc.
Line Balanc ing Solut ion
c = 60 seconds/unit
TM = 5 stations
Efficiency = 81.3%
The goal is to cluster the work elements
into 5 workstations so that the number of
work-stations is minimized, and the cycle
time of 60 seconds is not violated. Here
we use the trial-and-error method to find
a solution, although commercial software
packages are also available.

7/15/2019 Process Layout
http://slidepdf.com/reader/full/process-layout-5633826ff0a4b 31/31
© 2007 Pearson Education
Other Considerat ions
In addition to balancing a line, managers must alsoconsider four other options:
1. Pacing: The movement of product from one station
to the next as soon as the cycle time has elapsed.2. Behavioral factors of workers.
3. Number of models produced: A mixed-model line produces several items belonging to the samefamily.
4. Cycle times depend on the desired output rate, andefficiency varies considerably with the cycle timeselected. Thus exploring a range of cycle timesmakes sense.