Process Investigation for Namibia Seawater Pre...
71
Process Investigation for Namibia Seawater Pre-treatment: A Pilot Process Operation Namibia Water Corporation Water Quality & Environmental Services Private Bag 13389 September 2008 Windhoek Namibia
Transcript of Process Investigation for Namibia Seawater Pre...

Process Investigation for Namibia Seawater Pre-treatment: A Pilot Process Operation
Namibia Water Corporation Water Quality & Environmental ServicesPrivate Bag 13389 September 2008WindhoekNamibia

Process Investigation for Namibia Seawater Pre-treatment: A Pilot Plant Operation
Pilot Plant Operations Project Team
Dr. Kuiri F. Tjipangandjara (GM: Engineering)Martin Harris (Sr. Manager Engineering)Johan Botha (Sr. Manager New Business)Ehrenfried Uazuvara Petoorua Honga (Document Author)Willem Venter (Project Manager)Hendri Opperman (Pilot Plant Operator)John Matheus (Pilot Plant Operator)Merylinda Conradie (Laboratory Scientist)NP du Plessis (Sr. Environmentalist)
ii

Process Investigation for Namibia Seawater Pre-treatment: A Pilot Plant Operation
Preface
Industrial growth in the central coastal area of Namibia, driven by the development of the uranium mining industry is causing a rapid increase in demand for water. Local groundwater sources are currently used to the limit of their sustainable yield. Alternative water sources are required, or economic development will be stifled.
It has been established that the most cost effective source of additional water for supply to the central coastal area is desalinated seawater using reverse osmosis. The waters off the Namibian coast are cold and nutrient rich, the high levels of dissolved organic material and the major fluctuations in water quality associated with sulphur eruptions and algal will generate challenges with respect to pre-treatment of the water before it can be applied to reverse osmosis membranes without fouling them.
No significant experimentation regarding pre-treatment of Namibian seawater has previously been undertaken. The conduct of such experiments was identified as having major potential to add value with respect to improving the understanding of NamWater personnel on issues related to pre-treatment, and the provision of information to the design process for a full scale desalination plant. Hence the project reported on in this document.
Martin Harris
iii

Process Investigation for Namibia Seawater Pre-treatment: A Pilot Plant Operation
Acknowledgments
The author is immensely indebted to all project team members for diligently executing respective tasks with regard to the pilot plant operation. However, special thanks will go to:
Dr. Kuiri F. Tjipangandjara for keeping his emotions in check and thereby allowing the project team to flourish;
Martin Harris, who has been a member of previous attempts with regard to desalination projects but, who never allowed the past to influence the present. He allowed the present to dictate its own course;
Willem Venter for professional project guidance and excellent record keeping of various issues;
Hendri Opperman for being the heart beat of the project team, never got tired to execute any task and always willing to learn more through doing it better;
And finally Mrs Marieta Opperman who became the de facto member of the project team; the monthly fresh supply of food to Mr Opperman is like supply of fresh oxygenated blood to the heart to allow the body to function at its best – the project team was able to function at its best.
iv

Process Investigation for Namibia Seawater Pre-treatment: A Pilot Plant Operation
Summary
(a) Introduction
Desalination is any of the processes that remove dissolved salts from the ocean water and other brines. It is alleged that this process can be traced as far back as the third millennium BC. At present the countries that are leading the world in the desalination process are the middle east countries and the United States of America. The desalination process uses two types of techniques: the thermal technology and the membrane technology. The multi-stage flash distillation and the reverse osmosis processes are the most used techniques for converting seawater into potable water.
From the global perspective, the fact that the sea contains 97% of the earth water necessitated the thinking that desalting seawater for drinking and other purposes is the most sustainable option. As with Namibia, the rush for uranium exploration, especially during the late 2004 prompted NamWater to have a different paradigm shift with regard to desalination – a sense of urgency was declared. Consequently, a decision was taken to operate a pilot plant at the Namibia coast to investigate processes that could be viable for Namibia seawater pre-treatment.
(b) Objective
The objective of this document is therefore to reveal the results obtained from operating such pilot plant and to narrate any lessons learned.
(c) Pilot Plant Results
The pilot plant was operated in two phases. Phase 1 were the efforts by NamWater project team and Phase 2 were the suggestions as given by RostTek. RosTek is a consultancy company contracted by NamWater to assist with various issues and one of these issues was to advise on the pilot plant operation.
Phase 1
The SDI (15 minutes) value peaks during the month of May with maximum averages of about 6.3
The Namibia seawater turbidity, for most of the time, ranges between 4 and 10 NTU
The temperature has a definite cyclic paten; this paten has a maximum average of 21 oC and a minimum average of 14 oC.
v

Process Investigation for Namibia Seawater Pre-treatment: A Pilot Plant Operation
For most of the time the Namibia sea water has a pH range of between 7.6 to 7.8.
The TOC/DOC averages at below 3 mg/l
Given the above water quality profile the pilot process reduction indicated the following:
The DAF process unit hardly reduced SDI
The sand media filters were able to reduce the SDI by about 14% only
The cartridge and the UF membrane reduced the SDI by 43% and 60%, respectively.
The DAF process unit was able to reduce turbidity by about 40%
And the first stage sand filter reduced turbidity by 70% and the second stage by more than 60%, but below 70%. Overall the filter media reduced turbidity by more than 90%.
The media filters also reduced algae by more than 90% - the reduction was close to 100%.
However, the process units employed indicated that the TOC/DOC was not reduced at all.
Phase 2 Operation
The highlight of Phase 2 operation could be summarised as follows:
The average SDI output from the media filters was 6.23; the goal was to obtain a value of less than 4
The average turbidity output from the media filters was 0.69 NTU and the goal was to aim for a value of less than 0.2 NTU
Most of the particle size range between the 3 and 5 micron
And the media filters were able to reduce the particle counting by about 60%
With high hydraulic loading of 12.6 m/h during this operation the backwashing of media filers was more frequent when compared to the first phase when hydraulic loading was 4.39 m/h.
vi

Process Investigation for Namibia Seawater Pre-treatment: A Pilot Plant Operation
Ferric coagulant performs better when compared to polymer coagulant in particle removal.
(d) Lessons Learned
From both these conditions the lessons learned from operating the pilot plant can be summarised as follows:
The Namibia seawater has a high SDI value that may require an elaborated pre-treatment system to reduce it to below values of 3.0.
The turbidity which ranges between 4 and 10 NTU is easily removed by all unit process employed: that is, the DAF, the filter media, the cartridge filters and the UF membrane.
The red-tide phenomenon post a big challenge to the pre-treatment units like the sand media filters and the UF membrane – during red tide these units have to be backwashed more often.
By operating the pilot plant the NamWater personnel obtained valuable information that enhanced their ability to talk to other people in the field of desalination, for example, during the tendering process
Finally, the project brought about a common understanding that capacity within NamWater (as well as Namibia) with regard to desalination lacks and therefore, strategy with regard to capacity building for sustainable desalination process operation should be started at earliest opportune time.
(e) Recommendations
The recommendations from this pilot operation study are that:
Media filters can be essential in improving the quality of water in any pre-treatment process employed for the desalination of Namibia seawater and therefore, any proposal that omits the media filters must justify the omission of the sand filters by comparing gained capital cost to that of membrane replacements.
NamWater should form a concrete strategy with regard to the operation of desalination plant(s) and the recruitment to build capacity for the operation of any of the NamWater desalination plant(s) should start before the end of this calendar year (2009).
vii

Process Investigation for Namibia Seawater Pre-treatment: A Pilot Plant Operation
Table of Contents
Item Page
Pilot Plant Operations Project Team..............................................................................iiPreface..........................................................................................................................iiiAcknowledgments.........................................................................................................ivSummary........................................................................................................................v
(a) Introduction.....................................................................................................v(b) Objective..........................................................................................................v(c) Pilot Plant Results............................................................................................v(d) Lessons Learned............................................................................................vii(e) Recommendations.........................................................................................vii
Table of Contents........................................................................................................viiiTable of Contents........................................................................................................viiiList of Figures................................................................................................................xList of Tables................................................................................................................xi1.0 Introduction........................................................................................................1
(a) Definition and History of Desalination...........................................................1(b) Desalination Techniques.................................................................................1(c) Need for Seawater Desalination......................................................................2
(i) Global Perspective.......................................................................................2(ii) Namibian Perspective..................................................................................2
2.0 Objective of this Document...............................................................................63.0 Understanding Reverse Osmosis........................................................................6
3.1 Principles of RO..............................................................................................63.2 Early History of RO Membrane development.................................................63.3 Reverse Osmosis System, RO Membrane Modules and Module Configurations............................................................................................................7
4.0 Pilot Plant Process Description and Commissioning.........................................84.1 Process Description.........................................................................................94.2 Detailed Process Description (and hydraulics loadings)...............................10
4.2.1 The DAF Process Train:.........................................................................10(i) The Flocculation Column and DAF process Units................................10(ii) Sand Filters.............................................................................................10(iv) Bagfilters & Cartridge Filters.................................................................11(v) The UF Membrane Unit.........................................................................11
5 Pilot Plant Results and Discussions.....................................................................135.1 Parameters monitored....................................................................................135.2 Raw Water Quality........................................................................................15
5.2.1 The SDI value........................................................................................155.2.2 Raw water Turbidity..............................................................................155.2.3 Raw Water Temperature........................................................................165.2.4 pH...........................................................................................................175.2.5 Conductivity...........................................................................................185.2.6 Possible Correlations..............................................................................185.2.7 DOC/TOC Analysis...............................................................................205.2.7 Water Quality Improvement..................................................................21
viii
Process Investigation for Namibia Seawater Pre-treatment: A Pilot Plant Operation
5.2.3.1 Turbidity Reduction........................................................................215.2.3.2 Pilot System Reduction in SDI.......................................................225.2.3.3 Pilot System Algae Reduction........................................................235.2.3.4 Pilot System Reduction in TOC/DOC............................................255.2.3.4 Pre-treatment effectiveness: A Summary.......................................25
5.3 RosTek Intervention for Pilot Plant Operation..............................................255.3.1 Background information........................................................................255.3.2 Proposed Changes by RosTek................................................................265.3.3 Pilot Plant Evaluation After Proposed Changes.....................................28
5.3.3.1 Media Filtration Performance.........................................................285.3.3.2 Particle Counting............................................................................285.3.3.4 Backwashing of Relevant Process Units........................................305.3.3.5 Use of Ferric Chloride....................................................................32
6.0 Sustainable Operation of the Desalination Plant..............................................337.0 Lessons Learned from Pilot Plant Operations..................................................348.0 The Way-Forward............................................................................................369.0 References........................................................................................................3710 Appendices...........................................................................................................38
Appendix 1.0 Algae Genera in the Namibian Seawater........................................39Appendix 2.0 Proposed Structure of a Desalination Plant Larger than 50 000 m3/d (Courtesy of Gebel., and Yuce., 2007).....................................................................42
ix

Process Investigation for Namibia Seawater Pre-treatment: A Pilot Plant Operation
List of Figures
Figure Description Page
Figure 1 Namibia Water Cycle (Source: Courtesy of DWA, etl, May, 1998)...........2Figure 2 Future Water Demand and Sustainable Water Production Capacity (Source: Planning)..........................................................................................................4Figure 3 Uranium Prices from 1948 to 2007 (Source: Kee, D. E., 2007)..................4Figure 4 New and Potential Uranium Mines at the Namibian Coast (Source, J. Botha: Sr. Manager, NamWater, 2008).........................................................................5Figure 5 The Osmosis Process and the Development of the Osmotic Pressure.........7Figure 6 RO System Configurations..........................................................................8Figure 7 Commonly used RO modules (source: courtesy of AWWA)......................8Figure 8 Initial Pilot Plant Configuration...................................................................9Figure 9 Assemble of 3000 dizzer Inge UF membrane...........................................11Figure 10 UF Membrane Process Flow Diagram...................................................11Figure 11 Typical operational modes for UF membrane process..........................12Figure 12 The SDI Measuring Apparatus...............................................................13Figure 13 Turbidity Comparison for DAF System and the Seawater Filter System
14Figure 14 Seawater SDI at the Namibian Coastline...............................................15Figure 15 Namibia Seawater Quality: Turbidity....................................................15Figure 16 Namibian Coastal Water Quality: Turbidity (Statistical Analysis)........15Figure 17 Namibia Seawater Temperature Profile.................................................16Figure 18 Namibia Seawater pH Profile.................................................................17Figure 19 Namibia Seawater pH: A Statistical Analysis........................................17Figure 20 Namibia Seawater Conductivity Profile.................................................18Figure 21 Effects of Seawater Temperature on the SDI.........................................19Figure 22 The Effects of Algae Bloom on SDI......................................................20Figure 23 Pilot Plant Turbidity Reduction.............................................................22Figure 24 % SDI Reduction Evaluated from Pilot Plant Operation.......................23Figure 25 Parameters that influences SDI value....................................................23Figure 26 The Delphineis karstenii (Bolden) Fryxell & Miller..............................24Figure 27 Desalination Pre-treatment Pilot Plant: Final Configuration................26Figure 28 Raw water Particle Counting in 40 ml...................................................29Figure 29 Unit Process Particle Count reduction...................................................29Figure 30 Effects of Dissolved Oxygen on Particle Count....................................30Figure 31 UF Trans-membrane Pressure................................................................31Figure 32 Namibian Seawater Coagulation by Ferric and Polymer: A Comparison
32Figure 33 Employees Structure of a Desalination Plant Larger than 50 000 m3/d (Source: Courtesy of Gebel J., and Yuce S., 2007)......................................................33
x

Process Investigation for Namibia Seawater Pre-treatment: A Pilot Plant Operation
List of Tables
Table Description Page
Table 1 Desalination Technologies and Processes...................................................1Table 2 Major Stocks of Water Earth (www.nap.edu/open)....................................2Table 3 CURRENT AND POTENTIAL NEW URANIUM MINING CLIENTS (Source, J. Botha: Sr. Manager: NamWater, June 2008)...............................................5Table 4 Sand Filter Media Specifications...............................................................10Table 5 The Inge UF Membrane Specifications.....................................................12Table 6 Data for SDI Measurement........................................................................19Table 7 Namibia Seawater analysis on TOC/DOC.................................................20Table 8 Average Input Water Quality to Various Process Units (Turbidity in NTU)
21Table 9 Pilot Process Algae reduction....................................................................24Table 10 Effects of Pilot Process Units on TOC/DOC Reduction...........................25Table 11 Media Filters Specifications......................................................................27Table 12 Pre-treatment System Performance Goals (RosTek, 2008).......................27Table 13 Media Filter Performance..........................................................................28
xi
Process Investigation for Namibia Seawater Pre-treatment: A Pilot Plant Operation
1.0 Introduction
(a) Definition and History of Desalination
Desalination (or desalting) is any of the processes that remove dissolved salts from the ocean water and other brines. The main purpose is to convert the high total dissolved salts (TDS) water to potable water for human consumption, irrigation process and other industrial processes.
It is alleged in the Desalination: A National Perspective (www.ap.edu/open boob, 2007) that the separation of salt from water has a long history dating from the time when salt, not water, was the precious commodity. As a matter of fact some authors trace the inception of desalination to the Biblical times: Mohammad A.A. (2000) traces desalination technology to as far back as the third millennium BC; and a short scripture titled “The History of Desalination” (www.rpi.edu/dept, no date) traces desalination to the time of Moses.
Regardless of the early existence of desalination process the real usage of desalination was only during World War II – the process was used to supply freshwater needs in the remote locations. The research and development that took place after World War II accelerated the growth of the desalination and the process continue to undergo technical improvements even at the present moment (Krishma. H.J., no date).
At present the world leading countries in the desalination process are Saudi Arabia (17.4%), USA (16.2%), the United Arab Emirates (14.7%), Spain (6.4%) and Kuwait (5.8%) (Khawaji. A. D., etel, 2007).
(b) Desalination Techniques
As was implied earlier a desalination process separates saline water into two parts – one that has a low concentration of salt (the finished product) and the one that has a much higher concentration than the original feed water, usually referred to as brine concentrate (Krishma. H.J., no date). Worldwide there are two major technologies that are used for desalination: these are thermal or membrane technologies. The sub-categories of these technologies are as shown in Table 1.0. As with seawater desalination, at the end of 2002, MSF accounted for 61.6% whereas RO accounted for 26.7% (Khawaji. A. D., etel, 2007).
Table 1 Desalination Technologies and Processes
Thermal Technology Membrane TechnologyMulti-Stage Flash Distillation (MSF) Electrodialysis (ED)Multi-Effect Distillation (MED) Electrodialysis reversal (EDR)Vapour Compression Distillation (VCD) Reverse Osmosis (RO)
1

Process Investigation for Namibia Seawater Pre-treatment: A Pilot Plant Operation
(c) Need for Seawater Desalination
(i) Global Perspective
In many countries freshwater lies too deep to unlock and since the sea contains 97% of the earth water it seems very logical to treat seawater for potable purposes, if the cost is justifiable. Table 2.0 (below) illustrates the abundance of seawater when compared to other earth sources.
Table 2 Major Stocks of Water Earth (www.nap.edu/open)
Location Amount(106 km3)
Percentage of World Water
Ocean 1338 96.5Glaciers and permanent snow 24.1 1.74Groundwater (brackish or saline) 12.9 0.94Groundwater (fresh) 10.5 0.76Ground ice/permafrost 0.30 0.022Freshwater lakes 0.091 0.007Fresh water stream channels 0.002 0.0002
(ii) Namibian Perspective
Namibia is a semi-arid country. As shown in Figure 1.0 (below) about 97% of the water that Namibia gets, through the rain process, is lost to the atmosphere by evaporation and evapotranspiration. It is therefore a more logical approach for Namibia to use the sea as the main source of water supply.
Figure 1 Namibia Water Cycle (Source: Courtesy of DWA, etl, May, 1998)
2

Process Investigation for Namibia Seawater Pre-treatment: A Pilot Plant Operation
The realisation that Namibia should go the desalination route (for its water supply) especially at the coastal area was long realised during the late seventies and early 80s. To achieve such a goal an agreement was reached during March of 1977 among the Water Research Commission, the Department of Water Affairs and the Council for Scientific and Industrial Research. The objectives of this tripartite, as outlined in the Joint Final Contract Report of 1981, were to:
(a) Develop and administer a pilot project at the coast to permit pre-treatment and desalination of seawater by reverse osmosis.
(b) Produce 200 to 300 m3/day of potable water for supply process(c) Study the available technology with the view to develop the process design
criteria for large scale reverse osmosis desalination of seawater.(d) Permit the evaluation of selected commercial RO systems(e) Permit the conducting of research on possible improvements in RO
desalination technology(f) Enable the Department and Institute to acquire expertise and experience in
the design, construction and operation of the process of the desalination of seawater by reverse osmosis
The pilot plant that was operated (during this period) investigated the effectiveness of three type of pre-treatment systems to produce water that is suitable for RO plant unit. In brief the three pre-treatment systems were:
(a) a chlorinated raw water with a residual chlorine of about 1 mg/L followed by alum dosage at 25 mg/L and a flocculation aid at 0.1 mg/L. This water then passed through an upflow sedimentation unit and then through two down flow rapid gravity filter. One of the sand filters was topped with anthracite above the fine sand. As a further polishing step the produced water was passed through a DE filter.
(b) In parallel to the above process description water was passed to a flotator unit. The product from the flotator was then passed to a low pressure DE filter.
(c) The third pre-treatment process was again employing the concept of prechlorination to achieve a residual value of between 0.5 and 1 mg/L. This water was then passed through a fine screen and then into a sand settler. After a retention time of about 1 hour the water was passed to a 1500 m3 ageing dam. The two ageing dams (in parallel) had a retention of 2 to 3 days. A residual chlorine of 0.5 to 1 mg/l was also maintained in these ageing dams. The aged water was then passed through a rapid gravity filter and then a DE filter.
The conclusions from the above pilot plant operation was that:
► The ageing pond system was able to produce RO plant feed water which was well within plugging index specification of 45%, although difficulties were experienced during the summer months – possible algae growth.
► Large numbers of bacteria was able to penetrate the system, especially after de-chlorination of the feed water.
3

Process Investigation for Namibia Seawater Pre-treatment: A Pilot Plant Operation
These attempts (of the late 70s and early 80s) did not result in the commissioning of a desalination plant; however the same philosophy to desalinate water at the Namibian coast was again revisited during the mid 90s. As a matter of fact the investigation done during 1996 by NamWater (Final Report Volume 1, August 1996) indicated that there was going to be a shortfall of supplied water at the coast as indicated in Figure 2.0.
Figure 2 Future Water Demand and Sustainable Water Production Capacity (Source: Planning)
Based on these projected figures the study concluded that new water supply sources must be identified. The study investigated eight various sources to augment the supply of water at the coast. Among these eight alternative sources investigated the desalination of seawater turned out to be the most financially viable, with a discounted rate of 10% (Final Report Volume 1, 1996).
Like in the early 70s and late 80s the investigations of mid 90s did not lead to the implementation of a desalination plant at the coast. However, the uranium spot market price increased almost exponentially during the late 2004 as shown in Figure 3.0. The spot prices increased from below $US20/lb in 2004 to $US138/lb in July 2007 (Kee, D.E., 2007).
Figure 3 Uranium Prices from 1948 to 2007 (Source: Kee, D. E., 2007)
4

Process Investigation for Namibia Seawater Pre-treatment: A Pilot Plant Operation
This continuous increase in uranium spot prices (mentioned above) has been accompanied by increase in uranium exploration at the Namibian coast. Consequently, of late, there has been an increase in water demand for these mines (existing and upcoming) at the coast (see Table 1.0 and Figure 3.0).
Table 3 CURRENT AND POTENTIAL NEW URANIUM MINING CLIENTS (Source, J. Botha: Sr. Manager: NamWater, June 2008)
Mine or EPL holder Future Demand
Cumulative demand
Time-frame
Rössing 8 Mm3/a 8 Mm3/a Apr 2010Langer Heinrich 4 Mm3/a 12 Mm3/a Apr 2010Valencia 3 Mm3/a 15 Mm3/a Apr 2010Goanikontes 5 Mm3/a 20 Mm3/a Early 2011Ida Dome (Husab) 5 Mm3/a 25 Mm3/a Early 2011Tubas/Tumas 5 Mm3/a* 30 Mm3/a 2012Marenica 4 Mm3/a* 34 Mm3/a 2012Namura (Cape cross) 4 Mm3/a* 38 Mm3/a 2012Klein Spitzkoppe 4 Mm3/a* 42 Mm3/a 2014Africa Uranium 4 Mm3/a* 46 Mm3/a 2014Nam-China 4 Mm3/a* 50 Mm3/a 2014Nova Exploration 4 Mm3/a 54 Mm3/a 2014
Figure 4 New and Potential Uranium Mines at the Namibian Coast (Source, J. Botha: Sr. Manager, NamWater, 2008)
5

Process Investigation for Namibia Seawater Pre-treatment: A Pilot Plant Operation
Therefore, from a Namibian perspective, the rush in Uranium processing, at the Namibian coast has resulted in unprecedented increase in water demand which eventually made the need for seawater desalination a necessity. As a result, this increase in water demand (future or present) is making NamWater to approach the desalination philosophy with different vigour: Various desalination committees (within NamWater) have been established; motivations to the board to construct a desalination plant have been submitted and subsequently approved by the board; and finally a decision was taken to operate a pilot plant to investigate a suitable pre-treatment for a reverse osmosis desalination process.
2.0 Objective of this Document
The objective of this document is to reveal the results obtained from operating such a pilot plant and to narrate any lessons learned.
3.0 Understanding Reverse Osmosis
Before revealing the results of the investigations from pilot plant operations it is worthwhile to the reader to be introduced to the basic concepts surrounding reverse osmosis.
3.1 Principles of RO
In order for one to understand how reverse osmosis works one has to understand how osmosis works. As defined by Williams M.E. (2003) osmosis is a natural phenomenon in which a solvent (usually water) passes through a semipermeable barrier from the side with low solute concentration to the higher solute concentration side. Figure 5.0 demonstrate the basic principles of the osmosis process and the development of the osmotic pressure (denoted in the figure as pi). The typical osmotic pressure for seawater varies from 23 – 37 bars (Livingstone Shire Council, 2005). However, this nett flow of solute can be opposed by applying pressure to the solute mixture – to achieve such a reversal to the process the pressure that must be applied must be greater than the osmotic pressure. Such phenomenon is termed reverse osmosis (Williams M.E., 2003).
3.2 Early History of RO Membrane development
The early history with regard to RO membrane development was narrated by Glater J. (1998). Glater hails from the University of California at Los Angeles (UCLA) and, as a result most of his findings are bias towards findings at UCLA. Glater starts his narrating by suggesting that the first osmotic phenomenon was observed by Abbe Nollet in 1748. However, it was not until 1867 when the first inorganic semi-permeable membrane was prepared by Traube (Glater J., 1998). Glater further on reveals (in the same paper) that he believes that Hassler, in his unpublished work of August, 1950, was the first person to introduce the first concept of membrane desalination.
6

Process Investigation for Namibia Seawater Pre-treatment: A Pilot Plant Operation
Figure 5 The Osmosis Process and the Development of the Osmotic Pressure
This review paper by Glater goes on to suggest that by 1954 equipment had been constructed for the experimental verification of “Hassler’s reverse osmosis principle”. The design of this equipment was based on the devise of the osmotic pressure measurement in which a porous plate separated solution from solvent. The principle design of this equipment was an air gap – this gap was varied to vary the applied pressure on the seawater.
Unlike the Hassler’s narrow gap principle Glater indicates that during 1955 Professor Charles Reid proposed a device that operated on the principles of pressure to reverse the normal osmotic tendency through a variety of polymeric materials. Glater suggests that despite the performance limitations of this device Reid’s work provided “an experimental and theoretical framework for the next chapter in the on-going search for practical and economical method of membrane desalination.” Glater continues to suggest that the work done by Sidney Leob and S. Sourirajan, during the late 50’s culminated in them entering patents during the early 60’s. And by the mid-60’s the major companies like Dow Chemical and DuPoint have already recognised the potential for large-scale membrane desalination. The interests of these two companies resulted in R&D efforts that culminated in the development of hollow fiber desalination modules, Glater concludes.
3.3 Reverse Osmosis System, RO Membrane Modules and Module Configurations
Finally (on this RO topic) it is worth wile to show typical RO system configuration, most used RO modules and how they are configured.
A typical RO system configuration is as shown in Figure 6.0. The pre-treatment shown is essential in order to prevent scaling of the membrane by scale-forming foulants such as salt precipitation and microbial growth (Livingstone Shire Council, 2005). Typically, the system consist of feed water source, feed pre-treatment, high
7

Process Investigation for Namibia Seawater Pre-treatment: A Pilot Plant Operation
pressure pump, RO membrane modules and post treatment steps (Williams., M.E., 2003).
Figure 6 RO System Configurations
As with the modules, the ones that are common (commercially available) are plate-and-frame, tubular, spiral-wound and hollow-fiber elements (Williams., M.E., 2003). Of these modules the most widely used ones are the spiral-wound and hollow-fiber elements. Both these modules are as shown in Figure 7.0. The detailed components of these elements will not be the discussion of this document; this document, as was previously stated, will mainly concentrate on results of pilot plant that was operated at the Namibian coast.
Figure 7 Commonly used RO modules (source: courtesy of AWWA)
8

Process Investigation for Namibia Seawater Pre-treatment: A Pilot Plant Operation
4.0 Pilot Plant Process Description and Commissioning
4.1 Process Description
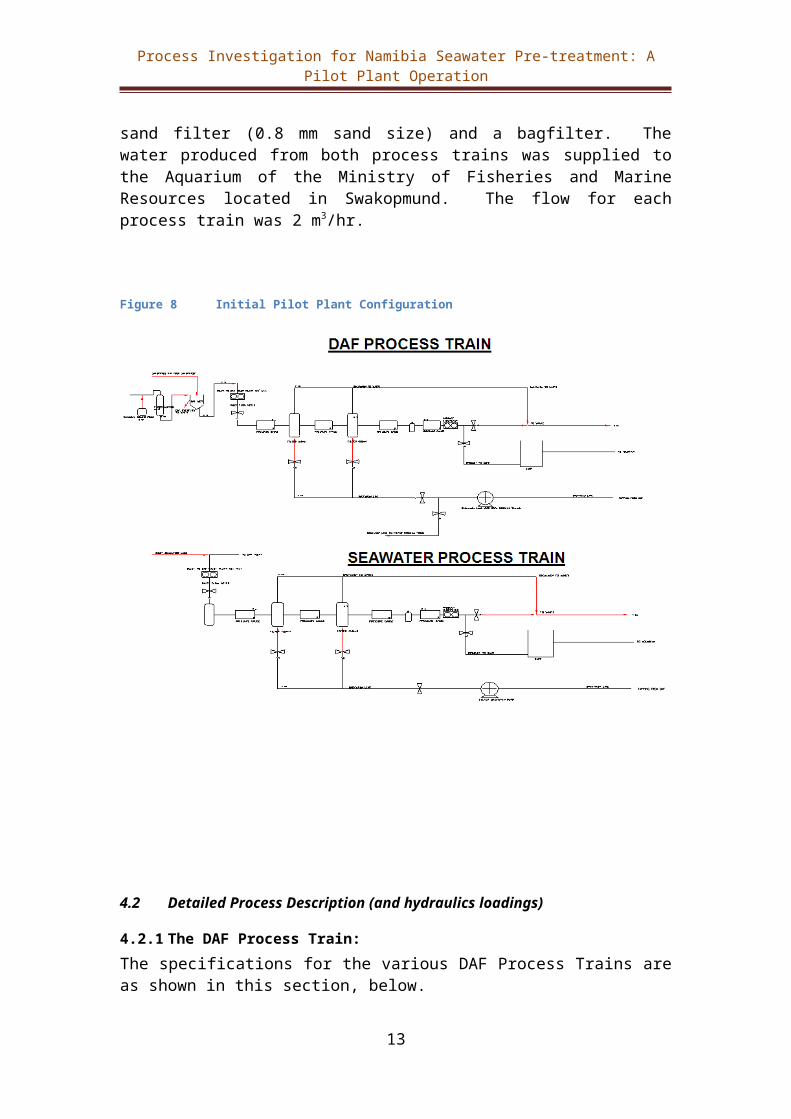
The pilot plant consisted of two legs: the DAF Process train and the Seawater Filter Process Train. As shown in Figure 8.0 (below) the DAF process train consisted of five main process units: the flocculation unit, the DAF, a primary sand filter (1.2 mm sand size), a secondary sand filter (0.8 mm sand size) and bagfilter or cartridge filter process unit. On the other hand the Seawater Filter System (also Figure 8.0) consisted of a strainer, a primary sand filter (1.2 mm sand size), a secondary sand filter (0.8 mm sand size) and a bagfilter. The water produced from both process trains was supplied to the Aquarium of the Ministry of Fisheries and Marine Resources located in Swakopmund. The flow for each process train was 2 m3/hr.
Figure 8 Initial Pilot Plant Configuration
9

Process Investigation for Namibia Seawater Pre-treatment: A Pilot Plant Operation
4.2 Detailed Process Description (and hydraulics loadings)
4.2.1 The DAF Process Train:The specifications for the various DAF Process Trains are as shown in this section, below.
(i) The Flocculation Column and DAF process Units
Raw water flow rate
(L/s) 1.10(m3/h) 3.96
DAF Unit Flocculation Unit
Volume (m3) 6.50 1.50Retention Time (h) 1.64 0.38Diameter (m) 2.15 0.762Hydraulic Loading (m/h) 1.84 5.20
(ii) Sand Filters
10

Process Investigation for Namibia Seawater Pre-treatment: A Pilot Plant Operation
The dimensions for the sand filters are as shown in Table 4.0 below. As can be seen the hydraulic loading for both the primary and the secondary filters were 4.39 m/h. The choice of these filters was not really based on typical seawater pre-treatment hydraulic loadings – the choice was mainly based on the cost and fast delivery.
Table 4 Sand Filter Media Specifications
Description For Both Trains
Primary Filter Collins P30Effective Size "d" (mm) 1.2Bed Depth "L" (mm) 400"L/d" 333Secondary Filter Effective Size "d" (mm) 0.8Bed Depth "L" (mm) 400"L/d" 500"L/d" Total 833 Flow Rate (L/h) 2000Flow Rate (L/s) 0.56Filter Diameter (m) 0.762Filter Area (m2) 0.456
Hydraulic Loading (L/s)/m2 1.22(m/h) 4.39
(iv) Bagfilters & Cartridge Filters
The size of the bagfilters that were investigated was for the 1.0 micron. As with the cartridge filter the size ranged from 3 micron to 10 micron.
(v) The UF Membrane Unit
The final unit in the process train was the Inge UF membrane. The assemble of this Inge unit (Figure 9) was done locally to allow the NamWater personnel to have a first hand experience with regard to the various components of the unit. The process flow diagram for this unit process (Figure 10) is also an in-house effort.
Figure 9 Assemble of 3000 dizzer Inge UF membrane
11

Process Investigation for Namibia Seawater Pre-treatment: A Pilot Plant Operation
Figure 10 UF Membrane Process Flow Diagram
The unit was operated in a dead-end mode (see Figure 11). It is alleged in a document titled: Filtration characteristics in dead-end ultrafiltration of wwtp-effluent (Jelle Roorda, 2004) that although cross-flow systems are widely used they use more energy than the dead-end systems. The specifications for this UF unit are as shown in Table 5 below.
Figure 11 Typical operational modes for UF membrane process
Table 5 The Inge UF Membrane Specifications
Dead End Operation: Specifications
12

Process Investigation for Namibia Seawater Pre-treatment: A Pilot Plant Operation
Feed flow (L/h) 1000 1620 - 3780
Membrane Surface m2 27 27
Flux rate L/(m2.h) 37.04 60 - 140
Transmembrane Pressure kPa ≤ 80 10 - max.80
Backwash: Specifications
Backwash Flow (L/h) 2500 4050 - 6750
Flux rate L/(m2.h) 92.59 150 - 250
Transmembrane Pressure kPa ≤ 60 30 - max.250
5 Pilot Plant Results and Discussions
5.1 Parameters monitored
The parameters that were monitored during the pilot plant operation were turbidity (NTU), SDI (15 minutes), temperature (oC), conductivity, pH, algae count and ID, particle size, total organic carbon and dissolved organic carbon. The focus of these parameters monitoring was mainly to learn as to what was driving the SDI.
The SDI (the silt density index) is the measure of water for the ability to clog a membrane. In this pilot operation the test involved the measurement of time taken for a 500 ml of water, at constant pressure of 2.1 bars, to pass through a 0.45 micron filter and collected in a cylinder. This initial time was noted as t i. For an SDI15 test this water from the 500 ml cylinder (see Figure 12) was released by opening the bottom of cylinder while filtration continued for another 15 minutes. After the 15 minutes lapse the bottom was again closed and the time to fill 500 ml was again noted down. This final time was noted as tf. From this data the SDI was calculated as follows:
…………………………………………
equation 1.0
It should be noted here though that the SDI values can also be measured in 5 or 10 minutes. The reason for using the SDI15 is that the American Standards for Testing Material (ASTM) defines it as the interval required for accurate and standardized testing – the SDI5 and SDI10 are only estimates of the 15 minute value (Lenntch, no date).
It can be seen from equation 1.0 that the limit as t f approaches infinity than equation 1.0 approaches a 6.7 value. The same arguments can be used for SDI5 and SDI10 – the maximum values for these two tests are 20 and 10 SDI, respectively.
13

Process Investigation for Namibia Seawater Pre-treatment: A Pilot Plant Operation
Before getting into the results section it should be noted here that the results that will be discussed in this document are only those for the DAF Treatment Train. The initial run of the two treatment trains revealed that the DAF system produced superior water quality, especially when one compares the turbidity of the secondary filters, as shown in Figure 13. For that reason the Seawater Treatment Train ceased operation during December 2006.
Figure 12 The SDI Measuring Apparatus
Figure 13 Turbidity Comparison for DAF System and the Seawater Filter System
14

Process Investigation for Namibia Seawater Pre-treatment: A Pilot Plant Operation
5.2
Raw
Water Quality
5.2.1 The SDI value
The SDI value during the pilot plant operation is as shown in Figure 14 below. Figure 14 suggests that the SDI peaks around about the months of May-April and drops toward the end of the year - the average maximum is about 6.25
Figure 14 Seawater SDI at the Namibian Coastline
5.2.2 Raw water Turbidity
15
0
1
2
3
4
5
6
04/11
/2006
06/11
/2006
08/11
/2006
10/11
/2006
12/11
/2006
14/11
/2006
16/11
/2006
18/11
/2006
20/11
/2006
22/11
/2006
24/11
/2006
26/11
/2006
28/11
/2006
30/11
/2006
02/12
/2006
04/12
/2006
06/12
/2006
08/12
/2006
10/12
/2006
12/12
/2006
14/12
/2006
16/12
/2006
18/12
/2006
20/12
/2006
time (day)
Turb
idity
(NTU
)
Seawater Filter SystemDAF System
5.00
5.20
5.40
5.60
5.80
6.00
6.20
6.40
6.60
6.80
21/08/2006 10/10/2006 29/11/2006 18/01/2007 09/03/2007 28/04/2007 17/06/2007 06/08/2007 25/09/2007 14/11/2007 03/01/2008
time (day)
SDI 15
Process Investigation for Namibia Seawater Pre-treatment: A Pilot Plant Operation
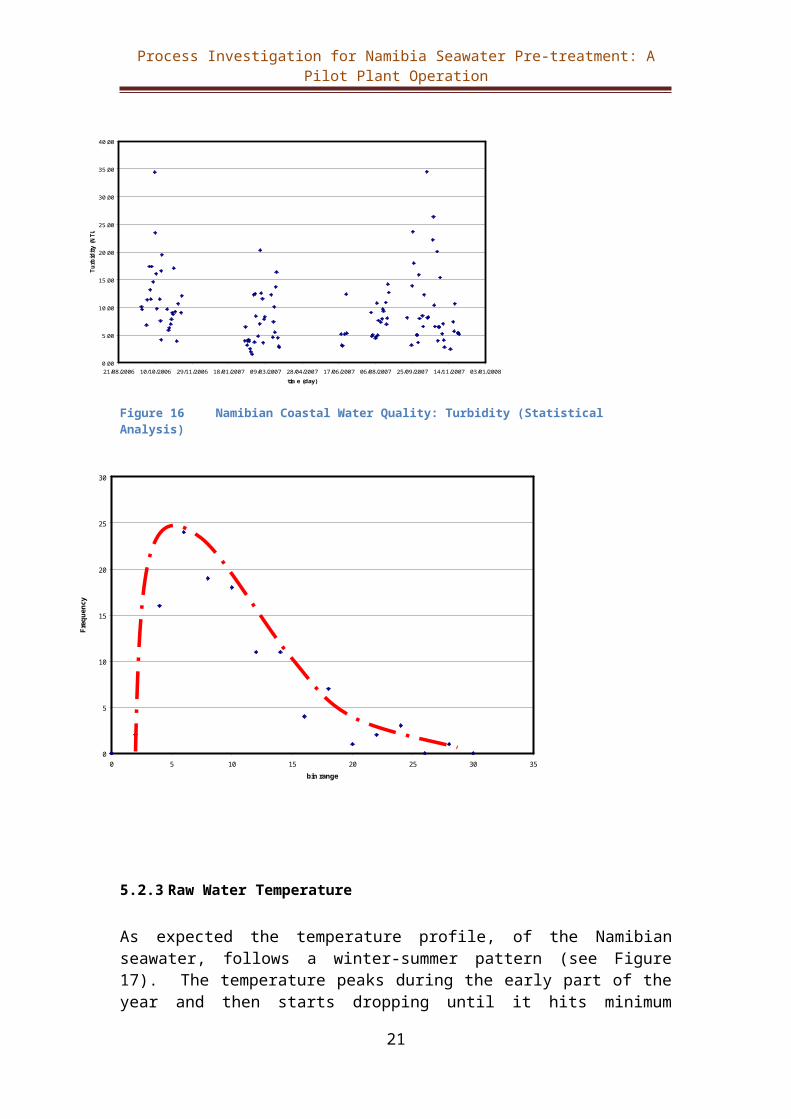
As seen in Figure 15 (below) the turbidity profile for the year does not show any pattern. However, Figure 16 (a histogram representation of the data) clearly indicates that for the Namibian coastal water the majority of turbidity expectation is around 4 to 10 NTU – that bin is about 64% of the total for the period investigated. However, the maximum and the minimum turbidity for the period is 34.50 and 1.56, respectively.
Figure 15 Namibia Seawater Quality: Turbidity
Figure 16 Namibian Coastal Water Quality: Turbidity (Statistical
Analysis)
5.2.3 Raw Water Temperature
As expected the temperature profile, of the Namibian seawater, follows a winter-summer pattern (see Figure 17). The temperature peaks during the early part of the year and then starts dropping until it hits minimum during the winter period. The
16
0.00
5.00
10.00
15.00
20.00
25.00
30.00
35.00
40.00
21/08/2006 10/10/2006 29/11/2006 18/01/2007 09/03/2007 28/04/2007 17/06/2007 06/08/2007 25/09/2007 14/11/2007 03/01/2008
time (day)
Turb
idity
(NTU
)
0
5
10
15
20
25
30
0 5 10 15 20 25 30 35
bin range
Freq
uenc
y

Process Investigation for Namibia Seawater Pre-treatment: A Pilot Plant Operation
important issue here is to see whether such changes in temperature profile do have any impact on the SDI behaviour.
Figure 17 Namibia Seawater Temperature Profile
5.2.4pH
As shown in Figure 18 the pH profile did not take a pattern that could warrant any predictability. However, Figure 19 indicates that that pH for about 90% of the water sampled (during this period) is within the range of 7.6 to 7.8 and with a maximum of 8.4 and a minimum of 7.4.
Figure 18 Namibia Seawater pH Profile
17
5.0
7.0
9.0
11.0
13.0
15.0
17.0
19.0
21.0
23.0
25.0
21/08/2006 10/10/2006 29/11/2006 18/01/2007 09/03/2007 28/04/2007 17/06/2007 06/08/2007 25/09/2007 14/11/2007 03/01/2008
period (day)
tem
pera
ture
(o C)
7.30
7.40
7.50
7.60
7.70
7.80
7.90
8.00
8.10
8.20
8.30
8.40
21/08/2006 10/10/2006 29/11/2006 18/01/2007 09/03/2007 28/04/2007 17/06/2007 06/08/2007 25/09/2007 14/11/2007 03/01/2008

Process Investigation for Namibia Seawater Pre-treatment: A Pilot Plant Operation
Figure 19 Namibia Seawater pH: A Statistical Analysis
5.2.5 Conductivity
The conductivity profile revealed a strange pattern indeed – Figure 20. The pattern suggests that the Namibia seawater is becoming more conductive overtime. That is a suggestion that the main cations are increasing in the seawater. The cause of this strange phenomenon could not, as yet, be determined.
Figure 20 Namibia Seawater Conductivity Profile
5.2.6 Possible Correlations
1851.5
52.0
52.5
53.0
53.5
54.0
54.5
55.0
55.5
21/08/2006 10/10/2006 29/11/2006 18/01/2007 09/03/2007 28/04/2007 17/06/2007 06/08/2007 25/09/2007 14/11/2007 03/01/2008
period (day)
cond
uctiv
ity m
S/cm
0
10
20
30
40
50
60
7.2 7.4 7.6 7.8 8 8.2 8.4 8.6
bin (pH range)
Dat
a Fr
eque
ncy

Process Investigation for Namibia Seawater Pre-treatment: A Pilot Plant Operation
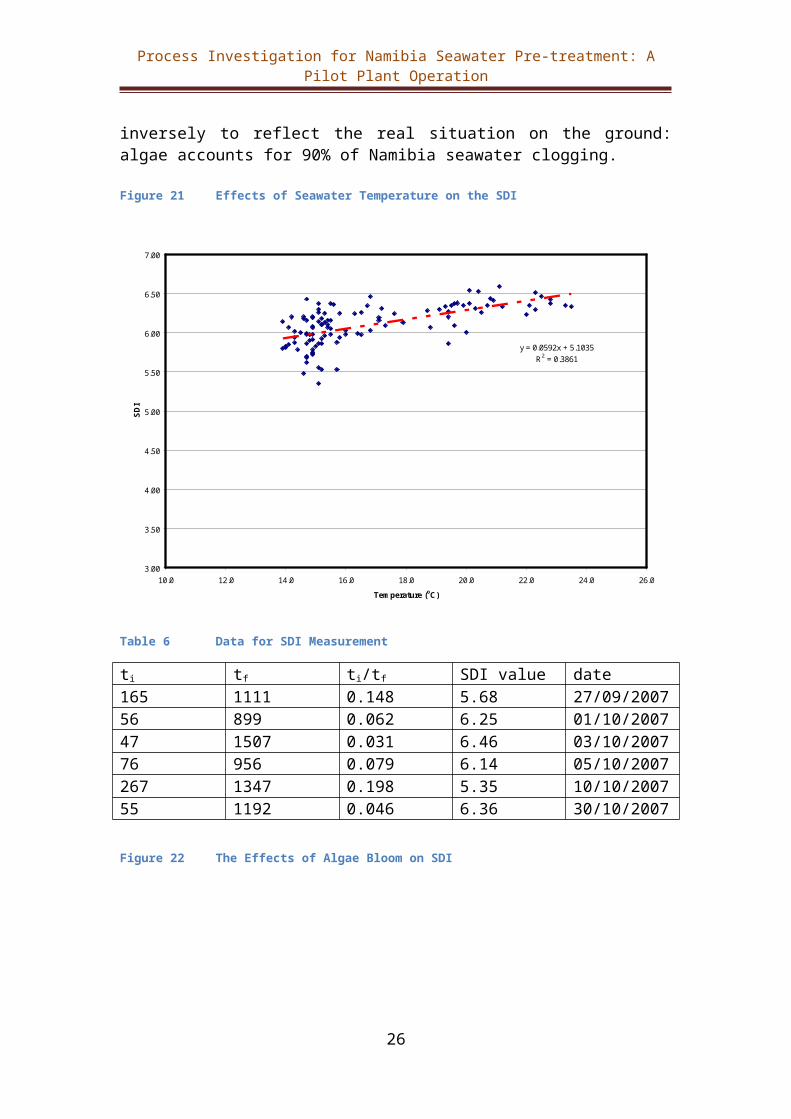
During the pilot plant operation the project team had keen interest to find out whether there were any parameters that had influence on one another. From the data displayed so far it is only the SDI and the temperature that shows any possible seasonal variation. Therefore, it is perhaps worthwhile to find out whether the two parameters have a correlation coefficient (r) that could be of any significance. The relationship between these two parameters is as shown in Figure 21. From Figure 21 the r2 is 0.3861 – therefore the coefficient of correlation (r) is 0.6. Since r is greater then 0.5 the influence of temperature on the SDI can be considered to be significant. It was demonstrated earlier (in this document) that the temperatures at the Namibian coast do peak during the summer months and indeed the SDI is also peaking during the same time (March –April).
The research team was aware that the parameters that are influenced by the temperature are the algae bloom (or the phytoplankton). A decision was therefore taken to also include the algae analysis in the set of parameters monitored. The relationship between algae bloom and SDI is shown in Figure 22. Figure 22 defies logic – the relationship suggests that with increase of algae bloom the SDI improves – the reverse is expected. Since the coefficient of correlation displayed is significantly high at 0.9, even much higher than the SDI-Temperature relationship, the data cannot just be dismissed for wrong anomaly – there must be an explanation.
The explanation to the seeming anomaly (in Figure 22) lies in the SDI equation – equation 1 of this document. To put this anomaly in perspective consider the data shown in Table 6.0. Table 6.0 reveals data obtained from a SDI measuring apparatus for different water quality (i.e. same source at different times). At times the water quality was clogging meaning that ti is high; at other times the water quality was good meaning that the ti was low. Now, equation 1 can be rearranged to look as follows:
Table 6.0 also shows that the ratio ti/tf is low for good quality water and the reverse is true for poor quality water. As a result, the calculated SDI will be high for good quality water and lower for poor quality water – whereas the reverse behaviour is logically expected. Consequently, this inverse behaviour is what is reflected in Figure 22. In other words one should read Figure 22 inversely to reflect the real situation on the ground: algae accounts for 90% of Namibia seawater clogging.
Figure 21 Effects of Seawater Temperature on the SDI
19

Process Investigation for Namibia Seawater Pre-treatment: A Pilot Plant Operation
y = 0.0592x + 5.1035R2 = 0.3861
3.00
3.50
4.00
4.50
5.00
5.50
6.00
6.50
7.00
10.0 12.0 14.0 16.0 18.0 20.0 22.0 24.0 26.0
Temperature (oC)
SDI
Table 6 Data for SDI Measurement
ti tf ti/tf SDI value date165 1111 0.148 5.68 27/09/200756 899 0.062 6.25 01/10/200747 1507 0.031 6.46 03/10/200776 956 0.079 6.14 05/10/2007267 1347 0.198 5.35 10/10/200755 1192 0.046 6.36 30/10/2007
Figure 22 The Effects of Algae Bloom on SDI
20

Process Investigation for Namibia Seawater Pre-treatment: A Pilot Plant Operation
y = -0.0003x + 6.4393R2 = 0.7662
0.00
1.00
2.00
3.00
4.00
5.00
6.00
7.00
0 500 1000 1500 2000 2500 3000 3500
Algae Count (cel/ml)
SDI
5.2.7 DOC/TOC Analysis
Apart from the algae bloom, as the possible parameter that could influence the clogging ability of the seawater, a school of thought in Namwater suggested that a high TOC/DOC in the Namibian seawater also clogs membranes. Hence, samples were taken and sent to South Africa for DOC/TOC analysis. Although the City of Windhoek laboratory do analyse for DOC the method used cannot cope with water with such high conductivity and therefore the need to send to South African laboratories. The results for seawater analysis on this particular parameter are as shown in Table 7.0. Table 7.0 clearly illustrates that the Namibia seawater total organic carbon averages (mostly) below 3.0 mg/l. As a rule of thump the IDS-Water-White Paper (2007) suggests that the alert levels for potential organic fouling in natural water sources, for TOC, are at 3 mg/L – hence, the Namibian seawater averages just below this alert level – the average is about 2.3 mg/L.
Table 7 Namibia Seawater analysis on TOC/DOC
SeaWater
Date TOC DOCUV absorbance
15/11/2006 2 1.8 0.0201/12/2006 2.8 2.7 0.01506/12/2006 3.4 2.9 0.0211/12/2006 1.3 1.1 0.0113/12/2006 1.1 1 0.01518/12/2006 2.7 2.7 0.01220/12/2006 3.8 3.6 0.01506/08/2007 1.3 1.2 08/08/2007 2.5 2.5 13/08/2007 2.6 2.6
21

Process Investigation for Namibia Seawater Pre-treatment: A Pilot Plant Operation
15/08/2007 2.6 2.6 20/08/2007 1 1 22/08/2007 3 2.8
5.2.7 Water Quality Improvement
5.2.3.1 Turbidity Reduction
Turbidity in water is measured by the effect of the fine suspended particles on light beam (The Nalco Water Handbook, 1988). The Nalco Water Handbook also suggests that light-interference analytical methods are classified as nephelometric, and one system of turbidity measurement uses nephelometric turbidity units (NTU). The IDS-Water-White Paper (written by Chris Gallagher) suggest that a maximum of 1 NTU is allowed for RO feed water.
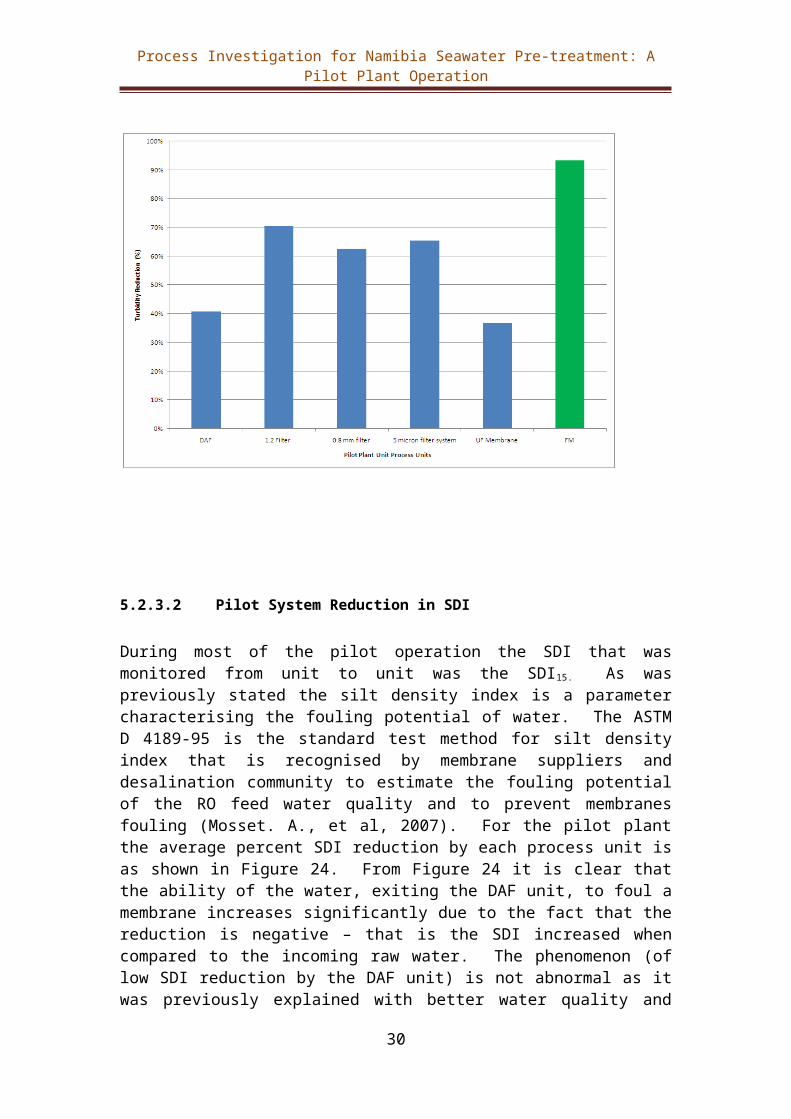
During the pilot plant operation one of the main aim was to evaluate effectiveness of the various process units in the reduction of turbidity. The turbidity percentage reduction for each process unit is as shown in Figure 23. The first stage filter had the highest reduction and the overall reduction from the DAF unit to the second stage filter averaged above 90%. Merely, for this good performance by these units in the turbidity reduction the NamWater management was convinced that a pre-treament process that involves multi media filter as well as the DAF units are essential in guaranteeing good quality feed water to the RO system. The average turbidity that was handled by each process unit is as shown in Table 8.0. The quality of the water exiting the sand media averaged at 0.5 NTU and that value is well within the 1 NTU value as proposed in the IDS-Water-White Paper (Chris Gallagher). However, due to persistent high levels of SDI values (as will be shown later in this document) the NamWater project team was of the opinion that another barrier should follow the sand media filters regardless of their good performance in turbidity reduction.
Table 8 Average Input Water Quality to Various Process Units (Turbidity in NTU)
Process Unit
DAF 1st stage sand media
2nd stage media
Cartridge system
UF membrane
Turbidity 9.37 5.11 1.38 0.5 0.15
Figure 23 Pilot Plant Turbidity Reduction
22

Process Investigation for Namibia Seawater Pre-treatment: A Pilot Plant Operation
5.2.3.2 Pilot System Reduction in SDI
During most of the pilot operation the SDI that was monitored from unit to unit was the SDI15. As was previously stated the silt density index is a parameter characterising the fouling potential of water. The ASTM D 4189-95 is the standard test method for silt density index that is recognised by membrane suppliers and desalination community to estimate the fouling potential of the RO feed water quality and to prevent membranes fouling (Mosset. A., et al, 2007). For the pilot plant the average percent SDI reduction by each process unit is as shown in Figure 24. From Figure 24 it is clear that the ability of the water, exiting the DAF unit, to foul a membrane increases significantly due to the fact that the reduction is negative – that is the SDI increased when compared to the incoming raw water. The phenomenon (of low SDI reduction by the DAF unit) is not abnormal as it was previously explained with better water quality and high SDI values – this situation is real – the DAF unit had very little impact on the SDI reduction. Another phenomenon, which is of significant interest, is the low SDI reduction by the media filters – the reduction is about 14%.
Subsequent to the low reduction in SDI by these upstream process units the project team had no other option but to investigate other process units that could reduce SDI to below 3. As indicated in Figure 24 these process units were the cartridge filter and the UF membrane systems; both these process units reduced the SDI value by 40% and 60%, respectively. The average SDI exiting the cartridge filter was 3.34 and the one exiting from the UF membrane was 1.6. Based on these results the NamWater project team were satisfied that the objective to achieve a water quality with an SDI value of less than 3 was achieved.
Furthermore, it is also worth noting here that SDI is not only influenced by mineral aspect of the water the parameter can also be influenced by the organic characteristic
23
Process Investigation for Namibia Seawater Pre-treatment: A Pilot Plant Operation
of the water as shown in Figure 25 (courtesy of Mosset. A., et al., 2007). As a result it was important for the pilot operation to look at parameters like algae and organics.
Figure 24 % SDI Reduction Evaluated from Pilot Plant Operation
Figure 25 Parameters that influences SDI value
5.2.3.3 Pilot System Algae Reduction
This parameter has not been extensively evaluated. Algae bloom at the sea leads to a condition called red tide. Red tides are accumulations of phytoplankton which discolour the seawater due to red pigments in the cells (Ministry of Fisheries Fax from Swakopmund, 30 July 2008). The same communiqué (from the Ministry of Fisheries) suggests that under normal conditions the south-westerly winds prevail at the Namibian coast. This south-westerly winds mix the water and also bring cold nutrient rich water to the surface which is very important for the plankton feeding. However, during the summer month (the communiqué continues) these south-westerly winds relax and northerly winds prevail – the latter has almost no mixing and therefore no
24

Process Investigation for Namibia Seawater Pre-treatment: A Pilot Plant Operation
upwelling of the nutrients and that results in the dying of the phytoplankton. Eventually the planktons sink to the bottom where the decomposition starts taking place. Such a phenomenon leads to the depletion of oxygen. Finally, when all the oxygen has been used the anaerobic bacteria starts to use sulphates in the decomposition process instead of oxygen converting it to sulphides and eventually to hydrogen sulphide, which is released in the water column. The species that are most responsible for the bloom are diatoms and dinoflagellates.
Samples that were sent to a South African laboratory revealed indeed that the dominant algae genera is of the class basillariophyceae (or diatoms) as shown in Appendix 1.0 of this document. In both of the samples sent the dominant specie was the Delphineis karstenii (Boden) Fryxell & Miller (Figure 26). As can be seen from Table 9.0 the pre-treatment involving multimedia filters can reduce the algae concentrations by more than 98%.
Figure 26 The Delphineis karstenii (Bolden) Fryxell & Miller
Table 9 Pilot Process Algae reduction
Algae Count in Raw Water % Reduction after 2nd stage filterSample 1 1328.75 cell/ml 99.1 %Sample 2 794 cell/ml 99.8%
5.2.3.4 Pilot System Reduction in TOC/DOC
25

Process Investigation for Namibia Seawater Pre-treatment: A Pilot Plant Operation
As can be seen in Table 10.0 the TOC (or DOC) level is very much unaffected by the pre-treatment process investigated. However, the pre-treatment employed would suggests that the feed water quality with regard to TOC will average at less than 3 mg/l. The IDS-Water-White Paper (Chris Gallagher) gives as a rule of thump that the TOC alert levels for potential organic fouling to be at 3 ppm.
Table 10 Effects of Pilot Process Units on TOC/DOC Reduction
Seawater 0.8 mm Cartridge system UF MembraneDate TOC DOC TOC DOC TOC DOC TOC DOC13/08/2007 2.6 2.6 1.9 1.9 2.2 2.1 1.4 1.415/08/2007 2.6 2.6 2.6 2.5 1.4 1.3 2.6 2.606/08/2007 1.3 1.2 2.5 2.5 2.4 2.4 2.5 2.408/08/2007 2.5 2.5 1.4 1.3 2.4 2.4 2.5 2.420/08/2007 1 1 1.7 1.4 1.7 1.5 2.7 2.622/08/2007 3 2.8 3 2.5 2.7 2.3 3 2.7
Average 2.17 2.12 2.18 2.02 2.13 2.00 2.45 2.35
5.2.3.4 Pre-treatment effectiveness: A Summary
Thus far the process units employed demonstrated that Namibia seawater SDI which averages above 6 could only be reduced to just below 5.8, up to the sand filter media. Downstream from the sand filter media the cartridge filters reduced the SDI to just above 3 and the UF produced a finished water quality with an average of 1.6 SDI. However, as will be seen in the section below, it was later advised by the Consultant that cartridge filters function as RO protectors and not as a treatment unit. In other words cartridge filters must be positioned downstream of the UF not the other way round as was the case with this first pilot plant operation.
With regard to turbidity and algae reduction the upstream process units (DAF and filter media) were effective in improving the quality of water significantly. The irony here is that since the media filters reduced the algae by more than 90% and since algae drives the SDI parameter by more than 60%, it is therefore baffling as to why the media filters did not reduce the SDI by a significant margin as well. It could have been helpful if some of these mind-bogging issues were discussed with the RosTek consultants.
5.3 RosTek Intervention for Pilot Plant Operation
5.3.1 Background information
RosTek Associates, Inc. (RAI) is a consultancy company based in Tampa, Florida, in the United States of America. The Company specialises in advanced water treatment, with a special emphasis on membrane technology (RosTek/NamWater Model Services Agreement, December 2007). In this agreement, one of the tasks required from the consultant (3.2 in this Model Services Agreement) was to evaluate NamWater’s current testing and piloting project on the pre-treatment of the seawater and give advice on how to proceed with further testing and the evaluation of the
26

Process Investigation for Namibia Seawater Pre-treatment: A Pilot Plant Operation
results. It is in this regard that RosTek visited NamWater pilot plant at the coast with view to propose changes that can be used to inform the Tender for the design, build and operate of the NamWater desalination plant at the coast.
5.3.2 Proposed Changes by RosTek
The main changes (among many) that were proposed by RosTek were with regard to:
(i) Pilot Plant Configuration(ii) Filter media hydraulic loadings(iii) Use of ferric coagulant(iv) Effective backwashing of relevant units(v) The essential of particle counting and (vi) DO measurement
As was previously indicated the Pilot Plant made use of DAF unit to improve the feed water quality to the filter media. RosTek proposed that the configuration should change to allow the filters media as stand-alone pre-treatment units prior to the membrane pre-treatment system. In addition, it was brought to the attention of the project team that cartridge filters are normally used as RO protectors and must therefore be situated downstream of the UF membrane. Some of the pressure gauges were alleged to have a large dial numbers as a result the differential pressures could not be easily monitored. The resultant proposed configuration changes (as proposed by RosTek) are as shown in Figure 27. Although Figure 27 shows the entire units set-up the revised process started with the basket strainer and therefore bypassing both the flocculation and the DAF units.
Figure 27 Desalination Pre-treatment Pilot Plant: Final Configuration
27

Process Investigation for Namibia Seawater Pre-treatment: A Pilot Plant Operation
With regard to the hydraulic loadings the suggestion was that the operational value must range between 6.48 m/h to 12.6 m/h for the first stage filter and to 12.6 m/h to 19.8 m/h for the second stage filter. The changes to the sand specification made (as shown in Table 11) resulted in a hydraulic loading of 12.58 m/h for both stage filters. The only difference between the two sand stages is the sand specification – and that resulted in a different L/d value of 375 and 625 for the first and second stage filter, respectively. Hence, the total L/d value for the second Pilot Plant run is 1000.
Table 11 Media Filters Specifications.
Description Previous Operation
Current Operation Since 11/03/08
Sandfilter-1 Collins P30 Collins P18Effective Size "d" (mm) 1.2 1.0Bed Depth "L" (mm) 400 375"L/d" 333 375Sandfilter-2 Effective Size "d" (mm) 0.8 0.6Bed Depth "L" (mm) 400 375"L/d" 500 625"L/d" Total 833 1000 Flow Rate (L/h) 2000 2000Flow Rate (L/s) 0.56 0.56Filter Diameter (m) 0.762 0.45Filter Area (m2) 0.456 0.159
Hydraulic Loading (L/s)/m2 1.22 3.49(m/h) 4.39 12.58
The coagulant was changed from an organic coagulant (ACH blend) to an inorganic coagulant ferric chloride. During the first run the use of the organic coagulant was informed by jar test analysis when the ACH blend was compared to the ferric chloride coagulant. However, it was advised during this time that the normal practise is to use the ferric coagulant let alone the fact that coagulation using ferric chloride requires optimum pH adjustment.
The goals aimed at, with the above changes, are as summarised in Table 12 (below).
Table 12 Pre-treatment System Performance Goals (RosTek, 2008)
Unit Process Parameter Units GoalMedia Filtration(Filters A and B)
Silt Density Index(SDI) N/A Less tha 4.0 at all times
Turbidity NTU Less than 0.2 NTUHydraulic Loading Rate 1/s/m2 Highest sustainable rateWater pressure kPa Lowest pressure loss(energy)
28
Process Investigation for Namibia Seawater Pre-treatment: A Pilot Plant Operation
Filter run time Hrs Longest run between backwash events
Waste volume 1 Lowest rinse volume expressed as a percentage of total feed water flow
Membrane Filtration Silt Density Index(SDI) N/A Less than 3.0, 90% of the time.Turbidity NTU Less than 0.1 NTUHydraulic Loading Rate 1/s/m2 Highest sustainable rateWater pressure kPa Lowest pressure loss(energy)Filter run time Hrs Longest run between CEB
/backwash eventsWaste volume 1 Lowest rinse volume expressed as a
percentage of total feed water flow
5.3.3 Pilot Plant Evaluation After Proposed Changes
5.3.3.1 Media Filtration Performance
The performance of the media filters is compared against the goals as shown in Table 13 below. As seen in Table 13, for both the SDI and turbidity, the respective goals were never met. It should be noted here that prior to these proposed changes the media filtration performance with regard to the turbidity averaged at 0.5 NTU, which was still above 0.2 when compared to the goal in Table 13.0. Owing to the fact that the DAF unit reduced turbidity by about 40% it is perhaps a clear demonstration that if water quality of less than 0.2 NTU is a requirement as feed to the UF unit then the DAF unit could not be taken out, as was the case during this second run.
Table 13 Media Filter Performance
Parameter Average GoalSDI 6.23 < 4Turbidity (NTU) 0.69 < 0.2
5.3.3.2 Particle Counting
Earlier, in this document, it was demonstrated that the algae species, the Delphineis karstenii, composed more than 70% of the algae in the feed water. This type of algae is 27 – 86 micrometer in length and 6 – 7 micrometer in width. Depending on its orientation it may require an aperture of more than 87 micrometer to pass through. During the particle counting the equipment was set to look at particle with the size ranging from 2 micrometer and above. The monitoring was done on the raw water, media filter output, UF feed and UF output.
As seen in Figure 28 the dominant particle size ranges between 3 and 5 micron range for which the average count is about 6000 cells/40 ml. The 6 to 7 micron range (to which the Delphineis belongs) averages about 2800 cells/40 ml – that is the range 7 to 10 micron. The particle reduction for the 3 to 5 micron range (the dominant range) is shown in Figure 29. Figure 29 shows that the media filters reduce the dominant range
29

Process Investigation for Namibia Seawater Pre-treatment: A Pilot Plant Operation
by more than 60%. Again this demonstrates the essential to include sand filter(s) in the pre-treatment process to extend the life span of membrane systems downstream.
Figure 28 Raw water Particle Counting in 40 ml
Figure 29 Unit Process Particle Count reduction
5.3.3.3 DO Analysis
As was alluded to earlier the analysis of DO is essential; the production of the algae requires oxygen and therefore, the analysis of DO could be an indication with regard to the bioactivity in the sea. Low oxygen in the water could therefore also be an indication that the hydrogen sulphide is produced by the decomposed anaerobic bacteria.
30

Process Investigation for Namibia Seawater Pre-treatment: A Pilot Plant Operation
Figure 30 shows the influence of dissolved oxygen on particle count per given volume. The behaviour suggests that an increase in oxygen leads to increase in particle count, just as expected. This count shown is for the range between 2 and 3 micron for the raw water. The coefficient of correlation is 0.7, which is quite significant. Therefore, DO could be used as a quick way to adjust chemical dosage for effective coagulation.
Figure 30 Effects of Dissolved Oxygen on Particle Count.
5.3.3.4 Backwashing of Relevant Process Units
During the first pilot operation, at a hydraulic loading rate of 4.39 m/h, the sand filter backwash was only done once per day to ensure a flow of 2m3/hr through the system. The filters were operated throughout the day and at the end of the day the flow dropped by about 10% - the backwash was done to correct the flow.
As with the increased hydraulic loading of 12.6 m/h it was necessary to backwash the filters after every 3 hours to avoid the flow dropping below 2 m3/hr. It should be taken into consideration here though, that during the first run the feed water to the filters passed through the DAF unit. During the second run the feed water to the filters was direct. As a matter of fact, to prove the point, feed water to the filters was again routed via the DAF unit system. The filter run was immediately extended to 7
31

Process Investigation for Namibia Seawater Pre-treatment: A Pilot Plant Operation
hours. Again, this demonstrates the importance of the DAF unit system as an important pre-treatment unit, especially at such high hydraulic loadings.
As was stated, earlier in this document, during this second pilot plant operation the cartridge filter was situated downstream of the UF membrane. Unlike the first pilot operation during which the UF was never backwashed, the UF was backwashed everyday to avoid any particle build up. Initially, the idea was to backwash the UF filter at any time when the inlet pressure increased by more than 10% or a trans membrane pressure (TMP) of about 46 kPa. As seen in Figure 31 the TMP increased above 46 kPa during conditions of red tide situations. It is alleged (by H. Opperman) during the month of March 2008, when the red tide conditions were severe, at times the UF had to be backwashed three times in six hours. That clearly suggests that any proposed pre-treatment process cannot ignore the severity of the red tided conditions.
Figure 31 UF Trans-membrane Pressure
5.3.3.5 Use of Ferric Chloride
Due to operational problems the use of ferric chloride, as the preferred coagulant, was not used until about the second week of April during 2008. Since it was suggested that the use of ferric chloride is the norm in the desalination of seawater it is perhaps appropriate to compare the effectiveness of ferric coagulant to that of aluminium chlorohydrate (ACH) blend. Since the results for the organic coagulant were operated
32
Process Investigation for Namibia Seawater Pre-treatment: A Pilot Plant Operation
via the DAF unit system, to compare apples with apples, it was necessary also to run the water through the DAF unit system, and using the ferric coagulant instead.
Figure 32 compares the two coagulants used during the pilot plant operation. Since the turbidity was much high when the ferric coagulant was used, data for which the turbidity was higher than four (during the organic coagulant usage) was compared. The dosage for the ferric and the organic coagulant was 5mg/l and 2mg/l, respectively. Figure 32 confirms that the best coagulant for water treatment is of the ferric type. It should also be taken into consideration that ferric coagulant performs better at reduced pH. The comparison in Figure 32 was not done under optimum conditions for the ferric product – still the ferric coagulant appreciably outperformed the organic coagulant during the pilot plant exercise.
Figure 32 Namibian Seawater Coagulation by Ferric and Polymer: A Comparison
6.0 Sustainable Operation of the Desalination Plant
It is without a shadow of doubt that within a short period of time Namibia will soon operate the biggest desalination plant, in Africa, south of the equator. At present, the use of desalination technology (at any significant magnitude) is not available in Namibia. Although NamWater called for a tender to design, build and operate a desalination plant, the operation of the desalination plant in a sustainable manner by NamWater will be a challenge after the two years operation by the Contractor - the Contractor is required to operate the plant for a period of two years. Therefore,
33

Process Investigation for Namibia Seawater Pre-treatment: A Pilot Plant Operation
NamWater is left with no other obligation than to investigate the viable options for sustainable operation after the two year contract.
Gebel J. and Yuce S. (2007) suggest a personnel structure for a desalination plant larger than 50 000 m3/d as shown in Figure 33 below – the proposed NamWater desalination plant is initially at 50 000 m3/d and that output is expected to be upgraded to 80 00 m3/d later on. Figure 33 indicates that the total employees figure for a desalination plant, with an output larger than 50 MLD, is 207. At present, NamWater total employees are about 620 – hence, the desalination plant will add about another 33% to the total. Although, some of the functions like, safety and training could be outsourced, still the final number of employees for the NamWater desalination plant may still be significant. Therefore, it will be ideal if NamWater starts to recruit personnel for the desalination plant at least a year before the desalination plant commissioning.
The reason behind recruiting early is to allow basic training for these employees to take place before commissioning of the desalination plant. The training in mind here is to allow personnel like Operation Manager, shift engineers and control room operators to visit sites (for example in the MENA countries) where there are desalination simulations. The incumbents could be certified to operate these simulation plants. In a nutshell the training and continuous training for the desalination personnel should be strategized by NamWater and immediately acted upon.
Figure 33 Employees Structure of a Desalination Plant Larger than 50 000 m3/d (Source: Courtesy of Gebel J., and Yuce S., 2007)
7.0 Lessons Learned from Pilot Plant Operations
For the first time NamWater had an in depth evaluation of Namibia sea water. Appreciable information with regard to the following issues is now at first hand to NamWater management:
Indeed the Namibia seawater has a high SDI value (or plugging index) which may require an elaborated pre-treatment system to reduce it at values below
34

Process Investigation for Namibia Seawater Pre-treatment: A Pilot Plant Operation
3.0. The SDI is in most instances driven by temperature; in fact the SDI value is driven 60% of the time by the temperature behaviour. Such a phenomenon suggests that the Namibia seawater SDI is closely related to the algae bloom or in other words the fouling potential of the Namibia seawater is mostly organic in nature.
The pilot process operation also revealed that the Namibia seawater turbidity floats between 4 and 10 NTU. In most cases this turbidity was easily removed by the process units employed.
However, the SDI could not be easily removed by the process units employed. The DAF unit was not as effective in removing the SDI although the media filters were able to reduce the SDI value by only 14% - and that was very low reduction indeed. Perhaps the use of DAF unit only before the UF membrane, without any sand filters media may not be the wise thing to do to effectively pre-treat the Namibia seawater to warrant a reduced SDI value before the RO units.
Although the red-tides breaks were not properly documented the pilot plant operation demonstrated that the prevalence of the red-tide in the Namibia seawater could be challenging to the pre-treatment process: during the red-tide conditions both the media filters and the UF membrane required frequent backwashing.
It should also be taken into consideration that although the plugging nature of the Namibia seawater is mostly organic in nature the TOC/DOC levels were only having average values below 3 mg/l and the process units employed did not reduce this parameter at all.
Adding to the irony (mentioned above) the algae genera that were found in the Namibia seawater could easily be removed by the sand media by more than 90%, yet the TOC reduction appear to be unreduced. Nevertheless, the fact that the algae were significantly reduced by the media filters indicted that the media filters contributes appreciably to the reduction of Namibia seawater organic fouling tendency.
As was mentioned before earlier in this document, for the first time Namibia will engage in the establishment of a desalination plant with a capacity of 50 MLD and more; however, there is no experience within NamWater or in Namibia with regard to the operation of a desalination plant. The operation of the pilot plant exposed two of NamWater personnel (Mr H. Opperman and John Matheus) to the rigorous monitoring of parameters for a desalination pre-treatment process and owing to the fact that a typical desalination plant requires a large personnel, NamWater must seriously strategise the capacity building with regard to desalination process.
Finally, reading the mood from the American presidential nominees, in America, a country that is the world largest energy consumer, the way forward is to build more nuclear power plants to reduce American dependency on oil. Therefore, the demand for uranium will be with us for a while. Such
35

Process Investigation for Namibia Seawater Pre-treatment: A Pilot Plant Operation
prevalence in uranium demand may necessitate NamWater to build more desalination plants. Hence, there must be a clear strategy from NamWater with regard to the operation of these potential desalination plants. It should be clear whether NamWater would opt for outsourcing such operations or whether NamWater will opt to build capacity within.
36

Process Investigation for Namibia Seawater Pre-treatment: A Pilot Plant Operation
8.0 The Way-ForwardAs a way of influencing the future with regard to desalination activities by NamWater management this documents suggest three issues to be seriously addressed:
(1) Firstly, the media filters appear to reduce algae count by quite an order of magnitude, therefore any Contractor who proposes to use a pre-treatment system without the media filters, mainly for capital cost reduction, should demonstrate the offsetting cost that will be incurred by UF membrane replacements.
(2) Secondly, NamWater should start with the recruitment of the main personnel for the desalination plant and thereafter map the training for all these individuals. It is suggested here that such a recruitment should commence before the end of this calendar year (2008).
(3) Finally, NamWater should formulate a clear cut policy with regard to desalination plants management: For example, will each desalination plant stand as an individual business unit or will each plant be operated like a region or area?
37

Process Investigation for Namibia Seawater Pre-treatment: A Pilot Plant Operation
9.0 References
Heyns, P., Montgomery, S., Pallett, J., and Seely, M., Namibia’s Water A Decision Makers’ Guide, Windhoek, The Department of Water Affairs, Ministry of Agriculture, Water and Rural Development and The Research Foundation of Namibia: May 1998.
Gallagher, C., “IDS-Water-White Paper,” Whitepaper on RO Water Chemistry.htm, (2006):
Gebel, J., and Yuce, S., “A new approach to meet growing demand of professional training for the operating and management staff of desalination plants,” Desalination, 220, (2007): 150 - 164
Glater, J., “The early history of reverse osmosis membrane development,” Desalination, 117, (1998): 297 - 309
Kee, D. E., “Nuclear Fuel: A New Market Dynamic,” The Electricity Journal, 20, (2007): 54 – 64.
Khawaji, A. D., Kutubkhanah, I. K., and Wie, J., “Advances in seawater desalination technologies,” Desalination, 221, (2007): 47 - 69
Krishna, H., “Introduction to Desalination Technologies,” Texas Water Development Board
Livingstone Shire Council, (2005)
Mosset, A., Bonnelye, V., Petry, M., and Sanz, M.A., “The sensitivity of SDI analysis: from RO feed water to raw water,” Desalination, (2006): 17 – 23
Ministry of Agriculture Water and Rural Development, “Water Supply to the Central Namib Area of Namibia Feasibility Study,” File Number 13/7/1/6/1, (August 1996):
Williams, M.E., “A Brief Review of Reverse Osmosis Membrane Technology,” EET Corporation and Williams Engineering Services Company, Inc., (2003):
38

Process Investigation for Namibia Seawater Pre-treatment: A Pilot Plant Operation
10 Appendices
39

Process Investigation for Namibia Seawater Pre-treatment: A Pilot Plant Operation
Appendix 1.0 Algae Genera in the Namibian Seawater
40

Process Investigation for Namibia Seawater Pre-treatment: A Pilot Plant Operation
41

Process Investigation for Namibia Seawater Pre-treatment: A Pilot Plant Operation
42

Process Investigation for Namibia Seawater Pre-treatment: A Pilot Plant Operation
Appendix 2.0 Proposed Structure of a Desalination Plant Larger than 50 000 m3/d (Courtesy of Gebel., and Yuce., 2007)
43


![kmstechnologies.com¼… · 10−1 100 101 102 10−2 10−1 t [s] step response [mV/km] seawater air, seawater air, seawater, sediments air, seawater, sediments, reservoir 100 102](https://static.fdocuments.us/doc/165x107/5ed9d12ffc45a253ed575c3b/-10a1-100-101-102-10a2-10a1-t-s-step-response-mvkm-seawater-air-seawater.jpg)