Process Dynamic and Control I CHEN 341 What is … Control...2 Dr. Mohamed Helmy CHEN 341 Process...
59
1 Dr. Mohamed Helmy CHEN 341 Process Dynamic and Control I CHEN 341 What is process control? 1. Process: number of successive steps (sequence of operations involving a change in a substance being treated) Series of steps or actions (chemical or mechanical) taken in order to achieve a change or a particular end. Examples of processes include: Change of energy state, such as from hot to cold, or liquid to gas, distillation of water Change of composition, as occurs in a chemical reaction or in mixing Change of dimension, as in breaking coal Change in level, as in reservoir or tank filling Change in media velocity, as in a reservoir feed pipe Holding a pressure level, as in a water distribution network 2. Control: To maintain desired conditions in a physical system by adjusting selected variables in the system Process control is a branch of automatic control that is used to maintain process conditions at their desired values by manipulating certain process variables to adjust the variables of interest. Note: Process automation involves using computer technology and software engineering to help e.g. power plants and factories in industries as diverse as paper, mining and cement to operate more efficiently and safely Compare between process dynamic and process control? Process dynamics is concerned with the study of transient and steady-state behaviour of processes. (Study the change of process variable with time until it reaches the new steady state value)
Transcript of Process Dynamic and Control I CHEN 341 What is … Control...2 Dr. Mohamed Helmy CHEN 341 Process...

1
Dr. Mohamed Helmy CHEN 341
Process Dynamic and Control I CHEN 341
What is process control?
1. Process: number of successive steps (sequence of operations involving a change in a
substance being treated)
Series of steps or actions (chemical or mechanical) taken in order to achieve a change or a
particular end.
Examples of processes include:
Change of energy state, such as from hot to cold, or liquid to gas, distillation of water
Change of composition, as occurs in a chemical reaction or in mixing
Change of dimension, as in breaking coal
Change in level, as in reservoir or tank filling
Change in media velocity, as in a reservoir feed pipe
Holding a pressure level, as in a water distribution network
2. Control: To maintain desired conditions in a physical system by adjusting selected variables
in the system
Process control is a branch of automatic control that is used to maintain process conditions at
their desired values by manipulating certain process variables to adjust the variables of
interest.
Note: Process automation involves using computer technology and software engineering to
help e.g. power plants and factories in industries as diverse as paper, mining and cement to
operate more efficiently and safely
Compare between process dynamic and process control?
Process dynamics is concerned with the study of transient and steady-state behaviour of
processes. (Study the change of process variable with time until it reaches the new steady state
value)

2
Dr. Mohamed Helmy CHEN 341
Process control is concerned with the "control" or "manipulation" of process behaviour so that
the process operates close to the desired operating point even in the presence of disturbances.
Examples of simple control systems:
1- A human being riding a bicycle
Fig. 1, A man riding a bicycle and trying to advance on an imaginary straight line
The rider looks ahead and receives information about his current position (Controlled
Variable) and also about the imaginary dotted line (Set Point). So obviously the eye acts as
the Sensor, that sends the information to the human brain (the controller), and after processing
the data, the decision or control action is achieved by steering the bicycle by the rider’s hand
(Final Control Element).
2. Float type Liquid Level Controller
A rise in liquid level causes the hollow Ball–Float to lift, and the attached ‘plug’ of a valve
mechanism comes closer to its ‘seat’ (built on the end of the liquid inlet) to reduce the
liquid inflow. In the system, the set point is the location of the hinge on the tank wall which is
usually fixed because in major number of applications it is required that the tank should be
filled to the fullest before use.

3
Dr. Mohamed Helmy CHEN 341
Fig. 2, The float type level controller
3. The temperature control system of a mixer pre-heater
Fig. 3, The temperature control system of a mixer pre-heater
A Thermocouple Sensor, TC, measures the exit stream temperature, TC. The TC output is
electronically conditioned in the Temperature Transmitter, TT, to 4–20 mA DC current signal
and transmitted as the measured variable, TM, to the Temperature Indicator Controller, TIC.
Such a Controller, beside its control capability has the facility of displaying the Measured
Variable, TM, and Set value, TR. Error is found as, e = TR – TM, and the Controller Output, CO, is
produced as a function of error. The low energy output from the Controller is amplified
through the FCE (which may be a Thyristor type power regulator) that changes the power
mains current to the resistance heater in the tank.
4
Dr. Mohamed Helmy CHEN 341
4. The dynamic level system
Fig. 4, The dynamic level system and its control
A tank acts as a constant head reservoir for supplying liquid to a process. The process
has variable demands. A Constant head in the tank is required so that exit flow rate is only
dependent on the resistance in the outflow line. The resistance may be the Control Valve
(FCE) of the control system of the downstream process. The liquid level of the tank is
measured by a level sensor-transmitter, and sent to the level Controller. The Controller
Output manipulates inflow through the Control Valve. The open loop process, and the
process with its control system has been shown in Figure ( ).
5. The reflux ratio control of a distillation column
Fig. 5, The reflux ratio control of a distillation column

5
Dr. Mohamed Helmy CHEN 341
In a distillation column, the reflux ratio is one of most important parameters to be
maintained to keep up the top product or distillate composition to the desired value; and in
many instances top product is the desired product of this operation. Reflux ratio, as the
name suggests, is the ratio of molar or mass flow rates of two streams R and D.
The Total Condenser condenses all the vapors coming from the top plate of the column. The
condensed liquid is diverted into two streams, R and D. R is fed back to the top plate, and D is
the product stream. A composition sensor-transmitter on the product line measures the
product composition and sends the information to the composition Controller, which
manipulates the reflux ratio through the three-way control valve. Figure ( ) depicts the
control system [Three way Control Valves are a variety of control valves and acts as special
final control elements. They come in two basic configurations:
(1) Diverting type has one inlet and two outlet ports. Liquid coming through inlet goes out
through the outlet ports subdivided into two streams at a definite volume ratio. This ratio is
dependent on the valve stem position.
(2) Mixing type has one outlet and two inlet ports.
Liquids coming through inlet ports are mixed in a definite volume ratio inside the valve
body, and go out through the outlet port. Again this ratio is dependent on the valve stem
position.]. The same control action may be achieved by using two sets of two-way
Control Valves.

6
Dr. Mohamed Helmy CHEN 341
6. Multi-loop control system of a flashing stage
Fig. 6, Multi-loop control system of a flashing stage
What are the main components of a control system?
Any control system consists of main four components:
(a) process (b) measuring element (sensor)
(c) controller (d) final control element (FCE)
Why process control? What are the objectives of process control?
A control system is required to perform either one or both task:
(1) Safety (2) Environmental protection
(3) Equipment protection (4) Smooth operation
(5) Product quality (6) Profit
(7) Monitoring and diagnosis (8) Efficient use of raw materials and energy
7
Dr. Mohamed Helmy CHEN 341
Tasks of a control engineer
Identifying the controlled system
Defining the controlled variable
Defining the measuring point
Determining the disturbance variables
Selecting of the final control element
Examining whether a closed-loop control system offers appreciable advantages
Selecting a suitable controller
Assembling the control devices taking into consideration guidelines
Commissioning, parameterisation, optimization
How is control documented?
There are two methods for control system documentation:
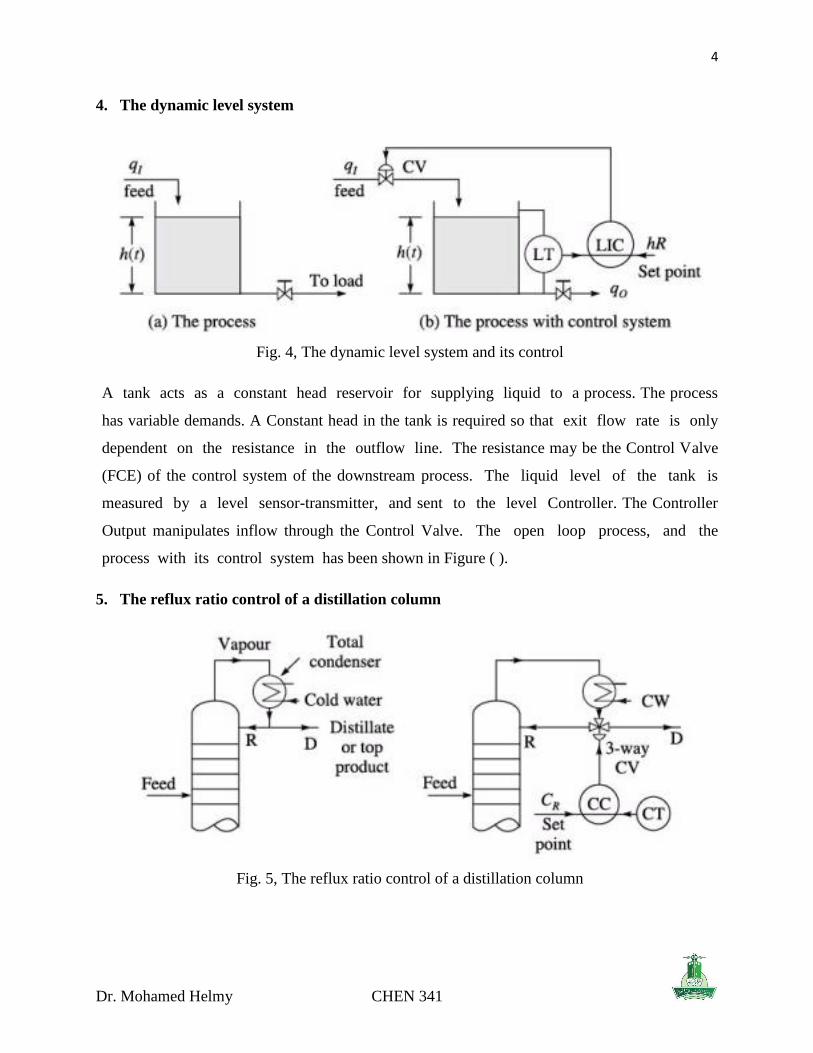
A. physical control system
Consists of a simple flow sheet showing the process and the location of the measuring element,
the controller, and the final control element
Fig. 7, Physical control system for a heating process in a stirred tank reactor

8
Dr. Mohamed Helmy CHEN 341
B. block diagram
It indicates the flow of information around the control system, the relationship between signals,
and the function of each part of the system (Fig. 8).
Each component of the system is represented by a block, with little regard for the actual physical
characteristics of the represented component (e.g., the tank or controller).
Block diagram contains information like:
a) Material, Energy and Signal Flows within the system.
b) The Mathematical Processing done for conversion of a signal to another (as happens when
a temperature sensor-transmitter converts the process temperature to an electrical current).
c) Branching and algebraic addition of the signal streams.
A Block Diagram generally consists of four basic elements:
a) Lines represent a signal, material or energy stream path and the associated Arrow-
Head expresses the direction of flow.
b) The summing points represent the algebraic summation of signals coming through the
incoming arrows with the +ve or –ve signs as their algebraic attributes. The resulting
signal flows out through the outgoing arrow.
c) A branch point is the location on a line at which the signal branches out and goes parallel
to their individual destination.
d) A block represents the mathematical operation done on an incoming signal to convert that
to the next one. Thus, a block is where the input signal to the block terminates and the
output signal from the block is generated. In a block diagram the blocks generally
represent the hardware used in a control system.
Any block diagram can be handled or manipulated algebraically. Figure 9 shows the essential
rules of block diagram algebra.

9
Dr. Mohamed Helmy CHEN 341
Fig. 8, generalized process control system (closed loop feedback).
Fig. 9, Rules of block diagram algebra
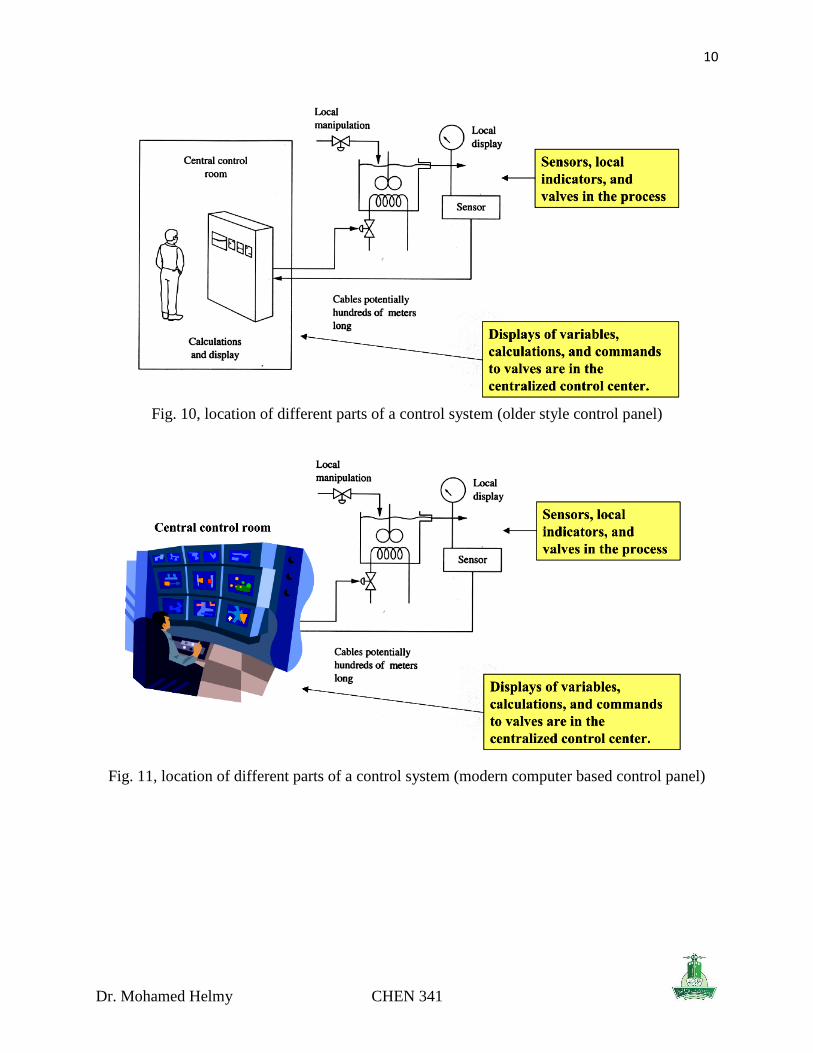
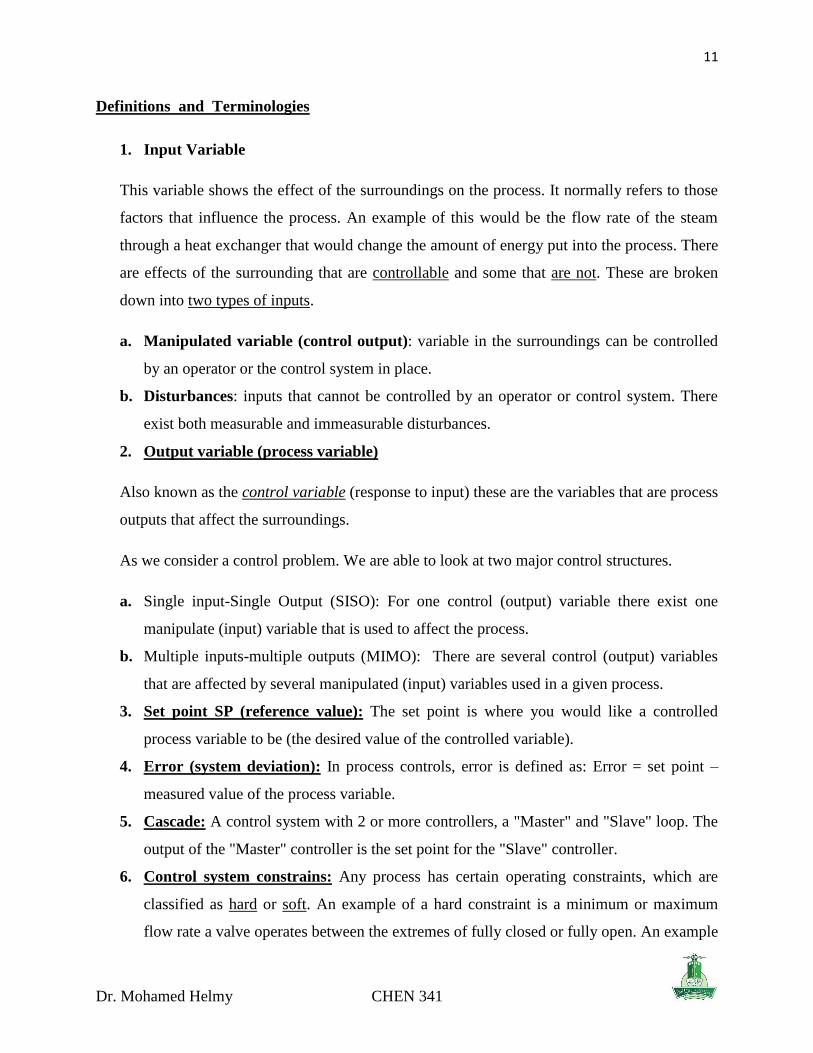
Where is control done?
Sensors, local indicators, and valves (FCE) are located in the process.
Displays of variables, calculations, and commands to valves are in the centralized control
center.
10
Dr. Mohamed Helmy CHEN 341
Fig. 10, location of different parts of a control system (older style control panel)
Fig. 11, location of different parts of a control system (modern computer based control panel)
11
Dr. Mohamed Helmy CHEN 341
DefinitionsandTerminologies
1. Input Variable
This variable shows the effect of the surroundings on the process. It normally refers to those
factors that influence the process. An example of this would be the flow rate of the steam
through a heat exchanger that would change the amount of energy put into the process. There
are effects of the surrounding that are controllable and some that are not. These are broken
down into two types of inputs.
a. Manipulated variable (control output): variable in the surroundings can be controlled
by an operator or the control system in place.
b. Disturbances: inputs that cannot be controlled by an operator or control system. There
exist both measurable and immeasurable disturbances.
2. Output variable (process variable)
Also known as the control variable (response to input) these are the variables that are process
outputs that affect the surroundings.
As we consider a control problem. We are able to look at two major control structures.
a. Single input-Single Output (SISO): For one control (output) variable there exist one
manipulate (input) variable that is used to affect the process.
b. Multiple inputs-multiple outputs (MIMO): There are several control (output) variables
that are affected by several manipulated (input) variables used in a given process.
3. Set point SP (reference value): The set point is where you would like a controlled
process variable to be (the desired value of the controlled variable).
4. Error (system deviation): In process controls, error is defined as: Error = set point –
measured value of the process variable.
5. Cascade: A control system with 2 or more controllers, a "Master" and "Slave" loop. The
output of the "Master" controller is the set point for the "Slave" controller.
6. Control system constrains: Any process has certain operating constraints, which are
classified as hard or soft. An example of a hard constraint is a minimum or maximum
flow rate a valve operates between the extremes of fully closed or fully open. An example

12
Dr. Mohamed Helmy CHEN 341
of a soft constraint is a product composition it may be desirable to specify a composition
between certain values to sell a product, but it is possible to violate this specification
without posing a safety or environmental hazard.
Remember: What are the objectives of process control?
A control system is required to perform either one or both task:
(1) Safety (2) Environmental protection
(3) Equipment protection (4) Smooth operation
(5) Product quality (6) Profit
(7) Monitoring and diagnosis
Let us discus these objectives on the following process:
Fig. 12, Hydrocarbon separation

13
Dr. Mohamed Helmy CHEN 341
1. Safety
Fig. 13, control system as a safety tool
2. Environmental protection
Fig. 14, control system as a means of environmental protection
14
Dr. Mohamed Helmy CHEN 341
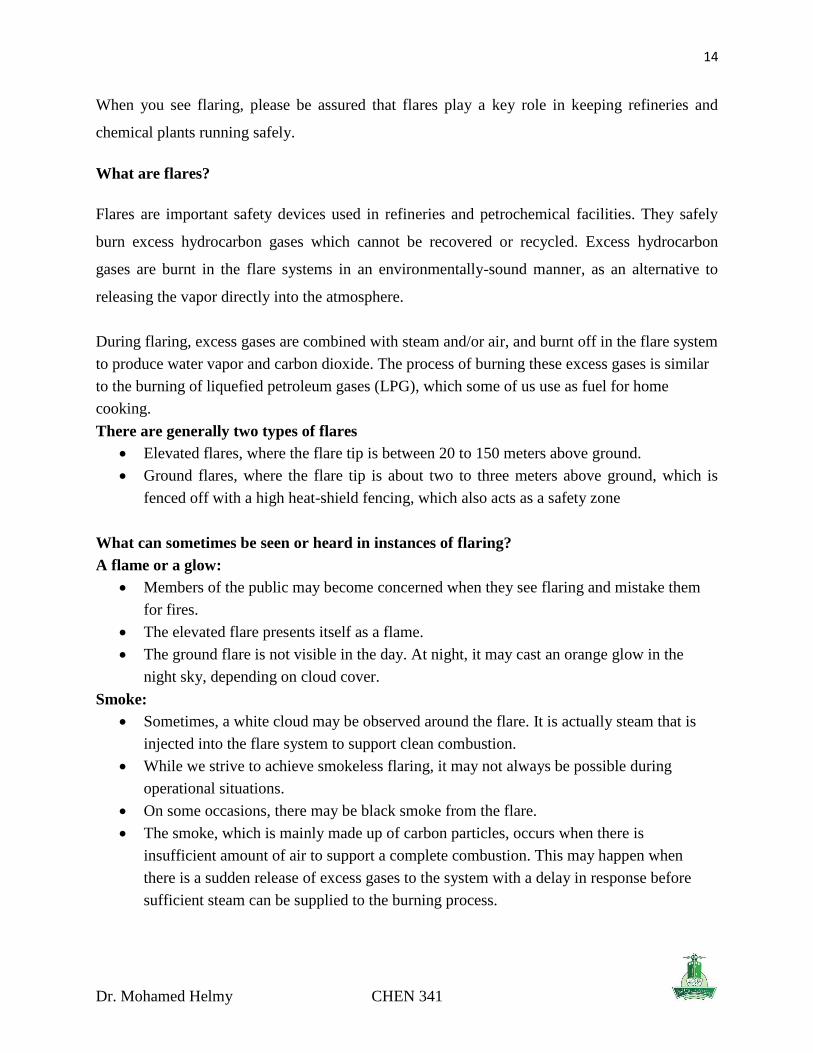
When you see flaring, please be assured that flares play a key role in keeping refineries and
chemical plants running safely.
What are flares?
Flares are important safety devices used in refineries and petrochemical facilities. They safely
burn excess hydrocarbon gases which cannot be recovered or recycled. Excess hydrocarbon
gases are burnt in the flare systems in an environmentally-sound manner, as an alternative to
releasing the vapor directly into the atmosphere.
During flaring, excess gases are combined with steam and/or air, and burnt off in the flare system
to produce water vapor and carbon dioxide. The process of burning these excess gases is similar
to the burning of liquefied petroleum gases (LPG), which some of us use as fuel for home
cooking.
There are generally two types of flares
Elevated flares, where the flare tip is between 20 to 150 meters above ground.
Ground flares, where the flare tip is about two to three meters above ground, which is
fenced off with a high heat-shield fencing, which also acts as a safety zone
What can sometimes be seen or heard in instances of flaring?
A flame or a glow:
Members of the public may become concerned when they see flaring and mistake them
for fires.
The elevated flare presents itself as a flame.
The ground flare is not visible in the day. At night, it may cast an orange glow in the
night sky, depending on cloud cover.
Smoke:
Sometimes, a white cloud may be observed around the flare. It is actually steam that is
injected into the flare system to support clean combustion.
While we strive to achieve smokeless flaring, it may not always be possible during
operational situations.
On some occasions, there may be black smoke from the flare.
The smoke, which is mainly made up of carbon particles, occurs when there is
insufficient amount of air to support a complete combustion. This may happen when
there is a sudden release of excess gases to the system with a delay in response before
sufficient steam can be supplied to the burning process.

15
Dr. Mohamed Helmy CHEN 341
Steam is usually added to the gases to increase turbulence in the gas flow. This increases
air intake that helps to achieve complete combustion and smokeless flaring.
Noise
Flaring may produce a rumbling noise. It may sound like thunder.
This is due to the turbulent mixing of gases, air and steam. The sound is similar to what
you hear when you fan a campfire, and oxygen is mixed with the flame.
Fig. 15, Flare stack

16
Dr. Mohamed Helmy CHEN 341
3. Equipment protection
Fig. 16, control system as a method of equipment protection
4. Smooth operation production rate
Fig. 17, control system as a method to maintain smooth operation

17
Dr. Mohamed Helmy CHEN 341
5. Product quality
Fig. 18, control system as a method to maintain product quality
6. High profit
Fig. 19, control system as a method to obtain high profit

18
Dr. Mohamed Helmy CHEN 341
7. Monitoring and diagnosis
Fig. 20, control system as a method of monitoring and diagnosis
Attributes of control system
There are several common attributes of control systems:
1. Disturbance rejection: The ability to maintain the process variable at its desired value in spite
of disturbances that might be experienced
2. Set point tracking: The ability to move the process variable from one setting to a new desired
setting

19
Dr. Mohamed Helmy CHEN 341
Types of control loops
a) Feedback control loop:
In a feedback control system, information about performance is measured and that
information is used to correct how the system performs.
Example:
Fig. 21, the feedback control of the liquid level in a boiler drum
Another example for feedback control is the control of an outlet temperature of a heat
exchanger:

20
Dr. Mohamed Helmy CHEN 341
Fig.22, feedback control of the outlet temperature of a heat exchanger process fluid
Feedback control can be implemented with different strategies as shown in the example of
controlling liquid level in a tank
Fig. 23, feedback control strategy 1 of the level is measured and the inlet flow rate

21
Dr. Mohamed Helmy CHEN 341
Fig. 24, feedback control strategy 2 of the level is measured and the inlet flow rate
(Note there are two inputs to the LT for LAH and LAL)
Feedback control of reactor temperature:
Fig. 25, Feedback control of reactor temperature

22
Dr. Mohamed Helmy CHEN 341
The following example shows feedback control loops for different parameters in a distillation
column:
This system shows the following control loops:
1) Pressure at the top of the tower by
adjusting the cooling water flow rate for
controlling rate of vapor condensation. Q =
m Cp ∆T = V∆H
2) Level control for the liquid in the reflux
drum
3) Temperature control of the top plates 4) Inlet feed temperature
5) Liquid level control at the tower bottom
Note: the control loop for steam is a feedforward
Fig. 26, Distillation column with six single-loop control systems
23
Dr. Mohamed Helmy CHEN 341
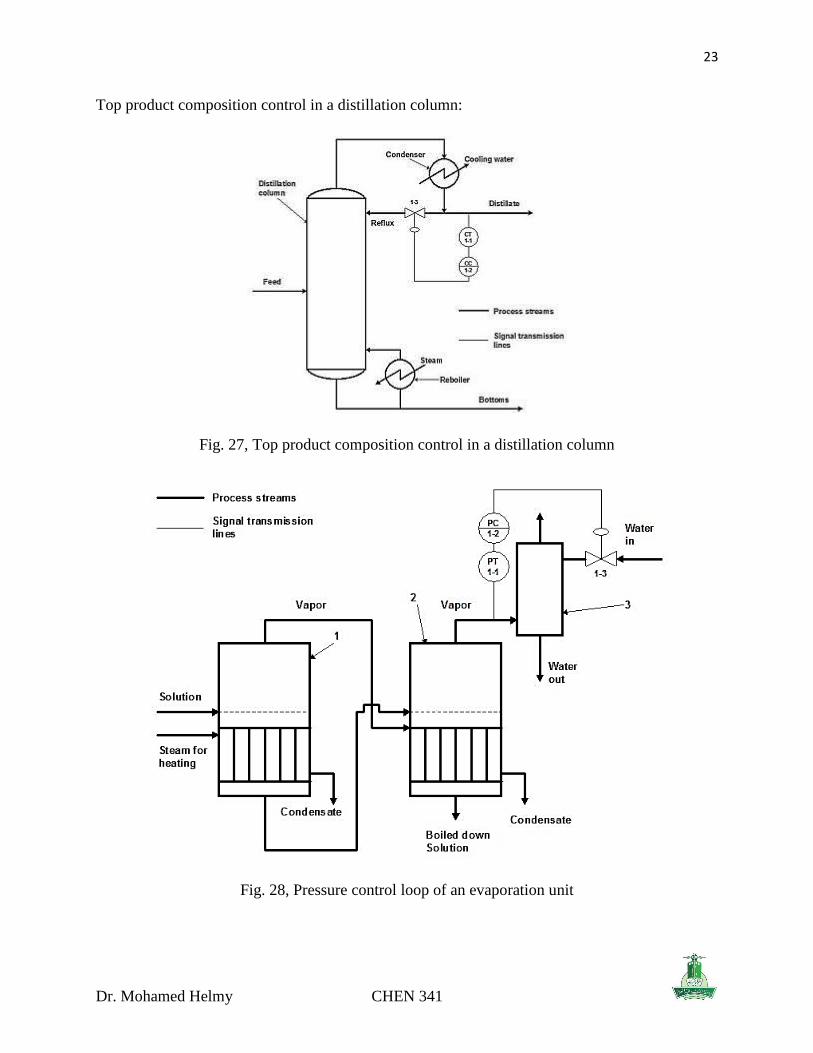
Top product composition control in a distillation column:
Fig. 27, Top product composition control in a distillation column
Fig. 28, Pressure control loop of an evaporation unit

24
Dr. Mohamed Helmy CHEN 341
pH control
Fig. 29, pH control system
The general block diagram for this type of control loops (feedback) is shown in figure 6.
Fig.30, General block diagram for the feedback control system

25
Dr. Mohamed Helmy CHEN 341
There are two types of feedback control loops:
a. Closed loop feedback control system: in this type the controller automatically acts to
return the controlled variable to its desired value.
b. Open loop feedback control system: the measurement signal disconnected from the
controller, and the controller output would have to be manually adjusted to change the
value of the controlled variable. The block diagram of this loop is shown in figure 27.
Fig. 31, block diagram of the open loop system
Negative and positive feedback control systems
There are two main types of feedback control systems: negative feedback and positive feedback.
Negative feedback Positive feedback
In a negative feedback control the set point and
output values are subtracted (error signal is
computed from the difference between the set
point and the measured signal)
As a rule negative feedback systems are more
stable than positive feedback systems
In a positive feedback control system the
set point and output values are added.

26
Dr. Mohamed Helmy CHEN 341
Advantages of feedback control system
1. Corrective action occurs as soon as the controlled variable deviates from the set point,
regardless of the source and type of disturbance. (counts for all disturbances)
2. Feedback control requires minimal knowledge about the process to be controlled; it
particular, a mathematical model of the process is not required, although it can be very useful
for control system design. (Easy to control)
Disadvantages of feedback control system
1. No corrective action is taken until after a deviation in the controlled variable occurs. Thus,
perfect control, where the controlled variable does not deviate from the set point during
disturbance or set-point changes, is theoretically impossible. (Allow error propagation)
2. Feedback control does not provide predictive control action to compensate for the effects of
known or measurable disturbances. (source of error is not defined)
3. It may not be satisfactory for processes with large time constants and/or long time delays. If
large and frequent disturbances occur, the process may operate continuously in a transient
state and never attain the desired steady state.
4. In some situations, the controlled variable cannot be measured on-line, and, consequently,
feedback control is not feasible.
b) Feed forward control system
If a particular load disturbance occurs frequently in a control process, the quality of control can
often be improved by the addition of feed-forward control.
The basic concept of feedforward control is to measure important disturbance variables and take
corrective action before they upset the process. (Does not allow error propagation).
The following scheme is a simple presentation of a feedforward control:

27
Dr. Mohamed Helmy CHEN 341
Fig. 32, simple presentation of a feedforward control
The following scheme shows the difference between feedback and feedforward control:
Fig. 33, The difference between feedback and feedforward control:
Physically the difference is shown in this example for the control in the outlet temperature of a
heat exchanger:

28
Dr. Mohamed Helmy CHEN 341
Fig.34, Physical control loop shows a comparison between feedback and feedforward strategies
Feedback measures the controlled variable and then take the corrective action while feedforward
measures the disturbance and corrects for it before the controlled variable changes.
An example of the feed forward control system is shown in figure 31.
Fig. 35, Physical feed-forward control system to control the outlet stream temperature of a H.X
In this example the possible disturbances (change in inlet feed temperature, change in water
temperature, and change in water flow rate) are accounted for by the inlet control valve.

29
Dr. Mohamed Helmy CHEN 341
Another examples:
Control of a reactor temperature:
Fig. 36, Control of a reactor temperature using feedback and feedforward strategy.
Level control in a tank
Fig. 37, Feedforward level control in a tank

30
Dr. Mohamed Helmy CHEN 341
Fig. 38, Feedforward control of heat exchanger
Flow feedforward control for temperature control of a column:
In this example there is a feedforward control on the inlet feed and also for steam in the reboiler.
Fig. 39, Flow feedforward control for temperature control of a column.
31
Dr. Mohamed Helmy CHEN 341
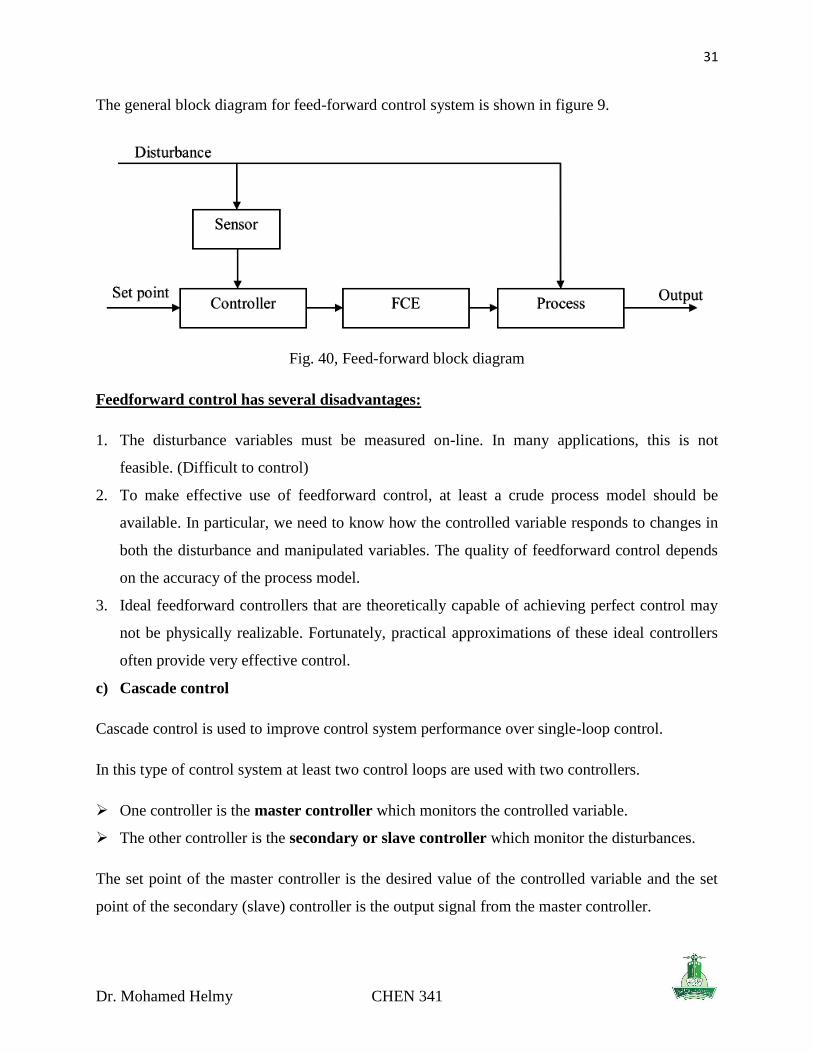
The general block diagram for feed-forward control system is shown in figure 9.
Fig. 40, Feed-forward block diagram
Feedforward control has several disadvantages:
1. The disturbance variables must be measured on-line. In many applications, this is not
feasible. (Difficult to control)
2. To make effective use of feedforward control, at least a crude process model should be
available. In particular, we need to know how the controlled variable responds to changes in
both the disturbance and manipulated variables. The quality of feedforward control depends
on the accuracy of the process model.
3. Ideal feedforward controllers that are theoretically capable of achieving perfect control may
not be physically realizable. Fortunately, practical approximations of these ideal controllers
often provide very effective control.
c) Cascade control
Cascade control is used to improve control system performance over single-loop control.
In this type of control system at least two control loops are used with two controllers.
One controller is the master controller which monitors the controlled variable.
The other controller is the secondary or slave controller which monitor the disturbances.
The set point of the master controller is the desired value of the controlled variable and the set
point of the secondary (slave) controller is the output signal from the master controller.

32
Dr. Mohamed Helmy CHEN 341
In a cascade control arrangement, there are two (or more) controllers of which one controller’s
output drives the set point of another controller. For example: a level controller driving the set
point of a flow controller to keep the level at its set point. The flow controller, in turn, drives a
control valve to match the flow with the set point the level controller is requesting.
Examples for cascade control:
Fig. 41, Cascade control of a liquid level
The controller driving the set point (the level controller in the example above) is called the
primary, outer, or master controller. The controller receiving the set point (flow controller in the
example) is called the secondary, inner or slave controller.
Fig.42, Comparison of cascade with a feedback loop applied to the temperature control of
stripping section of a distillation column

33
Dr. Mohamed Helmy CHEN 341
Cascade control for the CSTR temperature
Fig. 43, Control of heat exchanger outlet temperature using steam flow as secondary loop.

34
Dr. Mohamed Helmy CHEN 341
Fig. 44, Cascade control of heat exchanger outlet temperature using steam flow as secondary
loop
Note: Be aware with the control symbols.
Information flow diagram of a cascade control structure:
This scheme shows the flow of information in the cascade system. There are two control loops,
the slave control loop and the master control loop.
Fig. 45, Information flow diagram of a cascade control structure

35
Dr. Mohamed Helmy CHEN 341
What are the advantages of cascade control?
There are several advantages of cascade control, and most of them boil down to isolating a slow
control loop from nonlinearities in the final control element. In the level control example the
relatively slow level control loop is isolated from any control valve problems by having the fast
flow control loop deal with these problems.
Imagine that the control valve has a stiction problem (see blog on valve problems.) Without the
flow control loop, the level control loop (driving the sticky valve) will continuously oscillate in a
stick-slip cycle with a long (slow) period, which will quite likely affect the downstream process.
With the fast flow control loop in place, the sticky control valve will cause it to oscillate, but at a
much shorter (faster) period due to the inherent fast dynamic behavior of a well-tuned flow loop.
It is likely that the fast oscillations will be attenuated by the downstream process without having
much of an adverse effect.
Or imagine that the control valve has a nonlinear flow characteristic (see blog on valve
problems.) This requires that the control loop driving it be detuned to maintain stability
throughout the possible range of flow rates. If the level controller directly drives the valve, it
must be detuned to maintain stability – possibly resulting in very poor level control. In a cascade
control arrangement with a flow control loop driving the valve, the flow loop will be detuned to
maintain stability. This will result in relatively poor flow control, but because the flow loop is
dynamically so much faster than the level loop, the level control loop is hardly affected.
i.e. in a cascade control system we try to overcome the slow dynamic of the master loop by using
a faster dynamic secondary loop
When should cascade control be used?
Cascade control should always be used if you have a process with relatively slow dynamics (like
level, temperature, composition, humidity) and a liquid or gas flow, or some other relatively-fast
process, has to be manipulated to control the slow process. For example: changing cooling water
flow rate to control condenser pressure (vacuum), or changing steam flow rate to control heat
exchanger outlet temperature. In both cases, flow control loops should be used as inner loops in
cascade arrangements.
Does cascade control have any disadvantages?
Cascade control has three disadvantages.
a) It requires an additional measurement (usually flow rate) to work.

36
Dr. Mohamed Helmy CHEN 341
b) There is an additional controller that has to be tuned.
c) The control strategy is more complex – for engineers and operators alike.
These disadvantages have to be weighed up against the benefits of the expected improvement in
control to decide if cascade control should be implemented.
When should cascade control not be used?
Cascade control is beneficial only if the dynamics of the inner loop are fast compared to those of
the outer loop. Cascade control should generally not be used if the inner loop is not at least three
times faster than the outer loop, because the improved performance may not justify the added
complexity.
In addition to the diminished benefits of cascade control when the inner loop is not significantly
faster than the outer loop, there is also a risk of interaction between the two loops that could
result in instability – especially if the inner loop is tuned very aggressively.
Typical example of cascade control loop along with a block diagram:
Fig. 46, cascade control of a heat exchanger outlet temperature
37
Dr. Mohamed Helmy CHEN 341
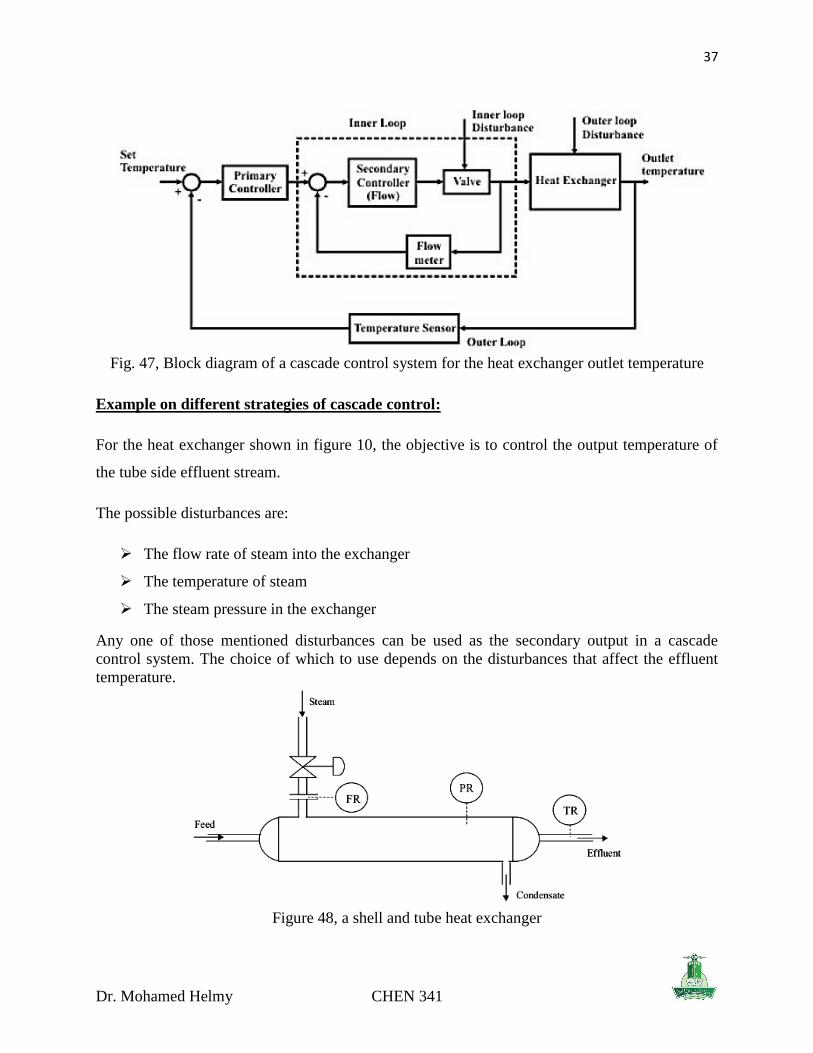
Fig. 47, Block diagram of a cascade control system for the heat exchanger outlet temperature
Example on different strategies of cascade control:
For the heat exchanger shown in figure 10, the objective is to control the output temperature of
the tube side effluent stream.
The possible disturbances are:
The flow rate of steam into the exchanger
The temperature of steam
The steam pressure in the exchanger
Any one of those mentioned disturbances can be used as the secondary output in a cascade
control system. The choice of which to use depends on the disturbances that affect the effluent
temperature.
Figure 48, a shell and tube heat exchanger

38
Dr. Mohamed Helmy CHEN 341
Fig. 49, cascade control of effluent temperature via steam flow control
Fig. 50, cascade control of effluent temperature via shell side pressure control
The general block diagram for cascade control system:
Fig.51, Traditional cascade block diagram

39
Dr. Mohamed Helmy CHEN 341
Example on the feedback and cascade loops:
For a system consists of a kettle through which water, entering at temperature 𝑇𝑖, is heated to 𝑇𝑜
by the flow of hot oil through a jacket surrounding the kettle. The temperature of the water in the
kettle is measured and transmitted to the controller, which in turn adjusts the flow of hot oil
through the jacket.
Draw a physical feedback and cascade control system to control the temperature inside the kettle
and draw the corresponding block diagram for each case.
Solution:
a. Feedback control system
Fig. 52, feedback loop
Feedback block diagram
Fig. 53, block diagram of the feedback loop

40
Dr. Mohamed Helmy CHEN 341
b. Cascade control system
Fig. 54, Cascade control loop
Cascade block diagram
Fig. 55, block diagram of the cascade control loop
d) Ratio control
An important control problem in the chemical industry is the combining of two or more streams
to provide a mixture having a desired ratio of components.
Ratio control is a special type of feedforward control that has had widespread application in the
process industries. The objective is to maintain the ratio of two process variables as a specified
value. The two variables are usually flow rates, a manipulated variable u, and a disturbance
variable d. Thus, the ratio R is controlled rather than the individual variables.

41
Dr. Mohamed Helmy CHEN 341
𝑅 =𝑢
𝑑
Typical application examples of ratio control include:
e) Setting the relative amounts of components in blending operations
f) Maintaining a stoichiometric ratio of reactants to a reactor
g) Keeping a specified reflux ratio for a distillation column
h) Holding the fuel-air ratio to a furnace at the optimum value
i) Ratio control of feed flow to the column and steam to the re-boiler of a distillation
column.
j) Ratio control of added chemicals to waste water in water treatment and pollution
control applications.
Implementation of ratio control
There are two methods:

42
Dr. Mohamed Helmy CHEN 341
Fig. 56, Ratio control, method I
Fig. 57, Ratio control, method II

43
Dr. Mohamed Helmy CHEN 341
Examples of ratio control system
1. Maintaining a stoichiometric ratio of reactants to a reactor
Fig. 58, maintaining a stoichiometric ratio of reactants to a reactor
2. Controlling the ratio of combustion air to fuel flow
Fig. 59, controlling the ratio of combustion air to fuel flow

44
Dr. Mohamed Helmy CHEN 341
Important note: the final control element is always on the manipulative variable stream.
Assignment:
A ratio control scheme is to be used to maintain a stoichiometric ratio of H2 and N2 as the feed to
an ammonia synthesis reactor. Draw a schematic diagram for the ratio control scheme.
e) Override control
Override control (or “selective control” as it is sometimes called) is a form of multivariable
control in which a manipulated variable can be set at any point in time by one of a number of
different controlled variables.
If there are more controlled variables than manipulated variables in a process to be controlled, a
common solution to this problem is to use a selector to choose the appropriate process
variable from among a number of available measurements.
Selectors can be based on multiple measurement points, multiple FCE or multiple
controllers. Selectors are used to improve the control system performance as well as to protect
equipment from unsafe operating conditions.
In an Override Control the selected control action depends on whether the process variable has
reached any of the two pre-chosen limits called hi- or low-limits.
Consider the process in Figure 14(a), where a hot saturated liquid pours in surge tank (capacity
element to reduce flow fluctuation) and from there is pumped under flow control to some
downstream process. Under normal operation, the controller tries to keep the level at H1. If, for
some reason, the level drops down to H2, the liquid will not have enough net +ve
suction head (NPSH) and the pump may get vapor bound which is a highly undesirable
condition in pump operation. Therefore, it is necessary to introduce a control scheme to avoid
this situation. This new scheme has been shown in Figure 14 (b).
The level in the tank is now measured and controlled. The FCE in the flow loop is a variable
speed pump that pumps more liquid for an increase of controller output. Hence, the flow
controller (FC) must have a reverse action, while the level controller (LC) is a direct acting
controller. The output of each controller goes to Low Selector (LS). The low selector’s output

45
Dr. Mohamed Helmy CHEN 341
goes to the pump. Under normal operating condition with level at H1 (which is above the
set point), the LC would try to speed-up the pump by increasing its output to saturation (say
to 20 mA), while the output from FC might be 10–12 mA. The low selector (LS) will allow
only the FC output to manipulate pump speed. This is the desired operating condition.
Another kind of contingency may appear if the in-flow rate of the hot liquid decreases
so that tank level continues to drop down. As the level drops below set point, the LC will
decrease its output to slow down the pump speed. If LC output goes below that of FC, the LS
will again allow only the LC output to manipulate pump speed thus avoiding any
undesirable low level value inside the tank. It can be said that the LC overrides the FC.
Fig. 60, Tank level control. (a) Conventional. (b) Control with override
Example: Override control to protect a boiler system
Fig. 61, Override control to protect a boiler system

46
Dr. Mohamed Helmy CHEN 341
Another category of control strategies involves the use of signal relays or function blocks with
the ability to switch between different signal values, or re-direct signals to new pathways. Such
functions are useful when we need a control system to choose between multiple signals of
differing value in order to make the best control decisions.
The “building blocks” of such control strategies are special relays (or function blocks in a digital
control system) shown here:
Fig. 62, Signal relays or Function blocks
High-select functions output whichever input signal has the greatest value. Low-select functions
do just the opposite: output whichever input signal has the least value. “Greater-than” and “Less
than” symbols mark these two selector functions, respectively, and each type may be equipped to
receive more than two input signals.
Sometimes you will see these relays represented in P&IDs simply by an inequality sign in the
middle of the large bubble, rather than off to the side in a square. You should bear in mind that
the location of the input lines has no relationship at all to the direction of the inequality symbol –
e.g., it is not as though a high-select relay looks for the input on the left side to be greater than
the input on the right. Note the examples shown below, complete with sample signal values:

47
Dr. Mohamed Helmy CHEN 341
High-limit and low-limit functions are similar to high- and low-select functions, but they only
receive one input each, and the limit value is a parameter programmed into the function rather
than received from another source. The purpose of these functions is to place a set limit on how
high or how low a signal value is allowed to go before being passed on to another portion of the
control system. If the signal value lies within the limit imposed by the function, the input signal
value is simply passed on to the output with no modification.
f) Split range control
This type of control is used, where there are several manipulated variables, but a single output
variable. The coordination among different manipulated variables is carried out by using Split
Range Control.
The figure attached below shows an example of a typical split range control scheme. The
steam discharges from several boilers are combine at a steam header. Overall steam
pressure at the header is to be maintained constant through a pressure control loop. The
command from the pressure controller is used for controlling simultaneously the steam flow rates
from the boilers in parallel. Clearly, there is a single output variable (steam header pressure)
while there are a number of manipulating variables (discharge from different boilers).

48
Dr. Mohamed Helmy CHEN 341
Fig.63, Steam header with split range control
Another example of split control (pressure control)
Fig. 64, Split range control scheme

49
Dr. Mohamed Helmy CHEN 341
Types of controllers
1. On/off control
In this type the output from the controller is either “full on” or “full off” and the final control
element (control valve or whatever) is full open or full closed; there are no intermediate
values of the output. Example of this type is the electrical heater, an iron, etc..
2. Proportional control
The controller changes the manipulated variable by an amount proportional to the error.
3. Proportional integral control
The controller is instructed to change the manipulated variable by an amount proportional to the
error and an additional amount proportional to the time integral of the error.
4. Proportional derivative control
The controller is instructed to change the manipulated variable by an amount proportional to the
error and an additional amount proportional to the time derivative of the error.
5. Proportional integral derivative control
The controller is instructed to change the manipulated variable by an amount proportional to the
error and an additional amount proportional to the time integral and time derivative of the error.
These types of controllers will be discussed in detail in the next chapters.

50
Dr. Mohamed Helmy CHEN 341
Control symbols and signals

51
Dr. Mohamed Helmy CHEN 341
Summary of instrument type & location Summary of
52
Dr. Mohamed Helmy CHEN 341
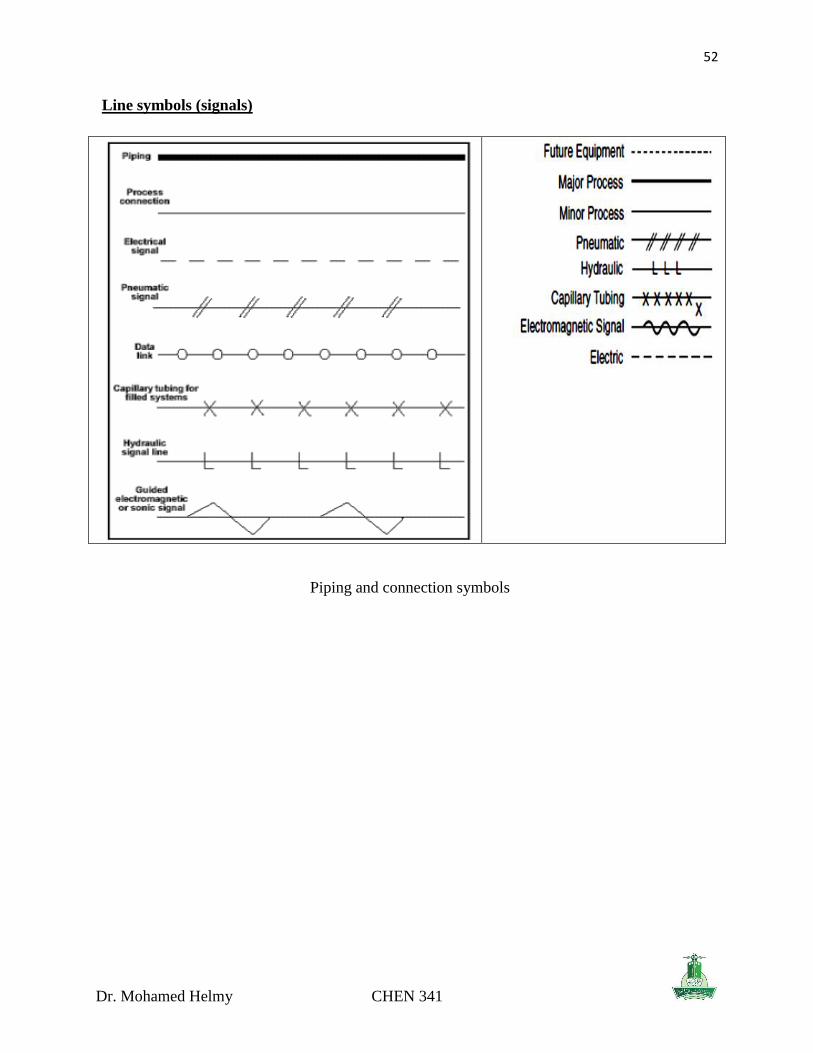
Line symbols (signals)
Piping and connection symbols

53
Dr. Mohamed Helmy CHEN 341

54
Dr. Mohamed Helmy CHEN 341
Common Instrumentation Symbols for Control Loop Presentation:
Information flow inside a process control system:

55
Dr. Mohamed Helmy CHEN 341
Notes about control valves
Butterfly valve Solenoid valve
Pneumatic valve (air to close)

56
Dr. Mohamed Helmy CHEN 341
Pneumatic valve (air to open)

57
Dr. Mohamed Helmy CHEN 341
Exercise:
Explain the meaning of the following signals and lines

58
Dr. Mohamed Helmy CHEN 341
DesignMethodologyforProcessControl
1) Understand the process:
Before attempting to control a process it is necessary to understand how the process works and
what it does.
2) Identify the operating parameters:
Once the process is well understood, operating parameters such as temperatures, pressures, flow
rates, and other variables specific to the process must be identified for its control.
3) Identify the hazardous conditions:
In order to maintain a safe and hazard-free facility, variables that may cause safety concerns
must be identified and may require additional control.
4) Identify the measurable:
It is important to identify the measurable that correspond with the operating parameters in order
to control the process.
Measurables for process systems include:
Temperature Pressure Flow rate
pH Humidity Level
Concentration Viscosity Conductivity
Turbidity Redox/potential Electrical behavior
Flammability
5) Identify the points of measurement:
Once the measurables are identified, it is important locate where they will be measured so that
the system can be accurately controlled.
6) Select measurement methods:
Selecting the proper type of measurement device specific to the process will ensure that the most
accurate, stable, and cost-effective method is chosen. There are several different signal types that
can detect different things.
These signal types include:
Electric Pneumatic Light
Radiowaves Infrared (IR) Nuclear
Electromagnetic Hydraulic

59
Dr. Mohamed Helmy CHEN 341
7) Select control method:
In order to control the operating parameters, the proper control method is vital to control the
process effectively. On/off is one control method and the other is continuous control. Continuous
control involves Proportional (P), Integral (I), and Derivative (D) methods or some combination
of those three.
8) Select control system:
Choosing between a local or distributed control systems that fit well with the process effects both
the cost and efficacy of the overall control.
9) Set control limits:
Understanding the operating parameters allows the ability to define the limits of the measurable
parameters in the control system.
10) Define control logic:
Choosing between feed-forward, feed-backward, cascade, ratio, or other control logic is a
necessary decision based on the specific design and safety parameters of the system.
11) Create a redundancy system:
Even the best control system will have failure points; therefore it is important to design a
redundancy system to avoid catastrophic failures by having back-up controls in place.
12) Define a fail-safe:
Fail-safes allow a system to return to a safe state after a breakdown of the control. This fail-safe
allows the process to avoid hazardous conditions that may otherwise occur.
13) Set lead/lag criteria:
Depending on the control logic used in the process, there may be lag times associated with the
measurement of the operating parameters. Setting lead/lag times compensates for this effect and
allow for accurate control.
14) Investigate effects of changes before/after:
By investigating changes made by implementing the control system, unforeseen problems can be
identified and corrected before they create hazardous conditions in the facility.
15) Integrate and test with other systems:
The proper integration of a new control system with existing process systems avoids conflicts
between multiple systems.