Process Analysis I Operations -- Prof. Juran. Outline Process Analysis Defined Key Terms and Metrics...
23
Process Analysis I Operations -- Prof. Juran
-
Upload
isabella-sims -
Category
Documents
-
view
215 -
download
3
Transcript of Process Analysis I Operations -- Prof. Juran. Outline Process Analysis Defined Key Terms and Metrics...

Process Analysis I
Operations -- Prof. Juran

Operations -- Prof. Juran
Outline
• Process Analysis Defined• Key Terms and Metrics• Process Flowcharting• Gantt Chart• Example: Milford Physicians

Operations -- Prof. Juran
A set of concepts, tools, and metrics for describing, planning, controlling managing, and improving processes.
A process is any part of an organization that transforms inputs into outputs, preferably adding value.
Process Analysis

Operations -- Prof. Juran
• Process Layout– Traditional Approach– Aimed at Economies of Scale and Specialization
• Product Layout– Basis for Cellular Manufacturing, Applied in some
services– More customer focused?– Behavioral benefits among workers?
Process Layout

Operations -- Prof. Juran
Other Types of Processes
• Make-to-order– Only activated in response to an actual
order– Both work-in-process and finished goods
inventory kept to a minimum• Make-to-stock
– Process activated to meet expected or forecast demand
– Customer orders are served from target stocking level

Operations -- Prof. Juran
Types of Processes Single-stage Process
Stage 1
Stage 1 Stage 2 Stage 3
Multi-stage Process

Operations -- Prof. Juran
Process Analysis Terms• Level of Analysis: The scope of our study; a
single machine, an assembly line, a factory, etc.
• Cycle Time: The average time between completions of successive units– Typically used at the lower levels of analysis

Operations -- Prof. Juran
Process Analysis Terms• Utilization: The ratio of the time that a
resource is actually activated relative to the time that it is available for use
• Flow Time: The time it takes for a single customer’s order to proceed through the process from start to finish. Sometimes called Throughput Time
• Throughput: The volume of production passing through the process over some time period– Typically used at the higher levels of analysis

Operations -- Prof. Juran
Process Analysis Terms• Bottleneck
– Occurs when the limited capacity of a process causes work to pile up or become unevenly distributed in the flow of a process
– If an employee works too slow in a multi-stage process, work will begin to pile up in front of that employee. In this is case the employee represents the limited capacity causing the bottleneck.
• Pacing– Refers to the fixed timing of the movement
of items through the process

Operations -- Prof. Juran
• Blocking– Occurs when the activities in a stage must stop
because there is no place to deposit the item just completed
– If there is no room for an employee to place a unit of work down, the employee will hold on to it not able to continue working on the next unit
• Starving– Occurs when the activities in a stage must stop
because there is no work – If an employee is waiting at a work station and no
work is coming to the employee to process, the employee will remain idle until the next unit of work comes
Process Analysis Terms
Operations -- Prof. Juran
A buffer refers to a storage area between stages where the output of a stage is placed prior to being used in a downstream stage
Bottlenecks, buffers, blocking, and starving are key concepts in Just-in-Time systems, which we will study later in the course
Process Analysis Terms

Operations -- Prof. Juran
Types of Processes (Continued)
Stage 1 Stage 2
Buffer
Multi-stage Process with Buffer

Operations -- Prof. Juran
Process Performance Metrics
• Operation time = Setup time + Run time
• Velocity = Throughput time Value-added time
• Throughput rate = 1 . Cycle time

Operations -- Prof. Juran
Process Performance Metrics
• Efficiency = Actual output Standard Output
• Productivity = Output Input
• Utilization = Time Activated Time Available

Operations -- Prof. Juran
Cycle Time Example
Suppose you had to produce 600 units in 80 hours to meet the demand requirements of a product. What is the cycle time to meet this demand requirement?
Suppose you had to produce 600 units in 80 hours to meet the demand requirements of a product. What is the cycle time to meet this demand requirement?
Answer: There are 4,800 minutes (60 minutes/hour x 80 hours) in 80 hours. So the average time between completions would have to be: Cycle time = 4,800/600 units = 8 minutes.
Answer: There are 4,800 minutes (60 minutes/hour x 80 hours) in 80 hours. So the average time between completions would have to be: Cycle time = 4,800/600 units = 8 minutes.

Operations -- Prof. Juran
Process Improvement
• Flow Time Reduction– Perform activities in parallel – Change the sequence of activities– Reduce interruptions
• Elimination of Non-Value-Added Steps• Quality Improvement
Operations -- Prof. Juran
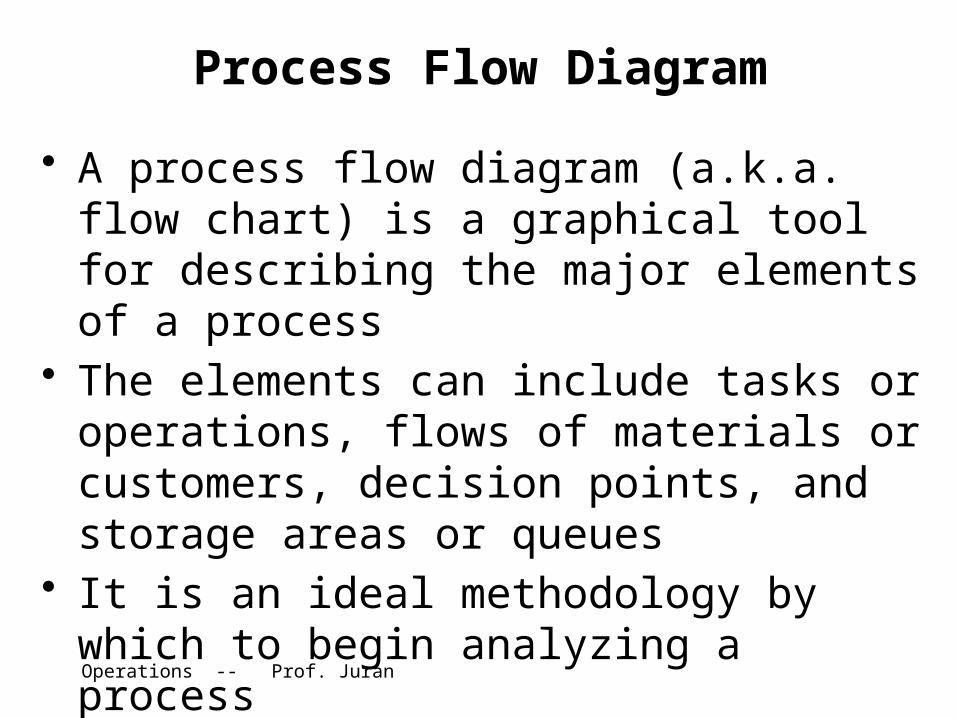
Process Flow Diagram
• A process flow diagram (a.k.a. flow chart) is a graphical tool for describing the major elements of a process
• The elements can include tasks or operations, flows of materials or customers, decision points, and storage areas or queues
• It is an ideal methodology by which to begin analyzing a process

Operations -- Prof. Juran
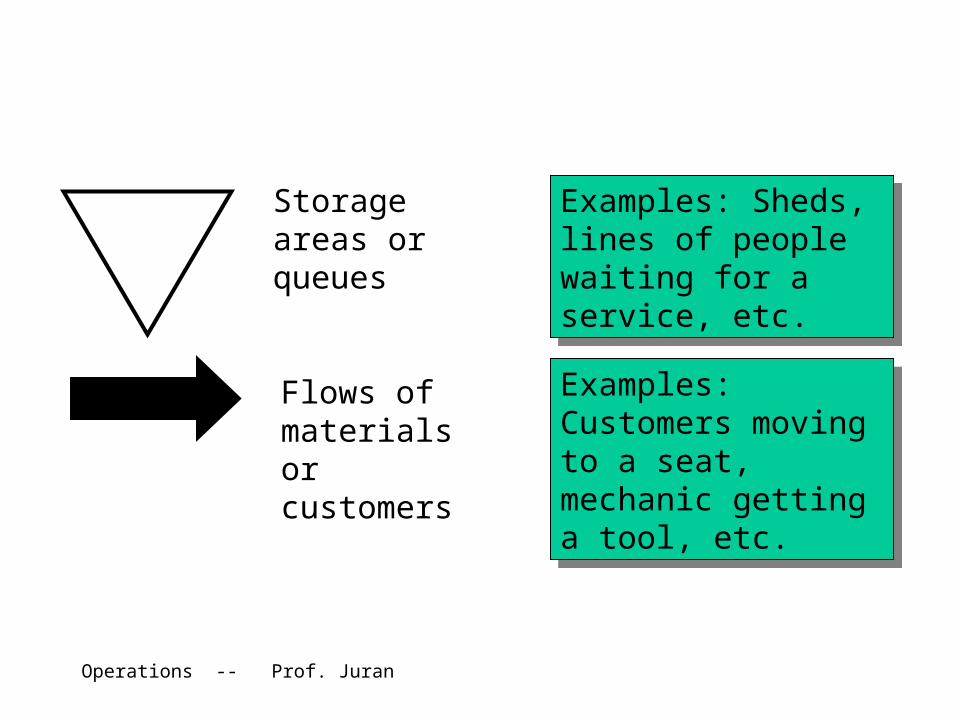
Flowchart Symbols
Tasks or operations
Examples: Giving an admission ticket to a customer, installing a engine in a car, etc.
Examples: Giving an admission ticket to a customer, installing a engine in a car, etc.
Decision Points
Examples: How much change should be given to a customer, which wrench should be used, etc.
Examples: How much change should be given to a customer, which wrench should be used, etc.
Operations -- Prof. Juran
Examples: Sheds, lines of people waiting for a service, etc.
Examples: Sheds, lines of people waiting for a service, etc.
Examples: Customers moving to a seat, mechanic getting a tool, etc.
Examples: Customers moving to a seat, mechanic getting a tool, etc.
Storage areas or queues
Flows of materials or customers

Example: Flowchart of Student Going to School
Yes
No
Goof off
Go to school today?
Walk to class
Drive to school
Operations -- Prof. Juran

Operations -- Prof. Juran
The man and thewoman agree to
have a date
Man tries again;Asks for a second date
At the end of the date,the man makes sexual advances
Woman is more relaxed this time
Man guesses that the time isright and approaches the woman
sexually
No sex for a long time
Man nags about thereasons why the womandoesn’t want to have sex
Man trips on the edge of the carpeton purpose to show the
woman how vulnerable he is
Woman melts
Mans knee heals rapidly and hesuggests sex
Man discovers how much funthey have even without sex
Woman suggests makingdinner together
Man pretends to be hungry
After cooking for hours, they eat
Man approacheswoman sexually
Man falls asleep
Woman agrees
Man suggests a refreshing walk,hoping that it will relax her
Man gets angry
Man suggests a trip toVenice
Woman gets excited and starts togo through brochures
Man suggests a short cut
Woman starts to get tired
Man suggestsa bath together
After a glass of wine the man Finds courage to say what he’s
been trying to say all evening andmakes a confession of love
SEX
Woman changes her mindNo sex
Flow Chart of a Relationship
Man almost drinks thewhole bottle himself
After the bath theman suggests opening a
bottle of Champagne
Operations -- Prof. Juran
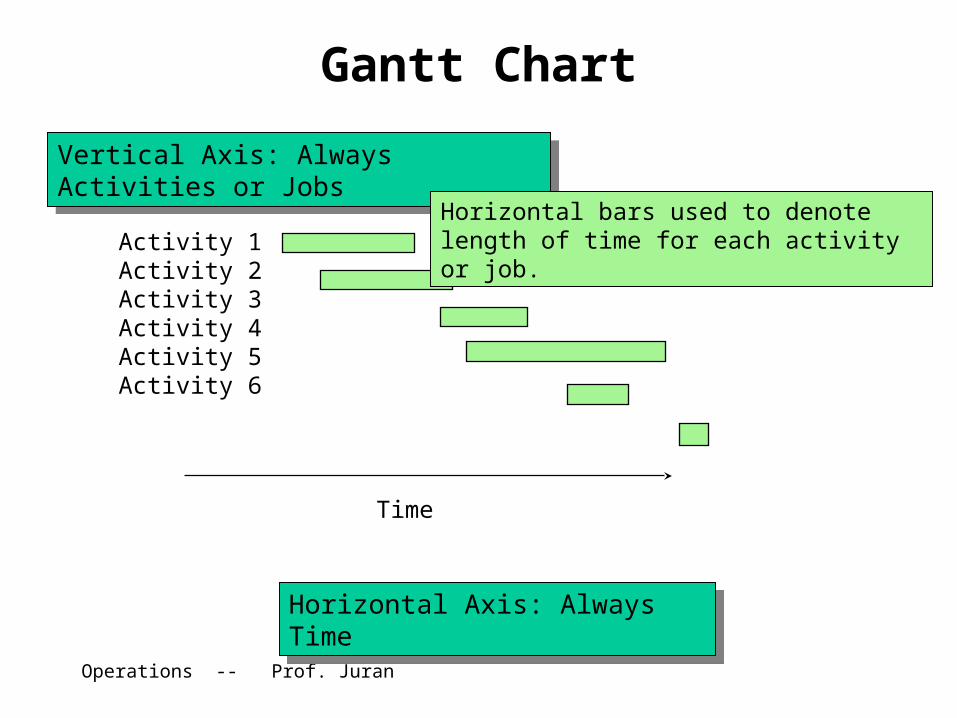
Gantt Chart
Activity 1Activity 2Activity 3Activity 4Activity 5Activity 6
Time
Vertical Axis: Always Activities or Jobs
Vertical Axis: Always Activities or Jobs
Horizontal Axis: Always TimeHorizontal Axis: Always Time
Horizontal bars used to denote length of time for each activity or job.

Operations -- Prof. Juran
Summary
• Process Analysis Defined• Key Terms and Metrics• Process Flowcharting• Gantt Chart• Example: Milford Physicians