Proceedings of the Advanced Seminar on Sedimentation,
50
Transcript of Proceedings of the Advanced Seminar on Sedimentation,


Proceedings of the Advanced Seminar on Sedimentation, August15-19, 1983, Denver, Colorado
G. Douglas Glysson, Editor
U.S. GEOLOGICAL SURVEY CIRCULAR 953
1987

Department of the Interior
DONALD PAUL HODEL, Secretary
U.S. Geological Survey
Dallas L. Peck, Director
Library of Congress Cataloging-in-Publication Data
Advanced Seminar on Sedimentation (1983; Denver, Colo.) Proceedings of the Advanced Seminar on Sedimentation, August 15-19, 1983, Denver, Colorado
(U.S. Geological Survey Circular 953) Includes bibliographies Supt. of Docs. No.: I 19.4/2:953 1. Sedimentation and deposition-Congresses. 2. Sediment
transport-Congresses. 3. River channels-Congresses. 4.Sediments (Geology)-United States-Congresses. I. Glysson, G. Douglas. II. Title. III. Series: United States. Geological Survey. Circular 953
QE57l.A25 1983 551.3'5 85-600102
Free on application to the Books and Open-File Reports Section, U.S. Geological Survey, Federal Center, Box 25425, Denver, CO 80225
CONTENTS
Page Introduction, by G. Douglas Glysson _____________________ 1 Summaries of the presentations _________________________ 2
Modeling _ _ _ _ ___ _ _____ _ _ _ _ _ _ _ _ _ _ _ _ __ ____ _ _ _ _ _ _ _ _ _ _ 2
Modeling water-discharge and sediment-concentration hydrographs at surface mine sites in Pennsylvania, by Lloyd A. Reed ______________ 2
Preliminary investigation of the physical basis of soil erosion parameters in the PrecipitationRunoff Modeling System (PRMS), by William P. Carey and Andrew Simon __________________ 3
Reducing sediment sampling frequency at streamflow gaging station Rio Grande at Otowi Bridge near San Ildefonso, New Mexico, by David H. Marshall ________________________ 4
Comparison of digital modeling techniques which simulate sedimentation processes in an agri-cultural watershed, by Leslie D. Arihood _______ 6
Instrumentation ----------------------------------- 7 Measurement of suspended sediment in surface
waters: A discussion of new technologies that will operate continuously and unattended, by Marvin C. Goldberg _______________________ 7
Instrumentation for automatically monitoring sediment concentration and particle size-A progress report, by James H. Ficken ________ 8
Progress report on testing of the Sedigraph particle size analyzer, by Bill Matthes _ _ _ _ _ _ _ _ _ _ 8
The Dynatrol test site, Madison, Wisconsin, by Gerald Goddard __________________________ 9
Determining sediment concentration with a fluid-density cell, by J. V. Skinner __________________ 10
Monitoring streambed changes and sediment concentrations using the acoustic velocity meter, by Antonius Laenen ___________________ 10
Mud and debris flows ------------------------------ 12 Geobotanical evidence of debris flows on Mount
Shasta, California, by Cliff R. Hupp and W. R. Osterkamp --------------------------------- 12
Downstream dilution of lahars from Mount St. Helens, Washington: Defining the boundary between debris flow and hyperconcentrated streamflow, by Thomas C. Pierson and Kevin M. Scott ------------------------------ 16
Stream channel adjustments to 1980 lahars and subsequent stormflow, Mount St. Helens, by Holly A. Martinson and David F. Meyer ________ 17
Erosional development of the North Fork Toutle debris avalanche deposit, by David F. Meyer and Richard J. Janda _________________________ 19
Sediment transport ________________________________ 21 Erosion and landform modification at a low-level
III
Page
Summaries of the presentations-Continued radioactive waste disposal facility near Sheffield, Illinois, by John R. Gray _____________________ 21
Estimating long-term sediment discharge-which method to use? by Thomas H. Yorke ___________ 22
Sediment budget of the tidal Potomac River and estuary, water years 1979-81, by R. Edward Hickman and James P. Bennett _______________ 24
Effects of the proposed Cooper River rediversion on sedimentation in Charleston Harbor, South Carolina, by Glenn G. Patterson _______________ 26
Sediment chemistry ------------------------------- 26 Determination of lake sedimentation rates by lead-
210 and cesium-137, by I. G. Yang ___________ 26 Inorganic partitioning in sediments, by Arthur J.
Horowitz ___________________________________ 27
Transport of suspended sediment and associated chemical constituents in the Lower Mississippi River, Louisiana, by Charles R. Demas and Philip B. Curwick --------------------------- 28
Suspended sediment: Transport and chemistry of organic carbon, by E. Michael Thurman ______ 29
Channel morphology ------------------------------- 30 Sediment impacts from coal mining, northeast
Tennessee, by Waite R. Osterkamp, William P. Carey, and Cliff R. Hupp _____________________ 30
Unit hydraulic geometry-An indicator of channel changes, by Rhea P. Williams _________________ 31
Channel adjustment to man-induced stress in west Tennessee, by Andrew Simon and Clarence H. Robbins ------------------------------------32
Contrast in stream channel response to major storms-Examples from two mountainous areas in California, by K. Michael Nolan and Donna C. Marron _____________________________________ 33
Effects of dam construction on channel geometry and bed material in Bear Creek, Denver, Col-orado, by R. F. Hadley and W. W. Emmett _____ 35
Sediment storage and discharge in steep unstable terrain, by Richard J. Janda __________________ 35
Bedload __________________________________________ 37
Variability in measured bedload transport during constant and slowly changing water discharge conditions, by William P. Carey _______________ 37
Some characteristics of fluvial processes in rivers, by William W. Emmett, Luna B. Leopold, and Robert M. Myrick --------------------------- 38
Measurement of bedload discharge in nine Illinois streams with the Helley-Smith sampler, by Julia B. Graf -------------------------------- 39
List of Attendees -------------------------------------- 41

ILLUSTRATIONS
Page
FIGURE 1. Graph showing hydrographs of water discharge and suspended-sediment concentration computed by PRMS ------- 3 2. Diagram showing types of botanical evidence of debris flow--------------------------------------------------- 13 3. Map showing location of the study areas on Mount Shasta, Calif. ---------------------------------------------- 14 4. Diagram showing representative cross section of Ash Creek near Military Pass, Calif. --------------------------- 16 5. Graph showing dominant fluvial processes, Pine Creek and South Fork Toutle River, 1980-81 -------------------- 18 6. Graph showing dominant fluvial processes, Pine Creek and South Fork Toutle River, 1981-82 ____________________ 18 7. Graph showing drainage integration, with time, of the upper North Fork Toutle River basin, above
the N-1 debris retention structure -----------------------------------------------------------------------20 8. Diagram showing Dekaport divisor system ----------------------------------------------------------------- 23 9. Diagram summarizing the use of botanical evidence to date recent flow events along Smoky Creek,
northeastTennessee -----------------------------------------------------------------------------------32 10. Diagram showing schematic representation of positive feedback between physical processes in
northwestern California ________________________________________________________________________________ 34
11. Graph showing variability of 120 consecutive bedload samples ------------------------------------------------ 37 12. Graph showing theoretical and sampled distributions of relative transport rates -------------------------------- 37 13. Graph showing variability of 120 consecutive bedload samples after smoothing --------------------------------- 38
TABLES
Page
TABLE 1. Information on rills and gullies used in PRMS subroutine ---------------------------------------------------- 3 2. Summary of debris flow dates at sites on Whitney and Bolam Creek, Calif. ---------------------------------- ___ 15 3. Summary of debris flow dates on Mud Creek, Calif. --------------------------------------------------------- 15 4. Summary of debris flow dates on Ash Creek, Calif. ---------------------------------------------------------- 15 5. Correlation coefficients and standard errors of estimate of relations between the logarithms
of water discharge and concentrations of sediment, sand, silt, and clay in suspension for the Schuylkill River at Manayunk, Penn. _____________________________________________________________________ 24
6. Measured and estimated suspended-sediment discharges of the Schuylkill River at Manayunk, October 1, 1953, to September 30, 1979 -------------------------------------------------------------------25
CONVERSION FACTORS
For use of readers who prefer to use metric units, conversion factors for terms used in this report are listed below:
Multiply inch (in.) square inch (in.2) foot (ft) foot per second (ft/s) square foot (ft2) cubic foot (ft3) cubic foot per second (ft3/s) mile (mi) square mile (mi2) acre acre-foot (acre-ft) ton (t) ton per square mile (t/mi2)
gallon (gal) ounce (oz)
by 2.540 6.452 0.3048 0.3048 0.09294 0.02832 0.02832 1.609 2.590 0.4047
1,233. 0.9072 0.3503
3.785 28.35
to obtain centimeter (em) square centimeter (cm2) meter (m) meter per second (m/s) square meter (m2) cubic meter (m3) cubic meter per second (m3/s) kilometer (km) square kilometer (km2) hectare cubic meter (m3) megagram (Mg) megagram per square kilo-
liter (L) gram (g)
meter (Mg/km2)
The use of brand names in this report is for identification purposes only and does not imply endorsement by the U.S. Geological Survey.
lV

Proceedings of the Advanced Seminar on Sedimentation,
August 15-19, 1983, Denver, Colorado Introduction
By G. Douglas Glysson
On August 15-19, 1983, the Water Resources Division of the U.S. Geological Survey (USGS) sponsored an advanced seminar on sedimentation at the National Training Center in Lakewood, Colo. Topics discussed included modeling, mud flows and debris flows, sediment transport, sediment chemistry, channel morphology, instrumentation, and bedload. This Circular presents summaries of the 27 presentations given at the seminar plus one additional summary that was not presented.
The term sedimentation encompasses the processes of erosion, entrainment, transportation, deposition, and the compaction of sediments (Vanoni, 1975). Historically, the Water Resources Division (WRD) has primarily limited its efforts to the study of the transport and deposition processes. Some geomorphologic studies have been conducted, the majority of the work being done in the WRD's national research program.
Several major events over the past few years have brought increased public awareness to the sedimentation problem. Notable are the eruption of Mount St. Helens, Wash., dioxin in the sediments at Times Beach, Mo., and the rapid erosion of the offshore islands off the coast of Louisiana. Not so noticeable have been the introduction of new chemicals as pesticides and fertilizers, and the seepages and direct erosion from waste-disposal sites.
In order to adequately assess our Nation's water resources, the WRD has, over the last several years, expanded its field of study to include all five pro-
cesses of sedimentation. The division is investigating the ro]e sediment plays in the transport and deposition of certain chemicals. The sediment particles may sorb these chemicals from the water and release them back into solution, depending on the physical and chemical environment. The WRD is also studying the effects that the sedimentation processes have on the ecosystem of our nation's waterways.
In an effort to improve the effectiveness of the division's expanding sediment program, the Quality of Water Branch organized an Advanced Seminar on Sediment, which was held August 15-19, 1983, at the USGS National Training Center in Lakewood, Colo. The objectives of this seminar were (1) to bring together the division's research, district, and headquarters personnel who are actively engaged in geomorphology or sedimentation-related studies to discuss mutual problems, and (2) to provide a forum for the effective transfer of sediment-related technology. The purpose of this Circular is to present summaries of the presentations made at the seminar. It is hoped that, by presenting these summaries, the technology transfer process can be extended to those who were unable to attend the seminar.
REFERENCE CITED
Vanoni, V. A., 1975, Sedimentation Engineering: American Society of Civil Engineers Manual of Engineering Practice No. 54, 745 p.

Summaries of the Presentations
Modeling
Modeling Water-Discharge and Sediment-Concentration Hydrographs at Surface Mine Sites in Pennsylvania
By Lloyd A. Reed
Rainfall, water-discharge, and suspended-sediment data were collected at several surface mine sites in the bituminous coal fields of Pennsylvania. These data were used to refine the Precipitation Runoff Modeling System (PRMS) of Leavesley and others (1983). PRMS is a modular design modeling system developed to evaluate the impacts of various combinations of precipitation and land use on water discharge and sediment yields. PRMS computes hydrographs of water discharge and suspended-sediment concentration for small and large basins affected by single or multiple land uses. The subroutine described here runs on a Tektronix 4051 computer and calculates water discharge and suspended-sediment concentration hydrographs for storms up to 24 hours in duration.
The model begins with observed precipitation and calculates precipitation excess and the sediment dislodged during the storm. Observed rainfall at 5-minute increments is stored in a 288-unit array by the model user. Precipitation excess is computed for each 5-minute increment by subtracting infiltration, calculated by the Green Ampt/Philip infiltration model (Green and Ampt, 1911) from total precipitation. Sediment dislodged from the mined area during each 5-minute increment is computed in two steps. A relation between precipitation intensity and suspended-sediment concentration that varies linearly with soil erodibility is used to calculate a suspended-sediment concentration (as a ratio). The suspended-sediment concentration is multiplied by the precipitation excess to determine the tons of sediment dislodged from each acre for each 5-minute increment.
After the values of precipitation excess and sediment production are calculated and stored in arrays, PRMS moves to a routing subroutine and routes the
2
water and sediment from the mined area, producing a hydrograph of water discharge and sediment concentration. The precipitation excess and sediment production from the first 5-minute period are recalled and divided into 1-minute intervals. PRMS distributes the precipitation excess and the sediment from the first interval onto the mined area. The precipitation excess and sediment distributed on the mined area is accumulated in rills and gullies, and equations for open-channel flow and sediment deposition are used to route the water and sediment from the mined area. The size and number of rills and gullies used by PRMS were selected after inspection of several regraded surface mine sites.
The rills and gullies, which ranged in size from just noticeable to several inches wide, were classified from 1 to 4. Small rills (class 1) joined and formed larger rills, or discharged directly to larger rills and gullies; large rills joined and formed gullies, or discharged directly to gullies or to the diversion channel. Thble 1 lists information about the rills and gullies used in this PRMS subroutine.
After PRMS distributes the precipitation excess and sediment production from the first minute of rainfall over the disturbed area, it is accumulated in the four classes of rills and gullies in proportion to the direct drainage areas listed in table 1. The depth of water in each class of channel is calculated and an equation for open-channel flow is used to compute the velocity of water. The velocity is multiplied by the depth and width and by the number of outlets to determine the water discharge from each class of rills and gullies. Sediment deposition in each class of channel is calculated on the basis of the particle settling velocity of the sediment and the depth of water in the channel. Sediment deposition in each class of channel is subtracted from the original

TABLE 1.-lnforrnation on rills and gullies used in PRMS sub-routine
Class Direct Total rill drainage drainage Channel or area area area
gully (ft2) (ft2) (ft2)
1 25,000 25,000 7,500 2 16,000 41,000 5,000 3 2,000 43,000 320 4 871 43,560 80
amount, and the sediment remaining in suspension is routed with the water discharge from the channels. Sediment is routed in proportions equal to the water discharge: If 10 percent of the water in a rill or gully is discharged, then 10 percent of the sediment remaining in suspension is also discharged. After water and sediment discharge have been calculated for each class, the water and sediment are routed to the next class or to the diversion terrace.
The diversion terrace is divided into four equal segments, each receiving 25 percent of the water and sediment discharge from the mined area. Water and sediment are routed through the four segments of the diversion terrace: segment 1 discharges to segment 2, segment 2 to 3, segment 3 to 4, and segment 4 discharges from the mine site. The water discharge and suspended-sediment concentrations from segment 4 are plotted at !-minute intervals.
Water and sediment-discharge hydrographs can be computed for a storm of 24 hours or less in duration. The results for one storm are shown on figure 1. Rainfall during the storm was 1.20 in., and the precipitation excess was 0. 90 in. The measured sediment discharge was 0.58 ton, and the sediment discharge calculated by the model was 0. 75 ton. The measured and calculated water discharges were both about 4,300 ft3.
Number Width of of each Channel
outlets outlet discharges per acre (ft) to
275 0.5 Class 2 rills 50 1.0 Class 3 rills
tl 1.5 Class 4 rills 4 2.0 Diversion terrace
REFERENCES CITED
Green, W. H., and Ampt, G. A., 1911, Studies on soil physics; I. Flow of air and water through soils: Journal of Agricultural Research, v. 4, p. 1-24.
Leavesley, G. H., Lichty, R. W., Troutman, B. M., and Saindon, L. G., 1983, Precipitation-runoff model system: User's manual, U.S. Geological Survey Water-Resources Investigations Report 83-4238, 207 p.
0 z
oo z~ <{IJ)
. a: 0.75 !llw ~11. Uf-~l!j z"-u ~~ w u 0.50 Uz X-w • zw oC!l _a: f-<1: <I: :I: f-U ii:!!! u 0 0.25 Wa; a:w ll.f-
<1: ~
TIME, IN MINUTES
;i 0
24,000~ ~ffi ~!:: U-' Za: Ow un. f-!/l
16.000 ~ ~ ::Ea: CiQ W-' !ll::! o::E ~~ z ~ !/) :::> !/)
FIGURE 1.-Water discharge and suspended-sediment concentration hydrographs computed by PRMS.
Preliminary Investigation of the Physical Basis of Soil Erosion Parameters in the
Precipitation-Runoff Modeling System (PRMS)
By William P. Carey and Andrew Simon
Simulation of upland soil erosion by PRMS currently requires the user to estimate two rainfall detachment parameters and three hydraulic detachment parameters. One of the rainfall parameters (a coefficient) and all three of the hydraulic parameters are directly related to the erosion properties of the
3
surface material. The remaining rainfall parameter (an exponent) is related to the damping effect of surface-water depth on raindrop impact.
At present these five parameters must be estimated by calibrating simulated results with observed data collected either on small upland plots

or at a downstream gaging station. Neither method provides a physical basis for estimating or transferring parameters. In order to provide a starting point for further research on the physical basis of these parameters, a preliminary assessment of the status of modeling of upland soil erosion is being conducted.
Although progress has been slow in relating measurable soil parameters to rainfall detachment, studies by Meyer and Harmon (1979) and Meyer (1981) have shown that a portable rainfall simulator can be used to evaluate the coefficient in the rainfall detachment equation. Various intensities of rainfall are applied to a soil under the same cover conditions. The relation between erosion rate and intensity is generally log-linear, and thus the coefficient in the rainfall detachment equation can be determined. The ratio of the coefficients quantifies the relative erodibility of different soils or the relative erosion from different cover conditions for a given soil.
A value for the exponent in the rainfall detachment equation is difficult to choose because it depends on the ratio of surface-water depth to raindrop diameter. A reformulation of the rainfall detachment equation based on the work of Mutchler and Larson (1971) would provide a damping term that would not require a user-supplied parameter.
The three hydraulic detachment parameters consist of one exponent and two coefficients. Foster and Meyer (1972) stated that if the bed shear stress is large compared to critical shear stress, then the initial value of the exponent can be set at 1.5. The two coefficients in the hydraulic detachment equation are functions of the soil's resistance to erosion by flow. Research into the relation between these coeffi-
cients and measurable soil properties has not yielded results that can be easily applied in a modeling study. Most studies of cohesive material have focused on the relation between critical tractive force and soil properties; however, Ariathurai and Arulanandan (1978) successfully correlated cation exchange capacity and sodium adsorption ratio with an erosion rate coefficient.
We cannot yet make recommendations concerning methods to evaluate the hydraulic detachment coefficients in PRMS. Further research is needed on the relations between these model parameters and soil properties and on the general applicability of the methods developed primarily for agricultural applications.
REFERENCES CITED
Ariathurai, R., and Arulanandan, K., 1978, Erosion rates of cohesive soils: Journal of the Hydraulics Division, American Society of Civil Engineers, v. 104, no. 2, p. 279-283.
Foster, G. R., and Meyer, L. D., 1972, Mathematical simulation of upland erosion by fundamental erosion mechanics, in Present and prospective technology for predicting sediment yields and sources: Proceedings of the Sediment Yield Workshop, Oxford, Mississippi: U.S. Department of Agriculture, p. 190-207.
Meyer, L. D., 1981, How rain intensity affects interrill erosion: Transactions of the· American Society of Agricultural Engineers, v. 24, no. 6, p. 1472-1475.
Meyer, L. D., and Harmon, W. C., 1979, Multiple-intensity rainfall simulator for erosion research on row sideslopes: Transactions of the American Society of Agricultural Engineers, v. 22, no. 1, p. 101-103.
Mutchler, C. K., and Larson, C. L., 1971, Splash amounts from waterdrop impact on a smooth surface: Water Resources Research, v. 7, no. 1, p. 195--200.
Reducing Sediment Sampling Frequency at Streamflow Gaging Station Rio Grande at Otowi Bridge near San lldefonso, New Mexico
By David H. Marshall
Suspended-sediment samples currently are collected daily at 16 stations that are operated by the New Mexico District of the U.S. Geological Survey. Less frequent sampling would reduce costs for the existing network and would free resources to expand the data-collection network. The purpose of this project is: (1) to develop and test a technique to estimate
4
daily suspended-sediment concentration using records of discharge, climate, and suspended-sediment concentration; (2) to determine the best sampling schedule that, when coupled with the estimation technique, would provide accurate estimates of daily suspended-sediment concentration and yearly total suspended-sediment load; and (3) to estimate the

number of years of daily records necessary to define the relation of suspended-sediment concentration to water discharge at a particular station.
Study of the conditions at the Rio Grande at Otowi Bridge began with an analysis of trend in the yearly mean suspended-sediment concentration. A doublemass curve was used to determine when a change took place in the relation between suspended-sediment discharge and water discharge. The graph of cumulative annual water discharge versus cumulative annual suspended-sediment load showed a linear relation with obvious breaks in slope. Annual mean concentrations were grouped for years when the double-mass curve had a constant slope, and the Kruskal-Wallis test (Canover, 1971) was performed to see if the groups were similar. The test showed that the groups differed at the 99-percent significance level, so the data were selected from the most current group having a constant slope, 1973 to present.
The model developed to predict daily suspendedsediment concentration contains both a deterministic and a probabilistic component. The deterministic component estimates the increase in suspended-sediment concentration caused by a rising stage or precipitation. The probabilistic component estimates the decline of suspended-sediment concentration after an increase, given the cause of the increase and the suspended-sediment concentration the day of the increase.
Flow on the Rio Grande follows a yearly cycle. Spring runoff from snowmelt begins in April, peaks in June, and ends in late July or early August. Flow in July through September typically has very rapid increases and declines from intense, short-duration thundershowers. Releases from Abiquiu Reservoir cause rapid increases in stage followed by sustained flow. The plot of daily suspended-sediment concentration versus discharge formed a hysteresis loop in which concentration was higher on the rising stage of spring runoff than on the falling stage (for the same discharge). The discharge-concentration hysteresis loop and the hysteresis loop formed by Froude number and discharge appeared to be very similar. The relation of the Froude number to suspended-sediment concentration is used in both the deterministic and probabilistic components of the model.
The deterministic component uses rainfall data from five rain-gage stations in the basin and the velocity and hydraulic depth calculated from discharge records from the Rio Grande at Otowi
5
Bridge. Rainfall depths were grouped according to the travel time the rainfall runoff needed to reach Otowi Bridge, and the groups then were summed. The summed depth was correlated with the increase in suspended-sediment concentration, and a line was fitted to the data using the median of the slopes formed by the origin and the data points. This relation is used to estimate the increase in suspendedsediment concentration for a given rainfall depth. Increases caused by a rising stage were estimated by correlating the increase in concentration with the velocity squared divided by hydraulic depth, and a line was fitted to the data using the median slope. Velocity was determined by using a discharge weighted velocity for a rise on day n of:
V = An ~ 1 V2n ~ 1 + (M) (D..d)g n An~ 1 Vn ~ 1 + (M) (gD..d)112
where n = day of the rise, V = discharge weighted velocity, A = cross-sectional area,
M = increase in cross-sectional area (An - An~1),
D..d = increase in mean depth (dn - dn ~ 1), and
g = acceleration of gravity.
The velocity of the rise is assumed to be celerity velocity of a wave of the depth of the river. This undoubtedly overestimates actual velocity, but it is only used to separate the rises for different discharges.
The probabilistic component is estimated using a Markov model (Karlin and Taylor, 1975). The Markov process was estimated by first grouping the suspended-sediment concentration data by the time since the latest increase and by the type of increase. Five groups were used: (1) 1 day after a 1-day storm; (2) 1 day after a 2-day (or longer) storm; (3) 2 or more days after a storm; (4) 1 day after a rise in stage; and (5) 2 or more days after a rise in stage. The range in concentration was broken into 50 intervals, or state spaces. The concentrations were paired for day nand day n + 1 and, after being grouped, were sorted by state spaces for day n. Only pairs where the concentration on day n + 1 was lower than day n were used. The mean of the concentrations for day n + 1 for each state space was calculated. All the state space means were joined using an arctangent function to make the model continuous. A lower limit of suspended-sediment concentration was calculated

by estimating the lowest boundary of velocity squared divided by hydraulic depth and measured concentration. This acts as an absorbing state; that is, once the concentration falls to this level, it will remain constant (for a given velocity squared/ hydraulic depth) until an increase takes place.
The model is exploratory and was developed to determine if the technique is feasible. Many variables affecting concentration were not used, and actual field conditions were not properly estimated. To assess accuracy, the model was developed using data from the 1979 and 1980 water years and tested using data from the 1981 water year. The calculated yearly suspended load was 76.5 percent of the measured load, and daily extimated suspended-sediment concentrations were reasonably close to measured concentration for all days when no precipitation occurred. Using observations of suspended-sediment concentrations when precipitation occurred
(138 points), the estimated yearly load was 91.8 percent of the measured load, and daily concentrations were very close.
Future work on the model will be needed to better estimate rising stage velocity, to develop a better assessment of rainfall relations, and to account for seasonal changes. The data base will be increased one year at a time to observe convergence of the estimated parameters. Other sampling schemes will be studied to optimize accuracy with the fewest possible samples, and recommendations for reduced sampling will be developed.
REFERENCES CITED
Canover, W. J., 1971, Practical nonparametric statistics: New York, John Wiley, p. 229-237.
Karlin, Samuel, and Thy lor, Howard M., 1975, A first course in stochastic process: New York, Academic Press, p. 45--116.
Comparison of Digital Modeling Techniques which Simulate Sedimentation Processes in an Agricultural Watershed
By Leslie D. Arihood
The Precipitation-Runoff Modeling System (PRMS) and Areal Non point Watershed Environmental Response Simulation (ANSWERS) models are evaluated for their accuracy, applicability, and practicality in simulating water and sediment runoff from a midwestern agricultural watershed. The models' applicability and performance were analyzed in light of the watershed's characteristics, storm patterns, and runpff characteristics.
Model design should be able to incorporate the specific characteristics of the Hooker Creek watershed, Indiana. Sediment production is mostly from the flood plain and areas close to the flood plain. The drainage network has developed in a manner such that runoff is rapid. The steady-state hydraulic conductivity of soil is reached within 5 minutes after water is pooled on the soil surface. Soils near the stream and soils in the uplands have different capacities to infiltrate, hold, and drain water.
Sediment transport is influenced greatly by source material and rainfall intensity. About 90 percent of suspended sediment is less than 0.062 mm in diameter, reflecting the fine-textured soils of the
6
watershed. Rainfall intensity strongly influences suspended-sediment concentration and discharge; in fact, sediment discharge from storms having a similar maximum intensity can be adequately described by a straight-line arithmetic plot of mean daily storm discharge and sediment discharge.
Differences in each model's structure and concepts of hydrologic processes are important in determining the model's usefulness and applicability. The PRMS is capable of simulating several storm and nonstorm periods whereas ANSWERS can simulate only one storm period per run. ANSWERS' grid system is well suited to the Hooker Creek drainage network. Overland flow planes can drain directly to adjacent overland flow planes or to the beginning of a stream and continue to maintain the actual watershed slope. The PRMS has a subsurface reservoir contributing to streamflow whereas ANSWERS can simulate subsurface flow only by tile drains. ANSWERS can simulate infiltration from surface pools until they dry, but PRMS simulates infiltration only during rainfall.
ANSWERS' data collection is simplified by

providing some sources for data in the documentation and by referencing sources that are easily obtained. Data for ANSWERS that must be collected from the watershed, such as discharge and
rainfall, are commonly collected by Districts and do not require significant increases in data-collection expertise.
Instrumentation
Measurement of Suspended Sediment in Surface Waters: A Discussion of New Technologies That Will Operate Continuously and Unattended
By Marvin C. Goldberg
Timely and accurate data on particle size distributions and mass concentrations of suspended sediment in natural water bodies are used by the U.S. Geological Survey and other agencies concerned with water quality and stream hydrology. Obtaining this data adequately and efficiently would be made easier if a device were available which could analyze the sediments automatically and unattended in situ. The analyzer, ideally, would be able to extract the sample from the cross section and measure the particle size/mass distributions. It should have a range of 1 to 1, 000 micrometers in hydrodynamic size and from 50 to 500,000 parts per million in concentration. It should make the measurements accurately and reliably, without operator attention, for a period of at least 2 weeks.
There are several technologies currently used for particle size measurements. These include sieving, sedimentation, gravimetry, elutriation, turbidimetry, light obscuration, electrozone measurements (Coulter-type sensors), doppler-shifted light scattering, acoustic echoing, holography, microscopy, Xray fluorescence, photon correlation spectroscopy, elastic light scattering, and attenuation of transmitted energy from a beam, where the beam can be visible light, X-ray, beta-ray, gamma-ray, or ultrasonic.
Only sieving, visible light beam attenuation, single-particle obscuration of a light beam, electrozone devices, and back-angle light scattering can measure sizes over the range desired. Of these, the singleparticle obscuration and electozone methods require many sensors operating in parallel and, in both
7
cases, each sensor contains a small orifice through which the particles must flow. Adding a way to automatically unclog the orifices introduces a degree of complexity which is undesirable in a field-sited particle sensor. Automatic sieving instruments are mechanically quite complicated, and for long-term reliability, electronic complexity is preferable to mechanical.
The techniques remaining are light-beam attenuation and light scattering. Of these two methods, light scattering has the advantages of being relatively insensitive to large concentration changes and being easy to combine with depolarization measurements, for extending the low end of the size range.
The U.S. Geological Survey uses hydrodynamic sizes as a size parameter. Few methods can accurately measure both size and mass in a single measurement, thus mass is commonly approximated by multiplying an average density (2.65 g/cm3 ) times the determined volume of the particle. Light-beam attenuation and light scattering techniques can be combined with sedimentation procedures to provide a hydrodynamic size measurement. A particle-sizing instrument developed in our laboratory, incorporating right-angle scattering, depolarization ratios, and back-angle scattering, has demonstrated better resolution in the small size range with smaller samples than gravimetric sedimentation and equal capabilities with larger particles. The instrument is mechanically quite simple, produces a signal that is readily digitized, and is adaptable to being incorporated into a field-sited particle analyzer.
Instrumentation for Automatically Monitoring Sediment Concentration and Particle Size-A Progress Report
By James H. Ficken
The Instrument Development Laboratory, located at the Gulf Coast Hydroscience Center in Mississippi, has procured several new instruments to evaluate their capabilities to measure suspendedsediment concentration and particle-size distribution. Two Markland Ultrasonic Suspended-Solids Meters have been procured to evaluate the meter's capability to measure suspended-sediment concentrations in the range of 5,000 to 70,000 mg/L. Daily sediment loads at two sites, estimated using the output of the Markland meters, will be compared to estimates made from routine daily sediment-sample analyses.
A Dynatrol instrument (a vibrating U-tube) will be evaluated for its capability to measure the density of a water-sediment mixture at a field site. The density can be related to sediment concentration provided corrections are made for variations in density because of dissolved solids and temperature.
A Markland sludge gun, an infrared transmissometer, detects and measures the absorption or scattering of infrared light by water-sediment mixtures. This instrument was evaluated for its ability to measure concentrations of sediment in water-sediment mixtures.
A Micromeritics Sedigraph 5000D was procured
for the particle-size analysis of sediment. Analytical determinations from this instrument were compared with determinations from the standard pipet method pertinent to measurement accuracy and analytical costs.
The Instrument Development Laboratory at the Hydrologic Instrumentation Facility is working with districts and the Interagency Sedimentation Project to evaluate the instrumentation mentioned above. Reports will be given by the following individuals:
1. Bill Matthes of the Iowa District will report on the work they are doing with the Micromeritics Sedigraph.
2. Dave Marshall of the New Mexico District will report on their progress to date on operating the Markland Ultrasonic Suspended-Solids Meter. [Not included in this report]
3. Dallas Childers of the Vancouver, Washington, Subdistrict will report on their application of the Markland Ultrasonic Suspended-Solids Meter. [Not induded in this report]
4. Gerry Goddard of the Wisconsin District will discuss characteristics of the site at which the Dynatrol is planned to be installed.
5. John Skinner of the Federal Interagency Sedimentation Project will discuss the Dynatrol.
Progress Report on Testing of the Sedigraph Particle Size Analyzer
By Bill Matthes
A Sedigraph model 5000D, manufactured by Micromeritics Instrument Corporation, was assigned to the Iowa District for testing the potential of the unit as an alternative to the pipet method.
The Sedigraph measures the sedimentation rate of particles, dispersed in a liquid, that range in size from 1 to 100 J.Lm. The instrument determines, by means of a finely collimated beam of X-rays, the concentration of particles remaining at decreasing
8
sedimentation depths as a function of time. Analysis time is reduced by continuously moving the sedimentation cell so that the effective sedimentation depth is inversely related to the elapsed time. A built-in solid-state computer solves Stoke's law and synchronizes the cell movement with the equivalent spherical diameter on the x-axis of the recorder, corresponding to the elapsed time and instantaneous depth. The logarithm of the difference in transmit-

ted X -ray intensity is electronically generated, scaled, and plotted linearly as a "cumulative mass percent" on the y-axis.
The experiments ·were designed to supply information on the degree of operator training, time of analysis, effects of varying concentration on analysis, reproducibility of results, effects of changing cells, and comparison of results with the pipet method.
The test materials consisted of seven fluvial sediment samples from various sites around the country (DeLaney and Schroder, 1979).
Operator training: The training of qualified operators for the Sedigraph is less demanding and not as critical as for the traditional pipet method. About 40 hours of on-the-job training would bring operators to acceptable competence.
Time comparison: Sample preparation time for either the pipet or Sedigraph methods is the same. The time of analysis per sample is 20 minutes for the Sedigraph and approximately 40 minutes for the pipet in the range of 2 to 62 J.Lm. One operator and one unit could analyze approximately 3,500 prepared samples per year.
Effect of varying concentration: The concentration of the sample does not have to be ascertained before the analysis; rather, the sample is diluted until the concentration meets the operational limits. The effects of varying sample concentration were tested by starting with a very turbid solution
and diluting with 10 mL diluted dispersing agent after each run. Negligible differences were noted between runs.
Reproducibility: A minimum of two analyses were obtained on each sample, and nearly identical results were obtained on most samples with as many as eight repetitions.
Effect of interchanging cells: During normal operation, cell windows will have to be replaced for various reasons. Results indicated no significant differences using two different cells.
Comparison of results: In general, the best agreement between methods was obtained for samples having 50 to 60 percent of the material finer than 1 J.Lm. For samples having a more uniform distribution of particle sizes, the results are acceptable. The largest differences were noted in samples containing 65 to 70 percent material larger than 10 J.Lm. These differences are significant and work is still being done to resolve this discrepancy.
Choosing the Sedigraph for an alternate method will depend largely on its reliability, availability, reproducibility, and comparability with other methods. With the exception noted, the Sedigraph appears initially to fulfill these criteria adequately.
REFERENCE CITED
DeLaney, B. M., and Schroder, L. J., 1979, Preparation of reference material for particle-size analysis of silts and clays: U.S. Geological Survey Open-File Report 79-1590, 14 p.
The Dynatrol Test Site, Madison, Wisconsin
By Gerald Goddard
The Willow Creek storm-sewer basin is located in the west-central part of the city of Madison, Wis. The gaging station was operated in cooperation with the City of Madison and the Dane County Regional Planning Commission to determine the nutrient, sediment, and water loadings to Lake Mendota. Continuous discharge and water-quality data have been collected since October 1973.
Willow Creek drains an area of 3.15 mi2 , of which about 30 percent is impervious. The basin is primarily residential with some small areas of commercial development and is considered fully developed.
9
The drainage network consists of enclosed storm sewers of various sizes along with natural and concrete-lined open channels.
The gaging station is located about 200 ft downstream of the storm-sewer outlet along a dredgedopen channel. The control at the station consists of a 6-ft-wide Parshall flume installed in a broad-crested concrete weir. Over 9 years of record, the maximum observed instantaneous discharge was 754 ft3/s and the minimum was 0.01 ft3/s. The average discharge was 2.38 ft3/s. Willow Creek is very flashy in regard to discharge, as is typical of urban streams and

storm sewers. The stage can change up to 4ft within 15 to 20 minutes, which corresponds to a change in discharge of about 750 ft3fs.
Suspended-sediment samples have been collected since October 197 4 using a U.S. PS-69 pumping sampler. Suspended-sediment concentrations have ranged from less than 10 mg/L to a maximum of 5,450 mg/L. The maximum daily load was 319 tons. Annual suspended-sediment yields ranged from 80 to 293 tons/mi2 • Rapid changes in sediment concentrations of 2,000 to 3,000 mg/L can occur within 15 to 20 minutes. This will provide a good test of the response time of the Dynatrol in monitoring changing sediment concentrations.
The Dynatrol will also be evaluated with regard to its response to particle size. Particle size of the suspended sediment at the gaging station is mostly in the silt and clay size ranges. The amount of silt size particles in the samples ranged from 15 to 78 per-
cent, the clay size particles ranged from 21 to 72 percent, and the sand size particles ranged from 1 to 74 percent.
The Dynatrol will be tested to see how closely it monitors sediment concentrations throughout a storm event. To check the accuracy of the Dynatrol, samples collected at the outlet of the unit will be analyzed for sediment concentration, dissolved solids, and specific conductance. Sieve analyses will also be made. Temperature and specific conductance will be recorded using a minimonitor.
The variation in discharge and sediment concentration at this site should provide a wide variety of situations to evaluate the Dynatrol. Storms varying in rainfall amount and intensity are relatively frequent under normal conditions. This site is also located within one-half mile of the Wisconsin District Office, so close surveillance and frequent inspections are possible.
Determining Sediment Concentration with a Fluid-Density Cell
By J. V. Skinner
The combination of a commercial density cell (Dynatrol) and a special electronic circuit shows considerable promise as a sediment-concentration meter. The cell consists of a U -shaped tube that is attached to an electromagnetic vibrator and a watersampling pump. As sediment particles move through the tube, they are forced to vibrate and thereby
· increase the mass of the oscillating system. As the sediment concentration increases, the vibrational period also increases.
The electronic circuit performs three functions: it sustains the vibration of the tube, accurately measures the vibrational period, and digitally displays the measurement after a preset time interval.
The relation between concentration and vibrational period has been established in a series of laboratory tests. Results indicate that for accurate measurements, the period reading must be corrected for water temperature and dissolved solids.
Monitoring Streambed Changes and Sediment Concentrations Using the Acoustic Velocity Meter
By Antonius Laenen1
Acoustic velocity metering (AVM) systems have been operational to0ls for the measurement of streamflow since 1965 (Laenen and Smith, 1982). These systems measure the traveltime of a sonic
1This paper was not presented at the seminar.
10
pulse transmitted diagonally across a stream in both directions to determine stream velocity along an acoustic path. This paper points out some acoustic applications that may be useful in the measurement of sediment and its transport and describes our experiences with the AVM system.

The measurement of stream depth by acoustic means is certainly not new. Fathometers, used routinely to define stream bottom profiles, use a single transducer to transmit an acoustic pulse to a reflecting surface (stream bottom) and then time the backscattered signal to obtain a measurement of depth. A sub-bottom profiler, another widely used device, is useful in locating well-defined surfaces beneath less consolidated bottom material. This device uses a trailing hydrophone to listen for reflected signals originating from a source some lateral distance away.
An AVM system uses only the direct signal between transducers to define the velocity component of the moving water between. Signals are also reflected from the streambed, and these (if monitored indirectly by oscilloscope) can be used to measure streambed changes in the vicinity midway between transducers. These phenomena have been documented (Laenen, 1983) and verified on the Cowlitz River in Washington by oscilloscope photography. This study showed that depths measured by scaling signal times off oscilloscope photos were within 0.3 ft of sounded depths and that this point measure was a good index for the cross section. AVM systems presently used do not recognize reflected signals, and other signal-recognition techniques need to be explored before an AVM system could monitor reflected signals automatically. Signal-correlation analysis, yet to be tried in stream-based acoustic systems, is the most likely method now available to make measurement by acoustic reflection a viable tool.
The measurement of sediment concentration by ultrasonic means is also not a new idea. Physical equations defining the relation of signal attenuation to particle size and concentration were derived in the early 1940s. Flammer (1962) concluded, "the [ultrasonic] method for determining sediment size and concentration seems adaptable to continuously recording and automatic field installations."
The acoustic attenuation of signals propagated in the stream determines how well an AVM system will operate. Signal strength is affected by the particulate matter present in the acoustic media, and signal
11
attenuation during normal AVM operation may be a reasonable indicator of the relative magnitude of the sediment concentration along the acoustic path. Equations by Urick (1967) indicate that significant signal attenuation should occur for the frequencies and the path lengths used in AVM systems, enough attenuation to provide information regarding sediment concentration. Oscilloscope photographs of signals from AVM systems now in use indicate this is indeed so.
To date, there has been no formal study to document the effect of sediment concentration on signal attenuation in existing AVM systems. Equipment has been designed and built to record changes in signal strength, and a program to explore the relation between this signal strength and sediment concentration is a reasonable approach.
The speed at which the acoustic signal travels in a stream is affected by the density of the watersediment mixture. If temperature and specific conductance are known and density gradients do not bend the acoustic signal significantly, then relative density changes will be indicated by the changing traveltime of the acoustic pulse. The accuracy and practicality of this scheme has yet to be tested; however, noticeable changes in speed of sound and associated sediment concentrations have been documented. Problems in this approach include the derivation of a modulus of elasticity value for the water-sediment mixture. Definition of modulus values could entail a difficult and involved laboratory analysis.
REFERENCES CITED
Flammer, G. H., 1962, Ultrasonic measurement of suspended sediment: U.S. Geological Survey Bulletin 1141-A, 48 p.
Laenen, Antonius, 1983, Measuring water surface and streambed elevation changes with the acoustic measuring system: American Geophysical Union, Water Resources Research, v. 19, no. 5, p. 1317-1322.
Laenen, A., and Smith, W., 1982, Acoustic systems for the measurement of streamflow: U.S. Geological Survey Water-Supply Paper 2213, 26 p.
Urick, R. J., 1967, Principles of underwater sound [2d edition]: New York, McGraw-Hill, 384 p.

Mud and Debris Flows
Geobotanical Evidence of Debris Flows on Mount Shasta, California
By Cliff R. Hupp and W. R. Osterkamp
Geobotanical data, including increment cores and cross sections from trees growing on and near debris-flow deposits, were collected in the vicinity of Mount Shasta, California, during July of 1982 and 1983. Evidence of debris flows is common in the valley sections along most streams draining Mount Shasta, especially those which head at an alpine glacier. This evidence usually appears as depositional terraces at levels above the present stream channel. In some cases, past debris flows have degraded the valley section and were deposited further downstream.
Debris flows destroy or damage the vegetation in or near their paths, but nearly all surfaces created by debris flows now sustain reestablished woody vegetation. Recent surfaces along six streams have been dated dendrochronologically to provide magnitude and frequency information of debris-flow activity in the vicinity of Mount Shasta. Floods and debris flows can have various effects on woody vegetation, including partly felling trees, scarring stems, and creating bare areas where seedlings can become established. The effects are recorded in the wood, and the age of the geomorphic event is measured in years by the annual growth increments.
Trees that survive a debris flow provide highly accurate dates. Effects of a debris flow are manifested in several ways, usually as deformation of the stem or wood anatomy. These deformations are of four basic types (fig. 2): (1) eccentric annual growth, (2) suppression and release sequences, (3) adventitious sprouting along the parent trunk, and (4) corrasion of the stems by debris transported in the debris flow. The analysis of cross-dated cores and cross sections of stems bearing one or more of these deformations ultimately yields a date for a particular event. All of these lines of evidence were employed for debris-flow dating at Mount Shasta. In areas where a debris flow removed vegetation, a minimum age was obtained by dating the reestablished trees. Often the age structure of the tree stands on ter-
12
races indicated that the trees began growing shortly after the deposition.
Whitney-Bolam, Ash, and Mud Creeks were the most intensively studied drainages (fig. 3). Study sites were selected to facilitate determination of the down-valley extent of any particular debris flow. Field routine consisted of: (1) determination of depositional terraces, through ground traverses, topographic maps, and aerial photography; (2) removal of increment cores, cross sections, and wedges from trees growing on or near the debrisflow terraces using increment borers and hand saws; and (3) analysis of wood samples for age and ring pattern.
Trees selected for dendrochronological analysis were either growing on a terrace with their root flare indicating germination after surface deposition or bore obvious deformation indicative of debris-flow damage, or both.
Detailed field notes were taken which described the character and location of debris-flow terraces, the location and type of botanical evidence for each tree sampled, and field date of the debris flow (when possible). About 425 trees were analyzed. Results of tree-ring analyses are summarized in tables 2, 3, and 4.
Most dendrochronologically datable debris-flow terraces occur relatively low in the valley section. Usually two or three terraces were found below the major stream incisement at all sampling sites. An example of this is shown in figure 4, a representative cross section of Ash Creek. As a rule, recent small debris flows were identified at high elevations on the mountain or low in the valley section; large debris flows were usually identified at low elevations or high in the valley section (fig. 4). Evidence of old small debris flows is rare, probably owing to the likelihood of being washed out by subsequent larger debris flows. Much evidence suggests cyclic scour and fill sequences along given reaches. Recent debris flows which can be traced downvalley indicate a fining of

D
FIGURE 2.-Types of botanical evidence of debris flow. A, Eccentric growth after tilting. B, Tree cored for minimum age. C, Release after passage of debris flow. D, Scar and callus growth after corrosion of stem by debris flow.
the clasts downslope, from very coarse lahars to hyperconcentrated floods.
Tree-ring dating was useful for dating surfaces as old as 500 years. However, considerable geomorphic and stratigraphic data indicate many debris flows that are much older. These data have not been thoroughly analyzed yet, but the literature has shown that a widespread pyroclastic deposit is about 9,200 years old. This deposit is distinctive and was used as a marker bed for relative ages of older deposits and as an indicator of areas with no recent debris-flow activity. Exposures of debris-flow stratigraphy, especially in cut banks, indicate periodic large
13
events both before and since the pyroclastic deposit. The unsorted to reverse grading which may be typical of debris-flow deposits can be seen in these exposures.
Recent and ancient debris flows on Mount Shasta represent a major surficial geomorphic agent. These flows, along streams and down valleys, may be the most significant geomorphic process; they have contributed to the formation of large alluvial fans. Dendrochronologic and stratigraphic analyses may allow for estimation of the magnitude and frequency of debris flows on Mount Shasta.

4JD30i-' ______________ __.:1~22;,...0 1~5_' -------r------------------;
i:::.~~
~
CAUFORNIA
I I I I I
5 MILES I
5 KILOMETERS
FIGURE 3.-Study areas (sites 1-12, see tables 2--4) on Mount Shasta, Calif.
14

TABLE 2.-Sumrnary of debris flow dates at sites on Whitney Creek and Bolam Creek, Calif.
Event a
Upper Whitney Bolam Whitney Creek Whitney Creek on Creek Creek below US 97 Juniper Flats
(1) (2) (3) (4)
A 1974 1;~2b B
c 1952c 1;;5c,d
1952 D 1935 1935b 1935c,d E 1924 F 1840 1840c G 1790 H 1670 1670c
aA, Tree age, ring anomalies; B, tree age; C, tree age, corrasion scar; D, tree age, ring anomalies, corrasion scars; E, corrasion scars; F, 5ree age, ring anomalies, corrasion scars; G, tree age; H, tree age.
Probably a flood, not a debris flow. ~Site of major deposition for event.
Event
A B c D
E F
Historically documented.
TABLE 3.-Summary of debris flow dates on Mud Creek, Calif
Event a
Damsite Pipeline RD13 CA 89 (5) (6) (7) (8)
A 1977 1977~ B 1974 1974 1974 c 1967c 1967c D 1964 1964 E 1962 F
1924d 1950
1924b,d G 1924 1924b,d H 1910
1;;ld 1881b,d I 1881 1;~ob J 1880
aA, Tree age, ring anomalies, corrasion scar; B, tree age, ring anomalies; C, adventitious sprouts from a flood (no debris flow), tree age; D, tree age; E, tree age, corrasion scars; F, tree age; G-H, tree age, corrasion scats; I, tree age, ring anomalies; J, tree age.
Site of major deposition for event. ~Probably a flood, not a debris flow. Historically documented.
TABLE 4. -Summary of debris flow dates on Ash Creek, Calif.
a Upper Ash Creek Military Pass Ford Old Mill Site
(9) (10) (11)
1977b,c 1977 1962c 1962 1962 1939 1939
1900 1900c 1800 1800 1800c
1725 1725c
aA, Tree age, corrasion scars; B, tree age, ring anomalies, corrasion scars; C, tree age, ring anomalies, corrasion scars; D, tree ageB ring anomalies; E, tree age; F, tree age.
Historically documented. cSite of major deposition for event.
15

(Not to scale)
FIGURE 4.-Representative cross section of Ash Creek near Military Pass, Calif.
Downstream Dilution of Lahars from Mount St. Helens, Washington: Defining the Boundary Between Debris Flow and Hyperconcentrated Streamflow
By Thomas C. Pierson and Kevin M. Scott
Mudflows and debris flows (collectively termed lahars in volcanic terrain) behave as non-Newtonian fluids. Hyperconcentrated streamflow, on the other hand, is thought to behave as a Newtonian fluid. Although the transition from one type of fluid to the other has significant implications for the mechanics of flow and sediment transport, the sediment concentration boundary separating them has only been arbitrarily defined. Several lahars occurring at Mount St. Helens since the catastrophic eruption on May 18, 1980, have transformed from debris flow to
16
hyperconcentrated streamflow. These flows provided the opportunity to describe the change in flow properties as the boundary was crossed and to correlate changes in character of the deposits with this transition.
An explosive eruption on March 19, 1982, caused nearly instantaneous melting of a large volume of snow in the Mount St. Helens crater. Subsequently, a flood of roughly 3,200 acre feet of water and hot volcanic ejecta cascaded down the north flank of the volcano, eroding and incorporating enough addi-

tional rock debris into the flow to transform it into a debris flow within 1.2 miles of the creater breach. This lahar, with an initial peak discharge estimated to be in excess of 490,000 ft3/s, entered the North Fork Toutle and flowed 17 miles downstream (moving in two surges) as a coherent debris-flow slurry. Flow velocities, computed from superelevation in bends, varied between 13 and 30 ft/s. Sediment concentrations of peak flow deposits were experimentally determined from reconstituted samples and showed a progressive downstream decrease from about 90 to 79 percent by weight. The deposits, which remained liquefied for more than a day, were typical of debris-flow deposits: poor sorting (sorting coefficient of2. 0 to 5. 0 phi units), lack of stratification within depositional units, matrix-supported clasts rather than openwork structure, and relatively low silt and clay contents (7 to 15 percent by weight).
Between 17 and 25 miles downstream from the crater, the character of the deposits changed progressively to a lahar-run out facies, consisting of poorly stratified, moderately well sorted (sorting coefficient of 1.1 to 1. 6 phi units) beds of noncohesive, openwork sand (predominantly coarse) with occasionallenses ofpumire gravel. These beds commonly exhibited both normal and reverse grading. At four gaging and observation stations located 30, 36, 45, and 50 miles downstream, observers noted that the flow was no longer a coherent slurry, but rather sand suspended in muddy water-hyperconcentrated streamflow. Grab samples, observed deposition of coarse sand (deposits drained immediately), and for-
mation of 8-ft-high standing waves confirmed a change in fluid properties. Progressive downstream changes at peak flow were observed (with respect to stations mentioned above) in suspended-sediment concentration (not measured, 71, 67, and 61 percent by weight), discharge (34,000, not measured, 23,000, and 16,000 ft3/s), and temperature (16.5, not measured, 12.5, and 10.8°C). Mean velocity did not change significantly but remained between 13 and 20 ft/s. The sedimentology and stratigraphy of deposits from the May 18, 1980, South Fork Toutle River lahar and deposits from several prehistoric lahars in the Toutle River valley show trends very similar to those of the March 19, 1982, deposits.
Dilution of the debris flow by deposition of coarser particles and incorporation of additional water from the river resulted in the transition from a one-phase slurry (trapped pore water transported within a framework of particles) to a two-phase hyperconcentrated fluid (coarser particles freely suspended in a mixture of water and fines). For the March 19, 1982, lahar, this sediment concentration threshold was crossed at between 76 and 79 weight percent solids. Samples from the recessional limb of the May 18, 1980, North Fork Toutle River Lahar indicate that the threshold for that lahar (mudflow) was bracketed between 72 and 84 weight percent solids. This boundary is, however, dependent on the particle-size distribution of the slurry. Past experimental work has indicated that silt- or clay-rich mixtures make the transition at considerably lower sediment concentrations.
Stream Channel Adjustments to 1980 Lahars and Subsequent Stormflow, Mount St. Helens, Washington
By Holly A. Martinson and David F. Meyer
The South Fork Toutle River, flowing west from Mount St. Helens, and Pine Creek, flowing southeast, are two river systems altered by lahars generated during the May 18, 1980, eruption. During water years 1980-82, the volume of sediment eroded or deposited by fluvial processes has been comparable to or greater than volumes eroded or deposited at channel cross sections by the May 18, 1980, lahars. Reaches of comparable slope have adjusted similarly, although the magnitude of storage changes
17
has not been proportional to discharge, nor have trends or patterns of adjustments persisted through time. These large-scale changes reflect the response of disturbed channels to the statistically large streamflows that have occurred since the eruption.
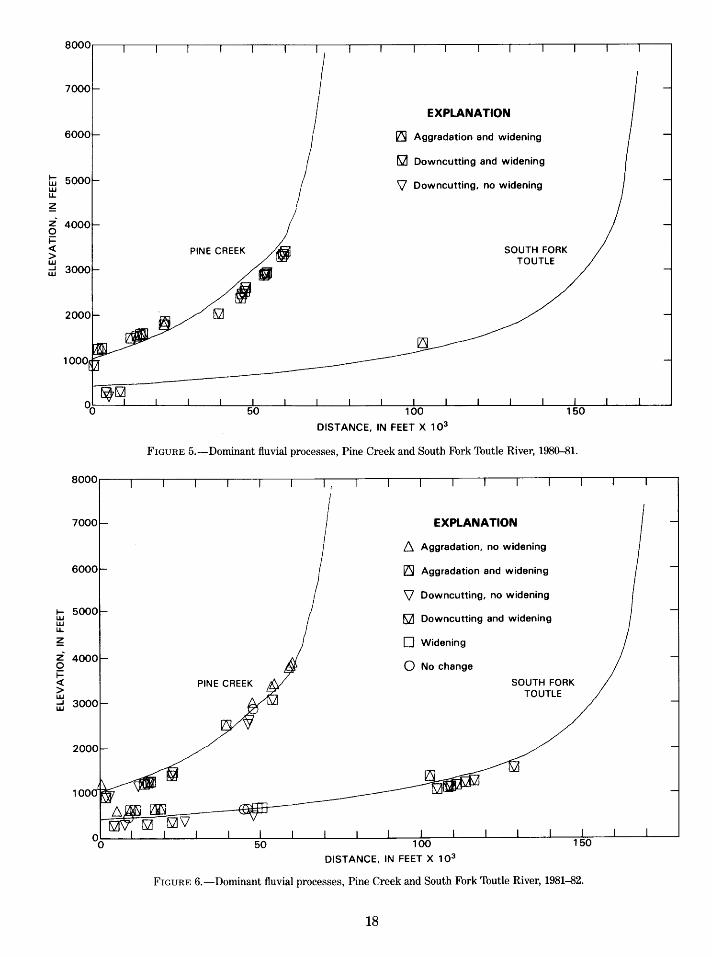
The largest changes in sediment storage occurred during water year 1981 at all measured sections, in part due to ubiquitous lateral instability and pervasive widening by channels by 30 feet or more during water year 1981 (fig. 5). The additional down-
~ w w u..
~
z 0 i= <{
> w ...J w
~ w w u..
~
z 0 i= <{ > w ...J w
EXPLANATION
~ Aggradation and widening
~ Downcutting and widening
\I Downcutting, no widening
SOUTH FORK TOUTLE
DISTANCE, IN FEET X 103
FIGURE 5.-Dominant fluvial processes, Pine Creek and South Fork Toutle River, 1980-81.
I
I EXPLANATION
6. Aggradation, no widening
~ Aggradation and widening
\I Downcutting, no widening
fQ1 Downcutting and widening
0 Widening
0 No change
SOUTH FORK TOUTLE
DISTANCE, IN FEET X 1 0 3
FIGURE 6.-Dominant fluvial processes, Pine Creek and South Fork Toutle River, 1981-82.
18

cutting of channel incisions in the steep, uppermost reaches caused a net loss of sediment from storage. For example, in upper Pine Creek, cross-sectional area at surveyed sites increased by 790 to 2,600 ft2 .
In moderate-slope reaches, area changes of as much as 750 ft2 reflected net storage losses or gains. Channel aggradation dominated at these sites, but erosion of higher terraces and the valley walls contributed to a net loss of sediment in storage measured at about half the sites. In low-slope reaches of the South Fork Toutle River the channel incised, but increases in cross-sectional area of as much as 5,400 ft2 were mainly caused by increases in channel width.
During water year 1982, changes in storage averaged one-fifth the magnitude of changes during water year 1981, and the pattern of response commonly was reversed (fig. 6). Eighty percent of measured cross sections in the high-slope reaches of
upper Pine Creek filled, with a net gain in storage. Channels incised at 90 percent of the measured sections in moderate-slope reaches (lower Pine Creek and middle South Fork Toutle River), lowering the bed by as much as 5 feet, and causing a net loss of storage. Widening was negligible at Pine Creek, except near the mouth, but continued as a dominant process in the middle reaches of the South Fork Toutle River. The channel aggraded and widened in the low-slope reaches of the lower South Fork Toutle River.
Therefore, high flows caused by storms of water year 1981 had a "first flush" effect. Subsequent discharge of comparable magnitude during water year 1982 did not have proportional effects on the channels. At some sites, the largest changes in storage occurred during high flows caused by the first significant storm of water year 1981.
Erosional Development of the North Fork Toutle River Debris Avalanche Deposit, Washington
By David F. Meyer and Richard J. Janda
In 3 years following the May 18, 1980, eruption of Mount St. Helens, the chaotic, hummocky topography of the massive debris avalanche deposit in the North Fork Toutle River has been significantly altered by mass wasting and fluvial processes. This deposit initially covered about 23 mi2 with an average of 150 feet of poorly sorted, low cohesion, primarily sand-size debris. Three major and nine minor tributaries were impounded by the avalanche deposit, and numerous closed depressions existed on its surface. For erosion to proceed, a through-flowing drainage had to develop.
Erosional development of each area on the avalanche deposit involves a four-step sequence of events: (1) drainage integration by fill and spill of closed depressions (fig. 7), (2) channel incision and extension, (3) channel widening, and (4) alternating scour and fill. However, even reaches experiencing aggradation show a net decrease in sediment storage because bank erosion more than compensates for aggradation on the bed. These processes deliver annually 2-3 x 10⁷ tons of suspended sediment and a large but as yet unquantified amount of bedload to the North Fork Toutle River. This extreme load
19
creates major sediment-management problems along the lower Toutle and Cowlitz Rivers.
Drainage integration was initiated by lahars generated by compaction, dewatering, and possibly liquefaction of the avalanche deposit during the morning and afternoon of May 18, 1980. Further integration proceeded quickly because areas on and upstream from the avalanche deposit receive 60--130 inches of precipitation annually. Surface runoff and ground-water seepage filled depressions, causing breaching and cutting of incipient channels. Breach flows surged downstream, sometimes as debris flows, until contained in larger depressions. The first significant discharge from the avalanche deposit to the North Fork Toutle River occurred on August 27, 1980, when a 284-acre-foot lake near Elk Rock (10 miles northwest of the crater and 5 miles upstream of the distal end of the avalanche) breached, generating a peak flow of about 16,000 ft3/s. Some breaches were caused by eroding away earthen impoundments rather than the fill-spill process. The largest breach of this type occurred on February 20, 1982, when the North Fork Toutle River breached the impoundment of Jackson Creek Lake, releasing about 2,000 acre-ft

of water. In addition to natural breaches, 37.9 mi2 of drainage integration was brought about by constructing controlled outlets to South Fork Castle, Coldwater, and Spirit Lakes. Spillways were constructed at the first two lakes during summer of 1981, and a pumping scheme was installed at Spirit Lake in autumn 1982.
Streams resulting from initial drainage integration quickly eroded deep narrow channels because of the generally steep initial slope (0.00~.055) and the readily erodible character of the avalanche deposit. New channels commonly incised 16 feet or more in response to breaching flows and storm runoff early in water year 1981.
During the last three quarters of water year 1981, marked incision occurred only upstream of Elk Rock. Nearly all sediment eroded from incising
120
(/) w ::::!100 (!) ::::;! z w i= a: 80 ~ <( ::l 80 a: 0 1-(/) z ~
0 60 u
<(-60 z
w u; a: <( <( al (!) LL. z
40 40 0
i= 1-::l z al w a: u 1- a: z 20 20 ~ 0 u
WATER YEAR
FIGURE 7.-Drainage integration, with time, of the upper North Fork Toutle River basin, above the N -1 debris retention structure. Vertical portions of the line represent breaching of ponds and lakes; heavy lines represent controlled breachings. Arrows represent major runoff-producing storms.
reaches was carried through the Elk Rock reach to and beyond the distal end of the avalanche deposit. Channel widths in both incising and poised reaches commonly increased by about 100 percent. Bank erosion caused relatively dry debris slides and avalanches as well as occasional slumps, but banks generally remained steep and straight. Storm runoff volumes, peak discharges, and sediment delivery
20
were all low compared (per unit of precipitation) with events in water year 1982.
Channel response on the North Fork avalanche deposit was quite different in water year 1982 for at least three reasons. First, annual precipitation and storm intensities were greater than in water year 1981. Second, at least 20 mi2 of drainage area was gained through episodic natural integration and construction of controlled exits for Coldwater and South Castle Lakes. Fina1ly, an effluent ground-water table developed over much of the avalanche and greatly increased the banks' susceptibility to slumping and flowing. In some tributaries, slumping of saturated debris generated debris flows that were observed to flow for as much as 1.2 miles. Higher peak discharges and increased sediment delivery caused massive channel widening (up to 180 feet in a single 2-day storm). Locally, width increased to the point that flow depths were insufficient to transport imposed sediment loads. Within the Elk Rock reach, net changes in thalweg elevation were minimal, although complex cut-and-fill sequences as much as 30 feet thick were evident following several storm periods. Even during periods of aggradation, channel widening in this reach eroded a greater volume of material than that deposited on the bed. Upstream and downstream of Elk Rock, large alluvial fans formed and considerable amounts of alluvium were placed in temporary storage.
Erosional development of the avalanche deposit has also been influenced by volcanically generated debris flows, the largest of which occurred March 19, 1982, during the initial explosive phase of a domebuilding eruption. This flow integrated drainage from the crater and the Pumice Plain north of the mountain with the North Fork Toutle River and was responsible for the largest peak discharge from the upper North Fork Toutle River since May 18, 1980. Although this flow caused considerable erosion and deposition on the avalanche, it merely accentuated fluvial landforms developed during the preceding winter storms.
Despite these drastic changes in surface morphology, to date only about 5 percent of the original avalanche deposit has been eroded away. This unit is likely to cause persistent sediment management problems.

Sediment Transport
Erosion and Landform Modification at a Low-Level Radioactive Waste Disposal Facility near Sheffield, Illinois
By John R. Gray
Erosion and other processes of landform modification are being studied at a 20-acre low-level radioactive waste disposal site near Sheffield, IL. The primary objective of the study, along with concurrent studies on the saturated and unsaturated ground-water resources at the site, is to develop a data base on site hydrology and surface stability to develop criteria for future waste site selection. The determination of rainfall-runoff and runoff-sediment transport relations, and the comparison of these relations to those obtained from a nearby undisturbed basin, are specific study objectives.
Runoff and sediment discharges are monitored in three watersheds comprising two-thirds of the site area, and in a 2. 7 -acre watershed in undisturbed terrain 0.3 mi south of the site. The effects of slope and land use on infiltration, runoff, and sediment yield are being evaluated at four plots ranging in size from 110 to 118 ft2 , two on the site and two on the undisturbed watershed. Three tipping-bucket and one weighing rain gage record the amount and intensity of precipitation. A micrometeorological station collects data for computing evapotranspiration. Land-surface altitudes are measured periodically at fixed locations onsite to quantify settling and compaction of fill materials. Photographs are taken periodically from reference points to allow visual comparison of vegetative and surficial changes over time. Surveys of ground-cover density are also made as one variable affecting the relation between rainfall and runoff.
Preliminary results indicate that 34.6 inches of precipitation from July 1, 1982, through June 30, 1983, produced 9.1 in. of runoff from the site, compared to 2. 0 in. of runoff from the undisturbed watershed. Evapotranspiration was computed to be 24.0 in. at the site for this period. The balance of 1.5 in. of water infiltrated the subsurface. Peak sediment concentrations of 54,000 milligrams per liter (mg/L) were measured in 1982 compared to 30,000 mg/L in 1981. The reduced concentrations came after erosion
21
control measures were implemented and a 75-percent vegetative cover was established on the site. Site sediment yields are still significantly greater than yields from the undisturbed watershed. A 0. 7-in. rain on July 21, 1982, for example, caused 0.4 ton of sediment per acre to be transported from a 3.26-acre area of the site, whereas no runoff resulted from the same storm at the undisturbed watershed. Analyses of samples for particle-size distributions show that silt- and clay-size particles make up over 95 percent of the sediment load in the site. Slope appears to be a significant factor in the relation of rainfall to runoff and sediment transport in the undisturbed watershed. However, storm sediment yields obtained from plots of different slope on the site suggest that the rainfall-to-runoff and runoff-tosediment transport relations are less dependent on slope than on other factors, such as soil composition and compaction or antecedent soil moisture conditions. Significant differences in runoff between plots and larger gaged watersheds have been observed; a 1.3-in. rain on June 29, 1983, induced 0.16 in. of runoff from the combined gaged site area compared to 0.01 in. of runoff from a site plot with a 14-percent slope. Measurements of sediment deposited in an 84-ft3 stilling basin downstream from a gage indicate that less than 3 percent of total storm sediment discharge is retained in the stilling basin.
More than 110 collapse holes formed on the site from December 1978 through December 1982. Although most collapse holes were less than 10 ft in diameter, two exceeded 20 ft in width, and one was estimated to be 16 ft deep. Over 70 percent of the holes formed along the edges of waste-disposal trenches.
A modified bubble gage measures stage at one station. The device uses a gas purge system to transmit the hydrostatic pressure over an orifice anchored in the hub of a crest-stage gage to a differential-port pressure transducer. The transducer attenuates a regulated voltage from a battery as a function of

pressure differential between its sensing port and atmospheric pressure at its reference port. The voltage is recorded and converted to engineering units of stage by a data logger.
A dekaport divisor system was developed to obtain reliable data on runoff and sediment yields from plots (fig. 8). The system pumps runoff from a
5.3-gallon primary collecting vessel through a 10-port cone splitter housing, a subunit of a USGS cone splitter. The cone splitter housing divides pumpage into 10 equal parts. Discharge from one port is retained in a 55-gallon auxiliary collecting vessel for volumetric measurements and sample collection.
Estimating Long-Term Sediment Discharge-Which Method to Use?
By Thomas H. Yorke
The accuracy of various methods for estimating long-term suspended-sediment discharge was evaluated by comparing the discharge measured at a longterm daily sediment station with the discharge estimated by 16 different methods. The flow-duration, suspended-sediment transport curve procedure (Miller, 1951; Colby, 1956) was used as the basis for all the methods; the differences between the methods were the types of curves, the dependent variable, and how the curves were plotted. The types of curves included a single annual curve, two seasonal curves (dormant and growing seasons), and three size-fraction curves (sand, silt, and clay). Relations between sediment concentration, sediment discharge, and water discharge were developed for each type of curve. The curves were computed as straight lines by a least-squares regression and hand drawn through average sediment-concentration or sediment-discharge values within specified water discharge intervals.
Daily suspended-sediment discharge records for the Schuylkill River at Manayunk, Penn., were used as the base information for the analyses. The river drains 1,810 mi2 and traverses three physiographic provinces. Land uses range from anthracite mining in forested mountains in the headwaters to extensive agriculture and industrial cities in the middle and lower basin. More than 9. 9 million tons of suspended sediment was discharged by the river from 1954 to 1979; annual sediment discharges ranged from 107,000 tons in 1966 to 996,000 tons in 1972. The sediment was 6 percent sand size, 54 percent silt size, and 40 percent clay size particles.
Major floods have a significant effect on the longterm sediment-discharge characteristics of the river; the highest annual sediment discharges from
22
1954 to 1979 occurred in 1955 and 1972, when floods generated by Hurricanes Connie and Diane in 1955 and Hurricane Agnes in 1972 transported most of the annual sediment load. During the 26-year period, 25 percent of suspended-sediment discharge was transported in 11 days or 0.12 percent of the time; 50 percent was transported in 56 days or 0.59 percent of the time.
Only the 86 samples collected for particle-size determinations from 1954 to 1979 were used in the analyses. The water discharge at that time of sampling ranged from 1,800 to 73,600 ft3/s. The correlation coefficient and standard error of estimate of the relations between water discharge and concentrations of sediment, sand size, silt size, and clay size particles are indicated in table 5. Generally, the relations between sediment and water discharge and clay size particles and water discharge are better (lower standard error) than the relations between sand size particles and water discharge and silt size particles and water discharge. Also, the growingseason relations are as good as or better than either the dormant-season or annual relations.
The average annual suspended-sediment discharge estimated by the 16 different methods ranged from 395,000 to 499,000 t/yr (table 6) compared to the measured average discharge of382,000 t/yr. The mean discharge estimated by the 16 methods was 432,000 t/yr and the standard deviation was 29,000 t/yr. The mean for the eight regression methods was 452,000 t/yr and the mean for the eight group-average methods was 412,000 t/yr; the standard deviations were 26,000 and 14,000 t/yr, respectively.
The positive bias of the estimates probably is caused by the use of only samples collected for particle-size determinations. These samples normally

FROM PUMP\
DISCHARGE HOSE TO TEN-PORT CONE-SPLITTER
GAGE SHELTER
TEN-PORT CONE-SPLITTER
AUXILIARY COLLECTING VESSEL
SAMPLE TUBE
SECONDARY COLLECTING VESSEL
EX PORT
PRIMARY COLLECTING VESSEL
FIGURE 8.-Dekaport divisor system.
23
INTAKE PORT (CONNECT TO HOSE FROM PUMP)
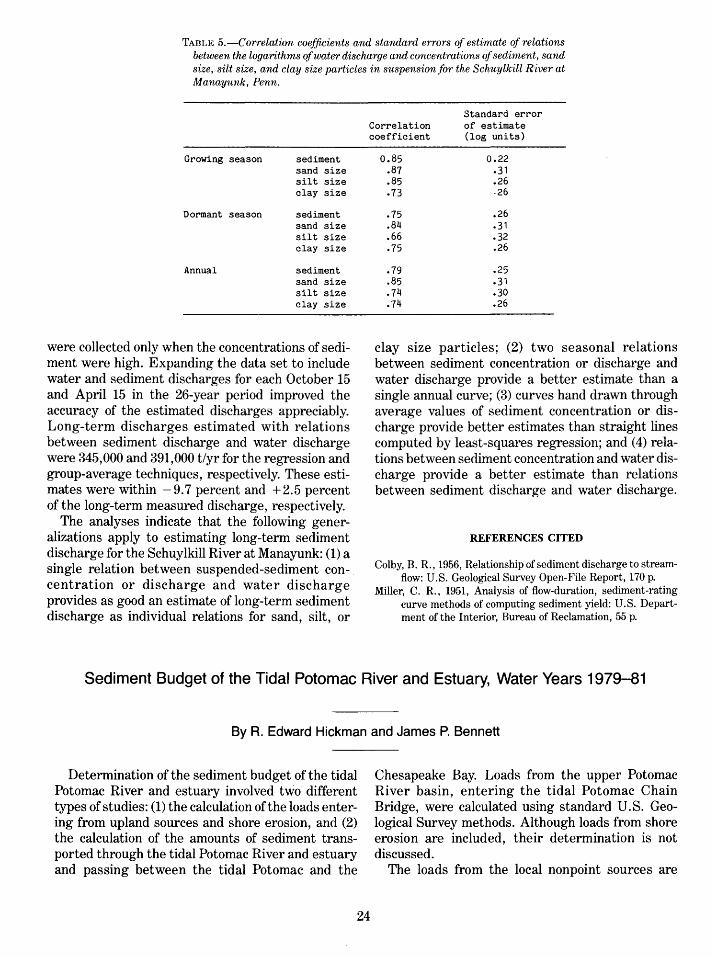
TABLE 5.-Correlation coefficients and standard errors of estimate of relations between the logarithms of water discharge and concentrations of sediment, sand size, silt size, and clay size particles in suspension for the Schuylkill River at Manayunk, Penn.
Growing season sediment sand size silt size clay size
Dormant season sediment sand size silt size clay size
Annual sediment sand size silt size clay size
were collected only when the concentrations of sediment were high. Expanding the data set to include water and sediment discharges for each October 15 and April 15 in the 26-year period improved the accuracy of the estimated discharges appreciably. Long-term discharges estimated with relations between sediment discharge and water discharge were 345,000 and 391,000 t/yr for the regression and group-average techniques, respectively. These estimates were within -9.7 percent and + 2.5 percent of the long-term measured discharge, respectively.
The analyses indicate that the following generalizations apply to estimating long-term sediment discharge for the Schuylkill River at Manayunk: (1) a single relation between suspended-sediment concentration or discharge and water discharge provides as good an estimate of long-term sediment discharge as individual relations for sand, silt, or
Standard error Correlation of estimate coefficient (log units)
0.85 0.22 .87 .31 .85 .26 .73 -26
.75 .26
.84 .31
.66 .32
.75 .26
.79 .25
.85 .31
.74 .30
.74 .26
clay size particles; (2) two seasonal relations between sediment concentration or discharge and water discharge provide a better estimate than a single annual curve; (3) curves hand drawn through average values of sediment concentration or discharge provide better estimates than straight lines computed by least-squares regression; and ( 4) relations between sediment concentration and water discharge provide a better estimate than relations between sediment discharge and water discharge.
REFERENCES CITED
Colby, B. R., 1956, Relationship of sediment discharge to streamflow: U.S. Geological Survey Open-File Report, 170 p.
Miller, C. R., 1951, Analysis of flow-duration, sediment-rating curve methods of computing sediment yield: U.S. Department of the Interior, Bureau of Reclamation, 55 p.
Sediment Budget of the Tidal Potomac River and Estuary, Water Years 1979-81
By R. Edward Hickman and James P. Bennett
Determination of the sediment budget of the tidal Potomac River and estuary involved two different types of studies: (1) the calculation of the loads entering from upland sources and shore erosion, and (2) the calculation of the amounts of sediment transported through the tidal Potomac River and estuary and passing between the tidal Potomac and the
24
Chesapeake Bay. Loads from the upper Potomac River basin, entering the tidal Potomac Chain Bridge, were calculated using standard U.S. Geological Survey methods. Although loads from shore erosion are included, their determination is not discussed.
The loads from the local nonpoint sources are
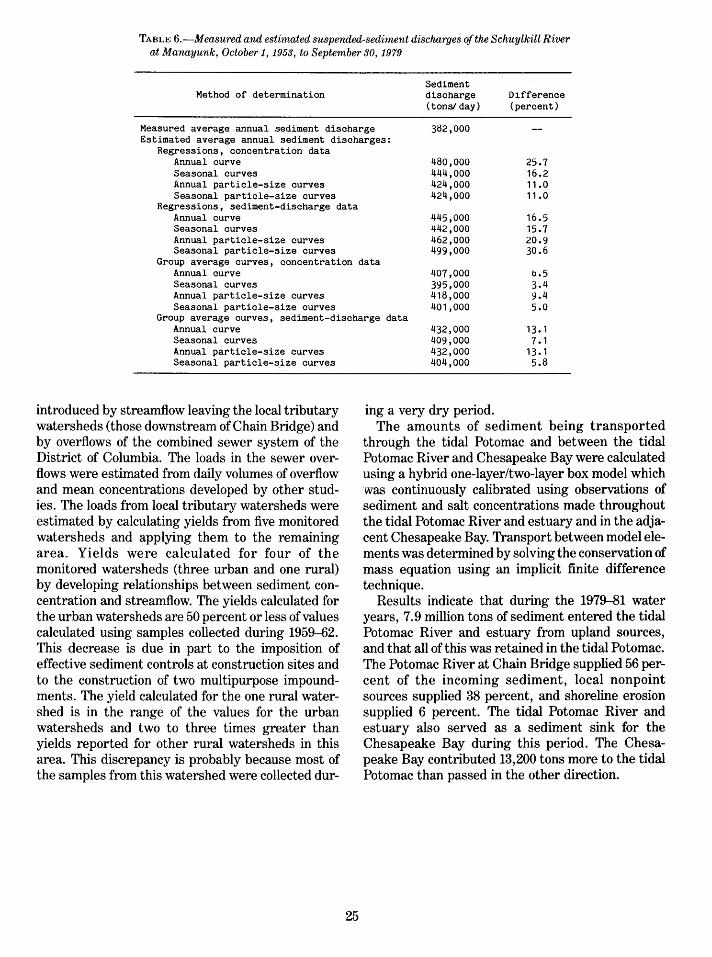
TABLE 6.-M easured and estimated suspended-sediment discharges of the Schuylkill River at Manayunk, October 1, 1953, to September 30, 1979
Method of determination Sediment discharge (tons/ day)
Difference (percent)
Measured average annual sediment discharge Estimated average annual sediment discharges:
382,000
Regressions, concentration data Annual curve Seasonal curves Annual particle-size curves Seasonal particle-size curves
Regressions, sediment-discharge data Annual curve Seasonal curves Annual particle-size curves Seasonal particle-size curves
480,000 444,000 424,000 424,000
445,000 Ll42,000 462,000 499,000
25.7 16.2 11.0 11.0
16.5 15.7 20.9 30.6
Group average curves, concentration data Annual curve LI07,000
395,000 418,000 401 ,000
b.5 3.LI 9.4 5.0
Seasonal curves Annual particle-size curves Seasonal particle-size curves
Group average curves, sediment-discharge data Annual curve 432,000
409,000 432,000 404,000
13.1 7.1
13.1 5.8
Seasonal curves Annual particle-size curves Seasonal particle-size curves
introduced by streamflow leaving the local tributary watersheds (those downstream of Chain Bridge) and by overflows of the combined sewer system of the District of Columbia. The loads in the sewer overflows were estimated from daily volumes of overflow and mean concentrations developed by other studies. The loads from local tributary watersheds were estimated by calculating yields from five monitored watersheds and applying them to the remaining area. Yields were calculated for four of the monitored watersheds (three urban and one rural) by developing relationships between sediment concentration and streamflow. The yields calculated for the urban watersheds are 50 percent or less of values calculated using samples collected during 1959-62. This decrease is due in part to the imposition of effective sediment controls at construction sites and to the construction of two multipurpose impoundments. The yield calculated for the one rural watershed is in the range of the values for the urban watersheds and two to three times greater than yields reported for other rural watersheds in this area. This discrepancy is probably because most of the samples from this watershed were collected dur-
25
ing a very dry period. The amounts of sediment being transported
through the tidal Potomac and between the tidal Potomac River and Chesapeake Bay were calculated using a hybrid one-layer/two-layer box model which was continuously calibrated using observations of sediment and salt concentrations made throughout the tidal Potomac River and estuary and in the adjacent Chesapeake Bay. Transport between model elements was determined by solving the conservation of mass equation using an implicit finite difference technique.
Results indicate that during the 1979--81 water years, 7.9 million tons of sediment entered the tidal Potomac River and estuary from upland sources, and that all of this was retained in the tidal Potomac. The Potomac River at Chain Bridge supplied 56 percent of the incoming sediment, local nonpoint sources supplied 38 percent, and shoreline erosion supplied 6 percent. The tidal Potomac River and estuary also served as a sediment sink for the Chesapeake Bay during this period. The Chesapeake Bay contributed 13,200 tons more to the tidal Potomac than passed in the other direction.

Effects of the Proposed Cooper River Rediversion on Sedimentation in Charleston Harbor, South Carolina
By Glenn G. Patterson
The rates of sedimentation and of resultant maintenance dredging in Charleston Harbor increased dramatically in the 1940s, following two major modifications to the harbor. One modification was deepening the navigation channels from 30 to 35 feet below mean low water; the other was the Santee-Cooper diversion project, which added an average of 15,000 ft3/s of Santee River water to the Cooper River, increasing by many times the freshwater inflow to the harbor. The diversion brought additional sediment into the harbor and made the harbor a more efficient sediment trap by inducing a landward flow of salty water along the harbor floor. In 1966, plans were made to redivert most of the Santee River water back to its former channel, in order to reduce the rate of sedimentation in the harbor.
The purpose of this investigation was to use existing information to determine the probable effectiveness of the proposed rediversion in reducing rates of sedimentation and maintenance dredging in the harbor. The approach was to estimate a sediment budget for the harbor and then estimate the effect of rediversion on the sediment budget.
Major sources of sediment include erosion from the bed and banks of the upper Cooper River and sediment that originates in the Santee River basin and passes Pinopolis Dam with the diverted water. A
number of minor sources, not directly affected by the diversion, contribute additional sediment.
Between 1942 and 1953 most of the sediment that was dredged from the navigation channels returned to the harbor, resulting in a rapid rate of sedimentation on the harbor floor. Improvements in dredging and spoil disposal methods reduced the rate of runback of dredged sediment after 1953 to an estimated 22 percent, but the rate of maintenance dredging has remained high (about 7 million cubic yards per year)-higher than can be accounted for by known sediment inputs. Inflow from the ocean by bottom currents may provide some of the additional sediment.
Rediversion should reduce sediment loads in the Cooper River and diminish the sediment-trapping landward bottom current. The rate of maintenance dredging that will be needed following rediversion cannot be precisely estimated because of the uncertainties in the sediment budget, but it will probably be 40 to 75 percent less than the average during the period 1966--82. The reduction in the rate of maintenance dredging may be delayed by a decade or more by the need to remove previously accumulated sediment and may be partially offset by the effects of future channel deepening.
Sediment Chemistry
Determination of Lake Sedimentation Rates by Lead-21 0 and Cesium-137
By I. C. Yang
The natural and artificial radionuclides of 210Pb and 137Cs have been used widely for the determination of sedimentation rate in lakes, estuaries, and coastal regions. As 210Pb has a half-life of 22.26 years, it is possible to date the sediment age up to 150 years. The 210Pb method used for determining
26
sedimentation rates is based on the occurrence of excess 210Pb, a member of the 238U decay series. There is a continuous escape of 222Rn from the lithosphere and hydrosphere to the atmosphere, where it decays with a 3.8-day half-life and transforms into 210Pb through four short-lived daughters.

The 210Pb is rapidly removed from the atmosphere by wet precipitation or dry fallout and provides a measurable flux to the earth's surface at a rate of approximately 3.2 to 6.5 disintegrations per minute per square inch per year (210Pb/in.2/yr) depending on the location. From the water column, it is scavenged to the bottom sediments. There are three assumptions involved: (1) the influx of 210Pb to the sediment-water interface remains constant; (2) the sedimentation rate remains constant; and (3) no independent migration of 210Pb occurs once deposited. These assumptions have been verified by many authors (Koid and others, 1972; Thompson and others, 1975; Eakins and others, 1978).
Cesium-137, with a 30-year half-life, was produced in the atmosphere as the result of nuclear weapon tests from 1952 to 1954, and more extensively in 1963. The residence time of this nuclide in the air and water column is less than 1 year. Therefore, an appearance of 137Cs activity in the sediment column would indicate the onset of nuclear testing in 1952, and the maximum activity would correspond to the year 1963; activity would subsequently decrease to the present time.
There are three methods used to measure 210Pb activity: (1) the gamma method, which is direct counting of sediment for the 46-ke V gamma activity from 210Pb by a Ge(Li) detector; (2) the beta method, which is separation of Pb from other radionuclides by ion-exchange columns, precipitation as PbCr03 ,
aging to ingrow the 210Bi daughter from 210Pb decay, and counting 210Bi beta particles on a low-beta gas proportional counter; and (3) the alpha method, which is chemical separation of 210Pb on a silver disk and counting 210Pb alpha particles by alpha spectrometer. The last two methods are capable of high sensitivity with gram-size samples, although
many processing steps are involved, and a longer ingrowth time of daughter radioactivity is required. The first method is simple and fast, but less accurate than the others and requires large samples.
Lake sediment cores from the Scofield Reservoir in Utah and the Lahontan Reservoir in Nevada have been dated by the 210Pb and 137Cs methods. The results from the Scofield Reservoir indicate that the top 4 in. of sediment yields excess 210Pb activity of 30 picocuries per ounce (pCiloz) dry weight, decreasing to 7 /pCiloz at a depth of 30 in. The sedimentation rate was approximately 0.19 in./yr, comparable to the value of 0.22 in./yr obtained independently by the 137Cs method. The Scofield Reservoir has a bottom sediment thickness of 11.8 in., which corresponds to a lake history of approximately 60 years.
At the Lahontan Reservoir, excess 210Pb activity profiles showed an inverse curve in the surface layer due to inverse sedimentation, probably caused by filter-feeding organisms. The excess 210Pb activity in the top 3.3 in. was 23 pCiloz and increased to 31 pCil oz between 3.3 and 6. 7 in. depth. Thereafter the activity gradually decreased to 15 pCi!oz at a depth of 18.5 in. The sedimentation rate was about 0.4 in./ yr compared to 137Cs-derived values of 0.5 in./yr.
REFERENCES CITED
Eakins, J. D., and Morrison, R. T., 1978, A new procedure for the determination of 21opb in lake and marine sediments: International Journal of Applied Radiation Isotopes, v. 29, p. 531-536.
Koide, M., Soutar, A., and Goldberg, E. D., 1972, Marine geochemistry with 210Pb: Earth and Planetary Science Letters, v. 14, p. 442.
Thompson, J., Turekin, K. K., and McCaffrey, R. J., 1975, The accumulation of metals in and release from sediments of the Long Island Sound, in Cronin, L. E., ed., Estuarine research, vol. 1: New York, Academic Press, p. 28.
Inorganic Partitioning in Sediments
By Arthur J. Horowitz
Historically, the Water Resources Division (WRD), as the name implies, has concentrated much of its water-quality efforts on the analysis of dissolved constituents. As a result, water quality tends to be evaluated on the basis of the kinds and concentrations of the various inorganic constituents found in solution. However, in most aquatic systems,
27
sediment (both suspended and bottom) contains many times the concentration of certain inorganic constituents than are dissolved in the water column. The strong association of numerous elements and compounds (arsenic, mercury, cadmium, lead, zinc, and others) with sedimentary material means that much of the distribution, transport, and availability
of inorganic constituents in a given hydrologic system cannot be detected or evaluated solely through the sampling and analysis of water. Further, sediment can be viewed as a chemical reservoir that may, under certain physicochemical conditions, release chemicals into the water column or otherwise enter the food chain. Finally, several inorganic constituents can degrade or react with other constituents to form soluble and possibly more toxic forms (for example, the conversion of mercury to methyl mercury). Therefore, a comprehensive picture of water quality, which adequately describes the distribution, transport, and availability of inorganic constituents, requires chemical data on sediments.
At the present time, the WRD lacks the capabilities, and the requisite field and laboratory procedures, to determine both the total (true) concentration of inorganic constituents, and their partitioning, in sediment. The term "total" means the actual concentration of a constituent in the sense of a series of analyses which yield results equal to 100 percent and should not be confused with the term "totally recoverable." Partitioning involves both a physical and a chemical separation. The physical aspect refers to the analysis of various size fractions (such as sand, silt, clay sizes) or specific gravity fractions in order to ascertain constituent distribu-
tion within a particular sample and to facilitate intersample comparisons or to more readily ascertain spatial trends. The chemical aspect refers to the determination of the associations of in organics with other materials within a sample (such as humic acids, carbonates, ferromanganese oxides) and to the type of association (adsorption, complexation, substitution, and others). From these types of data, it may be possible to begin to identify sources and sinks, or the fate and possible effects of potentially toxic or environmentally necessary inorganic constituents. Similarly, such data will help in transport modeling, for estimating cycling rates, and for determining the availability of inorganics to ecological systems.
A project to develop the procedures and techniques for dealing with inorganic-sediment associations has been established. Initial objectives include (1) adapting or developing methods for the determination of total concentrations in sediment for routine use in the WRD Central Laboratory System, (2) developing a size-fractionation method that does not alter chemistry, and selecting appropriate size ranges for routine analysis, (3) adapting or developing methods for inorganic-sediment chemical partitioning, and (4) providing guidelines on the use and interpretation of data generated by these methods.
Transport of Suspended Sediment and Associated Chemical Constituents in the Lower Mississippi River, Louisiana
By Charles R. Demas and Philip B. Curwick
Suspended sediment transported by the lower Mississippi River is viewed both as a burden and an asset by the State of Louisiana. Sediment deposition and bed movement pose a constant navigational threat and mean millions of maintenance dollars spent each year on dredging. Further, diversion of sediment-laden Mississippi River water and sediment control measures in the Mississippi River Basin have accelerated the rate of erosion of the State's coastal wetlands and shoreline. Coastal erosion has enormous economic repercussions to the State by affecting offshore oil revenues and influencing the productivity of its vast nearshore fisheries. The State could, however, use sediment-laden Mississippi River water to maintain and reclaim coastal wetland area.
28
For this reason, the Louisiana District of the U.S. Geological Survey entered into a cooperative agreement with the State of Louisiana to perform a 4-year study to characterize suspended-sediment movement and attached chemical load of the lower Mississippi River from Tarbert Landing to Venice, La. (296 river miles). The specific objectives of the study are (1) to identify areas where suspended sediment and associated chemical load are deposited or resuspended with respect to variations in streamflow and suspended-sediment loads at the upstream boundary; (2) to determine selected chemical constituent loads in relation to suspended-sediment concentrations, particle size, and water discharge and relate them to bed sediment; and (3) to develop and test a one-dimensional numerical sediment trans-

port model and use it to predict sediment and chemicalloads for the study reach.
Suspended sediment, bottom material, and attached chemical constituents will be sampled during several different rises in river stage during the course of the study. Suspended sediment will also be collected on a monthly basis. Instantaneous discharge measurements will be made concurrently with each sampling trip at selected sites. All suspended-sediment samples will be depth integrated at five or more equal discharge increments in a cross section. Suspended-sediment and water-quality
samples will be collected using a P-63 point sampler . and a bag sampler. Bottom material will be collected with a Teflon-coated Shipek grab sampler. Data collection and site selection will be optimized with the aid of a numerical unsteady flow model and a onedimensional numerical sediment transport model. Fathometer tracings and continuous stage data will be collected at several sites to help calibrate the models. Suspended sediment and bottom material will be characterized according to particle size and associated chemical constituents.
Suspended Sediment: Transport and Chemistry of Organic Carbon
By E. Michael Thurman
Suspended sediment transports 50 percent of the total organic carbon to the ocean, an important part of the global carbon cycle. Suspended or particulate organic carbon (SOC and POC) varies in concentration from micrograms per liter to milligrams per liter, depending on the type of river (Meybeck, 1981). The concentration of suspended organic carbon follows the river continuum concept (Vannote and others, 1980); that is, concentrations are least in first- and second-order streams and increase downstream and with higher stream order.
Suspended organic carbon consists of living biomass, detritus, and organic coatings on silt and clay. The importance of each of these sources varies with river and season. Small streams and rivers contain organic carbon of allochthonous origin, that is, from outside the riverine system. Large rivers have an autochthonous input from algae and aquatic organisms. The amount of autochthonous input is greatest in summer and fall and least in winter.
The proportion of organic carbon in suspended sediment ranges from 0.5 to 40 percent. The least is found in rivers with greatest discharge, and the most is found in slow-moving rivers that drain wetlands and swamps. Thus, the concentration of SOC for all world rivers varies inversely with the concentration of suspended sediment (Meybeck, 1981). Because higher erosional rates dilute SOC and reduce primary production, SOC is less with higher suspended sediment; however, within a river system, SOC varies directly with suspended sediment in a log-log fashion (Nordin and Meade, 1981). That is, increased
29
discharge increases the concentration of suspended sediment, which increases SOC. This increased SOC usually peaks ahead of dissolved organic carbon and discharge.
SOC has a longer residence time in rivers than dissolved organic carbon (DOC) has. Because sediment may exist for tens of years in streams to tens of thousands of years in flood plains of major rivers, SOC undergoes biological and chemical degradation over a much longer period than does DOC. The C/N ratio in suspended sediment is 10:1, which means that suspended sediment is considerably enriched in nitrogen compared to surrounding soils with a 25:1 C/N ratio (Malcolm and Durum, 1976). Because suspended sediment concentrates nitrogen by ion exchange and also consists of coatings of living biomass, it is enriched in organic nitrogen compounds. This makes it a good substrate for bacteria, which colonize its surfaces.
Bacteria attach themselves by pili (thread-like organs) and act as "microbial factories'' degrading organic matter aerobically in the suspended state. Here carbon dioxide and water are major products, and suspended organic carbon is converted to inorganic carbon. However, once sediment is deposited, oxygen may be depleted in interstitial waters. The bacterial community changes to anaerobic organisms, which convert POC to organic acids, methane, and carbon dioxide. This is characteristic of interstitial waters of sediment, where DOC increases to 50 to 500 mg C/L (Thurman, 1985).
Suspended organic carbon on sediment behaves as

an adsorbent for organic pollutants. It is well established that the percent organic carbon is a good prediction of equilibrium constants of organics (Schwarzenbach and Westall, 1981). Thus, sediment concentrates the least soluble of organic compounds, such as contaminants, and acts as a sink to store these contaminants in the flood plain of the river.
REFERENCES CITED
Malcolm, R. L., and Durum, W. H., 1976, Organic carbon and nitrogen concentrations and annual organic carbon load of six selected rivers of the United States: U.S. Geological Survey Water-Supply Paper 1817-F, 21 p.
Meybeck, M., 1981, River transport of organic carbon to the ocean, in [Report of a workshop] Flux of organic carbon by
rivers to the oceans: NTIS Report CONF-8009140, VC-11, p. 219-269.
Nordin, C. F., and Meade, R. H., 1981, The flux of organic carbon to the oceans; Some hydrological considerations, in [Report of a workshop] Flux of organic carbon by rivers to the oceans: NTIS Report CONG-8009140, VC-11, p. 173-218.
Schwarzenbach, R. P., and Westall, J., 1981, Transport of nonpolar organic compounds from surface water to groundwater; Laboratory sorption studies: Environmental Science and Technology, v. 15, p. 1360-1367.
Thurman, E. M., 1985, Organic carbon in water, chapter 2 in Organic geochemistry of natural waters: The Hague, Martinus Nijhoff-Dr. Junk, p. 497.
Vannote, R. L., Minshall, G. W., Cummins, K. W., Sedell, J. R., and Cushing, C. E., 1980, The river continuum concept: Canadian Journal of Fisheries and Aquatic Sciences, v. 37, p. 130-137.
Channel Morphology
Sediment Impacts from Coal Mining, Northeast Tennessee
By WaiteR. Osterkamp, William P. Carey, and Cliff R. Hupp
Extensive data, including water and sediment discharges, channel morphologies, bed- and bankmaterial characteristics, and botanical evidence of flow events, have been collected since 1981 from the Smoky Creek, Crabapple Creek, and Louse Creek basins, northeast Tennessee. Most basins of the area have been heavily impacted by coal-mining activities.
Crabapple Creek and Louse Creek drain adjacent basins of 1.1 and 4.4 mi2 , respectively. By 1981 about 7 percent of the Louse Creek basin had been disturbed by surface mining, much of it having occurred prior to 1971. The Crabapple Creek basin has remained relatively undisturbed since lumbering prior to World War II. Preliminary data from the Crabapple Creek basin indicate annual suspendedsediment yields of less than 86 t/mi2 , whereas casual observations suggest substantially higher yields from the Louse Creek basin. Marked differences between the two basins are also apparent in channel characteristics, particularly morphology. Crabapple Creek has a relatively stable, well-armored channel 26ft wide that is closely lined by a mature population of trees and shrubs. Analyses of coal content in bank material for the period 1981 to 1983 averaged less
30
than 1 percent, suggesting little fluvial transport and deposition of coal. In contrast, Louse Creek has a 69-ft-wide anabranching channel with numerous gravel and cobble bars that are being stabilized by sycamores and alders. Most of these trees are less than 25 years old, and suggest stabilizing channel conditions following deposition of coarse material and channel widening during mining. Coal content of bank-material samples from along Louse Creek averages 2.3 percent. Along channels below active coal mining, coal content often ranges from 5 to 10 percent.
Smoky Creek drains a basin of about 31 mi2 .
Upper Smoky Creek and major tributaries have high-gradient, subalpine channels that are generally either well armored or formed on bedrock. The stream valley is progressively more alluvial in the downstream direction, having bottom-land widths up to 820ft near the confluence of Smoky Creek with the New River. Extensive strip mining began in the basin about 1940 and has continued with varying intensity to the present. Since 1978 the annual suspended-sediment yield measured at Smoky Creek at Hembree, in the central part of the basin, has averaged about 2,280 t/mi2 • Over 90 percent of the sus-

pended sediment is in the silt-clay size range. Yield data from Smoky Creek above Hembree, about 2.5 mi upstream from the Hembree gage and with a drainage area of 8.1 mi2 , are not available, but suspended-sediment concentrations during peak discharges appear to be greater than at Hembree.
Channel-morphology data are being collected from nine monumented sections in the Smoky Creek basin and are supplemented with stratigraphic and botanical observations in the central part of the basin. Preliminary results indicate a general sequence of (1) channel widening and aggradation by movement of coarse bed material in the upper reaches of the drainage net below active mining; (2) eventual movement of the bed material into the upper and central parts of the Smoky Creek channel, the coarsest sizes being the least mobile; (3) incisement of recent deposits, channel narrowing, and reestablishment of woody vegetation along upland reaches following cessation of mining; and ( 4) continuing bank erosion, possible channel widening, aggradation, and reworking of mobile bed material as it is transported downstream during high-flow
events. Upland areas above Bills Branch near Hembree (drainage area of 0.66 mi2), for example, were mined principally in 1975. Parts of Bills Branch channel, which was mostly cut into bedrock, apparently had substantial aggradation. Recent cross-section measurements indicate that much of the previously deposited debris has been incised and transported downstream, and degradation of remaining coarse alluvium is continuing. At Smoky Creek above Hembree, similar measurements show recent aggradation, presumably by deposition of material derived from tributary basins such as that of Bills Branch. Section data, stratigraphic evidence, and botanical observations at Smoky Creek at Hembree and along lower reaches show that in recent years substantial bank erosion has occurred. At a site 0. 6 mi. downstream from the Smoky Creek at Hembree gage, botanical evidence shows that flow events deposited 30 and 3 in. of debris, respectively, in 1977 and 1983 (fig. 9). During the last 25 years there has been at least 72 ft of lateral channel migration and accompanying bank erosion at the same site.
Unit Hydraulic Geometry-An Indicator of Channel Changes
By Rhea P. Williams
Water-discharge and sediment-transport data collected at selected sites and surveyed river reaches in the western United States were used to evaluate hydraulic variables of the energy equation to evaluate channel changes at stream sections. The coefficients and exponents of hydraulic-geometry relations were based on unit discharge rather than on total discharge. Unit hydraulic geometry has greater application to defining channel changes than conventional analysis. The unit hydraulic-geometry relations were used to infer sectional competence of coarse-sediment discharge and expected channel
31
changes and to define quasi-equilibrium of nearbankfull streams.
Results of this study suggest that long-term projections of coarse-sediment transport initially involved an evaluation of past hydraulic changes in the stream reach. Although the primary analysis used streamflow measurements, slope-area techniques can be used to analyze ungaged reaches. The methods described are applicable to a broad range of stream conditions and provide techniques for evaluating natural changes and cultural influence on stream reaches.

C>
a
SMOKY CREEK POINT BAR SYCAMORE
IN 1983
0 0 0
FIGURE 9.-Diagram summarizing the use of botanical evidence to date recent flow events along Smoky Creek, northeast Tennessee.
Channel Adjustment to Man-Induced Stress in West Tennessee
By Andrew Simon and Clarence H. Robbins
Alluvial stream channels are dynamic geomorphic systems that are continuously adjusting to altered energy inputs. In west Tennessee, channel modifications have caused drastic channel adjustments in
32
plan and profile. More specifically, these modifications in conjunction with land-use practices have led to accelerated downcutting and headward degradation, downstream aggradation, accelerated scour,
and bank instabilities. Channel straightening creates a steepened profile and thus a heightened energy condition within the channel. Channel responses to this induced stress are, therefore, similar in type but greater in magnitude than those changes caused by dredging or clearing.
Large-scale channel instabilities and adjustments are apparent in the Obion River and the South Fork Forked Deer River whereas the nonchannelized Hatchie River, flowing through similar deposits, continues to exhibit characteristics of stability.
Channel slope, defined as the primary dependent variable (Mackin, 1948), proved to be a sensitive and descriptive parameter essential in determining channel adjustment. Although channel slope is generally considered to be one of the most difficult hydraulic variables to define, the rejuvenated fluvial systems of west Tennessee manifest readily measurable variations.
Adjustments in profile to man-induced slope
increases are described by inverse exponential functions of the basic form S = ae-bt where S is some function of channel slope, tis the number of years since the completion of channel work, and a and b are coefficients unique to the reach. These equations define response times for particular reaches or for entire rivers.
The length of time required to attain some quasiequilibrium condition is a function of the magnitude and extent of the imposed disturbance. The adjusted profiles are similar to the predisturbed profile gradients where no alteration to channel length took place. Where channels were straightened by constructing cutoffs, slope adjustments trended toward a profile with lower gradients.
REFERENCE CITED
Mackin, J. H., 1948, Concept of the graded river: Geological Society of America Bulletin, v. 59, p. 463-511.
Contrast in Stream Channel Response to Major StormsExamples from Two Mountainous Areas in California
By K. Michael Nolan and Donna C. Marron
Studies in two mountainous areas of California illustrate basic differences in the effects of major flood events on the morphology of stream channels. Widespread catastrophic storm effects in northwestern California contrast with localized stormrelated effects in the Santa Cruz Mountains of westcentral California.
Major storms in northwestern California trigger widespread debris sliding along inherently unstable colluvial streambanks. Streamside failure is particularly widespread in this area because of positive feedback effects between physical processes (fig. 10). These effects are responsible for triggering additionallandsliding downstream of initial failure sites. The massive amount of colluvium deposited in these gravel-bed channels by landslide activity overwhelms the sediment transport capacities of channels and results in massive channel aggradation and major increases in channel width throughout entire drainage basins. The effects of these large volumes of colluvium on channel geometry are exacerbated
33
by persistent mass movement processes, such as creep and earthflow, that supply sediment to highorder channel on an annual basis. Widespread channel changes resulting from recent storms in northwestern California have lasted for decades and may last for decades longer.
In contrast, major channel changes associated with storms in the Santa Cruz Mountains occur only locally. Most storm-related channel changes are no more severe than those associated with moderate events. Catastrophic channel changes are limited to localized areas with exceptional mass movement in the form of debris flows and debris avalanches that are triggered by high pore water pressures caused by locally intense precipitation. The moderate volumes of colluvium introduced elsewhere are transported with little affect on channel geometry because much of the colluvium is characterized by relatively small grain sizes (sand), because channel gradients are generally steep, and because channels usually do not contain large quantities of alluvium

.. - LANDSLIDE
,, , AGGRADA- ..__..1'-- LANDSLIDE
DAM OR TION r- DEBRIS JAM
,, n
STREAM DEFLEC
TION
...
-
BANK EROSION
'----------"'1 LANDSLIDE ---
,, DEBRIS
FAN
,, GULLYING
FIGURE 10.-Schematic representation of positive feedback between physical processes in northwestern California (after Colman, 1973).
prior to major storms. The relatively coherent bedrock found in the area limits streambank erosion. Streamside failure due to undercutting is therefore relatively limited, and the positive feedback found between hillslope and stream channel processes in northwestern California does not occur to any great extent in the Santa Cruz Mountains. Major channel changes associated with storm events are therefore limited to localized areas that receive maximum precipitation intensities.
The contrast in channel response in the two study areas is the result of interactions between naturally occurring physical processes operating in the respective areas. Although cultural activity may cause the impacts of any given storm event to be disproportionately large, these activities do not
34
alter basic process interactions. A more delicate balance exists between processes in northwestern California than in the Santa Cruz Mountains. This suggests that it would be easier for cultural activities to cause storms to have disproportionately large impacts on stream channels in northwestern California than in the Santa Cruz Mountains.
The contrast in channel response occurs despite a similarity in the magnitude and frequency of sediment transport in both areas. The effectiveness of flood events in shaping channel morphology in these mountainous areas is therefore independent of the magnitude and fre.quency of sediment transport and is best judged on the basis of impact duration. Channel morphology present in most stream reaches at any given time in northwestern California reflects the effects of individual storms and the length of time available for moderate post-flood flows to modify flood effects. In contrast, channel morphology in the Santa Cruz Mountains reflects the effects of both moderate and extreme flow events. Where overwhelming volumes of sediment have been introduced to channels during previous storms, channels tend to flow through alluvial channels that are relatively wide and fiat. Elsewhere, channels tend to be Vshaped and relatively steep, and presumably reflect effects of moderate events at least as much as effects of extreme events. Since the localized effects generated by any one storm can persist longer than the recurrence interval of the storm itself, channel morphology throughout the area probably reflects the effects of multiple storms.
The key to understanding why persistent stormrelated effects in northwestern California are more widespread than those in the Santa Cruz Mountains lies in identifying the physical processes operating on hillslopes and stream channels in each area, as well as assessing how these processes interact. Study of this interaction not only provides information describing the effects of major floods on the morphology of stream channels, but also provides information on the role of various hydrologic events in shaping general basin morphology.
REFERENCE CITED
Colman, S.M., 1973, The history of mass movement processes in the Redwood Creek basin, Humboldt County, California: paper presented in lieu of M.S. Thesis, University Park, Pennsylvania State University, 180 p.

Effects of Dam Construction on Channel Geometry and Bed Material in Bear Creek,
Denver, Colorado
By R. F. Hadley and W. W. Emmett
The objective of the study is to determine the downstream effects on channel geometry and characteristics of bed material caused by construction of a flood-control dam and reservoir on Bear Creek near Denver, Colo. This is a "backyard" project that requires 2 or 3 days a year in the field for surveys, data collection, and analysis.
Bear Creek originates on Mount Evans along the Continental Divide, west of Denver, and flows eastward out of the mountains onto the plains where it joins the South Platte River in the Denver metropolitan area. The drainage area of Bear Creek is approximately 260 mi2 ~ most of which lies in the mountains. There are two streamflow gaging stations on Bear Creek with more than 50 years of record. One is at Morrison where the stream leaves the mountains, and the second is at Sheridan near the mouth. The mean annual flow at Morrison is 53 ft3/s and is 38.8 ft3/s near the mouth. Before the flood-control dam was constructed, there was generally a snowmelt peak in the spring and occasional flood peaks from summer thunderstorms.
The channel was relatively unregulated before 1979 except for diversion of flows for irrigation of about 12,000 acres. In July 1979, a flood-control dam constructed by the U.S. Army Corps of Engineers near Morrison was completed and impoundment of Bear Creek Lake began. Since the closure of the dam, the flow in Bear Creek has been regulated and
peak discharges have been reduced. In March 1977, five cross sections were surveyed
and monumented on Bear Creek in Bear Creek Park between South Lamar Avenue and South Sheridan Boulevard in a reach about 700 feet long. The study reach is about three-fourths mile upstream from the gaging station near the mouth of Bear Creek. The five cross sections have been surveyed three times, twice before the dam was closed in 1977 and 1978 and once after dam closure in 1982. Bankfull width of the five cross sections ranged from 37 to 62 feet and averaged 46.2 feet in 1977 before dam closure. The mean bankfull depth ranged from 1.2 to 2.4 feet and averaged 1.6 feet. In 1982 the bankfull width ranged from 43 to 76 feet and averaged 54.8 feet. The mean bankfull depth ranged from 1.8 to 3.0 feet and averaged 2.5 feet. In the study reach, the gradient has decreased from 0.421 to 0.316 percent. Although the channel has become wider and deeper since the dam closure, the most obvious change is the large increase in depth. Changes in width probably have been restricted by the dense vegetation growth along the banks that confine the flow.
Cross sections 1 and 2 are located in a pool, cross sections 3 and 4 are located on a riffle, and cross section 5 is at the upstream end of a second pool. In 1977 the median diameter of bed material in the pools was 0.48 mm, and the median diameter of bed material on the riffle was 4. 6 mm.
Sediment Storage and Discharge in Steep Unstable Terrain
By Richard J. Janda
Storage of readily erodible sediment in and adjacent to stream channels profoundly influences fluvial sediment discharge, particularly in steep unstable terrain. Most recent hydrologic and geomorphic investigations by the U.S. Geological Survey have emphasized transport processes; storage of sedi-
35
ment, however, is commonly an equally important aspect of long-term movement of sediment drainage basins. Sediment discharge in headwater reaches of humid steepland streams is commonly supply limited, whereas downstream reaches are more likely to be transport limited. The impact of some land-use

changes on sediment discharge and the geomorphic significance of storms of a given magnitude can be properly documented only if changes in storage are considered along with changes in transport. The initial locations, volume, and physical characteristics of stored sediment, and the changes in these parameters while in storage, are all matters of interest (Dietrich and others, 1982). The sedimentation impact of two comparable floods on a river may differ greatly if the recurrence interval of the floods is less than the time required to recharge streamside sediment storage areas.
The volume of temporarily stored modern alluvium along a river is commonly more than ten times its average annual total sediment discharge (Swanson and others, 1982b). Alluvium may be stored in bedforms, behind organic debris or landslide dams, and on bars and flood plains. Sediment discharge and channel characteristics might also be influenced by storage changes associated with streamside outcrops of glacial drift, lahars, colluvium, loess, residual soil, and unconsolidated bedrock as well as modern alluvium. The type and stability of storage are a function of stream order and terrain characteristics; vegetation plays a particularly prominent role. Storage in channels, flood plains, and alluvial fans may delay and attenuate peak downstream delivery of sediment introduced from hillslope disturbances. Conversely, increased peak-water discharge may cause the transport of stored sediment without increased hillslope erosion. Increased water and sediment discharge commonly lead to increased channel width, thereby setting up self-reinforcing (positive) feedback that further accelerates erosion. In fact, changes in channel width generally exert a more profound influence on storage than do changes in bed elevation in mountainous terrain.
Examples of these processes are seen in the Oregon Cascades (Swanson and Fredricksen, 1982; Swanson and others, 1982a), the Coast Ranges of California and Oregon (Janda and others, 1975; Dietrich and Dunne, 1978), and the Mount St. Helens impact area of southwestern Washington (Meyer and Janda, in press).
The Water Resources Division is often asked to assess the immediate and long-term sedimentation impacts of intense storms, changes in land use, and more exotic forms of disturbance. These assess-
36
ments often must be performed in a short time and with limited funds. Nonetheless, before undertaking such projects, one should, as a minimum, assess qualitatively whether the system of interest is supply-limited or transport-limited. Preferably, one should develop in as quantitative terms as practicable a flow chart of the storage or landscape elements of interest and the transport processes that move sediment between elements. This procedure will help identify which storage elements and transport processes most need further documentation. If the system is supply limited, historical observation, time sequential aerial photographs, and stratigraphic techniques may provide more useful information than short-term transport studies.
If we are to develop predictive capabilities, we shall have to make increased use of analytical models. However, existing sediment routing models will have to be improved by making them two-dimensional and by incorporating stochastic as well as deterministic elements within them. Calibration and verification of such models will require carefully selected long-term data sets.
REFERENCES CITED
Dietrich, W. E., and Dunne, T., 1978, Sediment budget for a small catchment in mountainous terrain: Zeitschrift fUr Geomorphologie supplement, v. 29, p. 191-206.
Dietrich, W. E., Dunne, T., Humphrey, N. F., and Reid, L. M., 1982, Construction of sediment budgets for drainage basins: U.S. Forest Service General Technical Report PNW-141, p. 5--23.
Janda, R. J., Nolan, K. M., Harden, D. R., and Colman, S.M., 1975, Watershed conditions in the drainage basin of Redwood Creek, Humboldt County, California, as of1973: U.S. Geological Survey Open-File Report 75-568.
Meyer, D. F., and Janda, R. J., Sedimentation downstream from the 18 May, 1980 North Fork Toutle River debris avalanche deposit, Mount St. Helens, Wash., in Proceeding of the Symposium, Mount St. Helens, 5 years later (in press).
Swanson, R. J., and Fredricksen, R. L., 1982, Sediment routing and budgets: Implications for judging impacts of forestry practices: U.S. Forest Service General Technical Report PNW-141, p. 129-137.
Swanson, R. J., Fredricksen, R. L., and McCorison, F. M., 1982a, Material transfer in a western Oregon forested watershed, in Edmunds, R. L., ed., The natural behavior and response to stress of western coniferous forests: Stoudsburg, Penn., Dowden, Hutchinson, and Ross, p. 233-266.
Swanson, R. J., Janda, R. J., and Dunne, T., 1982b, Summary: Sediment budget and routing studies: U.S. Forest Service General Technical Report PNW-141, p. 157-165.

Bedload
Variability in Measured Bedload Transport During Constant and Slowly Changing Water-Discharge Conditions
By William P. Carey
Cyclic variations in bedload transport under constant water-discharge conditions are an inherent part of the bedload transport process. Although these cyclic variations have been measured extensively in the laboratory, similar information is not available from field measurements. The existing field data sets on cyclic variations generally consist of a small number of samples that yield little information about the nature of transport cycles. Collecting comprehensive field data on these variations is complicated by the restriction of constant or slowly changing water discharge.
The sand-bed channels of western Tennessee are particularly suited to this type of sampling because they tend to hold their peak discharge for periods of up to several days and then recede slowly. During periods of sustained peak discharge, it is assumed that bedload transport has equilibrated with the flow conditions and that measured variability is indicative of the inherent variability in the transport process.
During a 4-day period of slowly changing waterdischarge conditions, four sets of bedload samples were obtained at the same sampling point using the standard 65-pound Helley-Smith bedload sampler. The sample sets consist of 43, 50, 80, and 120 samples. Samples for the three larger sample sets were collected consecutively with approximately 3 minutes between samples. Water discharge was essentially constant during each sample set and varied less than 15 percent for the 4-day period.
Individual measured transport rates exhibit large variations from one sample to the next, as shown in figure 11. These individual rates can be converted to dimensionless rates by dividing each individual in a set by the mean rate for the set. When these dimensionless rates are plotted as cumulative frequency distributions, they show good agreement with the theoretical probability distribution derived for the case of ripples on dunes (fig. 12). As the number of samples increases, the similarity between the sampled and theoretical distributions also increases.
37
FIGURE 11.-Variability of 120 consecutive bedload samples.
LULU ali-...J <{ 90 ...Ja: §o LULU 80 l-Ie:{<{
a:~ 70 00 LU~ > LU 60 a: I m~-~~50 Z...J <{ <{ 40 1-::J <{d ILU ---Theoretical
- - - - - 1 20 consecutive samples
1 3 5 RELATIVE TRANSPORT RATE Qb/Qb
FIGURE 12.-Theoretical and sampled distributions of relative transport rates.

Probability distributions for the 80- and 120-sample sets closely app~oximate the theoretical distribution. This agreement between sampled and theoretical distributions has been verified by many laboratory investigations and by the few field data sets that have a sufficient number of samples.
A plot of measured transport rates versus time for the 120-sample set shows that peak transport rates seem to occur at approximately equal intervals (fig. 11). This cyclical trend is well documented in laboratory studies and has been shown to correspond to the passage of dune bedforms. By applying a smoothing technique to the same data set, these short-term cycles become very distinct and an oscillation appears of much longer term (fig. 13). The smoothing function, shown as the vertical axis of figure 13, is the summation of the individual bedload rates divided by the mean of all bedload rates measured during the period of sampling. This longer term oscillation has also been reported in laboratory studies and may be caused by groups of large and small dunes moving past the sampling point. Information on the frequency and length of bedforms was not obtained during the sampling period.
FIGURE 13.-Variability of 120 consecutive bedload samples after smoothing.
The data collected in this study are believed to constitute one of the most comprehensive sets of field observations on cyclic variability in existence today. These observations confirm the existence of at least two superimposed cycles occurring under conditions of constant or slowly changing water discharge.
Some Characteristics of Fluvial Processes in Rivers
By William W. Emmett, Luna B. Leopold, and Robert M. Myrick
Fluvial processes in rivers have been studied extensively in the United States during the past 20 years. This paper relates some older studies of scour and fill to some new studies for which detailed data on water-surface slopes and bedload-transport rates help to substantiate earlier interpretations. Although our discussion is based on data from three small rivers, the principles involved have transfer value to other rivers.
As maximum values of water-surface slope shift from riffles during low flow to pools during high flow, a similar reversal in maximum values of stream power takes place; this reversal is reflected in measured values of bedload-transport rate. Both pool and riffle reaches are likely to contribute sediment to bedload, resulting in generalized scour during high flow. However, spatially variable bedload-transport rates require those reaches with the least available stream power during times of high transport rate to
38
temporarily fill as continuity in the sediment budget is maintained. Similarly, those reaches with the least available stream power during times of receding river stage become sinks for storage of the moving sediment. This process helps explain the sorting mechanism of sediment and the maintenance of poolriffle sequences in rivers. The volume of scoured material within its annual travel distance is, on average, equal to annual bedload, but this is only an approximation because all bed particles do not move at the same speed or travel the same distance. Scour is associated with dilation of the grain bed through the scour depth, but individual particles move intermittently and at a speed much less than that of the water. The volume of material scoured and moved may be large, but because of its low mean speed downstream, the entire volume does not move out of a long reach but, in effect, is shifted downstream only a limited distance.
Measurement of Bedload Discharge in Nine Illinois Streams with the Helley-Smith Sampler
By Julia B. Graf
Samples collected with the Helley-Smith bedload sampler provide useful information about transport of sand-size sediment in Illinois streams. Bedload samples were collected from 1978 through 1981 at nine sites ranging in drainage area from 432 to 4,393 mi2 . Sampling sites and years of sampling are: Vermilion River near Leonore (1980 and 1981), Spoon River near Seville (1981), La Moine River near Ripley (1981), Kishwaukee River near Perryville (1981), Green River near Geneseo (1978--81), Rock River near Joslin (1978--81), Edwards River near New Boston (1980), Henderson Creek near Oquawka (1978--81), and Kaskaskia River near Venedy Station (1981). The purpose of the sampling program was to provide information needed to estimate volume of sand-sized material entering the Mississippi River and two of its major tributaries, the Rock River and the Illinois River.
All streams sampled drain flat to gently rolling terrain. Surficial materials in all drainage basins are composed largely of unconsolidated sediment deposited by processes related to Pleistocene glaciationloess, drift, till, and dune sand. Bedrock is exposed in places along some of the streams, particularly the Rock and Vermilion Rivers. Bed materials in all streams except the Vermilion River range from fine to coarse sand. The Vermilion River has a bed composed primarily of granule to cobble gravel. Median diameters of bed materials at sampling sites are: Vermilion River, 3.65 mm; Spoon River, 0.56 mm; La Moine River, 0.57 mm; Kishwaukee River, 0. 76 mm; Green River, 0.28 mm; Rock River, 0.67 mm; Edwards River, 0.53 mm; Henderson Creek, 0.38 mm; and Kaskaskia River, 0.29 mm.
The Helley-Smith samples provide the basis for bedload-discharge rating curves for the Rock and Kaskaskia Rivers and Henderson Creek. The 10 samples from the Rock River, collected at flows ranging up to almost the peak discharge of record, yield a well-defined bedload transport curve. Data from Henderson Creek cover a much narrower range of flow conditions and show wide scatter. Sampling methods that changed over the 4-year sampling period may have affected results. Although a transport curve was developed from the data, additional sampling is needed to obtain a reliable curve. Only
39
three measurements define the Kaskaskia River rating curve, but these cover a range of flow conditions and fall on a straight line. Measured bedload discharges near Venedy Station are all much less than bedload discharges computed from hydraulic and channel characteristics, suggesting that a reservoir 30.6 mi upstream of the site may be a significant factor in reducing bedload.
The possibility of extending bedload-discharge rating curves or of developing curves for stations with few measurements was investigated by comparing measured bedload discharge with bedload discharge computed from hydraulic and channel characteristics for a range of flow conditions. Three theoretical or empirical methods were used for the computations. One bedload sample was collected in each of the Spoon, Kishwaukee, and Edwards Rivers. Comparison of computed bedload discharges with the one measured value made possible the selection of an appropriate method for computing bedload discharge for each of these streams. No one computational method best represents bedload discharge in these streams. No bedload discharge rating curve was developed for the La Moine River, because the two measured bedload discharges are not sufficient for development of a rating curve and do not agree well with the computed bedload discharges. Bedload discharges measured in the Vermilion River, which has a sand, gravel, and bedrock bed, were much lower than any computed bedload discharges. Large bed material grains or high flow velocities may have interfered with the operation of the bedload sampler. A paucity of movable bed material also may be a cause of low measured bedload discharge at that site.
The dominant size of bedload in all streams sampled is in the range from 0.25 to 0.50 mm. Suspended sediment in all sampled streams is composed predominantly of silt- and clay-sized particles (less than 0.062 mm), with only a few percent of the sample being larger than the sampler bag mesh. Therefore, for most of these streams, the bedload sample probably contains very little sediment that was actually traveling in suspension. However, high percentages of sediment less than 0.25 mm in some bedload samples reflect significant suspended load of a size

close to the sampler bag mesh size. Very high percentages of sediment less than 0.25 mm collected in Green River samples (30--54 percent) suggest that the very fine bed materials in that stream may be clogging the sampler. Because of this inferred clogging, samples were not used to develop a bedload discharge rating curve for the Green River.
Suspended-sediment discharge was measured at
40
the same time as bedload for nine of the samples. The fraction of total sediment discharge that traveled within 3 in. of the bed ranged from about 0.1 percent to 10 percent. The bedload fraction was low for the Kaskaskia and Vermilion Rivers (0.4 and 0.1 percent, respectively) and was highest for the Kishwaukee and Rock Rivers and Henderson Creek (7 percent, 5 percent, and 2-10 percent, respectively).

LIST OF ATTENDEES
Northeastern Region Leslie D. Arihood, Indianapolis, Ind. Gerald L. Goddard, Madison, Wise. Julia B. Graf, Urbana, Ill. John R. Gray, Urbana, Ill. Lloyd A. Reed, Harrisburg, Penn. Thomas H. Yorke, Harrisburg, Penn.
Southeastern Region William P. Carey, Nashville, Tenn. Philip B. Curwick, Baton Rouge, La. John George (Regional Office), Atlanta, Ga. James H. Ficken (HIF), Bay St. Louis, Miss. Glenn G. Patterson, Columbia, S.C. Andrew Simon, Nashville, Tenn.
Central Region John Costa, Lakewood, Colo. James E. Kircher, Lakewood, Colo. David H. Marshall, Albuquerque, N.Mex. Wilbur J. Matthes, Jr., Iowa City, Iowa In Che Yang, (Central Laboratory) Arvada, Colo.
Western Region Dallas Childers, Jr., Vancouver, Wash. Richard J. Janda, Vancouver, Wash. Holly A. Martinson, Vancouver, Wash. David F. Meyer, Vancouver, Wash. K. Michael Nolan, Menlo Park, Calif. Thomas C. Pierson, Vancouver, Wash. Rhea P. Williams, Boise, Idaho
Research William W. Emmett, Lakewood, Colo. Marvin C. Goldberg, Lakewood, Colo. R. Edward Hickman, Reston, Va. Arthur J. Horowitz, Atlanta, Ga. Cliff R. Hupp, Reston, Va. Waite R. Osterkamp, Reston, Va. John V. Skinner, Minneapolis, Minn. E. Michael Thurman, Lakewood, Colo.
Headquarters G. Douglas Glysson, Quality of Water Branch
41

GPO 785-048/48015