PROCEEDINGS - univates.br · Maria Madalena Dullius Italo Gabriel Neide Marli Teresinha Quartieri...
200
PROCEEDINGS 26 Nov/01 Dec 2017 | Gramado, Brazil on the Teaching and Learning of Undergraduate Mathematics and Statistics 11th Southern Hemisphere Conference
Transcript of PROCEEDINGS - univates.br · Maria Madalena Dullius Italo Gabriel Neide Marli Teresinha Quartieri...

1Sumário
PROCEEDINGS
26 Nov/01 Dec 2017 | Gramado, Brazil
on the Teaching and Learning of
Undergraduate Mathematics and Statistics
11th Southern Hemisphere Conference

Maria Madalena DulliusItalo Gabriel Neide
Marli Teresinha QuartieriMarcelo de Carvalho Borba
Amanda Gabriele RauberSuzana Helena Strate Bonzanini
(Organizadores)
Proceedings of the 11th Southern Hemisphere Conference on the Teaching and Learning of Undergraduate Mathematics and Statistics
1ª edição
Lajeado, 2018

3Sumário
Proceedings of the 11th Southern Hemisphere Conference on the Teaching and Learning of Undergraduate Mathematics and Statistics ISBN 978-85-8167-237-3
Universidade do Vale do Taquari - UnivatesReitor: Prof. Me. Ney José LazzariVice-Reitor e Presidente da Fuvates: Prof. Dr. Carlos Cândido da Silva CyrnePró-Reitora de Pesquisa, Extensão e Pós-Graduação: Profa. Dra. Maria Madelena DulliusPró-Reitor de Ensino: Prof. Dr. Carlos Cândido da Silva CyrnePró-Reitora de Desenvolvimento Institucional: Profa. Dra. Júlia Elisabete BardenPró-Reitor Administrativo: Prof. Me. Oto Roberto Moerschbaecher
Coordenação e Revisão Final: Ivete Maria HammesEditoração: Marlon Alceu Cristófoli
Conselho Editorial da Editora UnivatesTitulares SuplentesAdriane Pozzobon Fernanda Rocha da TrindadeMarli Teresinha Quartieri Ieda Maria GiongoRogério José Schuck João Miguel BackFernanda Cristina Wiebusch Sindelar Alexandre André Feil
Avelino Talini, 171 – Bairro Universitário – Lajeado – RS, BrasilFone: (51) 3714-7024 / Fone/Fax: (51) 3714-7000
[email protected] / http://www.univates.br/editora
The opinions and concepts emitted, as well as the accuracy, adequacy and origin of the citations and references,
are the sole responsibility of the authors.
S727 Southern Hemisphere Conference on the Teaching and Learning of Undergraduate Mathematics and Statistics (11. : 2017 : Gramado, RS)
Proceedings of the 11th Southern Hemisphere Conference on the Teaching and Learning of Undergraduate Mathematics and Statistics / Maria Madalena Dullius et al. (Org.) – Lajeado : Ed. Univates, 2018.
200 p.:
ISBN 978-85-8167-237-3
1. Educação. 2. Ciências Exatas. 3. Matemática. 4. Estatística. I. Dullius, Maria Madalena. II. Título.
CDU: 37:501
Catalogação na publicação (CIP) – Biblioteca da UnivatesBibliotecária Andrieli Mara Lanferdini – CRB 10/2279

4Sumário
Proceedings of the 11th Southern Hemisphere Conference on the Teaching and Learning of Undergraduate Mathematics and Statistics ISBN 978-85-8167-237-3
PROMOTERS
FINANCIAL SUPPORT
5Sumário
Proceedings of the 11th Southern Hemisphere Conference on the Teaching and Learning of Undergraduate Mathematics and Statistics ISBN 978-85-8167-237-3
WELCOME
Proceedings of the 11th Southern Hemisphere Conference on the Teaching and Learning of Undergraduate Mathematics and Statistics
Welcome to Brazil Delta, the Eleventh Southern Hemisphere Conference on the Teaching and Learning of Undergraduate Mathematics and Statistics. This is the first time Brazil hosts the Delta conference, and we are pleased to welcome you to Gramado, a “German” town in Southern Brazil. Brazil Delta has delegates and guests from ten countries!
We hope that this event can foster diverse debates on current issues of mathematics education within the higher education sector, and also that useful new networking and collaborations can be developed. In order to achieve these we will have provoking keynote and invited speakers, and a magnificent venue to “Think Diversity”, our theme conference. The publications for this conference include the special Public Access supplement ‘Brazil Delta 2017 Conference Special Issue’ of the International Journal of Mathematical Education in Science and Technology, the Proceedings, the Communications and the Programme. The iJMEST issue and the Proceedings were double blind peer reviewed by at least two reviewers per paper.
We have worked hard to be able to host this conference in Brazil. Given the current political situation and the cuts in funding that Science and Education have suffered in recent years, it is only with much persistence and dedication that it was possible to organize this conference in Brazil.
We wish you an enjoyable and memorable stay in Gramado! In pursuit of excellence in teaching and learning,
Maria Madalena Dullius, on behalf of the organizing committee
Local organizing committeeMaria Madalena Dullius (UNIVATES) – chairItalo Gabriel Neide (UNIVATES)Marli Teresinha Quartieri (UNIVATES)Marcelo de Carvalho Borba (UNESP)Amanda Gabriele Rauber (UNIVATES)Suzana Helena Strate Bonzanini (UNIVATES)
Scientific CommitteeMarcelo de Carvalho Borba (UNESP) – chairItalo Gabriel Neide (UNIVATES)Greg Oates (UTAS)Victor Martinez Luaces (UDELAR)João Frederico Meyer (UNICAMP)

6Sumário
Proceedings of the 11th Southern Hemisphere Conference on the Teaching and Learning of Undergraduate Mathematics and Statistics ISBN 978-85-8167-237-3
SUMÁRIO
FULL PAPERS
THE INVESTIGATIVE TEACHING PRACTICE MOTIVATING THE STUDENT’S AUTONOMOUS LEARNING . . . . . . . . . . . . . . . . . . . . . . . . . . . . . . . . . . . . . . . . . . . . . . . . . . . . . . . . . . 12
Aline Silva de BonaMarcus Vinicius de Azevedo Basso
CONCEPTIONS OF FUNCTION IN A FIRST CALCULUS COURSE: AN APOS THEORY BASED STUDY . . . . . . . . . . . . . . . . . . . . . . . . . . . . . . . . . . . . . . . . . . . . . . . . . . . . . . . . . . . . . . . . . . . . . 21
Luisa Rodriguez DoeringVanessa de Azeredo AbreuElisabete Zardo Búrigo
A NOVEL APPROACH TO MATHEMATICS EXAMINATION DESIGN AND MARKING . . . . . 32David Easdown Brad RobertsRuth Corran
MATH CIRCLES FOR ALL AGES: FROM NAVAJO MATH TO THE RESEARCH UNIVERSITY 49Matthias Kawski
ANALYSIS OF UNDERGRADUATES’ WORKS ON AN INVERSE MODELLING PROBLEM WITHIN THE FRAME OF MATHEMATICAL WORKING SPACES . . . . . . . . . . . . . . . . . . . . . . . . 61
Victor Martinez-Luaces
THE EFFECT OF USING SIMULATIONS ON STUDENTS’ LEARNING OF INFERENTIAL STATISTICS IN AN ELEMENTARY STATISTICS CLASS IN THE MATHEMATICAL SCIENCES DEPARTMENT OF THE UNIVERSITY OF WISCONSIN-MILWAUKEE . . . . . . . . . 72
K. McLeodAlexa Schut
MULTIPLE REPRESENTATIONS IN THE STUDY OF ANALYTICAL GEOMETRY: VIDEO PRODUCTION IN A DISTANCE ONLINE PRE SERVICE TEACHER EDUCATION PROGRAM . . . . . . . . . . . . . . . . . . . . . . . . . . . . . . . . . . . . . . . . . . . . . . . . . . . . . . . . . . . . . . . . . . . . . . . . . 83
Liliane Xavier NevesMarcelo de Carvalho Borba
PRODUCTION OF VIDEOS WITH MATHEMATICAL CONTENT: A LOOK THROUGH SOCIAL SEMIOTICS . . . . . . . . . . . . . . . . . . . . . . . . . . . . . . . . . . . . . . . . . . . . . . . . . . . . . . . . . . . . . . . . 96
Vanessa OechslerMarcelo de Carvalho Borba

7Sumário
Proceedings of the 11th Southern Hemisphere Conference on the Teaching and Learning of Undergraduate Mathematics and Statistics ISBN 978-85-8167-237-3
UNDERSTANDING OF LIMITS AND DIFFERENTIATION AS THRESHOLD CONCEPTS IN A FIRST-YEAR MATHEMATICS COURSE . . . . . . . . . . . . . . . . . . . . . . . . . . . . . . . . . . . . . . . . . . 108
Greg OatesRobyn ReaburnMichael BridesonKumudini Dharmasada
FIRST YEAR ENGINEERING MATHEMATICS: WHAT’S THE OPTIMAL BLEND? . . . . . . . . 121Diana QuinnBronwyn HajekJorge Aarão
THE NEED FOR NEW ATTITUDES IN THE TEACHING – AND THE LEARNING! – OF A RELEVANT LINEAR ALGEBRA AT UNDERGRADUATE LEVEL . . . . . . . . . . . . . . . . . . . . . . . . 134
Clarice Favaretto Salvador
STUDENTS’ DIALOGUES IN STUDY OF THE DEFINITE INTEGRAL BASED ON ANALYSIS OF A PHYSICAL MODEL WITH TECHNOLOGY . . . . . . . . . . . . . . . . . . . . . . . . . . . . 143
Débora da Silva SoaresGuilherme Vier
AN INQUIRY-ORIENTED APPROACH TO A GUIDED REINVENTION OF EIGENTHEORY 154Megan WawroMichelle Zandieh David Plaxco
ABSTRACTS
A CROSS-BORDER STEM CLASS ON THE THEME OF ENERGY TO ENHANCE THE STATISTICS EDUCATION AT THE LEVEL OF 6TH GRADE OF BASIC SCHOOL CURRICULUM OF MATHEMATICS . . . . . . . . . . . . . . . . . . . . . . . . . . . . . . . . . . . . . . . . . . . . . . . . . . 167
Yuriko Yamamoto Baldin Masami Isoda Raimundo Olfos Soledad Estrella
THE IMPACT OF MATHEMATICS SOFTWARE REMEDIATION IN MATHEMATICS FOR ENGINEERING STUDENTS AT A UNIVERSITY IN THE EASTERN CAPE PROVINCE OF SOUTH AFRICA . . . . . . . . . . . . . . . . . . . . . . . . . . . . . . . . . . . . . . . . . . . . . . . . . . . . . 168
Lynette BesterT. Mandindi
JUST TAKE A BREATH: BRINGING MINDFULNESS INTO LARGE CLASSROOMS . . . . . . . 169Claire Blackman
HELPING STUDENTS OVERCOME FAILURE BY DEVELOPING ‘GROWTH MINDSETS’ . . 170Anita Campbell
8Sumário
Proceedings of the 11th Southern Hemisphere Conference on the Teaching and Learning of Undergraduate Mathematics and Statistics ISBN 978-85-8167-237-3
THE GEOGEBRA SOFTWARE AS A TOOL IN THE TEACHING OF TRIGONOMETRICAL FUNCTIONS . . . . . . . . . . . . . . . . . . . . . . . . . . . . . . . . . . . . . . . . . . . . . . . . . . 171
Marli Teresinha Quartieri Romildo Pereira da CruzItalo Gabriel NeideMaria Madalena DulliusAmanda Gabriele Rauber
PERSPECTIVES IN TEACHING STATISTICS IN A PEDAGOGY COURSE IN DE . . . . . . . . . . . 172Auriluci de Carvalho FigueiredoMichel da Costa
PREDICTING SECOND YEAR MATHEMATICS SUCCESS USING STATISTICAL MODELS . 173Lizelle Fletcher
HOW THE INTERNET ACT ON THE MATHEMATICAL MODELING ONLINE . . . . . . . . . . . 174Jeannette GalleguillosMarcelo de Carvalho Borba
A WEB APPLICATION TO SUPPORT THE CONTINUING LEARNING OF ELEMENTARY MATHEMATICS . . . . . . . . . . . . . . . . . . . . . . . . . . . . . . . . . . . . . . . . . . . . . . . . . . . . 175
Héctor Fernando Gómez Ramón Ronzón
PROMOTING METACOGNITION AS A HABIT OF MIND IN UNDERGRADUATE CLASSROOM COMMUNITIES . . . . . . . . . . . . . . . . . . . . . . . . . . . . . . . . . . . . . . . . . . . . . . . . . . . . . . . 176
Emilie Hancock
USING VIRTUAL AND PHYSICAL LEARNING SPACES TO DEVELOP A SUCCESSFUL MATHEMATICAL LEARNING COMMUNITY, BOTH FOR ON-SITE AND DISTANCE PROVISION . . . . . . . . . . . . . . . . . . . . . . . . . . . . . . . . . . . . . . . . . . . . . . . . . . . . . . . . . . . . . . . . . . . . . . . 177
Belinda Huntley Jeff WaldockAndrew Middleton
#FEESMUSTFALL: CHANGING THE LANDSCAPE OF E-ASSESSMENT . . . . . . . . . . . . . . . . . 178Simon GoldstoneHermien JohannesSimon GoldstoneShaun MeyerKoshala Terblanche
MATHEMATICAL FAILURE(S) OF BRIDGING STUDENTS AND THE IMPACT(S) ON THEIR PROGRESS AND AFFECT . . . . . . . . . . . . . . . . . . . . . . . . . . . . . . . . . . . . . . . . . . . . . . . . . . . 179
Phil Kane
ATTENDANCE: THE MISMATCH BETWEEN ACADEMICS AND STUDENTS . WHO IS RIGHT? . . . . . . . . . . . . . . . . . . . . . . . . . . . . . . . . . . . . . . . . . . . . . . . . . . . . . . . . . . . . . . . . . . . . . . . . . . . 180
R. Nazim Khan

9Sumário
Proceedings of the 11th Southern Hemisphere Conference on the Teaching and Learning of Undergraduate Mathematics and Statistics ISBN 978-85-8167-237-3
FIRST FESTIVAL OF DIGITAL VIDEOS AND MATHEMATICS EDUCATION . . . . . . . . . . . . . 181Hannah Dora de Garcia e LacerdaMarcelo de Carvalho Borba
SMART PHYSICS: TEACHING PHYSICS WITH SMART-CART AND SAMART-PHONES . . 182Jeff Nijsse
STUDENT EXPERIENCE INFORMS A SUPPORTIVE-ENVIRONMENTAL FRAMEWORK FOR ONLINE ASSESSMENT IN MOODLE . . . . . . . . . . . . . . . . . . . . . . . . . . . . . . . . . . . . . . . . . . . . 183
Pragashni PadayacheeDr Hermien JohannesDr Shirley Wagner-WelshRachel Passmore
CONTRIBUTIONS OF THE MATHEMATICAL MODELING TO THE DEVELOPMENT OF STATISTICAL LITERACY OF STUDENTS FROM A GRADUATE TECHNOLOGY COURSE . . . . . . . . . . . . . . . . . . . . . . . . . . . . . . . . . . . . . . . . . . . . . . . . . . . . . . . . . . . . . . . . . . . . . . . . . . 185
Andréa Pavan PerinMaria Lúcia Lorenzetti Wodewotzki
THE EXPLOITATION OF VIDEOS IN TEACHER TRAINING . . . . . . . . . . . . . . . . . . . . . . . . . . . 186Márcia Jussara Hepp RehfeldtIeda Maria GingoMarli Teresinha Quartieri
A TALE OF TWO JOURNEYS . . . . . . . . . . . . . . . . . . . . . . . . . . . . . . . . . . . . . . . . . . . . . . . . . . . . . . . . 187Barbara Miller-ReillyCharles O’Brien
EVALUATING THE EFFECTIVENESS OF CLICKERS TO OPTIMIZE PERFORMANCE IN A STATISTICS 100 COURSE . . . . . . . . . . . . . . . . . . . . . . . . . . . . . . . . . . . . . . . . . . . . . . . . . . . . . . . . 188
Fransonet ReynekeLizelle FletcherAnsie Harding
A TALE OF TWO DIAGNOSTIC TESTS . . . . . . . . . . . . . . . . . . . . . . . . . . . . . . . . . . . . . . . . . . . . . . . 189Leanne J. RylandsDonald Shearman
ENGAGING DISTANCE STUDENTS . . . . . . . . . . . . . . . . . . . . . . . . . . . . . . . . . . . . . . . . . . . . . . . . . . 190Cami Sawyer
CREATING A CONFIDENT COMPETENT QUESTIONING CULTURE . . . . . . . . . . . . . . . . . . . . 191Anne D’Arcy-WarmingtonHeather Lonsdale

10Sumário
Proceedings of the 11th Southern Hemisphere Conference on the Teaching and Learning of Undergraduate Mathematics and Statistics ISBN 978-85-8167-237-3
FULL PAPERS
VIRTUAL MATHEMATICS AND TEACHER TRAINING: USE OF INFORMATION AND COMMUNICATION TECHNOLOGIES IN PUBLIC SPACES . . . . . . . . . . . . . . . . . . . . . . . . . . . . . . 193
Lidermir de Souza ArrudaWenden Charles de Souza RodriguesSalete Maria Chalub Bandeira
EXPLORING DOLLS CLOTHING AREA THROUGH MATHEMATICAL MODELING . . . . . . 194Elise Candida Dente,Márcia Jussara Hepp Rehfeldt Marli Teresinha Quartieri
STATISTICAL LITERACY AND PROJECTS . . . . . . . . . . . . . . . . . . . . . . . . . . . . . . . . . . . . . . . . . . . 195Cassio Cristiano Giordano
ANALYSIS OF RESOLUTIONS PROVIDED BY ENGINEERING COURSE STUDENTS FOR THE PROBLEMS PROPOSED, A MEANINGFUL VIEW . . . . . . . . . . . . . . . . . . . . . . . . . . . 196
Marjúnia Édita Zimmer KleinJosé Cláudio Del Pino
TEACHING INTERNSHIP: A SIGNIFICANT EXPERIENCE . . . . . . . . . . . . . . . . . . . . . . . . . . . . . 197Geovana Luiza KliemannMaria Madalena DulliusAmanda Gabriele RauberRomildo Pereira da Cruz
SELECTED CALCULUS TOPICS: A DYNAMIC APPROACH USING GEOGEBRA . . . . . . . . . . 198André NagamineCamila Macedo Lima NagamineRosane Leite Funato
BUILDING GRAPHICS OF TWO-VARIABLE FUNCTIONS USING SLICEFORMS . . . . . . . . . 199Camila Macedo Lima NagamineRosane Leite FunatoLiliane Xavier NevesJoedson de Jesus SantanaAndré Nagamine

11Sumário
Proceedings of the 11th Southern Hemisphere Conference on the Teaching and Learning of Undergraduate Mathematics and Statistics ISBN 978-85-8167-237-3
FULL PAPERS

12Sumário
Proceedings of the 11th Southern Hemisphere Conference on the Teaching and Learning of Undergraduate Mathematics and Statistics ISBN 978-85-8167-237-3
THE INVESTIGATIVE TEACHING PRACTICE MOTIVATING THE STUDENT’S AUTONOMOUS LEARNING
Aline Silva de Bona1
Instituto Federal de Educação, Ciência e Tecnologia do Rio Grande do Sul, Osório, Brasil;
Marcus Vinicius de Azevedo Basso2
Departamento de Matemática Pura e Aplicada, Universidade Federal do Rio grande do Sul, Porto Alegre, Brasil
AbstractThis article discusses classroom practices based on research and dialogue aimed at raising students’ awareness of their individual learning processes. The goal is to present and share theoretical ideas and examples of teaching actions that improve the learning of concepts of mathematics. The case study was carried out in the subject Didactics for mathematics in Elementary School of the undergraduate program in mathematics of the IFRS - Osório Campus, from August to September of 2016 with a class of 22 students. The data are made up of the students’ accounts, recorded and transcribed, on classroom practices, focusing on three actions. The study is theoretically based on learning as defined by Piaget, on dialogue and autonomy as conceived by Paulo Freire and on the concept of mathematical investigations in the classroom of João Pedro da Ponte. The results highlight the students’ engagement with the activities in the classes, which allow for a learning of concepts beyond what was previously planned by the teacher, including the realization that classroom research enables students to develop their individuality in the classroom: their doing, thinking and learning.Keywords: Research, Dialogue, Autonomy, Teaching practice
INTRODUCTIONThe focus of this study is a central question: “How to motivate students to learn how
to learn concepts of mathematics in the classroom?”, Bona (2012), be it through the use of online digital technologies and, more recently, with mobile resources, be it through innovative classroom methodologies which motivate students and awake their curiosity to learning.
The School mathematics, defined by Bona (2017, p. 13) as:(...) the one capable of exciting and motivating students to learn how to learn its concepts by different means and forms (...). Additionally, the process of learning, that is, how mathematical concepts are presented, constructed and applied, makes all the difference in awaking the students’ interest. Taking curiosity as a starting point, it is possible to explore from concrete problem-solving situations to the formalization of the enunciation of an arithmetic property, as in the one where the sum of natural numbers will always have a natural number as a result, for example. (BONA, 2017, p. 13-14)
When thinking about first-year students in higher education, in particular the ones in the mathmathematics Teacher Training undergraduate program at IFRS – Osório Campus, one
13Sumário
Proceedings of the 11th Southern Hemisphere Conference on the Teaching and Learning of Undergraduate Mathematics and Statistics ISBN 978-85-8167-237-3
seeks first of all to comprehend in the Didactics for Middle School mathmathematics course what they understand about their own knowledge of mathematics in order to later exhibit different didactical possibilities for teaching actions in the classroom. This process is followed by debates around relevant topics in the context of teaching actions in the classroom based on official documents such as the National Curriculum Parameters (PCN) (BRASIL, 1997).
In this action of understanding the students, who will one day be teachers, the professor, one of the authors of this article, presents the subjects in the syllabus with questions and problems to be solved so that the students may signal their interests and identify themselves as agents of their learning.
At the same time, the idea that each question raised by the students may constitute an investigative action makes the class dynamic and promotes interaction among the students and between them and the professor. During this process, it becomes clear to the students that everyone’s individuality will determine how and to what extent each question will be answered. Also during this process, one notices that learning happens naturally for each student and according to his interests and particularities.
Taking this context into account, this study is a reflection based on classroom teaching practices and actions that are founded on investigation and dialogue so the student may realize that, once they are motivated, they can increase their chances of learning autonomously what they find interesting. The goal is to present and share theoretical ideas and three situations of teaching actions that promote the learning of concepts of math mathematics.
It is worth highlighting that when we refer to concepts of mathematics we identify what each student considers relevant, what they ask themselves and why they seek to know a certain concept of mathematics. In this set of knowledge may be present specific questions concerning the solving of problems, the introduction to some mathematical topic and even reflections on difficulties of learning a certain concept in Basic Education.
In section 2 we present the theoretical basis of this study; the methodological steps can be found in section 3 accompanied by the data obtained during the investigation and lastly come the results and final remarks.
Investigative teaching practice motivating the student’s autonomous learning process
The theoretical ideas that weave together in a network in this article are the central concepts: Piaget’s “learning” (1973; 1977), “dialogue” and “autonomy” as understood by Paulo Freire (1996) and João Pedro da Ponte’s concept of mathematical investigation in the classroom (PONTE, BROCARDO and OLIVEIRA, 2006)
Piaget’s studies focus at first on the subject’s action and on how the coordination of these actions happens. Later, according to Bona (2012), the focus shifts towards understanding how this subject’s process of conceptualization happens.
Each action is a form of autonomous knowledge, according to Piaget (1977), and this knowledge is a “savoir-faire”. For Becker (2001), in a sort of doing with the body where the action is the source of the conceptualized understanding, it constitutes autonomous knowledge of considerable effectiveness while the subject does not know themselves.
Actions are interactions which may be with objects and/or subjects, but such interactions are potentiated when performed in pairs and in the form of cooperation, according to Piaget (1973). That is, there is an action in situations where students are interacting in the classroom with the proposed resources. When this action is performed with their pairs, the moment when one’s ideas complete the others’, there is cooperative action. These actions find their support

14Sumário
Proceedings of the 11th Southern Hemisphere Conference on the Teaching and Learning of Undergraduate Mathematics and Statistics ISBN 978-85-8167-237-3
in dialogue, for it is impossible for people to exchange ideas, interact and learn if not speaking, listening and reflecting.
Dialogue is the main element highlighted by Freire (1996) of relationships among people, from learning to living together. It is worth pointing out that Freire affirms the necessity of saying everything that seems obvious to someone.
The idea of autonomy as presented by Piaget (1973) is that the student has the liberty to act, do and learn whatever they wish that may spark their curiosity. Such curiosity may be sparked and motivated by some object or action which may be the beginning of an interaction process.
Freire (1996) is in agreement with the idea of autonomy proposed by Piaget when he considers freedom of expression, of being, of doing and of taking a stance regarding any personal and/or social situation. Freire (1996) also points out that autonomy is everyone’s right as a citizen.
Taking these ideas into account, the process of learning how to learn gains a unique meaning in the student’s life in any level of schooling, due to the simple fact that learning depends on their actions moved by curiosity. These actions, in a web of relations, may become frequent and the privileged space for it is the classroom.
The practice that we have been researching is the investigative form, that is, the one that provides the student with an interest about a subject and which will lead them to act/research in order to comprehend it.
Corroborating this idea, Bona (2017), treats School mathematics asA way of using School mathematics which seems interesting and motivating to the student is through investigation, i.e. the student, curious to solve a situation, seeks with their resources and knowledge how to find a possible solution and shares it with their classmates, broadening their ideas and even finding other possible solutions. (BONA, 2017, p.17)
There are many authors in the field of mathematics Education who explore the idea of working with a problem in the classroom as a form of the problem solving. In this article, however, we construe investigating not only as tackling a problem to be solved, but also as an initial question which may in the future become a problem, that is, we understand the idea of investigating as macrostructuring.
Investigating, for Ponte, Brocardo e Oliveira (2006), means seeking to know the unknown, it means discovering relations among known mathematical objects or between them and unknown objects, it means seeking to identify their properties and their process of creation, and it means, for Bona (2012; 2017), making it possible for a student to be a “novice scientist” in that process of discovery, responsible for their own learning process, and autonomous to learn as much and however they desire in each situation that motivates them.
The action of investigating means understanding and seeking solutions to problems which we face in order to discover relations, always seeking to justify them. Investigative activities contemplate basic elements such as:(1) motivation: action which aims to motivate students to participate in class and from this participation to “learn”;(2) learning: observing the students’ learning and how they understand this learning(3) investigation: teaching practice based on dialogue and on valuing the students’ investigative actions in the classroom. (BONA; SOUZA, 2015, p. 240)

15Sumário
Proceedings of the 11th Southern Hemisphere Conference on the Teaching and Learning of Undergraduate Mathematics and Statistics ISBN 978-85-8167-237-3
With this theoretical basis a learning context is established and it demands from the professor or teacher that they choose a classroom practice capable of motivating the student to be, first of all, curious and, building on this curiosity, to formulate questions to be answered by themselves, either individually or collectively.
Next, we present situations of investigative teaching practices which stimulate the students’ process of autonomous learning in the classroom.
Methodological pathwayThe case study (GIL, 2007) was carried out during classes of the 2nd-semester course called
General Didactics and Methodology for Middle School mathematics, worth 4 credits, which is part of the mathematics Teacher Training undergraduate program at the Rio Grande do Sul Federal Institute of Education, Science and Technology – IFRS – Osório Campus, in August and September of 2016 with a night class consisting of 22 students.
The data are composed of the students’ and the professor’s accounts of three practical actions in the classroom recorded and transcribed.
Students were denominated by capital letters. Their average age was 22, with ages ranging from 17 to 42. At the moment of the study none of them were working as teachers. Part of the students had recently finished High School and revealed choosing the program because they learn mathematics easily; others worked with sales but expected to teach mathematics.
The three ActionsFirstly, the course in question has a syllabus with many topics, as written in the Political
Pedagogical Project for the program. The course also considers, for each topic, different authors in the field of mathematics Education. Taking this context into account, the course was planned based on the students’ interests, that is, their curiosity about the subjects and actions in learning how to learn.
Syllabus: some aspects of contents and methodologies for the teaching of mathematics in the last years of Middle School. Solving problemas, Ethnomathematics, History of mathematics, mathematical Modelling, Games, Informatics and Investigation as teaching approaches in the last years of Middle School. Curricular proposals for the teaching of mathematics. National Curriculum Parameters, State Curriculum Proposals and textooks. (PPC, 2015, p. 50)
On the first day of class the following question were asked to the students after the reading of the syllabus: “What do each of you want to know more about from the subjects in the syllabus?”. The answers were divided by subject. All of the topics in the syllabus were covered. The three most common subjects were Informatics, Investigation and studying the National Curriculum Parameters (PCN). So, in this article, we will present the teaching action concerning each one of these three subjects respectively, by means of the following questions: “How can we use informatics in the mathematics classroom?”; “What are the mathematical problems or questions which each one of you would like to either solve, know how to solve or even better understand the explanation?”; “What is the use of the PCN?”
Questions about the subjects in the syllabus were asked to the students on the second day of class and they could do their research in the classroom, in the library or in the computer lab, either individually or in groups. The idea was to think about the subject so that in the following class it would be possible to discuss and delineate what would be studied about each of the subjects.

16Sumário
Proceedings of the 11th Southern Hemisphere Conference on the Teaching and Learning of Undergraduate Mathematics and Statistics ISBN 978-85-8167-237-3
Generally research or attempts to answer the questions made other questions appear, and that provoked an interesting ambiance of research and querying in the classroom. This was provoked by the understanding that each one developed about the importance of choosing their question, its possible answers, and how much it could unfold in the discussion in the following class.
The process was dynamic and the students interacted seldom asking the professor for help. The teaching action happened in the form of questions such as “why did you choose this object as source for research?”, “What is the main idea presented by this author?”.
We highlight that the three actions are built upon the questions previously cited:- “How can we use informatics in the mathematics classroom?”; - “What are the mathematical problems or questions which each one of you would like to
either solve, know how to solve or even better understand the explanation?”;- “What is the use of the PCN?”The first of these questions was answered individually by the students where each of
them defined their question and answered orally to the group in the following class. In order to answer the second question, students organized in three ways: individually, in pairs, or in trios, but they all shared their questions and answers on GoogleDocs; for the third question the students organized the class in three groups and each presented to the other classmates a class project as answer, which means they put themselves in the position of teachers and created mathematics classes.
All actions are founded on the theoretical ideas previously presented, for each class is a question, that is, it is an investigative space for the students, and everyone’s learning process is not only collaborative, but also cooperative and based on dialogue. We posit that the pair cooperative-dialogical provides autonomy to the student which makes them capable of going beyond what was planned by the professor, in a simultaneous process of learning how to learn. For instance, in the question concerning the PCN, it was not foreseen by the professor of the course that students would think about creating classes to justify a possibility of using the National Curriculum Parameters.
Data Analysis: The students’ accountsThe students actively participated in the classes and always had many doubts and
questions. Despite stating they needed to read and study a great deal outside of the classroom and that they had no time, they made clear they felt the importance of studying longer than the time allotted to the class.
In this student action, we highlight two important factors: firstly, the students felt at ease to ask questions as soon as dialogue was established with the professor for the course. Secondly, but not less important, when they realized the necessity of studying longer than the time allotted to the class, they took responsibility for their own learning process.
The students considered the classes based on investigations and presentations of research to be interesting, different and exciting. They also said they could not be absent from any class because it would mean a loss of information for the other groups and about the other subjects. This account illuminates the practice developed in the course which is based on research and the students’ accounts. That is, when creating a space for students to learn how to learn with each other, the students themselves realized they were autonomous in their learning process and that learning does not depend on the teacher but on their actions/interactions with their

17Sumário
Proceedings of the 11th Southern Hemisphere Conference on the Teaching and Learning of Undergraduate Mathematics and Statistics ISBN 978-85-8167-237-3
research and presentations, from the organizing of each group to how they would present their research and watch the classmates.
The students also commented all the time that the professor resembled a “bag of questions”, since she always had a question on the tip of the tongue and sometimes there was already an answer presented by one of the students to the question.
Considering the large volume of data, we chose to present a selection of two questions concerning the first action, one concerning the second and one group concerning the third action.
Two questions about the first actionStudent A:“Why use the computer in the public school if there is no internet? If the cell phone is
more accessible and has great applications for mathematical logic. How to organize a group of 6th-grade children to use the cell phone and verify the criteria of divisibility of a natural number without it falling into chaos and so that all may learn? And would the students use it in the beginning or in the end of the explanation? Do all of them know operations with natural numbers well enough to explore the calculator? (…)”
Analysing the student’s answer one notices that she asks new questions in order to answer the one given and that her research will seek to answer her own questions and, when she reaches that answer, she will have answered what was asked. This circle of actions constitues an act of investigation, becase she has the question and with her own means she seeks possible anwers. In her questions, the student makes clear that the use of informatics is important, but, while the School is thinking about the computer, the cell phone is becoming more interesting. She also reflects on the mathematical content that may be taught in Basic Education, but asks herself how to manage every student’s learning. This student’s action indicates that this investigative practice evidences that a learning process with autonomy seeks understanding of its doubts and interests.
Student D:“There is a bunch of digital resources to learn mathematics, but are they all used after a
class explaining them? And are there resources for all content? And will students like it because mathematics done on paper is cool? And how will the teacher install in the school computer lab all the resources that they want? It seems very complicated using informatics in the classroom (...)”
This student’s thinking is different from his classmate cited above, since he points out that “mathematics on paper” is cool and, because of that, using the computer would need a resource for each piece of content. Like student A, student D also takes responsibility for his learning and, each in their own way, wants to learn some information about the question asked.
A question of the second action by the pair A and CStudent C:“I never understood why mathematics teachers love the board and write everything,
sometimes just outlining the question is enough. I always worried when the teacher solved a problem different from mine and got the same answer, but the teacher always said – if it is right, it is right. But I kept thinking I wanted to understand how she had done it and sometimes I managed to and sometimes I did not, but she did not care about helping me understand her way, having many student with difficulties. So I want to know many things, but here now: why

18Sumário
Proceedings of the 11th Southern Hemisphere Conference on the Teaching and Learning of Undergraduate Mathematics and Statistics ISBN 978-85-8167-237-3
does the angular coefficient of the perpendicular line is the inverse negative? Why does every triangle with different sides have different angles? Why are volume and capacity equivalent in mathematics? (...)”
Student C’s account quoted above is very interesting due to the fact that she wants to understand the different ways of solving a problem and also questions why the teacher always wants to write every single step on the board in detail, when sometimes a tip to solve the mathematical problem/exercise would suffice. This action is pure motivation for learning, autonomy and curiosity to learn how to learn more. Besides, she mentions her classmates, what indicates that she studies in a group and understands what they think.
Pointing out that the teacher did not choose explain different ways of solving the problems/exercises shows that an investigative class, that is, an increased dialogue with the teacher and the classmates when discussing the different ways to solve questions, would be more interesting to her learning.
In her account are visible elements of an investigative practice – problem, research/solving, sharing, learning in different ways, that is, according to Bona (2017) and Ponte, Brocardo and Oliveira (2006), the first step towards investigation is identifying the problem/issue/activity to be solved, its preliminary exploration and the creation of questions. After comes the process of conjecturing. The third step includes testing and reassessing of conjectures. On top of this last process the argumentation is done, that is, the demonstration and evaluation of the work done where the argumentation step happens in groups and after with the entire class, as in the case of the teacher that discusses the questions on the board.
Student A:“I agree with you, they also love worksheets. And my classmates sometimes did their math
differently from me and the teacher and it was correct, but is mathematics not exact? I have the same questions, but I have others that come before like the symbols for whole numbers, I know the rules, but I do not know why they are valid, like in multiplication a minus and a minus make a plus, why? Why is the Pythagorean theorem always valid?”
Student A collaborates with and reinforces the ideas of classmate C, showing that the practice adopted for this course is investigative and provides an autonomous and cooperative learning process for the students. We highlight that the students are cooperating because besides agreeing with each other, each one has their arguments and issues to be solved, but both point out the importance of understanding how the other thinks/solves/understands what is being done and, from there, complementing each other. The elements for understanding the different solutions and being able to complement are processes of learning denser and fuller of conceptual constructions to mathematics, since its being exact means there is only one right answer, but there are different ways to get to this right answer.
A question by the group composed of six students, but written down by student L as their voice
Student L:“I have always asked my friends what they were learning in school and sometimes it was
the same in the same grade, and other times it was not, but I never understood why it was different, I thought it was because those were different schools, but when my brother was in 8th-grade I asked him one day what he was learning and I could not remember the subject, and by then I was already a sophomore in High School. One day the principal said it was the curriculum, which I did not understand and I just let go. So the PCN must be a list of subjects

19Sumário
Proceedings of the 11th Southern Hemisphere Conference on the Teaching and Learning of Undergraduate Mathematics and Statistics ISBN 978-85-8167-237-3
common to every teacher of mathematics? But to what extent and how should each subject be developed? And who made this list of subjects? Why it is organized in this way? (…)”
Student C:“It is very interesting to study and read in the PCN that the solving of problems is to
be done in every year, but I only learned it in what is currently called the 7th-grade with one-variable equations (…)”
Student M:“We will prepare a class to demonstrate why this way of organizing the PCN is important,
since when we prepared the class we thought about what the student would have to know beforehand and what we want them to understand and in order to do that we also need to know how to do it according to their age (…). I liked how the PCN are not only contents, but also how to present these contents to the students (…)”
Student L (presented the class for his group and the class’s reflection with the classmates is here transcribed)
“We thought about preparing a very concrete class in order to show the students why the sum of the interior angles of a triangle is 180º. [We aimed to] analyze it as a way of solving an exploratory problem and it made us research forms of explaining it to the young ones as well as to the older ones and we realized we did not know any way of doing it because we were never stimulated by it. We found a way that everyone in the group love which is taking any triangle and coloring its interior angles, then cutting it and finally gluing them side by side. It is amazing! It makes a straight angle. Then comes the rule we knew but did not know how to explain. We were wondering why our teachers never showed us that in the classroom and also why they never proposed activities with things we could touch, since we found out that almost all geometry, which is so hard, can be done with visible material (…)”
Student B:“(…) the idea of investigation that we are studying is present in the PCN as a way of
teaching, but our group thinks that every class should be investigative because it comprises the solving of problems and also games, contexts and everything else (…)”
When reading and analyzing the accounts transcribed above, whose goal is to present the progress in the students’ learning process, two reflections stand out. The first is the students’ clear understanding concerning what are the PCN for a first study. Secondly, we can notice the elements of the theoretical basis of this article, such as: dialogue, autonomy, cooperative learning, responsibility over one’s own learning, and the evidence of an investigative practice.
Many analyses may be done concerning these perceptions. However, it is worth highlighting that the students understand that the teaching practice which adopts problem solving is embedded in the investigative practice and this is a very significant reflection for a teacher’s professional development.
Results and final remarksIt is currently frequent for students of IFRS’ mathematics Teacher Training undergraduate
program to point out that teachers in Middle School do not explore the idea of understanding the classmates’ solution for problems and that it is rare to allow students to ask questions in the classroom, since the teachers usually bring worksheets and the classes are all prepared.
In its expanded form, this research was carried out with two groups totaling 52 students. From these 52 students, 47 mentioned situations like the one described in the previous paragraph. Considering this, we may indicate as a first result of this investigative practice the

20Sumário
Proceedings of the 11th Southern Hemisphere Conference on the Teaching and Learning of Undergraduate Mathematics and Statistics ISBN 978-85-8167-237-3
students’ enchantment with the class activities that make an autonomous learning of concepts possible.
In addition to that, the students’ conclusion regarding the methodology of problem solving indicates that the students are included in the learning space. It also demonstrates the processes of taking responsibility and of autonomous learning and, finally, it shows that with freedom of thought they can go beyond what the professor planned for the course.
A question poses itself: Does a practice that promotes investigation make it possible for students to be autonomous in their doing, thinking and learning? From both a theoretical and experimental point of view, our answer is affirmative because the students developed their own reflections based on their experiences and knowledge and established their own dialogues with different interlocutors in this learning process.
We conclude reaffirming the importance of establishing dialogical spaces in teaching practices that promote the learning of concepts of mathematics and that stimulate the understanding of the teacher’s role in schools in the XXIst century.
REFERENCESBONA, Aline Silva De. Espaço de aprendizagem digital da Matemática: o aprender a aprender
por cooperação. Tese (Doutorado). Programa de Pós-Graduação em Informática na Educação. Porto Alegre: UFRGS, 2012.
_____; LEAL, Leandra Borba. O diálogo e a autonomia na prática investigativa de Matemática. XV Fórum de Estudos - Leituras Paulo Freire, Taquara, Rio Grande do Sul, 2013, p. 1-8.
_____; SOUZA, Maria Tereza Coelho. Aulas investigativas e a construção de conceitos de Matemática: um estudo a partir da teoria de Piaget. Revista de Psicologia da USP, v. 6, n. 2, 2015, p. 240-248.
______; A Matemática da Escola: parte de um processo de construção conceitual da ciência exata. In: BONA, Aline Silva De; LUFT, Gabriela Fernanda Cè. (org) Conexões no processo educativo: possíveis olhares sobre a Matemática, a Literatura, a Informática e a Ética. Curitiba: Editora CRV, 2017, p.13-26
BRASIL. Secretaria de Educação Fundamental. Parâmetros Curriculares Nacionais. Brasília, 1998, p. 56-57.
_____. Ministério da Educação. Secretaria de Educação e Cultura. Parâmetros Curriculares Nacionais: Ensino Médio. Brasília: MEC/SEMTEC, 4 v., 1999.
_____. Ministério da Educação e Cultura. Lei n. 9.394, de 20 de dezembro de 1996, Lei de Diretrizes e Bases da Educação Nacional. Brasília: MEC/SEF, 1996.
FREIRE, Paulo. Pedagogia da autonomia: saberes necessários à prática educativa. 22. ed. São Paulo: Paz e Terra, 1996.
PIAGET, Jean. Abstração Reflexionante: relações lógico - aritméticas e ordem das relações espaciais. Porto Alegre: Artmed, 1977.
______. Estudos Sociológicos. Rio de Janeiro: Forense, 1973.
PONTE, João Pedro; BROCARDO, Joana. OLIVEIRA, Hélia. Investigações matemáticas na sala de aula. Belo Horizonte: Autêntica, 2006.

21Sumário
Proceedings of the 11th Southern Hemisphere Conference on the Teaching and Learning of Undergraduate Mathematics and Statistics ISBN 978-85-8167-237-3
CONCEPTIONS OF FUNCTION IN A FIRST CALCULUS COURSE: AN APOS THEORY BASED STUDY
Luisa Rodriguez Doering3
Vanessa de Azeredo Abreu4
Elisabete Zardo Búrigo5
Departamento de Matemática Pura e Aplicada, Universidade Federal do Rio Grande do Sul, Porto Alegre, Brazil
AbstractThis work presents a study about the conceptions of function of students in an initial Calculus course and the ways in which these conceptions favour or hinder the resolution of problems and the accomplishment of tasks in the discipline. The analysis takes as reference the categories of APOS Theory, proposed by Ed Dubinsky and others. A group of thirteen students participated in a follow-up project during the second semester of 2013, when they were taking an initial Calculus course for the second time. During this follow-up, records were collected about students’ problem solving. The analysis of these data (resolutions) allowed us to identify the presence of evidence of the action conception and process conception of function. The action conception of function was apparent mainly in the performance of tasks that can be solved through algebraic manipulations or analysis of partial aspects of the graph of the function. On the other hand, it was also possible to identify that the action conception is an obstacle to the performance of non-routinely tasks that require an overall analysis of the function or coordination of algebraic and graphical records.Keywords: concepts of function; teaching of Calculus; APOS Theory.
INTRODUCTIONThe present work aims to study the conceptions of function of students in an initial
Calculus course and how these different conceptions favor or hinder the resolution of problems and other tasks of the course.
The data were collected during a project developed at the Federal University of Rio Grande do Sul (UFRGS), in the second semester of 2013, to accompany students enrolled in the initial calculus course. This project involved 13 students from engineering and mathematics majors, who accepted an invitation extended to all students who attended this course for the second time, after having failed the previous semester. The follow-up involved discussion about the students’ resolutions to problems, test questions and other tasks of the discipline, with the objectives of promoting their process of awareness, overcoming errors and developing their autonomy in identifying their difficulties and study necessities.
These resolutions and dialogs with students during and after the follow-up meetings have been analyzed in previous papers. In Abreu, Doering and Búrigo [1] we focus our analysis on a case study of a Calculus student’s learning style, while Abreu [2] presents a study of the

22Sumário
Proceedings of the 11th Southern Hemisphere Conference on the Teaching and Learning of Undergraduate Mathematics and Statistics ISBN 978-85-8167-237-3
transition process from high school to higher education in Mathematics, focusing on a first year Calculus course, as well as on its consequences on the student’s conceptions of Calculus, according to an APOS Theory perspective. In these analyses, different ways of thinking about functions were identified, having important consequences on the ways of approaching and solving calculus questions.
In this study, modes of thinking about functions have been analyzed according to the categories of action conception and process conception of function as proposed by APOS Theory [3, 4]. Here we present partial results of this analysis, considering that the identification of these connections between the conceptions of function and the performance of calculus tasks is relevant to the investigations about the difficulties faced in calculus and can support the actions of teachers and the students themselves.
APOS theoryAccording to Dubinsky [5], APOS theory aims to expand Piaget’s ideas originally intended
for the spontaneous constructions of mathematical concepts, adapting them to the analysis of the learning process of advanced mathematics concepts. The name APOS describes the stages of development (of mathematical concepts) identified in the students: Action, Process, Object and Schema. In the APOS theory perspective, an action is a transformation of objects perceived by the individual as essentially external and as requiring, either explicitly or from memory, step-by-step instructions on how to perform the operation. When an action is repeated and the individual reflects upon it, he or she can make an internal mental construction called a process which the individual can think of as performing the same kind of action, but no longer with the need of external stimuli. An individual can think of performing a process without actually doing it, and therefore can think about reversing it and composing it with other processes. An object is constructed from a process when the individual becomes aware of the process as a totality and realizes that transformations can act on it. A schema for a certain mathematical concept is an individual’s archives of actions, processes, objects, and other schemas which are linked by some general principles to form a framework in the individual’s mind that may be brought to bear upon a problem situation involving that concept [3].
Dubinsky and Harel [4] present a classification of conceptions of functions based on APOS Theory. For them, a prefunctional understanding is a vague or disjointed understanding, insufficient to perform mathematical tasks. An individual who has an action conception will tend to think about it one step at a time, like plugging numbers into an algebraic expression or by identifying and marking points on a chart. This tendency to think in terms of step-by-step instructions makes it difficult to perform tasks involving functions that are not given only by a formula. For example, an individual limited to an action conception may be able to obtain a composition of two algebraic functions by replacing each occurrence of the variable in one expression by the other expression, but will have difficulty in thinking about composition when one of the two functions involves, for example, different formulas for different parts of the domain.
A process conception of function involves a dynamic transformation of quantities. The individual is able to think about the transformation as a complete activity beginning with objects of some kind, doing something to these objects, and obtaining new objects as a result of what was done. Carlson and Oehrtman [6] also describe the process conception of function as a generalized view of the function such as obtaining a set of outputs from a set of inputs. An individual that has a process conception is able, for example, to think about the composition of functions, about the relation between a function and its inverse and other functional properties. Finally, when an individual is able to perform actions or processes on functions, such as thinking

23Sumário
Proceedings of the 11th Southern Hemisphere Conference on the Teaching and Learning of Undergraduate Mathematics and Statistics ISBN 978-85-8167-237-3
about the effect of parameter variation (such as those resulting in compressing, stretching and reflecting the graph of a function), successive derivations or to perceive functions as elements of a family of functions, it is considered that he has an object conception of function.
According to Dubinsky and Harel [4], the process conception of function is very complex and involves several aspects in which students can advance in different rhythms or modes. For example, some individuals can think more dynamically when dealing with graphical representations, while others are more adept at handling formulas. This complexity makes it difficult to classify individuals as having an action conception or a process conception of function, based on the evaluation of isolated tasks. Rather than proposing a scale on which all individuals can be categorized, in terms of the development of a conception of function, the authors prefer to refer to relatively weak or strong process conceptions.
In a more recent study involving high school students, Dubinsky and Wilson [7] evaluate the conception of function of survey participants according to the prevalence of indicators that correspond to the action conception or process conception. The authors point out that not all tasks are adequate to evaluate the presence of an action, process or object conception, because depending on the mathematical situation in which the student is working, it may be sufficient to mobilize an action conception, a process conception or an object conception. This shows the need to observe how the individual moves when performing different tasks, with a variety of complexity levels and involving different representations and concepts.
In this article, we do not intend to combine nor to confront several indicators for each of the participants of the research, with the purpose to classify them, but to present and discuss some examples of the students work that can be taken as evidence of the presence of an action conception, of a process conception, or of the transition from an action conception to a process conception. Our focus is on how the prevalence of one or the other conception may favour or hinder the resolution of tasks of an initial calculus course.
Methodological ApproachThe survey participants are students of an initial Calculus course, who engaged in the
project described above. The dynamics adopted in this project consisted of weekly meetings of the researchers with each participant or with small groups, in a day and time previously scheduled. The focus of the meetings was the discussion of the solutions presented by students for Calculus tasks. The students were instructed before each meeting to solve questions from tests and exams of the previous semester, exercises of the textbook, or exercises discussed in class. During the meetings, these solutions were discussed, so that the students could explain the reasoning developed, clarify doubts and correct any errors. The students were also invited to compare the output presented at that time with the answers they had produced the previous semester. Throughout the project, records of speech and writing were collected from all those involved, through recordings, annotations, and the archives of all the material produced by them. All participants authorized the use of the records of their dialogue and writing for the research.
The analysis of the material produced by the students allowed us to identify indications and evidence of the presence of the action conception and the process conception of function, and connections between these conceptions and the resolutions of the tasks of an initial calculus course. The materials selected for the discussion presented in this article refer to three students, named A, B and C, whose examples can be considered similar to or representative of the others.

24Sumário
Proceedings of the 11th Southern Hemisphere Conference on the Teaching and Learning of Undergraduate Mathematics and Statistics ISBN 978-85-8167-237-3
Function Conceptions in Calculus TasksIn this section we present analysis of the students’ work. Since our data are written in
Portuguese, below each figure we present the translation of the written information of the statements and resolutions of the questions, in the corresponding numbered items.
The Action Conception of a FunctionWe initially analyze a situation in which Student A reported difficulty in reading his
calculus textbook. The difficulty referred to an example of calculating the integral shown in Figure 1. Student A requested our help to understand the resolution presented in the textbook, as shown in the same Figure [8,p.368]. Understanding this example requires the student to have some resourcefulness and anticipation to follow the steps that are presented and identify others that are omitted. For example, he needs to realize that it is possible to write u2 = 3x2, and that from this equality results u = √3x.
Figure 1. Worked out example from the textbook.(1) “Example 5 Evaluate […]”.(2) “Solution: Replacing […]”.(3) “[…] we get […]”.From discussions with the student, we can determine that he does not understand
that 1/(1 + 3x2) can be treated as the expression of a composition of functions, and that the decomposition into u = √3x and f (u) = 1/(1 + u2) is convenient, since the primitive for the last expression is known. According to Dubinsky and Harel [4], to deal with a composition of functions, the individual needs to develop a process conception of function, since it is necessary for him to perceive the function given as a combination of transformations applied to a set of values, not just as a formula to be applied to each isolated value. Moreover, in order to understand the resolution forwarded in the textbook, it is necessary to imagine, understand, and reflect on a procedure that was not performed by the individual himself. The student’s difficulties on this issue indicate that his conception of function could be restricted to a weak action conception, which could make it difficult to follow the classes and to even use the textbook.
The following question was extracted from a test taken in the second semester of 2013 by students in a first Calculus course (Figure 2). During a meeting we asked Student B to solve this question, which asks for the inverse function of a function given in two parts, and their respective domains.

25Sumário
Proceedings of the 11th Southern Hemisphere Conference on the Teaching and Learning of Undergraduate Mathematics and Statistics ISBN 978-85-8167-237-3
Figure 2. Question and solution taken from Student B’s Test 1.(4) “Question 2 (1.2 points) Consider the invertible function h and its graph: […].”(5) “a) Evaluate h (h(5)).”(6) “b) Find an expression for the function h-1. Don’t forget the domain.”We note that Student B deals with the two parts of the function as separate functions,
naming each one as h, and each inverse as f -1. Then he applies an algebraic technique to determine the inverse function of each of these parts. This inversion is evidence of the presence of an action conception, that is, the student is able to mathematically deal with each function, applying an appropriate procedure (executing the same specific sequence of steps, in the same order, in each part of the function). The student’s presentation of the domain does not make explicit its relation with the expressions obtained. Apparently Student B does not think of h, or f -1, as a function with different expressions in different parts of its domain, but as a conjunction of two functions. This indicates that the student does not have a conception process of function and performs the task somewhat mechanically.
The next example, presented in Figure 3, was extracted from a test taken in the first semester of 2013 of a first Calculus course.

26Sumário
Proceedings of the 11th Southern Hemisphere Conference on the Teaching and Learning of Undergraduate Mathematics and Statistics ISBN 978-85-8167-237-3
Figure 3. Question and solution taken from Student B’s Test 2.(7) “Question 1 (1.5 pts) Let f be the function given by the graph below, with domain (-
∞, 4].”(8) “Based on the graph, analyze the continuity of f at the points a = -3 and a = 1. Justify
your answer in each case.”(9) “It is not continuous at the point a = - 3 because ‘I lift the pencil’.”(10) “It is continuous at the point because I don’t lift the pencil and because the lateral
limits are the same.”The first item of the question asks the student to verify if the function f given by the graph
is continuous at the points of abscissae a = - 3 and a = 1. In order to verify the continuity of the function f at the point a = - 3, Student B uses an intuitive criterion mentioned in the Calculus class, namely, about “lifting the pencil” in the plot. The marking made on the graph (Figure 3) indicates that the student applied this intuitive criterion literally, i.e., he overwrites the graph with his own pencil, in a physical manipulation that can be considered as an indication of an action conception of function. In addition, Student B extracts from the graph the lateral limits of f at the point a = - 3, but there is no evidence that the student concludes, from these limits, that the function is continuous, or discontinuous, at this point. In order to justify the continuity of the function f at the point of abscissa a = 1, the student argues that he “does not lift the pencil”, and that the lateral limits are the same, which is valid, but incomplete, since he does not verify whether the evaluation of the function at a = - 3 brings forth the same value as the lateral limits. The arguments or justifications presented by Student B in his resolution corroborate the indications of an action conception of function, which proved insufficient for a consistent conclusion of the continuity of the function f at the given points. In fact, the verification of the continuity of a function at a point requires the coordination of several actions - identification of the lateral limits and the confrontation of these limits with the value of the function at the point - characterizing the need for at least a process conception of function, which the student seems to have not yet developed.

27Sumário
Proceedings of the 11th Southern Hemisphere Conference on the Teaching and Learning of Undergraduate Mathematics and Statistics ISBN 978-85-8167-237-3
The Process Conception of a FunctionThe analysis of the previous examples indicates that there are tasks in an initial calculus
course that can be solved without the need for an overview of the function, through the application of routine procedures, involving some algebraic techniques and simple evaluations. There are other types of tasks for which there is no routine procedure to follow.
The example presented in Figure 4 refers to a question from the second exam that Student C took while attending, in the second semester of 2013, the initial Calculus course for the second time. This question asks the student to decide on the veracity of the statement “If f is a function such that f (2) = 3, then f ’(2) = 0.”
Figure 4. Question and solution taken from Student C’s Test 2.(11) “If f is a function such that f (2) = 3, then f’(2) = 0.”(12) “It is not possible to state this without knowing the function, because there is no
guarantee that f is constant, so it is not possible to state that […].”Student C’s writing indicates that he sees the function f evaluated at x = 2 as a particular
case of a function in a larger domain that contains this point, and when thinking globally about the function, he realizes that the information about f at only a point does not guarantee anything about what happens at all the other points of the domain: “nothing guarantees that f is a constant”. It is possible, though we cannot be certain, that Student C has realized that nothing can be said about how f varies in the neighborhood of the point, which would indicate a strong process conception of function. We also point out that neither Students A or B sketched an attempt to resolve this question, leaving it blank. Thus, to solve this kind of question, it is necessary to think of f as a generic function (to deal with the function in a global way), as evidenced by Student C in his argument.
The question presented in Figure 5 is taken from a test applied in the second semester of 2013 to students of the initial calculus course.
Figure 5. Question 1 taken from Student C’s Test 1.(13) “Question 1 (1 point) A painter was hired to paint two internal walls of a rectangular
room, as illustrated in the picture below.”(14) “It was only informed him that the height of the room is 2.5 m and that the floor area
is 20 m2. Based on this information, is it possible to determine the sum of the wall area that is going to be painted in terms of the room’s length x, shown in the picture? In the affirmative case, determine such a function, not forgetting its domain.”
We asked Student C to resolve it during a meeting (see Figure 6).

28Sumário
Proceedings of the 11th Southern Hemisphere Conference on the Teaching and Learning of Undergraduate Mathematics and Statistics ISBN 978-85-8167-237-3
Figure 6. Resolution of Question 1 above by Student C.(15) “y is the length of the wall!”.(16) “2,5 m is the height!”.(17) “Then […].”(18) “Since it is two walls: […]”.(19) “Since the area is the product of the sides, then any positive value can assume the
property!”. Initially, Student C identifies the variables of width and length of the room, naming them
x and y, relating them, writing the floor area equation for the room, and then expressing the variable y as a function of the variable x by writing y = 20/x. He expresses the area as the product of the two variables, disregarding the data on height, which does not matter at this point. Then Student C finds the area of one of the walls to be painted as 2.5∙y, using the given data that the height of the wall is 2.5 meters. Making use of the expression y = 20/x, Student C finds the area of one of the walls to be painted as a function of the width x, and justifies it arguing that, since there are two walls, it is necessary to multiply by 2 the result found by 50/x, hence getting A(x) = 100/x, with x > 0. The following is the transcription of the verbal description of Student C’s resolution.
Student C - The first question asked whether it was possible to determine the area to be painted depending on the floor area, wall area. Then, I got the length of the floor area, the lateral length, which they named y, isolated the variable and found the length. As the height here in the problem was already given (specified), I simply multiplied it by the formula of the area, length times the height. As there were two walls, I multiplied by two and found the result 100/x. Because the domain is proportional, it is a product [he means x·y=20], no matter what the size of the length, what matters is that they are [inversely] proportional. So, therefore, the domain has to be only greater than zero, the other vertex will be [inversely] proportional.
Modeling the situation described in the statement requires several coordinationsand choices: it is necessary to identify relations between a given variable and the length variable, not explicit in the statement, and to obtain a formula for the area to be painted as a composition

29Sumário
Proceedings of the 11th Southern Hemisphere Conference on the Teaching and Learning of Undergraduate Mathematics and Statistics ISBN 978-85-8167-237-3
of three functions, namely the function which expresses the length as a function of width; the function that expresses the area of a wall as a function of its length; and the one which expresses the area to be painted as double the area of a wall. The student’s combination of these functions and his description show that he perceived each of the functions as processes in which variables are dynamically related. In addition, they show that he not only followed a sequence of steps, but planned the solution globally, identifying from the start that it was a question of composing functions described in the problem with another that should be identified, which seems to indicate a strong process conception of function.
The question presented in Figure 7 asks for the domain of the inverse function of a given function.
Figure 7. Question 2(a) and resolution taken from Student C’s Test 1.(20) “Question 2 (1 point) Consider the invertible function g and its graph: […].”(21) “Determine the domain of the inverse function of g. Justify.”(22) “[-5, 4] the domain of the inverse is the image of g(x)!”The following is the transcription of the verbal description of Student C’s resolution.
Student C - Well, here the first question asked me to determine the domain of the inverse function of g. The domain of the inverse function of g is just the image of g, so I got the image data, inverted the coordinates, and found the domain easily.
We can observe above that the student explains generically the method used in solving the question, which can again be taken as an indication of a strong process conception of function. The following item asks for the graph of g -1 (Figure 8).
Figure 8. Question 2(b) and solution taken from Student C’s Test 1.(23) “Plot, in the above grid, the graph of g-1.”The following is the transcription of the verbal description of Student C’s resolution.
Student C - This one has the traditional method that you can do that is the one I did: to reverse the points, interchange the ordinates with the abscissae, as you can also plot the bisector line and then you can reflect the graph, that this will be

30Sumário
Proceedings of the 11th Southern Hemisphere Conference on the Teaching and Learning of Undergraduate Mathematics and Statistics ISBN 978-85-8167-237-3
the proportion [he means relationship between the graphs of g and g-1], but I feel safer doing this inversion method here.
When asked to justify his choice of plotting, the student realizes that the technique of inverting the coordinates, applied to only a few points as described by him, is the basis for the second, which consists of reflecting the graph of the given function g around the bisecting line of the coordinate axes. This discussion about his solution also allows the student to realize that the inversion of the coordinates of some points is not enough to plot the graph of g -1and that the reflection of the graph of g around the bisector line of the coordinate axes is the one that guarantees the correct graph of g -1. The fluency in passing from numerical to graphical registers, and thinking globally about the function graph give us further indications of a strong process conception of function.
Final considerationsThroughout this work, through the analysis of the material produced by three students
attending an initial calculus course for the second time, we identified indications and evidence of conception action and conception process of function, as well as connections between these conceptions and the manner in which these students approached the problems and tasks of a calculus course.
In the resolutions of Students A and B, we find indications of function’s conceptions that limit their problem solving strategies and may prevent them from advancing in the understanding of more advanced mathematical concepts. Student A commonly answers questions that require, at most, an application of a procedure, presenting difficulty in understanding and reflecting on his own actions. The evidence indicates that Student A is limited to an action conception of function. We found that Student B also generally transforms his resolutions into routine procedures and manages to solve many questions with relative success; however, he does not address questions whose statements require an overall assessment of the function or coordination of algebraic, graphical, and numerical records. The way Student B reflects on his actions, justifying them, questioning the possibility of alternative solutions and identifying possible mistakes could, on the other hand, be an indication of a transition from an action conception to a process conception of function.
The second time Student C took an initial calculus course he evidenced a strong process conception of function that possibly contributed to his ability to construct a more advanced understanding of the concepts studied. Student C has the habit of presenting, in his solutions, a justification for each step taken that is often presented in a generic way.
The analyses carried out here provide evidence that students who demonstrated only an action conception of function found difficulty mainly in dealing with questions that require the use of geometric arguments or formal definitions, as well as with questions that require the presentation of a justification, or a counter-example, to guarantee the validity, or falsity of a statement, respectively.
We believe that investigations regarding the conceptions of function, in the context of an initial Calculus course, can open new perspectives and contribute to the understanding of the dynamics of teaching and learning processes in this discipline. The analyses presented in this work and the follow-up with the students in the second semester of 2013 suggest new areas for investigation in the area of teaching and learning of Calculus.

31Sumário
Proceedings of the 11th Southern Hemisphere Conference on the Teaching and Learning of Undergraduate Mathematics and Statistics ISBN 978-85-8167-237-3
REFERENCES[1] Abreu VA, Doering LR, & Búrigo EZ. (2015) Estudo de caso sobre estilos de aprendizagem:
um aluno de Cálculo [Case study on learning styles: a student of Calculus]. In: Cardona AV, Cabral TCB, editors. Anais do XII Encontro Gaúcho de Educação Matemática [Proceedings of the 12th Conference on Mathematics Education]; 2015 Sep 30 – Oct 1; Porto Alegre, Brazil. Porto Alegre (Brazil): PUCRS, 2015. p. 1-12.
[2] Abreu VA. (2015). As concepções de cálculo na transição do Ensino Médio para o Ensino Superior: uma visão da teoria APOS [The conceptions of Calculus in the transition from High School to Higher Education: a view of the APOS theory] [monograph]. Porto Alegre (Brazil): Universidade Federal do Rio Grande do Sul; 2015.
[3] Dubinsky E, & Mcdonald M. A. (2003). APOS: A Constructivist Theory of Learning in undergraduate mathematics Education Research. In D.Holton et al. (Eds.), The teaching and learning of mathematics at university level (pp. 275-282). Springer Netherlands.
[4] Dubinsky E, & Harel G. (1992). The nature of the process conception of function. In: E. Dubinsky & G. Harel (Eds.), The concept of function: aspects of epistemology and pedagogy, pp. 85-106.Washington (DC): Mathematical Association of America, (MAA Notes, 25).
[5] Dubinsky E. (2001). Reflective Abstraction in Advanced Mathematical Thinking. In D. Tall D (Ed.), Advanced Mathematical Thinking, pp. 95-123. Dordrecht (Netherlands): Kluwer Academic Publishers.
[6] Carlson M, & Oehrtman M. (2005). Key aspects of knowing and learning the concept of function. In: A. Selden & J. Selden J (Eds.), Research Sampler. Washington (DC): Mathematical Association of America (Research Sampler 9).
[7] Dubinsky E, & Wilson RT. (2013). High school students’ understanding of the function concept. 2013; The Journal of Mathematical Behavior, 32(1),83-101.
[8] Anton H, Bivens I, & Davis S. (2007). Cálculo [Calculus]. Porto Alegre (Brazil): Bookman.

32Sumário
Proceedings of the 11th Southern Hemisphere Conference on the Teaching and Learning of Undergraduate Mathematics and Statistics ISBN 978-85-8167-237-3
A NOVEL APPROACH TO MATHEMATICS EXAMINATION DESIGN AND MARKING
David Easdown
Brad Roberts
University of Sidney
Ruth Corran
American University of Paris
Abstract: We introduce, motivate and describe a new approach to the design and marking of mathematics examinations. The method is suitable for successfully mapping student performance to a range of grade thresholds in the context of holistic or criterion-based assessment. It uses just one examination to assess and distinguish the performance and achievement of students coming from a bimodal or multimodal distribution with regard to backgrounds, preparedness and aspirations. The method combines and reflects the two phases in the SOLO taxonomy that distinguish deep from superficial learning. This also highlights different learning behaviours and outcomes as students move through and beyond liminal space, in the theory of threshold concepts. The design has been implemented in the School of Mathematics and Statistics at the University of Sydney, particularly with regard to assessment of mathematics units of study taken by large numbers of first year students.
INTRODUCTIONMathematics examinations typically involve extended answer questions or problems
that require students to write solutions that demonstrate their knowledge, understanding and ability to communicate and reason mathematically. This article is primarily concerned with a new design and assessment of extended answer questions, especially in the context of holistic theories of learning and criterion-based assessment. Our method has similarities to alternative techniques to traditional grading introduced by Brilleslyper et al (2012) and Brilleslyper and Schaubroek (2011), where educators introduce a “points-free” approach to assessment, combining holistic criteria and assessment paradigms that promote deep learning. Our method evolved quickly in response to practical difficulties associated with changes in assessment policies at the University of Sydney in years leading up to 2013, and has been widely used in marking examinations in First Year mathematics at the University of Sydney since 2014.
In Sections 2 and 3, we describe briefly traditional methods of marking, compare norm-referenced and criterion-referenced grading, and give some historical background that led to development of our method. In Sections 4 and 5, we briefly describe the SOLO taxonomy and theory of threshold concepts, which intertwine and provide a theoretical basis for understanding our method and how it applies in evaluating depth of student learning. The method, algorithm and an implementation are presented in Sections 6 and 7, with reference to examination questions provided in the Appendix. In Sections 8 and 9, we make brief comments about ‘hyperbolic’ as opposed to ‘linear’ grading, and discuss the possibility of paradoxes and moderation.

33Sumário
Proceedings of the 11th Southern Hemisphere Conference on the Teaching and Learning of Undergraduate Mathematics and Statistics ISBN 978-85-8167-237-3
TRADITIONAL METHODS OF MARKING MATHEMATICS EXAMINATION SCRIPTSTraditional methods of setting and assessing extended answer questions in mathematics
examinations tend to rely on numerical grading, involving simple aggregation of marks. Examination questions take the form of problems or exercises, often broken down into steps or parts, each of which is allocated a specified number of marks. While writing an answer, the student may be aware of the mark value of a question or part of a question, which may be explicitly stated or easily inferred from instructions. Afterwards, the students’ answers are assessed by the marker, who allocates marks, often using a marking scheme that has been prepared beforehand by the examiner, or may have evolved in a period of trial marking, or possibly left to the marker’s discretion. If a marking scheme changes in the process of marking, then the marker should go back and ensure that the changes are applied fairly across the entire cohort, even if this involves remarking scripts.
The new method, described below, differs from the traditional method primarily in its use of letter grades, rather than numerical marks, utilising qualitative characteristics as well as non-linear aggregations of credit, which are then combined in a novel way when the examination has several questions.
NORM-REFERENCED AND CRITERION-REFERENCED GRADINGThe use of pre-determined proportions of a population of students, as the primary basis
for the allocation of grades, is an example of norm-referenced grading, also known as “grading to the curve”. This method aims to achieve fairness of grades between different disciplines, especially with diverse assessment practices and approaches to grading, and to maintain continuity of historical standards.
In the Faculty of Science at the University of Sydney, norm-referenced grading was widespread up until about 2012, and it was expected that, for large cohorts of students taking a unit or study, or a suite of related units of study, as a proportion of the passing cohort, at most
• 5% would achieve High Distinctions, • 20% would achieve a Distinction or higher, and• 55% would achieve a Credit or higher. There was no explicit stipulation about what proportion of the class should pass or fail.
The passing criterion had been at the discretion of the academic or team of academics involved in the assessment. If the criterion was not explicit it could, for example, be related to the academic’s professional opinion and knowledge of the subject matter, and possibly influenced by historical practice with regard to relative perceived levels of difficulty from year to year. Consider then, in this framework, that a passing grade had been established in a unit of study with large enrolments. Without reference to criteria, one could simply take the rank order of the passing grades and then map, at most, the
• 45th percentile to 65, the minimum final grade for a Credit,• 80th percentile to 75, the minimum final grade for a Distinction, and• 95th percentile to 85, the minimum final grade for a High Distinction.In practice, this may not be so simple, especially if one has to balance numbers of students
between units of study that serve different purposes, such as preparation for honours courses. Nevertheless, however one achieves the final grades, the starting point in norm-referenced assessments is to limit the award of higher grades to certain predetermined proportions.
34Sumário
Proceedings of the 11th Southern Hemisphere Conference on the Teaching and Learning of Undergraduate Mathematics and Statistics ISBN 978-85-8167-237-3
Assessment policies at the University of Sydney evolved over about ten years preceding 2013, moving away from norm-referenced grading. From 2014 onwards, criterion-referenced grading was, in principle, universally adopted at the University of Sydney: Coursework Policy 2014, item (3) of Part 14, Clause 63 stipulates that
Students’ assessment will be evaluated solely on the basis of students’ achievement against criteria and standards specified to align with learning outcomes.
How ‘evaluation’ should take place is left open to interpretation and professional practice in the relevant discipline. Practices within the School of Mathematics and Statistics, leading up to 2014, worked very well: simple criteria were used to determine which raw marks should map to particular grade thresholds. For example, it was common for a raw aggregate of about 40 marks to map to a final Passing grade threshold of 50, on the basis that this achievement demonstrated routine knowledge across a spectrum of topics and important ideas in the course. It was also common that a raw aggregate of about 90 would map to a final High Distinction grade threshold of 85, on the basis that this achievement demonstrated complete or close to complete mastery of the material. Having a flexible raw mark range of about 40-90 mapping to 50-85 had the virtue that academics could set a wide range of challenging assessments tasks, and had plenty of room to make a professional judgment to match raw marks to criteria.
From 2014, however, the practice of mapping raw marks was forbidden. All academic staff were instructed that students’ raw aggregates of numerical marks must translate directly into final grades. Thus, an academic had to design assessment so that, at one extreme, a raw total of 50 exactly matched the Passing criteria, and, at the other extreme, a raw total of 85 exactly matched the High Distinction criteria. Only a very narrow range, from 50-85, was available to distinguish the relative performances of students.
This produced a conundrum. On the one hand, assessments had to be easy enough that weak students, who just deserved to pass, would accumulate 50 raw marks: but then many students who did not deserve high distinctions might easily accumulate 85 or more raw marks. On the other hand, assessments had to be difficult or challenging enough that a strong student, who just deserves a High Distinction, would accumulate 85 raw marks: but then many weak students who deserve to pass might not accumulate 50 raw marks. The purpose of the exam design described in this article is to successfully resolve this conundrum and create an exam where the numerical raw marks exactly match, or match as closely as possible, the criteria for the different grades.
THE SOLO TAXONOMYThe SOLO (Structure of Observed Learning Outcome) taxonomy was devised by Biggs
and Collis (1982) as a tool for classifying learning and teaching activities and outcomes, and is useful in practical applications of the theory of constructive alignment (see, for example, Biggs and Tang (2007)). It is especially useful for understanding the underlying framework for the new marking method proposed below.
The SOLO taxonomy uses three basic categories to describe the level of a student’s understanding or comprehension. In the prestructural phase, a student has not properly grasped or understood anything significant related to the subject matter. The level of cognition could be described as amorphous, tending towards chaotic, and without clear identifiable structure or coherence.
In the quantitative phase, the student may have grasped or mastered isolated pieces of information or technique, but does not see or understand how these come together to produce

35Sumário
Proceedings of the 11th Southern Hemisphere Conference on the Teaching and Learning of Undergraduate Mathematics and Statistics ISBN 978-85-8167-237-3
a coherent whole. This phase can be broken up into an initial unistructural subphase, where a student has successfully focused or mastered just one aspect of the topic, followed by the multistructural subphase, where the student manages to focus on more than one, and possibly many, aspects. The second subphase could, in principle, split up into a succession of subphases, as a student includes more and more aspects to his or her repertoire. In a certain sense, the student is aggregating expertise. However, this aggregation remains essentially disconnected and individual items retain, in the mind of the learner, the characteristic of being isolated from one another.
In the qualitative phase, the student begins to see how ideas and techniques from the quantitative phase come together to form an integrated whole, where individual parts coordinate, as in an orchestra, to work together to produce a powerful concept or method. There is an effect of precipitation, or crystallisation, where suddenly, or very rapidly, a coherent and complete “whole” emerges, which becomes “greater than the sum of the individual parts”. Aspects of learning, arising in the quantitative phase, may seem useless, inanimate or sterile when viewed in isolation (and indeed students often complain “what is the use of this?”), but only derive their power and full sense of purpose from being integrated into a fully functioning, live, complex system.
This higher qualitative phase may be viewed as breaking up into two subphases: the relational subphase refers to the initial coming together or integration of parts. It marks a critical point or threshold (and see discussion about threshold concepts below), where the fog miraculously lifts. The student may experience an epiphany moment, where meaning and significance become apparent and the subject matter transforms. The student shifts position from, previously, being a superficial learner to, now, becoming, or having the potential to become, a deep learner and expert. Learning potential may expand rapidly, even explode, as the student moves into the highest extended abstract subphase: here integration leads to further conceptualisation, or elevated levels of abstraction and generalisation, giving rise to surprising and spectacular insights, breakthroughs and applications. By moving into, and thereafter inhabiting, the extended abstract phase, the student becomes a master of his or her own learning, reaching at least one major peak or viewpoint, from which other peaks also become visible, and may be in a strong position to then embark on research, exploring new ideas and making discoveries.
THRESHOLD CONCEPTS AND LIMINALITYThe theory of threshold concepts was introduced and developed by Meyer and Land
(2003) (and see also Meyer and Land (2005) and Land et al (2005)), in order to explain and inform processes that lead to successful and deep learning. A threshold concept is a key idea or notion associated with a particular discipline that has transformative and integrative properties, opening up pathways or portals, to new and otherwise inaccessible knowledge and understanding. One hopes to identify threshold moments, when the student’s understanding or perception crystallises, empowering the student. By reaching these new vantage points, entire vistas and panoramas open up, facilitating rapid progress and exploration. In order to move towards and reach such portals, students embark on journeys along pathways that may be problematic, frustrating or troublesome, involving twists and turns, possible backtracking and repetitive behaviour, making and recovering from mistakes. Before reaching a particular portal, a student is said to be in liminal space.
The educator’s principal task is to create or facilitate an environment in which the student is prompted first to move into liminal space (possibly from an initial state referred to as preliminal), and then successfully navigate his or her way through it until the relevant

36Sumário
Proceedings of the 11th Southern Hemisphere Conference on the Teaching and Learning of Undergraduate Mathematics and Statistics ISBN 978-85-8167-237-3
threshold concept is mastered. This can involve a great deal of time and effort. The effect of mastering a threshold concept is so powerful that the changes in the learner’s mind become irreversible: “once learned, never unlearnt”.
This underlying theoretical framework encourages the educator to move away from a linear, indiscriminating list of topics, and instead focus attention on the most important knotty or problematic aspects of a particular discipline that lead to the most profound, far-reaching and accelerated learning. The theory is relatively undeveloped in mathematics, though there are some exploratory articles (see Easdown (2007), Wood et al (2011), Easdown (2011a), Easdown (2011b), Jooganah (2009), Pettersson (2011) and Easdown and Wood (2014)).
The relevance to this article is, firstly, that preliminal and early features of liminal space may correspond roughly to the prestructural and quantitative phases of SOLO. Measures of progress in these phases tend to relate to an accumulation or aggregation of disconnected or isolated skills or pieces of information. Secondly, the act of reaching the portal associated with a given threshold concept, and then unlocking the power of the underlying ideas or techniques, corresponds roughly to moving into the relational and extended abstract phases of SOLO. Measures of success are now expressed in terms of mastery, fluency and depth of learning, and may typically be associated with grades that reflect distinction, honours and research potential.
THE NEW METHOD AND MARKING ALGORITHMIn the new method described here, the underlying marking algorithm is the same for all
questions on the examination, though there could be question-specific points of interpretation. Each written extended answer receives one letter grade from amongst the following list, in descending order of quality:
AA, A, BB, B, CCC, CC, C, D, E, F, Z. In the implementation described below, this spectrum of letter grades turns out to be
practical and adequate. One could add further refinements (for example, introducing AAA or BBB grades), but doing so risks making the marking algorithm too complicated or difficult to apply rigorously and fairly. The following four letter grades are superior:
• AA and A, corresponding to a student response within the extended abstract phase of SOLO, where
AA corresponds to complete mastery, and A to almost complete mastery; and• BB and B, corresponding to the relational phase of SOLO, where BB corresponds to a student
response exhibiting excellence that remains within the relational phase, but does not quite reach the extended abstract phase, and B corresponds to a student response that just reaches the relational phase. The passing letter grades are the following:
• CCC, CC and Ccorresponding to a student response within the multistructural phase of SOLO, indicating
routine but meritorious competency across a spectrum of ideas or techniques associated with the topic, but which falls short of entering the relational phase; the measure of quality is indicated by the number of distinct positive attributes in the answer, ranging from four positive attributes for C, five positive attributes for CC, and six or more positive attributes for CCC. The inferior letter grades are the following:
• D, E, F and Z, corresponding to a student response within the multistructural, unistructural and
prestructural phases of SOLO, indicative of isolated pockets of competence; where D, E and

37Sumário
Proceedings of the 11th Southern Hemisphere Conference on the Teaching and Learning of Undergraduate Mathematics and Statistics ISBN 978-85-8167-237-3
F correspond to three, two and one positive attributes respectively, and Z corresponds to a complete absence of positive attributes.
In terms of the theory of threshold concepts, a student whose learning remains in liminal or preliminal space with respect to the topic at hand, is almost certain to receive a passing or inferior grade. By contrast, a student who has successfully navigated through liminal space to reach the portal is likely to perform at a level that receives a superior grade. If the student has made active use of this transformative knowledge then he or she has a reasonable expectation of achieving the highest possible grade.
The marking algorithm to be followed by the marker, for each examination question, is precise and proceeds in two phases:
Marking Algorithm:
1. First Phase: if the student’s answer is of superior quality award a grade of AA, A, BB or B, in descending order of quality;
2. Second Phase: if the student’s answer is not of superior quality, then look for an accumulation of distinct positive attributes, awarding a grade of Z (for zero), F, E, D, C, CC, CCC, in ascending order, with a ceiling of CCC (for six or more positive attributes).
If an answer is of superior quality, then the marker remains only in the First Phase, theSecond Phase is avoided and there is no need to try to identify positive attributes. If an
answer is perfectly integrated and masterfully written, with at worst only minor or trivial blemishes, then the highest AA rating is applied. If there is at least one substantial defect, but the answer is clearly in the extended abstract phase of SOLO, then the next highest rating A is applied. If the answer is relational but exhibits sufficiently many defects or omissions so as to not qualify as extended abstract, then either BB or B is awarded, in decreasing order of quality.
Only if an answer is not deemed to qualify as having superior quality, then the marker moves into the Second Phase, looking for an accumulation of distinct positive attributes. It is important, in this phase, that the marker is not simply trading off negative and positive points or attributes, which typically happens in more traditional marking schemes. A student may write some or a lot of nonsense, that disqualifies him or her from a superior grade, in the First Phase. However, this defective material should not then, in the Second Phase, prejudice the student from receiving at least some credit for exhibiting isolated pieces of knowledge, technique or understanding.
It is important to note, in evaluating the student’s work, that the roles of the First and Second Phases are different: in the First Phase, one may find deficiencies that contribute towards the impression that the student is not operating in the relational or extended abstract phases of SOLO (or has not in fact mastered the corresponding threshold concept); yet, the same piece of work, in the Second Phase, may possess one or more distinct positive characteristics that are counted towards a lower grade. This is not a contradiction or paradox, but simply recognition of different phases of learning, and finding and rewarding credit where it is due.
The Marking Algorithm described above, of course, may be supplemented, or fleshed out, by providing feedback, in the case that the assessment has formative properties, to any degree of detail that the educator feels will be helpful, to explain how the final grade was obtained and to support the student’s ongoing development and learning.
AN IMPLEMENTATIONWe describe a recent implementation of this method in a summative examination for
MATH1111 Introduction to Calculus, at the University of Sydney. For MATH1111, and many other

38Sumário
Proceedings of the 11th Southern Hemisphere Conference on the Teaching and Learning of Undergraduate Mathematics and Statistics ISBN 978-85-8167-237-3
mathematics units of study, levels of academic performance are rewarded with the following passing and higher grades:
• High Distinction (HD): complete or close to complete mastery of the topic;• Distinction (DI): excellence, but substantially less than complete mastery;• Credit (CR): creditable performance that goes beyond routine, but less than excellence;• Pass (PA): routine knowledge or understanding across a spectrum of ideas or concepts.When a grade is awarded for an entire unit of study, the student receives a numerical
grade within the spectrum 0 to 100, according to the following thresholds and ranges:• 85-100 for High Distinction;• 75-84 for Distinction;• 65-74 for Credit;• 50-64 for Pass;• 0-49 for Fail.In describing this implementation, we are only considering the extended answer section
of the MATH1111 examination. A discussion of how this grade combines with other formative and summative assessments, to form final grades for the overall unit of study, raises delicate issues that are beyond the scope of this article. The four examination questions appear in the Appendix, and test a variety of concepts and techniques from the course. They were designed from the point of view that, for any given question, at least four substantial defects or omissions in a student’s answer would have the effect of ‘disconnecting’ it, so that it should not be regarded as evidence of successful learning in the qualitative phase of the SOLO taxonomy. Equivalently, the questions were designed so that at least four substantial defects or omissions in a particular answer translates into evidence that the student remains in liminal or preliminal space and has not successfully mastered the relevant threshold concept or concepts. Thus, in this case, Step 1 (First Phase) of the Marking Algorithm simplifies: the marker awards a superior grade according to how far the answer is from a demonstration of complete mastery, by looking for up to three substantial defects, errors or omissions. If there are four or more substantial defects, the marker moves into the Step 2 (Second Phase), and then looks for an accumulation of positive characteristics. In realising the algorithm in this instance, therefore, the markers received the following technical instructions:
Marking Instructions:
1. Draw a line down the side of each page that you have looked at.
2. On the side of the line away from the student’s work, place a cross against a substantial error or omission, in the first phase when deciding to award AA, A, BB or B. Do not put ticks in the first phase. As soon as you find four crosses, move directly into the Second Phase (no need to spend time locating all errors or omissions).
3. If moving into the Second Phase, place a tick against each distinct positive attribute on the side of the line away from the student’s work, when deciding to award Z, F, E, D, C, CC, CCC.
4. Do not place any markings on the work itself, only nearby on the side of the line away from the student’s work.
5. Place the letter grade at the end of the student’s answer for that question, on the side of the line away from the student’s work.

39Sumário
Proceedings of the 11th Southern Hemisphere Conference on the Teaching and Learning of Undergraduate Mathematics and Statistics ISBN 978-85-8167-237-3
These instructions minimise writing on the script, simplify the process of checking the marking later, if necessary, and also assist the student in understanding how the grade was determined, in the case that he or she requests a review or makes an appeal.
A given student would receive four letter grades, one for each of the four questions. To convert these to a numerical aggregate with a maximum score of 4 ⨉ 8 = 32, the letter grades were converted to numerical scores as follows:
• AA=8, A=7, BB=6, B=5.5, CCC=5.5, CC=5, C=4, D=3, E=2, F=1, Z=0.The equivalent grade thresholds were then given the following natural interpretations,
which correspond exactly or very closely to the final minimum numerical grade thresholds:• High Distinction = A + A + A + A = 28/32 = 87.5%,• Distinction = BB + BB + BB + BB = 24/32 = 75%,• Credit = B + B + B + B = 22/32 = 68.75%,• Pass = C + C + C + C = 16/32 = 50%.The following points should be noted:1. The numerical conversion of the B and CCC grades in this implementation coincide
exactly with 5.5. One could of course adjust the conversions so that the passing grades are worth slightly less. For this cohort and academic context, however, even though a student may not have reached the relational phase of SOLO, an answer including six or more distinct positive attributes on a given question was deemed sufficient evidence of meeting criteria for a Credit.
2. A student could produce any combination of letter grades for the four questions, which are then aggregated numerically using the above conversion (and see the discussion below about the possibility of paradoxes). For example, a student could achieve a High Distinction with the combination AA+AA+A+CC=28/32, reflecting the relative levels of difficulty of the questions. Similarly, a student could achieve a Pass with combinations such as BB+CC+D+E=16/32, or A+B+C+Z=16.5/32.
3. The design of the questions, in increasing difficulty, in this implementation, leads naturally to combinations of letter grades that tend to be nonincreasing. If the examiner, on reflection, feels that the aggregates are too high or low, corresponding to the published criteria, then they can be adjusted. For example, in this exam, Q1 is very easy, and Q4 is very difficult, and for this particular examination, one might have considered AA+A+A+C as corresponding to the minimum threshold for a High Distinction and CC+C+C+F as corresponding to the minimum threshold for a Pass, and so on.
4. The numerical conversions given above turn out to be convenient and appropriate for this particular implementation (especially using fractions of 8 for each question), but of course one can use any numerical conversion of letter grades (and fractions of some other numbers) that the examiner deems most appropriate for interpretation of criteria. In this particular implementation the numerical translations for Credit and High Distinction fall slightly above the respective final minimal numerical thresholds, whilst the translations for Pass and Distinction produce exactly the respective final numerical thresholds. This produces a slight numerical bias against awarding Passes and Distinctions, though the examiners in this case felt for this exam that was appropriate. For a more difficult examination, one might aim for numerical translations that land further inside the range of the particular grade, well above the minimum threshold (and see the previous comment).

40Sumário
Proceedings of the 11th Southern Hemisphere Conference on the Teaching and Learning of Undergraduate Mathematics and Statistics ISBN 978-85-8167-237-3
5. This example uses four questions. Obviously the method can be adjusted for any number of questions. It simplifies considerably if, for example, there are just one or two questions in an in-term assignment, for which the method could be used to award letter grades. In the case of a formative assignment, the instructions to the markers can, of course, be supplemented to include the provision of detailed feedback.
6. This implementation was for a major piece of summative assessment, marked carefully and quickly, involving several hundred students. It was not expected that students would normally receive or expect feedback. However, formative aspects arise naturally when students contact the lecturer to have explained to them how their grades were determined.
HYPERBOLIC VERSUS LINEAR MARKINGIn traditional marking of students’ work, numerical marks tend to accumulate linearly,
or approximately linearly, when equivalent work, effort or insight across the assessment task correspond to equivalent marks. Our new method of marking deviates from ‘linearity’ in at least the two following respects:
1. There are two distinct marking phases, that distinguish performance or achievement in the two main phases of SOLO (and corresponding learning spaces in the theory of threshold concepts). Our new method is particularly adept at successfully assessing a student cohort that may be bimodal or multimodal with just one examination. The deep learners, or those who have mastered the relevant threshold concepts, tend to receive combinations of superior grades. The superficial learners tend to receive combinations of passing or inferior grades. Though the effects of aggregation of grades across multiple questions may cause some blending, the marking design recognises a qualitative leap that is less obvious in traditional ‘linear’ marking.
2. In the Second Phase, the marker is looking for positive attributes, and the accumulation is not expected to be linear. The first positive attribute, to achieve at least an F, finding any response from the student that deserves credit, may come easily. Each subsequent distinct positive attribute may become more difficult to achieve. There is an absolute ceiling in the Second Phase of a CCC grade, representing at least six positive attributes. One may describe this accumulation of credit as ‘hyperbolic’, never able to formally break over the Pass boundary. In the numerical conversion in the implementation described earlier, each of the first five distinct positive attribute contributes one unit each and the sixth positive attribute, if found, contributes an extra half of one unit, reflecting this nonlinear tapering of credit in the Second Phase. One could, of course, make this tapering more precise numerically.
PARADOXES AND MODERATIONA paradox occurs if a given assessment produces a higher grade for a weaker student
than for a stronger student. There are many natural reasons why paradoxes might occur in any assessment setting, especially related to a student’s attention to the task at hand, concentration, health, distractions or accidents. The most serious paradoxes occur however if there are fundamental flaws in the design of the assessment.
As explained in the previous section, the accumulation of credit is not linear. However, if the examination comprises only one question, then the following rank order of grades is achieved:
Z < F < E < D < C < CC < CCC ≦ B < BB < A < AA

41Sumário
Proceedings of the 11th Southern Hemisphere Conference on the Teaching and Learning of Undergraduate Mathematics and Statistics ISBN 978-85-8167-237-3
In the numerical conversion used in the implementation described in this article, CCC = B, but one could use a conversion where CCC < B.
There is no apparent paradox here: if the single question is well-designed, one expects the grades to correspond to the learning achievement of the student in the appropriate phase of SOLO or space in the theory of threshold concepts.
The possibility of paradoxes arises in aggregation when the examination comprises more than one question. Consider, for example, an examination with four questions, as in the Appendix, with the numerical conversion described in the earlier implementation. Suppose the learning of Student X has not progressed beyond the quantitative phases of SOLO, takes this exam and achieves grades CC+CC+CC+CC=20/32, in the order of those questions (from easy to difficult). Suppose Student Y and Student Z have learning achievements in the relational or extended abstract phases of SOLO with respect to most topics and achieve grades AA+AA+E+F=19/32 and D+D+BB+A=19/32 respectively on the same exam. It might not be fair to claim that Student X deserves a higher grade than Student Y or Student Z. The performance of Student X is well-balanced, consistently within the passing spectrum, possibly spending roughly equal amounts of time on the questions, picking out easier parts to answer. Student Y, by contrast, may have worked very hard and long on the first two questions, providing perfect model answers, and then ran out of time to properly attempt the last two questions. Student Z, by further contrast, may have attempted the questions in the reverse order of difficulty, investing time in the most difficult parts of the exam and ran out of time or energy to fully attempt the easiest parts.
Such apparent inconsistencies are typically related to time pressures in an exam. The best way to avoid this, would be to provide more than enough time for any student to thoroughly attempt every question. However, if there is a difficult question (like the last question in the Appendix) that could swallow up any amount of time, then even generous time allowances may still result in a paradoxical result, such as that of Student Z. The examiner must therefore have moderation strategies. One might consider adjusting weightings in the aggregation, that recognise the relative difficulty of questions, even just for students for which the examiner is sure the outcome has produced an unfair result. However, this may introduce complications, especially in explaining to students how their final grades were calculated, and also in ethical considerations and consistency when telling students in advance the mechanism for determining final grades.
The most effective solution, if one suspects that a paradox has occurred, would be to withhold the examination result for a particular student, until the examiner has had a chance to enquire about his or her performance in the exam, find out for sure what happened, and perhaps probe at interview the student’s knowledge and understanding of particular questions, or ask the student to resit another version of the exam or part of the exam. At the end of any moderation process, the ultimate aim is to provide students with fair grades that reflect their learning achievements and do not disadvantage any other student.
APPENDIX: EXAM QUESTIONSThe following four exam questions were used for MATH1111 Introduction to Calculus in
First Semester 2017. The first question is routine, and tests basic algebraic manipulation of a cubic polynomial function, integration and the following threshold concepts:
• application of derivatives to curve sketching;• application of even and odd functions to integration. The second question is easy but less routine, testing the following threshold concepts:• the Fundamental Theorem of Calculus;

42Sumário
Proceedings of the 11th Southern Hemisphere Conference on the Teaching and Learning of Undergraduate Mathematics and Statistics ISBN 978-85-8167-237-3
• tangent line approximations to a curve. The third question is harder, in two unrelated parts, both of which involve some nontrivial
aspects of problem solving and the following threshold concepts:• Riemann sum approximations;• concavity;• application of calculus to minimisation.The fourth question is a difficult modelling exercise, and tests the following threshold
concept:• the Chain Rule,embedded in an application, requiring ability to interpret information and fluency with
pronumerals.

43Sumário
Proceedings of the 11th Southern Hemisphere Conference on the Teaching and Learning of Undergraduate Mathematics and Statistics ISBN 978-85-8167-237-3

44Sumário
Proceedings of the 11th Southern Hemisphere Conference on the Teaching and Learning of Undergraduate Mathematics and Statistics ISBN 978-85-8167-237-3

45Sumário
Proceedings of the 11th Southern Hemisphere Conference on the Teaching and Learning of Undergraduate Mathematics and Statistics ISBN 978-85-8167-237-3

46Sumário
Proceedings of the 11th Southern Hemisphere Conference on the Teaching and Learning of Undergraduate Mathematics and Statistics ISBN 978-85-8167-237-3

47Sumário
Proceedings of the 11th Southern Hemisphere Conference on the Teaching and Learning of Undergraduate Mathematics and Statistics ISBN 978-85-8167-237-3
REFERENCES:Biggs, J.B. and Collis, K. (1982). Evaluating the Quality of Learning: the SOLO taxonomy. New
York: Academic Press.
Biggs, J.B. and Tang, C. (2007). Teaching for Quality Learning at University, 3rd Edition. New York: Society for Research into Higher Education & Open University Press.
Brilleslyper, M. and Schaubroeck, B. (2011). Alternatives to Traditional Grading to Enhance Student Learning. Minicourse, MAA MathFest, Mathematics Association of America, Lexington, Kentucky. [online: https://www.maa.org/mathfest-2011-program].
Brilleslyper, M., Ghrist, M., Holcomb, T., Schaubroeck, B., Warner, B. and Williams, S. (2012). What’s the point? The benefits of grading without points. Problems, Resources and Issues in Mathematics Undergraduate Studies 22(5), 411-427.
Easdown, D. (2007). The role of proof in mathematics teaching and the Plateau Principle. Proceedings of the Assessment in Science Teaching and Learning Symposium. Alexandra Hugman, Ian Johnston and Mary Peat (eds.). Sydney: Uniserve Science.
Easdown, D. (2011a). Transforming practice using threshold concepts. ALTC Professional Development Workshop. University of Wollongong, September 29-30, 2011. [online: http://www.austms.org.au/ALTC+Workshop+2011].
Easdown, D. (2011b). Excursions to and from semantic oblivion. Proceedings of Volcanic Delta 2011, Volcanic Delta 2011: The Eighth Southern Hemisphere Conference on the Teaching and Learning of Undergraduate Mathematics and Statistics. John Hannah and Mike Thomas (eds.). University of Canterbury.
Easdown, D. and Wood, L. (2014). Novel threshold concepts in the mathematical sciences. Threshold Concepts: from personal practice to communities of practice. Proceedings of the National Academy’s Sixth Annual Conference and the Fourth Biennial Threshold Concepts Conference, National Academy’s Sixth Annual Conference and the Fourth Biennial Threshold Concepts Conference, Catherine O’Mahony, Avril Buchanan, Mary Rourke and Bettie Higgs (eds.), NAIRTL (Irish National Academy for Integration of Research, Teaching and Learning), Cork, Ireland, 44–50.
Jooganah, K. (2009). Proof as a threshold concept for university mathematics: an exploration of student identity and transition. British Education Research Association Annual Conference. University of Manchester.
Land, R., Cousin, G., Meyer, J.H.F. and Davies, P. (2005). Threshold concepts and troublesome knowledge (3): implications for course design and evaluation. Improving Student Learning – equality and diversity (C.Rust, Ed.). Oxford: OCSLD.
Meyer, J.H.F. and Land, R. (2003). Threshold concepts and troublesome knowledge - linkages to ways of thinking and practising. Improving Student Learning - Ten Years On (C. Rust, Ed.). Oxford: OCSLD.
Meyer, J.H.F. and Land, R. (2005). Threshold concepts and troublesome knowledge (2): epistemological considerations and a conceptual framework for teaching and learning. Higher Education 49(3), 373-388.
Pettersson, K. (2011). The threshold concept of a function – A case study of a student’s development of her understanding. Stockholm University. [online: http://www.mai.liu.se/SMDF/madif8/Pettersson.pdf].

48Sumário
Proceedings of the 11th Southern Hemisphere Conference on the Teaching and Learning of Undergraduate Mathematics and Statistics ISBN 978-85-8167-237-3
Wood, L., Vu, V., Bower, M., Brown, N.R., Skalicky, J.L., Donovan, D., Loch, B., Joshi, N. and Bloom, W. (2011). Professional development for teaching in higher education. International Journal of Mathematical Education in Science and Technology 42(7), 997-1009.

49Sumário
Proceedings of the 11th Southern Hemisphere Conference on the Teaching and Learning of Undergraduate Mathematics and Statistics ISBN 978-85-8167-237-3
MATH CIRCLES FOR ALL AGES: FROM NAVAJO MATH TO THE RESEARCH UNIVERSITY
Matthias Kawski6
Arizona State University
AbstractThis article reports activities and efforts to bring math circles to much broader ranges of communities By age these range from elementary grades to college-ready students, and to teachers at all levels. We report on extreme geographic differences, from very small schools in small hamlets in the most remote corners of Indian reservations to advanced high school age students whose hunger for higher mathematics cannot be served by their high-schools, even in rich suburban districts.After a quick survey of the characteristics of math circles and our experiences over seven years with research oriented math circles in metropolitan areas, our report focuses on efforts over the last four years to connect students in the most remote corners of Indian Reservations with research mathematicians. The second part of the report elaborates one specific, typical example of a math circle session that has been successfully tested over a very broad age-range, including a teachers circle.Keywords: Math circle, extracurricular, problem solving, diversity, pipeline.
INTRODUCTION TO MATH CIRCLESWe start with a brief survey of the history of math circles, their commonalities as well as
their diversity. Mark Saul (2006), characterizes a math circle as A math circle is a social structure where participants engage in the depths and intricacies of mathematical thinking, propagate the culture of doing mathematics, and create knowledge. To reach these goals, participants partake in problem-solving, mathematical modeling, the practice of art, and philosophical discourse. Some circles involve competition, others do not; all promote camaraderie.
One may think of math circles as analogues of after school activities such as partaking in team sports, ballet classes, chess clubs, piano lessons, etc. Math circles have a long tradition, especially, in Russia, and, reaching back over more than a century, in Bulgaria. Roughly coincident with a large influx of, scientists, engineers, and mathematicians from the former Soviet Union and other former Eastern Bloc countries about 1990, math circles began to spread across the United States.
Math circles come in many different formats, from small parent-led groups of elementary grade students performing fun mathematical activities, to formal events at major universities led by research mathematicians. Common to all math circles is that they provide a social context for participants who come to enjoy math. While some math circles focus on preparing for competitions and some others have more school-like curricula, the vast majority appears to focus on deeper explorations that we like to describe as orthogonal to standard school curricula.
50Sumário
Proceedings of the 11th Southern Hemisphere Conference on the Teaching and Learning of Undergraduate Mathematics and Statistics ISBN 978-85-8167-237-3
The National Association of Math Circles (NAMC) provides an umbrella that connects math circles across the United States. This project of the Mathematical Sciences Research Institute provides most valuable resources for starting and sustaining successful math circles such as the guide “Circle in a Box” (Vandervelde, 2009), and an extensive collection of vetted activities, problems, and lesson plans. It also has sponsored numerous workshops and annual conferences that bring together math circle leaders, often in connection with Julia Robinson Math Festivals, and continues to provide structural and financial support for diverse local efforts.
Originally math circles targeted primarily K-12 students. In recent years, also math teachers circles have grown much in popularity. Mathematical topics addressed in any of these of often come from undergraduate college curricula, and beyond, and quite often even explore open research questions.
Whereas much of the public thinks of mathematics as worksheets and symbol manipulations, math circles are much closer to the way working mathematicians think of their art, and how they work. In many ways math circles implement the call that “all students learn these subjects [math, sciences] by direct experience with the methods and processes of inquiry” as highlighted in the report “Shaping the Future” (George, 1996). Many math circle leaders agree that this environment is an almost ideal laboratory setting where to experiment with new inquiry based lesson plans. Indeed, we frequently have “class-tested” new ways of delivering a topic in our math circle with motivated high school age students, before eventually taking the polished session into the undergraduate classroom (where packed syllabi leave little room for teaching experiments). A good example for this is a session that starts with a magic card trick, and eventually leads to a proof of Hall’s theorem, a fundamental combinatorial theorem with wide mathematical application (Anonymous, 2017).
A METROPOLITAN MATH CIRCLE FOR ADVANCED HIGH SCHOOL AGE STUDENTSThe author founded the Math Circle at ANONYMIZED in 2010 in response to numerous
requests by parents of school age students to connect these with research mathematicians, as their schools could not satisfy their hunger for more mathematics. We decided to use our most valuable resource, our research faculty in the setting of math circles to cater to these students who could be served by anyone else. First introduced in the initial report (Anonymous, 2011), our math circle is now in its 8th year still following the special theme of connecting highly motivated high school age students with research mathematicians. Our math circle has directly led to at least one major technical journal article co-authored by a then high school student (Kierstead, Salmon, and Wang, 2016).
Many of our favorite sessions start with compelling hands-on scenarios that young students can understand and, which in the best cases, connect all the way with current cutting edge research. A wonderful example starts with billiards on a rectangular grid (Tanton, 2010) and eventually connects with work which won the Field’s Medal (Mirzakhani, 2014). Indeed, some short scenes in the video (Mirzakhani, 2014) are remarkably similar to what our students do in the math circle. Similarly, another activity starts with explorations of network sorting, leading to hard combinatorial questions, many still open, and connected with Szemerédi’s work winning the Abel Prize in 2012. Another favorite topic centers about the stable marriage problem, best known in the context of assigning graduating medical students to their first hospital appointments. Shapley and Roth were awarded a Nobel Prize in 2012 for their algorithms for stable resource allocations in economics settings.

51Sumário
Proceedings of the 11th Southern Hemisphere Conference on the Teaching and Learning of Undergraduate Mathematics and Statistics ISBN 978-85-8167-237-3
NAVAJO MATH CIRCLES AND RELATED OUTREACH EFFORTSComplementing this math circle that is focused on advanced mathematics, the author is
regularly involved in a program to bring math circles to the some of the most remote hamlets in the Navajo and other reservations. This project started in the fall of 2012 when Tatiana Shubin spent her sabbatical to establish numerous math circles in the Navajo Reservation. This effort has grown over the past six years to annual two week long summer math camps, regular STEAM (science-technology-engineering-arts-math) festivals, regular math teacher workshops (in the spirit of math teacher circles), and frequent visits to math circles at small schools in all grades 2 to 12 in even the most remote corners of the reservation. A large group of research mathematicians from across the country now make frequent trips to this remote land to make a lasting difference. While most of the success stories are of anecdotal nature, some hard numbers show a dramatic increase of math majors in the tribal college, and successful transitions to college by former participants, often the first in the family to attend college.
This project has been the subject of a powerful film (Csicsery, 2016), supported in part by MSRI, which premiered at the Joint Math Meetings in January 2016 in Seattle, and has since then been screened at numerous film-festivals, on television by numerous PBS (public broadcasting), at many festivals, colleges, and the like.
Figure 1: Discovering Hopf algebra isomorphisms between objects counted by Catalan numbersOne of the biggest problems in these settings is simply transportation. It is not uncommon
that students travel for more than one hour each way! Consequently, many of the math circles in such locations are not structured as after-school events, but integrated into the daily schedule, with us as “guest teachers.” Common to practically all settings are a hunger for more math (and science), and enthusiastic students. This author, like many colleagues, has learned to greatly enjoy the challenge of leading sessions with students of all ages, as well with teachers who range from elementary grade generalists to those teaching calculus. The enthusiasm for learning by the youngest students is truly infectious, and has led the author to have much

52Sumário
Proceedings of the 11th Southern Hemisphere Conference on the Teaching and Learning of Undergraduate Mathematics and Statistics ISBN 978-85-8167-237-3
higher expectations for his university level classes, aiming to engage undergraduate students just as much as these youngest children do so naturally.
Recent sister projects to the Navajo Math Circles include a math circle at the ANONYMIZED Reservation where the photo in figure 1 was taken, and math circles on numerous small reservations in the state of Washington. Many of the higher level math circles activities that we have mentioned above are also used in these projects, albeit often not expecting to go as deep into the formal proofs as in (Anonymous, 2017). As seen in the photo in figure 1, many of these students are ready for very advanced mathematics. Here, in a follow-up to a session on counting with Catalan Numbers by (Davis, 2016), this math circle focused on not only finding bijections between different combinatorial objects counted by Catalan numbers, but actually finding (combinatorial Hopf algebra) structure preserving homomorphisms.
FROM KISSES AND HUGS TO PASCAL’S AND SIERPINSKI’S TRIANGLES AND BEYOND
This section describes the mathematical activities of, and our experiences with, one of our favorite math circle sessions. This is suitable for a broad range of students especially of younger ages, and for teacher circles. As such it is particularly relevant for undergraduate classes that serve future math teachers.
The general plan is simple: start with counting permutations, discover the addition property of the entries in Pascal’s triangle, and color its values according to the remainders by various divisors. In the United States, the Common Core State Standards http://www.corestandards.org/Math/Content/HSA/APR/C/5/ place Pascal’s triangle together with the binomial theorem into high school algebra. This is a class well-known for students losing interest in mathematics – likely due to the lack of captivating problems and presentation of the topic. Similar, we have seen many future math teachers struggle with related topics in their college math classes.
In the following we describe how, in a math circle environment, this topic can be highly successful. We have tried this in several settings, most successful with second graders, and also with sixth graders in very remote hamlets on the Navajo Reservation, as well as with beginning high school students on the Maricopa Pima Salt River Reservation, and with experienced elementary school teachers from various parts of the Navajo Reservation. These teachers are generalists, and have generally only minimal mathematical training, often from decades ago. Many of them are very timid, and almost afraid of mathematics. This makes it even more important that they not impregnate the next generation with such negative feelings, but instead learn and share how much fun mathematics can be. Once students fall in love with the subject, they are open to receive (if that is what is desired), and they will learn at amazing rates.
Rather than giving minute by minute instructions in the form of a lesson plan, in the sequel we describe the activities, objectives, and experiences in a more historical fashion. The observed participants’ reactions are reported alongside with the tasks and the mathematical content.
SEQUENCES OF KISSES AND HUGSAfter a brief introduction and hello, start the meeting with writing in big, bold letters xoxo
on the board. Looking ahead, plan for enough space by suitably placing xoxo on the board, see the word in red in figure 2. The second graders scream out “kiss-hug-kiss-hug.” The 6th graders need to be invited to read this aloud, and they generally much prefer “ex-oh-ex-oh” or “cross-circle-cross-circle” as in tic-tac-toe. Either way is fine. Our teachers mixed all three readings

53Sumário
Proceedings of the 11th Southern Hemisphere Conference on the Teaching and Learning of Undergraduate Mathematics and Statistics ISBN 978-85-8167-237-3
– but they generally agreed their youngest students would be most excited doing math with “kiss-hug-kiss-hug.” Similarly, the different settings preferred either of the terms “words” or “sequences”, just as different communities of mathematicians prefer either name.
Figure 2. Towards Pascal’s triangle, colored by the order Immediately we ask the next question: “Is this the only way to have two kisses and two
hugs?” The youngest kids will scream out various rearrangements of the hugs and kisses, which are recorded on the white-board or blackboard. If time is short, it speeds things up a lot (providing strong hints for later), if the session leader arranges the words with some foresight so that they are arranged in lexicographical order as shown in orange in figure 2. But if time permits, it is recommended to let the students come to the board and write their own permutations of the letters. The youngest students often miss a few rearrangements, or write duplicates on the board. This is a good time to sit back and come up with some way to make sure that nothing is missed, and that all possibilities are accounted for. The desired idea, usually students come up with this themselves very quickly, is symmetry: Look for patterns, such as: exactly three words each start (end) with a kiss (x) and exactly three start (end) with a hug (o), same for the second letter etc. Encourage the participants to write them in some order which makes the symmetries more apparent, e.g., two groups of words distinguished by their first letter, see the boundaries about the red and orange regions in figure 2.
Next question: “Are two kisses and two hugs are enough?” “OK, then let us try to find all arrangements of three kisses and two hugs.” Here it seems to work best if the participants first start individually with pencil and paper. After they begin to slow down writing more words, ask them how many they got: “Who found at least five different sequences of three kisses and two hugs?” “Who found six?” Let them compare in small groups, at their desks. Even the second graders almost all ended up with at least nine, very few had only eight. But it is surprising that even much older students and even several teachers are not very systematic.
The next objective is to encourage working a bit more systematically, by asking: “How could we have gotten these new sequences of three kisses and hugs from those we already have on the board with two kisses and two hugs?” One immediate answer is to just add one kiss at the end. As session leader, the author prefers to nudge the participants to agree that it is just as good with adding one kiss at the start, also alluding to lexicographical order. This yields the six words colored yellow in figure 2. The next question is: “What about the other sequences,
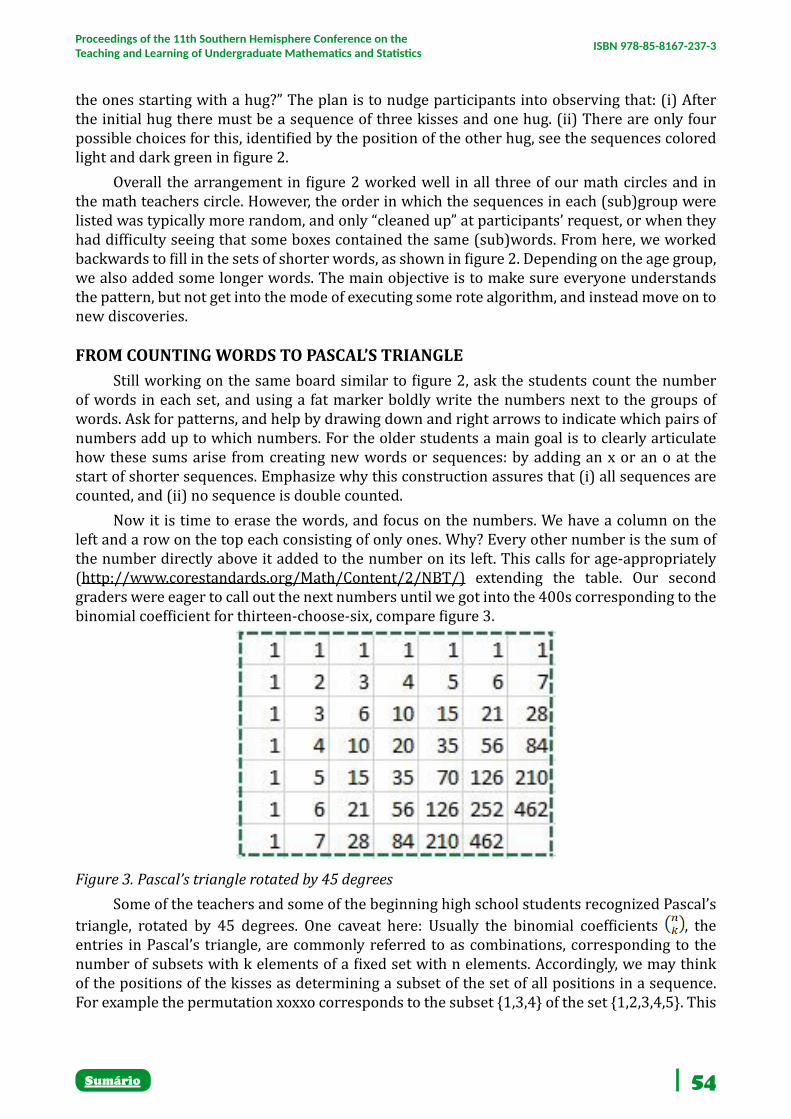
54Sumário
Proceedings of the 11th Southern Hemisphere Conference on the Teaching and Learning of Undergraduate Mathematics and Statistics ISBN 978-85-8167-237-3
the ones starting with a hug?” The plan is to nudge participants into observing that: (i) After the initial hug there must be a sequence of three kisses and one hug. (ii) There are only four possible choices for this, identified by the position of the other hug, see the sequences colored light and dark green in figure 2.
Overall the arrangement in figure 2 worked well in all three of our math circles and in the math teachers circle. However, the order in which the sequences in each (sub)group were listed was typically more random, and only “cleaned up” at participants’ request, or when they had difficulty seeing that some boxes contained the same (sub)words. From here, we worked backwards to fill in the sets of shorter words, as shown in figure 2. Depending on the age group, we also added some longer words. The main objective is to make sure everyone understands the pattern, but not get into the mode of executing some rote algorithm, and instead move on to new discoveries.
FROM COUNTING WORDS TO PASCAL’S TRIANGLEStill working on the same board similar to figure 2, ask the students count the number
of words in each set, and using a fat marker boldly write the numbers next to the groups of words. Ask for patterns, and help by drawing down and right arrows to indicate which pairs of numbers add up to which numbers. For the older students a main goal is to clearly articulate how these sums arise from creating new words or sequences: by adding an x or an o at the start of shorter sequences. Emphasize why this construction assures that (i) all sequences are counted, and (ii) no sequence is double counted.
Now it is time to erase the words, and focus on the numbers. We have a column on the left and a row on the top each consisting of only ones. Why? Every other number is the sum of the number directly above it added to the number on its left. This calls for age-appropriately (http://www.corestandards.org/Math/Content/2/NBT/) extending the table. Our second graders were eager to call out the next numbers until we got into the 400s corresponding to the binomial coefficient for thirteen-choose-six, compare figure 3.
Figure 3. Pascal’s triangle rotated by 45 degrees Some of the teachers and some of the beginning high school students recognized Pascal’s
triangle, rotated by 45 degrees. One caveat here: Usually the binomial coefficients , the entries in Pascal’s triangle, are commonly referred to as combinations, corresponding to the number of subsets with k elements of a fixed set with n elements. Accordingly, we may think of the positions of the kisses as determining a subset of the set of all positions in a sequence. For example the permutation xoxxo corresponds to the subset {1,3,4} of the set {1,2,3,4,5}. This

55Sumário
Proceedings of the 11th Southern Hemisphere Conference on the Teaching and Learning of Undergraduate Mathematics and Statistics ISBN 978-85-8167-237-3
is irrelevant for the youngest students, but makes for good teachable moments for the older students, even in college algebra, and for the teachers.
There are many different routes from here. One is a proof of the addition properties: for all natural numbers n and k, the binomial coefficients (defined as numbers of subsets) satisfy
. The key here is to think of x and o as noncommuting indeterminates when recursively expanding (x+o)n+1=(x+o)(x+o)n. This is grounded on sound mathematics. At the latest when dealing with matrices and cross-products students need to understand that the two middle terms in (A+B)2=A2+AB+BA+B2 need not be equal and cannot be combined.
EASIEST MODULAR ARITHMETIC, PARITY, AND COLORING: SIERPINSKI’S TRIANGLE
Looking ahead, desiring to get an impressive view of Sierpinski’s triangle, we want more than just a seven by seven table of binomial coefficients. Once the numbers get too big, the author managed to claim that there was not enough space on the board. The bold proposal to forget about tens and hundreds was met with incredulity by both the younger and older groups of students. Looking at their teacher, and then at the author, they asked: “Can we do that?” “Sure. Why not? We are here to have fun with math, and discover new math!” Starting over in the top left corner of the board (still temporarily leaving the old numbers on the board, we quickly filled a seventeen by seventeen table or so.
This calculation touches some nontrivial property at the first stages of modular arithmetic: for all positive integers n, m, and k>1 one has that mod(m+n,k) = mod(mod(m,k)+mod(n,k),k). Instead of first adding the numbers and then taking at the remainder, we may just add the remainders, and then, if necessary again take the remainder. For the teachers circle this can be a starting point for deeper discussions, while the youngest ones are readily convinced by looking at a few examples.

56Sumário
Proceedings of the 11th Southern Hemisphere Conference on the Teaching and Learning of Undergraduate Mathematics and Statistics ISBN 978-85-8167-237-3
Figure 4. Pascal’s triangle modulo 10 colored by parity (even/odd).The first time the author tried this session, almost magically, there were two posters,
attached to the bottom of the board, which broadly displayed the technical items “even” and “odd.” The author asked the class, what these words mean, asked for examples, and pointed to table showing Pascal’s triangle mod 10. It took no effort to get three or four students to run to the board and color (circle in bright red) all even numbers. Patterns emerged quickly. Compare figure 4 for an abstraction of the final result.
The author tried to slow down or interrupt the kids, as some discovered a general rule: Under a diagonal of even numbers there is always a whole triangle of even numbers. Apparently, even at this young age, the majority of the students connected “even plus even is even” with these triangles.
This strategy of first doing addition modulo ten, followed by reduction modulo two, may seem surprising at first. But it was apparent that for the younger students and the elementary school teachers this was a gentler introduction, and one that looked less like a textbook exercise. This is an opportunity to age-appropriately discuss this special case of the third isomorphism law: for all integers n, mod(mod(n,10),2)=mod(n,2).
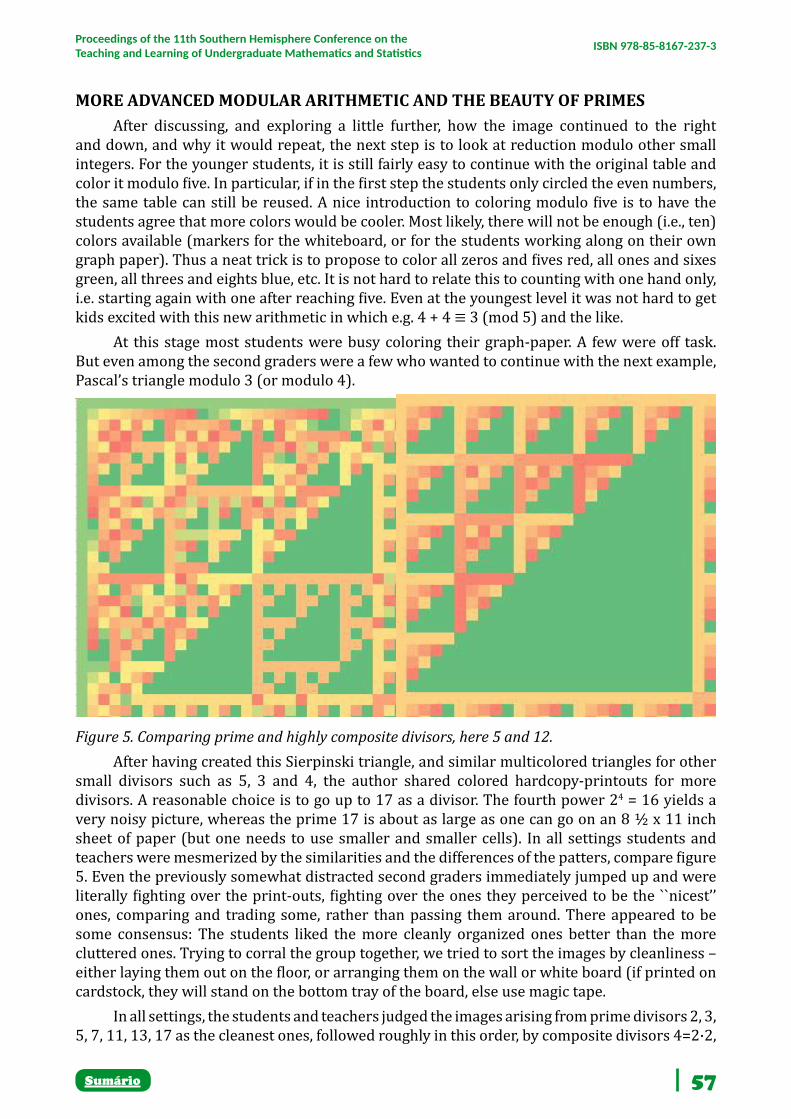
57Sumário
Proceedings of the 11th Southern Hemisphere Conference on the Teaching and Learning of Undergraduate Mathematics and Statistics ISBN 978-85-8167-237-3
MORE ADVANCED MODULAR ARITHMETIC AND THE BEAUTY OF PRIMESAfter discussing, and exploring a little further, how the image continued to the right
and down, and why it would repeat, the next step is to look at reduction modulo other small integers. For the younger students, it is still fairly easy to continue with the original table and color it modulo five. In particular, if in the first step the students only circled the even numbers, the same table can still be reused. A nice introduction to coloring modulo five is to have the students agree that more colors would be cooler. Most likely, there will not be enough (i.e., ten) colors available (markers for the whiteboard, or for the students working along on their own graph paper). Thus a neat trick is to propose to color all zeros and fives red, all ones and sixes green, all threes and eights blue, etc. It is not hard to relate this to counting with one hand only, i.e. starting again with one after reaching five. Even at the youngest level it was not hard to get kids excited with this new arithmetic in which e.g. 4 + 4 ≡ 3 (mod 5) and the like.
At this stage most students were busy coloring their graph-paper. A few were off task. But even among the second graders were a few who wanted to continue with the next example, Pascal’s triangle modulo 3 (or modulo 4).
Figure 5. Comparing prime and highly composite divisors, here 5 and 12.After having created this Sierpinski triangle, and similar multicolored triangles for other
small divisors such as 5, 3 and 4, the author shared colored hardcopy-printouts for more divisors. A reasonable choice is to go up to 17 as a divisor. The fourth power 24 = 16 yields a very noisy picture, whereas the prime 17 is about as large as one can go on an 8 ½ x 11 inch sheet of paper (but one needs to use smaller and smaller cells). In all settings students and teachers were mesmerized by the similarities and the differences of the patters, compare figure 5. Even the previously somewhat distracted second graders immediately jumped up and were literally fighting over the print-outs, fighting over the ones they perceived to be the ``nicest’’ ones, comparing and trading some, rather than passing them around. There appeared to be some consensus: The students liked the more cleanly organized ones better than the more cluttered ones. Trying to corral the group together, we tried to sort the images by cleanliness – either laying them out on the floor, or arranging them on the wall or white board (if printed on cardstock, they will stand on the bottom tray of the board, else use magic tape.
In all settings, the students and teachers judged the images arising from prime divisors 2, 3, 5, 7, 11, 13, 17 as the cleanest ones, followed roughly in this order, by composite divisors 4=2·2,

58Sumário
Proceedings of the 11th Southern Hemisphere Conference on the Teaching and Learning of Undergraduate Mathematics and Statistics ISBN 978-85-8167-237-3
6=2·3, 10=2·5, 14=2·7, 9=3·3, 15=3·5, 8=2·2·2, 12=2·2·3, and 16=2·2·2·2. In the United States prime numbers appear in the Common Core State Standards (http://www.corestandards.org/Math/Content/4/OA/) only at the fourth grade level, but even second graders do recognize the difference between the divisors for the pretty and the less pretty pictures.
MOVING ON TO AUTOMATION BY PROGRAMMING SPREAD-SHEETS With more advanced students and with teachers it is easy to continue the exploration using
computers. Arguably the easiest program to use is EXCEL After opening a new spreadsheet, select the entire worksheet by hitting CTRL A, and adjust the column width by grabbing and dragging the vertical line separating the column labels. If desired, adjust the row heights as well. It is desirable to have square cells, with at least 50 columns on the screen. Enter your divisor of choice, say 5 into the cell A1 and the “seed” value 1 into the cell B1. Select the cell B2 and enter the formula =mod(A2+B1,$A$1). Instead of typing B1 and A2, experienced users may prefer to just click on the respective cells, or use the arrow keys. By holding down the shift key, use the mouse to select a large portion of the worksheet, say, the second to fiftieth rows and the second to fiftieth columns (excluding the top row and the leftmost column). Hit CTRL R and CTRL D to copy the formula from the cell B2 over the entire selected region. Click on any randomly chosen cell, say G7, to see the formula it now contains: It should be =mod(F7+G6,$A$1) . The dollar signs in the address $A$1 signify that this is an absolute address, always referring to the top left cell which contains the value of the divisor. On the other hand, when copying and filling the selected range of cells the addresses A2 and B1, or F7 and G6, are relative addresses, referring to the cell to the left and to the cell above the selected cell. As the final step, still with the large range of cells selected, click the HOME tab, then CONDITIONAL FORMATTING, and choose your favorite COLOR SCALE . Caution: once young students discover the MORE RULES choice below the predefined color schemes, many will get stuck with exploring ever new color combinations as opposed to math. But fun must be. To change the divisor, simply enter a new value in the cell A1 and hit ENTER.
From here the doors are open for further explorations, entirely forgetting about the xoxo, a natural choice is to change the formula for the recursion, changing the sum A2+B1 into the difference A2-B1 or other linear combinations such as 3*A2-4*B1, possibly involving more than just two terms (cells). For planar (two-dimensional) Fibonacci-like formulas use two or more special rows and columns at the top and on the left side for seeding the recursion. E.g. start in cell C3 with the formula =mod(A3+B3+C1+C2,$A$1), the desired divisor in cell A1, and enter in both cells C2 and B3 the value 1 as new seed .
In these further explorations the formula shall only contain addresses of cells above and to the left of the selected cell. Else filling down and right will generate a warning message about “circular references”. A typical example might want to replace the value in a cell by the average of the values of its four immediate neighbors – this is basically a simple numerical approximations of solutions of Laplace’s equation. For EXCEL to carry this out, one needs to change some settings: Under the FILE tab, select OPTIONS, then FORMULAS, and enable ITERATIVE CALCULATION. From here it is only a small step to explorations more general cellular automata, such as Conway’s Game of Life.
WRAP-UP AND DEBRIEFJust like every regular class should end with a brief summary of “what we have learned”
and “where to go from here”, this math circle session also should have its own wrap-up. But unlike daily routine math classes, we like to emphasize items beyond the mathematical topics that were addressed in the math circle.

59Sumário
Proceedings of the 11th Southern Hemisphere Conference on the Teaching and Learning of Undergraduate Mathematics and Statistics ISBN 978-85-8167-237-3
• “Did you expect that you can do so much math just starting from xoxo”? • “Did all your questions get answered?” Hopefully NOT, as one key objective of our
program was a positive answer to: “Do you have many new questions that you need/want to investigate?”
• “Did you have fun?”We want our students to see/recognize math everywhere they look, instill a sense, habit,
and love of discovery. Students who are excited about a subject are open to almost anything. We trust that investing some time into inspiring activities will, at any level, more than make up for the time investment by more excited students learning faster and better.
Many participants in math teacher circles will be there for much the same reasons as K-12 students: To enjoy doing math together with like-minded colleagues. After experiencing math circles themselves, in an atmosphere free of pressure, exams, and fear of ridicule, where all participants just have fun actively discovering mathematics, many are committed to bring this inquiry based environment into their classrooms.
A common question is about the relation of the mathematical content to the school mathematics curriculum. The author and colleagues prefer math circle topics that are proverbially “orthogonal” to the school curriculum (Anonymous, 2011): For example, with high-school age students, we stay away from topics related to calculus – which can be trivial for the advanced students but unachievable for those who are a year younger. Don’t steal the school-teachers’ punch-lines! The author and his colleagues prefer continuous lines of investigation, starting with questions that 10 year old students can understand, yet which ideally connect with current research. A key design feature are questions whose answers lead to ever more new questions, ever expanding trees of inquiry.
Back to the elementary school teachers and the session presented in the preceding section. Aside from a modicum of curiosity and an appreciation of beauty, the main prerequisite is elementary arithmetic at the level of second grade (http://www.corestandards.org/Math/Content/2/NBT/). Even second graders easily can do modular arithmetic with divisors ten and two, and even five. To convince skeptical parents, just remind them of the practical value of mod 12 arithmetic. For the more advanced students, most any user of EXCEL should be able to follow and understand the elementary programming.
Complementary to the question about prerequisites, others ask: “What standard curriculum topics are addressed, and what doors does this material open?” This session lays the foundation for the binomial theorem, later formal work with permutations and combinations, and other combinatorial mathematics.
For the second graders there is a fair amount of practice of mental arithmetic in a specific fun context. Modular arithmetic with divisors three or seven are fun challenges for older students and teachers, and such experiences provide the foundation for cryptography and abstract algebra. The final coloring yielding Sierpinski’s triangle connects with recent mathematical research concerning self-similar structures, in particular, fractals. Once playing with a computer implementation, the sky is the limit, and students are invited into the recent notion of cellular automata which are claimed to be universal computing machines (Wolfram, 2002).
Most, if not all, participants are amazed by how much math one can discover by starting just with a short word like xoxo. Math is everywhere – one just needs to learn to see (recognize) it. One of the many rewards is beauty! In this case the geometric patterns resonated particularly well with our participants from the Navajo Nation which is famed for its geometric patterns, foremost on their rugs and traditional clothing. But it does not take much to see more intrinsic,

60Sumário
Proceedings of the 11th Southern Hemisphere Conference on the Teaching and Learning of Undergraduate Mathematics and Statistics ISBN 978-85-8167-237-3
abstract beauty. And most important of all, all participants agreed that doing math together can be incredible fun.
REFERENCESSaul, M. (2006) What is a Math Circle? National Association of Math Circles Wiki. Mathematical
Sciences Research Institute. https://en.wikipedia.org/wiki/Math_circle
Vandervelde, S. (2009) Circle in a Box. American Mathematical Society and Mathematical Sciences Research Institute. Berkeley. http://dev.mathcircles.org/2017/07/28/circle-in-a-box-available-for-free-download/
George, M. (1996) Shaping the Future Volume II: Perspectives on Undergraduate Education in Science, Mathematics, Engineering, and Technology. Contributions to the Review of Undergraduate Education by the Advisory Committee to the National Science Foundation Directorate for Education and Human Resources. National Science Foundation. https://www.nsf.gov/pubs/1998/nsf98128/nsf98128.pdf.
Anonymous (2017).
Anonymous, (2011).
Kierstead, H., Salmon, A., and Wang,R. (2016) On the choice number of complete multipartite graphs with part size four. European J. Combin. 58, 1–16.
Tanton, J. (2002) Billiards and Reflections. http://www.jamestanton.com/?p=530.
Mirzakhani, M., (2014) A Tenacious Explorer of Abstract Surfaces (video) Simons Found. & Internat Math. Union, https://www.quantamagazine.org/maryam-mirzakhani-is-first-woman-fields-medalist-20140812
Davis, T. (2016) Catalan Numbers , from Mathematical Circles Topics, http://www.geometer.org/mathcircles/
Csicsery, G. (2016) Navajo Math Circles, Zala Films, http://www.zalafilms.com/navajo/.
Wolfram, S. (2002) A New Kind of Science. Champaign, IL Wolfram Media, 646-647.

61Sumário
Proceedings of the 11th Southern Hemisphere Conference on the Teaching and Learning of Undergraduate Mathematics and Statistics ISBN 978-85-8167-237-3
ANALYSIS OF UNDERGRADUATES’ WORKS ON AN INVERSE MODELLING PROBLEM WITHIN THE FRAME OF
MATHEMATICAL WORKING SPACES
Victor Martinez-Luaces
FJR-Fing, UdelaR, Montevideo, Uruguay
AbstractThis paper describes mainly two previous experiences, in Buenos Aires, Argentina, and Colima, Mexico. In both cases, an inverse modelling problem was proposed to undergraduates from different university careers. The students worked on it in different contexts; however, their productions had similarities and also differences, basically due to their mathematical background as well as other circumstances that are studied in detail here. With the aim of analysing the development of their mathematical work, we consider the framework given by the “Mathematical Working Space” (MWS) developed by French scholars which has been widely used by francophone and Latin American researchers.The study presents a brief introduction of the MWS framework, and then it expounds the selected problem and the several reformulations. After that, in the following two sections the cases of Buenos Aires and Colima are presented. The outcomes of these teaching and learning experiences are studied within the MWS framework and taking into account the obtained results, various final conclusions are drawn.Keywords: Mathematical Working Space; Inverse Modelling Problems; Undergraduate Students’ Productions.
INTRODUCTIONTo some extent, doing mathematics can be considered as a problem solving activity. Then,
solving real problems – and not just routine exercises – is of great importance in the teaching and learning of this discipline.
In addition to their intrinsic interest, problems are often a means of introducing concepts, ideas, or procedures. Therefore they are not usually finished constructs and they require continuous transformations to be adjusted to the particular educational level of the students, the characteristics of the institution, or the subject that is being studied in a certain period.
For instance, some of the problems analysed in previous papers [1-2] needed certain mathematical tools, and this fact was used as a strong motivation to introduce them. In other cases, the resolution of a given problem could be improved with the use of appropriate software like GeoGebra, Cabri, etc., even in the most basic courses. As an example, in this article we will see how the students – using GeoGebra – were able to solve an inverse modelling problem in any of its versions even if they have not seen complex numbers or linear transformations, which was the expected mathematical content needed to solve it.
Modelling problems constitute a particular case, especially notable, as they develop skills and competences that will be of great importance in higher education and professional life. For this reason, analyzing how students react to problems that require modelling – direct or inverse – is an interest issue that requires an appropriate theoretical framework in order to study it properly.

62Sumário
Proceedings of the 11th Southern Hemisphere Conference on the Teaching and Learning of Undergraduate Mathematics and Statistics ISBN 978-85-8167-237-3
In this paper, we have chosen the theoretical framework given by the Mathematical Working Space (MWS), originally named ETM (Espaces de Travail Mathématique, in French), a theoretical frame designed by the researchers of the Laboratoire de Didactique André Revuz, Université Paris Diderot, France (LDAR). This frame has been used successfully by researchers from France, Canada, Chile, Argentina, Spain, Mexico and Cyprus, among others [3-4-5-6].
In the first part of the article we will present a brief exposition of this theoretical framework widely used in Spanish or French speaking countries. After this exposition, we will describe an inverse modelling problem, which has been reformulated several times and that was proposed to undergraduates from different university careers, in different countries. Another section of the paper analyses how students in Argentina, Mexico and Uruguay (among others) reacted when working on this problem and finally the MWS framework will be applied to analyse those experiences and conclusions will be drawn taking into account the results obtained.
CHARACTERISTICS OF THE MWS FRAMEWORKThe MWS frame started as a theoretical framework for the didactics of geometry and
more recently has been adapted and extended for the specific study of mathematical work which effectively involves teachers and students activities during mathematics classes. This frame provides a structure that allows analyzing the mathematical activity of those who are faced with the resolution of mathematical problems. It should be mentioned that both the description of the model and its applications have been published in scientific journals [3-4-5-6], and more recently, an edition of ZDM-Mathematics Education was integrally dedicated to the presentation of this model and its diverse applications [7-8].
The MWS consists of two planes: the epistemological plane, related to the mathematical content in the field being studied, and the cognitive plane that contemplates the way in which the individual acquires and uses the mathematical knowledge, related to the thinking of the problem solver individual.
Each of these planes contains various elements which are not merely brought together, but must be organized according to predetermined goals that will depend on the mathematical field and on the proposed tasks. Both planes can be observed in Figure 1.

63Sumário
Proceedings of the 11th Southern Hemisphere Conference on the Teaching and Learning of Undergraduate Mathematics and Statistics ISBN 978-85-8167-237-3
Figure 1. Diagram of the Mathematical WorkspaceAt the bottom of the diagram, we have the epistemological plane, a purely mathematical
dimension in which three components interact: a set of concrete and tangible objects (the term sign or representamen, is used to summarize this component), a set of artefacts like drawing instruments or software and a theoretical reference system based on definitions, properties and theorems.
About the concept of representamen, it is important to mention that – depending on the mathematical field – the signs can be geometrical images, algebraic symbols, graphics or even tokens, models or photos in the case of problems involving modelling.
At the top of the diagram is the cognitive plane, centred on the subject, understood as a cognitive subject. In this plane, closely linked to the components of the epistemological level, three cognitive components are defined: the visualization related to the process of deciphering and interpreting signs and the internal representation of the objects involved, the construction that depends on the artefacts and associated techniques and the demonstration that is carried out through validation processes based on the theoretical framework.
The LDAR researchers established that the development of adequate mathematical work by communities or individuals is a gradual process through which a suitable MWS is gradually settled through a progressive approach and fine tuning.
The analysis of mathematical work through the lens of the MWS allows us to understand how the meanings are gradually constructed, bridging the epistemological plane with the cognitive plane.
The figure 1 shows the interactions of the two levels, through three different dimensions or genesis: semiotic, instrumental and discursive. The semiotic genesis allows passing from a syntactic perspective to semantics of mathematical objects. On the other hand, the instrumental genesis is the one that allows making the operative artefacts in the construction of the MWS and finally, the discursive genesis of the mathematical proof, uses the theoretical reference system to achieve a validation not only iconic, graphic or instrumental.

64Sumário
Proceedings of the 11th Southern Hemisphere Conference on the Teaching and Learning of Undergraduate Mathematics and Statistics ISBN 978-85-8167-237-3
In educational institutions, an attempt is made in order to create an atmosphere that enables students to solve mathematical problems in an appropriate way, an objective that teachers also share. Then, it is an operative articulation of the epistemological and cognitive levels and makes possible the mathematical work that is expected from the learners. For this, it is important to organize and describe the existing relationship – or that one which is formed – between the previous geneses.
In order to understand this complex process, the LDAR researchers have described the vertical planes of the ETM model. These vertical planes can be connected with the different phases of mathematical work: discovery and exploration, justification and reasoning, and finally presentation and communication.
In the works of the aforementioned researchers, the planes have been identified according to the genesis that they implement. Specifically, it was designated as [Sem-Dis] the plane associated with the semiotic and discursive genesis of the mathematical proof, [Ins-Dis] is the plane associated with the discursive genesis of the proof and the instrumental genesis, and finally, the plane called [Sem-Ins] is associated with semiotic genesis and instrumental genesis.
A diagram illustrating the above planes is shown in Figure 2.
Figure 2. Vertical planes in the Mathematical WorkspaceIn another section of this article, the MWS framework will be applied to the analysis of
the work done by students when solving an inverse modelling problem which is described in the next section. This problem evolved and several reformulations were proposed [9-10-11-12-13], constituting what can be considered as the trajectory of the problem.
THE PIRATE PROBLEM IN URUGUAY AND ARGENTINAIn 2013 a work experience was carried out with first year students at the UTN (the
Argentinean National Technological University). The learners – at least in their first year courses – usually study the complex numbers, as an abstract construct of the mathematicians

65Sumário
Proceedings of the 11th Southern Hemisphere Conference on the Teaching and Learning of Undergraduate Mathematics and Statistics ISBN 978-85-8167-237-3
with almost no relation with real life problems. For this reason, an inverse modelling problem [10-11] was proposed to them as an optional activity, in which complex numbers were used to find a pirate´s treasure, which was buried after performing an algorithm that involved rotations and translations.
In a first version of the problem, a pirate goes to an island with the intention of hiding a treasure. The island has two large trees and the pirate decides to put a flag at a certain distance from those trees. Then, the pirate performs the following procedure: he walks straight to the first tree, turns 90 degrees clockwise, walks the same distance and finally he puts a stake at this
point (labelled as 1S in Figure 3). After that, he repeats the procedure with respect to the second tree, except that he turns 90 degrees counter clockwise and after completing the process he
puts a second stake (labelled as 2S in Figure 3). The pirate treasure is buried at the midpoint between the stakes.
The direct problem consists in finding the point where the pirate buried his treasure as a function of the positions of the trees and the flag. This first version of the problem had been proposed to engineering students at the University of the Republic of Uruguay (UdelaR) since the early nineties and – as it was mentioned above – it was modified several times.
Figure 3 shows a diagram corresponding to the pirate’s procedure as it was proposed to
the Uruguayan students (i.e., the direct problem). In this figure, 1S and 2S are the positions of the stakes and the treasure is buried at M , the midpoint between the stakes.
Figure 3. Flag, trees and stakes positionsNow, let us suppose that the pirate takes many years to come back to the island and when
he returns, the stakes and the flag have disappeared. Then, the inverse problem [10] to solve is: where the flag could be located in order to find the treasure under the new conditions in which the pirate finds the island, that is to say, with standing trees, but no flag or stakes?

66Sumário
Proceedings of the 11th Southern Hemisphere Conference on the Teaching and Learning of Undergraduate Mathematics and Statistics ISBN 978-85-8167-237-3
This problem – proposed to the Argentinean students – can be solved by using Linear Transformations or Complex Numbers [9-10].
THE PIRATE PROBLEM SOLUTION USING COMPLEX NUMBERS
In this approach, let us put the real axis on the line connecting the trees and the imaginary axis on the perpendicular bisector of both (see Figure 4).
Figure 4. The pirate island and the complex plane.
In this case the trees’ positions are 0il +− and 0il + , while the pirate flag is located in bia + , which is a generic point in the southern part of the island. Positions are indicated in
Figure 5.
Figure 5. Flag and trees positions.
If ( ) ( ) bialbiailz −−−=+−+−= 01r
is the vector that joins the flag and the left tree, then
the clockwise rotation gives a new vector ( )alibzi ++−=− 1r
and finally, the first stake will be
located at ( ) ( )aliblziil ++−−=−+− 10 r.
67Sumário
Proceedings of the 11th Southern Hemisphere Conference on the Teaching and Learning of Undergraduate Mathematics and Statistics ISBN 978-85-8167-237-3
Now, the same process is carried out in order to get the position of the second stake. In
this case ( ) ( ) bialbiailz −−=+−+= 02r
is the vector that joins the flag and the right tree, the
counterclockwise rotation gives the vector ( )alibzi −+=2r
and the second stake will be located
at ( ) ( )aliblziil −++=++ 20 r.
Finally, the treasure will be in the midpoint M of the stakes, i.e.
( ) ( )[ ] ( ) ( )[ ] lialiblaliblM +=−+++++−−= 021
21
and this result has the following consequence: the midpoint M does not depend on the coordinates of the flag position and so, the treasure can be found starting from anywhere in the island.
Indeed a group of the Argentinean students through the use of Power Point computer animations, have showed that the location where the treasure is buried does not depend on the positions of the flag and the stakes.
THE PIRATE PROBLEM IN COLIMA, MEXICOThe University of Colima, México, organized a mini-course and workshop that was
devoted to inverse modelling problems [14]. The participants were pre-service teachers of mathematics, so at the beginning this audience was interested in mathematics itself, not in the applications to other subjects. Nevertheless, these prospective teachers were aware of the need of relevance and their main concern was connecting mathematics to real world situations, that could be modelled using mathematical tools.
One of the problems analyzed in the workshop was the pirate’s problem, in the same version proposed few months before in Argentina [10] with similar results in term of motivation and students’ interest.
OTHER VERSIONS OF THE PROBLEMMany years after, the pirate´s problem evolved – taking into account ideas and suggestions
of students and teachers – and some interesting variations were proposed. The most interesting versions are the following:1) The pirate problem with both rotations clockwise:In this case a variation is proposed in which the pirate always rotates clockwise and
wonders if he can find the treasure years later when the flag and the stakes are no longer present. Some students have shown using Geogebra, that in these conditions it is not possible to find the treasure, which can also be formally proved using complex numbers. It is obvious that if the pirate always rotates counter clockwise, the situation will be the same.
2) The pirate performs all the procedure in reverse order.Here the pirate begins by burying the treasure and then he performs his procedure, i.e.,
he walks straight to the first tree, turns 90 degrees clockwise, walks the same distance and puts a stake at this point. After that, he repeats the procedure with respect to the second tree, except that he turns 90 degrees counter clockwise and after completing the process he puts a second stake. Finally, the pirate puts his flag in the midpoint between the stakes.
As in the previous cases, when he returns to the island the flag and the stakes are no longer present and the question is whether he can find the treasure? If a student has solved the

68Sumário
Proceedings of the 11th Southern Hemisphere Conference on the Teaching and Learning of Undergraduate Mathematics and Statistics ISBN 978-85-8167-237-3
problem in its original version, he can see that the answer is negative for this new problem, i.e., it is impossible to find the treasure under these conditions.
3) Another version imitating the movements of a chess knight:In this case the pirate, who is a fan of the game of chess, advances a distance L towards
the first tree and after turning 90 degrees, advances a distance 2L, imitating the movement of the chess knight. Using complex numbers and/or linear transformations, it is easy to see that if the pirate rotates clockwise when arriving to the first tree and counter clockwise in the second case, then he will be able to find his treasure, even though the flag and the stakes are no longer on the island.
4) A fourth version that includes rotations, translations, homotheties, and symmetries: The starting point is the following direct problem: The pirate Knight – who is also a fan
of chess – goes to an island with the intention of hiding a treasure. The island has two large trees and a double palm tree – in the shape of letter ¨V¨ – and the pirate decides to put his flag, at a certain distance from all those trees. Then, he imitates the movements of the chess knight:
he walks straight to the first tree a distance 1L and after that, he turns 90 degrees clockwise
and he walks a distance 12L and finally he puts a stake at this point (labelled as 1S in Figure 6). After that, he repeats the procedure with respect to the second tree, except that he turns 90 degrees counter clockwise and after completing the process he puts a second stake. If M is the midpoint between the stakes, then the treasure is buried at the point T located symmetrically with respect to the double palm tree. The Figure 6 shows a diagram corresponding to the
pirate’s procedure, in order to arrive to the points 1S and 2S , which are the positions of the stakes, then the midpoint M , and finally, the treasure point T .
Figure 6. The “V” Island and the procedure followed by the pirate Knight

69Sumário
Proceedings of the 11th Southern Hemisphere Conference on the Teaching and Learning of Undergraduate Mathematics and Statistics ISBN 978-85-8167-237-3
The direct problem consists in finding the point where the pirate buried his treasure as a function of the positions of the trees and the flag.
This direct problem can be converted into a more interesting inverse one, as it was done with the previous version, i.e., let us suppose that the pirate takes many years to come back to the island and when he returns, the stakes and the flag have disappeared. Then, the inverse problem to solve is: where the flag could be located in order to find the treasure under the new conditions in which the pirate finds the island, i.e., with standing trees, but no flag or stakes?
This last version of the pirate’s problem was informally discussed with former students and colleagues – including postgraduates in France and Spain – but it has not been tested in teaching training courses yet.
CONCLUSIONS
Application of the MWS model to the study of the problems of inverse modellingThe MWS frame allows us to describe how the students worked with the pirate inverse
modelling problem in its different versions. As we will see, this work has undergone variations in the different educational contexts and particularly in many countries (Uruguay, Argentina, Mexico and France).
The first (direct) versions of the pirate’s problem – proposed to the Uruguayan engineering students – were focused in illustrating how to use complex numbers in geometric modelling
problems. At most, when reaching the result, that is
2,
2LL – which is the midpoint between
( )ab, and ( )aLbL −− , – the teacher usually mentioned that this result does not depend on the coordinates of the point where the pirate put the flag. The students used to draw a diagram – in most cases without a ruler or any other instrument – when working the problem, and then, or in parallel, they developed their ideas with vectors in the complex plane. Finally, they arrived to a theoretical demonstration, like the one presented in the above mentioned iJMEST previous article [10]. It is important to say that they only made a demonstration based on complex numbers, since Linear Transformations were studied later within a parallel course (Linear Algebra instead of Calculus I).
Obviously, the work consisted basically of a rather precarious visualization – without the use of artefacts – and a formal proof, so that the mathematical work of these students took place mainly in the [Sem-Dis] plane, associated to the semiotic and discursive geneses of the proof.
The inverse problem in its first version – that is, the one that only involves rotations and translations – was proposed in Buenos Aires to the UTN engineering students. Unlike the experience conducted in Montevideo, Uruguay, these students were given the problem as an optional task to be done as non compulsory homework. Various groups of students did their work in a similar way as the UdelaR students in Montevideo, that is, a simple visualization, without artefacts and a formal proof using complex numbers. On the other hand, other groups preferred the use of geometric instruments (mainly rules and squares) and even a group of students made an animated presentation in Power Point, which showed how it is possible to start from two different points in the island and arrive to the same final point, where the treasure is buried. In this case, the students worked on each of the edges of the model (the semiotic, instrumental and discursive geneses) and at least in their final presentation, they

70Sumário
Proceedings of the 11th Southern Hemisphere Conference on the Teaching and Learning of Undergraduate Mathematics and Statistics ISBN 978-85-8167-237-3
concentrated on the [Sem-Dis] and [Ins-Dis] planes (mainly the first one, since only one group clearly worked on the second one).
In the course-workshop, developed at the University of Colima, Mexico, it was possible to observe in much greater detail the work of students with this problem. The students (all of them from the Mathematics Faculty) had not seen yet Linear Transformations, and about Complex Numbers they had only studied the fundamental operations, without a special emphasis on their geometric representation. On the other hand, in contrast what happened in Montevideo and Buenos Aires, this activity took place outside the regular courses and without a time limit on the task. In addition, being a face-to-face activity in the form of a workshop, it was possible to observe in detail how they performed their production. In this case, the students did not – nor did they attempt – a theoretical demonstration like the one presented in previous articles and book chapters [9-10-12]. Instead of this, they worked with geometric instruments (rules, squares and in some cases also protractor) and for different initial points, they located the pirate’s flag. On the contrary, the work of the students from Montevideo and Buenos Aires was focused on the [Sem-Ins] plane, exclusively.
It should be mentioned that the students worked on the first version of this problem in Montevideo in the decades of 1990-2000 and 2000-2010 and the other two experiences (in Buenos Aires and Colima) took place in 2013. Finally, in 2016, the chess knight reformulation of the problem was presented at the LDAR Seminary in Paris, France, but in this case the public was made up of researchers and doctoral students. In this opportunity, although it was a seminar not a workshop, some participants worked on the problem and commented that they had used the GeoGebra program to perform a different mathematical demonstration. As expected from a more specialized audience, those who addressed the problem worked at all levels of the MWS model. Moreover, they suggested possible modifications as it was described in the first and second versions of the previous section. Finally, it is important to comment that both modified versions were analyzed using GeoGebra.
Final comments and further researchBased on the results, mathematical work and circulation in the MWS vary in a very
important way when the educational context changes. Indeed, in the work with the pirate problem, important changes were observed according to the country, the institution and the formation of the students (Engineering, Teachers, or PhD degrees).
It is worth mentioning that the problem has been changing, to incorporate new enriching elements. First it was a direct problem, then an inverse problem with rotations and translations, then the homotheties were added (imitating the knight chess) and finally an inverse problem was proposed with the addition of central symmetry (in the “V” Island problem), among other reformulations.
As can be seen, the trajectory of the problem has reached this last version – the “V” Island problem, which will be proposed in future courses and workshops – as well as other reformulated versions, in order to investigate how students work on it. For this purpose the MWS showed to be a useful tool for analysis and it can be conjectured that the different educational context is the main variable to be considered.
Finally, it is important to mention that several other inverse modelling problems are being tested with Spanish master students (at the University of Granada, UGR) and it is expected that a similar project will be launched this year with Uruguayan pre-service teachers.

71Sumário
Proceedings of the 11th Southern Hemisphere Conference on the Teaching and Learning of Undergraduate Mathematics and Statistics ISBN 978-85-8167-237-3
AcknowledgementThe author would like to thank the University of Paris Diderot and the LDAR for the
invitation and their hospitality and kindness, which allowed working on this research.
REFERENCES[1] Martínez Luaces, V., (2003). Mass Transfer: the other half of Parabolic P.D.E. New Zealand
Journal of Mathematics, 32, pp. 125-133.
[2] Martinez Luaces, V., (2009). Modelling and inverse modelling: innovations with second order P.D.E. In: engineering courses. En/l D. Wessels y C. Snyman (Eds.), Proceedings of Southern Right Delta ’09, Seventh Southern Hemisphere Conference on Undergraduate Mathematics and Statistics Teaching and Learning. South Africa: ISC-Delta.
[3] Kuzniak, A. (2011). L’espace de Travail Mathématique et ses genèses. In Annales de didactique et de sciences cognitives, 16, pp. 9-24.
[4] Kuzniak, A., Parzysz, B., & Vivier, L. (2013). Trajectory of a problem: a study in Teacher Training. The Mathematics Enthusiast, 10(1-2), pp. 407-440.
[5] Kuzniak, A., & Richard, P. R. (2014). Spaces for mathematical work: Viewpoints and perspectives. Revista Latinoamericana de Investigación en Matemática Educativa, 17(4), pp.17-27.
[6] Gómez-Chacón, I. M., & Kuzniak, A. (2015). Spaces for geometric work: figural, instrumental, and discursive geneses of reasoning in a technological environment. International Journal of Science and Mathematics Education, 13(1), pp. 201-226.
[7] Kuzniak, A., Tanguay, D., & Elia, I. (2016). Mathematical Working Spaces in schooling: an introduction. ZDM, 48(6), pp. 721-737.
[8] Kuzniak, A., Nechache, A., & Drouhard, J. P. (2016). Understanding the development of mathematical work in the context of the classroom. ZDM, 48(6), pp. 861-874.
[9] Martinez-Luaces, V., (2012). Problemas inversos y de modelado inverso en Matemática Educativa, Saarbrücken, Germany: E.A.E.
[10] Martinez-Luaces, V., (2013). Inverse modelling problems in linear algebra undergraduate courses. International Journal of Mathematical Education in Science and Technology, 44(7), pp 1056-1064.
[11] Martinez-Luaces, V., (2016). Inverse Modeling Problems and their Potential in Mathematics Education. In Teaching and Learning: Principles, Approaches and Impact Assessment. Chapter 7, pp. 151-185. New York: Nova Publishers
[12] Martinez-Luaces, V., (2016). Relevance, motivation and meaningful learning in Mathematics Education. In Progress in Education. Chapter 7, pp. 207-233. New York: Nova Publishers.
[13] Martinez-Luaces, V., (2016). Problemas de modelado inverso en Matemática Educativa, Saarbrücken, Germany: E.A.E.
[14] Martinez-Luaces, V., (2013). Problemas inversos y de modelado inverso: posibilidades y potencialidad en Matemática Educativa (conferencia magistral). In Memoria del Congreso internacional en Ciencias de la Educación, pp. 15-23. Mexico: Universidad de Colima.

72Sumário
Proceedings of the 11th Southern Hemisphere Conference on the Teaching and Learning of Undergraduate Mathematics and Statistics ISBN 978-85-8167-237-3
THE EFFECT OF USING SIMULATIONS ON STUDENTS’ LEARNING OF INFERENTIAL STATISTICS IN AN ELEMENTARY
STATISTICS CLASS IN THE MATHEMATICAL SCIENCES DEPARTMENT OF THE UNIVERSITY OF WISCONSIN-
MILWAUKEE
K. McLeod7
Alexa Schut
University of Wisconsin-Milwaukee, USA
ABSTRACTWe report on a study which looked at the effect of introducing simulations into one introductory statistics class at the University of Wisconsin-Milwaukee during the Fall 2016 semester. We find statistically significant improvement (p < 0.01) in student understanding of confidence intervals. This finding supports the results of a recent study undertaken at Iowa State University.KEYWORDS: Introductory Statistics Courses; Simulation; Online Applets.
INTRODUCTIONThere have been many calls in recent years [1], [2], [3] to incorporate more technology
into the teaching of statistics at both secondary and tertiary levels. As a result, many college level, introductory statistics courses have embraced some level of technology such as graphing calculators, computer software, or online applets. Questions still remain, however, as to how useful these technologies are in helping students understand inferential statistics. More recently, the use of simulation-oriented applets for teaching inferential statistics has risen in popularity, but again there has been limited research up to this point on the true impact of simulations on student learning. The present paper reports on a study which looked at the effect of introducing simulations into one introductory statistics class at the University of Wisconsin-Milwaukee during the Fall 2016 semester. We were motivated to undertake this study in part by the results of a similar, though larger-scale, study at the University of Iowa [4], and our results in large measure replicate the results of that study.
LITERATURE REVIEW
Expected Gains from Appropriate Technology UseAccording to the Guidelines for Assessment and Instruction in Statistics Education (GAISE)
report [1], published by the American Statistical Association, “any introductory [statistics] course should take as its main goal helping students to learn the basic elements of statistical thinking”. Despite this recommendation, it is still all too common for students in introductory college-level statistics courses to spend large portions of their time on calculations, while minimizing time spent on interpretation of those calculations or of the original data. In a study of the effects of using simulations for analyzing the brain power of dolphins to teach students about inferential statistics, Strayer and Matuszewski [5] noted that statistics classes often

73Sumário
Proceedings of the 11th Southern Hemisphere Conference on the Teaching and Learning of Undergraduate Mathematics and Statistics ISBN 978-85-8167-237-3
emphasize memorization of steps and formulas for hypothesis testing that lead to a conclusion about the null hypothesis, while leaving the students with a minimal conceptual understanding of inferential statistics. While students focus on following a given sequence of steps, probably using a calculator to get numerical answers, they miss the bigger picture of what is going on behind all the work they were told to do by their teacher and textbook. Too often, students are focused on computing the “right” values to decide whether they should reject or not reject a hypothesis, and see no need to understand the meaning or interpretation of the values they have found.
While it is possible for students to learn the deeper meaning of inferential statistics without simulations, some statistics educators over the past few years have started to see the benefit of using simulations to teach this topic. Tintle et al. [6] noted six reasons why a simulations-based approach can be effective in creating a deeper understanding of inferential statistics: the use of simulations
• clearly presents “the overarching logic of inference,”• strengthens the “ties between statistics and probability/mathematical concepts,”
encourages students to “focus on the entire research process,”• facilitates students to think about “advanced statistical concepts,”• allows for more time to “explore, do, and talk about real research and messy data,”
and• allows students to act on a “firmer foundation on which to build statistical intuition.”These authors are stating an expectation that appropriate use of simulations will help
students to focus less on computational procedures, and more on what it means to truly understand and use statistics.
Allan Rossman and Beth Chance, who worked closely with Tintle to develop a simulations-based statistics course, noted in their research [7] that students need to realize that statistics is about more than getting a “yes” or “no” answer: it is, instead, about reaching a conclusion that fits with the context of the situation, and explaining how strongly that conclusion is supported by the data. Rossman and Chance state, “Our goal is not only for students to be able to interpret conclusions reported in scholarly and popular literature, but also to be able to explain them clearly to people who are not familiar with statistics.” Chance et al. [8] also state, “Technology has also expanded the range of graphical and visualization techniques to provide powerful new ways to assist students in exploring and analyzing data and thinking about statistical ideas, allowing them to focus on interpretation of results and understanding concepts rather than on computational mechanics.” Students can collect, analyze, and draw conclusions from data relevant to their own questions or topics, allowing them to feel empowered in and experience the full practice of statistics. Instructors can focus on testing students’ ability to carry out a full analysis of a data set, rather than smaller- scale computational questions, and we can hope that students will see that the data can reveal possibly unexpected but illuminating stories of real world situations [8].
Possible Concerns with the Use of SimulationsEven while acknowledging the benefits of technology use, and especially simulations, in
the teaching of statistics, some authors have expressed concerns about the use of inappropriate technology, or about new student misconceptions that might arise as the result of technology use. For example, Schnaffer [9] notes that there is often a “disconnect between software that is useful for teaching versus doing statistics”. He goes on to describe how, in his first attempts at using technology for activities and demonstrations in the classroom, it became harder to cover

74Sumário
Proceedings of the 11th Southern Hemisphere Conference on the Teaching and Learning of Undergraduate Mathematics and Statistics ISBN 978-85-8167-237-3
the required material for the course, and he eventually switched to a flipped classroom model which was more compatible with the use of the technology.
Another concern that has been voiced in some of the more recent research is the need to plan the use of simulations carefully, and then monitor student interaction closely as the simulations are used [8]. As teachers prepare to use technology in the classroom, their initial focus should be on why they are using a particular technology, and how it will be implemented in the classroom [8]. As instructors plan their use of technology, they must make sure that the material to be studied is accessible, interesting, and useful for their students, so that students have a meaningful learning experience rather than simply using technology for its own sake [1]. The technology should not be used merely as a calculational aid, but rather as a tool for exploring different concepts and enhancing student learning through concrete examples [1]. The technology is intended to aid in the learning of statistical concepts, so an overly complicated program, or one which is not easily accessible to students, can be counter-productive. Watkins, Bargagliotti, and Franklin [10] looked at two misconceptions that can occur because of the use of simulations: that students may believe it is necessary to draw multiple samples in order to make valid statistical inferences when using computer simulations for SDM (the Sample Distribution of the Mean); and that students have trouble distinguishing the variability due to random selection of data from the variability from using small numbers of replications. In particular, many students thought that they needed to increase the sample size in order for the mean of the sample means to be equal to the population mean, and for the standard deviation of the sample means to be equal to the population standard deviation divided by the sample size, although both of these relationships actually hold for samples of any size. According to [10], students were led to this conclusion precisely because of the variability that occurs when using simulations of repeated samples. Issues of this type should be directly addressed by instructors in order to avoid confusion.
A final concern is that students may not be able to connect the values and visuals provided by the simulations with the process used to achieve these values [7]. Rossman and Chance suggest the possibility of using physical manipulatives to avoid this sort of confusion [7]. They also suggest that students can be helped to make the connection by first going through the full analytic process by hand, concurrently with using the applets, so that they can compare the results from the theoretical process with those from the simulations.
Summary of a Recent StudyIn Spring 2014, instructors at Iowa State University conducted a study comparing two
sections of their introductory statistics course [4]. Students in each section were randomly assigned to one of two cohorts (4 cohorts in all); the sections were co-taught, and instructors alternated, to reduce the effects of the instructor variable. For the first part of the course, both sections were taught in a traditional lecture format. After 9 weeks, the course turned to inferential statistics, and two cohorts (one from each section) switched to a simulations-based approach using the StatKey software package, while the remaining two cohorts continued with the traditional course format. The assignments for both classes, though necessarily somewhat different, were kept as similar as possible whenever the classes covered similar topics. To evaluate student learning, the researchers used the ARTIST (Assessment Resources Tools for Improving Statistical Thinking) items [11] from the University of Minnesota, administered as part of the final exam. They also looked at two questions from the final exam that focused on conducting statistical inference in an applied setting using a theory-based approach. For the ARTIST questions, and the final exam question that focused on confidence intervals, the simulation-based cohorts had higher average scores than the traditional cohorts, but the simulation cohorts had lower average scores on the hypothesis-testing question of the final

75Sumário
Proceedings of the 11th Southern Hemisphere Conference on the Teaching and Learning of Undergraduate Mathematics and Statistics ISBN 978-85-8167-237-3
exam. The simulation group had greater variability than the traditional group for all questions, except for those focused on confidence intervals. The researchers found no significant difference for hypothesis testing between the two groups, but the average gain for the simulation group of 7.146% (0.7146 out of a possible 10 points) on the ARTIST scale for questions about confidence intervals was statistically significant at the 5% level. The researchers do, however, conclude by pointing out possible concerns about the validity of their results, including “the replicability of treatments, and the measurement of learning outcomes.”
METHODOLOGY
Research DesignWith the results of the Iowa State study in mind, our research question was
Will the use of simulation applets in an introductory college statistics course produce improved student understanding of foundational statistics concepts and, in particular, understanding of confidence intervals?
The students in our study were self-enrolled in two sections of the introductory college- level statistics course in the Mathematical Sciences Department of the University of Wisconsin-Milwaukee, MTHSTAT 215, Elementary Statistical Analysis, which fulfills a general education Mathematics requirement for many students. Both sections were taught by the same instructor (Schut), who was also the principal investigator for the study. To protect the students’ privacy, each student was assigned an ID number that was used throughout the analysis. The students in the control section were given ID numbers in the 700’s, and the students in the intervention section were given ID numbers in the 800’s.
Control and Intervention GroupsBoth sections met on Tuesdays and Thursdays for 75 minutes over a 14-week Fall semester.
The control section met at 8:00 am and the intervention (simulation) section met at 9:30 am. The control section consisted of 15 students, and the intervention section had 28 students; all students in both sections consented to be a part of the study. The content and examples for the two sections were always similar, and often matched exactly; in particular, both sections used the same textbook. Both sections concentrated on an introduction to inferential statistics, and covered topics such as: descriptive statistics, measures of center and standard deviation, correlation and regression, basic probability, normal distribution, confidence intervals, and hypothesis testing. Both sections were taught in the standard lecture format for the class, with weekly quizzes, three semester exams, a final exam, and effort-based homework from the textbook.
In the intervention section, a small number of simulation-based applets were used to demonstrate examples during the lectures, and the students completed two to three different problems in each homework assignment that required them to use the applets. (Students in the control section were assigned 12 problems from the textbook for each homework assignment, while students in the intervention section were assigned 9 or 10 problems from the textbook and 2 or 3 applet problems, so students in the two sections were assigned the same number of problems, and completed essentially the same amount of work in total.) The homework questions focused first on guiding them through the applets again, and then on having them draw conclusions from the values, graphics, and trends that they saw in the applets. The simulation-based problems, as with all homework assignments in both sections, were graded based on effort. The topics that were covered in the simulation homework were:

76Sumário
Proceedings of the 11th Southern Hemisphere Conference on the Teaching and Learning of Undergraduate Mathematics and Statistics ISBN 978-85-8167-237-3
• the relation of sample means and medians for different shaped data sets; conceptual understanding of the mean, median and standard deviation of a data set, and what these values would look like for a given data set;
• relating a line of best fit to data to see how outliers can change the line; understanding how the correlation coefficient relates to the spread of the data; understanding how probability relates to long run behavior;
• the use of a sample distribution to approximate the area under a normal curve; the relation of the mean of sample means to the population mean;
• the relation of the standard deviation of the sample means to the population standard deviation;
• the connection between confidence levels and the width and precision of a con- fidence interval; and
• the meaning and interpretation of p-values.We selected applets from two different sites. The first site contained the Rossman
and Chance Applets from Hope College (http://math.hope.edu/isi/) that were created to accompany a newer textbook that teaches introductory statistics through simulations. We used applets from this site for work on regression and correlation, hypothesis testing, and confidence intervals. Specifically, we used the following applets: Descriptive Statistics, Regression/Correlation, Correlation Guessing Game, One Proportion, One Mean, Theory-Based Inference, Matched Pairs, and Multiple Means. The second site was the Rice Virtual Lab in Statistics (RVLS) (http://onlinestatbook.com/stat sim/index.html). From this site, we used only the Sampling Distribution Applet, which we used to explore the effect of the shape of a data set on the relation between the mean and median, and the effect on the sample distribution of changing sample sizes.
Data CollectionWe measured students’ level of understanding of statistical concepts in two ways: with a
short pre/post test, and through selected questions on the three semester exams and the final exam. (Recall that both sections were given the same exams.) These assessments were given to students in both the control and intervention sections. In addition, students in the intervention section were asked to complete a brief survey on their reactions to the use of the applets, at the end of the semester.
The pre/post test consisted of four questions:(1) What is statistics, and why do we study statistics?(2) How would you set up an experiment with twenty subjects who have to choose
between two variables?(3) What is the role of randomization in statistical studies? Why is random sampling so
important? What is a random sample?(4) When would you expect the mean to be greater than or less than the median?For the exam questions, we selected 17 constructed-response questions (or parts of
questions) that related to the simulation-based homework problems given to the intervention section. The content addressed by each of the 17 rubric-graded questions is shown in Table 1 (notation: E1.4c refers to question 4c on Exam 1; F.1b refers to question 1b on the final exam).
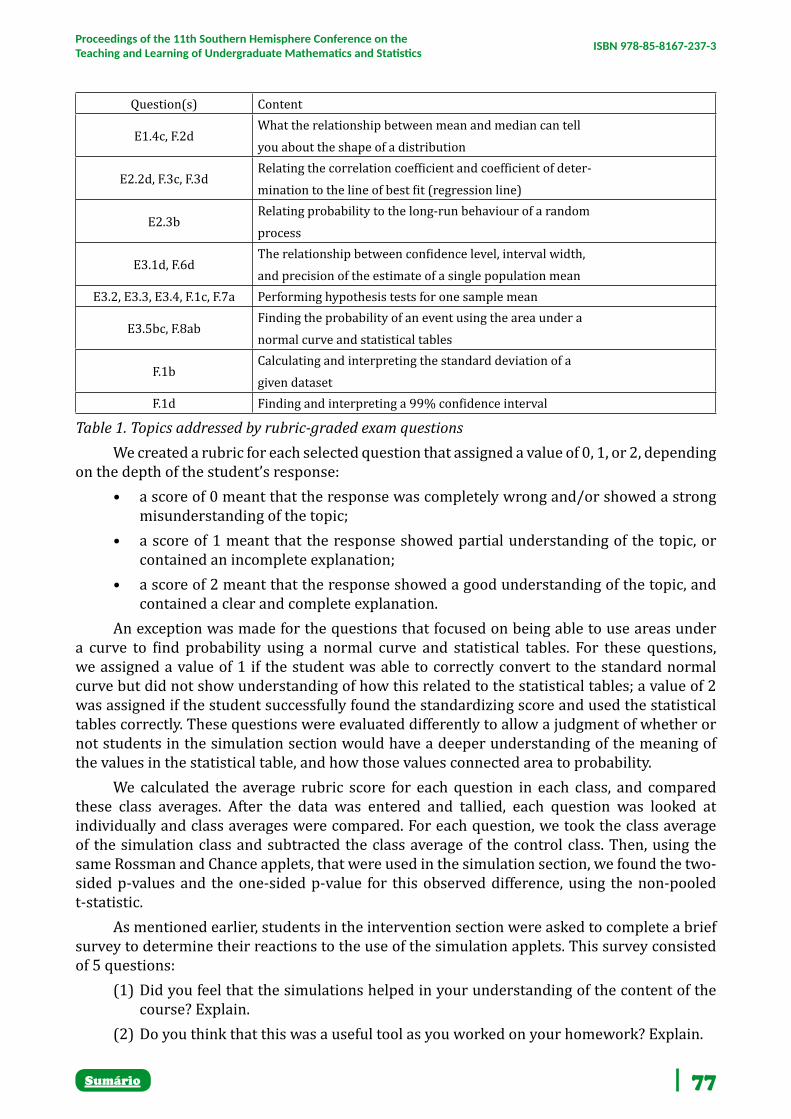
77Sumário
Proceedings of the 11th Southern Hemisphere Conference on the Teaching and Learning of Undergraduate Mathematics and Statistics ISBN 978-85-8167-237-3
Question(s) Content
E1.4c, F.2dWhat the relationship between mean and median can tellyou about the shape of a distribution
E2.2d, F.3c, F.3dRelating the correlation coefficient and coefficient of deter-mination to the line of best fit (regression line)
E2.3bRelating probability to the long-run behaviour of a randomprocess
E3.1d, F.6dThe relationship between confidence level, interval width,and precision of the estimate of a single population mean
E3.2, E3.3, E3.4, F.1c, F.7a Performing hypothesis tests for one sample mean
E3.5bc, F.8abFinding the probability of an event using the area under anormal curve and statistical tables
F.1bCalculating and interpreting the standard deviation of agiven dataset
F.1d Finding and interpreting a 99% confidence interval
Table 1. Topics addressed by rubric-graded exam questionsWe created a rubric for each selected question that assigned a value of 0, 1, or 2, depending
on the depth of the student’s response:• a score of 0 meant that the response was completely wrong and/or showed a strong
misunderstanding of the topic;• a score of 1 meant that the response showed partial understanding of the topic, or
contained an incomplete explanation;• a score of 2 meant that the response showed a good understanding of the topic, and
contained a clear and complete explanation.An exception was made for the questions that focused on being able to use areas under
a curve to find probability using a normal curve and statistical tables. For these questions, we assigned a value of 1 if the student was able to correctly convert to the standard normal curve but did not show understanding of how this related to the statistical tables; a value of 2 was assigned if the student successfully found the standardizing score and used the statistical tables correctly. These questions were evaluated differently to allow a judgment of whether or not students in the simulation section would have a deeper understanding of the meaning of the values in the statistical table, and how those values connected area to probability.
We calculated the average rubric score for each question in each class, and compared these class averages. After the data was entered and tallied, each question was looked at individually and class averages were compared. For each question, we took the class average of the simulation class and subtracted the class average of the control class. Then, using the same Rossman and Chance applets, that were used in the simulation section, we found the two-sided p-values and the one-sided p-value for this observed difference, using the non-pooled t-statistic.
As mentioned earlier, students in the intervention section were asked to complete a brief survey to determine their reactions to the use of the simulation applets. This survey consisted of 5 questions:
(1) Did you feel that the simulations helped in your understanding of the content of the course? Explain.
(2) Do you think that this was a useful tool as you worked on your homework? Explain.

78Sumário
Proceedings of the 11th Southern Hemisphere Conference on the Teaching and Learning of Undergraduate Mathematics and Statistics ISBN 978-85-8167-237-3
(3) Would you recommend this technique for future students? Explain.(4) What did you like about the simulations?(5) What did you dislike about the simulations?
RESULTS
Quantitative Results: Rubric-graded Exam QuestionsTable 2 shows summary data on all 17 rubric-graded questions for the two sections.
An asterisk, ∗, indicates 1-sided p-values which are statistically significant at the 5% level; ∗∗ indicates significance at the 1% level.
Question code E1.4c E2.2d E2.3b E3.1d E3.2 E3.3 E3.4 E3.5bcSimulations Mean 1.000 1.467 0.933 1.467 0.200 0.467 0.333 0.933Simulations S.d. 0.894 0.718 0.249 0.618 0.542 0.806 0.699 0.929Control Mean 1.267 0.933 0.867 0.667 0.400 0.667 0.467 0.600Control S.d. 0.772 0.854 0.618 0.789 0.800 0.943 0.806 0.8792-sided p-value 0.314 0.050 0.400 0.024 0.395 0.492 0.593 0.2541-sided p-value 0.843 0.025∗ 0.348 0.012∗ 0.802 0.754 0.704 0.128
Question code F.1b F.1c F.1d F.2d F.3c F.3d F.6d F.7a F.8abSimulations Mean 1.067 1.133 1.067 1.200 1.000 0.733 1.600 0.867 1.333Simulations S.d. 0.854 0.806 0.854 0.909 0.730 0.680 0.712 0.806 0.869Control Mean 0.600 0.400 0.867 0.867 0.733 0.600 0.667 0.733 0.667Control S.d. 0.611 0.611 0.957 0.806 0.772 0.800 0.869 0.854 0.8692-sided p-value 0.045 0.002 0.503 0.225 0.280 0.588 0.001 0.622 0.0231-sided p-value 0.023∗ 0.001∗∗ 0.252 0.113 0.140 0.295 <0.001∗∗ 0.311 0.012∗
Table 2. Summary data for rubric-graded questions
Qualitative Results: Pre/Post TestWe collect here some typical students’ responses from the pre/post tests. (Recall
that students in the control section were given ID numbers in the 700’s, and students in the intervention section were given ID numbers in the 800’s.)
Question 1 was about the meaning of statistics, and why we study statistics. Stu- dent 701 wrote in the pre-test that
[statistics is the study of] numbers and graphs, helps us better understand data and make observations
and in the post-test that[statistics was about] probability and we study it to help solve word problems and con- figure data.
Student 707 wrote in the pre-test that[statistics] deals with numbers (stats) — companies use it and are also used in studies for data
and in the post-test that[statistics is] probability and studies to figure out certain thing/answers.
Student 801 wrote in the pre-test that

79Sumário
Proceedings of the 11th Southern Hemisphere Conference on the Teaching and Learning of Undergraduate Mathematics and Statistics ISBN 978-85-8167-237-3
[statistics is the] study of mathematical quantities that reflect on a study of a population. It is important to study statistics as it helps us better understand the world around us,
and in the post-test that[statistics is the] study of probability and the means of scientific testing.
Student 817 indicated in the pre-test that s/he did not know what statistics is, but by the end of the semester was able to state that statistics is about using probabilities to make conclusions.
Question 2 was about setting up an experiment using twenty subjects with two variables. For this question in the pre-test, Student 701 simply stated s/he would do a blind study, but in the post-test was able to describe an experiment that involved a control group, experimental group, independent and dependent variables, and randomization. Student 807 wrote about using random samples on both occasions, and did not show significant growth. Several students in the intervention section wrote on both occasions about splitting into two groups based on variables and then comparing the two groups.
Question 3 was about the importance of randomization, and why it is important to use random samples. Student 701 noted in the pre-test that “random means there is no certain process which prevent[s] bias”; in the post-test s/he still talked about avoiding bias, but now mentioned how each subject has to have equal likelihood of being chosen. Student 827 noted in the pre-test that randomization is used to represent a population, and that “if you do not use random samples the subjects may be similar to each other so they would not provide useful data”. In the post-test, this student stated that using random samples “allows for the probability of being chosen equal among all people”, and this will give accurate and unbiased data.
The final question asked about the relationship between the mean and median, and what that relationship might tell you about the data. Student 701 stated in the pre-test that s/he was not sure what the relationship is, but wrote in the post-test that the relationship is effected by outliers and the skew of the data. Student 809 wrote in the pre-test that “you would expect it when the sample size is larger”, but noted in the post-test that the relationship would depend on whether “there are large outliers or small outliers present in the data”. Student 801 thought in the pre-test that the relationship was based on the “split of the data”, but noted in the post-test that it was connected to the skew of the data.
Qualitative Data: Student Response to the AppletsStudents in the intervention section were also asked to give their opinions of the applets.
Of the 28 students in this section, 25 completed this survey. Reactions overall were mixed: 14 students had a generally positive response to the applets, but 11 were more negative. What follows is a selection of typical responses.Student 801 noted that most of the applets were fairly easy to use, and gave a good way to check their understanding of the solutions they found using the theoretical approach. Student 802 felt that the applets were not helpful because they felt that all they did was “click buttons”, though s/he did find the applets were easy to use. According to Student 803,
[The applets helped] visualize what happens to some variables when we manipulate others.
Student 806 felt that the simulations did not add anything to the class that s/he could not learn from the standard approach to the course. Student 807 found the applets confusing and hard to follow. Student 809 thought that they were not necessary “unless you personally thought they were helpful”, but otherwise they were a

80Sumário
Proceedings of the 11th Southern Hemisphere Conference on the Teaching and Learning of Undergraduate Mathematics and Statistics ISBN 978-85-8167-237-3
a waste of time because we were never tested on them.Student 813 thought that the applets were helpful because
you could see step by step how to solve problems with accurate graphs of the data.
Student 817 thought that the applets worked well, but that they should only be a resource rather than required for the course. Student 818 noted that the applets high- lighted what s/he did not know, but s/he would only want to use them as a resource. Student 819 thought that the applets were useful because they provide visuals of the processes. Student 826 thought that the applets cleared up topics that they found confusing in class. Student 831 enjoyed the applets because they
gave me a chance to try the samples out on my own.Finally, Student 829 noted that s/he did not like the applets because
unless I see the math and equations used I don’t understand the data.
DISCUSSION AND CONCLUSIONSAs we planned our study, we expected that our most interesting results would come
from the qualitative student responses, and particularly from the reactions of the students in the intervention section to the use of the applets. In the event, however, we did find strong quantitative results.
Comparing the control and intervention sections for the 17 exam questions individually, the control section had a higher mean than the simulations group for 4 questions, but in none of those four cases was the difference statistically significant. Interestingly, 3 of the 4 questions were Questions E3.2, E3.3, and E3.4, which all concerned hypothesis testing on one sample mean. (On Question F.7a, which was on the same topic, the simulation section had the higher mean.) On the other hand, there were 5 questions on which the intervention section had a higher mean, with the (1-sided) difference being statistically significant at the level of p ≤ 0.05, and in two of those cases the significance was at the level of p ≤ 0.001. These two strong results were for Questions F.1c, concerning hypothesis testing for one sample mean, and F.6d, concerning confidence intervals. We thus confirm the result from the Iowa State study, [4], that students in the simulation section show a greater understanding of confidence intervals. We note that the earlier study showed no significant difference in understanding of hypothesis testing between the two groups, and that our results for that topic are also mixed, even with the result on Question F.1c.
Turning to our qualitative results and the 5 question pre/post test, we found for most of the students in the control section that their understanding of the material did not change greatly throughout the semester: if they gave a weak answer to one of the questions at the start of the semester, they were still unclear at the end. On Question 1, however, some of these students, like Student 701 quoted above, did seem to have come to the conclusion that we studied statistics in order to “solve word problems and configure data”. Students in the intervention section, like Students 801 and 817, were more likely to talk about statistics as helping us to use probability to study a population and/or understand the world around us.
Neither section showed obvious changes in their answers to Question 2. For Question 3, which concerned randomization, students in the control section showed no obvious change, while students in the intervention section were able to explain how random sampling gives every individual — and some were even able to say, every sample — an equal chance of being chosen.

81Sumário
Proceedings of the 11th Southern Hemisphere Conference on the Teaching and Learning of Undergraduate Mathematics and Statistics ISBN 978-85-8167-237-3
For the final question, on the relationship between mean and median, students in the intervention section seemed to end the semester better able to explain how the relationship between the two values depended on the skewness of the data set.
Finally, we discuss briefly the response to the applets from students in the intervention section. As stated earlier the overall results were mixed, with 14 generally positive responses, and 11 generally negative. Overall, however, the negative feedback focused on students’ feelings that the applets were extra work in the class, or that they were “useless” because they weren’t graded. Several students seemed to view the applets just as work to get through, rather than as tools to aid in their understanding. We conjecture that students felt this way in part because the applets were added on to the standard course, rather than being fully integrated. It was not possible for us to redesign the course in this way (as recommended by [9], among others) for this study, but we would certainly try to carry out a more comprehensive course redesign for any future study.
The positive comments were more varied, but generally matched our goals of providing visual learning opportunities, and leading students to a deeper understanding of the material than they would probably obtain in a standard lecture-only format. We conjecture that more students would appreciate these goals, and respond positively to the applets, if they were more fully integrated into a redesigned course.
Regardless of the student response, we conclude that introducing simulations into an introductory statistics course provides positive benefits and leads to greater student understanding of the concepts of inferential statistics, particularly concerning confidence intervals. In this last conclusion, we confirm the results of the earlier Iowa State study.
REFERENCES(1) American Statistical Association. (2005). Guidelines for Assessment and Instruction in
Statistics Education: College Report. Alexandria, VA: Author.
(2) American Statistical Association. (2007). Guidelines for assessment and instruction in statistics education (GAISE) report: A pre-K–12 curriculum framework. Alexandria, VA: Author.
(3) American Statistical Association. (2015). The statistical education of teachers. Alexandria, VA: Author.
(4) Maurer, K. & Lock, D. (2016). Comparison of Learning Outcomes for Simulation-based and Traditional Inference Curricula in a Designed Educational Experiment, Technology Innovations in Statistics Education, v.9(1). Retrieved August 9, 2017 from http://escholarship.org/uc/item/0wm523b0
(5) Strayer, A. M. & Matuszewski, A. (2016). Statistical Literacy: Simulations with Dolphins, Mathematics Teacher, v.109(8), 606–611
(6) Tintle, N. L., Chance, B., Cobb, G., Roy, S., Swanson, T., & VanderStoep, J. (2015). Combating Anti-Statistical Thinking Using Simulation-Based Methods Throughout the Undergraduate Curriculum, Faculty Work: Comprehensive List. Paper 574. Retrieved August 8, 2017, from http://digitalcollections.dordt.edu/faculty work/574
(7) Rossman, A. J., & Chance, B. L. (2000). Teaching the reasoning of statistical inference: A ”Top Ten” List, The Mathematical Association of America. Retrieved August 8, 2017, from http://www.rossmanchance.com/papers/topten.html

82Sumário
Proceedings of the 11th Southern Hemisphere Conference on the Teaching and Learning of Undergraduate Mathematics and Statistics ISBN 978-85-8167-237-3
(8) Chance, B., Ben-Zvi, D., Garfield, J., & Medina, E. (2007). The Role of Technology in Improving Student Learning of Statistics, Technology Innovations in Statistics Education, v.1(1). Retrieved August 8, 2017, from http://escholarship.org/uc/item/8sd2t4rr
(9) Schaffner, A. (2015). Some Thoughts and Experiences Using Simulation/Randomization Based Methods in Introductory Statistics Courses and in the Undergraduate Statistics Curriculum, Retrieved August 9, 2017, from https://www.causeweb.org/sbi/?p=828#more- 828
(10) Watkins, A., Bargagliotti, A., & Franklin, C. (2014). Simulation of the Sampling Distribution of the Mean Can Mislead, Journal of Statistics Education, v.22(3).
(11) Garfield, J., (2006). Assessment Resource Tools for Improving Statistical Thinking, Accessed on August 9, 2017, at https://apps3.cehd.umn.edu/artist/

83Sumário
Proceedings of the 11th Southern Hemisphere Conference on the Teaching and Learning of Undergraduate Mathematics and Statistics ISBN 978-85-8167-237-3
MULTIPLE REPRESENTATIONS IN THE STUDY OF ANALYTICAL GEOMETRY: VIDEO PRODUCTION IN A DISTANCE ONLINE PRE
SERVICE TEACHER EDUCATION PROGRAM
Liliane Xavier Neves8
Department of Exact and Technological Sciences, Santa Cruz State University, Ilhéus, Brazil;
Marcelo de Carvalho Borba9
Department of Mathematics Education, São Paulo State University Júlio de Mesquita Filho, Rio Claro, Brazil
ABSTRACTThis proposal is about an ongoing study that seeks to analyze the ways students of a teaching degree in Mathematics articulate multiple representations when producing videos on Analytical Geometry. We will present the digital videos as multimodal resources (Walsh, 2011) that allow the expression of ideas related to contents of Analytical Geometry based on audiovisual thinking for the exploration of the senses in order to provoke changes in mental processes (Ferrés, 1996). The contributions of the manipulations of different representations to the process of giving meaning to mathematical concepts were described by Smith (1997), who identified such manipulations as part of the development of mathematical learning. In this study we seek to analyze the role of audiovisual resources in the process of articulating different representations, considering the conceptual structure characteristic of Analytical Geometry, which opens possibilities for the treatment of concepts from algebraic and geometric representations, as well as the potential of video in the exploration of the senses and the conditioning of how knowledge is constructed (Borba; Villarreal, 2005). The locus of this study is a Distance Online Pre service Teacher Education Program, a space where learning becomes empowered by the internet and is one of the latest research trends in mathematics education (Borba; et al, 2016). We will present an initial analysis of the videos produced by the students participating in the research through reflections supported on the topics in question, namely, multiple representations, the construct humans-with-digital videos and multimodality.Keywords: multimodality; mathematics education; humans-with-digital videos.
DIGITAL VIDEO AND MULTIPLE REPRESENTATIONS IN THE STUDY OF ANALYTICAL GEOMETRY
The use of audiovisual resources in mathematics education is not recent. Borba et al. [1], in organizing the use of technologies in mathematical education in phases, emphasized that educational activities involving videos began with the advent of fast internet and its democratization, characterized mainly by the diverse modes of communication in cyberspace.
In fact, studies [2] showed that 50% of Brazilian households have computers and access to the Internet, and that 79% of the students interviewed said they used Internet videos to learn new things, 12% said they post online the videos they produce. The participating teachers also claimed to use movies and animations (59%) and video-lessons (55%) of the internet to assist

84Sumário
Proceedings of the 11th Southern Hemisphere Conference on the Teaching and Learning of Undergraduate Mathematics and Statistics ISBN 978-85-8167-237-3
in the preparation of classes and activities. This information makes us think that “the best technology is that which the student has access to and that helps him or her in the construction of knowledge” [3, p.52]. At this point we are faced with the question: how can videos help in the construction of mathematical knowledge?
The term multimodal is related to a non-linear production of texts that occur mainly on a computer or television screen, combining several modes [4]. The video, when characterized by the possibility of presenting images, sounds, gestures, words and movement, simultaneously, with the purpose of transmitting an idea, is classified as a multimodal medium. However, “the video is not only related to the means, but also the language, because it requires from the interlocutor an effort to express it in audiovisual form” [5, p. 15]. This effort is described by Wohlgemuth [6, p. 45] as a process in which several modes are used synchronously in an aesthetic synthesis with concordant logical meanings. When considering this process with the purpose of expressing a mathematical idea, we believe that the interlocutor, in addition to the need to have a deeper understanding of the mathematical concepts involved with the idea to be transmitted, should mobilize different representations of this mathematical concept.
According to Pirie [1998, apud 7], representations are associated with mathematical language and can be classified as common language, verbal mathematical language, symbolic language, visual representation, unspoken but shared assumptions, and quasi-mathematical language, having the function of communicating mathematical ideas. Goldin and Shteingold [8, p. 3] add that representation can symbolize something other than itself, as well as facilitating the treatment of more abstract mathematical concepts, while Borba and Confrey [9, p. 335] assert that “Mathematics does not exist independently of its representational forms”, thus, the sign makes mathematics accessible, but this happens from systems of different representations. For example, our numbering system, the system that describes the rules for manipulating algebraic expressions and equations, visual or spatial systems, such as graphs based on Cartesian or polar coordinate systems, as well as written and spoken words [8].
Figure 1. Representations of the Surface of Revolution.Laburú et al [10] understand that the comprehension of a certain concept is promoted
when we make didactic use of multiple modes and multiple representations, and that this notion respects the variety of the classroom, the ways of learning, what makes it relevant for learning, especially for mathematical learning. Smith [11] also emphasizes the importance of mobilizing various representations when referring to the process that constructs analogous
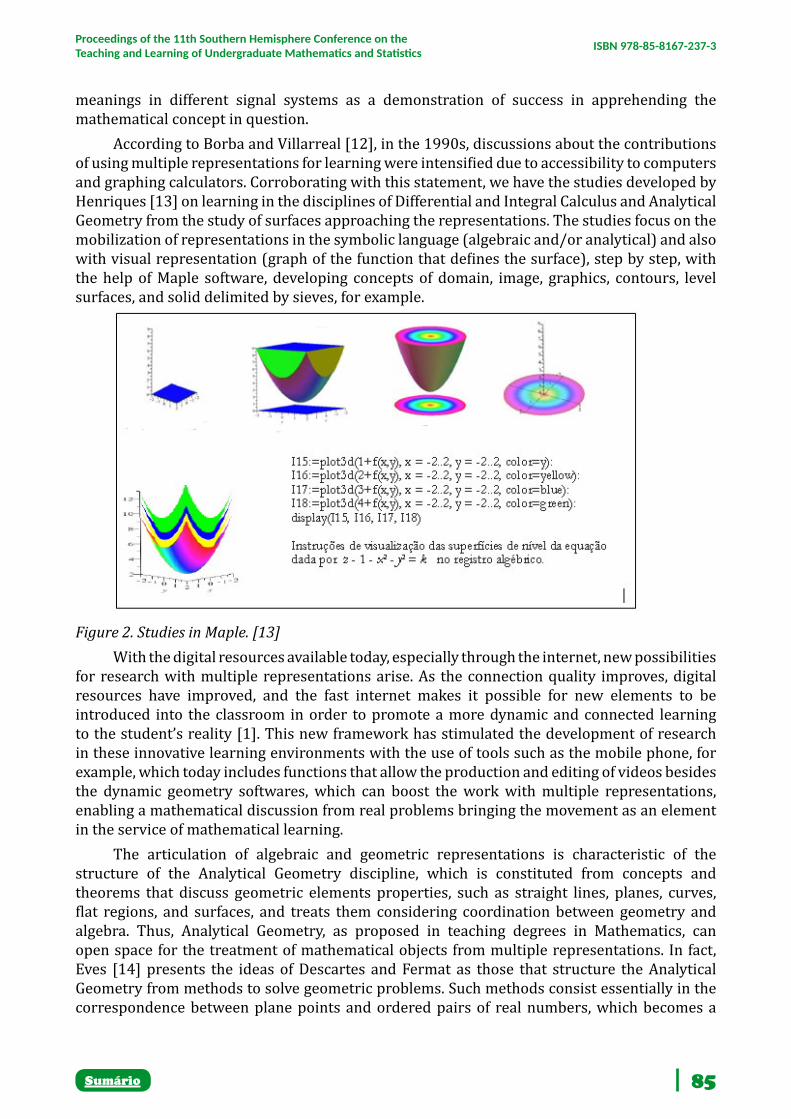
85Sumário
Proceedings of the 11th Southern Hemisphere Conference on the Teaching and Learning of Undergraduate Mathematics and Statistics ISBN 978-85-8167-237-3
meanings in different signal systems as a demonstration of success in apprehending the mathematical concept in question.
According to Borba and Villarreal [12], in the 1990s, discussions about the contributions of using multiple representations for learning were intensified due to accessibility to computers and graphing calculators. Corroborating with this statement, we have the studies developed by Henriques [13] on learning in the disciplines of Differential and Integral Calculus and Analytical Geometry from the study of surfaces approaching the representations. The studies focus on the mobilization of representations in the symbolic language (algebraic and/or analytical) and also with visual representation (graph of the function that defines the surface), step by step, with the help of Maple software, developing concepts of domain, image, graphics, contours, level surfaces, and solid delimited by sieves, for example.
Figure 2. Studies in Maple. [13]With the digital resources available today, especially through the internet, new possibilities
for research with multiple representations arise. As the connection quality improves, digital resources have improved, and the fast internet makes it possible for new elements to be introduced into the classroom in order to promote a more dynamic and connected learning to the student’s reality [1]. This new framework has stimulated the development of research in these innovative learning environments with the use of tools such as the mobile phone, for example, which today includes functions that allow the production and editing of videos besides the dynamic geometry softwares, which can boost the work with multiple representations, enabling a mathematical discussion from real problems bringing the movement as an element in the service of mathematical learning.
The articulation of algebraic and geometric representations is characteristic of the structure of the Analytical Geometry discipline, which is constituted from concepts and theorems that discuss geometric elements properties, such as straight lines, planes, curves, flat regions, and surfaces, and treats them considering coordination between geometry and algebra. Thus, Analytical Geometry, as proposed in teaching degrees in Mathematics, can open space for the treatment of mathematical objects from multiple representations. In fact, Eves [14] presents the ideas of Descartes and Fermat as those that structure the Analytical Geometry from methods to solve geometric problems. Such methods consist essentially in the correspondence between plane points and ordered pairs of real numbers, which becomes a

86Sumário
Proceedings of the 11th Southern Hemisphere Conference on the Teaching and Learning of Undergraduate Mathematics and Statistics ISBN 978-85-8167-237-3
correspondence between plane curves and equations, in addition to establishing relations between algebraic and analytical properties and geometric properties.
The problem of Figure 3 was taken from a book on Analytical Geometry [15]. It is a problem, in which the displacement of a particle is described by a parabola , and its velocity is defined by the tangent vector , and it is sought to determine maximum and minimum speed, among other issues. Visual aspects and algebraic notions involved in the problem can be naturally combined in the resolution process. This problem brings in its enunciation the idea of movement, which can be introduced in the discussion through an audiovisual resource.
Figure 3. Problem of Analytical Geometry.Considering this type of problem, O’Halloran [16, p. 361] states that the full description
of the situation depends on the representation used or the semiotic resource used. The author exemplifies with the mathematical description of the height of an arrow that was shoot vertically, which provides the exact height of the arrow at any time, other than a description made only of the usual language such as “the arrow is rising” or “it is falling”. In addition to it, the visual representation allows the understanding of the relations established between the variables involved in the problem. O’Halloran [17] understands the computer as a promise to the semiotic field by considering its ability to combine multiple semiotic features, such as language, images, sound, and gestures through devices such as video. The presentation of problems, such as those presented here, in a video for educational purposes results from a process already discussed in this text, which consists of a synthesis and organization of ideas and mathematical concepts.
The organization of ideas for the purpose of expressing thought in the audiovisual format brings with it the question of how videos influence the way knowledge is constructed. Borba and Villarreal [12] affirm that we think with technologies and are human-media systems, being something collective and strongly influenced by the available media, thus conditioning the knowledge. In the case of videos, we realize that the production process itself reveals a moment of organization to synthesize the ideas that will be expressed in the audiovisual format, which, in particular in the case of mathematical knowledge, enables the reorganization of the thought leading us to metaphor humans-with-digital videos.
Borba [18] emphasizes the importance of thinking about the contributions of all the elements involved in learning when we consider that the media, which are inserted in our daily life, shape the human being and are shaped by it, influencing in this process the way knowledge is generated. This vision, taken to education, has consequences insofar as it brings the media—or the media in general—to the core of didactic and pedagogical practices [18]. In fact, throughout history human beings have been using orality, writing, and computer science to produce, store, and transform knowledge. Meanwhile new media can and have been being used, raising new research questions anchored in thinking-with-technologies.
In this paper, we present an ongoing study that proposes the production of videos with mathematical content in which we seek to introduce students of a teaching degree in

87Sumário
Proceedings of the 11th Southern Hemisphere Conference on the Teaching and Learning of Undergraduate Mathematics and Statistics ISBN 978-85-8167-237-3
mathematics of distant education in an environment in which they can express their ideas about notions related to Analytical Geometry in an audiovisual way, reflecting in all stages of production anchored in the humans-with-digital videos construct, leading us to an audiovisual analysis as a multimodal resource that potentiates the mobilization of various representations.
A STUDY ON THE PRODUCTION OF VIDEOS WITH MATHEMATICAL CONTENT IN A DISTANCE ONLINE PRE SERVICE TEACHER EDUCATION PROGRAM
The study described here concerns a proposal that involved students of a teaching degree in Mathematics in the modality of distance education in an activity of production of digital videos related to contents of Analytical Geometry. Our intention was to encourage the use of multimodality, a feature present in the videos, in order to favor the articulation of multiple representations.
This study deals with a question related to the identification of strategies used to articulate multiple representations of concepts related to Analytical Geometry, considering the digital videos produced by mathematics pre-service teachers participating in the study as a locus for expression of mathematical ideas from thinking for the audiovisual format. We understand that the question that this study proposes is conditioned to the possibilities of interactions that favor the exploration of the use of digital videos of the virtual learning environment provided in the teaching and distance education degree in mathematics linked to the study.
The scenario of Distance Education in Brazil, according to Borba and Almeida [19], has been transformed with the number of enrolled students increasing annually, provoking great interest on the part of the researchers. The authors state that online distance education reinvents itself from available digital technologies in order to establish more intense interactions in flexible time and space. In this sense, we promote virtual interactions between students and teachers participating in the study and the researcher from a proposal of activity of production of videos about contents of Analytical Geometry with discussions in all stages of the elaboration of the audiovisual happening in virtual learning environments.
We understand that evidencing the mobilization of multiple representations and using the audiovisual language for this are significant points in the context of the study, a teaching degree in Mathematics, as this is related to the role of the future teacher of Mathematics. We believe that it is also part of their role to develop methods or adopt pedagogical practices that value teaching for all, respecting the knowledge that the student already has and their ways of learning. We also understand that significant experiences by the mathematics pre-service teachers in their training are reflected in the classroom, determining the extent of the change that their future students will experience in practice [20]. We conducted this study with mathematics pre-service teachers, hoping to bring moments of reflection on the notions of multiple representations, multimodality, and use of videos in mathematics teaching, considering the role of video and its production process in the construction of knowledge.
The internet stands out in the process in which the study was constituted, given its contribution to the transformations that occur in the learning environment, enabling mathematical thinking to be also developed in the virtual environment with the use of media artifacts available online. This leads us to question how such artifacts, such as digital videos, can be introduced into the learning environment in order to contribute to the education of mathematics pre-service teachers. More specifically, how do the digital technologies available in the virtual learning environment of a Distance Learning Analytical Geometry course make it possible to carry out video production activities with mathematical content and reflections on the articulation of multiple representations? Such questions, along with the guiding question, “How do students in a teaching and distance education degree in Mathematics articulate

88Sumário
Proceedings of the 11th Southern Hemisphere Conference on the Teaching and Learning of Undergraduate Mathematics and Statistics ISBN 978-85-8167-237-3
multiple representations by using digital videos as a multimodal resource to express ideas related to Analytical Geometry content? “ direct this study.
We have used a methodology based on a descriptive analysis of students’ actions in face of an activity of producing digital videos with mathematical content. This aspect characterizes this study as of the qualitative type to the extent that we attach greater importance to the process from an inductive analysis of the data. We mainly used virtual participant observation [21], realized in forums of a teaching and distance education degree in Mathematics.
Virtual participant observation extends the idea of participant observation to the online environment preserving itself as a research practice that is complemented by others such as semi-structured interview and documentary analysis, for example. In this study we consider virtual discussion forums as a space for participant observation, which took place during the second semester of 2016 and the first semester of 2017 from the follow-up of the disciplines titled Analytical Geometry 2 and Informatics applied to mathematical education.
The teaching degree in mathematics in which the study was conducted took place in an online environment through the Moodle platform (Modular Object Oriented Distance Learning), which presents itself as an e-Learning platform for online training management and which has features such as creating e-learning courses, with the possibility of editing their content and activities, enrolling trainees and trainers in courses, and organizing them in groups, assigning access profiles, monitoring access and progress of platform users, and evaluating notes and performance of the trainees in the courses offered.
In order to establish greater credibility in the analysis of the research data, other procedures will be used, such as analysis of reports on the stages of video production; analysis of video screenings, where their initial ideas about audiovisuals, questionnaires, and interviews should be expressed with coordinators, teachers and students; as well as an analysis of the videos created by the participants, which may guarantee a more specific examination based on the data triangulation.
Participating students contributed to the study with their participation in the forums held in the virtual learning environment, with the productions of videos with contents of Analytical Geometry, and answering the questionnaires elaborated by the researcher. These students were enrolled in the discipline of Analytical Geometry of a teaching degree in Mathematics in the distance education modality of a Brazilian university. The choice of the university to carry out the study is related to the fact that the degree was offering the discipline of Analytical Geometry when the contacts for the study began. In addition to it, the coordinator and the professor of the discipline have agreed to participate, giving total access to the virtual learning environment used in the program. Eighty-five students attended and were distributed at the six campi of the teaching and distance education degree in mathematics at this university. From this intervention, twenty-six videos with content of Analytical Geometry and functions were produced by the students in two disciplines accompanied.
To assist in the production of the videos, the groups of students participating in the study were led to a process defined from six steps.

89Sumário
Proceedings of the 11th Southern Hemisphere Conference on the Teaching and Learning of Undergraduate Mathematics and Statistics ISBN 978-85-8167-237-3
In the first stage, the students were divided into groups and chose one among the contents of the discipline to be the subject of their video activity. The next stage was to choose the approach to be used to transmit the mathematical idea in the video. In this stage we discussed with the students participating in the study about the meaning of the contents chosen by the groups from their contextualization when they are treated in the videos. Thus the groups could think of giving importance to problems of their daily lives and experiences when dealing with the content in the video. The third stage was characterized by the moment of theoretical deepening, in which the groups used available technologies, such as dynamic geometry software, calculator, as well as searches on reliable sites and also in books. With the idea formed about the development of the video they would like to produce, the groups started the fourth stage with the elaboration of the video script. The fifth stage was set up as a moment of study of more technical questions, in which the groups researched about the most accessible video production methods and chose the one that was more in agreement with the type of video specified in the script. They also researched and chose the most suitable software for editing their videos. Features such as cell phone or use of the film function with the camera were recommended as more affordable forms of production. The last stage was intended for the effective production and editing of the video.
During this process, online forums were offered for discussion and theoretical and technical support on the production and editing of videos, which was a moment we also discussed—students and researcher— about the use of digital technologies, specifically video, in mathematics teaching. The students elaborated reports of the meetings held during the process of producing the videos that are part of the research data, which contain information related to the mathematical discussions and justified decisions taken by the groups in relation to the productions.
The forums were designed by the professor of the discipline, along with the researcher. Figure 4 shows a part of the discussion held in the discipline of Informatics Applied to Mathematical Education about the concept of parable and the use of multiple representations mobilized by the teacher in exposing such concept to his students. The student participating in the study presents in the discussion a production carried out in the GeoGebra dynamic geometry software, in which the parable concept can be “experimented” through the manipulation of variables. We also discussed the possibility of understanding such a concept only from the manipulation, without the additional information contained in the file.
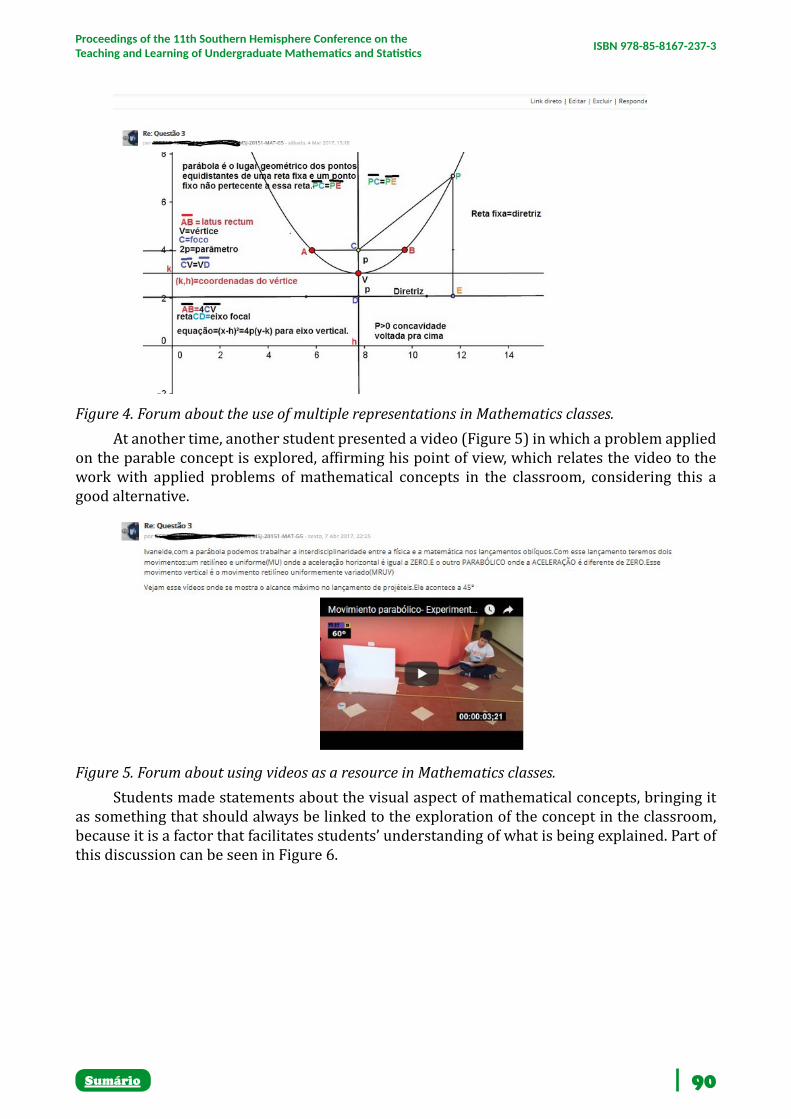
90Sumário
Proceedings of the 11th Southern Hemisphere Conference on the Teaching and Learning of Undergraduate Mathematics and Statistics ISBN 978-85-8167-237-3
Figure 4. Forum about the use of multiple representations in Mathematics classes.At another time, another student presented a video (Figure 5) in which a problem applied
on the parable concept is explored, affirming his point of view, which relates the video to the work with applied problems of mathematical concepts in the classroom, considering this a good alternative.
Figure 5. Forum about using videos as a resource in Mathematics classes.Students made statements about the visual aspect of mathematical concepts, bringing it
as something that should always be linked to the exploration of the concept in the classroom, because it is a factor that facilitates students’ understanding of what is being explained. Part of this discussion can be seen in Figure 6.

91Sumário
Proceedings of the 11th Southern Hemisphere Conference on the Teaching and Learning of Undergraduate Mathematics and Statistics ISBN 978-85-8167-237-3
Figure 6. Forum about the use of multiple representations in Mathematics classes.The videos produced in the activity proposed to the students participating in the study
are, at this first moment, analyzed by an adaptation of the method presented by Powell, Francisco, and Maher [22] composed of procedures such as: visualization and description of the data, followed by identification, selection, and coding of critical events, considering that the particularity of the video can be lost when it is transformed into another media by transcription, for example [23]. Below we will consider some of the videos produced for an initial analysis of the mobilization of multiple representations.
MULTIPLE REPRESENTATIONS IN VIDEOS PRODUCED BY MATHEMATICS PRE-SERVICE TEACHERS
The analysis step of the data produced in the study is still in its initial phase. The procedure that we emphasize in this first moment is a preliminary analysis of the videos by the adaptation of the method presented by Powell, Francisco, and Maher [22] composed by procedures like visualization and description of the data; identification, and selection of critical events related to the use and mobilization of multiple representations, provided by digital media, more specifically the audiovisual resource.
During the disciplines twenty-six videos on contents of Analytical Geometry were produced. Student groups chose topics such as distance between points, vectors, parallelogram area, coordinates of a point, equation of the line, circumference, symmetry of the cones, parabola, relative position of the lines, oriented segment, and rosettes, as topics to be worked in their videos. The audiovisual productions of the students present mostly a discussion about some applied problem. Some of them also bring a historical contextualization, and others are similar to video-classes.
In this preliminary analysis we will observe the mobilization of visual representations, the mother tongue (through the use of narration and texts), as well as representation in symbolic language (algebraic and/or analytical), and how the multimodal characteristic of the video facilitates the articulation of representations. We will then present a preliminary analysis of one video produced by the students in the study.
This video produced by the students of the teaching and distance education degree in mathematics is called Rosacea (rhodonea curve) and discusses the notion of this curve that

92Sumário
Proceedings of the 11th Southern Hemisphere Conference on the Teaching and Learning of Undergraduate Mathematics and Statistics ISBN 978-85-8167-237-3
is presented in the system of polar coordinates. The video does not deal with the idea of coordinate systems in general and in particular polar coordinates. Instead, it begins with the presentation of the rhodonea curve through visual representations. The name “rosacea” is repeated as a visual representation appears, establishing a match between the name of this particular curve and the displayed images. The formal definition of the rhodonea curve follows from the mobilization of representations in the symbolic (algebraic) language, in the mother tongue (speech), and written language.
Figure 8. Images of the Rosacea video.We notice that the authors do not articulate the representations used in order to better
explore the concept. The mother tongue is used to read what is presented symbolically, without adding additional information, such as the explanation of the requirement , or justifications of properties relating to the fact that n is even or odd with the number of rhodonea petals. A tutorial for building a rhodonea curve in the Winplot software is presented at the end of the video.
Figure 9. Image of the Rosacea video.A narrator presents the software tool that provides the visual representation of the
rhodonea curve from the insertion of the equation into a window. Again, we did not establish a relationship between the representations used to treat the concept of rhodonea curve in the video. That is, the symbolic and visual representations are presented separately and there is no articulation between them showing how they are effectively related.

93Sumário
Proceedings of the 11th Southern Hemisphere Conference on the Teaching and Learning of Undergraduate Mathematics and Statistics ISBN 978-85-8167-237-3
FINAL CONSIDERATIONSProviding students of a teaching degree in mathematics with the video production
experience is related to the idea of math classes taught by professionals who understand the variety of the classroom and also with the concern to give meaning to mathematical concepts. We assume that digital videos can enable a better articulation of representations, allowing this meaning. We understand that giving meaning to the concept is associated with making sense, making it understandable more effectively. According to the statements of the students participating in the study, this deeper understanding becomes possible with the articulation of multiple representations, mainly from the combination of the representation in the symbolic language with the visual representation.
Although several students have stated that it is important to combine representation in the symbolic (algebraic) language with visual representation in the explanation of concepts in the classroom, the second video, Rosacea, presented here does not use an articulation that can facilitate understanding. The way the definition of the rhodonea curve is initially presented, algebraically, is not correlated with the visual representation effectively. An association between the representations could be better observed with the step-by-step construction of the rhodonea curve, considering the variation of the angle θ.
Considering this a preliminary analysis of one of the twenty-six videos produced in the study, we affirm that a more in-depth investigation based on other theoretical aspects will still be performed. In the video Rosacea, the experience of video production brought, according to the discussions promoted in the Moodle platform forums, the certainty that producing digital materials, specifically videos with mathematical content, for their future classes is possible. In addition, the process of production of video with mathematical content, presenting the stages of choosing content—choosing the type of content approach— theoretical deepening—script preparation—choice of equipment for production and editing software—production and editing, revealed moments of organization to synthesize the ideas that were expressed in the videos presented, indicating the influence of the media involved in the construction of knowledge, taking us to the metaphor humans-with-digital videos. A more detailed analysis of the modes used in the video will be done, according to O’Halloran’s classification [16, 17]. It indicates that “semiotics resources, such as language, images, three-dimensional objects, gesture, clothing, music, sound and space, materialize and integrate across modalities which are visual, auditory, and somatic”. We will see how these modes can be adapted from written texts to videos.
REFERENCES[1] BORBA, MC, SCUCUGLIA, RRS, GADANIDIS, G. Fases das Tecnologias Digitais em Educação
Matemática: sala de aula e internet em movimento. 1st ed. Belo Horizonte: Autêntica; 2014.
[2] COMITÊ GESTOR DA INTERNET NO BRASIL. Pesquisa sobre o uso das tecnologias de informação e comunicação nas escolas brasileiras – TIC Educação 2015. Available at: http://www.cetic.br/publicacões/2015/tic-educacao-2015.pdf; Access on: September 4, 2017.
[3] MILL D, PIMENTEL NM. Educação a distância: desafios contemporâneos. São Carlos: EdUFSCar; 2013.
[4] WALSH M. Multimodal Literacy: researching classroom practice. 1st ed. Sydney: Primary English Teaching Association (e:lit); 2011.

94Sumário
Proceedings of the 11th Southern Hemisphere Conference on the Teaching and Learning of Undergraduate Mathematics and Statistics ISBN 978-85-8167-237-3
[5] FERRÉS J. Vídeo e educação. 2nd ed. Porto Alegre: Artes Médicas; 1995.
[6] WOHLGEMUTH J. Vídeo educativo: uma pedagogia audiovisual. 1st ed. Brasília: Senac; 2005.
[7] PANASUK RM, BEYRANEVAND ML. Algebra students’ability to recognize multiple representations and achievement. International Journal for Mathematics Teaching & Learning. 2010.
[8] GOLDIN G, SHTEINGOLD N. The roles representation in school mathematics Reston: National Council of Teachers of Mathematics; 2001. Chapter 1, Systems of representatios and the development of mathematical concepts; p. 1 – 23.
[9] BORBA MC, CONFREY J. A student’s construction of transformation of functions in a multiple representation enviroment. Educational Studies in Mathematics, New York. 1996; 31:319-337.
[10] LABURÚ CE, BARROS MA, SILVA OHM. Multimodos e múltiplas representações, aprendizagem significativa e subjetividade: três referências conciliáveis da educação científica. Revista Ciência e Educação. 2011;17(2):469-487.
[11] SMITH, H. A. Peirce’s sign and mathematics education: a introdution. Philosophy of Mathematics Education Jornal,1997;10. Available at: <http://socialsciences.exeter.ac.uk/education/research/centres/stem/publications/pmej/pome10/art3.htm>. Access on: January 18, 2017.
[12] BORBA MC, VILLARREAL ME. Humans-with-Media and the Reorganization of Mathematical Thinking: information and communication technologies, modeling, visualization and experimentation. New York: Springer; 2005.
[13] HENRIQUES A, ALMOULOUD SA. Teoria dos registros de representação semiótica em pesquisas na Educação Matemática no Ensino Superior: uma análise de superfícies e funções de duas variáveis com intervenção do software Maple. Revista Ciência e Educação; 2016; 22(2):465 – 487.
[14] EVES H. Introdução à História da Matemática. Trad. Hygino H. Domingues. São Paulo: Editora da Unicamp; 2004.
[15] BOULOS P, CAMARGO I. Geometria Analítica: um tratamento vetorial.3rd ed. São Paulo: Pearson-Prentice Hall; 2005.
[16] O’HALLORAN KL. Classroom Discourse in Mathematics: a multisemiotic analysis. Linguistics and Education. Elsevier Science Inc, 2000;10(3):359 – 388.
[17] O’HALLORAN KL. The Routledge Handbook of Multimodal Analysis. London: Routledge, 2011. Historical changes in the semiotic landscape. From calculation to computation; p. 98 – 113.
[18] BORBA MC. Pesquisa em Educação Matemática: concepções e perspectivas. 1999, 1st ed. São Paulo: Editora UNESP. Tecnologias Informáticas na Educação Matemática e Reorganização do Pensamento; p. 285 – 295.
[19] BORBA MC, ALMEIDA HRFL. As licenciaturas em matemática da Universidade Aberta do Brasil (UAB): uma visão a partir da utilização das tecnologias Digitais; 2015, 1st. .ed. São Paulo: Livraria da Física.
[20] ONUCHIC LR, ALLEVATO NSG. Educação Matemática no ensino superior: Pesquisas e debates; 2009, 1st.ed. Recife: SBEM. Chapter 10. Formação de professores: mudanças urgentes na licenciatura em matemática; p.169 – 188.

95Sumário
Proceedings of the 11th Southern Hemisphere Conference on the Teaching and Learning of Undergraduate Mathematics and Statistics ISBN 978-85-8167-237-3
[21] BORBA MC, MALHEIROS APS, AMARAL RB. Educação a Distância online. Belo Horizonte: Autêntica, 3rd ed, 2011.
[22] POWELL AB, FRANCISCO JM, MAHER CA. Uma abordagem à Análise de Dados de Vídeo para Investigar o Desenvolvimento das Ideias Matemáticas e do Raciocínio de Estudantes. Rio Claro: BOLEMA, 2004; 17(21): 81–140.
[23] BALTRUSCHAT A. Metodologias da pesquisa qualitativa em educação: teoria e prática. Petrópolis: Editora Vozes, 2010. A interpretação de filmes segundo o método documentário; p. 151 – 181.

96Sumário
Proceedings of the 11th Southern Hemisphere Conference on the Teaching and Learning of Undergraduate Mathematics and Statistics ISBN 978-85-8167-237-3
PRODUCTION OF VIDEOS WITH MATHEMATICAL CONTENT: A LOOK THROUGH SOCIAL SEMIOTICS
Vanessa Oechsler
Federal Institute of Santa Catarina, Gaspar, Brazil.
Marcelo de Carvalho Borba
Universidade Estadual Paulista “Júlio de Mesquita Filho”, Rio Claro, Brazil
ABSTRACTThis article presents data from a research on the production of videos with mathematical content developed in the city of Blumenau, state of Santa Catarina (Brazil). Middle school students (aged 13-14) from three municipal schools produced videos, where they expressed their mathematical ideas about some topic of the curriculum. On the whole, 19 videos were produced during the research. This article analyzes one of these videos, using the social semiotics theory, which takes into account not only the final video produced, but also the production process. When this process - involving humans-with-media - is taken into account, it is possible to understand the choice of producers for certain modes and designs used in the video. Keywords: multimodality, humans-with-media, video design
INTRODUCTIONThe discussion about the use and production of videos in education dates back to the
1990s and calls our attention to researchers such as Moran (1995) and Ferrés (1996). These authors discussed the didactic use of videos, in order to expose content, to simulate experiences that would normally require significant time and resources, to evaluate the performance of students, teachers and/or process, as well as to express the ideas of the producers of the videos, in this case, the students.
In this work we specifically focus on the production of videos by students. This relationship between students and video is anchored in the construct “humans-with-media” (Borba & Villarreal, 2005). This construct, based on the concept of the reorganization of thinking of Tikhomirov and collective intelligences of Lévy, suggests that knowledge is produced by a collective composed of humans-with-media, which refers to the idea that human beings and media are sets that complement and modify each other.
Moreover, we believe that knowledge is produced together with a given medium or technology of intelligence. It is for this reason that we adopt a theoretical perspective that supports the notion that knowledge is produced by a collective composed of humans-with-media, or humans-with-technologies, and not, as other theories suggest, by individual humans alone, or collectives composed only of humans (Borba & Villarreal, 2005, p. 23).
In this sense, videos are seen as a production of students, teachers and digital media. In this paper, we report a research about videos that were produced in Blumenau, Southern Brazil. Middle school students (aged 13-14) from three municipal schools took part in the activity, leading to the production of 19 videos at the end of the proposal. We emphasize that, although it was carried out in a middle school education, the activity can be easily implemented in higher education, as demonstrated by other researches from the GPIMEM – Technology, Other Media and Mathematics Education Research Group, in which we take part.
97Sumário
Proceedings of the 11th Southern Hemisphere Conference on the Teaching and Learning of Undergraduate Mathematics and Statistics ISBN 978-85-8167-237-3
In the present article, we will analyze the different ways students produce video. We will first address our view of digital technology and how it interacts with humans. We will then present the social semiotics that will be used to analyze the expression of mathematical ideas when producing a video collectively.
THE PRODUCTION OF VIDEOS AND SOCIAL SEMIOTICSThe research and the use of digital technologies in Brazil can be divided into four phases
(Borba, 2012; Borba et al., 2016). The first phase refers to the period of the Logo, in which computational programming was explored together with mathematics. The second phase focuses on the use of specific software, such as dynamic geometry software. The third phase is marked by online courses. Finally, the fourth phase is based on the use of applets, videos and Mathematics software in both online courses and face-to-face interactions. With the advent of fast internet and the popularization of sound and image equipment, the use and production of audiovisual resources at this stage became easier and was encouraged.
Each new generation of computers seems to present new possibilities, and the most recent one, characterized by fast internet access and multimedia, has generated multimodal discourses that are already qualitatively different from oral and written ones. Computers can be seen as an extension of memory that shapes our thinking with multimodal possibilities, particularly if one considers the increasing availability of different internet search tools. (Borba, 2012, p. 803)
In this perspective, technologies transform and modify human reasoning, while humans are constantly transforming technologies (Borba & Villarreal, 2005). In order to understand this interaction between humans and non-humans and their production of meaning, we rely on social semiotics, which values the social context of productions. In the present work it means valuing, as research objects, not only the videos produced by the students, but also the way they were produced and how the meanings were collectively negotiated during the production.
Social semiotics emerged in Australia, based on the ideas of Michael Halliday and proposes a critical reading of semiotic theory. Semiotics is dedicated to the study of the sign. Social semiotics, besides the study of the sign, seeks to investigate the interests of the producers of this sign and the context in which the message is inserted.
Social semiotics is an attempt to describe and understand how people produce and communicate meaning in specific social settings, be they settings such as the family or settings in which sign-making is well institutionalized and hemmed in by habits, conventions and rules (Kress & Van Leeuwen, 2006, p. 266).
Due to the fact that social semiotics concerns not only the sign, but also the process of producing its meaning, we adopted this theory in the analysis of the data related to the videos produced in this research. It involves analyzing not only the mathematical signs and the design presented in the videos, but also the negotiation process between the producers in the construction of these signs. “In a social semiotic theory, signs are made – not used – by a sign-maker who brings meaning into an apt conjunction with a form, a selection/choice shaped by the sign-maker´s interest.” (Kress, 2010, p.62)
The two central categories of social semiotics are sign and mode. Signs are elements in which meaning and form have been brought together in the interest of the producer. Mode, on the other hand, gives meaning to signs (Bezemer & Kress, 2016). Image, writing, layout, speech and gestures are examples of modes. Each of them has its potentialities and limitations to express meaning. (Bezemer & Kress, 2016; Kress & Van Leeuwen, 2006).
98Sumário
Proceedings of the 11th Southern Hemisphere Conference on the Teaching and Learning of Undergraduate Mathematics and Statistics ISBN 978-85-8167-237-3
In a video production, several ways can be used to enhance the meaning that the producer wants to convey. Position of the camera, framing, gestures, movement of the image and audio are some of the elements that compose the filmic language and contribute to the understanding of its meaning. The combined use of more than one mode characterizes what is called multimodality (Bezemer & Kress, 2016; Jewitt, 2009; Kress, 2010; Walsh, 2011).
Mathematics also has its own language. O’Halloran (2000, 2005) says that mathematics can be presented in three modes: language, symbolism and visual representation. The interaction between these modes, characterizing multimodality, aims to assist in the presentation and learning of mathematical concepts.
The mother tongue lends to mathematics both oral and written language. In order to communicate a mathematical idea through speech or writing, the speaker must use his/her knowledge of the mother tongue and organize his/her mathematical ideas to express them through speech or writing. In organizing his/her ideas, the speaker often comes to understand concepts that were not understood only with mathematical symbolism.
The mathematical symbolism throughout history has gone through three stages:1) rhetorical, in which the words were written in full;2) syncopated, in which abbreviations were used;3) symbolic, where the abbreviations gave place to the symbols, like the ones used today.From this evolution of mathematical symbolism, O’Halloran (2000, p. 362) indicates that
“we may conjecture that the grammar of modern mathematical symbolism grew directly out of the lexicogrammar of natural language and this may explain the high level of integration of symbolic and linguistic forms in mathematical texts”.
Besides language and symbolism, mathematics also makes use of visual representation to make explicit its meaning. Each of these modes has its potentialities and limitations to express mathematical content. In order to extend potentialities and to minimize limitations, it is suggested to use modes together, characterizing multimodality. As an example of the use of this strategy, we mention a passage from an article of O’Halloran (2000), in which the author analyzes the example presented by Burgmeier, Boisen and Larsen (1990) with the mathematical description s (t) = -16t2 + 80t for the height of an arrow fired vertically into the air, where ‘t’ is the time in seconds.
In this mathematical symbolic description, the complete pattern of the relationship between time and height of the arrow is encoded. However, using the semiotic resource of language, we could only say, for instance, “the arrow is still rising”, or “it is falling”’ or that “it has hit the ground”. The mathematical description gives the exact description of the height of the arrow at any point in time, a feat not possible with any other semiotic resource. (O’Halloran, 2000, p. 361)
That is, sometimes only one mode (language) is not sufficient to clarify the mathematical phenomenon, then other ways (such as symbolism and even the visual) are adopted to help clarifying what is happening, a fact corroborated by O’Halloran (2000), Which, in this same example, presents the visual representation (the graph) of the function (Figure 1), visually presenting the variation of the height of the arrow with respect to time.

99Sumário
Proceedings of the 11th Southern Hemisphere Conference on the Teaching and Learning of Undergraduate Mathematics and Statistics ISBN 978-85-8167-237-3
Figure 1: Visual representation of the function s(t) = -16t2 + 80t. Source: (O’Halloran, 2000, p. 362)
In this example, modes complement each other in order to promote the learning of mathematics. And how can students make use of these modes, both in mathematics and video, to express their mathematical ideas through video? This is what we will explore in the next section, in the video production activity developed with students of middle school.
VIDEO PRODUCTION - RESEARCH DATA The field work was developed with middle school students (aged 13-14) in three
municipal schools situated in the city of Blumenau (SC). In these schools, students were divided into groups and each group produced a video with mathematical content. On the whole, 19 videos were produced. All steps were recorded in audio and video, consisting, along with the field diary, interviews and videos produced, the research data. This is qualitative research, in which the main focus of analysis is the process involved in the production of the videos, highlighting the choices made by the producers of the materials.
We can divide the video production process into six steps: (i) conversation with students and presentation of video types; (ii) choice and research of the theme of video production; (iii) elaboration of the script; (iv) video recording; (v) editing the videos; (vi) dissemination of the videos (Oechsler, Fontes, & Borba, 2017).
Initially the proposal for the production of videos was presented to the students, along with several ideas of video design: animation, video-lesson, video with staging, video with slides, among others. From all these ideas, we asked students to organize themselves into groups in order to choose mathematics content to explore in the video. As a task, the students needed to research the chosen theme (definition, examples and applications).
After this initial research, the students discussed video design: the excerpt of the mathematical content that they would explore (since, in general, the contents are very broad; e.g. in the theme of fractions we can explore excerpts of operations, definition, classification, among others) as well as how this content would be displayed (animation, staging, video lesson etc.)

100Sumário
Proceedings of the 11th Southern Hemisphere Conference on the Teaching and Learning of Undergraduate Mathematics and Statistics ISBN 978-85-8167-237-3
At the next stage, students began to elaborate the script, to define the message they wanted to present in the video, as well as more technical aspects: text/speech, characters, audio, language and techniques used, among other details.
Once the scripts were ready, the students started preparing themselves for the recording of the images. Some chose to record their explanations by simulating video lessons, others recorded only the explanation of the content with writing on paper, without appearing in the recording. There were groups that chose to create slides and explanation narration, as well as the group that chose to create a specific software animation for this purpose.
A meeting followed where all this material produced by the students was edited. For editing, students used the YouTube video editor or Movie Maker editing software. At this point in the activity the students decided which images produced they would keep in the video, the sequence in which they would be presented and the effects that would be introduced, finalizing the design of the film.
Completed videos were presented to the whole class and aspects of the videos and their production, such as difficulties encountered and positive aspects of the activity, were discussed. Regarding the videos, the students pointed out interesting aspects of the productions of their classmates, as well as suggestions to make it easier to understand the content presented, as it can be noticed in the speeches of the students transcribed below.
Researcher: And this video? What did you think?Student:10 The explanation was bad, because we could not understandStudent 2: There was a part in which I thought it was Student 3 speaking, that I did not
understand ... anything.(...)Researcher: Ok, but why didn´t you understand? Was it too fast?Student 2: No, low.(…)Student 4: Background music stood out the soundStudent 5: Yes. I think the music took some of the attention of the thing. Then, as some of
them spoke lower, the music got louder. [Discussion of the EBM Quintino Bocaiúva class on the video “Classification of Fractions” in which students, through slides, present and narrate types of fractions. Along with the narration, the students play a background music which, for classmates, made it difficult to understand what the students were saying].
Researcher: Hey guys, what did you think about the video?Student: There was a lack of soundStudent 2: It was great (...)Researcher: But what did you think of the idea of animation?Student 3: Cool.
10 All comments made by students will be nominated by Student, Student 2, ... without mentioning the name of each one of them. Although we have permission to use the data produced in the research, as many conversations were carried out with the whole class, it is often not possible to distinguish the student who made the particular comment. Thus we decided not to present the name of any student in these excerpts.
101Sumário
Proceedings of the 11th Southern Hemisphere Conference on the Teaching and Learning of Undergraduate Mathematics and Statistics ISBN 978-85-8167-237-3
Student 4: I thought it was great. A pity the vehicles did not move.Student: If it had sound, it would get better.(...)Student 5: I thought it was well explained. [Discussion held by the students of EBM Felipe
Schmidt about the video “Function and bus ticket” where the students, through animations, present a problem situation in which it is calculated how much a worker spends monthly on bus tickets to go to work].
As a positive aspect of the activity, the students emphasized that the video production helped them to understand the content, because in order to explain it in the video, they needed to study and understand what they would explain.
Student: When you asked us to record, we also studied that so we could talk about it. It was not just copy. [Student from EBM Quintino Bocaiúva explaining the advantages of learning through video production].
Student: Because when we produce, we go deeper into the content, we search more ... [Student from EBM Felipe Schmidt explaining how the process of producing videos helps to understand the content].
On the down side, students highlighted the delay in producing the videos as the main difficulty with this approach, because to produce a video of three minutes it took almost a week to complete the recordings.
We noticed that, despite the difficulties pointed out, the students liked to carry out this activity. Reflection regarding their video production and the feedback received from their classmates, was a valuable learning experience that allowed them to make improvements. The enhanced interaction with the technologies is also a point to be highlighted; several students had no had prior contact with programs and software they used during the activity, which required a greater learning effort, related to both the technical and the mathematical aspects. Students were getting acquainted with this type of digital technology and, at the same time, digital technology associated with video started helping them to shape the ideas they have about mathematics and video presentation. In the next section we will present the process of producing one of the videos and the analysis developed using social semiotics.
AN ANALYSIS THROUGH SOCIAL SEMIOTICSIn this section we present an analysis of the video “Classification of Fractions”11, produced
by four students of EBM Quintino Bocaiúva. We chose this video because students used various media and modes to produce it. First we will present a description of the video according to the method developed by Wildfeuer (2014) (Table 1), and then an analysis will follow.
11 Video available in: https://www.youtube.com/watch?v=fI65qhhGjzI&index=18&list=PLiBUAR5Cdi60GspUuuH_DpZkW_dv28V8D

102Sumário
Proceedings of the 11th Southern Hemisphere Conference on the Teaching and Learning of Undergraduate Mathematics and Statistics ISBN 978-85-8167-237-3
Scene Scene Description Audio Language spoken Music
1
Countdown to the beginning of the video
Narrators’ speech
“One”
/
2 “Two”
3 “Three”
4Scene before the beginning of the explanations
“Go big son!”
5 Slide with the video theme presentation
Narrators’ speech
“Today we will talk about Fractions” /
6
Slide with the presentation of the notation and fraction elements
Narrators’ speech
“Let’s start with the notation of a fraction. The notation of a fraction is always a number divided by another number. The number at the top is called the numerator and the denominator is at the bottom. The numerator indicates how many parts of the whole were taken. The denominator indicates the total of equal parts in which the unit was divided. A good example is the one we have below. If we take this ball and divide it in half, we will have the fraction a half, because only one part of the whole was taken and the whole was divided into two parts. So I took a part of a total of two parts.”
Instrumental music
7 Slide to explain the fraction proper
Narrators’ speech
“There are four types of fractions. Here we are going to talk about the proper fraction. A fraction of its own happens when the numerator is smaller than the denominator. Here is an example. The number one is the numerator and the number four is the denominator, that is, the denominator is greater than the numerator.”
Instrumental music
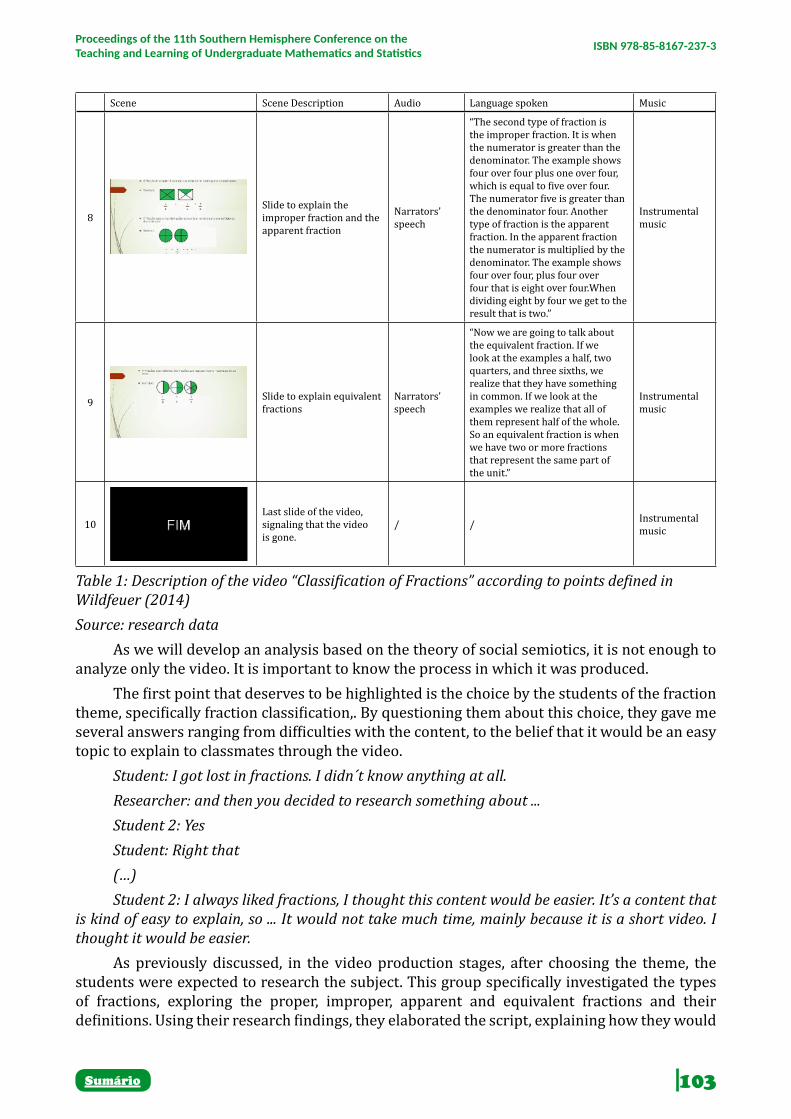
103Sumário
Proceedings of the 11th Southern Hemisphere Conference on the Teaching and Learning of Undergraduate Mathematics and Statistics ISBN 978-85-8167-237-3
Scene Scene Description Audio Language spoken Music
8Slide to explain the improper fraction and the apparent fraction
Narrators’ speech
“The second type of fraction is the improper fraction. It is when the numerator is greater than the denominator. The example shows four over four plus one over four, which is equal to five over four. The numerator five is greater than the denominator four. Another type of fraction is the apparent fraction. In the apparent fraction the numerator is multiplied by the denominator. The example shows four over four, plus four over four that is eight over four.When dividing eight by four we get to the result that is two.”
Instrumental music
9 Slide to explain equivalent fractions
Narrators’ speech
“Now we are going to talk about the equivalent fraction. If we look at the examples a half, two quarters, and three sixths, we realize that they have something in common. If we look at the examples we realize that all of them represent half of the whole. So an equivalent fraction is when we have two or more fractions that represent the same part of the unit.”
Instrumental music
10Last slide of the video, signaling that the video is gone.
/ / Instrumental music
Table 1: Description of the video “Classification of Fractions” according to points defined in Wildfeuer (2014)Source: research data
As we will develop an analysis based on the theory of social semiotics, it is not enough to analyze only the video. It is important to know the process in which it was produced.
The first point that deserves to be highlighted is the choice by the students of the fraction theme, specifically fraction classification,. By questioning them about this choice, they gave me several answers ranging from difficulties with the content, to the belief that it would be an easy topic to explain to classmates through the video.
Student: I got lost in fractions. I didn´t know anything at all.Researcher: and then you decided to research something about ...Student 2: YesStudent: Right that (…)Student 2: I always liked fractions, I thought this content would be easier. It’s a content that
is kind of easy to explain, so ... It would not take much time, mainly because it is a short video. I thought it would be easier.
As previously discussed, in the video production stages, after choosing the theme, the students were expected to research the subject. This group specifically investigated the types of fractions, exploring the proper, improper, apparent and equivalent fractions and their definitions. Using their research findings, they elaborated the script, explaining how they would
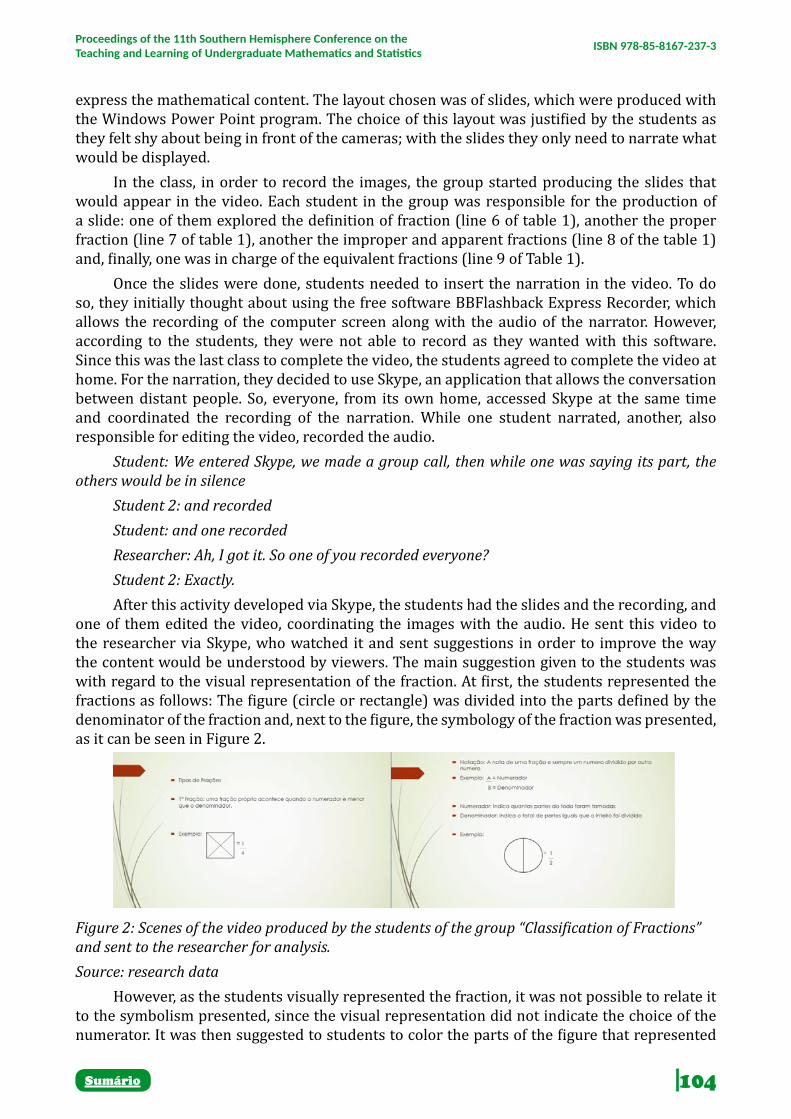
104Sumário
Proceedings of the 11th Southern Hemisphere Conference on the Teaching and Learning of Undergraduate Mathematics and Statistics ISBN 978-85-8167-237-3
express the mathematical content. The layout chosen was of slides, which were produced with the Windows Power Point program. The choice of this layout was justified by the students as they felt shy about being in front of the cameras; with the slides they only need to narrate what would be displayed.
In the class, in order to record the images, the group started producing the slides that would appear in the video. Each student in the group was responsible for the production of a slide: one of them explored the definition of fraction (line 6 of table 1), another the proper fraction (line 7 of table 1), another the improper and apparent fractions (line 8 of the table 1) and, finally, one was in charge of the equivalent fractions (line 9 of Table 1).
Once the slides were done, students needed to insert the narration in the video. To do so, they initially thought about using the free software BBFlashback Express Recorder, which allows the recording of the computer screen along with the audio of the narrator. However, according to the students, they were not able to record as they wanted with this software. Since this was the last class to complete the video, the students agreed to complete the video at home. For the narration, they decided to use Skype, an application that allows the conversation between distant people. So, everyone, from its own home, accessed Skype at the same time and coordinated the recording of the narration. While one student narrated, another, also responsible for editing the video, recorded the audio.
Student: We entered Skype, we made a group call, then while one was saying its part, the others would be in silence
Student 2: and recordedStudent: and one recordedResearcher: Ah, I got it. So one of you recorded everyone?Student 2: Exactly.After this activity developed via Skype, the students had the slides and the recording, and
one of them edited the video, coordinating the images with the audio. He sent this video to the researcher via Skype, who watched it and sent suggestions in order to improve the way the content would be understood by viewers. The main suggestion given to the students was with regard to the visual representation of the fraction. At first, the students represented the fractions as follows: The figure (circle or rectangle) was divided into the parts defined by the denominator of the fraction and, next to the figure, the symbology of the fraction was presented, as it can be seen in Figure 2.
Figure 2: Scenes of the video produced by the students of the group “Classification of Fractions” and sent to the researcher for analysis. Source: research data
However, as the students visually represented the fraction, it was not possible to relate it to the symbolism presented, since the visual representation did not indicate the choice of the numerator. It was then suggested to students to color the parts of the figure that represented
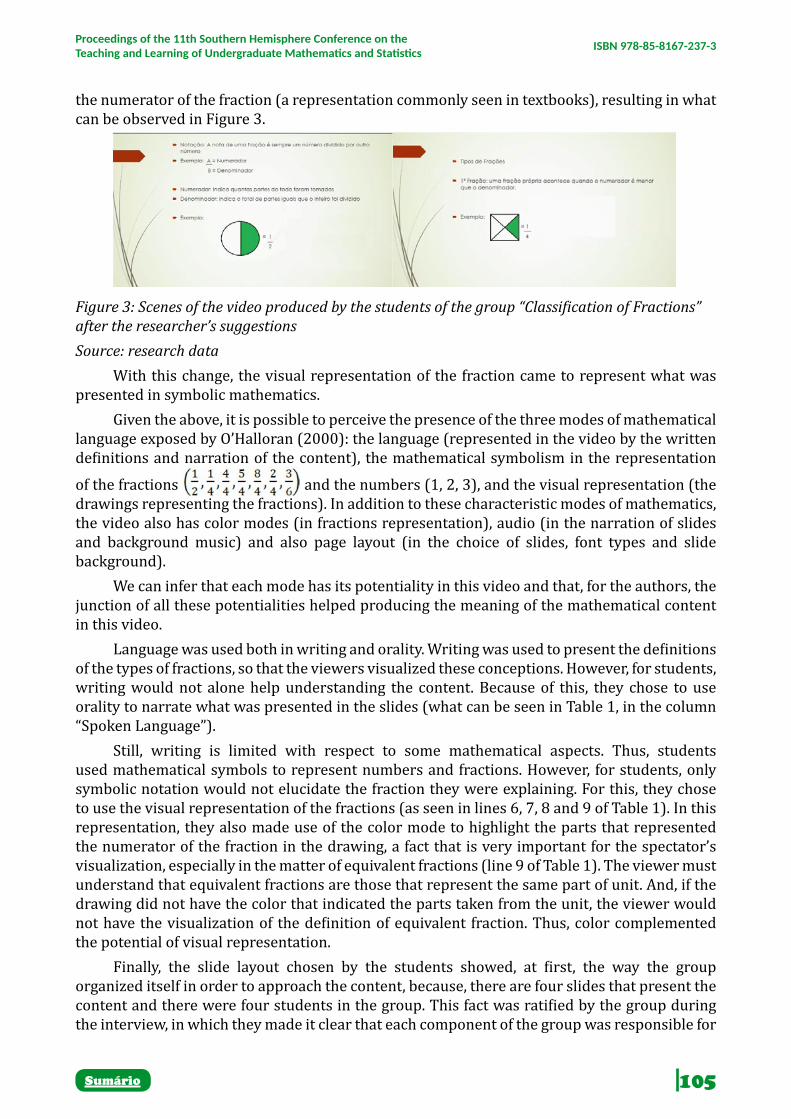
105Sumário
Proceedings of the 11th Southern Hemisphere Conference on the Teaching and Learning of Undergraduate Mathematics and Statistics ISBN 978-85-8167-237-3
the numerator of the fraction (a representation commonly seen in textbooks), resulting in what can be observed in Figure 3.
Figure 3: Scenes of the video produced by the students of the group “Classification of Fractions” after the researcher’s suggestions Source: research data
With this change, the visual representation of the fraction came to represent what was presented in symbolic mathematics.
Given the above, it is possible to perceive the presence of the three modes of mathematical language exposed by O’Halloran (2000): the language (represented in the video by the written definitions and narration of the content), the mathematical symbolism in the representation
of the fractions and the numbers (1, 2, 3), and the visual representation (the drawings representing the fractions). In addition to these characteristic modes of mathematics, the video also has color modes (in fractions representation), audio (in the narration of slides and background music) and also page layout (in the choice of slides, font types and slide background).
We can infer that each mode has its potentiality in this video and that, for the authors, the junction of all these potentialities helped producing the meaning of the mathematical content in this video.
Language was used both in writing and orality. Writing was used to present the definitions of the types of fractions, so that the viewers visualized these conceptions. However, for students, writing would not alone help understanding the content. Because of this, they chose to use orality to narrate what was presented in the slides (what can be seen in Table 1, in the column “Spoken Language”).
Still, writing is limited with respect to some mathematical aspects. Thus, students used mathematical symbols to represent numbers and fractions. However, for students, only symbolic notation would not elucidate the fraction they were explaining. For this, they chose to use the visual representation of the fractions (as seen in lines 6, 7, 8 and 9 of Table 1). In this representation, they also made use of the color mode to highlight the parts that represented the numerator of the fraction in the drawing, a fact that is very important for the spectator’s visualization, especially in the matter of equivalent fractions (line 9 of Table 1). The viewer must understand that equivalent fractions are those that represent the same part of unit. And, if the drawing did not have the color that indicated the parts taken from the unit, the viewer would not have the visualization of the definition of equivalent fraction. Thus, color complemented the potential of visual representation.
Finally, the slide layout chosen by the students showed, at first, the way the group organized itself in order to approach the content, because, there are four slides that present the content and there were four students in the group. This fact was ratified by the group during the interview, in which they made it clear that each component of the group was responsible for
106Sumário
Proceedings of the 11th Southern Hemisphere Conference on the Teaching and Learning of Undergraduate Mathematics and Statistics ISBN 978-85-8167-237-3
researching and explaining a part of what was explored in the video. So, each student produced one of the slides, what can also be noticed in the narration, where each of the students narrated one of them. Although each student produced its own slide, the group took care about using the same format of letters and visual representations, giving uniformity to the video. All slides with mathematical content relied on the definition and an example composed of mathematical symbolism and numerical representation. The other slides were produced in order to introduce and finish the video, but also followed an aesthetic pattern - white characters on a black background.
In addition to the modes used in the video, it is worth highlighting the wide range of media used by students in the production of these videos: Power Point, BBFlashback Express Recorder, Skype and video editor, each of them having its own role in the image, audio and video production and design.
When analyzing this video we notice that the production process monitoring and the knowledge acquired about the production context helps the analysis, because, knowing the preferences and limitations of the students, it was possible to understand the modes they used (writing, sound, image, color, and slide layout) (Bezemer & Kress, 2016, Hodge & Kress, 1988, Kress, 2010), as well as the media that was chosen.
FINAL CONSIDERATIONSThe production of videos discussed in this article leads us to think about several
issues. Firstly we must think about the interaction among participants in the process. There was interaction between students to discuss how they would produce the video, as well as interaction of the students with the researcher and teachers to discuss aspects of the work (both mathematical and technical). This interaction characterizes the collective of human beings. The participants also interacted with the media used (Internet, pencil and paper, video and text editors, slide writing programs, among others used by groups in their productions), characterizing what Borba and Villarreal (2005) called humans-with-media.
In this activity the interaction of the collective of students/teacher/researcher with the media was clear, and the collective needed to negotiate to decide the media to be used, as well as the way that media would give them support in the production of meaning. For example, why was Power Point media used? Because it provided the necessary ways for students to visually explore the subject of fractions in the video. However, this media had the limitation of being just visual. Thus, the students used an audio recorder and a video editor to insert the audio in the explanation of the slides, which, according to them, would make it easier for the viewer to understand the content.
We observe that this human-media interaction in the production of the videos enhanced the use of multimodality because, for the producers, only one mode would not provide the necessary input for the viewers to understand the content. Yet, as pointed out by O’Halloran (2000), mathematics has a multimodal character, because it can be expressed in the form of language, symbolism and visual representation. And, together with the multimodal character of the design of the film, one can notice the presence of several modes in the productions made in this research. We notice in the video the students’ choice both in the use of multimodality concerning mathematics— the use of writing, symbolism and visual representation — as well as multimodality concerning design, layout, sound and colors.
Finally, it is important to emphasize the important role of social semiotics in data analysis, taking into account not only the video with its signs, but also the process in which this video was produced, understanding the choices of modes and designs and how they enhance the expression of mathematical ideas, because during the process, students justified the choice

107Sumário
Proceedings of the 11th Southern Hemisphere Conference on the Teaching and Learning of Undergraduate Mathematics and Statistics ISBN 978-85-8167-237-3
of modes, for example, the choice of video narration, because they understood that the image alone would not elucidate the explanation of what was exposed. If the production process had not been followed up, these decisions would not be known, limiting the analysis of the video produced to aspects of the producers’ choices and negotiations.
REFERENCESBezemer, J., & Kress, G. (2016). Multimodality, Learning and Communication: a social frame.
London: Routledge.
Borba, M. C. (2012). Humans-with-media and continuing education for mathematics teachers in online environments. ZDM, 44, 802–814.
Borba, M. C., Askar, P., Engelbrecht, J., Gadanidis, G., Llinares, S., & Aguilar, M. S. (2016). Blended learning, e-learning and mobile learning in mathematics education. ZDM - The International Journal on Mathematics Education, 48, 589–610.
Borba, M. C., & Villarreal, M. E. (2005). Humans-With-Media and the Reorganization of Mathematical Thinking: information and communication technologies, modeling, experimentation and visualization (Vol. 39). New York: Springer.
Burgemeier, J. W., Boisen, M. B., & Larsen, M. D. (1990). Brief Calculus with Applications. New York: McGraw-Hill.
Ferrés, J. (1996). Vídeo e Educação. (J. A. Llorens, Trans.) (2nd ed.). Porto Alegre: Artes Médicas.
Hodge, R., & Kress, G. (1988). Social semiotics. New York: Cornell University Press.
Jewitt, C. (2009). An introduction to multimodality. In The Routledge Handbook of Multimodal Analysis (pp. 14–27). London: Routledge.
Kress, G. (2010). Multimodality: a social semiotic approach to contemporary communication. New York: Routledge.
Kress, G., & Van Leeuwen, T. (2006). Reading Images: the grammar of visual design (2nd ed.). London: Taylor & Francis e-library.
Moran, J. M. (1995). O Vídeo na Sala de Aula. Comunicação E Educação, 2, 27–35.
Oechsler, V., Fontes, B. C., & Borba, M. C. (2017). Etapas da produção de vídeos por alunos da educação básica: uma experiência na aula de matemática. Revista Brasileira de Educação Básica, 2(1), 71–80.
O’Halloran, K. L. (2000). Classroom Discourse in Mathematics: A Multisemiotic Analysis. Linguistics and Education, 10(3), 359–388.
O’Halloran, K. L. (2005). Mathematical discourse: language, symbolism and visual images. London: Continuum.
Walsh, M. (2011). Multimodal Literacy: Researching classroom practice. Australia: Primary English Teaching Association (e:lit).
Wildfeuer, J. (2014). Film Discourse Interpretation: towards a new paradigm for multimodal film analysis. New York: Routledge.

108Sumário
Proceedings of the 11th Southern Hemisphere Conference on the Teaching and Learning of Undergraduate Mathematics and Statistics ISBN 978-85-8167-237-3
UNDERSTANDING OF LIMITS AND DIFFERENTIATION AS THRESHOLD CONCEPTS IN A FIRST-YEAR MATHEMATICS
COURSE
Greg Oates12
Robyn Reaburn
Michael Brideson
Kumudini Dharmasada
University of Tasmania
ABSTRACTThreshold concepts remain relatively unexplored in mathematics, despite suggestions that the troublesome nature of such concepts pose a critical barrier to student understanding of mathematics. Many studies have identified student difficulties with limits, and their findings point to a strong likelihood that limits do indeed constitute a threshold concept in mathematics. This paper describes the initial results in a study that sought to investigate students’ understanding of limits and differentiation from the prospective of Threshold Concepts. While the findings to date do not provide conclusive evidence for limits as a threshold concept, they do reinforce the troublesome nature of the limit concept, and suggest some important implications for the teaching of limits consistent with previous studies.Keywords: Undergraduate Mathematics, Limits, Differentiation, Threshold Concepts
INTRODUCTIONThreshold concepts were originally proposed by Meyer and Land [9] as a means of
understanding, describing and scaffolding student difficulties in a general cross-disciplinary sense. While their discussion explicitly considers examples from mathematics (e.g. Tall’s consideration of limits [15]), Meyer and Land are not mathematicians and their discussion of limits as a potential threshold concept arises from their understanding of Tall’s work [9, 15], not a specific investigation of threshold concepts in mathematics per se. Threshold concepts as described by Meyer and Land [9] have very specific features; they are those concepts that once understood, lead the student to a “transformed way of understanding, or interpreting, or viewing something without which the learner cannot progress” [9, p. 1]. They can also be compared with a one-way door, in that they open up “new and previously inaccessible way[s] of thinking about something” [9, p. 1]; once a student has gone through this door, the subject is transformed for this student. These concepts are commonly identified as troublesome, they may be counter-intuitive, alien, or incoherent to the learner [9, p. 7]. Cornu [4] cites Bachelard [1938], who referred to such topics as epistemological obstacles; topics that obstruct student understanding and by their very nature are difficult.
The limit is one of the fundamental ideas in calculus and is required for a good understanding of both derivatives and integrals [15]. While the formal definition of the limit (the “epsilon-delta” definition) can be learned by rote and used to prove that limits exist, we believe that if students are to truly understand further work in calculus they need to be able to

109Sumário
Proceedings of the 11th Southern Hemisphere Conference on the Teaching and Learning of Undergraduate Mathematics and Statistics ISBN 978-85-8167-237-3
have an intuitive understanding about their nature. Many studies support this conclusion and have considered student difficulties with limits in this respect [4, 5, 10; 14; 17]. As suggested earlier, Meyer and Land [9] indeed suggest that Tall’s consideration of limits [15] points to the concept of a limit as being troublesome and potentially a threshold concept. Certainly limits are “counter-intuitive” in that they may lead a student to imagine dividing by zero (which is not possible), or to imagine dividing areas under graphs into slices that are infinitely small. In addition, a limit may lead to a place in a function that can be defined or undefined [15]. Because of their difficult nature, Davis and Vinner [5] state that in reality misconceptions may be unavoidable as students build their knowledge about limits; therefore overcoming such hurdles may indeed be seen as crossing a threshold.
Whilst there has been considerable work on the misconceptions that students may have about limits and other calculus topics (e.g. [1, 4, 5, 10, 12, 14, 15, 17]), and many textbooks provide ways of addressing these (e.g. [11]), there are few studies into threshold concepts in pure mathematics in general and especially calculus. Several studies have investigated threshold concepts in wider applied mathematical domains (e.g. Computer Science, [2]; Financial mathematics, [6, 7, 8]; Statistics, [3]) but the only studies identified aimed specifically at calculus, while useful here, are either introductory and small scale [13], or within a higher second-level calculus course [18]. There are some studies which examine how students go through the process of gaining understanding when they first meet the formal definition of a limit, differentiation and the Fundamental Theorem of Calculus. Williams [17] for example found that students had an almost ubiquitous view of limit as being unreachable and viewed counter-examples as minor exceptions rather than reasons to abandon incomplete concepts. Oehrtman [10] analysed 120 students’ written and verbal descriptions of their thinking about challenging limit concepts. This analysis resulted in a characterisation of 5 clusters of strong metaphors based on the objects, relationships, and logic related to intuitions about (a) a collapse in dimension, (b) approximation and error analyses, (c) proximity in a space of point-locations, (d) a small physical scale beyond which nothing exists, and (e) the treatment of infinity as a number. Students’ reasoning with these metaphors had significant implications for the images they formed and the claims and justifications they provided about multiple limit concepts [10, p. 396]. The results and metaphors described in these two studies provide powerful evidence to suggest that limits and differentiation are indeed potential threshold concepts, and give considerable insight into the nature of questions we might ask, and the kind of thinking we might look for in establishing this.
Thus, given Meyer and Land’s claim that an understanding of threshold concepts can provide rich opportunities for teachers to better design and scaffold their lessons [9], this study aimed to investigate students’ mathematical understanding from the perspective of Threshold Concepts, building on the work of Tall [15] and the metaphors constructed by Oehrtman [10] and Williams [17]. This paper presents the initial results from an exploratory study with students in a first-year calculus course. The study combined questions aimed at identifying current knowledge and revealing potential misconceptions students might hold, with a post-survey interview to see if we could identify the nature of this thinking from a threshold concept perspective, similar to methodologies adopted in other threshold concept studies [2; 3; 13]. In addition to the value of the study in contributing to research in the under-explored domain of threshold concepts, we felt confident that students may well enjoy the questions in the survey, and there would be additional benefits for student participants in reinforcing and consolidating their learning of limits with questions relevant to their first-year mathematics content.
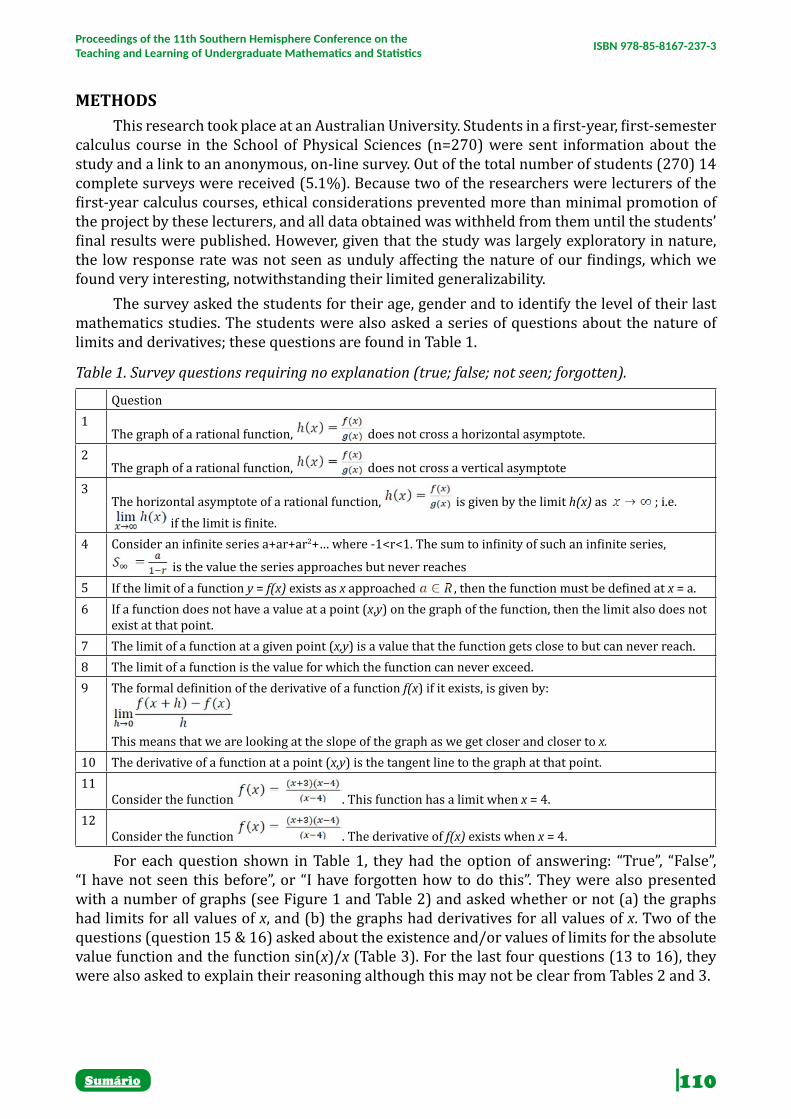
110Sumário
Proceedings of the 11th Southern Hemisphere Conference on the Teaching and Learning of Undergraduate Mathematics and Statistics ISBN 978-85-8167-237-3
METHODSThis research took place at an Australian University. Students in a first-year, first-semester
calculus course in the School of Physical Sciences (n=270) were sent information about the study and a link to an anonymous, on-line survey. Out of the total number of students (270) 14 complete surveys were received (5.1%). Because two of the researchers were lecturers of the first-year calculus courses, ethical considerations prevented more than minimal promotion of the project by these lecturers, and all data obtained was withheld from them until the students’ final results were published. However, given that the study was largely exploratory in nature, the low response rate was not seen as unduly affecting the nature of our findings, which we found very interesting, notwithstanding their limited generalizability.
The survey asked the students for their age, gender and to identify the level of their last mathematics studies. The students were also asked a series of questions about the nature of limits and derivatives; these questions are found in Table 1.
Table 1. Survey questions requiring no explanation (true; false; not seen; forgotten).
Question1
The graph of a rational function, does not cross a horizontal asymptote. 2
The graph of a rational function, does not cross a vertical asymptote3
The horizontal asymptote of a rational function, is given by the limit h(x) as ; i.e. if the limit is finite.
4 Consider an infinite series a+ar+ar2+… where -1<r<1. The sum to infinity of such an infinite series,
is the value the series approaches but never reaches5 If the limit of a function y = f(x) exists as x approached , then the function must be defined at x = a.6 If a function does not have a value at a point (x,y) on the graph of the function, then the limit also does not
exist at that point.7 The limit of a function at a given point (x,y) is a value that the function gets close to but can never reach. 8 The limit of a function is the value for which the function can never exceed.9 The formal definition of the derivative of a function f(x) if it exists, is given by:
This means that we are looking at the slope of the graph as we get closer and closer to x. 10 The derivative of a function at a point (x,y) is the tangent line to the graph at that point. 11
Consider the function . This function has a limit when x = 4. 12
Consider the function . The derivative of f(x) exists when x = 4.
For each question shown in Table 1, they had the option of answering: “True”, “False”, “I have not seen this before”, or “I have forgotten how to do this”. They were also presented with a number of graphs (see Figure 1 and Table 2) and asked whether or not (a) the graphs had limits for all values of x, and (b) the graphs had derivatives for all values of x. Two of the questions (question 15 & 16) asked about the existence and/or values of limits for the absolute value function and the function sin(x)/x (Table 3). For the last four questions (13 to 16), they were also asked to explain their reasoning although this may not be clear from Tables 2 and 3.

111Sumário
Proceedings of the 11th Southern Hemisphere Conference on the Teaching and Learning of Undergraduate Mathematics and Statistics ISBN 978-85-8167-237-3
Table 2. Questions requiring an explanation (see Figure 1).
Question13 Which of these has limits for all values of x?14 Which of the following can be differentiated for all values of x?
Figure 1. Graphs for Survey Questions 13 and 14 about limits and differentiability.(Note that the graph in (e) has a discontinuity that is not clear in the reproduction here).
Table 3. Final two survey questions requiring an explanation about the functions y = |x| and y = sin(x).
Question15 Consider the graph of the function shown here (y = |x|, See Figure 2). Does the function have a limit when
x=0?16
Do you think it is possible to find the limit of the function as 0→x i.e. ?Explain your thinking, and if you think it is possible, give a value for the limit if you can find it.

112Sumário
Proceedings of the 11th Southern Hemisphere Conference on the Teaching and Learning of Undergraduate Mathematics and Statistics ISBN 978-85-8167-237-3
Figure 2. Graph of y = |x| for Question 15.
FINDINGSWe received 14 completed responses to the survey, seven males and seven females.
For three of these students the previous course they had studied in secondary school was Mathematics Methods13, for eight students their previous course was Mathematics Specialised (note students who undertake Mathematics Specialised have all previously completed Mathematics Methods). Three of the participants had completed other courses to be eligible for enrolment in this undergraduate course. We do not have space to consider in-depth responses to all the questions here, so have selected some examples which we found most interesting, and most supportive of the troublesome nature of the questions that may suggest their identification of threshold concepts. In the following tables (4-13), the correct responses have been bolded where applicable.
Questions about asymptotes (Question 1, Question 2 and Question 3)These questions showed higher levels of uncertainty than most of the other questions.
Table 4 shows that four of the students answered “True” to both questions, whereas the statement for Question 1 is false; the graph can cross horizontal asymptotes. Four students said that they had not seen this before to both questions, and four said that they had forgotten how to do this for both questions. In Question 3, six of the students correctly agreed with the given definition of a horizontal asymptote, while five stated that they had forgotten how this was done (Table 5). We would expect students in all courses (Methods & Specialised) to have met the concept of an asymptote, but less likely the notion of the limit as in Question 3, so these results demonstrate to us some unexpected confusion. Especially interesting is that fewer students said they had not met the conceptualisation of an asymptote as a limit before, but believed they had not met the idea of the nature of an asymptote itself. The result that four students believe the graph of a function can never cross an asymptote, either horizontally or vertically, while less surprising based on our experiences, is nevertheless worrying.
13 Mathematics Methods and Mathematics Specialized are mathematics courses at secondary schools in Australia that contribute to a student’s eligibility for university entrance. Mathematics Methods includes the study of functions and graphs, circular functions, statistics and probability, limits, differentiation and integration. Mathematics Specialized includes the study of complex numbers, matrices, calculus including the use of the 1st and 2nd derivatives for graph sketching, integration, and 1st order differential equations.

113Sumário
Proceedings of the 11th Southern Hemisphere Conference on the Teaching and Learning of Undergraduate Mathematics and Statistics ISBN 978-85-8167-237-3
Table 4. Comparison of responses from questions one and two in the survey.
Question 2
Question 1 True False I have not seen this before
I have forgotten how to do this Total
True 4 1 5False 1 1I have not seen this before 4 4
I have forgotten how to do this 4 4
Total 4 2 4 4 14
Table 5. Summary of Question 3 survey responses.
Question 3 True FalseI have not seen this
before
I have forgotten how
to do thisTotal
The horizontal asymptote of a rational
function, is given by the limit h(x) as ; i.e. if the limit is finite.
6 2 1 5 14
Questions about the definition of a derivative (Questions 9 and 10)Here eight students correctly agreed that the formal definition of a derivative as given
in Table 1 (Q9) refers to the slope of the graph at a point x, and 12 incorrectly agreed that the derivative is the tangent line at a point (Q10). While it is possible the wording of Question 10 may have ‘led’ them to this response, it still indicates some confusion of their understanding of a derivative compared to the means we use to calculate or find it, or the difference between procedures and the concepts themselves. The figures in Table 6 provide a further pointer to the troublesome nature of these concepts, with only one student selecting the correct combination for both questions.Table 6. Summary of responses to questions about the definition of derivative.
Question 10Question 9 True False TotalTrue 7 1 8False 2 1 3I have not seen this before 1 1
I have forgotten how to do this 2 2
Total 12 2 14
Questions referring to whether limits can be “reached” or “exceeded” (Questions 4, 7, and 8)
Six students agreed that the limits cannot be reached or exceeded. Nine students agreed to the statement that the limit of a series is a value that is never reached; no student correctly answered false. In contrast, 10 students correctly stated false to the proposition that the limit of a function cannot be exceeded. These results are perhaps not surprising, given that the

114Sumário
Proceedings of the 11th Southern Hemisphere Conference on the Teaching and Learning of Undergraduate Mathematics and Statistics ISBN 978-85-8167-237-3
questions themselves were based around the categories of confusion identified in the literature [9, 15]. However, the inconsistencies in their thinking shown in the comparison of responses to different questions in Tables 7 to 9 add weight to the troublesome nature of limits and their consideration as a threshold concept.Table 7. Comparison of responses from questions four and seven in the survey.
Question 7
Question 4 True False I have not seen this before
I have forgotten how to do this Total
True 6 3 9FalseI have not seen this before 1 2 3
I have forgotten how to do this 2 2 2
Total 7 5 2 14
Table 8. Comparison of responses from questions four and eight in the survey.
Question 8Question 4 True False TotalTrue 1 8 9FalseI have not seen this before 2 1 3
I have forgotten how to do this 1 1 2
Total 4 10 14
Table 9. Comparison of responses from questions seven and eight in the survey.
Question 8Question 7 True False TotalTrue 7 7False 2 3 5I have forgotten how to do this 2 2
Total 4 10 14
Questions referring to existence of limits (Questions 5 and 6)As shown in Table 10, five students incorrectly agreed that the function must be defined
at a limit (True for Q5). In contrast, nine students correctly believed that a limit may exist at a point where a function does not have a value (False for Q6). The five students who answered correctly to both statements showed consistency in their responses, we postulate that perhaps this is an indication they have ‘crossed the threshold’ in their thinking about the existence of limits, although the evidence here is insufficient to conclude this here.

115Sumário
Proceedings of the 11th Southern Hemisphere Conference on the Teaching and Learning of Undergraduate Mathematics and Statistics ISBN 978-85-8167-237-3
Table 10. Comparison of responses from questions five and six in the survey.
Question 6
Question 5 True False I have not seen this before Total
True 3 2 5False 1 5 1 7I have not seen this before 1 1
I have forgotten how to do this 1 1
Total 4 9 1 14
Questions referring to the function )4()4)(3(
−−+
=x
xxy (Questions 11 and 12)Table 11. Comparison of responses from questions 11 and 12 in the survey.
Question 12
Question 11 True False I have not seen this before
I have forgotten how to do this Total
True 1 7 1 2 11False 1 2 3Total 2 9 1 2 14
Table 11 shows that eleven students correctly identified that this function has a limit at x = 4, and 9 correctly stated that there is not a derivative at this point. Seven answered both questions correctly. It seems possible that the numerical nature of these questions (compared to previously more abstract questions) helped students’ thinking here, but nevertheless the responses here ( in Table 11) suggest better understanding than for asymptotes and the nature of limits themselves.
Questions referring to the graphs in Figure 2 (Questions 13 and 14)The correct answers to Question 13 as shown in bold in Table 12 are a, c and e, and the
correct answer for Question 14 is a (see Table 2 and Figure 1 for the questions and response choices).Table 12. Graphical responses for questions 13 and 14 in the survey.
Graph a b c d e noneLimits at all values of x (Q13) 10 6 9 8 10 1Differentiable at all values of x (Q14) 14 2 5 3 6 0
Reasoning for Question 13:Two students picked the correct answers, (a), (c), and (e) without choosing any other
options. Four students used reasoning that suggested that for a limit to exist in a function at a point x, the value of the limit as we approach this point from the negative side should equal that as we approach the same point from the right hand side. However only one of these four students picked solely the three correct answers. For example, while one student correctly stated:
Limits lead to the same point, so not (d),
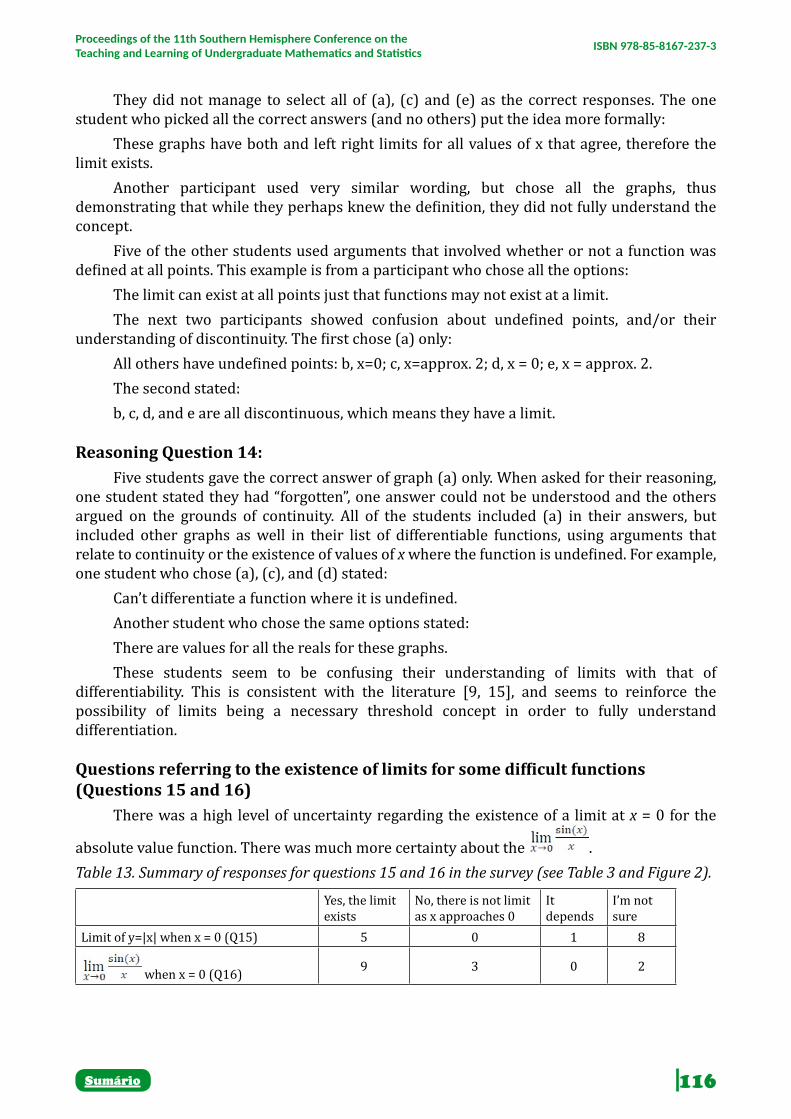
116Sumário
Proceedings of the 11th Southern Hemisphere Conference on the Teaching and Learning of Undergraduate Mathematics and Statistics ISBN 978-85-8167-237-3
They did not manage to select all of (a), (c) and (e) as the correct responses. The one student who picked all the correct answers (and no others) put the idea more formally:
These graphs have both and left right limits for all values of x that agree, therefore the limit exists.
Another participant used very similar wording, but chose all the graphs, thus demonstrating that while they perhaps knew the definition, they did not fully understand the concept.
Five of the other students used arguments that involved whether or not a function was defined at all points. This example is from a participant who chose all the options:
The limit can exist at all points just that functions may not exist at a limit.The next two participants showed confusion about undefined points, and/or their
understanding of discontinuity. The first chose (a) only:All others have undefined points: b, x=0; c, x=approx. 2; d, x = 0; e, x = approx. 2.The second stated:b, c, d, and e are all discontinuous, which means they have a limit.
Reasoning Question 14:Five students gave the correct answer of graph (a) only. When asked for their reasoning,
one student stated they had “forgotten”, one answer could not be understood and the others argued on the grounds of continuity. All of the students included (a) in their answers, but included other graphs as well in their list of differentiable functions, using arguments that relate to continuity or the existence of values of x where the function is undefined. For example, one student who chose (a), (c), and (d) stated:
Can’t differentiate a function where it is undefined.Another student who chose the same options stated:There are values for all the reals for these graphs.These students seem to be confusing their understanding of limits with that of
differentiability. This is consistent with the literature [9, 15], and seems to reinforce the possibility of limits being a necessary threshold concept in order to fully understand differentiation.
Questions referring to the existence of limits for some difficult functions (Questions 15 and 16)
There was a high level of uncertainty regarding the existence of a limit at x = 0 for the
absolute value function. There was much more certainty about the .Table 13. Summary of responses for questions 15 and 16 in the survey (see Table 3 and Figure 2).
Yes, the limit exists
No, there is not limit as x approaches 0
It depends
I’m not sure
Limit of y=|x| when x = 0 (Q15) 5 0 1 8
when x = 0 (Q16) 9 3 0 2
117Sumário
Proceedings of the 11th Southern Hemisphere Conference on the Teaching and Learning of Undergraduate Mathematics and Statistics ISBN 978-85-8167-237-3
Reasoning Question 15This question demonstrated the highest level of uncertainty in the students, eight of
whom stated that they were uncertain of the answer. Of those who stated that the limit exists, three stated that the limits approaching from both sides of x=0 had the same value, zero. Most of the participants who were unsure did not give an answer. Two students who were unsure gave their reasons as follows:
Can’t go lower but I’m not sure if that counts as a limit.I’m not sure, I would have said “yes, the limit exists” if I was to pick another option,
because the function has real x values all along the function, except for at 0, and I think that might be what a limit is.
Reasoning Question 16It was unlikely students would have met this example in their previous courses, but it is
part of their first-year unit content. We asked this question to see if might detect any indication of ‘threshold thinking’ that enables students to correctly argue this question through. Three students stated that the limit was one. One stated that the “expression can be rewritten so that it is not dividing by zero, limit is equal to 1” without giving further explanation. One student stated “The answer is 1 but I don’t remember how to work it out”. The other student gave a description of L’Hopital’s rule without calling it as such, and then correctly gave the answer as one. One student gave the limit as zero. Another participant stated that the limit did not exist because we “can’t divide by zero” while another stated that “I believe that the answer is +(ve) infinity, because as the x values get smaller and smaller, sin(x) will approach 0, but as we are dividing by x that is getting smaller and smaller, the answer will approach infinity”. There was no indication from any respondents that they understood limits sufficiently to distinguish the process of finding a limit from the concept of existence of the limit, or a link to other limits they may have found which involved dividing by zero, for example the formal definition of a derivative?
Discussion and ImplicationsThe number of participants in this study is too small to clearly establish limits and
differentiability as threshold concepts. However, the results of this study agree with the misconceptions and confused understanding shown in the literature [e.g. 4, 5; 11 15], and in the questions where students provided explanations, consistent with the findings and metaphors as described in [10] and [17]. The findings here clearly confirm the troublesome nature of these concepts as one of the primary indicators of a threshold concept. There is considerable confusion between the two concepts, and even though we found indications that some students may have crossed the ‘threshold” in their thinking about the existence of limits for earlier questions (Q5, Q6, Q11, Q12), we did not see evidence of this in later questions. Examples from the yet to be completed analysis of the post-survey interviews may shed further light on this. Their thinking about the existence of limits for the graphical examples in Question 13 was clearly confused, and in some cases mixed up with their understanding of the derivative. No students seemed able to extend their correct thinking from earlier questions in their approach to Question 16, albeit that this question would be new for most of them and is arguably one of the trickier examples students will meet. Nonetheless we might expect a student who had “crossed the threshold” to at least be able to approach this question with an open mind as to the possibility of a limit existing. If these concepts are indeed threshold ones, then clearly these students have not yet crossed it. However, our findings to date support other studies that have investigated threshold concepts in Calculus [13, 18] and Meyer and Land’s [9] original proposal

118Sumário
Proceedings of the 11th Southern Hemisphere Conference on the Teaching and Learning of Undergraduate Mathematics and Statistics ISBN 978-85-8167-237-3
for limits as a threshold concept based on Tall’s work [15]. Further investigation is needed, linking students’ correct thinking (over the threshold?) to more complex examples such as that in Question 16.
Notwithstanding that we have yet to show conclusive support for limits and differentiation as threshold concepts, this study still provides interesting insights into student thinking and misconceptions, with implications for the teaching of these concepts. Firstly the results illustrate the importance of educators needing to not make assumptions about students’ prior knowledge. It is clear that students can work with derivatives, even beyond the mere procedural level, yet not understand limits fully. There is limited reference to limits with respect to differentiation in the Australian Mathematics Methods Syllabus papers, where the only mention is: “Limit theorems made plausible”. [16, p. 6]. The results of this study suggest that whilst students appear to be working competently on differentiation and integration problems, they might not understand the concept that makes this work possible. In addition to the examples of student responses already cited in support of the data presented in the tables, we found many other interesting comments by students that illustrate the confusion inherent in their thinking, such as the following beliefs:
• Flat lines differentiate to zero, therefore no derivative for (c), (d) in Question 14;• Can differentiate where there are no vertical asymptotes, so (c), (d) are possible;• Dividing by zero gives infinity as the answer (Q16);• The derivative IS the tangent line.These and the findings presented in the tables lead us to make the following observations
and recommendations which we present as implications from this study.
Teaching implications:• Notwithstanding changing practice based on many years of research, and support
offered with technological advances, teachers must recognise that the concepts of limits and differentiation remain difficult for students (sic troublesome);
• Students need to see examples where a graph can cross a horizontal asymptote, and examples where sequences reach their limits;
• We must ask students questions that reveal their reasoning; otherwise we can assume they are correct without realising that they still may have misconceptions. For example, the students who correctly gave the limit as “1” in Question 16, but could not correctly explain their reasoning;
• Students can hold conflicting views. For example, they say that one function has a discontinuity so isn’t differentiable but then say another function with a discontinuity is differentiable because the nature of the discontinuity differs ((b), (c), (d) & (e)), or realise that a discontinuity means one function does not have a limit, but believe it is differentiable, (d), everywhere flat so derivative is zero;
• Students can absorb ideas such as that left hand and right hand limits agree, and notions of continuity, but may not grasp the implications fully yet. The responses here were the closest we came to confirming limits as a threshold concept.
FINAL COMMENTSThe findings of this study have given support for the conceptualisation of limits and
differentiation as threshold concepts, and suggested some important implications for supporting and scaffolding student understanding in the teaching of these concepts. We anticipate that

119Sumário
Proceedings of the 11th Southern Hemisphere Conference on the Teaching and Learning of Undergraduate Mathematics and Statistics ISBN 978-85-8167-237-3
the post-survey interviews may provide further examples of students’ thinking with respect to these concepts, and we hope to identify examples from these which provide evidence of students; ‘crossing the threshold’. Results from these interviews have yet to be transcribed or analysed. Further investigation with a larger sample may also identify examples where students’ thinking has clearly “crossed a threshold”, allowing them to argue coherently about these concepts in unfamiliar contexts and using more complex examples.
REFERENCESBezuidenhout, J. (2001). Limits and continuity: some conceptions of first-year students.
International Journal of Mathematical Education in Science and Technology, 32(4), 487-500.
Boustedt, J., Eckerdal, A., McCartney, R., Moström, J. E., Ratcliffe, M., Sanders, K., & Zander, C. (2007). Threshold concepts in computer science: do they exist and are they useful?. ACM SIGCSE Bulletin, 39(1), 504-508.
Bulmer, M., O’Brien, M., & Price, S. (2007). Troublesome concepts in statistics: A student perspective on what they are and how to learn them. In Proceedings of the Science Teaching and Learning Symposium, University of Sydney, September 28-29. Sydney, Australia, pp. 139–144, Accessed 16 October from 2013.http://openjournals.library.usyd.edu.au/index.php/IISME/article/view/6337.
Cornu, B. (1991). Limits. In D. Tall (ed.), Advanced mathematical thinking (pp. 153-166). Dordrecht: Kluwer Academic Publishers.
Davis, R., & Vinner, S. (1986). The notion of limit: Some seemingly unavoidable misconception stages. Journal of Mathematical Behaviour, 5, 281-303.
Hoadley, S., Kyng, T., Tickle, L., & Wood, L. N. (2015). Threshold concepts in finance: student perspectives. International Journal of Mathematical Education in Science and Technology, 46(7), 1004-1020.
Hoadley, S., Tickle, L., Wood, L. N., & Kyng, T. (2015). Threshold concepts in finance: conceptualizing the curriculum. International Journal of Mathematical Education in Science and Technology, 46(6), 824-840.
Hoadley S, Wood LN, Tickle, L. & Kyng T. (2015). Threshold concepts in finance and the role of mathematics. Available from: https://www.researchgate.net/publication/280571189
Meyer, J., & Land, R. (2003). Threshold concepts and troublesome knowledge: Linkages to ways of thinking and practising within the disciplines. In C. Rust (ed.), Improving students learning – Ten years on. Oxford: OCSLD.
Oehrtman, M. (2009). Collapsing dimensions, physical limitation, and other student metaphors for limit concepts. Journal for Research in Mathematics Education, 396-426.
Reaburn, R. (2016). Calculus. In G. Hine, R. Reaburn, J. Anderson, L. Galligan, C. Carmichael, M. Cavanagh, B. Ngu & B. White, Teaching Secondary Mathematics (pp. 355-389). Cambridge University Press: Melbourne, Australia.
Robert, A., & Schwarzenberger, R. (1991). Research in teaching and learning mathematics at an advanced level. In D. Tall (ed.). Advanced mathematical thinking (pp. 127-139). Dordrecht: Kluwer Academic Publishers.

120Sumário
Proceedings of the 11th Southern Hemisphere Conference on the Teaching and Learning of Undergraduate Mathematics and Statistics ISBN 978-85-8167-237-3
Scheja, M. & Pettersson, K. (2010). Transformations and contextualisation: Conceptualising students’ conceptual understandings of threshold concepts in calculus. Higher Education, 59, 221-241.
Sealey, V. (2014). A framework for characterizing student understanding of Riemann sums and definite integrals. The Journal of Mathematical Behavior, 33(1), 230-245.
Tall, D. (1992). The transition to advanced mathematical thinking: Functions, limits, infinity, and proof. In D. Grouws (ed.), Handbook of research on mathematics teaching and learning (pp. 495-511). New York: MacMillan.
Tasmanian Qualifications Authority [TQA] (2014). Mathematics Methods, Version 1a. TQA
Williams, S. R. (1991). Models of limit held by college calculus students. Journal for research in Mathematics Education, 219-236.
Worsley, S. & Bulmer, M. (2008). Threshold concepts and troublesome knowledge in a second-level mathematics course. In A. Hugman and K. Placing (eds.), Symposium proceedings: Visualisation and concept development (pp. 139-144). The University of Sydney: UniServe Science.
121Sumário
Proceedings of the 11th Southern Hemisphere Conference on the Teaching and Learning of Undergraduate Mathematics and Statistics ISBN 978-85-8167-237-3
FIRST YEAR ENGINEERING MATHEMATICS: WHAT’S THE OPTIMAL BLEND?
Diana Quinn14
Bronwyn Hajek
Jorge Aarão
University of South Australia
ABSTRACTThere are many choices for learning mathematics for engineering students with courses available in face-to-face, blended and fully online modalities. Students are demanding more flexibility in their programs, however the temptation to misuse this flexibility to avoid mathematical studies until it is too late can be an unfortunate side effect. Using the 3P model of student learning as a guide, we explore what happens when you try to find the optimal blend – the best of the available online and face-to-face teaching and learning to create a motivating student-centred learning experience that is flexible, effective and engaging for first year engineers. Developments trialled included online quizzes for changing attitudes and teaching foundational concepts, online lecture options, the adoption of Board Tutorials supported by a problem-solving approach for more complex engineering modelling problems and online interactive problems. The optimal blend will depend on the course and its students. Implementing blended learning by combining the best of online learning tools and F2F learning activities can make for excellent courses provided that the focus remains on student learning rather than course delivery. Keywords: Blended Learning, Mathematics, Engineering.
INTRODUCTIONDigital technologies are predicted to transform the delivery, support and access of higher
education programs15 [1]. One driver for this change is students who are increasingly mobile, have greater access to information and are juggling competing commitments [2]. It is predicted that online engineering programs, that allow learning anywhere and anytime, will continue to develop and improve [3, 4]. Mathematics is central to engineering [5], however, fully online mathematics courses are more likely to suffer student attrition than other disciplines [6]. Blended versions of face-to-face (F2F) engineering mathematics courses may be a way forward, allowing for the coupling of online activities with F2F instruction [7]. However the ‘learning’ part of the term ‘blended learning’ has been contested as adding online components to courses is more delivery-focussed, rather than learning-focussed [8]. Flipped learning is a subset of blended learning that consists of two parts: computer-based individualised instruction (usually lectures) outside of the classroom followed by in-class active group learning activities [9-11]. So, if you could create an ideal first year engineering mathematics blended learning experience that combined the best of online and F2F experiences, what would it look like? To answer this question, let’s first focus on student learning.
14 [email protected] We refer to engineering programs as being made up of courses, where full time study is 4 courses per study
period (semester). A course contributes 4.5 units towards the completion of a 144 unit engineering program. According to Assessment Policy, the time students spend on all the learning activities and assessment in a 4.5 unit course should not exceed 157.5 hours of student workload
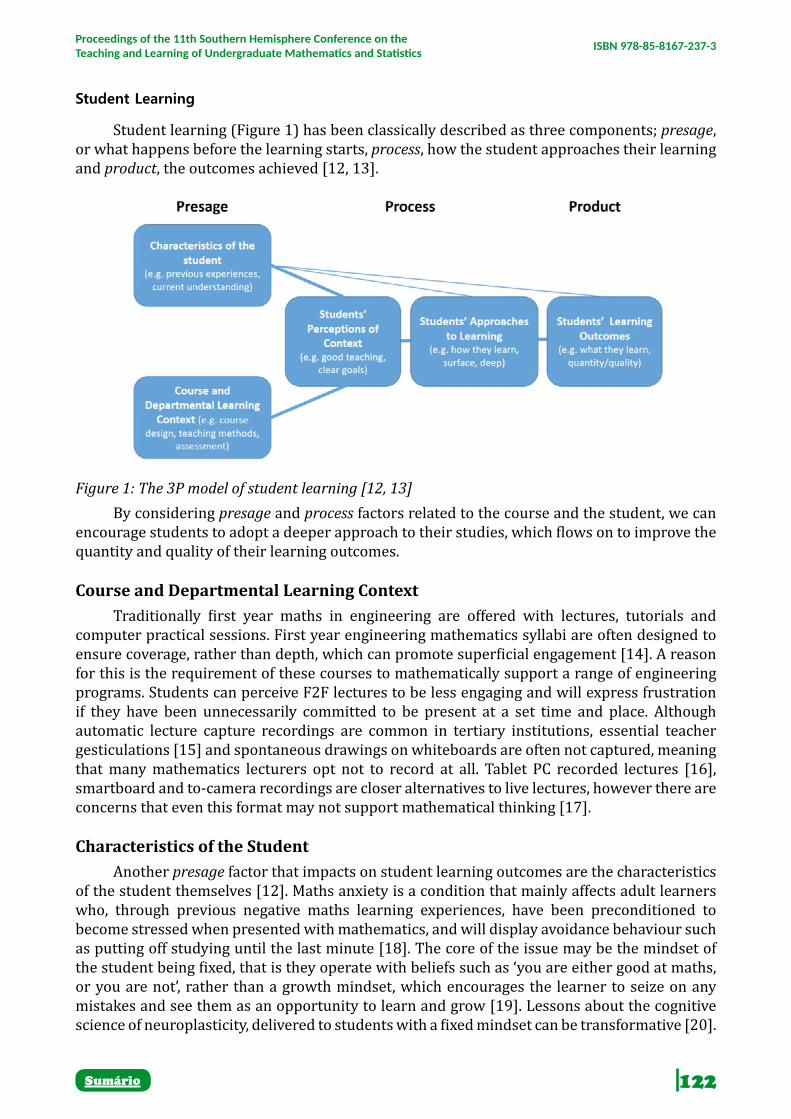
122Sumário
Proceedings of the 11th Southern Hemisphere Conference on the Teaching and Learning of Undergraduate Mathematics and Statistics ISBN 978-85-8167-237-3
Student Learning
Student learning (Figure 1) has been classically described as three components; presage, or what happens before the learning starts, process, how the student approaches their learning and product, the outcomes achieved [12, 13].
Figure 1: The 3P model of student learning [12, 13]By considering presage and process factors related to the course and the student, we can
encourage students to adopt a deeper approach to their studies, which flows on to improve the quantity and quality of their learning outcomes.
Course and Departmental Learning ContextTraditionally first year maths in engineering are offered with lectures, tutorials and
computer practical sessions. First year engineering mathematics syllabi are often designed to ensure coverage, rather than depth, which can promote superficial engagement [14]. A reason for this is the requirement of these courses to mathematically support a range of engineering programs. Students can perceive F2F lectures to be less engaging and will express frustration if they have been unnecessarily committed to be present at a set time and place. Although automatic lecture capture recordings are common in tertiary institutions, essential teacher gesticulations [15] and spontaneous drawings on whiteboards are often not captured, meaning that many mathematics lecturers opt not to record at all. Tablet PC recorded lectures [16], smartboard and to-camera recordings are closer alternatives to live lectures, however there are concerns that even this format may not support mathematical thinking [17].
Characteristics of the StudentAnother presage factor that impacts on student learning outcomes are the characteristics
of the student themselves [12]. Maths anxiety is a condition that mainly affects adult learners who, through previous negative maths learning experiences, have been preconditioned to become stressed when presented with mathematics, and will display avoidance behaviour such as putting off studying until the last minute [18]. The core of the issue may be the mindset of the student being fixed, that is they operate with beliefs such as ‘you are either good at maths, or you are not’, rather than a growth mindset, which encourages the learner to seize on any mistakes and see them as an opportunity to learn and grow [19]. Lessons about the cognitive science of neuroplasticity, delivered to students with a fixed mindset can be transformative [20].

123Sumário
Proceedings of the 11th Southern Hemisphere Conference on the Teaching and Learning of Undergraduate Mathematics and Statistics ISBN 978-85-8167-237-3
Pre-learning opportunities, which allow students to self-test and learn from their mistakes in the privacy of an online environment have been shown to ease anxiety [18].
It is important to ensure that all our students have the foundation knowledge to be successful in first year engineering courses [21]. Mathematics is at the core of engineering and incoming skill levels are correlated with engineering student outcomes [5]. Although GPA can be used as a predictor of success in STEM courses [22]Alyse C.</author><author>Wladis, Claire</author><author>Conway, Katherine</author></authors></contributors><titles><title>Prior online course experience and G.P.A. as predictors of subsequent online STEM course outcomes</title><secondary-title>The Internet and Higher Education</secondary-title></titles><periodical><full-title>The Internet and Higher Education</full-title></periodical><pages>11-17</pages><volume>25</volume><dates><year>2015</year></dates><isbn>10967516</isbn><urls></urls><electronic-resource-num>10.1016/j.iheduc.2014.10.003</electronic-resource-num></record></Cite></EndNote>, personality factors such as Grit - perseverance and passion for long term goals [23, 24] have been shown to be strong predictors of academic success. In a study of students’ views of their transition from secondary to tertiary mathematics, engineering students identify this as a time of changing identity [25] and thus first year may be an ideal time to support students to form a clearer understanding of their new selves.
Students’ Perceptions of the Learning ContextHow students’ perceive the learning context impacts on how they choose to approach their
learning [12] and thereby, their subsequent learning outcomes [26]. To engage and motivate adults to learn it is important to establish inclusion, help them develop a favourable attitude to learning, enhance meaning for their learning experiences, and engender competence by creating or affirming something that students value and perceive as authentic [27]. Traditional learning approaches in lecture halls and tutorial rooms can be distant from how learning is achieved in professional engineering settings. Setting contextualised problems for students can help motivate them to learn by creating interest and demonstrating the relevance of what they are learning [28].
Other key aspects related to how the learning context is perceived by students are its level of preparedness and organisation and the clarity of objectives and explanations [26]. Structured active learning processes and sufficient time on task have also been identified as contributing to student success in university-level mathematics courses [29]. Time Budgets, which are visual guides to the weekly learning activities [30] can succinctly convey course structure to students.
Students’ Approaches to LearningStudents can elect to take a surface or a deep approach to their learning. However, it
is possible to change the learning environment to be active [31] such that students cannot succeed by adopting a surface approach [14]. For example, Board Tutorials [32, 33] are a more active form of tutorial ideally suited to maths learning. Board Tutorials require a special room where white boards have been installed around the room and furniture (tables and chairs) can be quickly relocated. Students form pairs, are given problems, a marker and allocated a whiteboard as they arrive. Students take turns solving the set problems, talking and asking questions of each other about the approaches that are being used. The students are encouraged to look at others’ work and discuss any differences in strategies and weigh the pros and cons of such choices. Students are also encouraged to photograph and share their work.

124Sumário
Proceedings of the 11th Southern Hemisphere Conference on the Teaching and Learning of Undergraduate Mathematics and Statistics ISBN 978-85-8167-237-3
The role of the tutor in Board Tutorials is to engage students through deep questioning and facilitating the problem solving process. The tutors do not have a marker and use questioning to help students move through the various stages of the problem solving process. Answers are available in the session for students to check and at the end of the week full solutions are shared. While the number of problems students complete is reduced when using this technique, the learning process is richer and more active [32, 34], therefore limiting the opportunity for students to choose a surface approach to their learning.
BackgroundThe courses, Mathematical Methods for Engineers 1 (MME1) and Mathematical Methods
for Engineers 2 (MME2) are 1st and 2nd semester first-year core courses offered as a part of all Bachelor of Engineering programs. The F2F versions of these courses were first introduced in 1992 with the aim of providing an introduction to mathematical concepts relevant to engineering disciplines using analytic and software approaches (MME1) and an introduction to linear algebra and differential equations and a continuation of differential and integral calculus concepts with a focus on applications (MME2). The prerequisites for the MME1 course are Mathematics 1 or Mathematical Studies at Year 12, or equivalent, and the prerequisite for MME2 is MME1. While the intake is predominantly local students from the high school system, approximately 15% are international students.
The F2F MME1 course has been taught with 3 hours of lectures for 13 weeks, 1.5 hour tutorial for 12 weeks and 1 hour computer practical for 12 weeks. The F2F MME 2 course has 4 hours of lectures for 13 weeks, 1 hour tutorial for 12 weeks and 1 hour computer practical every second week.
MME1 has a history of poor performance in student learning outcomes with high failure and withdrawal rates when compared to other first year courses in the engineering degree. Interventions to detect students at risk via performance in early assessment were in place in 2008 [35] and had some impact at reducing the rate of withdrawal, but poor grades and comparatively low student satisfaction scores continued. High failure rates in MME1 and MME2, when compared to other first year engineering courses, has necessitated the scheduling of make-up courses in other study periods to support engineering students’ progress through their program.
With the help of a development team, fully online versions of MME1 and MME2 were offered from 2012. The course materials underwent some change to allow this new delivery including the development of topic notes, topic summary videos, tutorial solution videos and a Time Budget [30].
After a development period in 2015, online components were incorporated into the 2016 F2F courses and Board Tutorials were adopted. MME1 students could opt to ‘flip their learning’ if they wished by watching online lecture resources rather than coming to lectures.
METHODOLOGYThe developments implemented in MME1 and MME2 in 2016 are listed in Table 1.
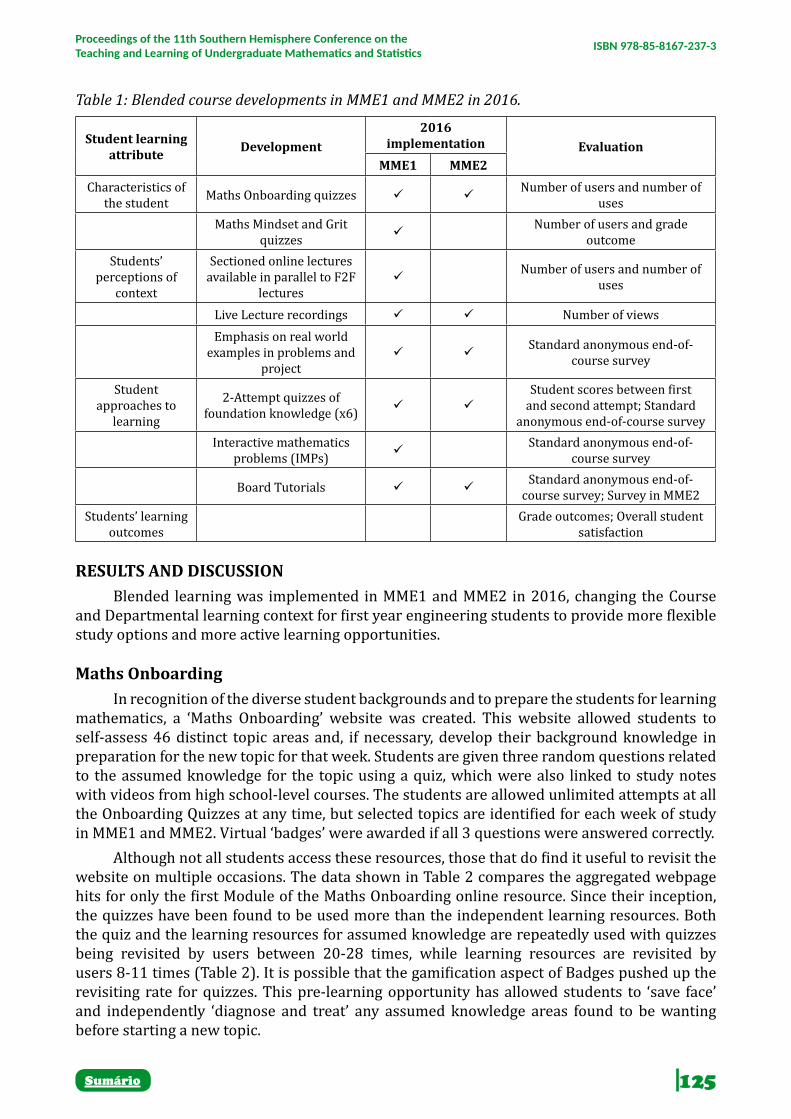
125Sumário
Proceedings of the 11th Southern Hemisphere Conference on the Teaching and Learning of Undergraduate Mathematics and Statistics ISBN 978-85-8167-237-3
Table 1: Blended course developments in MME1 and MME2 in 2016.
Student learning attribute Development
2016 implementation Evaluation
MME1 MME2Characteristics of
the student Maths Onboarding quizzes Number of users and number of
usesMaths Mindset and Grit
quizzes Number of users and grade
outcomeStudents’
perceptions of context
Sectioned online lectures available in parallel to F2F
lectures
Number of users and number of uses
Live Lecture recordings Number of viewsEmphasis on real world
examples in problems and project
Standard anonymous end-of-
course survey
Student approaches to
learning
2-Attempt quizzes of foundation knowledge (x6)
Student scores between first and second attempt; Standard
anonymous end-of-course surveyInteractive mathematics
problems (IMPs) Standard anonymous end-of-
course survey
Board Tutorials Standard anonymous end-of-
course survey; Survey in MME2Students’ learning
outcomesGrade outcomes; Overall student
satisfaction
RESULTS AND DISCUSSIONBlended learning was implemented in MME1 and MME2 in 2016, changing the Course
and Departmental learning context for first year engineering students to provide more flexible study options and more active learning opportunities.
Maths OnboardingIn recognition of the diverse student backgrounds and to prepare the students for learning
mathematics, a ‘Maths Onboarding’ website was created. This website allowed students to self-assess 46 distinct topic areas and, if necessary, develop their background knowledge in preparation for the new topic for that week. Students are given three random questions related to the assumed knowledge for the topic using a quiz, which were also linked to study notes with videos from high school-level courses. The students are allowed unlimited attempts at all the Onboarding Quizzes at any time, but selected topics are identified for each week of study in MME1 and MME2. Virtual ‘badges’ were awarded if all 3 questions were answered correctly.
Although not all students access these resources, those that do find it useful to revisit the website on multiple occasions. The data shown in Table 2 compares the aggregated webpage hits for only the first Module of the Maths Onboarding online resource. Since their inception, the quizzes have been found to be used more than the independent learning resources. Both the quiz and the learning resources for assumed knowledge are repeatedly used with quizzes being revisited by users between 20-28 times, while learning resources are revisited by users 8-11 times (Table 2). It is possible that the gamification aspect of Badges pushed up the revisiting rate for quizzes. This pre-learning opportunity has allowed students to ‘save face’ and independently ‘diagnose and treat’ any assumed knowledge areas found to be wanting before starting a new topic.

126Sumário
Proceedings of the 11th Southern Hemisphere Conference on the Teaching and Learning of Undergraduate Mathematics and Statistics ISBN 978-85-8167-237-3
Table 2: Maths Onboarding Usage for Module 1 Topics (August 2017)
TopicQuiz Learning resource (notes, videos)
Views Users Views Users1.1 Mathematical Preliminaries 20396 719 2008 2351.2 Polynomials 14180 580 1553 1501.3 Exponents 9821 474 1048 891.4 Rationals, Radicals and Complex Numbers 10263 434 825 84
Maths Mindset and Grit QuizTo address potential maths anxiety issues, a maths mindset quiz was developed for
MME1 in 2016. This educational quiz introduced students to the concepts of neuroplasticity, growth and fixed mindset, debunked ‘giftedness’ in relation to mathematics and emphasised the importance of learning from mistakes [19, 20]. This awareness can help students become more robust as learners and develop a ‘growth mindset’ in relation to studying mathematics. In 2016 the voluntary quiz was completed by only 17% of the MME1 cohort, however 89% of these participants received final grades greater than 75% (Distinction level or above). This could be a positive selection bias, that is only those students who are interested in concepts such as maths mindset would also have a positive attitude to their studies. It will be interesting to explore this learning activity longitudinally and follow individual students progress to see if the positive impact of mindset/neuroplasticity awareness that has been reported for junior and high school level students [20] also holds for engineering students. It is also possible to argue that as these are engineering mathematics students, they are unlikely to be experiencing maths anxiety issues. Dweck explains [19] that students with a fixed mindset can experience some success with maths, but will reach a ceiling because they are reluctant to push out of their safety zone to attempt more complex problems where there is a risk they might not get everything right. Therefore taking time to readjust students thinking from fixed to growth mindset in first year seems worthwhile.
In addition, a standard Grit quiz was introduced in MME1 in 2016 and 39% of students participated. On average, the participating students were ‘Mostly Gritty’. Those students who scored >75% in the Grit quiz were 90% likely to score >75% in their final marks for MME1. Of those students who scored <50% in the Grit Quiz, 40% failed, 40% passed and 20% withdrew. The Grittiness of a student has been linked to academic success [23, 24] but it is not clear if the Grit level reflects how students engage with blended, flipped and online learning opportunities.
‘Flip’ Lecture OptionIn MME1 the 2016 Coordinator’s smartboard recordings were progressively edited and
titled into 69 smaller videos from the original 13 weeks. The lectures were integrated into a weekly study plan based on a Time Budget (see Figure 2) and on average these recordings were accessed by 17% of the cohort.

127Sumário
Proceedings of the 11th Southern Hemisphere Conference on the Teaching and Learning of Undergraduate Mathematics and Statistics ISBN 978-85-8167-237-3
Figure 2: Time Budget for F2F students studying MME1
F2F lectures continue to be offered and were well attended despite lecture recordings being available. The F2F lectures were also automatically recorded and were accessed by 41% of MME1 students. From this we can conclude that many students were still self-selecting to participate in MME1 lectures in person if they possibly could and preferring recordings of the actual session over the historic recordings, as has been found in other studies [16].
For MME2, the historic lecture recordings were not available for internal students to ‘flip’, but 65% students took the opportunity to catch up or review by watching the lecture recordings as they were progressively released (Figure 3).
Figure 3: Lecture recording views by date in MME2 in 2016.
Week 1 corresponds to July 25 2016; Mid semester break is 19 September to 3 October, Swot Vac starts on 7 November and Exams start on 14 November 2016. Without parallel data for in-class attendance and the student voice it is difficult to ascertain how (or if) all students are accessing the material covered in F2F lectures. It is clear is that for a proportion of the students, the opportunity to access recordings of lectures, when they need it and as often as they need it, is a valuable component of their study program.
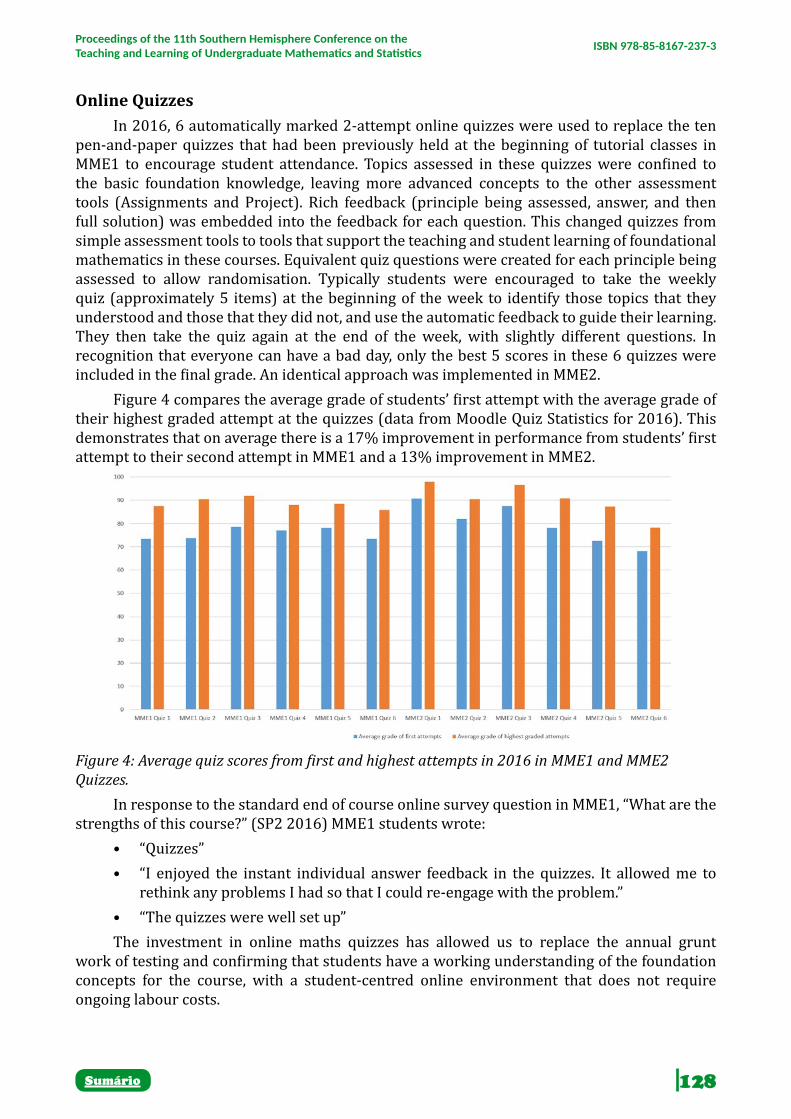
128Sumário
Proceedings of the 11th Southern Hemisphere Conference on the Teaching and Learning of Undergraduate Mathematics and Statistics ISBN 978-85-8167-237-3
Online QuizzesIn 2016, 6 automatically marked 2-attempt online quizzes were used to replace the ten
pen-and-paper quizzes that had been previously held at the beginning of tutorial classes in MME1 to encourage student attendance. Topics assessed in these quizzes were confined to the basic foundation knowledge, leaving more advanced concepts to the other assessment tools (Assignments and Project). Rich feedback (principle being assessed, answer, and then full solution) was embedded into the feedback for each question. This changed quizzes from simple assessment tools to tools that support the teaching and student learning of foundational mathematics in these courses. Equivalent quiz questions were created for each principle being assessed to allow randomisation. Typically students were encouraged to take the weekly quiz (approximately 5 items) at the beginning of the week to identify those topics that they understood and those that they did not, and use the automatic feedback to guide their learning. They then take the quiz again at the end of the week, with slightly different questions. In recognition that everyone can have a bad day, only the best 5 scores in these 6 quizzes were included in the final grade. An identical approach was implemented in MME2.
Figure 4 compares the average grade of students’ first attempt with the average grade of their highest graded attempt at the quizzes (data from Moodle Quiz Statistics for 2016). This demonstrates that on average there is a 17% improvement in performance from students’ first attempt to their second attempt in MME1 and a 13% improvement in MME2.
Figure 4: Average quiz scores from first and highest attempts in 2016 in MME1 and MME2 Quizzes.
In response to the standard end of course online survey question in MME1, “What are the strengths of this course?” (SP2 2016) MME1 students wrote:
• “Quizzes” • “I enjoyed the instant individual answer feedback in the quizzes. It allowed me to
rethink any problems I had so that I could re-engage with the problem.” • “The quizzes were well set up” The investment in online maths quizzes has allowed us to replace the annual grunt
work of testing and confirming that students have a working understanding of the foundation concepts for the course, with a student-centred online environment that does not require ongoing labour costs.
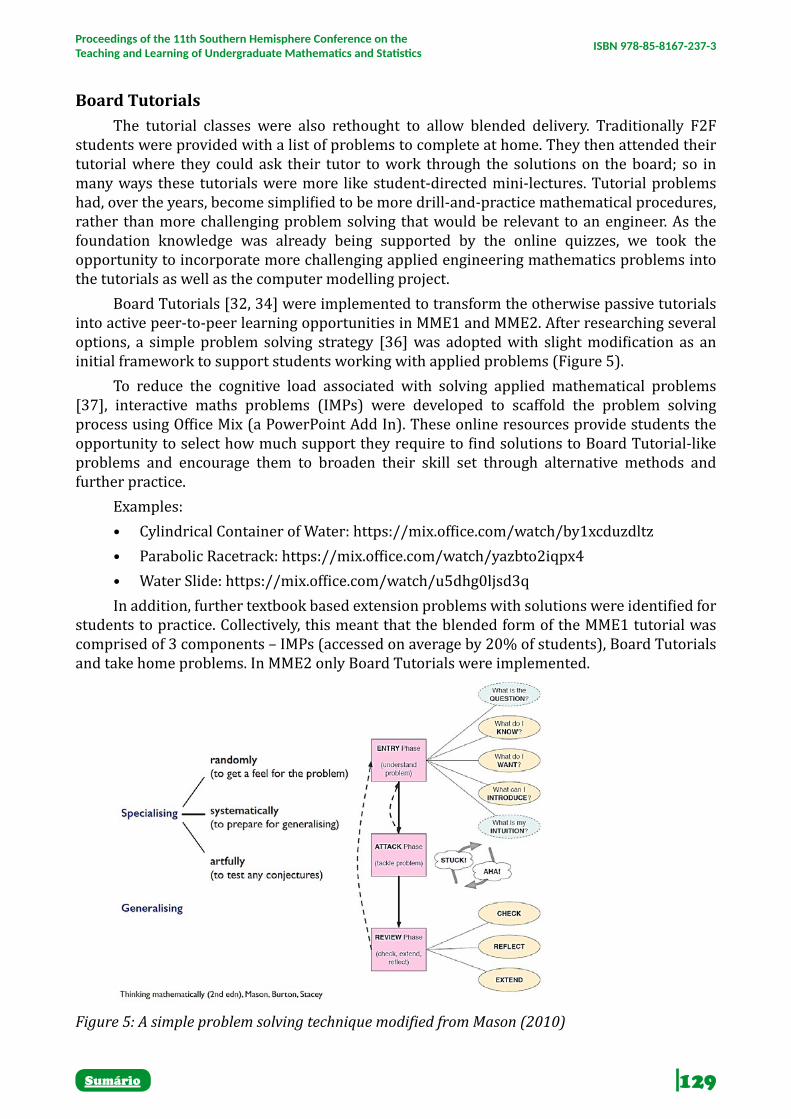
129Sumário
Proceedings of the 11th Southern Hemisphere Conference on the Teaching and Learning of Undergraduate Mathematics and Statistics ISBN 978-85-8167-237-3
Board TutorialsThe tutorial classes were also rethought to allow blended delivery. Traditionally F2F
students were provided with a list of problems to complete at home. They then attended their tutorial where they could ask their tutor to work through the solutions on the board; so in many ways these tutorials were more like student-directed mini-lectures. Tutorial problems had, over the years, become simplified to be more drill-and-practice mathematical procedures, rather than more challenging problem solving that would be relevant to an engineer. As the foundation knowledge was already being supported by the online quizzes, we took the opportunity to incorporate more challenging applied engineering mathematics problems into the tutorials as well as the computer modelling project.
Board Tutorials [32, 34] were implemented to transform the otherwise passive tutorials into active peer-to-peer learning opportunities in MME1 and MME2. After researching several options, a simple problem solving strategy [36] was adopted with slight modification as an initial framework to support students working with applied problems (Figure 5).
To reduce the cognitive load associated with solving applied mathematical problems [37], interactive maths problems (IMPs) were developed to scaffold the problem solving process using Office Mix (a PowerPoint Add In). These online resources provide students the opportunity to select how much support they require to find solutions to Board Tutorial-like problems and encourage them to broaden their skill set through alternative methods and further practice.
Examples:• Cylindrical Container of Water: https://mix.office.com/watch/by1xcduzdltz • Parabolic Racetrack: https://mix.office.com/watch/yazbto2iqpx4 • Water Slide: https://mix.office.com/watch/u5dhg0ljsd3qIn addition, further textbook based extension problems with solutions were identified for
students to practice. Collectively, this meant that the blended form of the MME1 tutorial was comprised of 3 components – IMPs (accessed on average by 20% of students), Board Tutorials and take home problems. In MME2 only Board Tutorials were implemented.
Figure 5: A simple problem solving technique modified from Mason (2010)

130Sumário
Proceedings of the 11th Southern Hemisphere Conference on the Teaching and Learning of Undergraduate Mathematics and Statistics ISBN 978-85-8167-237-3
Board tutorials were very well received by students who, in a survey in MME2, commented on their ability to learn from doing the maths themselves on the board with their partner critiquing their work, learning by watching their partner and other groups solve problems and from their tutor. Learning how to tackle problems in different ways was also valued by students. The main complaint from students was that Board Tutorial sessions were not long enough.
Student OutcomesBlended learning been well received in MME1 with a 43% improvement in the number
of students passing and a 59% improvement in overall student satisfaction rating as measured by a standard anonymous end of semester student survey from 2015 to 2016. Students wrote about the learning experiences in the end-of course survey:
• “This course is so much better than last year. It feels like the teachers actually want to teach and help make students understand every detail of a problem. There isn’t an assumption that we should know, everything is patiently explained and well taught.”
• “A fantastic course which was exciting, fascinating, and challenging.”• “It is an enjoyable course with relevant assignments. I specifically found the board
tutorials helpful.”MME2 experienced a 6% lift in the number of failures in 2016 compared to 2015 but a
5% improvement in Overall Satisfaction as measured by an anonymous end-of-course survey. Both of these courses currently enjoy the highest student satisfaction rating of all the first year engineering courses in their respective semesters.
CONCLUSIONReturning to our question, what is the optimal blend for first year engineering mathematics
students, it is unlikely that that standard ‘flip’ will work for engineering mathematics, where lectures are replaced with online versions, as it can be challenging to find an adequate substitute for the live lecture [17]. This may be because student presage factors, such as maths anxiety, Grit and fixed mindset are such that first year students do not have the correct attitude and self-discipline to be successful when dealing with learning maths and the freedom of organising to watch online lectures at a time that suits them. Time budgets can help naïve students develop better study habits [30].
Online components that can make a difference to student presage factors are quizzes. We have found online quizzes to be a useful tool that, coupled with supporting material, can level the playing field in relation to the assumed knowledge for students transitioning to university. In addition, online quizzes with rich feedback that allow 2 attempts are also an effective means to ensure the foundation knowledge in a course has been understood before more complex applications are attempted. Allowing students 2 attempts and the best 5 of 6 results is perceived as students as being fair, and thus supports the process of learning, as students develop a positive view of the learning context.
Students’ approaches to learning or process can also be optimised by using active learning approaches [16, 31]. Board Tutorial implementation has changed our passive tutorials to experiences that both students and teachers value highly. Implementing blended learning by combining the best of online learning tools and F2F learning activities can make for excellent courses provided that the focus remains on student learning rather than course delivery.
131Sumário
Proceedings of the 11th Southern Hemisphere Conference on the Teaching and Learning of Undergraduate Mathematics and Statistics ISBN 978-85-8167-237-3
AcknowledgementsDr Kerry Smith and Dr Jane Kehrwald for their help creating the Maths Mindset and Grit
Quizzes; Dr Mohammed Rizvi for the 2-attempt quizzes and Ms Stephanie Wake for the IMPs.
REFERENCESErnst & Young, University of the Future: A thousand year old industry on the cusp of profound
change. 2012: Sydney, Australia. p. 32.
Coates, H. and A.C. McCormick, Engaging University Students. International Insights from System-Wide Studies. 2014, Singapore: Springer.
Bourne, J., D. Harris, and F. Mayadas, Online engineering education: Learning anywhere, anytime. Journal of Engineering Education, 2005. 94(1): p. 131-146.
Quinn, D., et al., Learning from experience: the realities of developing mathematics courses for an online engineering programme. International Journal of Mathematical Education in Science and Technology, 2015. 46(7): p. 991-1003.
Harris, D., et al., Mathematics and its value for engineering students: what are the implications for teaching? International Journal of Mathematical Education in Science and Technology, 2014. 46(3): p. 321-336.
Smith, G.G. and D. Ferguson, Student attrition in mathematics e-learning. Australasian Journal of Educational Technology, 2005. 21(3).
Ellis, R. and P. Goodyear, Students’ experiences of e-learning in higher education: the ecology of sustainable innovation. 2013: Routledge.
Oliver, M. and K. Trigwell, Can ‘blended learning’be redeemed? E-learning and Digital Media, 2005. 2(1): p. 17-26.
Bishop, J.L. and M.A. Verleger. The flipped classroom: A survey of the research. in ASEE National Conference Proceedings, Atlanta, GA. 2013.
Hamdan, N., et al., The flipped learning model: A white paper based on the literature review titled A Review of Flipped Learning. 2013.
McLaughlin, J.E., et al., Flipped classroom implementation: a case report of two higher education institutions in the United States and Australia. Computers in the Schools, 2016. 33(1): p. 24-37.
Biggs, J., Approaches to the enhancement of tertiary teaching. Higher education research and development, 1989. 8(1): p. 7-25.
Trigwell, K. and M. Prosser, Towards an understanding of individual acts of teaching and learning. Higher Education Research & Development, 1997. 16(2): p. 241-252.
Biggs, J., What the student does: teaching for enhanced learning. Higher education research & development, 1999. 18(1): p. 57-75.
Weinberg, A., T. Fukawa-Connelly, and E. Wiesner, Characterizing instructor gestures in a lecture in a proof-based mathematics class. Educational Studies in Mathematics, 2015. 90(3): p. 233-258.
Freeman, S., et al., Active learning increases student performance in science, engineering, and mathematics. Proceedings of the National Academy of Sciences, 2014. 111(23): p. 8410-8415.

132Sumário
Proceedings of the 11th Southern Hemisphere Conference on the Teaching and Learning of Undergraduate Mathematics and Statistics ISBN 978-85-8167-237-3
Trenholm, S., L. Alcock, and C.L. Robinson, Mathematics lecturing in the digital age. International Journal of Mathematical Education in Science and Technology, 2012. 43(6): p. 703-716.
Marshall, E.M., et al., Addressing maths anxiety within the curriculum. MSOR Connections, 2017. 15(3): p. 28-35.
Dweck, C., Mindset: How you can fulfil your potential. 2012: Hachette UK.
Boaler, J., Ability and Mathematics: the mindset revolution that is reshaping education. FORUM, 2013. 55(1): p. 143-52.
Dekkers, A., N. Adams, and S. Elliott. Using technology to provide a supportive mathematical pathway into university. in 8th Delta conference on the teaching and learning of undergraduate mathematics and statistics. 2011. Rotorua, New Zealand.
Hachey, A.C., C. Wladis, and K. Conway, Prior online course experience and G.P.A. as predictors of subsequent online STEM course outcomes. The Internet and Higher Education, 2015. 25: p. 11-17.
Duckworth, A., et al., Grit: perseverance and passion for long-term goals. Journal of personality and social psychology, 2007. 92(6): p. 1087-1101.
Duckworth, A. and P. Quinn, Development and Validation of the Short Grit Scale (Grit–S). Journal of Personality Assessment, 2009. 91(2): p. 166-174.
Hernandez-Martinez, P., et al., Students’ views on their transition from school to college mathematics: rethinking ‘transition’ as an issue of identity. Research in Mathematics Education, 2011. 13(2): p. 119-130.
Trigwell, K. and M. Prosser, Improving the quality of student learning: the influence of learning context and student approaches to learning on learning outcomes. Higher education, 1991. 22(3): p. 251-266.
Wlodkowski, R.J., Enhancing adult motivation to learn: A comprehensive guide for teaching all adults. 2011: John Wiley & Sons.
Herrington, J., T.C. Reeves, and R. Oliver, Authentic learning environments, in Handbook of research on educational communications and technology. 2014, Springer. p. 401-412.
Thiel, T., S. Peterman, and M. Brown, Addressing the Crisis in College Mathematics: Designing Courses for Student Succes. Change: The Magazine of Higher Learning, 2008. 40(4): p. 44-49.
Quinn, D. and B. Wedding. Responding to diversification: Preparing naïve learners for university study using Time Budgets. in ASCILITE-Australian Society for Computers in Learning in Tertiary Education Annual Conference. 2012. Wellington, New Zealand: ASCILITE.
Martin, B., Increasing student participation in tutorials. Overview-University of Wollongong Teaching & Learning Journal, 1993. 1(2): p. 8-11.
Seaton, K.A., D.M. King, and C.E. Sandison, Flipping the maths tutorial: A tale of n departments. Gazette of the Australian Mathematical Society, 2014. 41(2): p. 99-113.
Williams, G., Blackboard tutorials in first year mathematics. Overview-University of Wollongong Teaching & Learning Journal, 1994. 2(1): p. 11-12.
Liljedahl, P., Building Thinking Classrooms: Conditions for Problem-Solving, in Posing and Solving Mathematical Problems. 2016, Springer. p. 361-386.

133Sumário
Proceedings of the 11th Southern Hemisphere Conference on the Teaching and Learning of Undergraduate Mathematics and Statistics ISBN 978-85-8167-237-3
Johnston, H., et al., Engaging students: encouraging success, in ATN Assessment Conference Adelaide, South Australia 20-21 November. 2008, University of South Australia: Australia.
Mason, J., L. Burton, and K. Stacey, Thinking Mathematically. 2010: Pearson.
Ambrose, S.A., et al., How learning works: Seven research-based principles for smart teaching. 2010, San Francisco, CA.: John Wiley & Sons.

134Sumário
Proceedings of the 11th Southern Hemisphere Conference on the Teaching and Learning of Undergraduate Mathematics and Statistics ISBN 978-85-8167-237-3
THE NEED FOR NEW ATTITUDES IN THE TEACHING – AND THE LEARNING! – OF A RELEVANT LINEAR ALGEBRA AT
UNDERGRADUATE LEVEL
Clarice Favaretto Salvador16
Instituto de Ciências Exatas e Tecnológicas, UNIP
ABSTRACTIn this work I briefly present the difficulties students must overcome when studying and trying to learn Linear Algebra as cited in the literature as well as in my professional work. In addition, I present the possibility of using Mathematical Modelling of some real-life problem-situations to introduce basic Linear Algebra, before student’s contact with abstract and theoretical definitions. I also emphasize the need for these theoretical and abstract concepts, but I use the examples to motivate their teaching and studying, after introducing some basic Linear Algebra concepts using the hopefully relevant examples provided here. I conclude by presenting possibilities of a radical change in the way Linear Algebra is considered; in syllabuses, programmes, classes and textbooks.Keywords: Linear Algebra, Math Modelling, Real Life Applications, Learning and Teaching Motivation.
INTRODUCTIONMuch has been said (and written) – although some of us refuse to pay attention... – about
the dire difficulties that undergraduate students face when they come in contact with first courses of Calculus. And rightly so! (Garzella, 2016).
But similar situations appear just as frequently with other courses and one such example is Linear Algebra (sometimes taught together with Calculus!). Students often consider Linear Algebra as excessively theoretical and abstract and, as their teachers, we haven’t been adequately able to exhibit the necessity of Linear Algebra concepts for both practical and theoretical motives (Chiari, 2015). In fact, Dorier et al (2000) formally state that in France, students’ difficulties with initial definitions (such as vector spaces and subspaces) are a severe hindrance to the learning of other aspects of Linear Algebra. Celestino (2000) studied high failure rates in Linear Algebra, classifying it as one of the “problem-disciplines” for undergraduates, in spite of being a connecting subject for many other subject themes in Mathematics, an opinion also supported by Grande (2006).
And, as with other subjects in undergraduate Mathematics courses, Linear Algebra is of paramount importance in the future work of professionals, especially in what we are used to calling the “Exact Sciences”, i.e. Technology – but in other fields as well. In many cases, Linear Algebra, with its concepts and tools, is the mainstay of applications – and of working tools in Mathematics. Besides this, Chiari (2015) describes Linear Algebra as a valuable gateway to a new and fascinating field of mathematical concepts; being both an instrument for producing a unified mathematical language, as well as introducing students to a type of mathematical reasoning that undergraduates are not familiar with initially.
Here I wish to present some motivating examples of some real-life problems’ applications, which should (or “must”) be worked on hand-in-hand with the main theoretical aspects of
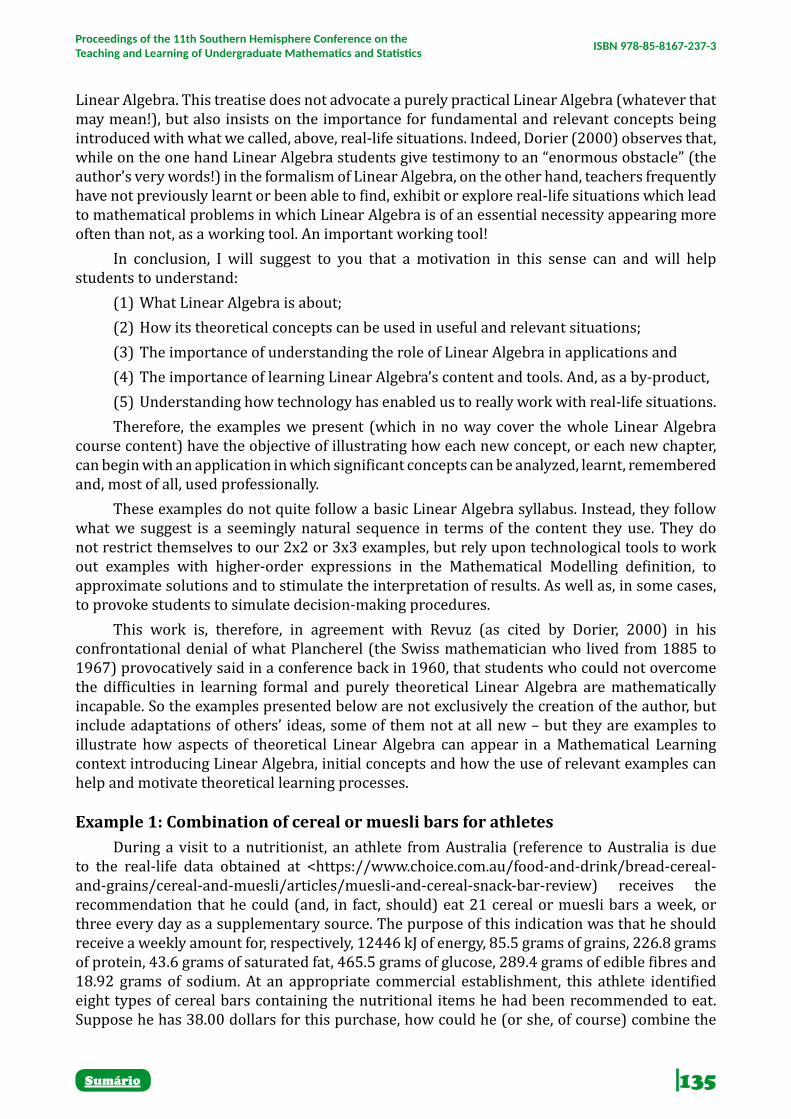
135Sumário
Proceedings of the 11th Southern Hemisphere Conference on the Teaching and Learning of Undergraduate Mathematics and Statistics ISBN 978-85-8167-237-3
Linear Algebra. This treatise does not advocate a purely practical Linear Algebra (whatever that may mean!), but also insists on the importance for fundamental and relevant concepts being introduced with what we called, above, real-life situations. Indeed, Dorier (2000) observes that, while on the one hand Linear Algebra students give testimony to an “enormous obstacle” (the author’s very words!) in the formalism of Linear Algebra, on the other hand, teachers frequently have not previously learnt or been able to find, exhibit or explore real-life situations which lead to mathematical problems in which Linear Algebra is of an essential necessity appearing more often than not, as a working tool. An important working tool!
In conclusion, I will suggest to you that a motivation in this sense can and will help students to understand:
(1) What Linear Algebra is about;(2) How its theoretical concepts can be used in useful and relevant situations;(3) The importance of understanding the role of Linear Algebra in applications and(4) The importance of learning Linear Algebra’s content and tools. And, as a by-product,(5) Understanding how technology has enabled us to really work with real-life situations.Therefore, the examples we present (which in no way cover the whole Linear Algebra
course content) have the objective of illustrating how each new concept, or each new chapter, can begin with an application in which significant concepts can be analyzed, learnt, remembered and, most of all, used professionally.
These examples do not quite follow a basic Linear Algebra syllabus. Instead, they follow what we suggest is a seemingly natural sequence in terms of the content they use. They do not restrict themselves to our 2x2 or 3x3 examples, but rely upon technological tools to work out examples with higher-order expressions in the Mathematical Modelling definition, to approximate solutions and to stimulate the interpretation of results. As well as, in some cases, to provoke students to simulate decision-making procedures.
This work is, therefore, in agreement with Revuz (as cited by Dorier, 2000) in his confrontational denial of what Plancherel (the Swiss mathematician who lived from 1885 to 1967) provocatively said in a conference back in 1960, that students who could not overcome the difficulties in learning formal and purely theoretical Linear Algebra are mathematically incapable. So the examples presented below are not exclusively the creation of the author, but include adaptations of others’ ideas, some of them not at all new – but they are examples to illustrate how aspects of theoretical Linear Algebra can appear in a Mathematical Learning context introducing Linear Algebra, initial concepts and how the use of relevant examples can help and motivate theoretical learning processes.
Example 1: Combination of cereal or muesli bars for athletesDuring a visit to a nutritionist, an athlete from Australia (reference to Australia is due
to the real-life data obtained at <https://www.choice.com.au/food-and-drink/bread-cereal-and-grains/cereal-and-muesli/articles/muesli-and-cereal-snack-bar-review) receives the recommendation that he could (and, in fact, should) eat 21 cereal or muesli bars a week, or three every day as a supplementary source. The purpose of this indication was that he should receive a weekly amount for, respectively, 12446 kJ of energy, 85.5 grams of grains, 226.8 grams of protein, 43.6 grams of saturated fat, 465.5 grams of glucose, 289.4 grams of edible fibres and 18.92 grams of sodium. At an appropriate commercial establishment, this athlete identified eight types of cereal bars containing the nutritional items he had been recommended to eat. Suppose he has 38.00 dollars for this purchase, how could he (or she, of course) combine the
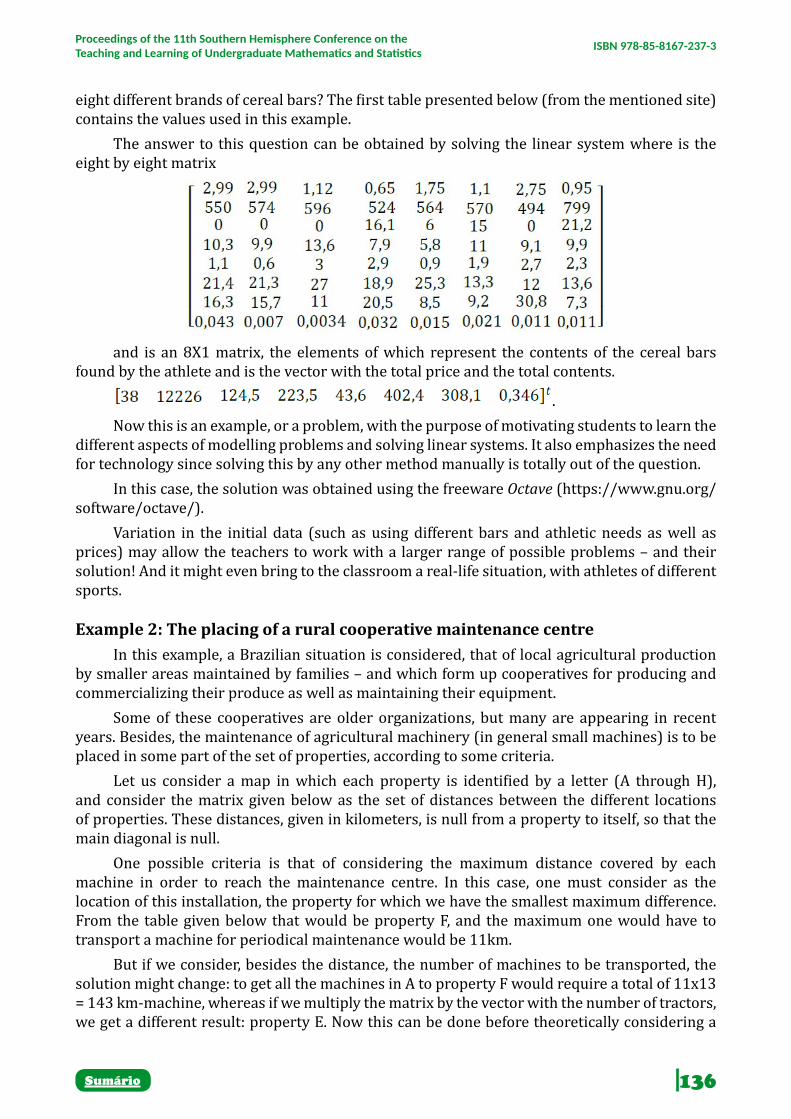
136Sumário
Proceedings of the 11th Southern Hemisphere Conference on the Teaching and Learning of Undergraduate Mathematics and Statistics ISBN 978-85-8167-237-3
eight different brands of cereal bars? The first table presented below (from the mentioned site) contains the values used in this example.
The answer to this question can be obtained by solving the linear system where is the eight by eight matrix
and is an 8X1 matrix, the elements of which represent the contents of the cereal bars found by the athlete and is the vector with the total price and the total contents.
.Now this is an example, or a problem, with the purpose of motivating students to learn the
different aspects of modelling problems and solving linear systems. It also emphasizes the need for technology since solving this by any other method manually is totally out of the question.
In this case, the solution was obtained using the freeware Octave (https://www.gnu.org/software/octave/).
Variation in the initial data (such as using different bars and athletic needs as well as prices) may allow the teachers to work with a larger range of possible problems – and their solution! And it might even bring to the classroom a real-life situation, with athletes of different sports.
Example 2: The placing of a rural cooperative maintenance centreIn this example, a Brazilian situation is considered, that of local agricultural production
by smaller areas maintained by families – and which form up cooperatives for producing and commercializing their produce as well as maintaining their equipment.
Some of these cooperatives are older organizations, but many are appearing in recent years. Besides, the maintenance of agricultural machinery (in general small machines) is to be placed in some part of the set of properties, according to some criteria.
Let us consider a map in which each property is identified by a letter (A through H), and consider the matrix given below as the set of distances between the different locations of properties. These distances, given in kilometers, is null from a property to itself, so that the main diagonal is null.
One possible criteria is that of considering the maximum distance covered by each machine in order to reach the maintenance centre. In this case, one must consider as the location of this installation, the property for which we have the smallest maximum difference. From the table given below that would be property F, and the maximum one would have to transport a machine for periodical maintenance would be 11km.
But if we consider, besides the distance, the number of machines to be transported, the solution might change: to get all the machines in A to property F would require a total of 11x13 = 143 km-machine, whereas if we multiply the matrix by the vector with the number of tractors, we get a different result: property E. Now this can be done before theoretically considering a
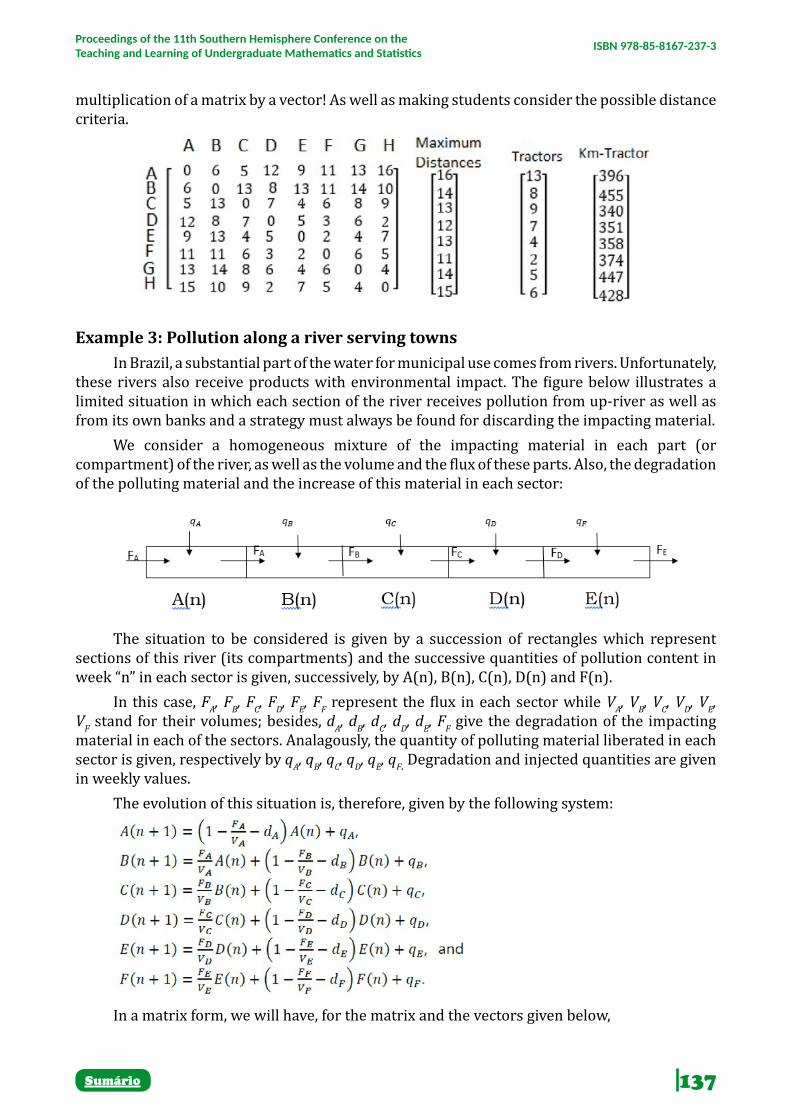
137Sumário
Proceedings of the 11th Southern Hemisphere Conference on the Teaching and Learning of Undergraduate Mathematics and Statistics ISBN 978-85-8167-237-3
multiplication of a matrix by a vector! As well as making students consider the possible distance criteria.
Example 3: Pollution along a river serving townsIn Brazil, a substantial part of the water for municipal use comes from rivers. Unfortunately,
these rivers also receive products with environmental impact. The figure below illustrates a limited situation in which each section of the river receives pollution from up-river as well as from its own banks and a strategy must always be found for discarding the impacting material.
We consider a homogeneous mixture of the impacting material in each part (or compartment) of the river, as well as the volume and the flux of these parts. Also, the degradation of the polluting material and the increase of this material in each sector:
The situation to be considered is given by a succession of rectangles which represent sections of this river (its compartments) and the successive quantities of pollution content in week “n” in each sector is given, successively, by A(n), B(n), C(n), D(n) and F(n).
In this case, FA, FB, FC, FD, FE, FF represent the flux in each sector while VA, VB, VC, VD, VE, VF stand for their volumes; besides, dA, dB, dC, dD, dE, FF give the degradation of the impacting material in each of the sectors. Analagously, the quantity of polluting material liberated in each sector is given, respectively by qA, qB, qC, qD, qE, qF . Degradation and injected quantities are given in weekly values.
The evolution of this situation is, therefore, given by the following system:
In a matrix form, we will have, for the matrix and the vectors given below,

138Sumário
Proceedings of the 11th Southern Hemisphere Conference on the Teaching and Learning of Undergraduate Mathematics and Statistics ISBN 978-85-8167-237-3
If we have to search for a situation in which the pollution remains constant equal to , we will have to solve:
and a solution exists if and only if or, if
In this example one must mention sparse matrices, lower triangular matrices, main and secondary diagonals, as well as determinants and existence of solutions. And then pass on to theoretical definitions.
Example 4: Linear TransformationsLena Söderberg is a Swedish model photographed in 1972. Her face is the most widely
used image for testing development image processing software – a fact that rendered her the title of “Internet’s First Lady”. The reason why this image of hers has been in use since 1973 is due to the richness of details, plane regions, shadows and special textures which constitute a challenge for the efficiency of the mentioned software.
The concept behind these many applications for images and objects is that of the Linear Transformation – a concept necessary for, as an example, computer games, animated cartoon softwars that deform images and even stretching or fattening images.
Images (1) and (2) can be seen as original images of Lena, the second one rotated by 45 degrees, a transformation obtained with the freeware Octave. Both these images are represented by matrices such that the position of each pixel is given by an ordered pair of natural numbers, the position in the matrix. Because of this, the command “imrotate” not only uses the product of the rotation matrix by the ordered pairs that represent each pixel, but it also adjusts the matrix so that the ordered pairs continue to be a matrix the elements of which are positive integers.

139Sumário
Proceedings of the 11th Southern Hemisphere Conference on the Teaching and Learning of Undergraduate Mathematics and Statistics ISBN 978-85-8167-237-3
Figure 1. Lena, by Octave.
Figure 2. rotation, in a counter-clockwise sense.The use of this kind of command does not, in principle, stimulate or even allow students
to establish a relationship between both matrices and the linear transformation necessary for this rotation, an aspect they will have to learn, maybe only theoretically. On the other hand it would not be rational to get the students to create their own image-transformation matrices (which are easily used in Octave). So what this example proposes is to mention that these linear transformations are the product of two matrices to be correlated with linear transformations using Lena’s example to introduce the transformation of graphs in 3-D, those of known surfaces of two-valued functions and/or their level curves. In examples like these, one can make evident the introduction of linear transformations through the use of products of square matrices by vectors as well as the transformation of matrices into vectors and vice-versa!
In figures (3), (4), (5) and (6) some examples are presented, using the function .

140Sumário
Proceedings of the 11th Southern Hemisphere Conference on the Teaching and Learning of Undergraduate Mathematics and Statistics ISBN 978-85-8167-237-3
CONCLUSIONS AND COMMENTS Revuz (2000 makes two statements concerning the learning of Linear Algebra – maybe
one should present them as difficulties. They are listed below but with the author’s comments as well:
• Linear Algebra has a widespread spectrum of applications, both theoretical and practical for professionals that must know how to use them in real-life situations or as theoretically defined tools, and
• Mathematics (and, therefore, Linear Algebra) does in no way “belong” to mathematicians, and the teaching and learning of Mathematics must consider the “toolbox” aspect of present and future uses of Mathematical concepts!
Now, in the way our syllabuses are commonly formed, the emphasis is mostly, and sometimes exclusively (in general, of course) on the theoretical aspects, and this shows up in Linear Algebra in a paradigmatic form, suggesting an issue of inappropriate didactics and a severe deficiency in developing future teachers, both for pre-university levels as well as (and especially) at undergraduate levels (Robinet, in Dorier, 2000; França, 2007). In fact, França (2007.) also mentions the most widely adopted Linear Algebra textbooks in Brazilian universities in this sense.
In spite of possibilities for enrichment of the kind presented above, while many linear algebra texts have titles which include an expression equivalent to “... and Applications” (or something similar), many of the applications therein are theoretical!
The author of this work, in her teaching activities and duties (in several different undergraduate courses in some universities), was able to confirm the problem of the general nature in the teaching of Linear Algebra (as well as of other areas) that begins with a general and theoretical overview before approaching particular and illustrative examples, while many learning processes follow exactly in the other direction.
In this aspect, the Mathematical Modelling of natural and social phenomena constitutes a challenging alternative for formal teaching, introducing real-life situations as introductory steps in order to understand and learn abstract concepts and definitions which, following the said examples, acquire mathematical and social meaning. It is described here as an alternative since it inverts the traditional way of presenting Linear Algebra and it appears as challenging because it demands that institutions, course coordinators and teachers adopt the learning of new and relevant applications.
Finally, my main objectives with this work was twofold: Firstly to present a few real-life situations, their modelling, validation, resolution and evaluation and demonstrate that such use can make Linear Algebra a mathematical subject with meaning and relevance for learners; and secondly to make Linear Algebra teachers aware of the factors of meaning and relevance in the examples they use.
Table 1. Nutrients of Cereal/Muesli Bars
Cereal/Muesli Bars A B C D E F G H
Price($) 2,99 2.99 1,12 0,65 1,75 1,1 2,75 0,95
Grains per serve (g) 550 574 596 524 564 570 494 799
Grains per serve (g) 0 0 0 16,1 6 15 0 21,2
Proteins (g/100g) 10,3 9,9 13,6 7,9 5,8 11 9,1 9,9
Saturated fats(g/100g) 1,1 0,6 3 2,9 0,9 1,9 2,7 2,3
Glucose (g/100g) 21,4 21,3 27 18,9 25,3 13,3 12 13,6

141Sumário
Proceedings of the 11th Southern Hemisphere Conference on the Teaching and Learning of Undergraduate Mathematics and Statistics ISBN 978-85-8167-237-3
Cereal/Muesli Bars A B C D E F G H
Fibres (g/100g) 16,3 15,7 11 20,5 8,5 9,2 30,8 7,3
Sodium (mg/100g) 43 7 3,4 32 15 21 11 11
Figure 3. Graph of
Figure 4. rotation, in a counter-clockwise sense
Figure 5. Shear of factor 3 in the direction of the y axis

142Sumário
Proceedings of the 11th Southern Hemisphere Conference on the Teaching and Learning of Undergraduate Mathematics and Statistics ISBN 978-85-8167-237-3
Figure 6. Enlargement by a factor of 3 in the direction of the y axis
REFERENCESCelestino, M. R. (2000). Ensino-aprendizagem da álgebra linear: as pesquisas brasileiras na
década de 90.
Chiari, A. S. S. (2015). O papel das tecnologias digitais em disciplinas de Álgebra Linear à distância: possibilidades, limites e desafios, Dissertação (Doutorado em Educação Matemática) – UNESP, Rio Claro.
D’ambrosio, U. (1999). Entrevista com Ubiratan D’Ambrosio, Revista de Educação Matemática em Revista (Sociedade Brasileira de Educação Matemática), 6(7), pp 5-10
Dorier, J L. (2000). On the teaching of linear álgebra. Dordrecht: Kluwer Academic Publishers.
Dorier, J. L.; Robert, A.; Robinet, J.; Rogalski, M. (2000). The Obstacle of formalism in linear álgebra. In: J. L. Dorier (Org.), On the teaching of linear álgebra. Dordrecht: Kluwer Academic Publishers, 2000, p 85-124.
França, M. (2007). Conceitos fundamentais de Álgebra Linear: uma abordagem integrando geometria dinâmica. Dissertação – PUC, São Paulo.
Grande, A. L. (2006). O conceito de independência e dependência linear e os registros de representação semiótica nos livros didáticos de álgebra linear. Dissertação (Mestrado em Educação Matemática) – PUC, São Paulo.
Revuz A. Prefácio. In J. L. Dorier (Org.). On the teaching of linear algebra, pp. 15-18. Dordrecht: Kluwer Academic Publishers.

143Sumário
Proceedings of the 11th Southern Hemisphere Conference on the Teaching and Learning of Undergraduate Mathematics and Statistics ISBN 978-85-8167-237-3
STUDENTS’ DIALOGUES IN STUDY OF THE DEFINITE INTEGRAL BASED ON ANALYSIS OF A PHYSICAL MODEL WITH
TECHNOLOGY
Débora da Silva Soares17
Guilherme Vier
Federal University of Rio Grande do Sul, Porto Alegre, RS, Brazil
AbsttractThe aim of this paper is to analyse the dialogues developed by students when reflecting on the concept of the definite integral, based on the analysis of a mathematical model for the phenomenon of free-fall. The context of the research is an extension course offered to Mathematics Majors students from the University of Rio Grande do Sul State, Brazil, which proposed the study of Differential and Integral Calculus concepts based on the analysis of the aforementioned mathematical model. The research is qualitative and is based on the studies of Alrø and Skovsmose [1] about communication in Mathematics classrooms. Two patterns of communication were identified: inquiry co-operation; and what we called conduction, performed by one of the students. In addition, we observed the participation with and reorganization by the software of three dialogical acts: getting in contact, challenging and evaluating. Keywords: teaching of Calculus; mathematical modelling; digital technologies.
INTRODUCTIONIn Soares and Vier [2] we presented a first analysis of dialogues developed by students
while analysing a mathematical model of the free fall phenomenon and discussing some Differential and Integral Calculus concepts in this context. These activities were proposed in an extension course designed and offered to Mathematics Majors of a public University at Rio Grande do Sul State, Brazil. The aim of this course was to develop Calculus concepts based on the analysis of a mathematical model of the free fall phenomenon with the use of software Modellus.
This first analysis focused on a task aimed at studying the influence of the parameters of the model in the behaviour of the model’s solutions and pointed out two moments: “one characterized by the communication pattern of quizzing and the other characterized by the inquiry cooperation” [2, p.1]. In this paper, we seek the same aim: to analyse the dialogues conducted by students working in the learning environment characterized above. Our focus, however, is another task: Task 4, in which students are invited to think about relationships that involve the concept of the Definite Integral.
The analysis is based on data collected through audio recording of students’ dialogues while solving this task and field notes developed by the researchers. As detailed in Soares and Vier [2], the extension course was composed of five tasks, which involved the study of different Calculus concepts based on the analysis of the mathematical model. Four students participated and they worked in pairs or in a group of three, according to whom was present.
144Sumário
Proceedings of the 11th Southern Hemisphere Conference on the Teaching and Learning of Undergraduate Mathematics and Statistics ISBN 978-85-8167-237-3
The analysis of students’ dialogues developed in this learning environment is important to help us to understand the possibilities and limitations of the teaching approach and also to comprehend the nature of reflections about Calculus concepts students develop. Keeping this in mind, we advance another step in this direction.
Technologies and Dialogues in Mathematics EducationThe tasks of the course were based on the ones proposed in Soares [3] and Soares and
Borba [4], who proposed that the central role of the software was to offer students access to the model’s solutions and to work as a laboratory where students could develop experiments about the phenomenon. It is important to emphasize that this is a fundamental role of the software and a fundamental aspect of this proposal, since the mathematical model analysed by students involved Ordinary Differential Equations, a subject not yet studied by them.
We emphasize this role played by the software because we understand that media has a central role in the processes of knowledge production, as proposed by the humans-with-media construct [5]. We also understand that media reorganize our thinking [5] according to the possibilities and restrictions they offer us. In this sense, we consider that the learning environment that composes the extension course - Model Analysis with the use of software - is a reorganization of Mathematical Modelling [6].
The humans-with-media construct considers that the unit of knowledge production is a collective composed by humans and media, such as oral communication, pencil and paper, computers, software, etc. According to Alrø and Skovsmose [1, p.130], “The notion of humans-with-media also plays an important role in understanding the notion of dialogue, as well as the risks associated with dialogue”. In fact, the collective of “humans” being part of the unit of knowledge production reflects the understanding that communication and dialogue are important in learning. In addition, “media” being part of the same unit reflects the understanding that learning processes involve some kind of medium (or technology).
Alrø and Skovsmose [1] present the following characterization of a dialogue: “as a process involving acts of getting in contact, locating, identifying, advocating, thinking aloud, reformulating, challenging and evaluating” [1, p.135]. In the following we summarize the main ideas that characterize each of these dialogical acts.
• Getting in contact means paying attention to the colleague’s contributions and perspectives. Good mood, check questions and tag questions are examples of how this dialogical act can be perceived.
• “Locating means to discover something that was unknown or unconscious before” [1, p.106]. It involves experimentation, and the proposition and analysis of hypothetical questions.
• Identifying is related “to make a perspective known by all involved in the investigation” [1, p.109]. It involves the crystallization of mathematical ideas and justification of perspectives.
• Advocating means arguing, reasoning, defending a perspective. At the same time it means to be open to receive criticism and to investigate this perspective with colleagues.
• “Thinking aloud means to express thoughts, ideas and feelings during the process of investigation” [1, p.113]. Through the process of thinking aloud it is possible to share and to make public a perspective.

145Sumário
Proceedings of the 11th Southern Hemisphere Conference on the Teaching and Learning of Undergraduate Mathematics and Statistics ISBN 978-85-8167-237-3
• “Reformulating means to repeat what has been said with slightly different words or with a different tone of voice” [1, p.114]. It can involve checking questions or the complementation of half-sentences, and it is an important process to keep contact.
• “Challenging means trying to take things in another direction or questioning knowledge or perspectives already established” ([1, p.115]. It can involve hypothetical questions and has an important role in promoting the analysis of new possibilities.
• “Evaluating presupposes support, critics and constructive feedbacks” [1, p.117]. It may assume different forms and can be developed by the students or by the teacher.
These dialogical acts compose what Alrø & Skovsmose [1] call the Inquiry Co-operation Model, which describes the pattern of communication that is present in investigative approaches. In the following section, we are going to use this model as an analytical resource to identify the communication patterns developed by the students while working in one of the tasks proposed in the course.
DATA ANALYSISThe aim of Task 4, which will be the focus of analysis in this paper, is to work with the
concept of the definite integral, taking as a base the relations between acceleration, velocity and displacement of a falling object. The task is composed of ten questions, of which we will analyse Q4, Q5 and Q6. On the day when this task was given, students E1, E2 and E3 were present. The three students solved the first three questions and, after that, student E3 left, so question 4 was solved only by students E1 and E2.
The first two questions aimed to resume the relationship between acceleration and velocity of a falling object, in order to identify the acceleration in an instant of time as the derivative of the velocity function and to determine the law of acceleration function. The purpose of question 3 was the inverse process: from the graph of acceleration function, how to determine the change of the object’s velocity in certain time interval? The idea of question 3 is that students propose their strategies. E1, E2 and E3 wrote , taking as a base the
differential equation . Following this, question 4 described a possible strategy to solve this problem, as we can see in the following.

146Sumário
Proceedings of the 11th Southern Hemisphere Conference on the Teaching and Learning of Undergraduate Mathematics and Statistics ISBN 978-85-8167-237-3
4) A possible strategy that helps us to answer the previous question is to remember that a = Δv/Δt, where it follows that Δv = a·Δt. In the graph axt, this corresponds to the area of region R delimited by curve a(t), by the axis of the abscissa, and by the vertical lines that define the time interval. Lets observe this relationship from the table below, whose first column corresponds to a given time interval Δt, the second column must be completed with the calculation of the area of region R, and the third column must be completed with the calculation ∆v=vf – v0, where vf means the value of the velocity of the falling object in the final instant of the given time interval.
Δt = [0,tf] Area of region R delimited by a(t), horizontal axis, line t=0 (vertical axis) and line t=tf
Δv = vf - v0
[0,1]
[0,2]
[0,3]
[1,2]
Based on the completion and analysis of the above table, please comment on:
a) What is the relation between the value of the area of region R and the value of the change of velocity ∆v, in each time interval?
b) What is the type of region for which it was calculated the area in the time intervals of type [0,t]? And for the interval [1,2]?
c) In general, how it would be the calculation of the change of velocity in a time interval of the type [0,t] considering the area under the curve? And for any time interval [t0,t]?
Figure 1. Statement of question 4. Source: researcher’s collection.
Figure 2. Graphics of position (red), velocity (purple), acceleration (green), and table of their respective values over time. Source: researcher’s collection.
E1 and E2 read the fourth question and confirmed the graphs that are plotted in the software, identifying the graph of position and the graph of velocity. Continuing, they plotted the graph of acceleration and called the professor in order to clarify the statement of the question. As we can see in Figure 2, the graph of a(t) is a straight line, and the statement of the question mentions “the area under the curve”, an expression that generated doubt in the students, who did not understand that “curve” referred to a general way of describing the graph of a function. In consequence, this doubt led to a difficulty in identifying the region that was under analysis and of which area they should calculate. The professor explained that the region was between the graph of a(t) and the axis of abscissa, and between a determined time interval. The students

147Sumário
Proceedings of the 11th Southern Hemisphere Conference on the Teaching and Learning of Undergraduate Mathematics and Statistics ISBN 978-85-8167-237-3
tried to understand the perspective presented by the professor, as showed in the following excerpt.
E1: So, it would be the region? That’s it?P: Yes.E2: Oh, here, all this?P: From the straight line with the horizontal axis, there from a t [E2: Oh, ok.] with the
vertical straight lines. E1: It will be a rectangle.P: In this case it will be a rectangle.E1: The problem was the curve.E2: [laugh] Yes, I thought it was the graph of position. [laugh]In this first excerpt, we observe that the professor presents vantage points18 of the
question when she explains to the students that the term “curve” refers to the “graph of the function a(t) and also when explaining the region for which they should calculate the area. In the attempt to comprehend the perspective presented by the professor, E1 plays the dialogical act of reformulate, in so far as she proposes check questions. The professor’s answer to these questions corresponds to evaluate. In the end of the excerpt we observe E1 saying that the problem was the word “curve” and E2 complements asserting that he had understood that the question referred to the graph of position function, instead of the acceleration function. They laugh, which illustrates the good mood, a way of keeping contact.
Still in this excerpt, we can observe that all the processes of dialogue occurred were based on the graphs plotted by the software, which provides the results of the mathematical model [3]. Following the plotting of graphs, we observe the students confirming which graph referred to which function, which we could interpret as getting in contact, but this time with the software. Alrø and Skovsmose [1, p.105] also characterize this dialogical act as “a way of building rapport with the colleague and his perspectives”. In this sense, we understand that the software reorganizes this dialogical act once students were building rapport with the information presented by it. This suggests that students-with-Modellus get in contact.
In the following example, while the professor presents the vantage point and the students present their check questions, the software remains in the background, providing information about the model in graphic form, which is used as a reference to the identification of the rectangular region from which they have to calculate the area.
Following this first moment, the professor leaves and the students get back to the question, collecting the necessary values through the software and completing the second column of the table calculating (tf-ti)×(9,8) for each given time interval. Then, they re-read the statement of the question and confirm that the third column of the table has to be filled with the variation of the velocity in each interval. The students observe, even before completing the table, that the value of the area of each region coincides with the value module of the variation of the velocity in the respective interval, as the following excerpt shows.
E2: It is the velocity, it makes sense, right? The area in this interval is 9.8 and the velocity is -9.8.
E1: Yes, it has the pattern of the velocity.E2: -19.6 [E1: Yes.], - 29.4 and so on.
18 “A vantage point provides an overview of the task and gives some meaning to it” [1, p.32]

148Sumário
Proceedings of the 11th Southern Hemisphere Conference on the Teaching and Learning of Undergraduate Mathematics and Statistics ISBN 978-85-8167-237-3
E1: It is the same, you notice that the intervals change and that areas, ok, but it is the final velocity minus the initial velocity, it is the variation, it is only the variation.
In this excerpt, we observe a crystallization of mathematical ideas, in so far as students calculate the area of each rectangle relative to each time interval using the formulae of the area. The crystallization of mathematical ideas indicates the dialogical act identifying, that is, the students identify the formulae of the rectangle area as adequate to determine the area of the region under the curve a(t). In addition, we observe that students compare the values found for the area with the values of the variation of the velocity in each time interval, that is, they use information provided by the software to evaluate their conjectures, which means that the software participates in this dialogical act. In this sense, students-with-Modellus evaluate.
The students took all the meeting to finish question 4. In the following meeting E1, E2 and E4 were present. Initially, E1 and E2 explained to E4 what they had answered for questions 3 and 4, and E4 sought to understand their answers and agree with their reasoning. Following this, they started question 5.
5) Consider, now, the graph of vxt. How to determine, from this graph, the displacement (variation of the object’s position in a time interval) of the falling object in a given time interval? Explain your strategy, justifying your answer.
Figure 3. Statement of question 5. Source: researcher’s collection.E2: Position of the object in a given instant of time, displacement, variation of the position...E4: Yeah, is that for us to determine the velocity, it is going to be the area under that
straight line, right, but to determine the position, it is the area under that curve [v(t)], isn’t it?E2: Yeah, it makes sense…E1: It is this, right.E2: But... / E4: But it doesn’t make sense to say that the velocity is the area under the
straight line that is inclined is you don’t say the same thing to the position, because on is a branch of a parabola and the other is a straight line, but it is the same graph, is the same… they are the same coordinates right, it is g by t, for both of them.
E2: But it looks like they’ve erased everything [laugh].E4: No, look, here [question 4], even without seeing the graph, you said that it was the
area and, in fact, it is the area under this small straight line [graph of a(t)] [...]E2: Yes...E4: Why it wouldn’t be the area, right? In this initial section of the resolution of question 5, we observe a change in the students’
pattern of communication. After reading the statement of the question, E2 begins a process of thinking-aloud, but he is soon interrupted by E4, who presents his conjecture that the position would be determined from the calculation of the area under the graph of the function velocity. Students E1 and E2 seems to agree, but aren’t able to formulate a complete reasoning once E4 presents other two ways of argumentation, apparently with the aim of clarifying his perspective. In the first one, he seems to base his argument on the relation between acceleration, velocity and position of an object, affirming that, if the variation of the velocity corresponds to the area under the graph of a(t), then the variation of the displacement must correspond to the area under the graph of v(t). In the second, he resumes the answer of his colleagues to question 4, reinforcing his first argument.
Alrø and Skovsmose [1] assert that this process of seeking several lines of argumentation presupposes advocating. According to the authors, “Advocating means to say what you think

149Sumário
Proceedings of the 11th Southern Hemisphere Conference on the Teaching and Learning of Undergraduate Mathematics and Statistics ISBN 978-85-8167-237-3
and at the same time being receptive to the criticism about your positions and assumptions” [1, p.112]. This last aspect is highlighted by the authors who affirm that its absence characterizes the vindication, “which corresponds to trying to convince the other the you are right, without seeking for a justification” [1, p.112]. The communication developed by E4 seems to have aspects from both advocating and vindication: at the same time, he seeks several ways of argumentation and presents check questions, he seems to try to convince his colleagues of his opinion, but he doesn’t give time for them to develop a more complete reasoning. The justifications are all presented by E4, who conducts the debate with certain authority.
In the last sentence of this excerpt, E4 seems to challenge his colleagues asking “Why it wouldn’t be the area, right?” According to Alrø & Skovsmose [1, p.116] “a challenge may occur through a new positioning or through a review of perspectives that are already consolidated” (highlighted by the author). In this sense, the question presented by E4 could be understood as a challenge; it seems to propose a reflection about the perspective already consolidated that the variation of the displacement corresponds to the area under the graph of v(t). However, taking in account the communication pattern we have identified, we interpret this question as being rhetorical, another way of argumentation and convincing colleagues and not a way to propose discussion about the relation between the average velocities and the corresponding areas under the curve.
After the proposition of the question by E4, E2 completes a brief reasoning before E4 formulates another argumentation to justify his perspective, as we can see in the following section.
E2: We are representing, ãhhh, to represent the displacement of the falling object in a given time interval, it is this by this, right?
E4: Hm?E2: Two, he has fallen this far till here, it makes sense to be the area.E4: What is it? E1: A triangle.E4: Yes, the triangle is the [graph] of the velocity. Because the position in relation to the
acceleration is quadratic, right? [E1: It is positive. Yes.] And the velocity is linear. Because of that it cannot be a triangle, right? [E1: Yes.] The position. Actually, it is to integrate here, that curve [E2: Uhum].
In this excerpt, it seems to us that E2 elaborates a mental calculation to determine the variation of the displacement in an interval to compare with the area under the graph of v(t) in the same interval. This statement by E2 can be interpreted as thinking-aloud, but also as locating, once he shares his thoughts, which is a test, and experimentation of values, attempting to convince himself that the relation pointed to by the colleague is true. E4 agrees with E2, getting in contact through active listening and a question: “What is it?”. With this question, he seeks to clarify the area from which region E2 is calculating. The answer given by E1 “A triangle” suggests that he is also keeping contact. Taking this information as a base, E4 elaborates a justification, affirming that the triangular region is found under the graph of the velocity, because it is a linear function. In addition, according to E4, the region under the graph of the position cannot be a triangle, because it is quadratic. Finally, he asserts that the calculation of the area corresponds to integrate the function velocity. The search for a justification is related to the dialogical act identifying.

150Sumário
Proceedings of the 11th Southern Hemisphere Conference on the Teaching and Learning of Undergraduate Mathematics and Statistics ISBN 978-85-8167-237-3
We observe in this excerpt a second change in the communication pattern, resuming the inquiry co-operation. However, this resumption is temporary, once E4 returns to lead the debate during the process of writing the answer19. During this process E4 comments the following.
E4: Haven’t you done anything in GeoGebra as well?E2: Oh, I didn’t know it had that! E4: Yes, I have looked [the task] yesterday. We have to do a lot of things today.We observe that E4 comments to his colleagues about the other questions in Task 4,
affirming he had looked the task the day before the meeting. This suggests to us that the change in the communication pattern is due to this fact, because when E4 justifies his perspective in several ways without giving time to his colleagues to reflect more calmly about them, he is considering that they still have a lot of things to do in this meeting and also takes in consideration the ideas he has developed about the questions when he have looked it. That is, E4 already knows where they should arrive and is concerned with the available time. In this sense, E4 leads the colleagues through the presentation of his arguments.
The same communication pattern remains during the solution of question 6, which proposes the students develop a strategy to determine the area under the graph of function s(t) in a given time interval. After reading the question, the students set Modellus to visualize only the graph of s(t). Initially, the students spontaneously remembered that the calculation of the area under a curve is related to the concept of the definite integral. Following this, they keep thinking about the question.
E2: We can determine the area under the curve also analysing this axis here, look, we can do like this, right, from the interval [point] a to the interval [point] b.
E1: We are going to take the interval, for example from 1 to 2. E2: Yes... We can see very well here, look, it has a straight line there, right, look, how do we
do a zoom here? What have I done here?E4: Give a ctrl – [laugh]. It is distancing. E2: Teacher, please, some help here [laugh]. Oh, it came back, it came back.E1: We have lost the graph. In this excerpt, we observe that students E1 and E2 begin the dialogical act of locating,
once they start to make tests, experiment and examine possibilities. In this process, E2 zooms in on the graph which causes the graph to disappear from the graphic window. They call the professor, who explains how they have to proceed to visualize the graph again. The professor observes something different in the graph and comments to the students, as follows.
19 Due to the available space it was not possible to present all the excerpt of dialogue related to the response written process.

151Sumário
Proceedings of the 11th Southern Hemisphere Conference on the Teaching and Learning of Undergraduate Mathematics and Statistics ISBN 978-85-8167-237-3
Figure 4. Graphics A and B of s(t) (in red). Source: researcher’s collectionP: This straight line there, have you change the interval of delta?E4: It shouldn’t be a curve? A branch of a parabola?E1: Maybe here it is closer.P: This is the graph of which function? The position?E4: The position.P: Go to independent variable. [laugh] Set 0.1 so that it varies more continuously.E2: Aah, I got it...E4: Yeah, right. The parabola, it is still a sequence of straight lines. [E1: Yes.] E2: With a bigger interval, it is easier to see, right, but then we have this, this...E4: You see that branch of straight lines, then you bug, right, to you it is a branch of
parabola.P: A parabola is approximated by line segments. E4: Wow. E2: Cool, right?As we can observe in Figure 4A, students were analysing a graph of the positions that
were made by a sequence of line segments. The students’ doubt about the zoom allowed the professor to note the situation and to confirm with them the value they were using as “delta”, that is, the value of the increment Δt used by the software to construct the graph of a solution. The change of this value as suggested by the professor generated the graph in Figure 4B.
What is called to our attention in this excerpt is that students don’t notice the graph was different than expected; in fact, E2 was going to suggest using the line segments as a base to solve the question. The intervention of the professor explaining how to change delta ends up being a vantage point of the question, because it clarifies an aspect that would directly affect the solution of the problem. In fact, if the graph remained segmented, students would probably identify a trapezoid as the region under the curve, which could be solved again only with geometry.
Another aspect to highlight is that the situation with the zoom led to a discussion about the approximation of a parabola by line segments. Although the content of this debate is not

152Sumário
Proceedings of the 11th Southern Hemisphere Conference on the Teaching and Learning of Undergraduate Mathematics and Statistics ISBN 978-85-8167-237-3
properly related to the proposed question, we can interpret this situation as challenging. As defined by Alrø and Skovsmose [1], challenging is related to taking the debate in another direction. In this sense, the use of zoom unfolded as a challenge; that is, the feedback given by the software was the trigger to the reflection, so that we can understand the software as a participant in this dialogical act. Even more, once again we can understand that the software reorganizes the act of challenging, as it allows new ways of challenging from the manipulation of graphs. In this sense, this may be described as a “students-with-professor-with-Modellus challenge”.
FINAL CONSIDERATIONSAs we can observe in the data analysis, two communication patterns were present during
the solution of Task 4. In the solution of question 4 we identified the following dialogical acts: getting in contact, reformulating, identifying, evaluating, and a vantage point. As a consequence, we understand that this communication pattern is characteristic of the model of inquiry co-operation, that is, a dialogue in the sense developed by Alrø and Skovsmose [1]. This same pattern was also noticed in part of the solution of question 5, where we identified the dialogical acts of locating, getting and keeping contact. However, during most of the solution of question 5 and also in the solution of question 6 we observed a change in this pattern, once E4 started to conduct the debate.
In Soares and Vier [2] we also identified a change in the communication pattern, however in this case from quizzing to dialogue. Alrø and Skovsmose [1] identify quizzing as the communication pattern more present in a traditional class. According to the authors, this type of communication occurs, in general, when the teacher already knows where he wants to arrive and tries to conduct students to this same destination. As we mentioned in the data analysis, it seems to us that E4 started to conduct the debate by already knowing where they should arrive, because he has thought about the question before the course meeting. Despite this, our understanding is that this conduction is not characterized as quizzing, because he doesn’t propose questions to be answered by his colleagues, but presents his perspective through different ways of argumentation, keeping the focus on the resolution of the question.
Another aspect observed in Soares and Vier [2] and that is repeated in this analysis is the participation of the software in the dialogical acts. Previously, we have identified two dialogical acts: challenging and evaluating. Now, besides these two, we also observed getting in contact. When we refer to the software participating in these dialogical acts, we rely on the notion of humans-with-media [5], that is, we understand that students-with-Modellus: get in contact when they rapport their perspectives; challenge when they change the direction of things; and evaluate when they confront results. This corroborates Alrø and Skovsmose [1], who identify the computer generating new ways of thinking aloud; we understand that the software Modellus reorganized the aforementioned dialogical acts, according to the feedback given by generating new ways of getting in contact, challenging and evaluating: pointing to the computer screen, collecting data from tables and graphs provided by the software, changing the zoom of the graph and delta, and changing parameters of the model.
Finally, we observe that during these different communication patterns students reflected about mathematical concepts. In our understanding, they crystallized some mathematical ideas, that is, they were able to “recognize a principle or mathematical algorithm that emerged from the joint process of perception” [1, p.109]. However, we observe that the most general crystallization, that is, the one that refers to how to calculate the area of a curve whose geometrical form we don’t know, happens when the communication pattern is conducted by E4. In this sense, it doesn’t seem to develop in a joint process of perception.

153Sumário
Proceedings of the 11th Southern Hemisphere Conference on the Teaching and Learning of Undergraduate Mathematics and Statistics ISBN 978-85-8167-237-3
REFERENCES[1] Alrø H, Skovsmose O. Diálogo e Aprendizagem em Educação Matemática. [Dialogue and
Learning in Mathematics Education] 2nd ed. Minas Gerais: Autêntica Editora; 2006. Portuguese.
[2] Soares DS, Vier G. [The dialogue in an environment of model analysis and technologies: fall of an object with air resistance.] Educere et Educare. 2017;12(24):1-16.
[3] Soares DS. Uma Abordagem Pedagógica Baseada na Análise de Modelos para alunos de Biologia: qual o papel do software? [dissertation] Rio Claro (SP): State University of São Paulo; 2012.
[4] Soares DS, Borba MC. The role of software Modellus in a teaching approach based on Model Analysis. ZDM. 2014;46(4):575-587.
[5] Borba MC, Villarreal ME. Humans-with-Media and the Reorganization of Mathematical Thinking: information and communication technologies, modeling, experimentation and visualization. New York (NY): Springer, 2005.
[6] Soares DS. Model Analysis with Digital Technologies: a “hybrid approach”. In: Stillman GA, Blum W, Biembengut MS, editors. Mathematical Modelling in Education Research and Practice: cultural, social and cognitive influences. Cham: Springer, 2015. p. 453-463.

154Sumário
Proceedings of the 11th Southern Hemisphere Conference on the Teaching and Learning of Undergraduate Mathematics and Statistics ISBN 978-85-8167-237-3
AN INQUIRY-ORIENTED APPROACH TO A GUIDED REINVENTION OF EIGENTHEORY
Megan Wawro20
Virginia Tech
Michelle Zandieh
College of Technology and Innovation
David Plaxco
Clayton State University
AbstractThe Inquiry-Oriented Linear Algebra (IOLA) curricular materials are designed to be used for a first course in linear algebra at the university level. Many of the tasks in the IOLA materials are created to facilitate students engaging in task settings in such a way that their mathematical activity can serve as a foundation from which more formal mathematics can be developed. The materials include rationales for design of the tasks, suggestions for promoting student and instructor inquiry, and examples of typical student work. In the submission, we illustrate the IOLA materials by summarizing aspects of student work on a task sequence that supports students’ reinvention of diagonalization and eigentheory. Keywords: eigentheory; inquiry; guided reinvention; linear algebra
INTRODUCTIONThere is mounting evidence documenting the positive effects of active learning in
undergraduate Science, Technology, Engineering, and Mathematics (STEM) courses on student learning, success, persistence, and attitudes (e.g., [1]). Indeed, a recent joint statement from the Conference Board of the Mathematical Sciences in the United States [2], signed by fifteen leaders of national mathematics and mathematics education organizations, stated that this approach is appropriate and warranted in university mathematics courses. In addition, the 2016 White House Office of Science and Technology Policy called for more active learning approaches in STEM courses at the university level [3].
Towards meeting this need, the Inquiry-Oriented Linear Algebra (IOLA) project focuses on developing student materials composed of challenging and coherent task sequences that facilitate an inquiry-oriented approach to the teaching and learning of linear algebra. The project has also developed instructional support materials to help instructors implement the IOLA tasks in their classrooms.
Theoretical FramingInquiry-oriented instruction is a form of active learning in which students contribute to
the reinvention of important mathematical ideas; this contrasts with forms of active learning in which students’ activity is marked by practicing or applying principles that have already been explained or demonstrated by the instructor. We think about inquiry both in terms of what students do and what instructors do in relation to student activity. On the one hand, students

155Sumário
Proceedings of the 11th Southern Hemisphere Conference on the Teaching and Learning of Undergraduate Mathematics and Statistics ISBN 978-85-8167-237-3
learn mathematics through inquiry as they work on challenging problems that engage them in authentic mathematical practices, such as symbolizing or defining. On the other hand, instructors engage in inquiry by listening to student ideas, responding to student thinking, and using student thinking to advance the mathematical agenda of the classroom community [4, 5]. This approach to inquiry is closely aligned with the principles of inquiry-oriented instruction [6] and is compatible with how Inquiry-Based Learning is characterized [7, 8].
The IOLA materials are guided by the instructional design theory of Realistic Mathematics Education (RME) [9]. A central tenet of RME is that mathematics is a human activity. IOLA is guided by the two RME heuristics of guided reinvention and emergent models. The notion of guided reinvention emphasizes the active role an instructor plays in utilizing student ideas and justifications to move forward the mathematical development of the class. The notion of emergent models emphasizes that classroom endeavors should support students in developing models of their mathematical activity that can in turn be used as models for subsequent mathematical activity. In keeping with these heuristics, the task sequences we designed to support students in making progress toward a set of mathematical learning goals. In IOLA, students’ activity evolves toward the reinvention of formal notions and ways of reasoning about the mathematics initially investigated.
Literature Review Thomas and Stewart [10] found that students struggle to coordinate the two different
mathematical processes captured in Ax = λx (matrix multiplication versus scalar multiplication) to make sense of equality as “yielding the same result,” an interpretation that is nontrivial or novel to students [11]. Furthermore, students have to keep track of multiple mathematical objects when working on eigentheory problems, all of which can be symbolized similarly; for instance, the zero in (A − λI) x = 0 refers to the zero vector, whereas the zero in det(A - λI) = 0 is the number zero.
Some posit that the processes and objects students struggle to coordinate may prevent them from making the needed symbolic progression from Ax = λx to (A − λI) x = 0 [10]. In their genetic decomposition of the eigenvalue, eigenvector, and eigenspace concepts, Salgado and Trigueros [12] also point out the importance of developing an understanding of the equivalence of the two equations through a coordination between Ax = λx and solutions to a homogeneous system of equations. Our own work has indicated that student reasoning when solving problems involving eigenvectors and eigenvalues may be influenced by reliance on or preference for either (A − λI) x = 0 or Ax = λx [13].
Instructors often move back and forth between geometric, algebraic, and abstract modes of description, but this is often not within the cognitive reach of students [14]. In fact, [10] found students in their study primarily tended to think of eigenvectors and eigenvalues symbolically and were confident in matrix-oriented algebraic procedures, but the majority had no geometric or embodied views. In contrast, other researchers demonstrated that students could develop geometric ways of understanding eigentheory when engaged in geometrically-oriented tasks [5, 15, 16].
Building on this research, we developed an instructional sequence for learning eigenvalues and eigenvectors to mitigate issues that students might have with the equation Ax = λx. Rather than approaching eigentheory instruction by beginning with that formal equation, the sequence uses geometric notions of stretch factors and stretch directions of a linear transformation.

156Sumário
Proceedings of the 11th Southern Hemisphere Conference on the Teaching and Learning of Undergraduate Mathematics and Statistics ISBN 978-85-8167-237-3
Research SettingOur research program on student reasoning about linear algebra is grounded in the
design-based research paradigm of classroom-based teaching experiments [17, 18], which involves a cyclical process of (a) investigating student reasoning about specific mathematical concepts and (b) designing and refining tasks that honor and leverage students’ ideas towards accomplishing the desired learning goals [19]. At present, three units comprise the IOLA materials. These units, which were designed according to RME, are a product of our research over the last decade in the teaching and learning of linear algebra. Each unit is grounded in our findings regarding how students understand concepts in linear algebra [e.g., 5, 18, 20, 21, 22, 23]. The three current units are:
• Unit 1: Linear Independence and Span • Unit 2: Matrices as Linear Transformations • Unit 3: Change of Basis, Diagonalization, and Eigentheory All materials focus on developing deep conceptual understanding of particular
mathematical concepts and how the concepts relate to each other. Each unit is composed of a sequence of four tasks. The units are independent from each other; however, if an instructor used all three, a sizable portion of topics that one would expect to address in an introductory level linear algebra course in �n would be explored.
In this submission, we summarize aspects of student work on an IOLA task sequence that supports students’ reinvention of diagonalization and eigentheory. The data we present here come from two different classroom teaching experiments [10], with two different teachers, conducted in a first course in linear algebra during Fall 2014 at a large public mid-Atlantic university in the United States. The data sources were student work written on group white boards, created during class as students worked on Unit 3 Task 3.
IOLA Unit 3: Diagonalization and EigentheoryThe main learning goal of Unit 3 is to support students’ guided reinvention of change of
basis, diagonalization and eigentheory. Four tasks comprise this unit:• Task 1: Builds from students’ experience with linear transformations in �2 to
introduce them to the idea of stretch factors and stretch directions and how these can create a non-standard coordinate system for �2,
• Task 2: Has students create matrices that convert between the standard and non-standard coordinate systems and relate these to the stretching transformation of Task 1 to reinvent the equation Ax = PDP-1x,
• Task 3: Builds from students’ experience with stretch factors and directions to create ways to determine eigenvalues and eigenvectors given various information about a transformation; and
• Task 4: Students work with examples in �3 to develop the characteristic equation as a solution technique, as well as connect eigentheory to their earlier work with change of basis through diagonalization.
Students work on tasks in small groups and engage the rest of the class in a discussion about their group’s work. A role of the instructor is to serve as a broker between students’ mathematical activity and the mathematics of the mathematical community [5]. One aspect of this role of broker is to introduce students to definitions and symbols used in the mathematics community that align with the mathematical activity in which students have already been engaged through their work on the tasks in the unit. In other words, in this curriculum

157Sumário
Proceedings of the 11th Southern Hemisphere Conference on the Teaching and Learning of Undergraduate Mathematics and Statistics ISBN 978-85-8167-237-3
definitions such as eigenvector and eigenvalue and symbols such as Ax→ = λx→ are introduced only after the students have been working with the tasks in ways that experts would recognize as appropriate to symbolize in this way.
Unit 3 begins with a task that describes a transformation from ⌷2 to ⌷2 that stretches vectors along two directions (represented by the equations y = x and y = -3x) by the stretch factors 1 and 2, respectively [5]. Students are asked to determine a matrix that will calculate what happens under the transformation to any point on the plane. Students often produce the matrix equations and . This typically leads to the development of a system of four equations with four unknowns. Along with this activity, students are asked to sketch the result of the transformation of the plane, which helps lead to a discussion about representing the plane relative to a basis comprised of vectors in the stretch directions and considering the linear transformation relative to that basis. This in turn motivates a change of basis, which instructors can readily represent with a commutative diagram and the diagonalization equation, A = PDP-1.
Although students use the equations above, occasionally students represent their work using the equations and , in which the stretch factor is explicitly written as a scalar on the right-hand side of the matrix equation. These equations are what we call “matrix times vector equals scalar times vector” (mtv = stv) equations [17]. Specifically, we use the mtv = stv label to denote representations of the eigen equation that use numbers and variables in arrays of matrices and n-tuples. Although to the expert these equations are simply a more specified version of the generalized eigen equation Ax→ = λx→, we want to distinguish student use of various symbolizations to emphasize transitions in their reasoning. As part of making this distinction we call an mtv = stv equation but call an mtv = v equation. This choice may seem odd because the equations are distinguished only by whether the scalar is multiplied by the entries in the vector on the right-hand side of the equation; however, may initially appear to students to be simply another example of equations that they encountered in the Linear Transformations unit, such as or other versions of Ax→ = λx→ . We see equations such as as a fulcrum between the ideas about linear transformations from ⌷2 to ⌷2 the students learned in Unit 2 and the new ways of reasoning about mtv = stv and Ax→ = λx→ equations that the students develop in Unit 3.
In particular, mtv = v equations like connect to students’ existing, concrete ways of thinking about linear transformations geometrically and to the matrix equation notation Ax→ = λb→ . Another important connection is that mtv = stv equations can be converted into mtv = v equations and then rewritten as a system of equations, which students use to solve for unknown variables. Finally, mtv = stv equations can be used to support students as they connect these aspects of linear transformations more formally with the general eigen equation. Thus, the notation used in mtv = stv equations allows students to engage in specific, contextualized problem solving that is leveraged to support general notions of eigenvectors and eigenvalues.
Task 3: Stretch Factors and Stretch DirectionsThe overall learning goal for Task 3, which is composed of three problems, is for
students to explore the relationships involved in the equation Ax→ = λx→ and to develop intuitive notions of eigenvalue and eigenvector. As with earlier tasks, we cast the problems in this task geometrically, in terms of stretch factors and stretch directions, but we ask students to provide numeric solutions, giving students the impetus to create and manipulate symbolic expressions

158Sumário
Proceedings of the 11th Southern Hemisphere Conference on the Teaching and Learning of Undergraduate Mathematics and Statistics ISBN 978-85-8167-237-3
to find those numeric solutions. Having already asked students (in Task 1) to find a matrix given stretch factors and stretch directions, Task 3 recasts this by switching which information is given and requested (see Figure 1).
1. The transformation defined by the matrix stretches images in �2 in the directions and y = -x. Figure out the factor by which anything in the direction is stretched and the factor by which anything in the y = -x direction is stretched.
2. The transformation defined by the matrix stretches images in �2 in one direction by a factor of 3 and some other direction by a factor of 2. Figure out what direction gets stretched by a factor of 3 and what direction gets stretched by a factor of 2.
3. The transformation defined by the matrix stretches images in �2 in two directions. Find the directions and the factors by which it stretches in those directions.
Figure 1. The three problems in Task 3. This sequence is intended to allow students to develop a connection between the problem
statements, which are given in terms of stretch factors and stretch directions, and the general eigen equation Ax→ = λx→ . It is rare for students to use λ as the symbol for stretch factors; symbols such as c or k are more common. It is not until their work in this task is connected by the instructor to the broader mathematical community’s eigenvector and eigenvalue conventions that students switch to the more common λ. In the following subsections, we provide examples of common student approaches to Problems 1-3. We have chosen the examples of student work based on how representative they are of students’ approaches and also based on their usefulness for being leveraged to support more general and formal ideas of eigentheory.
Task 3 Problem 1: Finding stretch factorsAs shown in Figure 1, Problem 1 provides students with stretch directions and a given
matrix and asks them to find the stretch factor for each stretch direction. Students initially realize they will need to find at least one vector that lies on the line and at least one vector that lies on the line y = -x. Two common choices are and , respectively. Students then determine the factor by which each of these vectors is stretched when multiplied by the given matrix.
The first example of student work (Figure 2a) exemplifies a typical approach. This group of students began by multiplying the given matrix A times and , which yielded and
, respectively. From this, the students re-wrote the vectors on the right-hand side of the equation as scalar multiples of the vectors on the left-hand side. Although not written on their board, the students indicated in class that they (correctly) interpreted their work to imply that the desired stretch factors were 3 and -9.

159Sumário
Proceedings of the 11th Southern Hemisphere Conference on the Teaching and Learning of Undergraduate Mathematics and Statistics ISBN 978-85-8167-237-3
(a) (b)
Figure 2. Student Work on Task 3 Problem 1.
In the second example, students leveraged the equation A = PDP-1 with the given matrix A (Figure 2b). In particular, this group determined how to input the given information into the diagonalization equation, manipulate the equation, and solve for the matrix D. They represented the stretch direction of and the stretch direction y = -x as the column vectors and , respectively, used that information to create matrix P, found P-1 (we are not sure how they computed the inverse), and substituted them into the diagonalization equation (Fig. 2b line 1). The group explained they left multiplied by P-1 and right multiplied by P to solve for D (Fig. 2b lines 2-3). The product P-1AP yields (Fig. 2b line 4), which the students equated to D and interpreted in terms of stretch factors and directions, namely that the transformation represented by A stretch by -3 and y = -x by 9.
Because the stretch directions are given in equation form, the students must choose a single vector in each direction. As seen in the first example, students are typically able to recognize that they only need to multiply the given matrix times a vector along the stretch direction and notice that the product is a scalar multiple of the original in order to answer the question. As demonstrated, students sometimes write this as an mtv = stv equation with the scalar factored out (last row in Figure 2a). We have found this to be less common in our implementation of the curriculum, with students usually determining the stretch factors without explicitly factoring the right-hand side. However, as we demonstrate in the next section, Problem 2 tends to support students’ production of the mtv = stv equation with the scalar factored.
Task 3 Problem 2: Finding stretch directionsIn contrast to Problem 1, Problem 2 provides students with a matrix and two stretch
factors and asks them to find the stretch directions. They should notice that there are infinitely many ways to describe the stretch direction for a given stretch factor. Also, importantly, students are not able to merely calculate the product of the matrix times a vector or the stretch factor times a vector as they may have before in Problem 1, but instead they must use a generalized stretch direction vector in their approach. Most groups use an mtv = stv equation to generate a system of equations, while other groups use the equation B = PDP-1. Here we share one example of each.

160Sumário
Proceedings of the 11th Southern Hemisphere Conference on the Teaching and Learning of Undergraduate Mathematics and Statistics ISBN 978-85-8167-237-3
Figure 3. Student work on Task 3 Problem 2, using mtv = stv equation. Figure 3 shows a very detailed version of student work using the mtv = stv equation. This
group used as a generic stretch direction vector that is multiplied by the given matrix B on the left-hand side of the equation and the given scalar, 3, on the right-hand side of the equation.
The vector is their generic vector that is multiplied by B on the left and scalar 2 on the right. The group then used each of these matrix equations to generate a system of two equations with two unknowns. The students combined like terms to convert each into a homogeneous equation. The students use the first of the two equations to write an expression of one variable in terms of the other ( and d = 5b) and then convert these equations to a specific vector in each direction: and . The students even reference a connection to the B = PDP-1 relationship at the bottom of their work by listing a matrix, P, with the two vectors they found as its column vectors.

161Sumário
Proceedings of the 11th Southern Hemisphere Conference on the Teaching and Learning of Undergraduate Mathematics and Statistics ISBN 978-85-8167-237-3
Figure 4. Student work on Task 3 Problem 2, using B = PDP-1.In Figure 4 we present an example of student work using B = PDP-1. The group did not
resolve their work to a final solution. The group rearranged the equation B = PDP-1 into the equivalent equation BP = PD. The group used the given matrix B, wrote P as a matrix of four unknowns, and used the two given stretch factors as the diagonal entries of D. They corrected multiplied BP and PD; the next step would be to set the corresponding components of each of the resultant matrices equal. This would create four equations that are identical to those created using the mtv = stv method.
Task 3 Problem 3: Finding both stretch factors and stretch directionsProblem 3 only provides students with the matrix and asks them to find both stretch
directions and stretch factors. Students need to recognize that they cannot solve for any of the unknowns directly and that there are infinitely many solutions for vectors that lie on the stretch directions. In addition, students’ work can be leveraged to develop the idea of the characteristic polynomial for a given matrix and how finding the roots is equivalent to determining the stretch factors of that matrix.

162Sumário
Proceedings of the 11th Southern Hemisphere Conference on the Teaching and Learning of Undergraduate Mathematics and Statistics ISBN 978-85-8167-237-3
Figure 5. Student work on Task 3 Problem 3, finding stretch directions first.One method for solving this problem is to find the stretch directions first. Figures 5
show one group’s work, which we have separated into two images. As with the other groups, this group began with the mtv = stv equation and used it to generate a system of equations. However, in each equation, they solved for the stretch factor, k, and set the remaining algebraic statements equal to each other in an equation that reflects a proportion. The group then simplified this equation to yield a quadratic in two variables: 4a2 - 6ab + 2b2 = 0. Factoring this and drawing on the zero product property, the group was able to produce the two equations b = 2a and b = a, which they recognized as the stretch directions. Following this, the group found the corresponding stretch factors by selecting a single vector along each stretch direction and continuing in a manner similar to their approach to Problem 1.
Another common approach to Problem 3 is to find the stretch factors first; one example is given in Figure 6. The students constructed an mtv = stv equation with variables for both components of the eigenvector and a variable k for the eigenvalue. The group set up proportions to generate a single equation in terms of k. Although this group of students did not make it explicit, the ratio is the slope of the line described by each equation. From this, the students developed a quadratic equation. After solving the quadratic for the stretch factors, the students determined the corresponding stretch directions, one of which is shown on their whiteboard.

163Sumário
Proceedings of the 11th Southern Hemisphere Conference on the Teaching and Learning of Undergraduate Mathematics and Statistics ISBN 978-85-8167-237-3
Figure 6. Student work on Task 3 Problem 3, finding stretch factors first. The ways in which this group manipulated the system of equations can be leveraged to
support a discussion of the characteristic polynomial and the standard manipulations used to calculate it. Specifically, it is helpful to juxtapose the two systems of equations in Figure 6 with
the matrix equations and , as well as the more generalized equations Ax→ = kx→ and (A − kl) x→ = 0→ . We have found that this helps students to draw parallels between the three pairs of symbolizations so that each can be used to make sense of the other. Furthermore, the instructor can draw on the Invertible Matrix Theorem to motivate the need to calculate det(A − kl) and, in so doing, introduce the notion of the characteristic polynomial. Such a discussion would begin with the instructor pointing out (or supporting students to identify) the need for a nonzero vector as a solution to the original eigen equation and, so, to the equation (A − kl) x→ = 0→ and continue by leveraging the Invertible Matrix Theorem to warrant the need for det(A − kl) to equal zero. In this sequence, the power of Task 3 takes shape. The generalization of students’ specific solutions allows them to draw parallels between their own activity and its generalization to help motivate the notion of the characteristic polynomial and its derivation through the equation (A − kl) x→ = 0→ .
Finally, after the students complete the task, the culmination of Task 3 involves the instructor introducing the terms eigenvector and eigenvalue as the mathematical community’s terms for what they have been exploring geometrically as stretch factors and stretch directions. What follows in Task 4 and beyond is generalizing eigenvectors and eigenvalues beyond 2x2 matrices with two real non-zero eigenvalues to the myriad of other possibilities, their interpretation geometrically (if possible), and their connection to diagonalization.
CONCLUSIONIn this submission, we illustrated the IOLA materials by summarizing aspects of student
work on a task that supports students’ guided reinvention of eigenvectors and eigenvalues. In particular, we highlighted in student work the usefulness of student fluidity between the eigen equation in the various forms of matrix equations, systems of linear equations, and the equation
164Sumário
Proceedings of the 11th Southern Hemisphere Conference on the Teaching and Learning of Undergraduate Mathematics and Statistics ISBN 978-85-8167-237-3
Ax→ = λx→ . The tasks in Unit 3 were developed in such a way as to build and extend work that students have previously done with Ax→ = b→ equations and their various equivalent forms. The examples of student responses to the three problems in Unit 3 Task 3 that we provided in this chapter illustrate several important types of reasoning that support a robust understanding of eigentheory. Specifically, the task allows students to leverage their existing ways of representing linear transformations with matrix equations composed of numbers and variables – what we have denoted as mtv = stv or mtv = v equations. Students are then able to interpret these matrix equations as systems of equations in order to shift their reasoning towards developing approaches to solving equations of the form Ax→ = kx→. As the task progresses, each subsequent problem varies which of the three components (eigenvector, eigenvalue or both) are unknown. This was designed intentionally to allow students to interpret the outcome of their activity in terms of stretch directions and stretch factors based on their work on the previous problem, as well as Unit 3 Tasks 1-2. In this way, the students’ work with Unit 3 Task 3 is meant to involve referential activity, a key component of the instructional design theory of Realistic Mathematics Education [9].
Unit 3 Task 3 culminates in the instructor leveraging students’ solutions to Problem 3 and generalizing their use of the mtv = stv and mtv = v equations. In addition, the students we have worked with have begun to generalize the various relationships in the eigen equation beyond the specific 2x2 examples of the task. This is meant to lead to an introduction and discussion of the characteristic polynomial, with its standard derivation resulting directly from generalizing activity. Furthermore, the instructor plays a crucial role as broker between the classroom and broader mathematical community by connecting students’ work with stretch factors and stretch directions with the more widely known terms of eigenvalues and eigenvectors, respectively. Through this discussion, students’ activity is guided toward a reinvention of eigentheory from a meaningful, problem-based approach.
REFERENCES[1] Freeman, S., Eddy, S. L., McDonough, M., Smith, M. K., Okoroafor, N., Jordt, H., Wenderoth,
M. P. Active learning increases student performance in science, engineering, and mathematics. Proceedings of the National Academy of Sciences, 2014;111(23):8410-8415
[2] Conference Board of the Mathematical Sciences. Active Learning in Post-Secondary Mathematics Education. 2016, July 15. Retrieved from http://www.cbmsweb.org/Statements/Active_Learning_Statement.pdf
[3] Handelsman, J., Brown, Q. A call to action: incorporating active STEM learning strategies into K-12 and higher education. 2016, August 17. Retrieved from https://www.whitehouse.gov/blog/2016/08/17/call-action-incorporating-active-stem-learningstrategies-k-12-and-higher-education
[4] Rasmussen C, Kwon O. An inquiry oriented approach to undergraduate mathematics. J Math Behav. 2007;26:189–194.
[5] Authors.
[6] Kuster, G., Johnson, E., Keene, K., Andrews-Larson, C. Inquiry-oriented instruction: A conceptualization of the instructional principles. PRIMUS. 2017.
[7] Ernst, D. C., Hodge, A., Yoshinobu, S. What is Inquiry-Based Learning? AMS Notices. 2017;64(6):570-574.
[8] Rasmussen, C., Marrongelle, K., Kwon, O. N., Hodge, A. Four goals for instructors using Inquiry-Based Learning. Manuscript submitted for publication. 2017.

165Sumário
Proceedings of the 11th Southern Hemisphere Conference on the Teaching and Learning of Undergraduate Mathematics and Statistics ISBN 978-85-8167-237-3
[9] Freudenthal, H. Revisiting mathematics education. Dordrecht, Kluwer; 1991.
[10] Thomas, M. O. J., Stewart, S. Eigenvalues and eigenvectors: Embodied, symbolic and formal thinking. Math Edu Research J. 2011;23(3):275–296.
[11] Authors.
[12] Salgado, H., Trigueros, M. Teaching eigenvalues and eigenvectors using models and APOS Theory. J Math Behav. 2015;39:100–120.
[13] Authors.
[14] Hillel J. Modes of description and the problem of representation in linear algebra. In: Dorier J-L, editor. On the teaching of linear algebra. Dordrecht: Kluwer; 2000. p. 191–207.
[15] Çağlayan, G. Making sense of eigenvalue-eigenvector relationships: Math majors’ linear algebra–geometry connections in a dynamic environment. J Math Behav. 2015;40:131–153.
[16] Gol Tabaghi, S., Sinclair, N. Using dynamic geometry software to explore eigenvectors: The emergence of dynamic-synthetic-geometric thinking. Technology, Knowledge and Learning. 2013;18(3):149–164.
[17] Cobb P. Conducting teaching experiments in collaboration with instructors. In: Kelly AE, Lesh RA, editors. Handbook of research design in mathematics and science education. Mahwah: Lawrence Erlbaum; 2000. p. 307–330.
[18] Authors.
[19] Gravemeijer, K. How emergent models may foster the constitution of formal mathematics. Math Think Learn. 1999;1:155–177.
[20] Authors.
[21] Authors.
[22] Authors.
[23] Authors.

166Sumário
Proceedings of the 11th Southern Hemisphere Conference on the Teaching and Learning of Undergraduate Mathematics and Statistics ISBN 978-85-8167-237-3
ABSTRACTS

167Sumário
Proceedings of the 11th Southern Hemisphere Conference on the Teaching and Learning of Undergraduate Mathematics and Statistics ISBN 978-85-8167-237-3
A CROSS-BORDER STEM CLASS ON THE THEME OF ENERGY TO ENHANCE THE STATISTICS EDUCATION AT THE LEVEL OF 6TH
GRADE OF BASIC SCHOOL CURRICULUM OF MATHEMATICS .
Yuriko Yamamoto Baldin
Universidade Federal de São Carlos, Brasil
Masami Isoda
University of Tsukuba, Japan
Raimundo Olfos
Pontificia Universidad Católica de Valparaíso, Chile
Soledad Estrella
Pontificia Universidad Católica de Valparaíso, Chile
The challenge of implementing STEM Education with themes of global importance such as Energy at the level of basic education has been worked within the APEC Lesson Study Project, as one fundamental initiative of the International APEC HRD– UNESCO Project since 2015. Among the “Sustainable Developments Goals” of this Project, those of “quality education”, “affordable and clean energy”, “responsible consumption and production” and “partnership for the goals” motivate collaborative actions of schools and educators towards efficient lessons with real data (APEC database) in classrooms. The structure of Lesson Study has based the research work of innovative lessons on energy efficiency and cross border education since 2016, by the countries collaborating within the APEC project. This presentation aims to bring the results of a recent cross- border STEM class for 6th grade using real data, between Chile and Brasil, planned and executed under Lesson Study principles, potentialized by the communication technology that permitted real time interactions between the classrooms. The lesson has enhanced the contents of the basic mathematics curriculum, enriched with the evidence of statistical thinking of students and the power of a cross cultural environment for the learning.

168Sumário
Proceedings of the 11th Southern Hemisphere Conference on the Teaching and Learning of Undergraduate Mathematics and Statistics ISBN 978-85-8167-237-3
THE IMPACT OF MATHEMATICS SOFTWARE REMEDIATION IN MATHEMATICS FOR ENGINEERING STUDENTS AT A
UNIVERSITY IN THE EASTERN CAPE PROVINCE OF SOUTH AFRICA
Lynette Bester
T. Mandindi
Walter Sisulu University, South Africa
This study was initiated by the poor state of mathematics in South Africa. The 2015 Trends in International Mathematics and Science Study reported that South Africa rated 38 of the 39 countries assessed. In the Eastern Cape Province of South Africa, which consists mainly of rural areas and where most of the engineering students at a university in this area come from, the percentage of Grade 12 learners who achieved 40% and above in mathematics dropped from 26,3% in 2013 to 21,8% in 2015. The unacceptable state of prospective students’ mathematics knowledge and the fact that mathematics is a fundamental subject for engineering students, emphasised the need for remediation. Civil and electrical engineering students in the extended diploma programme participated in this study. A mixed research design was used to investigate the impact of a computer based mathematics intervention to fill the gaps in participants’ mathematics background. Examination results indicated that this intervention had a positive effect on the pass rate in mathematics of civil engineering participants. Interviews and an online survey at the end of the remediation revealed that 96% of the students were in favour of this intervention. With limited staff, time and resources, this study indicated that appropriate mathematics software can successfully be used as an intervention to fill the gaps in the mathematics knowledge of students entering courses that require a mathematics background. Follow up work should be done to confirm these findings.Keywords: Mathematics; Intervention; Engineering; Computer based; Rural; Remediation, E-learning.

169Sumário
Proceedings of the 11th Southern Hemisphere Conference on the Teaching and Learning of Undergraduate Mathematics and Statistics ISBN 978-85-8167-237-3
JUST TAKE A BREATH: BRINGING MINDFULNESS INTO LARGE CLASSROOMS
Claire Blackman21
University of Cape Town
As a lecturer at a South African university that has an increasingly diverse student body, I have spent a lot of time thinking about how to create a safe, nurturing space for my large, often extremely stressed, first-year mathematics class. I decided that one of the most useful things I could do is to give my students the tools to focus and quieten their minds and emotions, and so I decided to include two minutes of mindful breathing meditation at the start of each class. The response from my 200 students was overwhelmingly positive, and I noticed that these students were more relaxed and focused than other classes. I have since started including mindful breathing at the start of all my classes and workshops. In this talk, I’ll discuss how I introduced mindfulness to my students, how I run the meditation, and what my students and I experienced. I’ll also give some background about the scientific research into the effect of mindful practice on the brain.

170Sumário
Proceedings of the 11th Southern Hemisphere Conference on the Teaching and Learning of Undergraduate Mathematics and Statistics ISBN 978-85-8167-237-3
HELPING STUDENTS OVERCOME FAILURE BY DEVELOPING ‘GROWTH MINDSETS’
Anita Campbell22
University of Cape Town
Students who have experienced failure in university mathematics may be unsuccessful in changing their academic behaviour due to limiting self-beliefs. A key self-belief that affects mathematics achievement is the belief that academic ability is fixed (known in social psychology as having a ‘fixed mindset’) rather than capable of growing (having a ‘growth mindset’). Students with growth mindsets tend to ask questions, persist when challenged, and value learning more than looking smart. Students with fixed mindsets are more likely to view behaviour such as asking questions and working persistently as indicators of lower ability. The link between self-beliefs and behaviour, and the fact that beliefs are usually deeply held and difficult to change, may explain why students can describe what behaviour would improve their academic achievement and yet not succeed in making sustained changes to their behaviour. Interventions to develop growth mindsets have mostly targeted school students rather than university students. In this presentation I discuss an intervention to develop growth mindsets in engineering mathematics students at a university in South Africa through a voluntary peer tutoring project on the social media platform WhatsApp. The project design and issues regarding data collection and data analysis on the qualitative data analysis software Nvivo will be discussed.
171Sumário
Proceedings of the 11th Southern Hemisphere Conference on the Teaching and Learning of Undergraduate Mathematics and Statistics ISBN 978-85-8167-237-3
THE GEOGEBRA SOFTWARE AS A TOOL IN THE TEACHING OF TRIGONOMETRICAL FUNCTIONS
Marli Teresinha Quartieri23 Romildo Pereira da Cruz24
Italo Gabriel Neide
Maria Madalena Dullius
Amanda Gabriele Rauber
Universidade do Vale do Taquari - UNIVATES
This work presents the use of GeoGebra as a pedagogical tool for the teaching of trigonometric functions tool in a class of 34 students, participants of the discipline “Introduction to the Exact Sciences”. The application occurred during the course “Teaching Internship in the Undergraduate Level”, which is a part of the Master’s Degree in Teaching, at a Higher Education Institution located in Rio Grande do Sul, Brazil. The goal was to analyze and interpret the behavior of students and the learning situations emerging from the use of such software. The research was outlined in the qualitative perspective and systematic observations and the application of questionnaires were used for data collection. The analysis of such questionnaires was based on Content Analysis. During the investigation and the monitoring of the activities developed, it was noticed that the students sharpened their senses and showed evidence of improvement in the use of content, especially in the recognition of functions from the natural, algebraic and graphical registers, as well as better comprehension of the treatment procedures for each case. With this, we can infer that, in the investigated classroom, the participation in activities that involved the use of software increased the learning potential of students. It was observed that the interaction between students, and the interaction of students with the professor, supported by the meaning of the activities, was fundamental for the success of the practice. The results suggest a positive perspective on the learning of students with the use of software, provided that it takes into account good planning and well-defined objectives, in order to incorporate them into educational practices.Key-words: GeoGebra. Introduction to the Exact Sciences. Learning.

172Sumário
Proceedings of the 11th Southern Hemisphere Conference on the Teaching and Learning of Undergraduate Mathematics and Statistics ISBN 978-85-8167-237-3
PERSPECTIVES IN TEACHING STATISTICS IN A PEDAGOGY COURSE IN DE
Auriluci de Carvalho Figueiredo25
Michel da Costa26
Universidade Metropolitana de Santos – UNIMES
Distance Education (DE) plays a fundamental role nowadays, and consequently also in the formation of teachers. Our research group composed of teachers who have been working for some time with this training in face-to-face mode faced a great challenge: how to deal with subjects in Teacher Training courses in DE? So, the present article represents a larger research project on the subject, and we choose here to treat some possibilities of teaching and learning of Statistics in a Pedagogy course in a University of the State of São Paulo in DE. Our concern among others was to combine statistical knowledge, articles in the area of Statistical Education and teaching practices. The study was carried out from the analysis of records in evaluative and non-evaluative activities in the virtual environment that happened in forums and tasks, among others. We were aware that the teaching of Statistics in a Pedagogy course goes far beyond the concepts that involve a discipline, but also with a look of future teachers of this area of knowledge. Research shows that teacher trainers often do not take into account the creation of subjects which integrate disciplines with specific content and the ones with pedagogical content, and point out that the responsibility for this transposition would be under the responsibility of teachers in the pedagogical area. Among other conclusions, we present testimonials of reflection on the part of the students about content covered in Basic Education and possibilities to approach content from various perspectives coming from research in the area of Statistical Education.

173Sumário
Proceedings of the 11th Southern Hemisphere Conference on the Teaching and Learning of Undergraduate Mathematics and Statistics ISBN 978-85-8167-237-3
PREDICTING SECOND YEAR MATHEMATICS SUCCESS USING STATISTICAL MODELS
Lizelle Fletcher27
Department of Statistics- University of Pretoria
In the pursuit of student success, the Natural and Agricultural Science (NAS) Faculty at the University of Pretoria in South Africa is paying particular attention to undergraduate courses with a low pass rate. Mathematics students is one specific group of second year students that are of concern. The NAS Faculty identified a need for a model to inform decisions on admission requirements and possible rerouting of students, based on existing student data.Several sets of student data were merged to construct models for predicting success of second year students. It was found that performance in the first year of study, mathematics performance in the students’ matric year, as well the sex and mother tongue vs. preferred language of instruction significantly contributed to explaining second year performance in mathematics. (South Africa has eleven official languages, reflecting its ethnic diversity, however this is recognised as a potential obstacle in the teaching of subjects with a technical language.)CHAID analysis, a data segmentation technique, was used to create tree-based classification models to explicate the relationship between second year mathematics performance and the various predictors. In addition, multinomial logistic regression models were constructed to further explore the influence of the first year modules, and where applicable, the prerequisite second year modules, on the outcome of second year mathematics modules. So-called “Safe” and “At-risk” students were identified using the information obtained from the statistical modelling to assist in advising students about their subject choices.
174Sumário
Proceedings of the 11th Southern Hemisphere Conference on the Teaching and Learning of Undergraduate Mathematics and Statistics ISBN 978-85-8167-237-3
HOW THE INTERNET ACT ON THE MATHEMATICAL MODELING ONLINE
Jeannette Galleguillos28
Universidad de Valparaíso
Marcelo de Carvalho Borba29
Universidade Estadual Paulista “Júlio de Mesquita Filho” – Rio Claro
Facebook is a highly favorable social network for people to participate in a discursive social activity. We used the social network in an online extension course for interactions of teachers in mathematical modeling. We see modeling as a process of posing and solving problem, from studying an interest topic. In this work, we observed a group of mathematics teachers in the construction and development of a problem by mean of the social network. We focus on observing how digital technologies act in online mathematical modeling. We use Activity Theory to analyze the discussions of participants in a closed group. In the resolution process tensions emerged in the participants with a crucial role of the Internet in the online mathematical modeling.

175Sumário
Proceedings of the 11th Southern Hemisphere Conference on the Teaching and Learning of Undergraduate Mathematics and Statistics ISBN 978-85-8167-237-3
A WEB APPLICATION TO SUPPORT THE CONTINUING LEARNING OF ELEMENTARY MATHEMATICS
Héctor Fernando Gómez30
Ramón Ronzón
Universidad del Caribe
According to the Programme for International Student Assessments (PISA) the performance of Mexican students in mathematics is far below the average of the OECD countries. As a consequence, Mexican students suffer from severe difficulties in their transition to engineering programmes at different universities. One of these difficulties is a large failure rate in first-year mathematics courses which, in the end, is a principal cause of attrition. In order to support incoming students to engineering programmes, we built a new web application based on the use of expert systems. Expert systems are artificial intelligence techniques used to solve problems replicating the skills of a human expert. In our web platform, expert systems are used to solve, and to describe the solution, of exercises in different algebra and geometry topics. Additionally, we integrated a module in which students can solve exercises step by step. Every step is reviewed by an expert system allowing an immediate feedback for the student. The web application has been used in an introductory mathematics course for engineering students at the Universidad del Caribe in Cancún, Mexico. We study the impact of these tools by implementing a regression analysis, specifically by modelling through a Bayesian network. In the presentation we describe the results obtained.

176Sumário
Proceedings of the 11th Southern Hemisphere Conference on the Teaching and Learning of Undergraduate Mathematics and Statistics ISBN 978-85-8167-237-3
PROMOTING METACOGNITION AS A HABIT OF MIND IN UNDERGRADUATE CLASSROOM COMMUNITIES
Emilie Hancock
University of Northern Colorado
Research in mathematical problem solving has long identified metacognition as an essential component of the problem-solving process, and a 21st Century skill. As students learn new mathematical concepts and problem-solving strategies, they should learn how to manage and regulate application of this new knowledge. Thus, providing students authentic problem-solving experiences necessitates the promotion of metacognitive thinking and shifting, at least to some degree, the responsibility of monitoring and control from teacher to student. As the activity within a classroom community of practice creates a microculture of negotiated activities and interactions among students and the teacher, over time normative behavior emerges. For metacognitive thinking to develop, it must be an explicit part of the classroom culture and have opportunities to become established as normative activity. In this talk, I discuss a qualitative research study exploring the use of portfolio problem-solving sessions and write-ups to mediate metacognitive thinking during problem solving in a first-year, inquiry-oriented undergraduate math course in the United States. Regularly throughout the 15-week semester, students worked together on non-routine problems, and submitted written documentation of their judgement and decision-making processes during their entire problem-solving process, from initial thoughts to final solution attempt. Classroom audio- and video-data, written artifacts, and interviews conducted with students and the primary instructor were collected. Microanalysis was conducted to identify semester-long changes in normative metacognitive activity during portfolio problem-solving episodes. Macroanalysis utilizing Activity Theory as an analytic framework situated these results, highlighting contradictions as catalysts for change. Results and teaching implications are presented.

177Sumário
Proceedings of the 11th Southern Hemisphere Conference on the Teaching and Learning of Undergraduate Mathematics and Statistics ISBN 978-85-8167-237-3
USING VIRTUAL AND PHYSICAL LEARNING SPACES TO DEVELOP A SUCCESSFUL MATHEMATICAL LEARNING
COMMUNITY, BOTH FOR ON-SITE AND DISTANCE PROVISION
Belinda Huntley
University of South Africa (UNISA)
Jeff Waldock
Andrew Middleton
Sheffield Hallam University, UK
Student engagement, satisfaction and academic success is built upon a sense of belonging – of being part of a professional community that provides comprehensive support. This can be achieved through a culture of expectation and behaviour, suitable support structures and effective use of physical and virtual learning space. Carefully designed physical and virtual learning spaces, together with a managed peer-support network, help create a partnership learning community within which this process can flourish. Our hypothesis is that learning spaces are not only conceptual and provided, but co-constructed, especially in our digital and hybrid contexts where the learner has more influence over the space and places they co-construct and inhabit.In this presentation, we will describe our experiences of developing and making effective use of virtual and physical spaces to develop successful mathematical learning communities both at Sheffield Hallam University in the UK - where activities are principally face-to-face, and at the University of South Africa (UNISA) – where they are mainly virtual. Innovation in the design and use of discipline-specific physical space can have an important role in helping learners achieve this through a sense of ‘becoming and belonging’ (Willcock, 1999). We will explore the ‘equivalence of place’ and the changing role of academic staff in fostering professional learner identities both through traditional on-site delivery, and through the distant, blended or hybrid approach.

178Sumário
Proceedings of the 11th Southern Hemisphere Conference on the Teaching and Learning of Undergraduate Mathematics and Statistics ISBN 978-85-8167-237-3
#FEESMUSTFALL: CHANGING THE LANDSCAPE OF E-ASSESSMENT
Simon Goldstone31
Hermien Johannes
Simon Goldstone
Shaun Meyer
Koshala Terblanche
Nelson Mandela University
In 2016, student protests at most South African Universities reached a boiling point, resulting in the closure of campuses and up to a six week loss of time from the academic calendar. While student protests have been ongoing in South Africa since the mid-90s, a national student movement in 2015, under the tag #FeesMustFall, came to prominence protesting against rising Higher Education fees which lead to a disruption across a number of Institutions of learning in September 2016. These events had a ripple effect on the uptake of Blended and Online Learning at South African Universities. The creative application of online tuition and alternative forms of assessment assisted staff and students to advance completion of the academic year.The closure of campuses placed Infrastructure and Information demands on the ICT services unit. Engineers and administrators had to develop solutions for implementation at a secured off campus venue which would form the hub for faculty, students and support personnel – extending the traditional campus teaching, learning and assessment spaces like never before.The reduction of available teaching time tested Institutional readiness and drove the demand for accelerated technology adoption. Faculty required extensive training and support from the Academic Developers within the Centre for Teaching, Learning and Media.The increased utilization of the Learning Management System with respect to access, performance and the changing requirements for online assessment, tested all aspects of the system’s various capabilities. Valuable lessons were learned regarding the setting up of remote assessment laboratories and the accompanying guidelines and procedures for the correct deployment of online assessment activities. These informed practice to conduct successful assessments – be it continuous, formative or summative. The real world context inspired new thinking about design for authentic and connective assessment.An important driver for e-Assessment is being able to control the environment, which was difficult to do. Therefore, an innovative connective assessment design model was developed and applied to address some of these difficulties in a variety of contexts using various technologies within a networked environment. This model is underpinned by theories of Connectivism and Mastery Learning. Important design principles for connective assessment will be discussed, supported by examples from applications in different disciplines and reflections on various faculty experiences.Keywords: Innovative teaching and assessment approaches and practices.
179Sumário
Proceedings of the 11th Southern Hemisphere Conference on the Teaching and Learning of Undergraduate Mathematics and Statistics ISBN 978-85-8167-237-3
MATHEMATICAL FAILURE(S) OF BRIDGING STUDENTS AND THE IMPACT(S) ON THEIR PROGRESS AND AFFECT
Phil Kane32
The University of Auckland -New Zealand
Failure is an unfortunate option for a solid minority of bridging mathematics students, and too many appear to not have an “at-homeness” (Cockcroft, 1982) with number. Addressing these learners’ needs requires not only deliberate acts of teaching but also consideration of the systems in place. Prior to 2015 students who completed and failed the Maths91F course were all progressed to the Maths92F course in the next semester with the rest of the cohort. However, in spite of their achieving and passing in other subjects, these failing students almost without exception failed Maths92F also, so a whole year on these students were still unable to enter university. Then in 2015, a repeat Maths91F course was offered in semester two to those who had narrowly failed earlier. After examining results before and after 2015, the 2015-2017 results of the candidates between the two semesters, and by keeping an occasional diary, an informal picture emerges about the students who succeeded the second time around. Unsurprisingly, these students attended religiously, they submitted everything on time, they were driven to improve in a subject that had thwarted them to now, they asked questions when unsure (and sometimes when curious), and they likely had D or D+ grades from semester one. It was also evident that the ‘chapter chase’ in semester one had to be partly renovated into opportunities for them to interact with threshold concepts such as place value and decimal systems, and multiplicative and proportional reasoning, that seem to have been missed or forgotten in their compulsory education.

180Sumário
Proceedings of the 11th Southern Hemisphere Conference on the Teaching and Learning of Undergraduate Mathematics and Statistics ISBN 978-85-8167-237-3
ATTENDANCE: THE MISMATCH BETWEEN ACADEMICS AND STUDENTS . WHO IS RIGHT?
R. Nazim Khan33
University of Western Australia
Most academics consider class attendance as key performance. Various strategies have been implemented in order to entice students to attend classes and engage more fully with the course, with limited if any success. This is a study on evaluating student performance based on attendance.Accurate student attendance was obtained by lecture theatre scanners for an introductory calculus unit. Lectures were not recorded for this unit. In another unit, a first level business statistics unit, attendance information was obtained by student surveys. Lectures were recorded in this unit. In each case the attendance records were linked to performance and demographic information. The data were analysed to determine the effect of attendance on performance.In addition, surveys of academic staff and students were taken to ascertain the attitude of each toward class attendance. Students with a range of performance profiles were selected so attitudes to class attendance could be linked to performance. I will report the results of the data analysis. Based on this study, I will answer the questions: Does attendance matter? And what do students expect from lectures?
REFERENCESNyamapfene, A. (2010) Does Class attendance still matter? Engineering Education: Journal of
the Higher Education Academy Engineering Subject Centre, 5 (1), 64-74.
Purcell, P. (2007) Engineering student attendance at lectures: effect on examination performance, International conference on engineering education ICEE September 3-7, Coimbra, Portugal.
Rico, J. E. F. S. , Fernndez, F., Surez, A. A. and Camblor, P. M. The importance of university lecture attendance, University of Oviedo, Vice-Chancellorship for Quality, Planning and Innovation, http://www.albertoalvarezsuarez.es/Doc/8Articulo ingles.pdf
Birch, W. and Williams, A. (2015) Who goes to lectures (and does it matter)? Higher Education Review, 47(2).
Dolnicar, S., Kaiser, S., Matus, K. & Vialle, W. (2009) Can Australian universities take measures to increase the lecture attendance of Marketing students? Journal of Marketing Education, 31 (3), 203-211.
Kottasz, R. (2005) Reasons for student non-attendance at lectures and tutorials: an analysis. Investigations in university teaching and learning, 2(2), 5-16.
Hunter, S. and Tetley, J. (1999) Lectures. Why don’t students attend? Why do students attend? HERDSA Annual conference, Melbourne, July 12-15.

181Sumário
Proceedings of the 11th Southern Hemisphere Conference on the Teaching and Learning of Undergraduate Mathematics and Statistics ISBN 978-85-8167-237-3
FIRST FESTIVAL OF DIGITAL VIDEOS AND MATHEMATICS EDUCATION
Hannah Dora de Garcia e Lacerda34
Marcelo de Carvalho Borba35
Universidade Estadual Paulista (Unesp) - Rio Claro
The Research Group on Informatics, other Media and Mathematics Education (GPIMEM), that has been advancing research involving technologies which can be used as educational resources, promoted the First Festival of Digital Videos and Mathematics Education. The Festival is part of The Digital Videos project in the Distance Mathematics Degree (E-licm@t-Tube) that aims to understand the possibilities of the production and use, in a collaborative way, of videos in the training of teachers of distance learning Mathematics, also extending to face-to-face courses and to schools of Basic Education. For the Festival, students and Pre-service Mathematics Teacher and Basic Education submitted a total of 120 videos produced by them, in which mathematical content was part of the script. The videos were analyzed by a jury composed of artists, mathematicians and mathematical educators, by three evaluation criteria: the nature of the Mathematical Idea, Creativity and Artistic-Technological Quality. For this oral presentation, our focus will be an initial analysis of the videos awarded in the Higher Education category, regarding the criteria The Nature of the Mathematical Idea. The submitted videos are hosted on the festival’s website, making it a repository of didactic material containing videos with mathematical content. At the moment, we have one scientific research, two master’s degree and six doctor’s degree students developing their qualitative research associated to the E-licm@t-Tube. We hope, from the Festival, to contribute to the communication of mathematical ideas and the establishment of a culture of digital mathematical video production.

182Sumário
Proceedings of the 11th Southern Hemisphere Conference on the Teaching and Learning of Undergraduate Mathematics and Statistics ISBN 978-85-8167-237-3
SMART PHYSICS: TEACHING PHYSICS WITH SMART-CART AND SAMART-PHONES
Jeff Nijsse36
Auckland University of Technology
Students in introductory physics classes are often excited by the real world applications of the material yet struggle with abstract interpretation. This becomes challenging when coupled with foundation-level students that have not had a lot of exposure to techniques such as graphing and data analysis. Communication through graphs is a key concept to understand the relationship between position, velocity, and acceleration. This is consistently an area where students struggle.In this presentation two fundamental concepts in introductory physics will be analysed with the use of cheap technology—a common smartphone ($30 USD), and more expensive technology— a PASCO wireless smart cart ($180 USD).First, a classic physics lab involves tracking the motion of an object and describing its behaviour using a graph. This can be accomplished in a number of ways; traditionally with a teacher demonstration, followed by explanation and theory. Secondly, simple harmonic motion is another classic physics demonstration. This usually involves an elaborate set up with motion detectors connected to a computer.Through the addition of simple and affordable technology, motion tracking experiments can quickly and easily be incorporated into the lecture and or lab that enable real-time results and feedback for the students. Using only what comes pre-packaged in a smartphone can easily model motion and put an experiment in every student’s hands!

183Sumário
Proceedings of the 11th Southern Hemisphere Conference on the Teaching and Learning of Undergraduate Mathematics and Statistics ISBN 978-85-8167-237-3
STUDENT EXPERIENCE INFORMS A SUPPORTIVE-ENVIRONMENTAL FRAMEWORK FOR ONLINE ASSESSMENT IN
MOODLE
Pragashni Padayachee
Centre for Educational Assessment for Access and Placement, Centre for Higher Education Development, University of Cape Town
Dr Hermien Johannes
Centre for Teaching, Learning and Media, Nelson Mandela University
Dr Shirley Wagner-Welsh
Department of Mathematics, Nelson Mandela University
With the increased intake of students at many higher education institutions, the teaching, learning and assessment of large groups is one of the biggest challenges facing educators. Appropriate online assessment may address some of the challenges. In this paper, the experiences of 392 mathematics students, undertaking their assessments via Moodle at a University in the Eastern Cape of South Africa, are described. Student experiences informed the design of a supportive-environmental framework for online assessment. The theoretical lens for this research study is framed by mastery learning, student experience and online assessment. The research reported on in this paper highlights one aspect: the third phase of the action-research cycle, namely, to observe the implementation of online assessment. Examples from two blended-learning Moodle courses highlight some of the experienced difficulties and successes. The lessons learnt informed the online-assessment design and implementation to introduce supportive environments for online assessment. The knowledge gained from this study culminated in a 4-Pillar Supportive-Online Assessment Framework for Blended-Learning environments, which could contribute to an improvement in online-assessment practices. Keywords: Online assessment; Moodle; Supportive learning environment; Students’ experiences; Higher education; Blended learning; 4-Pillar Supportive Online Assessment Framework.

184Sumário
Proceedings of the 11th Southern Hemisphere Conference on the Teaching and Learning of Undergraduate Mathematics and Statistics ISBN 978-85-8167-237-3
NURTURING MATHEMATICAL CREATIVITY AND CURIOSITY IN FOUNDATION MATHEMATICS STUDENTS.
Rachel Passmore37
University of Auckland
Creativity in Mathematics is often associated with problem solving; a solution might be labelled creative if it is particularly elegant. Such creativity is an aspect I aim to encourage in my students, but my quest goes wider than that. Similarly the type of mathematical curiosity I strive to promote with my students is not just curiosity about an answer but rather about posing mathematical questions that pique their interest.Inspiration for introducing more creativity in mathematics came from traditional Maori and Pacifica weaving designs. Similar designs are used to teach non-linear graphs and equations. Student engagement with this task was very high and the results were outstanding. Learning derived from this activity includes not only transformations of non-linear graphs and equations, but also familiarity with domains and ranges of functions.At the last DELTA conference I shared some of my students’ video creations. One question in my video assessment asks students to construct a context for a set of three simultaneous equations with a particular solution. I will share some of the creative contexts that students have devised.Encouraging mathematical curiosity in my students was challenging and initially rather disappointing. Students were extremely reluctant to pose mathematical questions and appeared to have little mathematical curiosity. I discovered this was largely due to a lack of understanding about what a mathematical question was. Practice with Fermi questions has assisted with student formulation of questions. I will describe activities where students are asked to pose mathematical questions in response to short video clips.

185Sumário
Proceedings of the 11th Southern Hemisphere Conference on the Teaching and Learning of Undergraduate Mathematics and Statistics ISBN 978-85-8167-237-3
CONTRIBUTIONS OF THE MATHEMATICAL MODELING TO THE DEVELOPMENT OF STATISTICAL LITERACY OF STUDENTS
FROM A GRADUATE TECHNOLOGY COURSE
Andréa Pavan Perin38
Universidade Estadual Paulista (UNESP) - Campus de Rio Claro
Maria Lúcia Lorenzetti Wodewotzki39
Universidade Estadual Paulista (UNESP) - Campus de Rio Claro
The current work presents ongoing doctoral research, implemented in the higher education environment with the focus of enabling the Applied Statistics discipline. The research took place in an environment based on Mathematical Modeling, in which the student actively participated in the teaching-learning process, exploring subjects of his interest. This project aimed at discussing the contributions that emerge from Statistics teaching to the development of Statistical Literacy in its three dimensions: interpretation, critical questioning and production, whenever Mathematical Modeling projects are carried out in higher education technology courses. The data were collected both from the recording of an audio containing the oral presentation made to the class as well as the written version of the final work. The results indicated that the students passed by the three dimensions, because they were able to read information, numbers, symbols, tables and charts, critically evaluating them, besides communicating arguments and making decisions. Regarding the contributions of the Mathematical Modeling methodological orientation to the development of this competence, it can be affirmed that it was fundamental, because statistical literacy occurs when meaning is found in the statistical data in several contexts and, for this reason, it is part of the way the reader places his thoughts and analysis, and considers the data a way to know and decipher the context of the research. Mathematical Modeling, starting from an initial situation in order to get to a desired final situation, requires a close look at all the information provided.

186Sumário
Proceedings of the 11th Southern Hemisphere Conference on the Teaching and Learning of Undergraduate Mathematics and Statistics ISBN 978-85-8167-237-3
THE EXPLOITATION OF VIDEOS IN TEACHER TRAINING
Márcia Jussara Hepp Rehfeldt
Ieda Maria Gingo
Marli Teresinha Quartieri
Universidade do Vale do Taquari – UNIVATES
This work is the result of an action developed in the research entitled “Methodological Strategies for Innovation and Curricular Reorganization in the Field of Mathematics Education in Primary Education”. The purpose of this study is to illustrate the implications of using a video about Mathematical Modeling in continuing teacher education. For the elaboration of the video, a script of actions was developed. Initially, several Mathematical Modeling practices developed by the members of the research were recorded. Then the editing of the images of the modeling practices and the creation of slides in an online platform occurred. Finally, the narration, the final edition and the finalization of the resource were carried out. The video, which lasted 8 minutes, contemplated definitions about mathematical modeling and illustrated the steps to be followed, according to some authors. Armed with the video, the research team carried out several training courses, among which: undergraduate students and teachers who already work in six local schools. After the training, a questionnaire was made available to verify the impact that the resource caused on the participants of the meetings. The answers were entered into the online TagCrowd software to account for the frequency of certain words. The most cited words were: clear, contributed, contribute, which specifically referred to videos. From the analysis of results, it is possible to affirm that the video of Mathematical Modeling contributed, in a clear way, to the understanding of the main characteristics of this tendency.

187Sumário
Proceedings of the 11th Southern Hemisphere Conference on the Teaching and Learning of Undergraduate Mathematics and Statistics ISBN 978-85-8167-237-3
A TALE OF TWO JOURNEYS
Barbara Miller-Reilly
Charles O’Brien
University of Auckland - New Zealand
Two decades ago we met: Charles, a young business man needing assistance with a debilitating fear of mathematics; Barbara, an experienced teacher of maths-avoidant adults, in the early stages of research for her doctorate. Both of us were embarking on big challenges. An initial six-month course enabled Charles to progress from viewing mathematics as “the most disgusting, unappealing building” to one “with form, balance and symmetry” and, on the other hand, the metaphors gathered from Charles became an illuminating part of Barbara’s PhD thesis. Recently Charles asked Barbara to teach him again, trying to meet the mathematical prerequisites for entry to a post-graduate business degree. This talk considers our reflections of our respective journeys over two decades. Charles’ experience is that overcoming mathematics anxiety during adulthood is a transition of major magnitude. The stages in Charles’ story are his perception of a need, his commitment to address the problem by taking specific actions to become more comfortable with mathematics, his recognition of a turning point having been reached, which has resulted in a change in his mathematical perspectives and concern for others with similar needs. Barbara felt a great personal achievement completing her doctorate, as it was the culmination of much of her previous experiences both in life and in her profession. It also resulted in further professional recognition, as well as personal and professional growth. We come from different sub-groups in society: an academically-able maths-avoidant adult; and a mature woman undertaking doctoral studies. Unexpectedly we each provided a crucial component of the other’s journey.

188Sumário
Proceedings of the 11th Southern Hemisphere Conference on the Teaching and Learning of Undergraduate Mathematics and Statistics ISBN 978-85-8167-237-3
EVALUATING THE EFFECTIVENESS OF CLICKERS TO OPTIMIZE PERFORMANCE IN A STATISTICS 100 COURSE
Fransonet Reyneke40
Lizelle Fletcher
Ansie Harding
University of Pretoria
This paper focuses on the role of audience response systems, i.e. clickers in a large first level statistics course. Various intervention strategies were introduced over a period of several years with a view to improve students’ learning and success rates. Departing from the traditional teaching model an online homework system was implemented, followed by the flipped classroom. Clickers were subsequently implemented to enable active and cooperative learning inside the lecture hall. This facilitates peer engagement and discussions amongst students who become more involved and enjoy using clickers. A clicker allows every student to submit an answer without fear of embarrassment by peers when answering incorrectly. Without clickers the same students tend to always answer the questions in class. Effective, anonymous feedback is another important advantage of clickers, not only for students but also for lecturers. Misconceptions of difficult concepts can immediately be dealt with and provide students with interaction opportunities. Class attendance can also be monitored and the influence of class attendance on performance be tested. More important is the versatility of clickers concerning assessment. There will always be human capacity constraints and therefore clickers should be used to its full potential in class. It should not only be used for formative, but also for summative assessment and both assessment processes are discussed and evaluated.

189Sumário
Proceedings of the 11th Southern Hemisphere Conference on the Teaching and Learning of Undergraduate Mathematics and Statistics ISBN 978-85-8167-237-3
A TALE OF TWO DIAGNOSTIC TESTS
Leanne J. Rylands41
School of Computing, Engineering and Mathematics, Western Sydney University, Sydney, Australia;
Donald Shearman42
Mathematics Education Support Hub, Western Sydney University, Sydney, Australia
It is not uncommon to use what are called diagnostic, placement, readiness or competency tests once students arrive at university to gauge their basic skills in mathematics or literacy. This paper begins by discussing diagnostic mathematics tests, including the many reasons for which these are run and what actions might then be taken.Two such tests with repercussions for students are discussed. These two tests are for different student cohorts and are run for different reasons. Their purposes and the actions taken as a result of the tests are considered. The tests have a positive impact on student learning.Keywords: first-year; mathematics; diagnostic; placement; readiness; competency.
190Sumário
Proceedings of the 11th Southern Hemisphere Conference on the Teaching and Learning of Undergraduate Mathematics and Statistics ISBN 978-85-8167-237-3
ENGAGING DISTANCE STUDENTS
Cami Sawyer
Massey University, New Zealand
Teaching an introductory university mathematics course for students studying by distance is challenging. Over the past 4 years I have been transforming a course covering the basics of algebra, matrices, and calculus, from being delivered primarily by paper to using technology. The course has had issues with engagement and preparedness because there are a large number of adult learners and students with full-time jobs. I am continually experimenting with combinations of incentives and disincentives to change student behaviour. I have incorporated online quizzes in the assessment and developed specialised videos for each topic. The videos are the change the students remark on the most. I will discuss what makes my videos different from Khan academy or other videos online, how I incorporate my teaching philosophy around student engagement into a directed teaching medium such as video, and other changes I am looking at exploring.

191Sumário
Proceedings of the 11th Southern Hemisphere Conference on the Teaching and Learning of Undergraduate Mathematics and Statistics ISBN 978-85-8167-237-3
CREATING A CONFIDENT COMPETENT QUESTIONING CULTURE
Anne D’Arcy-Warmington43
Heather Lonsdale
Curtin University
A key part of problem-solving lies in formulating effective questions. This is often discussed under the guise of reciprocal teaching and think-aloud strategies. In teaching the art of asking a good question can be a key factor for both students and staff. Many students (and staff!) don’t feel adequately equipped or confident enough to ask questions, and this can hinder the development of personal and academic skills. As a result, it is important to incorporate many facets of the art of questioning in a classroom setting. In this talk we will discuss a variety of techniques to encourage a culture of questioning in the classroom. A key element of this involves fostering a welcoming community where students feel comfortable expressing their ideas. We felt we should finish this abstract with a question; what do you think?Keywords: reciprocal teaching; think-aloud strategies; questioning techniques.

192Sumário
Proceedings of the 11th Southern Hemisphere Conference on the Teaching and Learning of Undergraduate Mathematics and Statistics ISBN 978-85-8167-237-3
FULL PAPERS
193Sumário
Proceedings of the 11th Southern Hemisphere Conference on the Teaching and Learning of Undergraduate Mathematics and Statistics ISBN 978-85-8167-237-3
VIRTUAL MATHEMATICS AND TEACHER TRAINING: USE OF INFORMATION AND COMMUNICATION TECHNOLOGIES IN
PUBLIC SPACES .
Lidermir de Souza Arruda44
Wenden Charles de Souza Rodrigues45
Salete Maria Chalub Bandeira46
Federal University of Acre
The purpose of this article is to present the actions of the virtual mathematical project that aims at the interaction of students involved with mathematics teaching and Information and Communication Technologies (ICT), using GeoGebra on smartphones or computers. The project was funded by the Acre Research Support Foundation (FAPAC) and counts on the partnership of the High Schools of the municipalities of Rio Branco and Tarauacá; College of Application of the Federal University of Acre (UFAC); Center for Educational Innovation (CRIE / SEE-AC) through the Institute of Mathematics, Sciences and Philosophy of Acre and UFAC. Teachers of these institutions acted as instructors of the Project Courses. Our methodological proposal is to train teachers that can “multiply” and disseminate the teaching of mathematics through the use of ICT both in the capital and in the small villages of Acre, one of the states located in the Amazon jungle. Courses were offered for five groups of twenty UFAC students, mostly scholarship holders of the Institutional Program of Teaching Initiation Scholarship (PIBID) to act as multipliers. In this paper we present the experience of a State School involved with the project and with five “Pibidians” students, to offer workshops for two hundred and fifty students of the first year of High School. Faculty form UFAC acted as advisors. Our work is based on that of Borba, Silva and Gadanidis (2015) which addresses the phases of digital technologies in Mathematics Education; Borba and Penteado (2005) with a focus on Informatics and Mathematics Education; Araújo e Nóbrega on learning mathematics with GeoGebra and others. As a partial result, the project in the training phase with the multipliers has been favorable to create a dynamic paradigm for teaching mathematics with current technologies.
REFERENCESARAÚJO, L. C. L. de; NÓBRIGA, J. C. C. Aprendendo matemática com o GeoGebra .
São Paulo: Editora Exato, 2010. Disponível em: <http://pt.calameo.com/read/0003741242ae2fb8b879e>. Acesso em: 29 fev. 2016.
BORBA, M. de C.; PENTEADO, M. G. Informática e Educação Matemática. 3. ed. Belo Horizonte: Autêntica, 2005. [Coleção Tendências em Educação Matemática].
BORBA, M. de C.; SILVA, R. S. R. da; GADANIDIS, G. Fases das tecnologias digitais em Educação Matemática: sala de aula e internet em movimento. 1. ed. Belo Horizonte: Autêntica, 2015. [Coleção Tendências em Educação Matemática].

194Sumário
Proceedings of the 11th Southern Hemisphere Conference on the Teaching and Learning of Undergraduate Mathematics and Statistics ISBN 978-85-8167-237-3
EXPLORING DOLLS CLOTHING AREA THROUGH MATHEMATICAL MODELING
Elise Candida Dente,
Márcia Jussara Hepp Rehfeldt47
Marli Teresinha Quartieri
Universidade do Vale do Taquari – UNIVATES
This work aims to present an activity explored during the research entitled Mathematical Modeling and its implications for the teaching and learning of Mathematics in the 5th year of Elementary School. The research is related to one Master’s Degree Program in Teaching of Exact Sciences. The activity was developed from the interest of the class: “playing”, because the pedagogical practice was explored enlighted by Mathematical Modeling based on the steps of Burak and Aragão (2012). To these authors, Modeling begins with chosing the theme, which is to be of interest for the students. In order to explore doll play we encourage students to determine the area of a doll’s clothing. To develop the practice, we provide for each pair of students some doll’s clothing and adhesive squares of 1 cm² area. After delivering the materials to the students we discussed with the class the concept of area and understood that this 1cm² was the surface occupied by a square. Then, the students began to glue the squares on the clothes and in a few moments one student already pondered “we just need to paste on one side and then make two times”. At this moment the mathematical model for solving the proposed problem emerges and this can be written as: the number of squares on one side of the clothing twice two.
REFERENCESBURAK, Dionísio; ARAGÃO, Rosália M. R. A modelagem matemática e relações com a
aprendizagem significativa. 1. Ed. Curitiba: Editora CRV, 2012.
195Sumário
Proceedings of the 11th Southern Hemisphere Conference on the Teaching and Learning of Undergraduate Mathematics and Statistics ISBN 978-85-8167-237-3
STATISTICAL LITERACY AND PROJECTS
Cassio Cristiano Giordano48
Pontifícia Universidade Católica de São Paulo
Statistical literacy is critical for academic education, for professional life, and, above all, for the exercise of empowerment in our society, given the ease of access to data streaming from diverse media. Reading and interpreting these data, as well as expressing ideas informed by them, have become essential for every individual. However, despite the principles conveyed in Brazilian national and state curriculum guidelines, the teaching and learning of statistics have not received their deserved space in São Paulo schools in the majority of textbooks marketed for use in high schools. Project-based teaching and learning of statistics constitute opportunities to promote statistical literacy. Moreover, this approach has the potential to change, in a notable manner, the relationship among teacher, student, and knowledge, promoting greater autonomy for students to develop their own research. To analyze the development of literacy and changes in the didactic contract under a project-based approach, a case study was conducted. The subjects were 43 students aged 17-20 years from the high school, who were distributed into nine groups of four or five members. During two months they participated in the entire process of developing a statistical investigation, from selecting themes and formulating research questions to the dissemination of results. The results revealed that this approach encourages the development of statistical literacy, creating conditions for a breach of the didactic contract – an important step in the development of students’ autonomy, preparing them for future challenges in their lives, the university, the labor market and any other situation.
196Sumário
Proceedings of the 11th Southern Hemisphere Conference on the Teaching and Learning of Undergraduate Mathematics and Statistics ISBN 978-85-8167-237-3
ANALYSIS OF RESOLUTIONS PROVIDED BY ENGINEERING COURSE STUDENTS FOR THE PROBLEMS PROPOSED, A
MEANINGFUL VIEW
Marjúnia Édita Zimmer Klein49
Universidade do Vale do Rio dos Sinos - UNISINOS
José Cláudio Del Pino50
Universidade Federal do Rio Grande do Sul
Instigated by the fact that Higher Education students express conceptual and procedural difficulties regarding the interpretation, analysis and solving of problems, and such skill being deemed necessary for the Calculus I subject, it was decided to investigate how students taking that subject solved problems. Taking as theoretical foundation Ausubel’s Theory of Meaningful Learning as proposed by David P. Ausubel and followed up, interpreted and complemented by Joseph D. Novak (Ausubel et al., 1980) and D. Bob Gowin (1981 apud MOREIRA, 2006), in which the main idea is to consider what learners already know and, by stating that, Ausubel intends to focus on the individual’s cognitive framework, that is, the ideas and contents they have regarding a given topic, it was intended to map out students’ previous ideas with the objective of teaching them accordingly by identifying the basic organizational concepts and utilizing resources that would facilitate learning in a meaningful fashion. Meaningful learning is a process through which a new piece of information interacts with the existing, specific knowledge framework (subsumer concept) resulting in a new piece of information that acquires a new meaning, including for the pre-existing subsumers. After categorizing the obtained solutions, it was perceived that most students did not use mathematical knowledge taught at school for the proposed problem solving, but did use resolutions that contained their own logical reasoning in such a way that equations appeared with low frequency.

197Sumário
Proceedings of the 11th Southern Hemisphere Conference on the Teaching and Learning of Undergraduate Mathematics and Statistics ISBN 978-85-8167-237-3
TEACHING INTERNSHIP: A SIGNIFICANT EXPERIENCE
Geovana Luiza Kliemann51
Maria Madalena Dullius
Amanda Gabriele Rauber
Romildo Pereira da Cruz
Universidade do Vale do Taquari – UNIVATES
This abstract describes part of the planning trajectory from the practice of teaching internship, developed in a classroom with 21 students, from courses of Architecture and Electrical Engineering, at the discipline of Introduction to the Exact Sciences, in the University of Vale do Taquari – UNIVATES, located in Lajeado, RS, Brazil. In this experience, we aimed to accomplish work that could be meaningful for the academic journey of students. This discipline aims to improve the ways of describing the behavior of dynamic situations, whether in the form of technical text, graphs, tables, or equations of Mathematical laws, and to solve theoretical and practical problems related to scientific areas. The classes occurred in expositive and dialogued way, highlighting important points and characteristics of the models. Other classes had practical or experimental approaches, with activities and exercises solved individually or in small groups, encouraging the use of technological resources, such as the scientific calculator and software. For example, the content of Vectors was approached by exploring GeoGebra, used for construction and better visualization of vectors, which helped the students in the comprehension of concepts and resolution of proposed problems. The use of technological resources enabled greater interaction and better comprehension of the approached content. The opportunity to experience this, interacting directly with undergraduate students and the professor of the discipline provided new knowledge and proximity with the responsibility of preparing professionals to act in the job market. Moreover, this reinforces our view of the importance of technological resources as facilitators in teaching and learning processes.

198Sumário
Proceedings of the 11th Southern Hemisphere Conference on the Teaching and Learning of Undergraduate Mathematics and Statistics ISBN 978-85-8167-237-3
SELECTED CALCULUS TOPICS: A DYNAMIC APPROACH USING GEOGEBRA
André Nagamine
Camila Macedo Lima Nagamine
Universidade Estadual do Sudoeste da Bahia
Rosane Leite Funato
Universidade Estadual de Santa Cruz
The process of teaching Differential and Integral Calculus (DIC) in Brazilian universities has been an object of study over several years. However, even in more recent research one aspect is common: the great difficulty presented by most students in understanding the subjects of these courses (Calculus I, Calculus II, etc.). A consequence of this fact is the high failure rate in DIC, which is also mentioned by several authors in the literature. Therefore, the objective of this work is to propose the use of the GeoGebra software, by the teacher, in certain topics of the DIC considered essential for the good understanding of this subject as a whole. The methodology consists in identifying which would be these essential points and then construct in GeoGebra a representation of that content that can facilitate the understanding of the points by the students. This methodology can be used in any of the courses of the DIC. We will use, as theoretical foundation, the theory of the Instrumental Approach, because within this theory GeoGebra would be what is considered as an instrument. In addition, we also rely on the Semiotic Representation Registry, because in the development of a certain topic of the DIC, GeoGebra allow us to obtain different records of representations of the objects studied.

199Sumário
Proceedings of the 11th Southern Hemisphere Conference on the Teaching and Learning of Undergraduate Mathematics and Statistics ISBN 978-85-8167-237-3
BUILDING GRAPHICS OF TWO-VARIABLE FUNCTIONS USING SLICEFORMS
Camila Macedo Lima Nagamine
Universidade Estadual do Sudoeste da Bahia
Rosane Leite Funato
Liliane Xavier Neves
Joedson de Jesus Santana
Universidade Estadual de Santa Cruz
André Nagamine
Universidade Estadual do Sudoeste da Bahia
In the study of the construction of graphs of functions of two variables we can visualize interesting mathematical objects. However, it is not always an easy task to represent them graphically, that is, a set of points in three-dimensional space whose coordinates obey a given law. In this sense, we present a proposal to assist in the construction of function graphs of two variables using the technique known as Sliceforms, starting from the interaction between the analytical and geometric representations of the function boundary maps of two previously selected variables, to explore the interactions between the Algebraic and graphical representations of these functions. Sliceforms is a technique that unites art and mathematics, allowing the construction of models that are made by intersecting sets of parallel regions parallel to each other, which together can generate interesting spatial surfaces. The structure of these models can be folded flat, as well as provide the spatial visualization of two sets of orthogonal patches with each other. Geogebra and Maple software were used to construct the sketches of the contours, contour map, function graphs and other mathematical objects we used for the construction of Sliceforms. For the development of learning with the help of the software in question and the concrete Sliceform model, approached as instruments, it is based on the Instrumental Approach.
200Sumário
Proceedings of the 11th Southern Hemisphere Conference on the Teaching and Learning of Undergraduate Mathematics and Statistics ISBN 978-85-8167-237-3