PROCEEDINGS AND PAPERS - mvcac.org€¦ · San Francisco Public Health, Environmental Health...
131
PROCEEDINGS AND PAPERS of the Eighty-Fifth Annual Conference of the Mosquito and Vector Control Association of California March 26 – 29, 2017 Held at the Hyatt Regency Mission Bay (San Diego) Editor: William K. Reisen, Ph.D. Professor Emeritus Department of Pathology, Microbiology and Immunology School of Veterinary Medicine University of California Davis, CA 95616 phone: 530-792-1865 email: [email protected] Layout and Editorial Assistance: Katelyn Hicks, MVCAC Mosquito and Vector Control Association of California 1 Capitol Mall, Suite 800 Sacramento, California 95816 Phone: 916-440-0826 • Fax: 916-444-7462 Email: [email protected] www.mvcac.org Published October 2017
Transcript of PROCEEDINGS AND PAPERS - mvcac.org€¦ · San Francisco Public Health, Environmental Health...

PROCEEDINGS AND PAPERS of the
Eighty-Fifth Annual Conference of the Mosquito and Vector Control Association of California
March 26 – 29, 2017Held at the Hyatt Regency Mission Bay (San Diego)
Editor: William K. Reisen, Ph.D.Professor Emeritus
Department of Pathology, Microbiology and ImmunologySchool of Veterinary Medicine
University of CaliforniaDavis, CA 95616
phone: 530-792-1865 email: [email protected]
Layout and Editorial Assistance: Katelyn Hicks, MVCAC
Mosquito and Vector Control Association of California1 Capitol Mall, Suite 800
Sacramento, California 95816Phone: 916-440-0826 • Fax: 916-444-7462
Email: [email protected]
Published October 2017

Mosquito and Vector Control Association of California Robert Achermann, Executive Director
BOARD OF DIRECTORS President: Jamesina Scott President-Elect: David HeftVice President: Jeremy WittiePast President: Kenn FujiokaChair, Trustee Advisory Council: Doug Walker Sacramento Valley Region Representative: Peter BonkrudeCoast Region Representative: Kenn KlemmeNorthern San Joaquin Region Representative: Eddie Lucchesi Southern San Joaqin Region Representive: Colin ReisSouthern Region: Rick Howard
TRUSTEE COUNCILChair: Doug WalkerVice Chair: John Dukes N. San Joaquin Valley Rep: Lynn Apland S. San Joaqyin Valley Rep: Rod Coburn Coastal Rep: Donna Rutherford
CORPORATE MEMBERS Coastal Region Alameda County MADAlameda County VCSDContra Costa MVCDMarin/Sonoma MVCDNapa County MADNo. Salinas Valley MADSan Benito County Agricultural CommissionSan Francisco Public Health, Environmental Health SectionSan Mateo County MVCDSanta Clara County VCDSanta Cruz County MVCDSolano County MAD
Sacramento Valley RegionCity of AlturasBurney Basin MADButte County MVCDColusa MADDurham MADEl Dorado County Environmental ManagementGlenn County MVCDLake County VCDOroville MADPine Grove MADPlacer MVCDSacramento-Yolo MVCDShasta MVCDSutter-Yuba MVCDTehama County MVCD
North San Joaquin Valley RegionEast Side MADMerced County MADSaddle Creek Community Services DistrictSan Joaquin County MVCDTurlock MAD
South San Joaquin Valley RegionConsolidated MADDelano MADDelta VCDFresno MVCDFresno Westside MADKern MVCDKings MADMadera County MVCDSouth Fork Mosquito Abatement District MADTulare Mosquito Abatement District (TMAD)West Side MVCD
Southern California RegionAntelope Valley MVCDCity of Moorpark/VCCity of Pasadena Public Health Department Coachella Valley MVCDCompton Creek MADGreater LA County VCDImperial County Vector ControlJune Lake Public Utility DistrictLong Beach Vector Control ProgramLos Angeles West Vector and Vector-borne Disease Control DistrictMosquito and Vector Management District of Santa Barbara CountyNorthwest MVCDOrange County Mosquito and Vector Control DistrictOwens Valley MAPRiverside County, Dept of Environmental Health VCPSan Bernardino County MVCSan Diego County Dept. of Environmental Health, Vector ControlSan Gabriel Valley MVCDVentura County Environmental Health DivisionWest Valley MVCD

2017 SUSTAINING MEMBERS
ADAPCOApplication Dynamics
AMVACAerial Services
Bayer Environmental Science BioQuip Products, Inc.
Central LifeClarke
DK EnvironmentalFrontier Precision, Inc.
FMC Corporation Leading Edge Associates, Inc.
Lite TraxSCI Consulting Group
Target Specialty Products Univar E.S.
Valent BioSciencesVector Disease Control International

William C. Reeves New Investigator Award Symposium
Entomological and socio-behavioral components of dog heartworm (Dirofilaria immitis) prevalence in two Florida communities ..............................................................................................................................1Nicholas A. Ledesma, Phillip E. Kaufman, Rui-De Xue, Christopher Leyen, Mark J. Macapagal, Olivia C. Winokur and Laura C. Harrington
Differentiating Geo-Spatiotemporal Aquatic Larval Habitats of Anopheles gambiae complex in Urban Agriculture and Urban Non-Agriculture Environments in Accra, Ghana .........................................4Sam Mckeever, Robert J. Novak, Benjamin Jacob, Dave D. Chadee, and Daniel Boakye
Symposium: Collaborative Disease Surveillance Programs
Surveillance for mosquito-borne encephalitis virus activity in California, 2016 ..............................................9Tina Feiszli, Kerry Padgett, Leslie Foss, Maria Salas, Jacklyn Wong, Sharon Messenger, Vicki Kramer, Jody Simpson, Ying Fang, and Chris Barker
Symposium: Invasive Aedes and Zika
Managing invasive Aedes under the threat of Zika and other exotic arboviruses ...........................................15Gimena Ruedas, Javier Romo, “Albo” Crew, Angela Brisco, Kimberly Nelson, Sam McKeever, Kenn Fujioka, and J. Wakoli Wekesa
Mapping past, present, and future climatic suitability for invasive Aedes aegypti and Aedes albopictus in the United States: a process-based modeling approach ...................................................18Marisa A. P. Donnelly, Matteo Marcantonio, Christopher M. Barker, Markus Neteler, Forrest Melton, and Annapaola Rizzoli
Boots on the Ground: Aedes Control in Los Angeles County ........................................................................21Mark A. Daniel
Combined applications of VectoBac® WDG with a Curtis DynaFog® LV-8 and AquaDUET® with a Clarke® ProMist against invasive Aedes in San Gabriel Valley, Los Angeles County, California ................................22Antonio Bishop, Darrin Jones, Gimena Ruedas, Angela Brisco, Ignacio Urena, Marco Gaytan, Steven Gallegos, Benjamin Waswa, Leslie Conner, Marta Tanaka, Sam Mckeever, Kenn Fujioka, and J. Wakoli Wekesa
Fighting Aedes aegypti in the California Desert ..............................................................................................24Jennifer A. Henke
Zika Control Communication and Treatment Implementation Strategies in San Diego County ....................26Nikos Gurfield and Eric Lardy
Aedes aegypti in California: Evaluating a novel strategy in response to a new invasion ................................27F. Steve Mulligan and Jodi Holeman
Braden Court: Comprehensive source reduction program to eliminate Aedes aegypti ...................................28Jodi Holeman, Katherine Ramirez, F. Steve Mulligan, and Mark Amorino
Volume 85 March 26-29, 2017
Model-based assessment of the vector potential of California’s urban mosquitoes for Zika virus .................29Christopher M. Barker
Finding Funding to Fight the New Guys in Town: Aedes Aegypti and Aedes Albopictus ...............................30John W. Bliss and Maria Garcia-Adarve
Field evaluation of a redesigned oviposition trap to monitor gravid invasive Aedes mosquitoes ...................31Dereje Alemayehu, Eric Haas-Stapleton, and Trinidad Reyes
Zika in the Rockies: Utah mosquito abatement districts aid CDC workers investigating two curious Zika infections ..............................................................................................................................32Gregory S. White and Ary Faraji
Using MALDI-TOF Mass Spectrometry to rapidly identify invasive Aedes eggs in California .....................33Olivia Winokur, Ying Fang, Sandra Garcia, Barbara A. Byrne, and Christopher M. Barker
Symposium: Community Engagement/Advocacy
Building Relationships
Importance of Relationship Building and Collaborating with Key Partners ...................................................35Luz Maria Robles
Using local CERT (Community Emergency Response Team) trained volunteers for assistance in West Nile virus outreach ..............................................................................................................................36Amanda Poulsen
Raising an army in the war on Zika .................................................................................................................37Kelly Middleton
Developing and Delivering “The Message”
Fighting invasive Aedes through education and outreach in Los Angeles .......................................................38Jason Farned
Voles, House Mice and NextDoor (Neighborhood Networking and Vector Control Services) .......................39Daniel Wilson
Strategic Issues Management
Fact, Fiction, and the Unbelievable Truth: Using community engagement workshops to identify public values and perceptions surrounding mosquito control activities and Zika response strategies .......................43Truc Dever
Volume 85 March 26-29, 2017
Volume 85 March 26-29, 2017
Measuring Success
Preparing residents in Clovis, CA for the release of 640,000 male Aedes aegypti into their neighborhood ....................................................................................................................................44Jodi Holeman
Development, implementation, and evaluation of repellent distribution pilot program ..................................45Ada Barros
Symposium: Statewide Mosquitofish Programs: Updates, Highlights, and a Glimpse into the Future
Old Bones, New Face: Managing a Mosquitofish Program from the Ground Up ...........................................46Sandi Courcier
Impact of Nutritional Supplementation with Spirulina and Chlorella on Development Rates and Pathogen Resistance of Gambusia Affinis .................................................................................................49Chris Ocegueda
South San Joaquin Valley Region Mosquitofish Health Workshop Review ....................................................53Katherine Ramirez
Observations of Mosquitofish Stocking Densities and Production in Intensive Aquaculture Systems ...........55Scott Schon
Testing the Effectiveness of Barley Straw as an Algaecide or Growth Inhibitor ............................................56Darrell Jew
Developing a Viable Supplemental Protein Feed for Mosquito Fish using Aquatic Organisms .....................57Darrell Jew
The Mosquitofish and Biocontrol Subcommittee: Looking Back and Ahead .................................................58Michael V. Saba
Symposium: Information Technology
CalSurv Gateway: mapping and data visualization tools for invasive Aedes ..................................................59Jody K. Simpson and Christopher M. Barker
Implementation of MapVision, a Geospatial Data Management System, and Entrance into the Information Age ...............................................................................................................................................60David Heft and Monica Patterson
Fighting Vector-borne Disease by Putting the Pieces Together with Geospatial Solutions .............................61Chad Minteer
Symposium: Operations
Alameda County Mosquito Abatement District 2016 Update .........................................................................62Ryan Clausnitzer
Update of Program Activities for the Alameda County Vector Control Services District ...............................63Robert B. Gay
Control of Urban Wildlife in Alameda County ................................................................................................64Michael Mooney
Vector control response to an elevated WNV health risk adjacent to sensitive natural habitat .......................65KariLyn Merlos, Jessica Dieckmann, and Nikos Gurfield,
Evidence-based entomological thresholds for adult mosquito control ............................................................66Pascale C. Stiles, and Christopher M. Barker
Continued aerial ULV adulticide trials in Salt Lake City Utah .......................................................................68Gregory S. White
Using the Vector Index to determine when to conduct aerial mosquito adulticide operations over urban areas in the Sacramento Valley ......................................................................................................69Sarah S Wheeler
Hidden Sources of Mosquitoes in the Underground Storm Water Conveyance Systems in the San Gabriel Valley, Los Angeles County, California .......................................................................................72Gilbert Holguin, Anthony Parker, Marco Gaytan, Sam McKeever, Marta Tanaka, Melvin Cook, J. Wakoli Wekesa, and Kenn Fujioka
What Lies Beneath: A Practical Approach to Mosquito Suppression in Underground Storm Drains .............74Kevin Vargas and Mark A. Daniel
Mandated trash capture devices: Impeding trash without impeding mosquito abatement ..............................75Joseph Huston, Ryan Clausnitzer, Erika Castillo, and Robert Ferdan
Mosquito Control Challenges at the Largest Waste Water Treatment Facility West of the Mississippi Hyperion Treatment Plant .............................................................................................................76Mark Brooks
The effect of a robust abatement policy on efforts to control mosquitoes in the San Gabriel Valley, Los Angeles County, California ..............................................................................................................................77Marta Tanaka, Marco Gaytan, Darrin Jones, Gilbert Holguin, Antonio Bishop, Hendricks Pena, Melvin Cook, J. Wakoli Wekesa, Kenn Fujioka
Symposium: Pesticide Resistance
Lysinibacillus sphaericus resistance in Culex pipiens in Salt Lake City, UT ..................................................78T. Steven Su, Jennifer Thieme, Taylor Lura, Min Lee Cheng, Greg White, and Ary Faraji
Volume 85 March 26-29, 2017
Volume 85 March 26-29, 2017
Evaluation of Natular G30 and Artesian Wells ................................................................................................79Scott Bradshaw
Culex erythrothorax: Temporal Pattern of Adult Activity and Resistance to Pesticides .................................80Allen Esterly, Dereje Alemayehu, Eric J Haas-Stapleton, Tina Sebay, Theresa Shelton, and Nayer Zahiri
Adulticides, Etofenprox and Pyrethrin: Lab and Field Investigations .............................................................81Noor S. Tietze, Glencijoy David, and Kayvon Solaimanpour
Organophosphate use as a pyrethroid resistance management strategy - why it may not be the solution we are looking for ..............................................................................................................................86Deborah Dritz, Kara Kelley and Paula Macedo
Lab and Field Assays of Adulticides ................................................................................................................87Jennifer A. Henke, Melissa Snelling, Gabriela Perezchica-Harvey, and Gregory White
Modeling the efficacy of aerial spraying on the relative abundance of Culex tarsalis and Culex pipiens ......88Karen M. Holcomb, Christopher M. Barker, and Robert C. Reiner
Symposium: Disease and Biology
Epidemiology of Zika virus in California ........................................................................................................90Wendy Jilek, Charsey Cole Porse, and Vicki Kramer
Establishment of an Aedes sierrensis colony for laboratory bioassays ...........................................................91Bret Barner, and Sarah Wheeler
Ovipositional responses of Culex tarsalis to fish-associated semiochemicals in laboratory bioassays ..........92Adena Why, William Walton, and Dong-Hwan Choe
Ectoparasite treatment of wild rodents in suburban parks to reduce ticks and tick-borne disease ..................94Theresa L. Shelton, Nayer Zahiri, Warren Macdonald, and Cherly Tina Sebay
The possible role of invasive Hedera (ivy) species in the amplification of Ixodes pacificus abundance and prevalence of Borrelia burgdorferi sensu stricto in a park in Oakland California ...................................95Bruce Kirkpatrick, Sutapa Biswas, Joyce E. Kleinjan, Natalia Fedorova, David James, Robert Gay, and Lucia T. Hui
Tick-borne disease surveillance in wild rodent populations ............................................................................97Warren P. Macdonald, Nayer Zahiri, Theresa Shelton, and Cherly Tina Sebay
Vector control, we mite have a problem: biting arthropods on a school campus .............................................98Tim Morgan, Steve Bennett, Laura Krueger, Jared Dever, and Robert Cummings
Increased incidence of tropical rat mite (Ornithonyssus bacoti) infestations in Alameda County ................104David K. James

Oriental cockroach ecology and control in residential Alameda County ......................................................105Cody Schaaf
The persistent threat of flea-borne typhus in the San Gabriel Valley, Los Angeles County, California ........108Kimberly Nelson, Angelo Brisco, Kenn Fujioka, J. Wakoli Wekesa, Alice Maina, Allen Richards, Curtis Croker, Chelsea Foo, Van Ngo, and Rachel Civen
Submitted Papers
Reverse Transcription Quantitative Polymerase Chain Reaction (RT-qPCR): Singleplex for West Nile Virus and Multiplex for WNV, St. Louis and Western Equine Encephalomyelitis Viruses ..........109Tianyun Su
Current Status of West Nile virus Dead Bird Surveillance Programs in the United States ...........................116Leslie Foss and Kerry Padgett
Volume 85 March 26-29, 2017
Volume 85 March 26-29, 2017
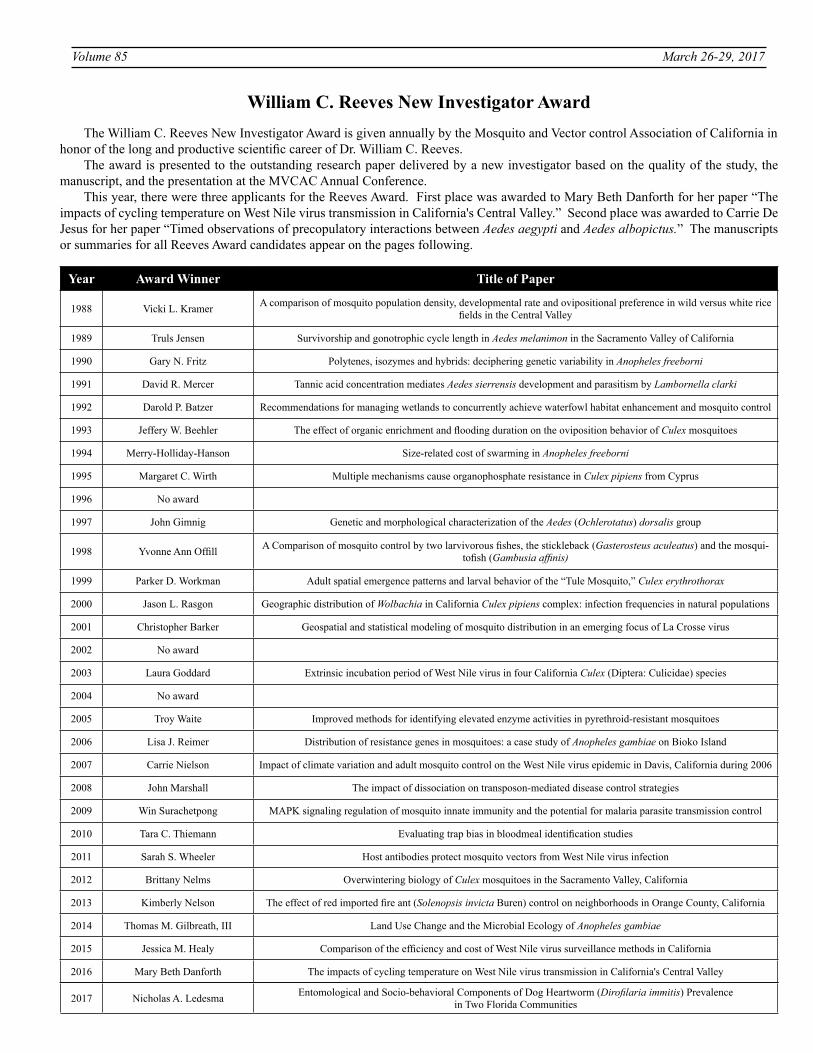
William C. Reeves New Investigator AwardThe William C. Reeves New Investigator Award is given annually by the Mosquito and Vector control Association of California in
honor of the long and productive scientific career of Dr. William C. Reeves.The award is presented to the outstanding research paper delivered by a new investigator based on the quality of the study, the
manuscript, and the presentation at the MVCAC Annual Conference. This year, there were three applicants for the Reeves Award. First place was awarded to Mary Beth Danforth for her paper “The
impacts of cycling temperature on West Nile virus transmission in California's Central Valley.” Second place was awarded to Carrie De Jesus for her paper “Timed observations of precopulatory interactions between Aedes aegypti and Aedes albopictus.” The manuscripts or summaries for all Reeves Award candidates appear on the pages following.
Year Award Winner Title of Paper
1988 Vicki L. Kramer A comparison of mosquito population density, developmental rate and ovipositional preference in wild versus white rice fields in the Central Valley
1989 Truls Jensen Survivorship and gonotrophic cycle length in Aedes melanimon in the Sacramento Valley of California
1990 Gary N. Fritz Polytenes, isozymes and hybrids: deciphering genetic variability in Anopheles freeborni
1991 David R. Mercer Tannic acid concentration mediates Aedes sierrensis development and parasitism by Lambornella clarki
1992 Darold P. Batzer Recommendations for managing wetlands to concurrently achieve waterfowl habitat enhancement and mosquito control
1993 Jeffery W. Beehler The effect of organic enrichment and flooding duration on the oviposition behavior of Culex mosquitoes
1994 Merry-Holliday-Hanson Size-related cost of swarming in Anopheles freeborni
1995 Margaret C. Wirth Multiple mechanisms cause organophosphate resistance in Culex pipiens from Cyprus
1996 No award
1997 John Gimnig Genetic and morphological characterization of the Aedes (Ochlerotatus) dorsalis group
1998 Yvonne Ann Offill A Comparison of mosquito control by two larvivorous fishes, the stickleback (Gasterosteus aculeatus) and the mosqui-tofish (Gambusia affinis)
1999 Parker D. Workman Adult spatial emergence patterns and larval behavior of the “Tule Mosquito,” Culex erythrothorax
2000 Jason L. Rasgon Geographic distribution of Wolbachia in California Culex pipiens complex: infection frequencies in natural populations
2001 Christopher Barker Geospatial and statistical modeling of mosquito distribution in an emerging focus of La Crosse virus
2002 No award
2003 Laura Goddard Extrinsic incubation period of West Nile virus in four California Culex (Diptera: Culicidae) species
2004 No award
2005 Troy Waite Improved methods for identifying elevated enzyme activities in pyrethroid-resistant mosquitoes
2006 Lisa J. Reimer Distribution of resistance genes in mosquitoes: a case study of Anopheles gambiae on Bioko Island
2007 Carrie Nielson Impact of climate variation and adult mosquito control on the West Nile virus epidemic in Davis, California during 2006
2008 John Marshall The impact of dissociation on transposon-mediated disease control strategies
2009 Win Surachetpong MAPK signaling regulation of mosquito innate immunity and the potential for malaria parasite transmission control
2010 Tara C. Thiemann Evaluating trap bias in bloodmeal identification studies
2011 Sarah S. Wheeler Host antibodies protect mosquito vectors from West Nile virus infection
2012 Brittany Nelms Overwintering biology of Culex mosquitoes in the Sacramento Valley, California
2013 Kimberly Nelson The effect of red imported fire ant (Solenopsis invicta Buren) control on neighborhoods in Orange County, California
2014 Thomas M. Gilbreath, III Land Use Change and the Microbial Ecology of Anopheles gambiae
2015 Jessica M. Healy Comparison of the efficiency and cost of West Nile virus surveillance methods in California
2016 Mary Beth Danforth The impacts of cycling temperature on West Nile virus transmission in California's Central Valley
2017 Nicholas A. Ledesma Entomological and Socio-behavioral Components of Dog Heartworm (Dirofilaria immitis) Prevalence in Two Florida Communities
Volume 85 Proceedings and Papers of the Mosquito and Vector Control Association of California 1
2017
Entomological and Socio-behavioral Components of Dog Heartworm (Dirofilaria immitis) Prevalence in Two Florida Communities*
Nicholas A. Ledesma1; Phillip E. Kaufman2; Rui-De Xue3;Christopher Leyen4; Mark J. Macapagal4; Olivia C. Winokur4; Laura C. Harrington4
1Department of Biological and Biomedical Sciences, College of Veterinary Medicine, Cornell University, Ithaca, NY 148532Entomology and Nematology Department, University of Florida, Gainesville, FL 32611
3Anastasia Mosquito Control District, 120 EOC Drive., St. Augustine, FL 320924Department of Entomology, 3131 Comstock Hall, Cornell University, Ithaca, NY 14853
*(A complete paper has been submitted to the Journal of the American Veterinary Medical Association)
INTRODUCTION
Despite the range of available veterinary treatments and macrocyclic lactone preventives, dog heartworm remains a major veterinary concern, challenged by pet owner compliance issues and macrocyclic lactone resistance in D. immitis (Geary et al. 2011, Bourginat et al. 2011, Brown et al. 2012). Becuse mosquitoes are the only known vectors of D. immitis (Phillips 1939, Bowman and Atkins 2009), vector control could be an important aspect of dog heartworm management; however, D. immitis can cycle between several species of definitive hosts, and the growing list of putative dog heartworm vectors in the United States includes at least 25 mosquito species in the Anopheles, Aedes, Culex, and Psorophora genera (Ledesma and Harrington 2011). Various biological and socio-behavioral components of heartworm risk have been proposed (Brown et al. 2012; Ledesma and Harrington 2011, 2015; Sacks et al. 2004; Fortin and Slocombe 1981; Knight and Lok 1998); however, no comprehensive study of these relationships has been conducted in heartworm-endemic communities. Our study provides a framework for incorporating resident knowledge and practices with local mosquito population data to incriminate key heartworm vector species and identify opportunities for improved messaging.
MATERIALS AND METHODS
Neighborhoods in Lake City (Columbia County), FL and St. Augustine South (St. John’s County), FL were chosen as study sites based on respectively high and low historical D. immitis prevalence in dogs. Knowledge, Attitudes and Practices questionnaires and larval mosquito inspections were performed following the methods of Tuiten et al (2009). Adult mosquito collections were conducted in each neighborhood using large Cornell vegetation aspirators (Ponlawat and Harrington 2005), BioGents (BG) traps, CO2-baited CDC traps, and resting boxes. Female mosquitoes were identified to species following published keys (Darsie and Morris 2003). Non-fed mosquito heads and thoraces were pooled by collection event and species. Blood-fed mosquitoes were processed individually and abdomens screened separately. We screened mosquitoes for D. immitis using primers specific to D. immitis cytochrome oxidase I and sequenced positive samples for confirmation (Rishniw et al. 2006). Factor independence from city, highest education, and dog
ownership were tested by χ2 analyses of each KAP category (df=1, p˂0.05). Adult mosquito collection data were standardized by collection-hours and trap-nights. Minimum infection rates were calculated for D. immitis-positive mosquito pools (Biggerstaff 2009).
RESULTS
Overall, 40.6% of residents knew that mosquitoes transmit dog heartworm; dog owners were more likely to know this the non-dog owners (60.8% vs 17.8%, p<0.001). Responses followed similar distributions when naming months of heartworm transmission and months of mosquito activity: over 80% included June, July, and August; the least frequently mentioned months for mosquito activity were November-February. Only 28.1% of responses correctly stated that mosquitoes were active all year, and only 41.4% of responses correctly indicated year-round heartworm risk. More St. Augustine residents correctly estimated treatment cost (31.7% vs 9.3%, p=0.011). Pet owners (n=70) identified their sources of dog heartworm information as follows: 67% (n=47) received heartworm information from their veterinarian; and equal numbers (8.6%, n=6) reported sources as a friend or family member, internet, other media, or had no source of heartworm information. The majority of pet owners (71.2%) had their dogs on heartworm preventive drugs. Only one had a cat on preventive. The top three reasons for non-compliance among pet owners (n=19) were not believing their pet was at risk, never considering that their pet could be infected, and/or not knowing why they were not administering preventive. Cost was the least common reason. Peridomestic larval inspections revealed that Aedes albopictus was the most abundant species (88.2%), followed by Culex quinquefasciatus (11.7%). Ae. albopictus and Cx. quinquefasciatus were the only potential vector species larvae on residents’ property, despite adult collections of Ae. aegypti near the same locations in St. Augustine. Adult mosquito collections captured 28 species, and collection effort was comparable between Lake City and St. Augustine. Ae. albopictus comprised most of the specimens collected and were trapped most effectively with BG and CO2-baited CDC traps. The most abundant species per collection time in Lake City were Ae. albopictus and Anopheles quadrimaculatus; Ae. albopictus also was the most abundant mosquito species in St. Augustine
2 Proceedings and Papers of the Mosquito and Vector Control Association of California Volume 85
2017
collections. An. quadrimaculatus were captured most efficiently by CO2-baited CDC traps in Lake Cityas were An. bradleyi/crucians;. anophelines were almost absent from St. Augustine collections. Abundance was evenly distributed among six species in Lake City, in contrast to the predominance of Ae. albopictus in St. Augustine collections. Ae. aegypti were collected from 3 sites in St. Augustine.Of 676 pools tested, six (0.9%) head/thorax pools were positive for D. immitis. Two blood-fed mosquito abdomens, Coquilletidia perturbans and Culiseta inornata, were positive for D. immitis while their respective individual heads/thoraces were negative. One mosquito pool of Ae. albopictus (n=12) whole bodies was positive. The highest point estimates of minimum infection rate per 100 tested in head/thorax screening were from Ae. aegypti (90.91) in St. Augustine and Cx. nigripalpus (52.63) in Lake City; however, all minimum infection rate 95% confidence intervals included 0, and therefore no further statistical conclusions were made from these estimates.
DISCUSSION
Residents’ understanding of dog heartworm transmission biology and risk was most often incorrect, and education level was associated only with knowing that dogs were hosts of heartworm. Lack of knowledge and awareness were prevalent: the majority of residents provided incorrect transmission routes for dog heartworm, they failed to describe heartworm transmission risk and mosquito activity as year round concerns in their area, and only a slight majority of all resident responses named dogs as potential heartworm hosts. Only one pet cat was on preventive, despite the risk of heartworm in cats. Our quantification of reasons for non-compliance is the first in the literature and, unexpectedly, cost was the least common reason. Lack of awareness and misperception of low risk were the top two reasons for non-compliance, presenting an opportunity for improved veterinarian-client communication. Traditional public messaging frequently advises residents to avoid dawn/dusk as times of high mosquito activity, and most residents in our study believed that mosquito activity was restricted to these periods; however, our peridomestic collections of Ae. albopictus (diurnal feeder) and Cx. quinquefasciatus (nocturnal feeder) were large in both locations. The ecological differences between mosquito populations in St. Augustine and Lake City support the need for evidence-based vector management. Larval collections were overwhelmingly dominated by Ae. albopictus in both St. Augustine and Lake City. When integrated with molecular screening results showing Ae. albopictus and Ae. aegypti pools positive for D. immitis in St. Augustine, it is clear that a comprehensive dog heartworm control program for that community should prioritize peridomestic container-breeding reduction. Lake City’s adult mosquito collection reflects a diverse mosquito ecology representing an array of life history characteristics, many of which rely on woodland areas, lakes, and temporary pools with submerged vegetation. In this case, a multi-modal approach to larval control is ideal, but would require intensive, invasive management of natural areas. Lake City should stress natural area avoidance during peak activity, give residents guidance for repellant use and physical barriers against mosquitoes,
and should improve messaging regarding dog heartworm risk. Our study is the first to confirm natural infection of United States populations of Ae. aegypti with D. immitis (Ledesma and Harrington 2011). An. quadrimaculatus was an abundant species in our collections, particularly in Lake City, where we also detected a D. immitis-positive pool of this species. Florida An. quadrimaculatus mosquitoes have proven to be a competent vector of dog heartworm in laboratory infections, and infected pools have been found in other field collections (Kartman 1953, Scoles 1998, Watts et al. 2001). Its abundance, mammal-biting preferences, and the detection of a naturally-infected pool make it a likely key heartworm vector in Lake City. Although we cannot infer a causal relationship between associations in our questionnaire findings, implications remain for public messaging from veterinarians and mosquito control districts. Most pet owners claimed that their veterinarian was their source for dog heartworm information, and some pet owners had no source of information. Access to veterinary care is likely the limiting factor, and this is an opportunity to expand messaging to media such as the Internet, television, and pamphlets; partnerships with mosquito control district officials could promote alternative means of disseminating information. Veterinary messaging can improve by discussing expenses associated with hospitalization and treatment in comparison to the relatively low cost of monthly prevention and veterinaryexaminations. Although cost was the least common reason for non-compliance, this could be due to unrealistic comparisons between cost of monthly preventive drugs and residents’ underestimation of veterinary fees. We found high peridomestic mosquito abundance, reinforcing the need to convey that an indoor lifestyle does not prevent pets from contracting dog heartworm. Providing local dog heartworm incidence in dogs or vector screening may help realize specific, local risk. Public messaging regarding mosquito reduction practices should improve perception of mosquitoes as a health risk. Future messaging may be improved by including pictures of mosquito larvae and examples of peridomestic mosquito developmental containers. This is the first community-scale dog heartworm KAP study, and also the first to relate mosquito abundance, infection rate, and peridomestic breeding sites to KAP findings. Our approach provides a customizable framework for evidence-based, integrated vector control strategies to target key vectors of dog heartworm and other vector-borne diseases.

Volume 85 Proceedings and Papers of the Mosquito and Vector Control Association of California 3
2017
REFERENCES CITED
Biggerstaff, B. J. 2009. PooledInfRate, Version 4.0: a Microsoft Office Excel Add-In to compute prevalence estimates from pooled samples. Version by B. L. Biggerstaff, Fort Collins, CO.
Bourguinat C., K. Keller, A. Bhan, A. Peregrine, T. Geary, and R. Prichard. 2011. Macrocyclic lactone resistance in Dirofilaria immitis. Vet Parasitol. 2011. doi:10.1016/j.vetpar.2011.04.012.
Bowman D.D., and C.E. Atkins. 2009. Heartworm biology, treatment, and control.Vet Clin North Am Small Anim Pract. 39(6): 1127–58, vii. doi:10.1016/j.cvsm.2009.06.003.
Brown H.E., L.C. Harrington, P.E. Kaufman, T. McKay, D.D. Bowman, C. T. Nelson, D. Wang, and R. Lund. 2012. Key factors influencing canine heartworm, Dirofilaria immitis, in the United States. Parasit Vectors. 5: 245. doi:10.1186/1756-3305-5-245.
Darsie R., C. Morris. 2003. Keys to the adult females and fourth instar larvae of the mosquitoes of Florida (Diptera, Culicidae). Florida Mosq. Contr. Assoc.
Fortin J., and J. Slocombe. 1981. Temperature requirements for the development of Dirofilaria immitis in Aedes triseriatus and Aedes vexans. Mosq News. 623-633.
Geary T.G., C. Bourguinat, and R.K. Prichard. 2011. Evidence for macrocyclic lactone anthelmintic resistance in Dirofilaria immitis. Top Companion Anim Med.26(4): 186–92. doi:10.1053/j.tcam.2011.09.004.
Kartman L. 1953. Factors influencing infection of the mosquito with Dirofilaria immitis (Leidy, 1856). Exp Parasitol. 2(1): 27-78.
Knight D.H., and J.B. Lok. 1998. Seasonality of heartworm infection and implications for chemoprophylaxis. Clin Tech Small Anim Pract. 13(2): 77–82.
Ledesma N., and L. Harrington. 2011. Mosquito vectors of dog heartworm in the United States: vector status and factors influencing transmission efficiency. Top Companion Anim Med. 26(4).
Ledesma N., and L. Harrington. 2015. Fine-scale temperature fluctuation and modulation of Dirofilaria immitis larval development in Aedes aegypti. Vet Parasitol. 209 (1), 93-100.
Sacks B.N., B.B. Chomel, and R.W. Kasten. 2004. Modeling the distribution and abundance of the non-native parasite, canine heartworm, in California coyotes. Oikos. 2004; 105(2): 415–425. doi:10.1111/j.0030-1299.2004.12749.x.
Phillips J. 1939. Studies on the transmission of Dirofilaria immitis in Massachusetts. Am J Epidemiol. 29.3: 121-129.
Ponlawat A., and L.C. Harrington. 2005. Blood feeding patterns of Aedes aegypti and Aedes albopictus in Thailand. J Med Entomol. 42(5): 844–849.
Rishniw M., S. Barr, and K. Simpson. 2006. Discrimination between six species of canine microfilariae by a single polymerase chain reaction. Vet Parasitol. 135 (3): 303-314.
Scoles G.A. 1998. Vectors of canine heartworm in the United States: a review of the literature including new data from Indiana, Florida, and Louisiana, pp. 21-36. In Recent Advances in Heartworm Disease: Symposium’98: Proceedings of the American Heartworm Society: 1–3 May 1998. Tuiten W., C.J.M. Koenraadt, K. McComas, and L.C. Harrington. 2009. The effect of West Nile virus perceptions and knowledge on protective behavior and mosquito breeding in residential yards in upstate New York. Ecohealth 6(1): 42–51. doi:10.1007/s10393-009-0219-z.
Watts K.J., G.R. Reddy, R.A. Holmes, J.B. Lok, D.H. Knight, G. Smith, and C.H. Courtney. 2001. Seasonal prevalence of third-stage larvae of Dirofilaria immitis in mosquitoes from Florida and Louisiana. J Parasitol. Apr; 87(2): 322-9.
4 Proceedings and Papers of the Mosquito and Vector Control Association of California Volume 85
2017
Differentiating Geospatial and Temporal Larval Habitats of Anopheles gambiae complex in Two Urban Agricultural and Non-Agricultural
Environments in Accra, Ghana
Sam Mckeever1, Robert J. Novak¹, Benjamin Jacob¹, Dave D. Chadee1,2, and Daniel Boakye3
1University of South Florida, Department of Global Health, Tampa, Florida, 33612, USA2The University of the West Indies, St. Augustine, Trinidad and Tobago.
3Noguchi Memorial Institute for Medical Research, University of Ghana, Accra, Ghana
Current Address of Corresponding Author:Sam Mckeever
San Gabriel Valley Mosquito and Vector Control District1145 N. Azusa Canyon Road, West Covina, CA 91790
T: (626) 814-9466; F: (626) 337-5686Email contact: [email protected]
ABSTRACT: To meet the rising demand for food in Ghana’s urban communities, agriculture has been encouraged to increase food security and improve nutrition. Urban agriculture, defined as the cultivation of crops and keeping of livestock at both the subsistence and commercial levels within open spaces in urban areas, is on the rise, with 60% of households in the City of Accra participating in “backyard farming.” Although these agricultural activities provide substantial benefits for this urban populace, they have been linked to the presence of suitable habitats for Anopheles gambiae complex larvae. Despite these observations, the spatial-temporal distribution of An. gambiae complex larvae and larval habitats within the city of Accra has not been established. A larval survey was conducted in the months of May, July through September, 2014 in two localities of Accra. Two sites designated as urban agriculture and the other two as urban non-agriculture were selected for the study. A total of 3,807 An. gambiae complex larvae were collected from the urban agriculture sites of Korle Bu and Opeibea,whereas the urban non-agriculture sites of Madina and Ashaiman yielded a total of 2,484 An. gambiae complex larvae. The results of this study show that the urban agriculture site of Korle Bu was the most productive with 2,604 An. gambiae complex larvae collected throughout the study period and 1,653 collected in July. Further investigation on larval habitats of An. gambiae complex in urban environments is necessary to better understand malaria transmission attributes unique to Accra, Ghana.
INTRODUCTION
Malaria is a significant cause of morbidity and mortality in Ghana with the entire population (of approximately 24.2 million people) at risk. The national healthcare facilities report an average 3.5 million cases of malaria annually, with children below five years of age accounting for more than 900,000 cases (Training Manual, 2014). The mosquito species responsible for malaria transmission in Ghana include the Anopheles gambiae complex and An. funestus (Training Manual, 2014). Anopheles gambiae complex in the region include Anopheles gambiae sensu stricto (s.s.), An. melas and An. arabiensis, and are morphologically indistinguishable. Anopheles gambiae sensu stricto which will be referred to as An. gambiae for the rest of this article, is primarily found in open, clean, sunlit waters and An. funestus is found in permanent waters (Opuku et al., 2007). The other species of An. gambiae complex such as An. melas are found in mangrove swamps of the southwest region of the country, and An. arabiensis are found in the northern savannah region. Larval control strategies to reduce Anopheles populations in the country are limited. In fact, the strategy for larval control by the Ghana National Malaria
Control Program is loosely defined as “few, fixed, findable” sources implying that services are far and apart. The national strategy is flawed because of its high cost and poor logistics (Wilmot, 2014), especially when larval control is often contracted out to an ineffective private organization called Labio-Pham (Wilmot, 2014). To meet the rising demand for food in Ghanaian urban communities, agriculture has been encouraged (Donovan et al., 2012). Despite the economic and nutritional benefits gained through increasing urban agriculture, the practice in Africa has been linked to creation of suitable habitats for Anopheles proliferation (Kudom et al., 2011). The relationship between urban agriculture and malaria transmission has been documented well. In 2006, communities closest to such agricultural activities within Accra had a higher prevalence of Anopheles larvae compared to those far away (Klikenburg et al., 2006). Moreover, entomological inoculation (EIR) and man biting rates (MBR) were notably higher in urban agricultural communities than non-agriculture communities (Klikenburg et al., 2008). In addition, high malaria infection rates and self-reporting cases have been known to occur among individuals residing within one kilometer of an urban agriculture plots (Stoler et al., 2009).

Volume 85 Proceedings and Papers of the Mosquito and Vector Control Association of California 5
2017
This study aimed to quantify An. gambiae complex larvae in two urban agriculture and two urban non-agriculture sites within the metropolis of Accra in Ghana by using remote sensed data and confirmed by overlaying field-collected data. In addition, this study seeks to produce and establish statistically significant outputs of geo-referenced larval habitat covariates using seasonal field-collected larval counts. The microhabitats for larval production in Accra’s metropolis can better be evaluated and individual larval outputs correlated to the malaria cases with geo-referenced data sets. The absence of such data on An. gambiae complex larval habitats, and lack of a robust larval sampling scheme has greatly hampered progress in understanding important malaria transmission attributes associated with urban-agriculture in the country.
METHODS
Study Area The study was conducted in Accra, Ghana during the month of May which is part of the dry season, and the months of July through September, 2014 which is the wet season. In Accra, the rainy season is split into two rainy seasons, the short and long rains. The short rains occur from June through August and long rain from September through November (Strategic Plan, 2014). The annual temperature ranges from 24 to 29°C, and relative humidity ranges from 10 to 100% in the southern part of the country. The capital City Accra is located to the south of the country within the Greater metropolis of Accra. The Greater Accra region has a total population of >4M people. Two urban agriculture sites of Korle Bu and Opeibea and two comparison urban non-agriculture sites of Ashaiman and Madina were selected for study. The urban agricultural sites of Korle Bu and Opeibea are located within the Accra Metropolis District which has a population of more than 1.8 million (Ghana Population Census, 2010).
Larval Habitat Sampling Larval habitats were mapped using a differentially corrected global positioning system (Garmin E-Trex GPS). A standard 200 ml dipper was used to collect larvae and after five dips per habitat, larvae were placed in Whirl-packs and transported to the Department of Parasitology at the Noguchi Memorial Institute for
Medical Research (NMIMR) for processing. Anopheles larvae were separated from culicine larvae and were divided into 1st and 2nd instars and 3rd and 4th instars. Geo-referenced larval habitat covariates were collected and measured at the field level. All covariates except HOUSE were recorded and measured at the field level (Table 1). The covariate identified as HOUSE was measured using Google Earth for accuracy. The larval habitat type was categorized either as a water pool (POOL), boot print (BOOT), abandoned septic tank (TANK), shallow ditch (DITCH), tire tracks (TIRE), residential rain gutter (GUTTER), animal hoof print (HOOF), or construction trench (TRENCH) covariates. In addition, the variable DEV was created to characterize study locations either as urban agriculture or urban non-agriculture sites.
Statistical Analysis The field geo-referenced larval habitat covariates were statistically analyzed using SAS 9.1.3 (SAS Institute Inc, 2014). A Poisson regression statistic was selected due to the utilization of count data in the model. In cases of over dispersion a negative binominal model was used. The Poisson model determined which geo-referenced covariates were most important in determining larval count for the months of May, and July through September. All the covariates used in the models were tested for collinearity using the Pearson product-moment correlation test.
RESULTSLarval Sampling A total of 6,291 An. gambiae complex larvae were collected from 91 larval habitats during the months of May, and July through September, 2014. The urban agriculture site of Korle Bu had the highest number of An. gambiae complex larvae (2,604 larvae) overall compared to the urban non-agriculture site of Madina that had the lowest number of An. gambiae complex larvae (1,185 larvae) (Figure 1). The combined collection of 3,807 An. gambiae complex larvae from the urban agriculture sites of Korle Bu and Opeibea
was greater than the 2,484 An. gambiae complex larvae collected at the non-agriculture sites of Madina and Ashaiman during the same period. The results show that urban agriculture site of Korle Bu was the most productive site with 2,604 An. gambiae complex larvae collected. The least productive site
Table 1: Model variables and description of larval habitat characteristics at four locations during the 2014 study period in Accra, Ghana
Figure 1: Collections of An. gambiae complex (n) larvae throughout the study period in 2014 in Accra, Ghana stratified by site
6 Proceedings and Papers of the Mosquito and Vector Control Association of California Volume 85
2017
across all months was Madina, an urban non-agriculture site, with a total of 1,185 An. gambiae complex larvae collected. For the month of May, a total of 1,517 An. gambiae complex larvae were collected from all sites. The urban agriculture site of Opeibea had the highest number of larvae (512 larvae) compared to Madina, a non-agriculture site with the lowest number of larvae (270 larvae). The most frequent An. gambiae complex larval habitats during May were categorized as POOL (11 out of 24 habitats), and the least frequent larval habitats were categorized as TIRE (1 out of 24 habitats) and TANK (1 out of 24 habitats). For the month of July, a total of 3,546 An. gambiae complex larvae were collected from all sites. The urban agriculture site of Korle Bu had the highest number of An. gambiae complex larvae (1,653 larvae) compared to the non-agriculture site of Opeibea which had the lowest number of larvae (428 larvae). In the same month, the most frequent An. gambiae complex larval habitat was categorized as DITCH (9 out of 24 habitats) and the least frequent larval habitats were categorized as HOOF (1 out of 24 habitats) and TANK (1 out of 24 habitats). For the month of August, a total of 456 An. gambiae larvae were collected from all sites under study - Korle Bu, Opeibea,
Madina, and Ashaiman. The urban agriculture site of Korle Bu had the highest number of An. gambiae complex larvae (186 larvae) compared to the non-agriculture site of Opeibea with the lowest number of larvae (79 larvae). The most frequent An. gambiae complex larval habitat during the month was categorized as DITCH (11 out of 20 habitats) and the least frequent larval habitats were categorized as GUTTER (1 out of 24 habitats), POND (1 out of 24 habitats), and TRENCH (1 out of 24 habitats). For the month of September, a total of 772 An. gambiae larvae were collected from all sites under study - Korle Bu, Opeibea, Madina, and Ashaiman. The urban agriculture site of Korle Bu had the highest number of An. gambiae complex larvae (347 larvae) compared to the non-agriculture site of Ashaiman, which had the lowest number of larvae (103 larvae). The most frequent An. gambiae complex larval habitat was categorized as BOOT (8 out of 24 habitats) and the least frequent larval habitats were categorized as TANK (1 out of 24 habitats) and TRENCH (1 out of 24 habitats).
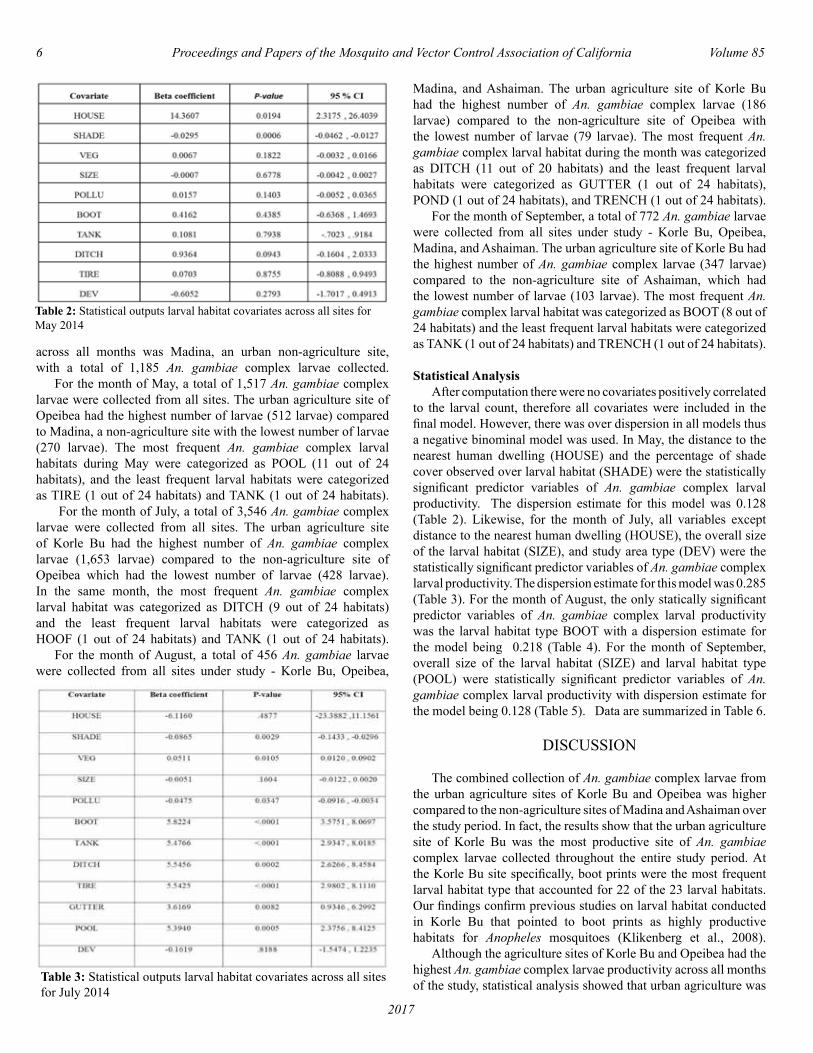
Statistical Analysis After computation there were no covariates positively correlated to the larval count, therefore all covariates were included in the final model. However, there was over dispersion in all models thus a negative binominal model was used. In May, the distance to the nearest human dwelling (HOUSE) and the percentage of shade cover observed over larval habitat (SHADE) were the statistically significant predictor variables of An. gambiae complex larval productivity. The dispersion estimate for this model was 0.128 (Table 2). Likewise, for the month of July, all variables except distance to the nearest human dwelling (HOUSE), the overall size of the larval habitat (SIZE), and study area type (DEV) were the statistically significant predictor variables of An. gambiae complex larval productivity. The dispersion estimate for this model was 0.285 (Table 3). For the month of August, the only statically significant predictor variables of An. gambiae complex larval productivity was the larval habitat type BOOT with a dispersion estimate for the model being 0.218 (Table 4). For the month of September, overall size of the larval habitat (SIZE) and larval habitat type (POOL) were statistically significant predictor variables of An. gambiae complex larval productivity with dispersion estimate for the model being 0.128 (Table 5). Data are summarized in Table 6.
DISCUSSION
The combined collection of An. gambiae complex larvae from the urban agriculture sites of Korle Bu and Opeibea was higher compared to the non-agriculture sites of Madina and Ashaiman over the study period. In fact, the results show that the urban agriculture site of Korle Bu was the most productive site of An. gambiae complex larvae collected throughout the entire study period. At the Korle Bu site specifically, boot prints were the most frequent larval habitat type that accounted for 22 of the 23 larval habitats. Our findings confirm previous studies on larval habitat conducted in Korle Bu that pointed to boot prints as highly productive habitats for Anopheles mosquitoes (Klikenberg et al., 2008). Although the agriculture sites of Korle Bu and Opeibea had the highest An. gambiae complex larvae productivity across all months of the study, statistical analysis showed that urban agriculture was Table 3: Statistical outputs larval habitat covariates across all sites
for July 2014
Table 2: Statistical outputs larval habitat covariates across all sites for May 2014

Volume 85 Proceedings and Papers of the Mosquito and Vector Control Association of California 7
2017
positively correlated with larval production only forthe month of August (the Beta Coefficient of 1.867). Since the month of August received the highest amount of rainfall during the study a negative relationship seemed to exist between An. gambiae complex larval habitat productivity within urban agriculture sites and rainfall exists. To successfully reduce malaria transmission in the city of Accra, the National Malaria Control Program must realize the importance of creating and implementing a robust vector surveillance program. This study served to provide baseline data for vector surveillance in urban environment focusing on the agricultural activities as the main source of mosquito production such environment. Similar surveillance studies can be used to guide interventions and assist in the reduction of malaria transmission.
ACKNOWLEDGMENTS I would like to express my sincere gratitude to my graduate advisor, Dr. Robert J. Novak for his guidance during my master of public health program at University of South Florida. I would also like to thank my committee members; Drs. Benjamin Jacob and Dave D. Chadee for their support and superb advice. This work would not have been possible without the tireless support and kindness of Sellase Pi-Bansa and Osei Akuoko. I thank Dr. Daniel Boakye for his generosity in providing his laboratory space at Noguchi Memorial Institute of Medical Research at the University of Ghana to facilitate this study. Last but not least I sincerely appreciate the efforts of Angela Brisco, Kimberly Nelson, and Dr. J. Wakoli Wekesa at San Gabriel Valley Mosquito and Vector Control District for their editorial help on the earlier versions of this manuscript.
Table 4: Statistical outputs larval habitat covariates across all sites for August 2014
Table 6: Monthly larval collections (means) and site descriptors across all sampling sites during the 2014 study in Accra, Ghana
Table 5: Statistical outputs larval habitat covariates across all sites for September 2014
8 Proceedings and Papers of the Mosquito and Vector Control Association of California Volume 85
2017
REFERENCES CITED
Accra Metropolitan. 2013. Ministry of Food and Agriculture. Republic of Ghana, Accra, Ghana.
Asafu-Adjaye, P. 2014. The tendency to urban farm in Accra: A cultural lag - labor surplus nexus, J. Third Wld. Studies 29: 159-182.
Afrane, Y.A., K.O. Daaku, P. Drechsel R. Garms, E. Klikenberg, and T. Kruppa. 2004. Does irrigated urban agriculture influence the transmission of malaria in the City of Kumasi, Ghana? Acta Trop. 89: 125-134.
Gillies, M.T., and M. Coetzee. 1987. A supplement to the Anophelinae of Africa south of the Sahara (Afrotropical Region) (Publication 55: 1-139). South African Institute for Medical Research, Johannesburg, South Africa.
President’s Malaria Initiative. 2013. Report of the Ghana urban malaria study. John Snow Institute, Inc. Washington, DC, USA: Retrieved on August 15, 2014, Webpage: http://www.jsi.com/Independent/Docs/GhanaUrbanMalariaStudy.pdf
Ghana Statistical Service. 2010. Ghana population census by region, district, and sex, Republic of Ghana., Accra, Ghana.
Klikenberg, E., P.J. McCall, M.D. Wilson, F. P. Amerasinghe, M.J. Donnelly. 2008. Impact of urban agriculture on malaria vectors in Accra, Ghana. Malaria Journal, 7:151| DOI:10.1186/1475-2875-7-151.
Klikenberg, E., P.J. McCall, M.D. Wilson, A.O. Akoto, F.P. Amerasinghe, I. Bates, F.H. Verhoeff, G. Barnish, M.J. Donnelly. 2006. Urban malaria and anemia in children: a cross-sectional survey in two cities of Ghana., Tropical Medicine and International Health, 11: 578-588.
Klikenberg, E., P.J. McCall I.M. Hastings, M.D. Wilson, F.P. Amerasinghe, M.J. Donnelly. 2005. Malaria and irrigated crops, Accra, Ghana. Emerging Infectious Diseases, 11: 1290-1293.
Kudom, A.A., B.A. Mensah, T.K. Agyemang. 2011. Characterization of mosquito larval habitats and assessment of insecticide-resistance status of Anopheles gambiae senso lato in urban areas in southwestern Ghana. Journal of Vector Ecology, 37: 77-82.
Opuku, A.A., O.D. Ansa-Asare J. Amoako. 2007. The occurrences and habitat characteristics of mosquitoes in Accra, Ghana. Council for Scientific and Industrial Research -Water Research Institute, Accra, Ghana.
Presidents Malaria Initiative. 2014. Ghana Malaria Operational Plan Financial Year 2014, Republic of Ghana, Accra, Ghana.
Stoler, J., J.R. Weeks, A. Getis, A.G. Hill. 2009. Distance threshold for the effect of urban agriculture on elevated self- reported malaria prevalence in Accra, Ghana. Am JTrop Med Hyg. 80: 547-554.
Strategic plan for malaria control in Ghana 2008-2015. 2014. Republic of Ghana, Accra, Ghana. Retrieved on August 15, 2014.
Training manual for the management of malaria at health facilities in Ghana. Republic of Ghana, Accra, Ghana.
Volume 85 Proceedings and Papers of the Mosquito and Vector Control Association of California 9
2017
Surveillance for Mosquito-borne Encephalitis Virus Activity in California, 2016
Tina Feiszli1, Kerry Padgett1, Jody Simpson2, Christopher M. Barker2, Ying Fang2, Jacklyn Wong1, Leslie Foss1, Maria Salas1, Sharon Messenger1, and Vicki Kramer1.
1 California Department Public Health, 1616 Capital Ave, Sacramento, CA 95899
2 Davis Arbovirus Research and Training,
University of California, Davis, CA, 95616(510) 412-6253; [email protected]
ABSTRACT: In 2016, the California surveillance program for mosquito-borne encephalitis virus activity tested humans, dead birds, mosquitoes, and sentinel chickens to detect arbovirus activity. West Nile virus (WNV) activity was widespread and elevated in several counties, although the number of human cases reported decreased compared to 2014 and 2015. Almost 500 human WNV infections were reported, and enzootic WNV activity was detected among dead birds, mosquitoes, and sentinel chickens. In addition to WNV, St. Louis encephalitis virus (SLEV) activity re-emerged in southern California and the Central Valley. Three human SLEV cases were reported, and enzootic SLEV activity was detected among mosquitoes and/or sentinel chickens located in nine counties.
INTRODUCTION
The California Arbovirus Surveillance program is a cooperative effort of the California Department of Public Health (CDPH), the University of California Davis Arbovirus Research and Training laboratory (DART), the Mosquito and Vector Control Association of California (MVCAC), local mosquito abatement and vector control agencies, county and local public health departments, and physicians and veterinarians throughout California. Additional local, state, and federal agencies collaborated on, and contributed to, the West Nile virus (WNV) component of the arbovirus surveillance program. In 2016, the surveillance program components included the following: (1) Diagnostic testing of specimens from human patients exhibiting symptoms of encephalitis, aseptic meningitis, acute flaccid paralysis, or with unexplained febrile illness of more than seven days. (2) Monitoring mosquito abundance and testing mosquitoes for the presence of St. Louis encephalitis virus (SLEV), WNV, western equine encephalomyelitis virus (WEEV), and other arboviruses as appropriate. (3) Serological monitoring of sentinel chickens for SLEV, WEEV, and WNV antibodies. (4) Reporting and WNV diagnostic testing of dead birds. (5) Monthly reporting of arbovirus test results to ArboNET, the national arbovirus surveillance system. (6) Weekly reporting of arbovirus activity in the CDPH Arbovirus Surveillance Bulletin and on the California WNV website: www.westnile.ca.gov. (7) Data management and reporting through the CalSurv Gateway, the California arbovirus surveillance system.
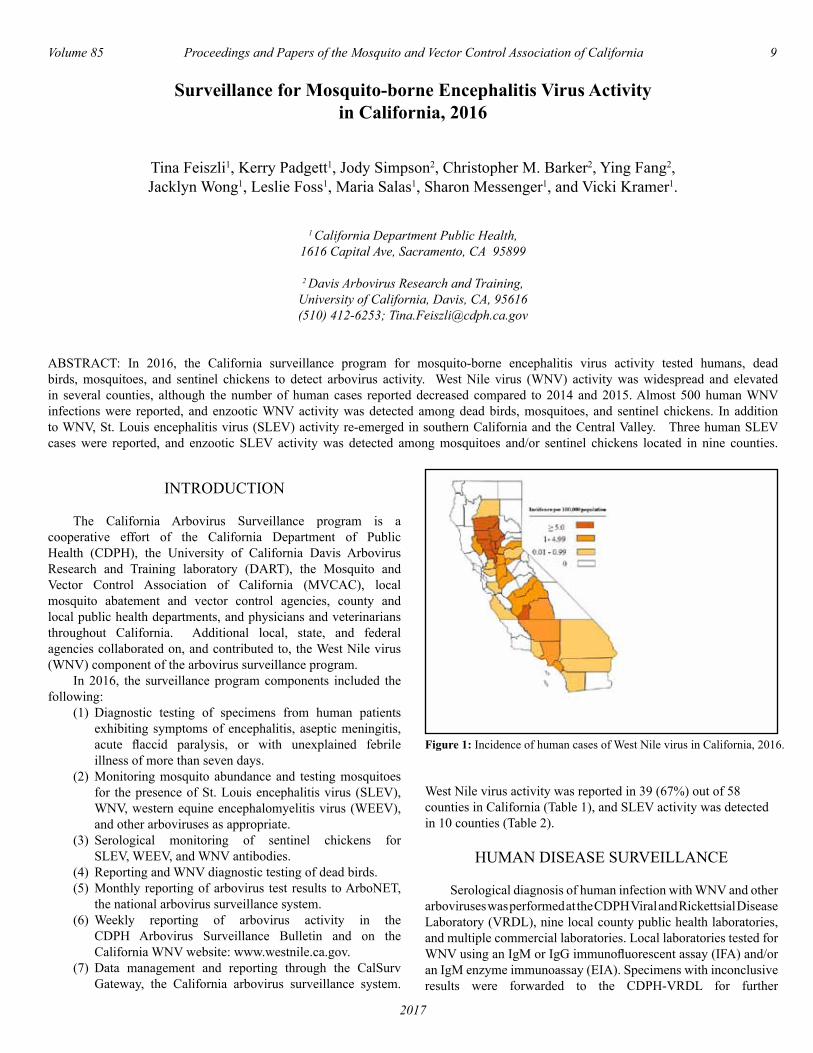
West Nile virus activity was reported in 39 (67%) out of 58 counties in California (Table 1), and SLEV activity was detected in 10 counties (Table 2).
HUMAN DISEASE SURVEILLANCE
Serological diagnosis of human infection with WNV and other arboviruses was performed at the CDPH Viral and Rickettsial Disease Laboratory (VRDL), nine local county public health laboratories, and multiple commercial laboratories. Local laboratories tested for WNV using an IgM or IgG immunofluorescent assay (IFA) and/or an IgM enzyme immunoassay (EIA). Specimens with inconclusive results were forwarded to the CDPH-VRDL for further
Figure 1: Incidence of human cases of West Nile virus in California, 2016.

10 Proceedings and Papers of the Mosquito and Vector Control Association of California Volume 85
2017
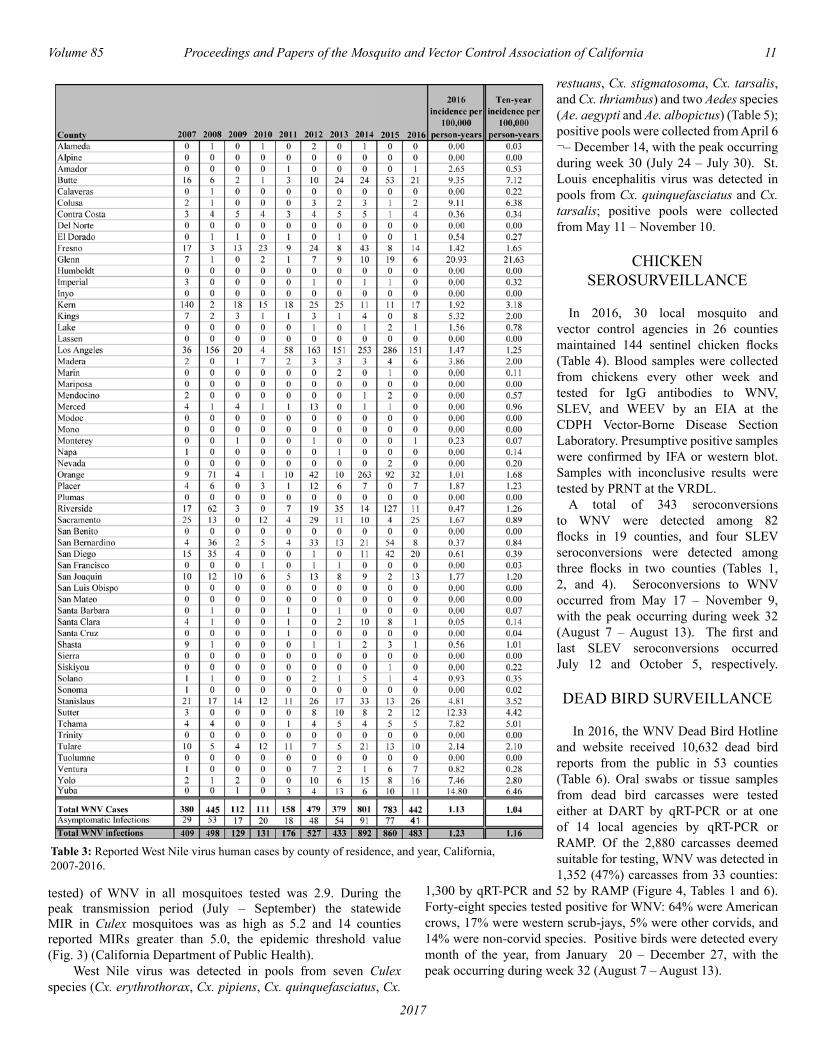
testing with a plaque reduction neutralization test (PRNT) or reverse transcriptase-polymerase chain reaction (RT-PCR). Additional WNV infections were identified through nucleic acid test screening performed by blood donation centers. In 2016, a total of 442 symptomatic and 41 asymptomatic infections with WNV were identified, a 43.8% decrease in infections compared to 2015 (Table 3). Of the 442 clinical cases, 329 (74%) were classified as West Nile neuroinvasive disease (i.e. encephalitis, meningitis, or acute flaccid paralysis) and 113 (26%) were classified as non-neuroinvasive disease. Case-patients were residents of 30 counties and 271 (61%) were male. Incidence was highest (20.9 cases per 100,000 persons) in Glenn County, although Los Angeles County reported the highest number of cases (Table 3, Figure 1). The median age for non-neuroinvasive disease cases was 57 years (range, 14 to 91 years), and neuroinvasive disease cases was 60 years (range, 2 to 94 years). The median age of the 19 WNV-associated fatalities was 76 years (range, 32 to 94 years). Dates of symptom onset ranged from June 12–December 9, with the peak occurring during week 32 (August 6 –August 12) (Figure 2). Three clinical cases of SLEV infection were identified in 2016. These were the first human cases of SLEV disease reported in California since 1997. All cases were diagnosed with neuroinvasive disease and one fatality was reported. Case-patients were residents of three counties (Table 2) and two were male. The median age was 68 years (range, 59 to 77) and dates of symptom onset ranged from July 1–September 2.
MOSQUITO SURVEILLANCE
Mosquito testing was performed at DART and 13 local mosquito and vector control agencies. DART tested mosquitoes for WNV, SLEV, and WEEV using a multiplex real-time (TaqMan) reverse transcriptase-polymerase chain reaction (qRT-PCR). Eight local agencies tested mosquitoes for WNV only using qRT-PCR or a commercial rapid assay-RAMP® (Rapid Analyte Measurement Platform, Response Biomedical Corp). Five local agencies tested for WNV, SLEV, and WEEV by qRT-PCR. A total of 44,934 mosquito pools were tested from 37 counties: 30,022 pools (832,018 mosquitoes) were tested for WNV, SLEV, and WEEV, and 14,912 pools (370,275 mosquitoes) were tested for WNV only. Aedes aegypti and Ae. albopictus mosquitoes were also tested for chikungunya, dengue, and Zika viruses at DART by a separate qRT-PCR. West Nile virus was detected in 3,528 mosquito pools from 31 counties (Tables 1 and 4), and SLEV was detected in 180 mosquito pools from eight counties (Table 2). Statewide, the annual minimum infection rate (MIR-defined as the minimum number of infected female mosquitoes per 1,000
Table 1: Infections with West Nile virus in California, 2016. Includes asymptomatic infections detected through blood bank screening. NT = None tested
Figure 2: Number of human cases of West Nile virus reported in California by week of symptom onset.
Table 2: Infections with St. Louis encephalitis virus in humans, mosquito pools, and sentinel chickens, by county, California, 2016. NT = None tested
Volume 85 Proceedings and Papers of the Mosquito and Vector Control Association of California 11
2017
tested) of WNV in all mosquitoes tested was 2.9. During the peak transmission period (July – September) the statewide MIR in Culex mosquitoes was as high as 5.2 and 14 counties reported MIRs greater than 5.0, the epidemic threshold value (Fig. 3) (California Department of Public Health). West Nile virus was detected in pools from seven Culex species (Cx. erythrothorax, Cx. pipiens, Cx. quinquefasciatus, Cx.
restuans, Cx. stigmatosoma, Cx. tarsalis, and Cx. thriambus) and two Aedes species (Ae. aegypti and Ae. albopictus) (Table 5); positive pools were collected from April 6 ¬– December 14, with the peak occurring during week 30 (July 24 – July 30). St. Louis encephalitis virus was detected in pools from Cx. quinquefasciatus and Cx. tarsalis; positive pools were collected from May 11 – November 10.
CHICKEN SEROSURVEILLANCE
In 2016, 30 local mosquito and vector control agencies in 26 counties maintained 144 sentinel chicken flocks (Table 4). Blood samples were collected from chickens every other week and tested for IgG antibodies to WNV, SLEV, and WEEV by an EIA at the CDPH Vector-Borne Disease Section Laboratory. Presumptive positive samples were confirmed by IFA or western blot. Samples with inconclusive results were tested by PRNT at the VRDL. A total of 343 seroconversions to WNV were detected among 82 flocks in 19 counties, and four SLEV seroconversions were detected among three flocks in two counties (Tables 1, 2, and 4). Seroconversions to WNV occurred from May 17 – November 9, with the peak occurring during week 32 (August 7 – August 13). The first and last SLEV seroconversions occurred July 12 and October 5, respectively. DEAD BIRD SURVEILLANCE
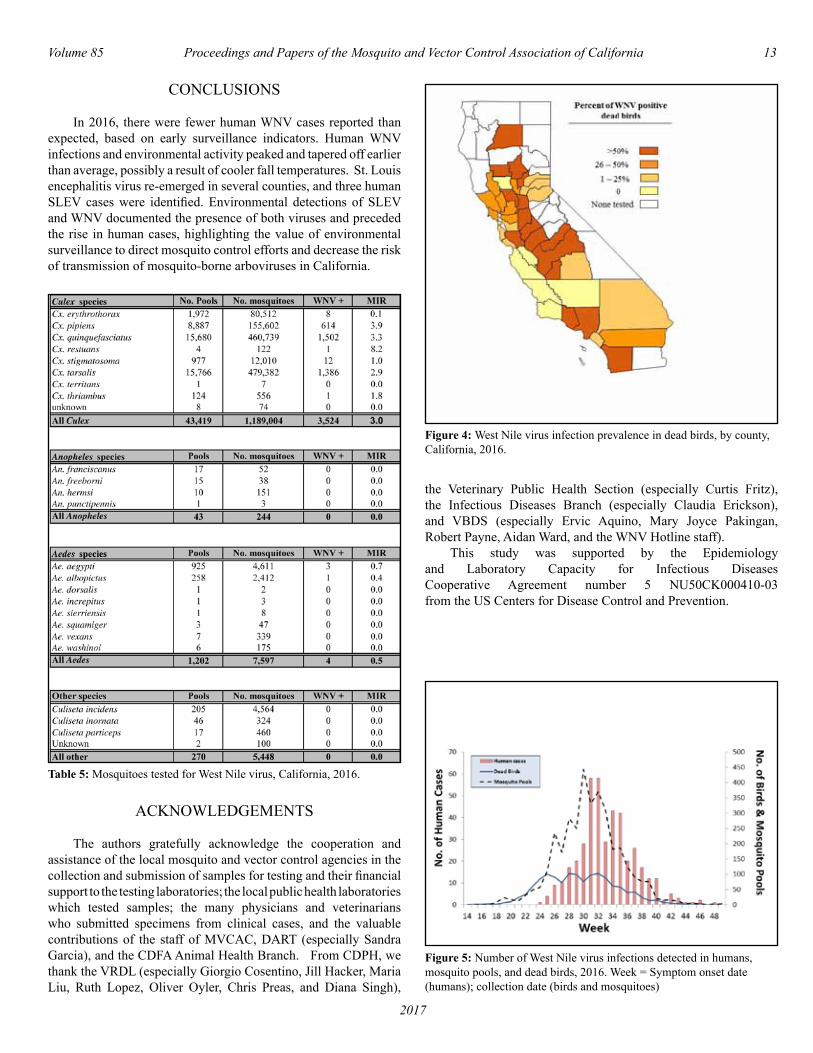
In 2016, the WNV Dead Bird Hotline and website received 10,632 dead bird reports from the public in 53 counties (Table 6). Oral swabs or tissue samples from dead bird carcasses were tested either at DART by qRT-PCR or at one of 14 local agencies by qRT-PCR or RAMP. Of the 2,880 carcasses deemed suitable for testing, WNV was detected in 1,352 (47%) carcasses from 33 counties:
1,300 by qRT-PCR and 52 by RAMP (Figure 4, Tables 1 and 6). Forty-eight species tested positive for WNV: 64% were American crows, 17% were western scrub-jays, 5% were other corvids, and 14% were non-corvid species. Positive birds were detected every month of the year, from January 20 – December 27, with the peak occurring during week 32 (August 7 – August 13).
Table 3: Reported West Nile virus human cases by county of residence, and year, California, 2007-2016.
12 Proceedings and Papers of the Mosquito and Vector Control Association of California Volume 85
2017
DISCUSSION
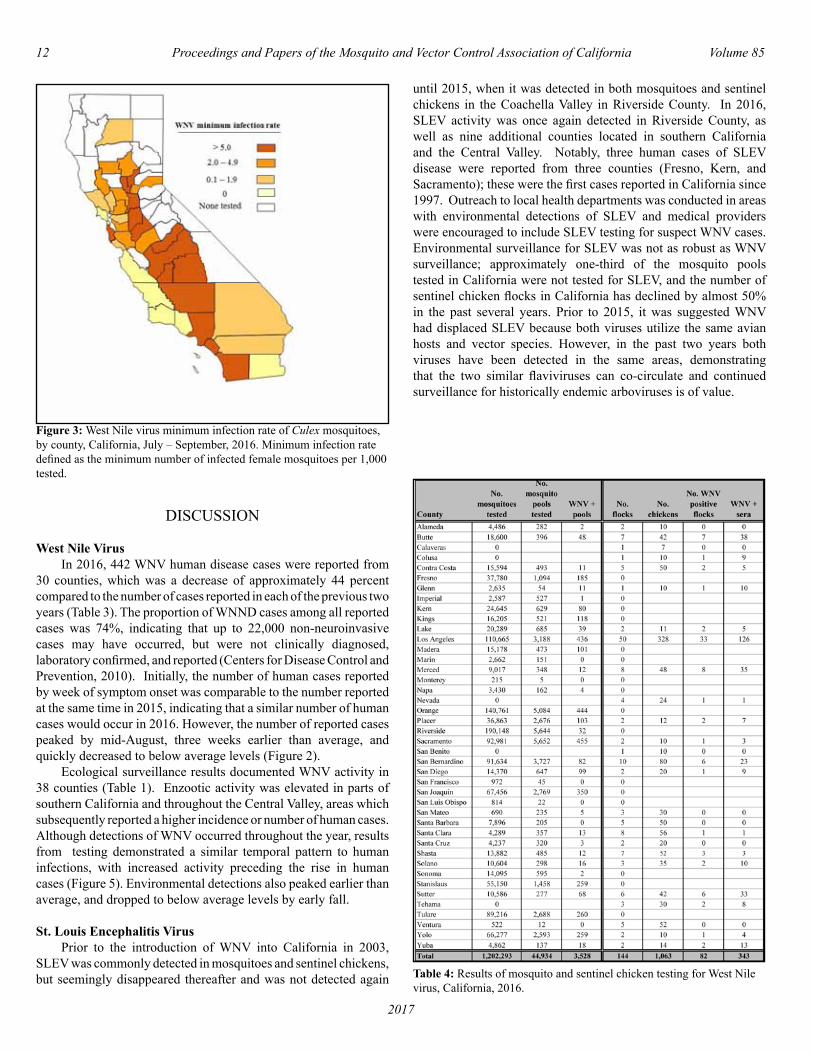
West Nile Virus In 2016, 442 WNV human disease cases were reported from 30 counties, which was a decrease of approximately 44 percent compared to the number of cases reported in each of the previous two years (Table 3). The proportion of WNND cases among all reported cases was 74%, indicating that up to 22,000 non-neuroinvasive cases may have occurred, but were not clinically diagnosed, laboratory confirmed, and reported (Centers for Disease Control and Prevention, 2010). Initially, the number of human cases reported by week of symptom onset was comparable to the number reported at the same time in 2015, indicating that a similar number of human cases would occur in 2016. However, the number of reported cases peaked by mid-August, three weeks earlier than average, and quickly decreased to below average levels (Figure 2). Ecological surveillance results documented WNV activity in 38 counties (Table 1). Enzootic activity was elevated in parts of southern California and throughout the Central Valley, areas which subsequently reported a higher incidence or number of human cases. Although detections of WNV occurred throughout the year, results from testing demonstrated a similar temporal pattern to human infections, with increased activity preceding the rise in human cases (Figure 5). Environmental detections also peaked earlier than average, and dropped to below average levels by early fall. St. Louis Encephalitis Virus Prior to the introduction of WNV into California in 2003, SLEV was commonly detected in mosquitoes and sentinel chickens, but seemingly disappeared thereafter and was not detected again
until 2015, when it was detected in both mosquitoes and sentinel chickens in the Coachella Valley in Riverside County. In 2016, SLEV activity was once again detected in Riverside County, as well as nine additional counties located in southern California and the Central Valley. Notably, three human cases of SLEV disease were reported from three counties (Fresno, Kern, and Sacramento); these were the first cases reported in California since 1997. Outreach to local health departments was conducted in areas with environmental detections of SLEV and medical providers were encouraged to include SLEV testing for suspect WNV cases. Environmental surveillance for SLEV was not as robust as WNV surveillance; approximately one-third of the mosquito pools tested in California were not tested for SLEV, and the number of sentinel chicken flocks in California has declined by almost 50% in the past several years. Prior to 2015, it was suggested WNV had displaced SLEV because both viruses utilize the same avian hosts and vector species. However, in the past two years both viruses have been detected in the same areas, demonstrating that the two similar flaviviruses can co-circulate and continued surveillance for historically endemic arboviruses is of value.
Figure 3: West Nile virus minimum infection rate of Culex mosquitoes, by county, California, July – September, 2016. Minimum infection rate defined as the minimum number of infected female mosquitoes per 1,000 tested.
Table 4: Results of mosquito and sentinel chicken testing for West Nile virus, California, 2016.
Volume 85 Proceedings and Papers of the Mosquito and Vector Control Association of California 13
2017
CONCLUSIONS
In 2016, there were fewer human WNV cases reported than expected, based on early surveillance indicators. Human WNV infections and environmental activity peaked and tapered off earlier than average, possibly a result of cooler fall temperatures. St. Louis encephalitis virus re-emerged in several counties, and three human SLEV cases were identified. Environmental detections of SLEV and WNV documented the presence of both viruses and preceded the rise in human cases, highlighting the value of environmental surveillance to direct mosquito control efforts and decrease the risk of transmission of mosquito-borne arboviruses in California.
ACKNOWLEDGEMENTS
The authors gratefully acknowledge the cooperation and assistance of the local mosquito and vector control agencies in the collection and submission of samples for testing and their financial support to the testing laboratories; the local public health laboratories which tested samples; the many physicians and veterinarians who submitted specimens from clinical cases, and the valuable contributions of the staff of MVCAC, DART (especially Sandra Garcia), and the CDFA Animal Health Branch. From CDPH, we thank the VRDL (especially Giorgio Cosentino, Jill Hacker, Maria Liu, Ruth Lopez, Oliver Oyler, Chris Preas, and Diana Singh),
the Veterinary Public Health Section (especially Curtis Fritz), the Infectious Diseases Branch (especially Claudia Erickson), and VBDS (especially Ervic Aquino, Mary Joyce Pakingan, Robert Payne, Aidan Ward, and the WNV Hotline staff). This study was supported by the Epidemiology and Laboratory Capacity for Infectious Diseases Cooperative Agreement number 5 NU50CK000410-03 from the US Centers for Disease Control and Prevention.
Figure 4: West Nile virus infection prevalence in dead birds, by county, California, 2016.
Figure 5: Number of West Nile virus infections detected in humans, mosquito pools, and dead birds, 2016. Week = Symptom onset date (humans); collection date (birds and mosquitoes)
Table 5: Mosquitoes tested for West Nile virus, California, 2016.

14 Proceedings and Papers of the Mosquito and Vector Control Association of California Volume 85
2017
REFERENCES CITED
California Department of Public Health. 2015. California Mosquito-Borne Virus Surveillance and Response Plan. http://westnile.ca.gov/resources.php
Centers for Disease Control and Prevention. 2010. Surveillance for Human West Nile Virus Disease—United States, 1999–2008. MMWR. 59: 1-17.
Table 6: Dead birds reported, tested, and positive for West Nile virus, California 2016.
Volume 85 Proceedings and Papers of the Mosquito and Vector Control Association of California 15
2017
Managing invasive Aedes under the threat of Zika and other exotic arboviruses
Gimena Ruedas, Javier Romo, “Albo Crew,” Angela Brisco, Kimberly Nelson, Kenn Fujioka and J. Wakoli Wekesa1
San Gabriel Valley Mosquito and Vector Control District1145 N Azusa Canyon Rd, West Covina, CA 91790
1E-mail: [email protected]
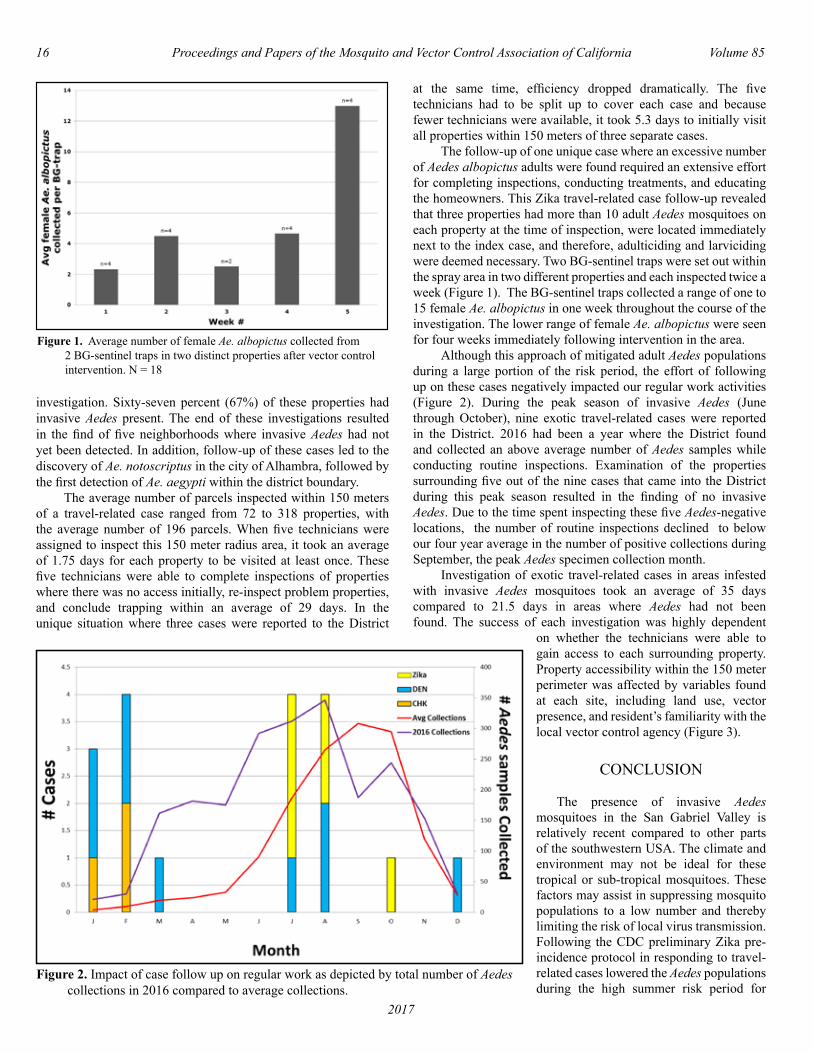
ABSTRACT: The year 2016 was challenging for vector control agencies state-wide, and the San Gabriel Valley Mosquito and Vector Control District (District) in particular, following five years controlling Aedes albopictus and two years controlling Aedes notoscriptus. In addition in June 2016, Aedes aegypti was found in the City of Alhambra. Managing these invasive Aedes under the threat of Zika, dengue or chikungunya virus introduction made it challenging. As travel-related cases within the District were reported through the Los Angeles County Health Department, the District determined, using the CDC Zika Interim Response Plan for vector agencies, whether there were Aedes present in the area. If Aedes were found within the health risk area, proper mosquito control measures were taken to reduce or mitigate the potential for new arboviral disease outbreak(s). Here we present the results of using these methods.
BACKGROUND
Aedes albopictus was introduced into Southern California in 2001 and subsequent efforts to eradicate this mosquito seemed to have been successful (Linthicum et al., 2003). In 2011, a large population of Ae. albopictus was identified in the City of El Monte to which, our invasive Aedes control team (also known as the “Albo Crew”) devoted extensive efforts to control (Brisco et al., 2015, Wekesa et al., 2014). By the end of 2016, Ae. albopictus had been confirmed in 22 of the 23 cities within the District. A second invasive species, Ae. notoscriptus, native to Australia and New Guinea, was detected in the cities of Monterey Park and Montebello in June of 2014 and has since been found in the cities of Alhambra and Rosemead. In 2015, an Aedes aegypti infestation was discovered outside our District’s eastern and western boundaries and was expected to spread throughout the San Gabriel Valley within one to two years (Yoshimizu et al., 2016). Aedes aegypti finally arrived in the San Gabriel Valley in 2016. In June 2016, Ae. aegypti was found in the City of Alhambra, in August it was detected in Monterey Park and Rosemead, and in October it was found in the City of Pomona. The presence of these mosquitoes was daunting due to arboviral activity in the Americas. In 2013 there was a Chikungunya outbreak in the Caribbean and there were predictions that dengue would increase due to weather patterns in 2014 (Akpan, 2016). In 2015, the Zika disease outbreak, originally discovered in Brazil, spread rapidly into South and Central America and was anticipated to arrive in the United States in 2016 (Bogoch 2016). Managing three invasive Aedes vector species under the threat of chikungunya, dengue and Zika virus introduction by travelers provided a serious challenge to the District.
MATERIALS AND METHODS
The invasive Aedes surveillance and control plan for 2016 at the San Gabriel Valley Mosquito and Vector Control District (District) focused on reducing the abundance of the three Aedes species and their potential for transmitting chikungunya, dengue
and Zika viruses to humans. The plan was modelled on phase 1 of the 2016 CDC Zika Interim Response Plan for the pre-incident stage for vector control agencies. Phase 1 required inspection and, if necessary, treatment of all properties for invasive Aedes within 150 meters from a travel-related case as reported to the District by the Los Angeles County Public Health Department. Properties not accessed during the first round of inspection received a “door hanger” requesting access. Once access was granted technicians inspected the entire property for any larval sources, or for presence of eggs, larvae, pupae, and adult mosquitoes. Duet™ or Aqua Duet™ adulticide were used as a quick knock-down on properties that had ten or more adult Aedes mosquitoes present. BioGents (BG)-sentinel traps were placed on properties that had invasive adult Aedes activity. The BG-sentinel traps were serviced by replacing the nets once every two days for 35 days. Adult mosquitoes collected from BG-sentinel traps were brought to the laboratory, identified, and females were pooled by species and sent for arboviral testing at the UC Davis Arbovirus Research and Training (DART). Whenever immature stages of invasive Aedes were found, a sample was collected and the source treated by either source reduction (removal of container) or by applying larvicide(s). Properties that had multiple breeding containers were scheduled for backpack larviciding using VectoBac® WDG within two days. If no sign of invasive Aedes was found, and the location looked conducive for invasive Aedes harborage, oviposition traps (ovitraps) were placed on properties within the investigation area and paper strips were replaced weekly. All progress and data collected was reported to Los Angeles County Department of Public Health at the conclusion of the exotic case follow-up.
RESULTS/DISCUSSION
By the end of 2016 there had been a total of three chikungunya, eleven dengue, and six Zika travel-related cases, ten of which occurred during the peak of the Aedes season. A total of 1,330 properties were inspected relating to travel-related disease
16 Proceedings and Papers of the Mosquito and Vector Control Association of California Volume 85
2017
investigation. Sixty-seven percent (67%) of these properties had invasive Aedes present. The end of these investigations resulted in the find of five neighborhoods where invasive Aedes had not yet been detected. In addition, follow-up of these cases led to the discovery of Ae. notoscriptus in the city of Alhambra, followed by the first detection of Ae. aegypti within the district boundary. The average number of parcels inspected within 150 meters of a travel-related case ranged from 72 to 318 properties, with the average number of 196 parcels. When five technicians were assigned to inspect this 150 meter radius area, it took an average of 1.75 days for each property to be visited at least once. These five technicians were able to complete inspections of properties where there was no access initially, re-inspect problem properties, and conclude trapping within an average of 29 days. In the unique situation where three cases were reported to the District
at the same time, efficiency dropped dramatically. The five technicians had to be split up to cover each case and because fewer technicians were available, it took 5.3 days to initially visit all properties within 150 meters of three separate cases. The follow-up of one unique case where an excessive number of Aedes albopictus adults were found required an extensive effort for completing inspections, conducting treatments, and educating the homeowners. This Zika travel-related case follow-up revealed that three properties had more than 10 adult Aedes mosquitoes on each property at the time of inspection, were located immediately next to the index case, and therefore, adulticiding and larviciding were deemed necessary. Two BG-sentinel traps were set out within the spray area in two different properties and each inspected twice a week (Figure 1). The BG-sentinel traps collected a range of one to 15 female Ae. albopictus in one week throughout the course of the investigation. The lower range of female Ae. albopictus were seen for four weeks immediately following intervention in the area. Although this approach of mitigated adult Aedes populations during a large portion of the risk period, the effort of following up on these cases negatively impacted our regular work activities (Figure 2). During the peak season of invasive Aedes (June through October), nine exotic travel-related cases were reported in the District. 2016 had been a year where the District found and collected an above average number of Aedes samples while conducting routine inspections. Examination of the properties surrounding five out of the nine cases that came into the District during this peak season resulted in the finding of no invasive Aedes. Due to the time spent inspecting these five Aedes-negative locations, the number of routine inspections declined to below our four year average in the number of positive collections during September, the peak Aedes specimen collection month. Investigation of exotic travel-related cases in areas infested with invasive Aedes mosquitoes took an average of 35 days compared to 21.5 days in areas where Aedes had not been found. The success of each investigation was highly dependent
on whether the technicians were able to gain access to each surrounding property. Property accessibility within the 150 meter perimeter was affected by variables found at each site, including land use, vector presence, and resident’s familiarity with the local vector control agency (Figure 3).
CONCLUSION
The presence of invasive Aedes mosquitoes in the San Gabriel Valley is relatively recent compared to other parts of the southwestern USA. The climate and environment may not be ideal for these tropical or sub-tropical mosquitoes. These factors may assist in suppressing mosquito populations to a low number and thereby limiting the risk of local virus transmission. Following the CDC preliminary Zika pre-incidence protocol in responding to travel-related cases lowered the Aedes populations during the high summer risk period for
Figure 1. Average number of female Ae. albopictus collected from 2 BG-sentinel traps in two distinct properties after vector control intervention. N = 18
Figure 2. Impact of case follow up on regular work as depicted by total number of Aedes collections in 2016 compared to average collections.

Volume 85 Proceedings and Papers of the Mosquito and Vector Control Association of California 17
2017
exotic arbovirus transmission. In addition, by surveying properties near all cases the District identified invasive Aedes in neighborhoods where they had not yet been detected previously. The ability to sustain this workload was dependent upon several factors; however, as the number of travel-related cases increased, follow-up on every incident becomes less sustainable. With multiple concurrent cases, the work-force was divided leaving fewer technicians per case to complete inspections. The presence of Aedes within the 150 meters of the index case also increased the work-load to mitigate mosquito populations. In addition, when cases were in areas with mixed land use, technicians were able to access more properties in a shorter amount of time.
ACKNOWLEDGEMENTS
We thank the “Albo Crew” for 2016 as they were instrumental in completing the investigations for each travel-related exotic disease case. The 2016 "Albo Crew" included Jacqueline Cordova, Elrich Delgado, Christopher Figueroa, Martha Gonzalez, Schuyler Harvey, Fred Ibarra, Brandon Hugh, Eric Luong, Leticia Rios, Javier Romo, and Gimena Ruedas. We also appreciate the support from residents of those cities in the District who allowed us access to their property to inspect for invasive Aedes.
Figure 3. Variables affecting access rate during exotic arbovirus disease follow-up. N = 2191
REFERENCES CITED
Akpan, Nsikan. 2016. If you get chikungunya this summer, maybe blame El Niño. Retreived from http://www.pbs.org/ newshour/updates/el-nino-tropical-disease-zika- chikungunya-dengue-plague/
Bogoch, I. I., O. J. Brady, M.U.G Kraemer, M. German, M.I. Creatore, et. al. 2016. Anticipating the international spread of Zika virus from Brazil. Correspondence. 387: 335-336. doi: 10.1016/S0140-6736(16)00080-5.
Brisco, A., “The Albo Crew”, K. Fujioka, J.W. Wekesa. 2015. Eradication of Aedes albopictus in the San Gabriel Valley, California is doubtful using current methodologies. Proc. Mosq. Vector Control Assoc. Calif. 83: 22-23.
Linthicum, K.J., V.L. Kramer, M.B. Madon, K. Fujioka and the Surveillance-Control Team. 2003. Introduction and potential establishment of Aedes albopictus in California in 2001. J. Am. Mosq. Control Assoc. 19:301-308.
Wekesa, J.W., T. Sorvillo, A. Brisco, M. Tanaka, M. Cook, K. Fujioka. 2014. Three Years (2011-2013) of Aedes albopictus in the City of El Monte, San Gabriel Valley, Los Angeles County, California. Proc. Mosq. Vector Control Assoc. Calif. 82: 89-92.
Yoshimizu, M.H., K. Padgett, M. Metzger, T. Feiszli, I. Leonard, M. Garcia, A. Scazlo, S. Mulligan, J. Holeman, R. Gay, N. Zahiri, B. Weber, T. Philips, C. Freece, and V. Kramer. 2016. The initial detection and establishment of invasive Aedes aegypti in California, 2013. Proc. Mosq. Vector Control Assoc. Calif. 84: 153-159.
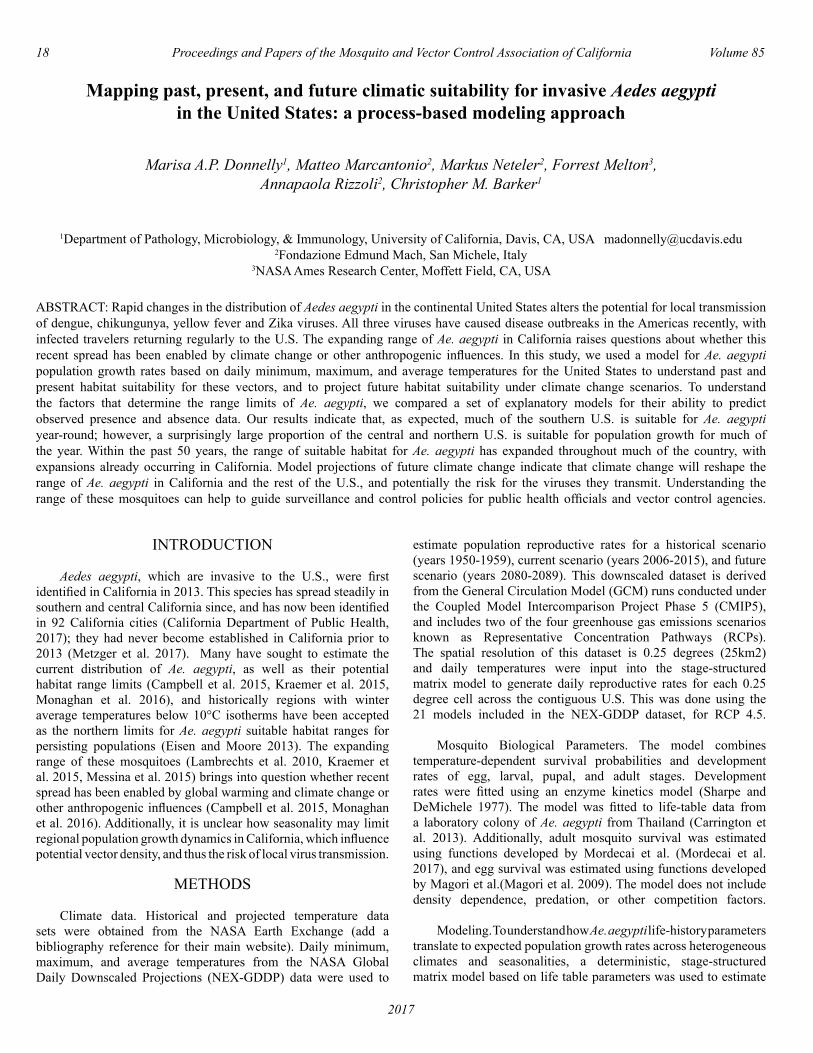
18 Proceedings and Papers of the Mosquito and Vector Control Association of California Volume 85
2017
Mapping past, present, and future climatic suitability for invasive Aedes aegyptiin the United States: a process-based modeling approach
Marisa A.P. Donnelly1, Matteo Marcantonio2, Markus Neteler2, Forrest Melton3, Annapaola Rizzoli2, Christopher M. Barker1
1Department of Pathology, Microbiology, & Immunology, University of California, Davis, CA, USA [email protected] Edmund Mach, San Michele, Italy
3NASA Ames Research Center, Moffett Field, CA, USA ABSTRACT: Rapid changes in the distribution of Aedes aegypti in the continental United States alters the potential for local transmission of dengue, chikungunya, yellow fever and Zika viruses. All three viruses have caused disease outbreaks in the Americas recently, with infected travelers returning regularly to the U.S. The expanding range of Ae. aegypti in California raises questions about whether this recent spread has been enabled by climate change or other anthropogenic influences. In this study, we used a model for Ae. aegypti population growth rates based on daily minimum, maximum, and average temperatures for the United States to understand past and present habitat suitability for these vectors, and to project future habitat suitability under climate change scenarios. To understand the factors that determine the range limits of Ae. aegypti, we compared a set of explanatory models for their ability to predict observed presence and absence data. Our results indicate that, as expected, much of the southern U.S. is suitable for Ae. aegypti year-round; however, a surprisingly large proportion of the central and northern U.S. is suitable for population growth for much of the year. Within the past 50 years, the range of suitable habitat for Ae. aegypti has expanded throughout much of the country, with expansions already occurring in California. Model projections of future climate change indicate that climate change will reshape the range of Ae. aegypti in California and the rest of the U.S., and potentially the risk for the viruses they transmit. Understanding the range of these mosquitoes can help to guide surveillance and control policies for public health officials and vector control agencies.
INTRODUCTION
Aedes aegypti, which are invasive to the U.S., were first identified in California in 2013. This species has spread steadily in southern and central California since, and has now been identified in 92 California cities (California Department of Public Health, 2017); they had never become established in California prior to 2013 (Metzger et al. 2017). Many have sought to estimate the current distribution of Ae. aegypti, as well as their potential habitat range limits (Campbell et al. 2015, Kraemer et al. 2015, Monaghan et al. 2016), and historically regions with winter average temperatures below 10°C isotherms have been accepted as the northern limits for Ae. aegypti suitable habitat ranges for persisting populations (Eisen and Moore 2013). The expanding range of these mosquitoes (Lambrechts et al. 2010, Kraemer et al. 2015, Messina et al. 2015) brings into question whether recent spread has been enabled by global warming and climate change or other anthropogenic influences (Campbell et al. 2015, Monaghan et al. 2016). Additionally, it is unclear how seasonality may limit regional population growth dynamics in California, which influence potential vector density, and thus the risk of local virus transmission.
METHODS
Climate data. Historical and projected temperature data sets were obtained from the NASA Earth Exchange (add a bibliography reference for their main website). Daily minimum, maximum, and average temperatures from the NASA Global Daily Downscaled Projections (NEX-GDDP) data were used to
estimate population reproductive rates for a historical scenario (years 1950-1959), current scenario (years 2006-2015), and future scenario (years 2080-2089). This downscaled dataset is derived from the General Circulation Model (GCM) runs conducted under the Coupled Model Intercomparison Project Phase 5 (CMIP5), and includes two of the four greenhouse gas emissions scenarios known as Representative Concentration Pathways (RCPs). The spatial resolution of this dataset is 0.25 degrees (25km2) and daily temperatures were input into the stage-structured matrix model to generate daily reproductive rates for each 0.25 degree cell across the contiguous U.S. This was done using the 21 models included in the NEX-GDDP dataset, for RCP 4.5.
Mosquito Biological Parameters. The model combines temperature-dependent survival probabilities and development rates of egg, larval, pupal, and adult stages. Development rates were fitted using an enzyme kinetics model (Sharpe and DeMichele 1977). The model was fitted to life-table data from a laboratory colony of Ae. aegypti from Thailand (Carrington et al. 2013). Additionally, adult mosquito survival was estimated using functions developed by Mordecai et al. (Mordecai et al. 2017), and egg survival was estimated using functions developed by Magori et al.(Magori et al. 2009). The model does not include density dependence, predation, or other competition factors.
Modeling. To understand how Ae. aegypti life-history parameters translate to expected population growth rates across heterogeneous climates and seasonalities, a deterministic, stage-structured matrix model based on life table parameters was used to estimate
Volume 85 Proceedings and Papers of the Mosquito and Vector Control Association of California 19
2017
temperature-dependent, daily population growth rates (Caswell 2006). This model allows for identification of regions and time periods in which the highest potential reproductive rates are expected.
Analysis. Analyses were performed in R version 3.3.1 (R Core Team 2017) and results were mapped in QGIS version 2.10.1 (http://qgis.org). To investigate and account for the seasonal dynamics of reproduction, variables describing how Ae. aegypti population growth and reproduction fluctuate throughout seasons (referred to as seasonal reproductive variables, Table 1) were generated from the modeled reproductive rates, and averaged across all 21 models. These seasonal reproductive variables represent the seasonal fluctuations of reproduction driven by regional temperatures. Logistic regression was conducted to determine which of the seasonal reproductive variables best explain the documented Ae. aegypti distribution in the U.S., using reported county-level Ae. aegypti presence/absence data (Hahn et al. 2016). To determine how these seasonal variables would have changed since 1950, and how they are expected to change by 2080, the seasonal statistic variables (Table 1) were used to contrast the differences between past and present, and present and future.
RESULTS AND DISCUSSION
Range limits. The probability of Ae. aegypti presence for U.S. counties was highly associated with the annual timing of peak reproduction. Areas with later peaks in Ae. aegypti reproductive rates were more likely to have Ae. aegypti. This may be due to a larger population entering the coldest part of the year, which would yield more emerging adults early in the following year, and possibly a higher likelihood of persistence. In California, reproductive rate peaks occur late in the year in the Central Valley and in Southern California, with the latest reproductive rate peaks occurring along the central coast, all regions where Ae. aegypti have been detected. The average winter temperature was also highly associated with Ae. aegypti presence. Regions with warmer average winter temperatures were more likely to have had detected Ae. aegypti mosquitoes. These findings agree with Kraemer et al. (2015) who predicted high probabilities of Ae. aegypti occurrence in the Central Valley and parts of the central California Coast, based on reported species occurrence data and environmental conditions (Kraemer et al. 2015). Our models, however, predict higher suitability along the California Coast than that predicted by Kraemer et al. because our models do not rely on presence and absence data, as few Ae. aegypti have been detected along the coast in California. Changes in Ae. aegypti distribution. In contrasting the past decade seasonal variables (1950-1959) with those from the present decade (2006-2015), the week of the peak reproductive rates occurs later in the year in the present decade than in the past decade for much of California, with the greatest changes occurring in the Central Valley. Because the week of peak reproductive rates was associated with Ae. aegypti presence in the logistic regression analysis, later peak reproductive rates indicate that warming temperatures in these regions have led to increases in Ae. aegypti climate suitability. The model estimates that a small region in the southeast corner of the state will have peak reproductive rates occurring earlier in the year
in the present decade relative to the past decade. This is the result of desert temperatures becoming too hot to sustain reproduction in midsummer, limiting the reproductive season to earlier in the year. At present, the Central Valley and the California Coast have the longest reproductive seasons. The length of the reproductive season has increased since the 1950s for most of the California Coast, due to temperatures warming and becoming better suited for Ae. aegypti reproduction in areas previously too cool to support reproduction. In much of the Central Valley, the length of the reproductive season has contracted, due to temperatures becoming too hot to support Ae. aegypti reproduction during parts of the summer season that were previously suitable for reproduction. In the future, the length of the reproductive season is expected to expand along the western Central Valley and along the coast, while in the Central Valley it is expected to contract relative to the present decade.
These results indicate that climate change is influencing the seasonality of Ae. aegypti population dynamics already and will continue to do so in future decades. These findings agree with other studies that have explored the relationship between climate change and Ae. aegypti distribution change globally (Campbell et al. 2015, Monaghan et al. 2016). Using temperature and precipitation thresholds for Ae. aegypti occurrence (Eisen et al. 2014) and projected temperatures from RCP 4.5, Monaghan et al. (2016) estimated that the global land area suitable for Ae. aegypti will increase by 8% by 2061-2080 in addition to estimating that the California Coast and parts of the Central Valley will become more suitable for Ae. aegypti by 2061-2080. Using ecological niche models, Campbell et al. (2015) also estimated that the Central Valley and California Coast are currently suitable for Ae. aegypti, and will become more suitable in the future, given temperature and precipitation estimates from CMIP4 future-climate model projections. These studies, in addition to our study, support the hypothesis that as climate change continues, many temperate North American regions will become more suitable for Ae. aegypti, while some regions will become too hot to support population growth. Our study takes a mechanistic approach to estimate the potential population and seasonal dynamics of Ae. aegypti, which can be applied to improve vector control on a local scale. Future studies should focus on characterizing model uncertainty and establishing web-based tools to better assess the risk of local Ae. aegypti establishment in California and across the U.S.
ACKNOWLEDGMENTS
This study was supported by a grant from the National Aeronautics and Space Administration’s Applied Sciences Program in Health and Air Quality (#NNX15AF36G). We also thank Andrew Michaelis at NASA Ames Research Center for his advice during this project.
20 Proceedings and Papers of the Mosquito and Vector Control Association of California Volume 85
2017
REFERENCES CITED Campbell, L. P., C. Luther, D. Moo-L lanes, J. M. Ramsey, R. Danis-Lozano, and A. T. Peterson. 2015. Climate change influences on global distributions of dengue and chikungunya virus vectors. Philos. Trans. R. Soc. Lond. B Biol. Sci. 370.
Carrington, L. B., M. V. Armijos, L. Lambrechts, C. M. Barker, and T. W. Scott. 2013. Effects of fluctuating daily temperatures at critical thermal extremes on Aedes aegypti life-history traits. PLoS One. 8: e58824.
Caswell, H. 2006. Matrix Population Models: Second Edition. Oxford University Press. United States.(CDPH) California Department of Public Health. 2017. Aedes albopictus and Aedes aegypti Mosquitoes. (https://www.cdph.ca.gov/HealthInfo/discond/Pages/Aedes-albopictus-and-Aedes-aegypti-Mosquitoes.aspx).
Eisen, L., A. J. Monaghan, S. Lozano-Fuentes, D. F. Steinhoff, M. H. Hayden, and P. E. Bieringer. 2014. The impact of temperature on the bionomics of Aedes (Stegomyia) aegypti, with special reference to the cool geographic range margins. J. Med. Entomol. 51: 496–516.
Eisen, L., and C. G. Moore. 2013. Aedes (Stegomyia) aegypti in the continental United States: a vector at the cool margin of its geographic range. J. Med. Entomol. 50: 467–478.
Hahn, M. B., R. J. Eisen, L. Eisen, K. A. Boegler, C. G. Moore, J. McAllister, H. M. Savage, and J.-P. Mutebi. 2016. Reported Distribution of Aedes (Stegomyia) aegypti and Aedes (Stegomyia) albopictus in the United States, 1995-2016 (Diptera: Culicidae). J. Med. Entomol. 53 (5): 1169-1175.
Kraemer, M. U. G., M. E. Sinka, K. A. Duda, A. Q. N. Mylne, F. M. Shearer, C. M. Barker, C. G. Moore, R. G. Carvalho, G. E. Coelho, W. Van Bortel, G. Hendrickx, F. Schaffner, I. R. F. Elyazar, H.-J. Teng, O. J. Brady, J. P. Messina, D. M. Pigott, T. W. Scott, D. L. Smith, G. R. W. Wint, N. Golding, and S. I. Hay. 2015. The global distribution of the arbovirus vectors Aedes aegypti and Ae. albopictus. Elife. 4: e08347.
Lambrechts, L., T. W. Scott, and D. J. Gubler. 2010. Consequences of the expanding global distribution of Aedes albopictus for dengue virus transmission. PLoS Negl. Trop. Dis. 4: e646.
Magori, K., M. Legros, M. E. Puente, D. A. Focks, T. W. Scott, A. L. Lloyd, and F. Gould. 2009. Skeeter Buster: a stochastic, spatially explicit modeling tool for studying Aedes aegypti population replacement and population suppression strategies. PLoS Negl. Trop. Dis. 3: e508.
Messina, J. P., O. J. Brady, D. M. Pigott, N. Golding, M. U. G. Kraemer, T. W. Scott, G. R. W. Wint, D. L. Smith, and S. I. Hay. 2015. The many projected futures of dengue. Nat. Rev. Microbiol. 13: 230–239.
Metzger, M. E., Y. M. Hardstone, K. A. Padgett, R. Hu, and V. L. Kramer. 2017. Detection and Establishment of Aedes aegypti and Aedes albopictus (Diptera: Culicidae) Mosquitoes in California, 2011-2015. J Med Entomol. 54: 533-543.
Monaghan, A. J., K. M. Sampson, D. F. Steinhoff, K. C. Ernst, K. L. Ebi, B. Jones, and M. H. Hayden. 2016. The potential impacts of 21st century climatic and population changes on human exposure to the virus vector mosquito Aedes aegypti. Clim. Change. 143: 1–14.
Mordecai, E. A., J. M. Cohen, M. V. Evans, P. Gudapati, L. R. Johnson, C. A. Lippi, K. Miazgowicz, C. C. Murdock, J. R. Rohr, S. J. Ryan, V. Savage, M. S. Shocket, A. Stewart Ibarra, M. B. Thomas, and D. P. Weikel. 2017. Detecting the impact of temperature on transmission of Zika, dengue, and chikungunya using mechanistic models. PLoS Negl. Trop. Dis. 11: e0005568.
R Core Team. 2017. R Core Team. R Core Team. (https://www.r-project.org/).
Sharpe, P. J., and D. W. DeMichele. 1977. Reaction kinetics of poikilotherm development. J. Theor. Biol. 64: 649–670.
Table 1 The seasonal reproductive variables used in logistic analysis.
Variable:Index day of maximum reproductive rateMean December reproductive rateMean January reproductive rateAnnual sum of reproductive ratesLength of reproductive seasonLength of winter season
First day of reproductive season14th day of reproductive seasonLast day of reproductive seasonMean annual reproductive rateMean reproductive rate during periods suitable for reproductionMaximum annual reproductive rate
Volume 85 Proceedings and Papers of the Mosquito and Vector Control Association of California 21
2017
Boots on the Ground: Aedes Suppression in Los Angeles County
Mark A. Daniel
Greater Los Angeles County Vector Control District 12545 Florence Ave., Santa Fe Springs, Ca 90670, [email protected], (562) 944-9656
This paper presents Aedes suppression from the operations perspective. The back bone of our suppression efforts, at The Greater Angeles County Vector Control District, happens house to house and requires the dedication and expertise of our operational staff. The paper highlights our field strategy and presents the challenges of Aedes suppression in the urban/suburban environment.

22 Proceedings and Papers of the Mosquito and Vector Control Association of California Volume 85
2017
Combined applications of VectoBac® WDG with a Curtis Dyna Fog® LV-8 and AquaDUET® with a Clarke® ProMist against invasive Aedes
in San Gabriel Valley, Los Angeles County, California
Antonio Bishop, Melvin Cook, Marta Tanaka, Gimena Ruedas, Kenn Fujioka, and J. Wakoli Wekesa
San Gabriel Valley Mosquito and Vector Control District1145 N Azusa Canyon Rd, West Covina, CA 91790
Corresponding Author:J. Wakoli Wekesa
San Gabriel Valley Mosquito and Vector Control District1145 N Azusa Canyon Rd, West Covina, CA 91790TL: 626-814-9466; E-mail: [email protected]
ABSTRACT: Invasive Aedes have spread to every city throughout the San Gabriel Valley Mosquito and Vector Control District (district) increasing the potential for viral transmission. Modification to how bulk pesticide product is mixed and loaded into the reservoirs for truck-mounted treatments against invasive Aedes has been of high priority. A couple of years ago we incorporated a “Venturi” design system to speed up the suspension of VectoBac WDG, significantly reducing time and manpower required for preparation of each treatment. The “Venturi” design system when used successfully completed mixing of 568 litres (150 gallons) in less than 30 minutes using 2-4 people compared to 2-3 hours it previously took with 8-10 people. In addition, by focusing on the time of application and understanding the weather patterns we have improved the efficiency of performing an area-wide truck mounted application of VectoBac WDG using Curtis Dyna Fog LV-8 (LV-8). When this larviciding is combined with AquaDuet adulticiding using the Ultra-Low Volume (ULV) Clarke Pro-mist®, the results are encouraging. So far, our evaluations have shown that when timed properly, targeted treatments of neighborhoods by such truck-mounted applications can have great impact in slowing down and or changing the trajectory of Aedes transmitted virus such as Chikungunya, Dengue, and Zika.
BACKGROUND
Since the redetection of Aedes albopictus in the City of El Monte, California in 2011, invasive Aedes mosquitoes have rapidly spread throughout all cities within the San Gabriel Valley Mosquito and Vector Control District (District). Aedes notoscriptus was discovered in 2014 and Aedes aegypti was found in 2016. Although the possibility of eradicating invasive Aedes is unlikely (Brisco et al., 2015), controlling their population and improving our control strategies is of paramount importance to prevent transmission of introduced viruses. . The District periodically uses truck-mounted applications using the Curtis Dyna Fog LV-8 (LV-8) for larviciding which has shown up to 100 percent efficiency in bioassay evaluations (Wekesa et al., 2015), yet the mixing process for truck mounted applications proved time consuming and labor intensive. The Ultra-low Volume (ULV) Clarke Pro-mist® truck-mounted sprayer has been used for adulticiding treatments to reduce risk of human infection from arboviruses such as chikungunya, dengue, and Zika. However, the effectiveness of these treatments could be impacted by various factors including insecticide resistance and lack of temperature inversion during the application time. As the territory of the three invasive Aedes species continues to expand, the District has addressed the above challenges by treating larger areas where access to individual properties is limited using truck mounted equipment, innovating on how the larvicide is mixed by cutting back on mixing time, and improving on the efficiency of adulticiding.
MATERIALS AND METHODS
Previously electric drills and mixing bits along with 20 liter buckets or 208 liter (55 gallon) drums were used to mix VectoBac WDG®. At the end of the mixing process the product was transferred to the 568 liter (150 gallon) formulation tank on the LV-8 sprayer. In 2015, the District worked with Peter DeChant of Valent BioSciences to implement a “Venturi” mixer to improve efficiency on nights when truck-mounted spraying was necessary. The Venturi allowed the District to introduce dry product into the water while mixing at a much faster rate. Further improvements of tapping the feed and return line into the formulation tank on the LV-8 sprayer allowed for the removal of the mixing tank altogether. Our second task was increasing the effectiveness of Clarke Pro-mist® truck-mounted adulticide applications. We addressed the possibility of insecticide resistance by switching to AquaDuet®, a product with both Prallethrin and Sumithrin®, at 1.06 fl ounces/acre from Scourge®. Furthermore, we timed applications to coincide with suitable weather patterns by monitoring the weather leading up to the application time in order to have an opportunity of treatment during the temperature inversion window; usually a 2 hour period between midnight and 6:00 AM. The impact of treatments was measured by placing adult Culex quinquefasciatus mosquitoes in cages at different locations on properties within the treatment area, specifically on the front yard, side yard, and back yard. In addition, similar cages of mosquitoes were placed at two properties outside the treatment areas as controls. The number of dead and alive mosquitoes placed in cages was counted before and after treatments.

Volume 85 Proceedings and Papers of the Mosquito and Vector Control Association of California 23
2017
RESULTS AND DISCUSSION
Initially, the Venturi design system mixed the product too quickly and caused a foaming effect in the mixing/formulation tank. We adjusted the incoming flow angle by adding a capped pipe inside of the tank with a series of holes in a line facing slightly downward and to one side of the tank. The result of this modification created a rolling effect with the formulation and eliminated the foaming problem. Once the method was perfected, we were able to finish the mixing process for 568 liters (150 gallons) in less than 30 minutes using two to four people. Previously, the same amount of material would take two to three hours to mix and require eight to ten people.On September 1, 2016, the District responded to an elevated situation of high Ae. albopictus populations in El Monte, California. The weather during this nighttime treatment was 21°C (70°F), with 1.6-3.2 kpm (1-2 mph) winds. The larviciding treatment using VectoBac WDG® was evaluated by cup bioassay and revealed 92.5-100% mortality within the treatment area. Most of the mortality was achieved within 24 hours post treatment. On October 20, 2016, 90-100% mortality was achieved in an application done in Rosemead, California, with almost identical weather condition to the previous treatment in El Monte.Adulticide treatments utilizing the Clarke Pro-mist® truck-mounted sprayer with AquaDuet on September 1, 2016 achieved between 60-95% mortality of adult Cx. quinquefasciatus set out in cages within the treatment area under the same weather condition listed for the larvicide treatment on the same night in El Monte, California. Mosquitoes in the cages were knocked down within eight hours. The Rosemead treatment on October 20, 2016 was evaluated by comparing pre- and post-treatment mosquito counts from BioGents Sentinel mosquito traps, one placed inside and one placed outside of the treatment boundaries. The results of this
treatment showed a measurable decrease in the adult population: decreasing the trap counts inside the treatment area from 129 Ae. albopictus and11 Cx. quinquefasciatus to 14 Ae. albopictus and six Cx. quinquefasciatus, respectively. The post-treatment trap counts outside of the treatment boundaries were unchanged.
CONCLUSION
The Curtis Dyna Fog LV-8® successfully delivered VectoBac WDG® to residential properties in a timely and efficient manner due to the implementation of the Venturi mixer. The time for mixing 568 liters worth of mixed product was reduced by more than 85 percent of time (from 180 mins to 30 mins).The District was also able to improve truck-mounted adulticiding using AquaDuet® with the Clarke ProMist® by evaluating application times when optimal conditions were favorable. These activities shall play an important role in designing strategy to manage invasive Aedes and controlling potential arboviruses transmitted by them.
ACKNOWLEDGMENTS
We are grateful to our colleagues, without their efforts this work would have not been possible. We thank Leslie Conner, Marco Gaytan, Steven Gallegos, Gilbert Holguin, Darrin Jones, Marc Mitchell, Hendricks Peña, Michael Rhambo, Benjamin Waswa, and Ignacio Ureña for their effort of mixing the larvicide and actual spraying. Also, we would like to thank Angela Brisco, Sam McKeever, Javier Romo and the rest of the “Albo Crew” for the setup and conducting bioassays. We would like to give special thanks to Kimberly Nelson for her editorial work. Finally, we would like to thank the residents of El Monte and Rosemead for enduring the noise associated with late night spraying.
REFERENCES CITED :
Brisco, A., “The Albo Crew”, K. Fujioka, J.W. Wekesa. 2015. Eradication of Aedes albopictus in the San Gabriel Valley, California is Doubtful Using Current Methodologies. Proc. Mosq. Vector Control Assoc. Calif. 83: 22-23.
Wekesa, J.W., A. Brisco, M. Tanaka, A. Bishop, M. Cook and K. Fujioka. 2015. Truck-Mounted Applications of Bacillus thurengiensis israelensis WDG against Aedes albopictus in San Gabriel Valley, California. Proc. Mosq. V ector Control Assoc. Calif. 83: 24.

24 Proceedings and Papers of the Mosquito and Vector Control Association of California Volume 85
2017
Although invasive Aedes mosquitoes were discovered in California in 2011, these mosquitoes were not found in the Coachella Valley until May 9, 2016. During the winter of 2015 and 2016, the Coachella Valley Mosquito and Vector Control District (District) Managers and Supervisors spent time asking other mosquito and vector control districts about their Aedes programs. Staff from Greater Los Angeles Vector Control District, Consolidated Mosquito Abatement District, and Delta Vector Control District provided us with information on how their programs were set up, how data was collected, and what had not worked in their areas. Using this information, the District drafted an Invasive Mosquito Species Response Plan. On May 9, 2016 Aedes aegypti were detected at a residence in Coachella following a training for staff regarding invasive mosquitoes. The District deployed door hangers in the immediate area to alert residents to the presence of Ae. aegypti and to inform them that staff would be coming by to conduct an inspection of their property. Two-person teams were deployed to each residence. After gaining permission from the property owner or resident, the team began at opposite end of the property, looking for any potential larval sources as they examined the property. Then, the team would record their findings, discuss them with the resident, and make an appropriate treatment. District surveillance staff used BG traps and CO2 traps to monitor the adult mosquito population. The BG traps were modified slightly, in that a piece of Velcro was glued to the top of the trap. Velcro was also placed on the shipping containers that the District uses for its regular CO2 traps so that the shipping container could be attached directly to the BG trap. We have not found a difference in the collection of mosquitoes between the two types of traps, but this could be because we have not had many Aedes mosquitoes in the area. As we discovered that the area where Ae. aegypti mosquitoes were distributed encompassed nearly 800 acres, we felt that the appropriate method of treatment was an aerial larvicide application. For this, we consulted with Valent BioSciences on how applications were made for other areas. We worked with the Federal Aviation Administration and Salton Sea Air Service, our contracted pilot, to file a Congested Area Flight Plan to make the application. The Congested Area Flight Plan required that we provide information on the aircraft, the pilot, the application conditions, and our plan for emergency response. We also provided them with plan for notifying the public. Prior to our application, we submitted a press release
Fighting Aedes Aegypti in the Desert
Jennifer A. Henke
Interim Laboratory Manager - . Coachella Valley Mosquito and Vector Control District P.O. Box 2967 Indio, CA 92202, [email protected]
which was distributed to our local news stations, cable television station, local radio stations, and local newspapers. Flyers were distributed to each residence within the spray block. An email was set to City managers and public relations departments, county health and environmental officials, local school boards, local water districts, sanitation departments, a local zoo, chambers of commerce, a cemetery, state and local elected officials, Native American tribes, and local residents who have requested to be notified. A notice was also placed on our website (www.cvmvcd.org/controlactivities.htm). Initially, applications were made to a 100-acre section of the city to ensure that the application would be successful. We selected 20 residences within the spray block and 5 outside of the area as our evaluation sites. At each residence, a plastic cup was placed in one of four habitats, with 0%, 25%, 50%, and 100% coverage from the aerial application. The placement of the cups allowed us to determine if the product would drift into hidden, hard-to-treat areas in residents’ yards. One hour after the application, the cups were picked up and returned to the laboratory. The cups were washed to ensure that no residual product was on the outside of the cup. Then approximately 100 milliliters of water and 15 third-instar Culex quinquefasciatus larvae were added, and the mosquitoes were fed. When we checked on the mosquitoes four hours later, we already saw mortality. We inspected the cups 4, 24, and 48 hours after the larvae were added. Cups placed in the open area (0% coverage) had the highest larval mortality (approximately 90%) at 48 hours, while cups placed in the hard-to-reach areas (100% coverage) had 72% mortality at 48 hours. A second application was made to the smaller area on July 7, and morality ranged from 90% in the hard-to-reach areas to 99% in the open areas. After trial evaluations, the application area was expanded the entire 800-acre area where we had found or suspected that Ae. aegypti was present. We re-notified everyone in the spray zone using the above tactics with one change. We modified our door hanger to let residents know that the applications would be made for several weeks. Applications were scheduled to be conducted weekly for the first four weeks and then to be every other week afterwards. Because of the large size of the treatment area, we initially split the application into two zones. Fifteen residences within each application area were selected as evaluation sites, while the untreated control area was moved to the District to ensure that it would be outside of the application area. After the first two applications on July 21-22 and July 28-29, the applications were merged into a
Volume 85 Proceedings and Papers of the Mosquito and Vector Control Association of California 25
2017
single application on August 5 and August 12. Applications then moved to every two weeks through the end of November. While we continued examining the efficacy of the product by bioassay using the cups, we also continued setting traps for the adult mosquitoes in the area. The last time that Ae. aegypti were found in Coachella was an adult female caught on August 11. Since then, inspections and traps have not turned up any living Ae. aegypti. On a Saturday following the aerial treatment, one of our teams was able to convince a resident that they needed to inspect her backyard. She had over 20 buckets of standing water, and in those buckets were dead Aedes and Culex larvae – not a single living larva was found. Since we began the aerial larvicide campaign, we have continued to monitor for Ae. aegypti throughout our District. We did detect them within another city, and we are currently working to control them there. As the current distribution is small, we have not yet moved to aerial larvicide there, but we are working to prepare to do that if necessary. The use of aerial larvicide is an important tool to consider, but it does take time to prepare the FAA Congested Area Flight Plan as well as to discuss applications with stakeholders to ensure that they are supportive. It was 53 days from our initial detection to our initial flight, and to get to that point took a lot of dedicated, focused work by our team. We believe that if we were to need to break transmission cycles of Aedes transmitted arboviruses in the Coachella Valley, this would be an important tool in our arsenal of Integrated Vector Management.
ACKNOWLEDGMENTS:
The author thanks her colleagues for their dedication to this work. This project would not have been possible without the rest of the Coachella Valley Mosquito and Vector Control District staff, in particular Jeremy Wittie, Rod Chamberlain, Jill Oviatt, Ed Prendez, Mike Martinez, Olde Avalos, Bobbye Dieckmann, Greg White, Chris Cavanaugh, Gaby Perezchica-Harvey, Gerald Chuzel, Melissa Snelling, Art Gutierrez, Marc Kensington, Mike Esparza, Charles Rodriguez, Jazmin Valop, Alan Montenegro, and Tony Molina. The District received some of the CDC funding for one application of VectoBac WDG. We also thank the Valent BioSciences team for their support, in particular Peter DeChant, Banu Kesavaraju, and Stephanie Whitman. Thank you also to Dino Candito from Adapco.

26 Proceedings and Papers of the Mosquito and Vector Control Association of California Volume 85
2017
Zika Control Communication and Treatment Implementation Strategiesin San Diego County
KariLyn Merlos, Nikos Gurfield, Eric Lardy
County of San Diego, Department of Environmental Health - Vector Control Program5570 Overland Ave, Ste 102
San Diego, CA 92123
ABSTRACT: In 2016, over 200 highly suspect or confirmed cases of Zika were referred by County of San Diego Public Health Services to the County Vector Control Program (VCP) for investigation. These investigations resulted in 10 instances where invasive Aedes aegypti mosquitoes were found in close proximity to the homes of the infected cases. In an effort to prevent local transmission of Zika or other Aedes-transmitted viruses, the VCP implemented focused control efforts using ULV adulticiding in conjunction with education and larval control within a specified area around the case. To ensure successful operations, the VCP developed a unique and comprehensive communication strategy including timely and transparent notifications to affected residents, elected officials, law enforcement, registered bee keepers, pesticide regulators, the media and the general public, with the effect of both preemptively mitigating concerns and improving compliance with treatments. In addition, the VCP implemented a practice of obtaining area warrants so that treatments could be conducted quickly at all of the potentially impacted residences to maximize the treatment effects. Processes and nuances of these operational strategies were discussed.
Volume 85 Proceedings and Papers of the Mosquito and Vector Control Association of California 27
2017
Aedes aegypti in California: Evaluating a Novel Strategy in Response to a New Invasion
F. Steve Mulligan, Jodi HolemanConsolidated Mosquito Abatement District, P.O. Box 278, Selma, CA
The invasion of Aedes aegypti (L.) into California, beginning in 2013, has created significant public health issues. A primary vector for dengue and chikungunya viruses, as well as Zika virus, this mosquito is closely associated with human habitation for oviposition sites and exhibits a preference for humans as hosts. In invaded neighborhoods, Ae. aegypti is a huge biting nuisance and source of resident complaints, yet it is difficult to control utilizing conventional treatment methods. Thus innovative approaches are called for in combating this important vector. During 2016, the Consolidated Mosquito Abatement District collaborated with MosquitoMate, Inc., to evaluate their novel sterile insect technique against a recently established Ae. aegypti population within a small neighborhood of Clovis, CA. This SIT incorporates the mass rearing and release of large numbers of Wolbachia infected males to mate with non-infected wild females. We discuss the elements and issues involved in development of the study; including the selection of study sites, gaining access and acceptance from homeowners, development of procedures and protocols to evaluate the efficacy of this SIT method against Ae. aegypti in an arid habitat, as well as dealing with media and providing and disseminating public education materials.
28 Proceedings and Papers of the Mosquito and Vector Control Association of California Volume 85
2017
Braden Court: Comprehensive Source Reduction Program to Eliminate Aedes Aegypti
Jodi Holeman1, Katherine Ramirez2, Mark Amorino3, F. Steve Mulligan4
1Scientific Technical Services Director, [email protected] Biologist, [email protected] 3Operations Director [email protected]
4District Manager, [email protected], Consolidated Mosquito Abatement District, PO Box 278, Selma CA
The invasion of Aedes aegypti L. into California beginning in 2013 has created significant public health issues. Conventional control methods have fallen short of Consolidated Mosquito Abatement District (District) and resident expectations. Since the invasion of Ae. aegypti the District has encouraged residents to practice clean yard sanitation and source reduction in and around their home as well as their neighbors. Complete resident compliance across an entire neighborhood is significant challenge. In 2016 the District decided to demonstrate what a neighborhood can look like from a mosquito standpoint when 100% compliance with source elimination is achieved. The District targeted 119 homes covering approximately 7 hectares. Each resident in this neighborhood was targeted for complete and ongoing source elimination. Residents were asked to sign an agreement permitting the district to cover all yard drains, modify all down spouts and provide monthly access for yard inspections. In addition to the residential source elimination the District ensured routine monitoring and inspecting of PGE vaults, storm drains, landscaping sprinkler boxes and any park area drains. Public outreach on the program started in March followed by field implementation in May. Weekly surveillance of the Ae. aegypti population was monitored with 5 BG sentinel traps and 14 ovitraps. The elements and issues involved in development of this evaluation, including the selection of study sites, gaining access and acceptance from homeowners, development of procedures and protocols as well as results were presented.
Volume 85 Proceedings and Papers of the Mosquito and Vector Control Association of California 29
2017
Model-based assessment of the vector potential of California's urban mosquitoes for Zika virus
Christopher M. Barker
DART Laboratory, Department of Pathology, Microbiology, and Immunology, School of Veterinary Medicine, University of California, Davis
ABSTRACT: Zika virus is a mosquitoborne pathogen that has emerged as a major threat to human health as the virus continues to spread throughout Latin America. It is known that the virus is transmitted by Aedes aegypti and Aedes albopictus, two invasive species have spread rapidly in many urban areas of southern and central California, and questions have been raised about the potential role of other common urban species such as Culex quinquefasciatus, in transmission. Here, I use a deterministic model informed by emerging field and laboratory data to evaluate the relative importance of California’s most common urban mosquito species.

30 Proceedings and Papers of the Mosquito and Vector Control Association of California Volume 85
2017
Finding Funding to Fight the New Guys in Town: Aedes Aegypti and Aedes Albopictus
John Bliss, Maria Garcia-Adarve
SCI Consulting Group4745 Mangels Boulevard
Fairfield, CA 94534707-430-4300 phone
707-430-4319 [email protected]
DESCRIPTION: New invasive mosquito species, such as Aedes aegypti and Aedes albopictus, have put additional burden on the budgets of local mosquito control agencies. Meanwhile Zika virus and its associated health impacts have captured the attention of the worldwide media and raised the public’s concern. The presentation will discuss how to raise additional revenues to fund your current services, to better prepare to combat new invasive mosquito species, and to help prevent local mosquito-borne Zika virus transmission and other emerging diseases. Discussion will include a comparison of funding alternatives, with particular emphasis given to parcel taxes and benefit assessments. Presentation will also cover the findings from surveys and opinion research projects conducted recently.

Volume 85 Proceedings and Papers of the Mosquito and Vector Control Association of California 31
2017
Field evaluation of a one gallon-sized oviposition trap for invasive Aedes mosquito surveillance.
Dereje Alemayehu1, Trinidad Reyes2, Eric Haas-Stapleton1
1 Alameda County Mosquito Abatement District23187 Connecticut Street, Hayward, CA 94545 510.783.7744 [email protected]
2 Madera County Mosquito and Vector Control District3105 Airport Drive, Madera CA 93637, 559.662.8880 [email protected]
Monitoring for invasive Aedes mosquitoes is critical for defining the geographic region of an invasion and estimating the intensity of mosquito oviposition in the area. A commonly used surveillance method for detecting gravid invasive Aedes mosquitoes is the ovitrap cup. Although the ovitrap cup is effective for detecting invasive Aedes mosquitoes, employing this trap during hot summer months or over broad geographic areas is labor intensive because the water in this small-volume trap must be frequently replenished to maintain the water vapor attractant. Moreover, the relatively narrow base of the ovitrap cup makes it unstable and easily tipped, resulting in the loss of trap contents. We developed a low cost and simple-to-build ovitrap bucket that incorporates a perforated lid that maintains 76 % of the lid surface to prevent large debris from entering the trap and to reduce water evaporation (Figure 1). The ovitrap bucket contains 8 – 10 times more water than the one pint ovitrap cup, thereby retaining water and attracting mosquitoes for up to 25 days, and a methoprene tablet that is added to prevent mosquito emergence allowing for the identification of hatched larvae. Comparison of 19 adjacently-placed ovitrap cups and buckets in the City of Madera, where Aedes aegypti were present during the September – October, 2016 study period, showed that the bucket
Figure 1. Assembled ovitrap bucket with oviposition substrate. A one-gallon black bucket with a lid perforated with 3/4 inch holes, 1/16 inch drain holes placed 3 5/8 inch from the top of the bucket, germination paper-wrapped wooden paint paddle stirrer for the oviposition substrate, containing one Altosid 30-day briquette and approximately 2 liters of water.
traps captured approximately twice as many Aedes eggs relative to the cup traps (total of 5,937 invasive Aedes eggs trapped over 28 days; bucket, n = 3,997 eggs (67 %); cup, n = 1,940 eggs (33 %)). Because the water vapor attractant persisted in the ovitrap buckets for a longer time, the work effort needed to inspect a network of oviposition traps may be reduced if oviposition buckets are utilized instead of oviposition cups. In summary, the ovitrap bucket trapped more invasive Aedes eggs compared to the ovitrap cups, and integrating ovitrap buckets into a surveillance program may reduce the work effort needed to deploy and inspect a oviposition trap network.
32 Proceedings and Papers of the Mosquito and Vector Control Association of California Volume 85
2017
Zika in the Rockies: Utah Mosquito Abatement Districts Aid CDC Workers Investigate Two Curious Zika Infections
Gregory S. White, Ary Faraji. Salt Lake City Mosquito Abatement District, 2020 N Redwood Rd, Salt Lake City, UT 84014 [email protected]
ABSTRACT: As Zika virus (ZIKV) spread through much of the western hemisphere in 2016, making international news, the 1st death attributed directly to ZIKV infection in the United States occurred in Salt Lake County, UT. The patient acquired ZIKV from a trip to Mexico. Shortly after the patient died, another patient was diagnosed with a ZIKV infection. This person did not travel outside the county and was not involved in a sexual relationship with the 1st patient. Because of the unknown cause of infection in the 2nd patient, the Centers for Disease Control and Prevention (CDC) sent an investigation team to Salt Lake County to determine the cause of the infection. In addition to epidemiologists and public information officers, two vector entomologists were sent as part of the CDC investigation. Four local mosquito abatement districts aided in the investigation with the CDC vector entomologists. The results of the investigations into local vectors and arboviruses helped investigators determine the 2nd patient contacted ZIKV through a previously unknown route, likely through contact with tears or saliva from the infectious patient. The role of local mosquito abatement districts in the investigation is discussed and the results of the vector investigation presented.
Volume 85 Proceedings and Papers of the Mosquito and Vector Control Association of California 33
2017
Using MALDI-TOF Mass Spectrometry to rapidly identify invasive Aedes eggs in California
Olivia Winokur1, Ying Fang1, Sandra Garcia1, Barbara A. Byrne2, and Christopher M. Barker1
1 DART Lab, Department of Pathology, Microbiology, and Immunology, School of Veterinary Medicine, University of California, Davis
2 Department of Pathology, Microbiology, and Immunology, School of Veterinary Medicine, University of California, Davis
INTRODUCTION
The mosquitoes Aedes aegypti and Aedes albopictus are important vectors of dengue, chikungunya, yellow fever, and Zika viruses (Akiner et al. 2016). Risk for local transmission of these viruses in California has been heightened by the establishment and spread of the invasive mosquitoes, combined with increased numbers of virus-infected travelers (Metzger et al. 2017, CDPH 2017). Additionally, Aedes notoscriptus, an Australian arbovirus vector that also oviposits in containers, has been detected in Los Angeles since 2014 (GLACVCD 2016). Ovitraps are widely used by vector control districts to monitor Aedes populations and evaluate control efforts. Eggs of both invasive Aedes and native Aedes sierrensis, a California tree-hole mosquito, are collected in ovitraps, and reliable methods are needed for identifying eggs to species. Unfortunately, Aedes eggs cannot be differentiated morphologically using a stereomicroscope (Bova et al. 2016). Traditionally, identifying Aedes eggs requires hatching and rearing to late instar larvae or adults for visual identification. This process is time-consuming, often unreliable due to larval mortality and installment hatching, can spread invasives when mosquitoes are reared away from their collection site, and, most notably, creates a time-lag for mosquito control, potentially allowing the invasive Aedes mosquitoes to spread before intervention occurs. During the 2016 mosquito season in California, we began using Matrix-Assisted Laser Desorption/Ionization-Time of Flight Mass Spectrometry (MALDI-TOF MS) to rapidly identify Aedes eggs based on species-specific protein signatures. MALDI-TOF MS is rapid and cost effective, does not require district staff to rear mosquitoes, and allows for timely control if invasive Aedes mosquitoes are identified.
METHODS
Library creation Eggs were harvested from lab colonies established in early 2016 (Ae. aegypti, Los Angeles, CA; Ae. albopictus, Los Angeles, CA; Ae. sierrensis, Sonoma, CA). 5-10 eggs were removed from oviposition paper and placed in a 0.5-mL micro tube (Sarstedt
AG & Co. Nümbrecht, Germany) with five 1-mm glass beads (BioSpec Products, Bartlesville, OK, USA) and a mixture of 10uL 70% Formic Acid (Fluka Analytics, Honeywell, Morris Plains, NJ, USA) and 10uL 50% Acetonitrile (Fisher Chemical, Pittsburgh, PA, USA). Samples were homogenized for one minute using a Mini-Beadbeater-1 (BioSpec Products, Bartlesville, OK, USA). Following homogenization, samples were centrifuged at room temperature for 1 minute at 10,000 rpm. Samples were plated and library entries were created according to the Bruker MALDI-TOF Biotyper protocol for Custom MSP and Library Creation (Bruker, Billerica, MA, USA). Blind testing of colony eggs was performed for validation. At least 3 ‘good’ eggs were necessary to obtain correct identification; good eggs were considered those that were ovoid, appeared healthy, and were not collapsed or hatched. The analysis and results in this study did not include Ae. notoscriptus; this species was added to the library in May 2017 following the above protocol and currently is being used for identification of field collected eggs.
Identification of field-collected eggs Field-collected eggs were received from various mosquito control agencies in California. Upon arrival, samples with ≥3 good eggs were prepared as above in library creation; a maximum of 10 eggs was used per sample. Samples were plated and identified against our library entries according to the Bruker MALDI-TOF Biotyper protocol for sample identification (Bruker, Billerica, MA, USA).
RESULTS
As of May 2017, we have received and tested 474 field-collected samples with ≥3 good eggs. Of those 474 samples, 348 (73.4%) were identified as Ae. albopictus, 16 (3.4%) as Ae. aegypti, 22 (4.6%) as a mix of Ae. albopictus and Ae. aegypti, and 17 (3.6%) as Ae. sierrensis; 71 (15.0%) yielded no reliable identification (Figure 1).

34 Proceedings and Papers of the Mosquito and Vector Control Association of California Volume 85
2017
DISCUSSION
MALDI-TOF MS reliably separated native Ae. sierrensis from the two invasive species tested; however, challenges arose when trying to resolve Ae. aegypti and Ae. albopictus. These patterns in protein signatures seem to reflect phylogenetic relationships. Ae. albopictus and Ae. aegypti are in the same subgenus Stegomyia, whereas native Ae. sierrensis is in the subgenus Ochlerotatus. We hypothesize that MALDI-TOF MS will reliably separate invasive Ae. notoscriptus from Ae. sierrensis, Ae. aegypti, and Ae. albopictus as it is in the distantly related subgenus Finlaya. Some samples (4.6%) were identified as a mixture of Ae. albopictus and Ae. aegypti. It is possible that these samples were actually mixed samples, but because MALDI-TOF testing consumed the samples, we were unable to verify the mixed-species determination by hatching or other testing. Samples resulting in a
mixed identification that had ≥ 3 high-quality or good eggs remaining on oviposition paper after MALDI-TOF MS testing were hatched. All of these samples yielded homogenous Ae. albopictus results, and therefore it is unlikely that all samples were mixed. 15% of samples with ≥3 good eggs yielded no reliable identification, although eggs looked robust and were not collapsed or hatched. We hypothesize that samples identified as mixed or samples yielding no reliable ID could be attributed to (1) variation in protein synthesis during embryogenesis, (2) hatching cues that trigger changes in proteins, and/or (3) contamination with mold. Currently, we are optimizing MALDI-TOF MS for identifying Aedes eggs by creating library entries of samples at different time points held under different conditions. Additionally, we are testing a new method to identify Aedes eggs using hyperspectral imaging based on their species-specific surface reflectance profiles. This non-destructive method will allow for additional testing of samples if initial identification is unreliable.
ACKNOWLEDGEMENTS
The authors thank the Vector-Borne Disease Section of the California Department of Public Health, the Mosquito and Vector Control Association of California (MVCAC), and the following mosquito control agencies: Alameda County MAD, Coachella Valley MVCD, Madera County MVCD, Marin-Sonoma MVCD, Napa County MAD, San Gabriel Valley MVCD, San Mateo County MVCD, Santa Cruz County MVCD. This work was funded by CDC/PHFE Epidemiology and Laboratory Capacity and NASA, Health and Air Quality grant NNX15AF36G. The content is solely the responsibility of the authors and does not necessarily represent the official views of either funding source.
Figure 1: Egg sample species identification by MALDI-TOF MS (n=474).
REFERENCES CITED
Akiner, M. M., B. Demirci, G. Babuadze, V. Robert, and F. Schaffner. 2016. Spread of the Invasive Mosquitoes Aedes aegypti and Aedes albopictus in the Black Sea Region Increases Risk of Chikungunya, Dengue, and Zika Outbreaks in Europe. PLoS Negl. Trop. Dis. 10: e0004664.
Bova, J., S. Paulson, and G. Paulson. 2016. Morphological Differentiation of the Eggs of North American Container-Inhabiting Aedes Mosquitoes. J. Am. Mosq. Control Assoc. 32: 244–246.
California Department of Public Health (CDPH). 2017. Zika. https://www.cdph.ca.gov/Programs/CID/DCDC/Pages/Zika.aspx
Greater Los Angeles County Vector Control District (GLACVCD). 2016. What are the Invasive Aedes Mosquitoes in Los Angeles County? https://www.glacvcd.org/vector-information/mosquitoes/invasive-mosquitoes/
Metzger, M. E., M. Hardstone Yoshimizu, K. A. Padgett, R. Hu, and V. L. Kramer. 2017. Detection and Establishment of Aedes aegypti and Aedes albopictus (Diptera: Culicidae) Mosquitoes in California, 2011-2015. J. Med. Entomol. 54: 533–543.

Volume 85 Proceedings and Papers of the Mosquito and Vector Control Association of California 35
2017
Importance of Relationship Building and Collaborating withKey Partners and Elected Officials
Luz Maria Robles
Sacramento-Yolo Mosquito & Vector Control District 8631 Bond Rd. Elk Grove, Ca. 95624 [email protected]
ABSTRACT: An important element in the Sacramento-Yolo Mosquito and Vector Control District’s outreach and education program is building relationships and creating partnerships with local elected officials and key city entities such as the Neighborhood Services Divisions, Parks and Recreation departments and Code Enforcement. Engaging and having the support of these entities is critical. Therefore each year our District dedicates a significant amount of our outreach towards these groups as a means of ensuring they are aware of the prevalence of West Nile virus and the District’s mosquito control activities that may be taking place in their given area.This presentation highlights the importance of collaborations, relationship building and creating partnerships as part of a successful community outreach and education program. It provides an overview of our District’s strategies which include setting up annual presentations at city council meetings and coordinating one on one meetings with new city and county elected officials. This presentation also offers recommendations for Districts who are beginning or expanding their relationships with key entities and local elected officials in support of mosquito control strategies.
36 Proceedings and Papers of the Mosquito and Vector Control Association of California Volume 85
2017
Using local CERT (Community Emergency Response Team) Trained Volunteers forAssistance in West Nile Virus Outreach
Amanda Poulsen
Vector Ecologist, Santa Cruz County Mosquito and Vector Control, 640 Capitola Road, Santa Cruz, CA 95062 [email protected]
ABSTRACT: In August 2016, local CERT (Community Emergency Response Team) trained volunteers helped Santa Cruz County Mosquito and Vector Control (SCCMVC) achieve an outreach mission that would have been impossible in the peak of summer with our staff alone. SCCMVC staff created informational door hangers regarding West Nile virus (WNV), conducted a short training program for the volunteers, and provided talking points. A crew of about 10 CERT volunteers helped disperse the door hangers to at least 4,100 residences in a densely populated area where one WNV positive bird and two WNV positive mosquito pools were found. The volunteers saved us a significant amount of time (~400 hours) and costs by distributing the door hangers on our behalf. Additionally, many of the volunteers took the time to speak with residents regarding good dump and drain practices, were able to answer a few questions regarding Zika virus, and forwarded Service Requests to our office. Not only were the CERT volunteers vital in distributing important public health information to residents in a timely manner, they also proved to be valuable in strengthening SCCMVC’s relationship with the public through “neighbor-to-neighbor” conversations.
Volume 85 Proceedings and Papers of the Mosquito and Vector Control Association of California 37
2017
Raising An Army in the War on Zika
Kelly Middleton
Greater LA County Vector Control District, 12545 Florence Ave., Santa Fe Springs, CA [email protected]
CONTRIBUTORS:
Levy Sun, GLACVCD; Jason Farned, SGVMVCD; Jee Kim, LA CoDPH EPRPJoseph Kim, LA CoDPH EPRP; Lisa Patrick-Mudd, LA CoDPH EPRP
Community outreach typically receives only a small percentage of a district’s overall budget; however, the need for clear, effective, and comprehensive outreach has outpaced even the most prepared districts’ ability to keep up. Outreach personnel must preemptively raise awareness, motivate behavioral change, and be ready to strategically respond in crisis situations.
Los Angeles County, home to more than 10 million residents, three international airports, and both Aedes aegypti and Ae. albopictus mosquitoes has been identified by the Centers for Disease Control and Prevention (CDC) as one of the nation’s highest-risk areas for Zika virus introduction and localized transmission. Preparing for and responding to a Zika outbreak will require an army of trained personnel.
In 2016, Los Angeles County vector control districts partnered with the Los Angeles County Department of Public Health to create a Zika emergency response plan and through the Emergency Preparedness and Response Program (EPRP), capitalized on a vast network of nearly 5,000 volunteers to exponentially expand our ability to respond. Zika Action and Prevention (ZAP) Teams consisting of volunteers from interfaith groups, medical universities, environmental health professionals, medical reserve corp., and community promotores, were provided with the knowledge, equipment, and hands-on training necessary for rapid deployment, if necessary. Fighting Zika virus is a ‘boots-on-the-ground campaign’. Volunteer networks of dedicated and trained personnel can exponentially expand available resources giving districts a fighting chance against this enemy we call Zika.

38 Proceedings and Papers of the Mosquito and Vector Control Association of California Volume 85
2017
Fighting Invasive Aedes Through Educationand Outreach in Los Angeles County
Jason Farned1, Kelly Middleton2, Levi Sun3
1Public Information Officer, San Gabriel Valley MVCD, 1145 N. Azusa Canyon Rd., West Covina, CA [email protected]
2Director of Community Affairs, Greater Los Angeles County VCD, 12545 Florence Ave., Santa Fe Springs, CA 906703Public Information Officer, Greater Los Angeles County VCD, 12545 Florence Ave., Santa Fe Springs, CA 90670
The introduction of invasive Aedes into Los Angeles County has created many challenges for vector control agencies. Invasive Aedes are distinct from most species native to California, because their durable eggs are laid individually in small containers which make them difficult to manage, they bite aggressively during the day, making them a greater nuisance to humans, and they transmit viruses that people have never been exposed to in California. Vector control agencies in Los Angeles County have had to develop a new and tailored response to address invasive Aedes. At the heart of this response is a robust education and outreach program which must not only educate the general public and local leaders about the emerging threat but also enlist their help to fight it. Here, we discuss the creation and evolution of Aedes-specific public education and outreach programs we use at the San Gabriel Valley Mosquito and Vector Control and the Greater Los Angeles County Vector Control Districts. Specifically we outline the strategies and best practices implemented by both districts, and the existing challenges facing the effort.
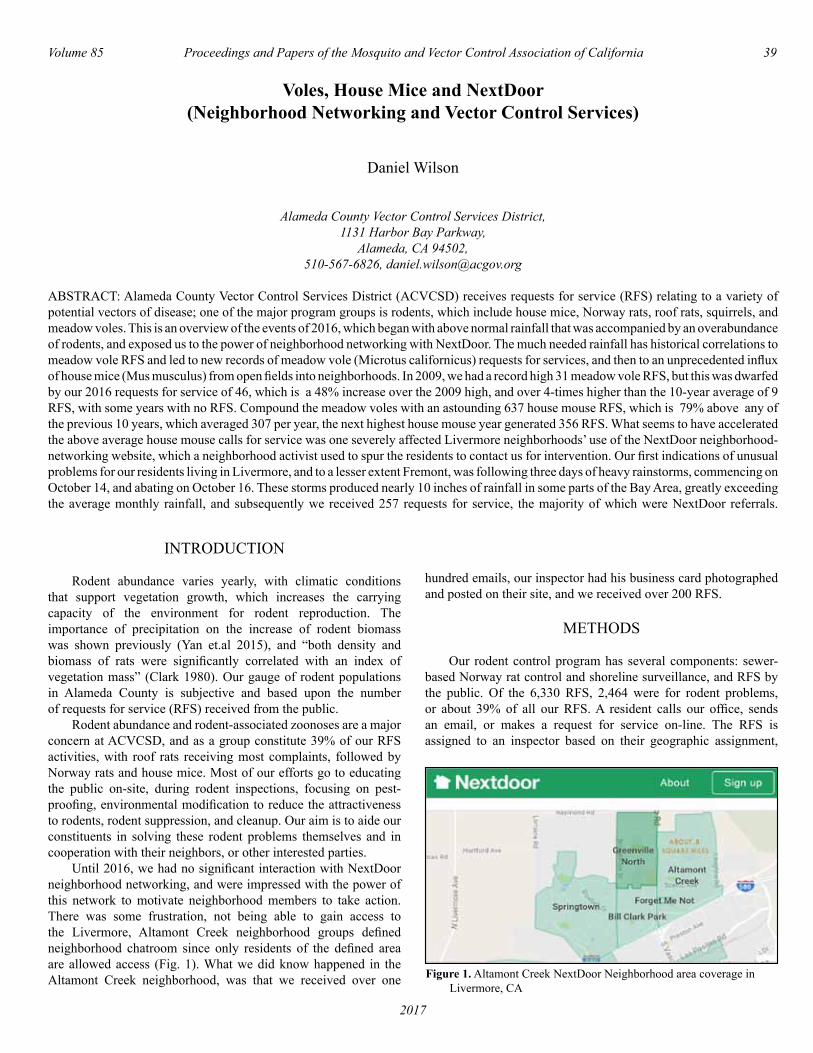
Volume 85 Proceedings and Papers of the Mosquito and Vector Control Association of California 39
2017
Voles, House Mice and NextDoor(Neighborhood Networking and Vector Control Services)
Daniel Wilson
Alameda County Vector Control Services District, 1131 Harbor Bay Parkway,
Alameda, CA 94502, 510-567-6826, [email protected]
ABSTRACT: Alameda County Vector Control Services District (ACVCSD) receives requests for service (RFS) relating to a variety of potential vectors of disease; one of the major program groups is rodents, which include house mice, Norway rats, roof rats, squirrels, and meadow voles. This is an overview of the events of 2016, which began with above normal rainfall that was accompanied by an overabundance of rodents, and exposed us to the power of neighborhood networking with NextDoor. The much needed rainfall has historical correlations to meadow vole RFS and led to new records of meadow vole (Microtus californicus) requests for services, and then to an unprecedented influx of house mice (Mus musculus) from open fields into neighborhoods. In 2009, we had a record high 31 meadow vole RFS, but this was dwarfed by our 2016 requests for service of 46, which is a 48% increase over the 2009 high, and over 4-times higher than the 10-year average of 9 RFS, with some years with no RFS. Compound the meadow voles with an astounding 637 house mouse RFS, which is 79% above any of the previous 10 years, which averaged 307 per year, the next highest house mouse year generated 356 RFS. What seems to have accelerated the above average house mouse calls for service was one severely affected Livermore neighborhoods’ use of the NextDoor neighborhood-networking website, which a neighborhood activist used to spur the residents to contact us for intervention. Our first indications of unusual problems for our residents living in Livermore, and to a lesser extent Fremont, was following three days of heavy rainstorms, commencing on October 14, and abating on October 16. These storms produced nearly 10 inches of rainfall in some parts of the Bay Area, greatly exceeding the average monthly rainfall, and subsequently we received 257 requests for service, the majority of which were NextDoor referrals.
INTRODUCTION
Rodent abundance varies yearly, with climatic conditions that support vegetation growth, which increases the carrying capacity of the environment for rodent reproduction. The importance of precipitation on the increase of rodent biomass was shown previously (Yan et.al 2015), and “both density and biomass of rats were significantly correlated with an index of vegetation mass” (Clark 1980). Our gauge of rodent populations in Alameda County is subjective and based upon the number of requests for service (RFS) received from the public. Rodent abundance and rodent-associated zoonoses are a major concern at ACVCSD, and as a group constitute 39% of our RFS activities, with roof rats receiving most complaints, followed by Norway rats and house mice. Most of our efforts go to educating the public on-site, during rodent inspections, focusing on pest-proofing, environmental modification to reduce the attractiveness to rodents, rodent suppression, and cleanup. Our aim is to aide our constituents in solving these rodent problems themselves and in cooperation with their neighbors, or other interested parties. Until 2016, we had no significant interaction with NextDoor neighborhood networking, and were impressed with the power of this network to motivate neighborhood members to take action. There was some frustration, not being able to gain access to the Livermore, Altamont Creek neighborhood groups defined neighborhood chatroom since only residents of the defined area are allowed access (Fig. 1). What we did know happened in the Altamont Creek neighborhood, was that we received over one
hundred emails, our inspector had his business card photographed and posted on their site, and we received over 200 RFS.
METHODS
Our rodent control program has several components: sewer-based Norway rat control and shoreline surveillance, and RFS by the public. Of the 6,330 RFS, 2,464 were for rodent problems, or about 39% of all our RFS. A resident calls our office, sends an email, or makes a request for service on-line. The RFS is assigned to an inspector based on their geographic assignment,
Figure 1. Altamont Creek NextDoor Neighborhood area coverage in Livermore, CA
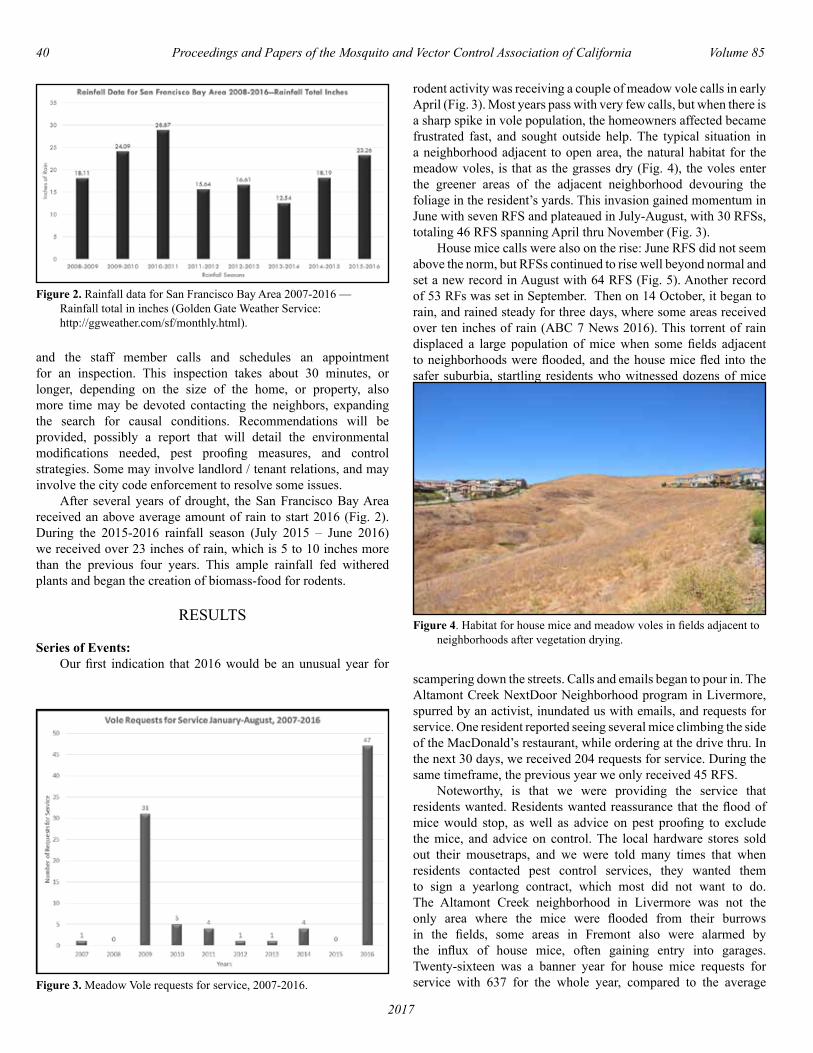
40 Proceedings and Papers of the Mosquito and Vector Control Association of California Volume 85
2017
and the staff member calls and schedules an appointment for an inspection. This inspection takes about 30 minutes, or longer, depending on the size of the home, or property, also more time may be devoted contacting the neighbors, expanding the search for causal conditions. Recommendations will be provided, possibly a report that will detail the environmental modifications needed, pest proofing measures, and control strategies. Some may involve landlord / tenant relations, and may involve the city code enforcement to resolve some issues. After several years of drought, the San Francisco Bay Area received an above average amount of rain to start 2016 (Fig. 2). During the 2015-2016 rainfall season (July 2015 – June 2016) we received over 23 inches of rain, which is 5 to 10 inches more than the previous four years. This ample rainfall fed withered plants and began the creation of biomass-food for rodents.
RESULTS
Series of Events: Our first indication that 2016 would be an unusual year for
rodent activity was receiving a couple of meadow vole calls in early April (Fig. 3). Most years pass with very few calls, but when there is a sharp spike in vole population, the homeowners affected became frustrated fast, and sought outside help. The typical situation in a neighborhood adjacent to open area, the natural habitat for the meadow voles, is that as the grasses dry (Fig. 4), the voles enter the greener areas of the adjacent neighborhood devouring the foliage in the resident’s yards. This invasion gained momentum in June with seven RFS and plateaued in July-August, with 30 RFSs, totaling 46 RFS spanning April thru November (Fig. 3). House mice calls were also on the rise: June RFS did not seem above the norm, but RFSs continued to rise well beyond normal and set a new record in August with 64 RFS (Fig. 5). Another record of 53 RFs was set in September. Then on 14 October, it began to rain, and rained steady for three days, where some areas received over ten inches of rain (ABC 7 News 2016). This torrent of rain displaced a large population of mice when some fields adjacent to neighborhoods were flooded, and the house mice fled into the safer suburbia, startling residents who witnessed dozens of mice
scampering down the streets. Calls and emails began to pour in. The Altamont Creek NextDoor Neighborhood program in Livermore, spurred by an activist, inundated us with emails, and requests for service. One resident reported seeing several mice climbing the side of the MacDonald’s restaurant, while ordering at the drive thru. In the next 30 days, we received 204 requests for service. During the same timeframe, the previous year we only received 45 RFS. Noteworthy, is that we were providing the service that residents wanted. Residents wanted reassurance that the flood of mice would stop, as well as advice on pest proofing to exclude the mice, and advice on control. The local hardware stores sold out their mousetraps, and we were told many times that when residents contacted pest control services, they wanted them to sign a yearlong contract, which most did not want to do. The Altamont Creek neighborhood in Livermore was not the only area where the mice were flooded from their burrows in the fields, some areas in Fremont also were alarmed by the influx of house mice, often gaining entry into garages. Twenty-sixteen was a banner year for house mice requests for service with 637 for the whole year, compared to the average
Figure 2. Rainfall data for San Francisco Bay Area 2007-2016 — Rainfall total in inches (Golden Gate Weather Service: http://ggweather.com/sf/monthly.html).
Figure 3. Meadow Vole requests for service, 2007-2016.
Figure 4. Habitat for house mice and meadow voles in fields adjacent to neighborhoods after vegetation drying.
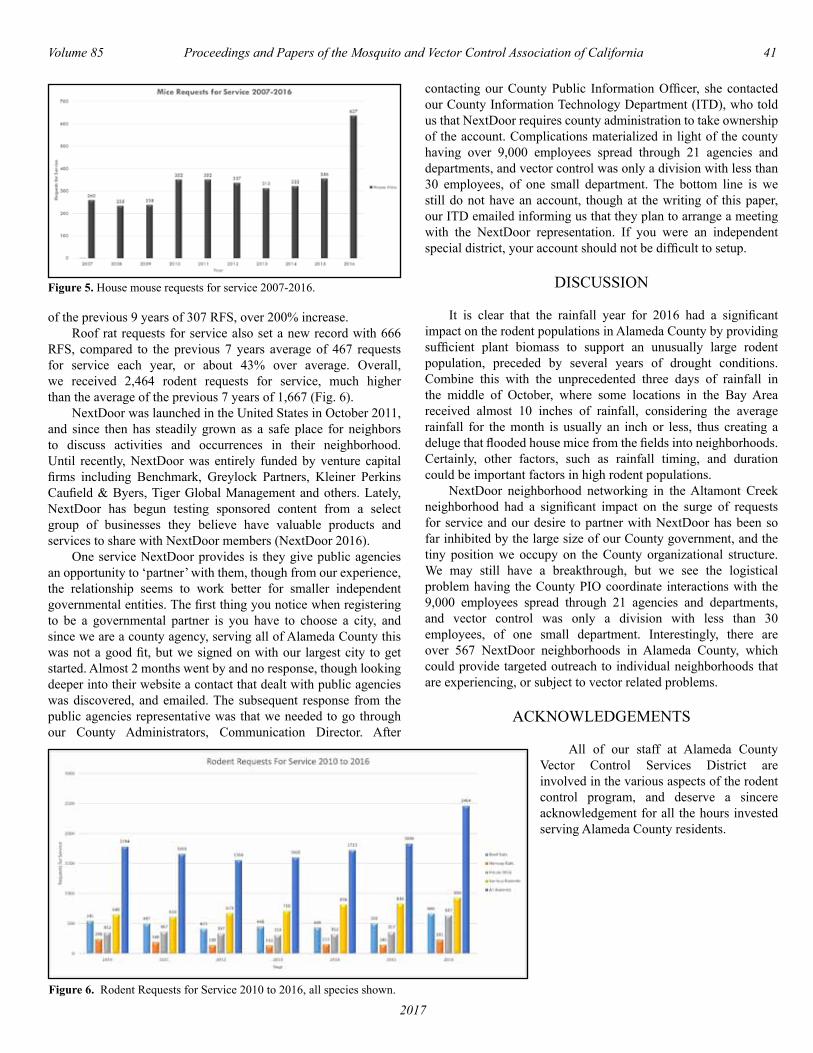
Volume 85 Proceedings and Papers of the Mosquito and Vector Control Association of California 41
2017
of the previous 9 years of 307 RFS, over 200% increase. Roof rat requests for service also set a new record with 666 RFS, compared to the previous 7 years average of 467 requests for service each year, or about 43% over average. Overall, we received 2,464 rodent requests for service, much higher than the average of the previous 7 years of 1,667 (Fig. 6). NextDoor was launched in the United States in October 2011, and since then has steadily grown as a safe place for neighbors to discuss activities and occurrences in their neighborhood. Until recently, NextDoor was entirely funded by venture capital firms including Benchmark, Greylock Partners, Kleiner Perkins Caufield & Byers, Tiger Global Management and others. Lately, NextDoor has begun testing sponsored content from a select group of businesses they believe have valuable products and services to share with NextDoor members (NextDoor 2016). One service NextDoor provides is they give public agencies an opportunity to ‘partner’ with them, though from our experience, the relationship seems to work better for smaller independent governmental entities. The first thing you notice when registering to be a governmental partner is you have to choose a city, and since we are a county agency, serving all of Alameda County this was not a good fit, but we signed on with our largest city to get started. Almost 2 months went by and no response, though looking deeper into their website a contact that dealt with public agencies was discovered, and emailed. The subsequent response from the public agencies representative was that we needed to go through our County Administrators, Communication Director. After
contacting our County Public Information Officer, she contacted our County Information Technology Department (ITD), who told us that NextDoor requires county administration to take ownership of the account. Complications materialized in light of the county having over 9,000 employees spread through 21 agencies and departments, and vector control was only a division with less than 30 employees, of one small department. The bottom line is we still do not have an account, though at the writing of this paper, our ITD emailed informing us that they plan to arrange a meeting with the NextDoor representation. If you were an independent special district, your account should not be difficult to setup.
DISCUSSION
It is clear that the rainfall year for 2016 had a significant impact on the rodent populations in Alameda County by providing sufficient plant biomass to support an unusually large rodent population, preceded by several years of drought conditions. Combine this with the unprecedented three days of rainfall in the middle of October, where some locations in the Bay Area received almost 10 inches of rainfall, considering the average rainfall for the month is usually an inch or less, thus creating a deluge that flooded house mice from the fields into neighborhoods. Certainly, other factors, such as rainfall timing, and duration could be important factors in high rodent populations. NextDoor neighborhood networking in the Altamont Creek neighborhood had a significant impact on the surge of requests for service and our desire to partner with NextDoor has been so far inhibited by the large size of our County government, and the tiny position we occupy on the County organizational structure. We may still have a breakthrough, but we see the logistical problem having the County PIO coordinate interactions with the 9,000 employees spread through 21 agencies and departments, and vector control was only a division with less than 30 employees, of one small department. Interestingly, there are over 567 NextDoor neighborhoods in Alameda County, which could provide targeted outreach to individual neighborhoods that are experiencing, or subject to vector related problems.
ACKNOWLEDGEMENTS
All of our staff at Alameda County Vector Control Services District are involved in the various aspects of the rodent control program, and deserve a sincere acknowledgement for all the hours invested serving Alameda County residents.
Figure 5. House mouse requests for service 2007-2016.
Figure 6. Rodent Requests for Service 2010 to 2016, all species shown.
42 Proceedings and Papers of the Mosquito and Vector Control Association of California Volume 85
2017
REFERENCES CITED
ABC 7 News 2016. Parts of Bay Area get 31 days worth of rain under 72 hours. http://abc7news.com/weather/parts-of-bay- area-get-31-days-worth-of-rain-under-72-hours/1558183/
Clark, D. B. 1980. Population ecology of Rattus rattus Across a desert – montane forest gradient in the Galapagos Islands. Ecology 61: 1422-1433.
Golden Gate Weather Services 2016. Climate of San Francisco, Monthly Rainfall. http://ggweather.com/sf/monthly.html
NextDoor 2016. How does NextDoor make money, accessed November 17, 2016. https://help.nextdoor.com/customer/portal/ articles/807212-how-does-nextdoor-make-money-
Yan, H., Liang, C., Li, Z., Liu, Z., Miao, B., He, C., Sheng, L. 2015. Impact of precipitation patterns on biomass and species richness of annuals in a dry steppe. PloS ONE. 10(4): e0125300. https://doi.org/10.1371/journal.pone.0125300
Volume 85 Proceedings and Papers of the Mosquito and Vector Control Association of California 43
2017
Fact, Fiction, and the Unbelievable Truth
Truc Dever
Greater Los Angeles County Vector Control District 12545 Florence Ave., Santa Fe Springs, Ca 90670, [email protected], (562) 944-9656
The emerging threat of local Zika virus transmission underscores the importance of proactive mosquito control measures at the local level. However, every community brings with it values, perceptions and beliefs that may create obstacles to successful control. Misconceptions, fears, and false data can plague new and traditional control methods that are part of the vector control tool box. Being able to better address these public concerns is critical for effective disease prevention, particularly during an outbreak. A series of community engagement workshops were held in December 2016 in Los Angeles County to assess public knowledge and perception of mosquito control activities throughout the County and how values and preferences may change when faced with a potential Zika virus outbreak. Data gathered from these five workshops were presented to inform vector control professionals on planning for an emergency and the preferred approaches and strategies for communications.

44 Proceedings and Papers of the Mosquito and Vector Control Association of California Volume 85
2017
Preparing Residents in Clovis, CA for the Release of 640,000 Male Aedes AegyptiInto Their Neighborhood
Jodi Holeman
Scientific Technical Services Director,Consolidated Mosquito Abatement District, PO Box 278, Selma CA, [email protected]
The transition from the laboratory to the field requires more than just packing up the laboratory and setting up outside. Establishing a field site set in an urban residential neighborhood can present unique challenges. The Consolidated Mosquito Abatement District, in collaboration with MosquitoMate, the University of Kentucky and the University of California, Davis, developed a public outreach program for the evaluation of a novel sterile insect technique against a recently established Ae. aegypti population within a small neighborhood in Clovis, CA. In March 2016, the public outreach program was launched, targeting approximately 400 homes. This program was designed to prepare residents for the release of 640,000 male Ae. aegypti mosquitoes over the span of 16 weeks. The elements of the outreach program as well as survey results from the outreach effort were discussed

Volume 85 Proceedings and Papers of the Mosquito and Vector Control Association of California 45
2017
Development, implementation, and evaluation of repellent distribution pilot program
Ada Barros
Placer Mosquito and Vector Control District2021 Opportunity Dr. , Roseville, CA 95678
ABSTRACT: The distribution of insect repellent is an intervention strategy that a few mosquito control agencies in California implement. The Placer Mosquito and Vector Control District has been distributing insect repellent since 2005. Up until 2016, repellent was only distributed by technicians to members of the public they encounter in the field or at community or education events by outreach staff. Most of the time, it was handed out with other promotional items at community event booths. This approach was neither targeted nor measurable, so it was difficult to assess if repellent distribution had any impact on vector-borne disease awareness or preventive behaviors. This pilot project involved conducting research on populations at risk for mosquito-borne illness and those who would benefit from repellent use, and included development and implementation of survey tools on repellent use, outreach messages encouraging repellent use by targeted groups, and a targeted repellent distribution program.
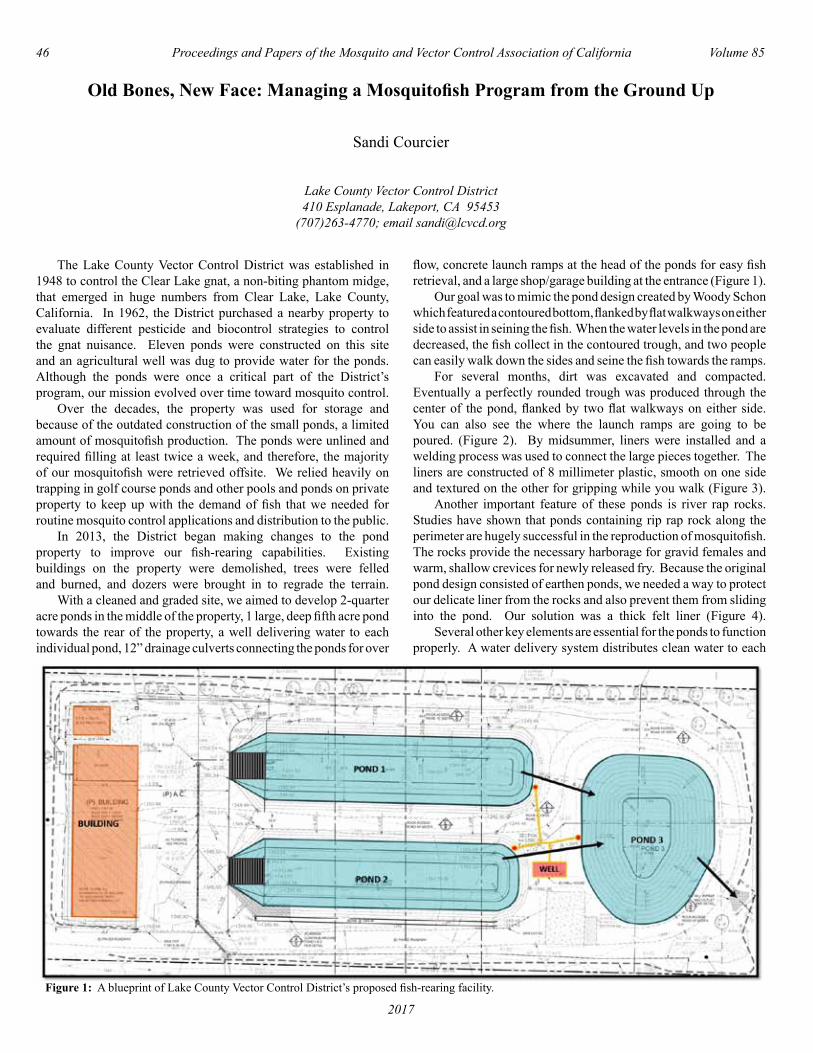
46 Proceedings and Papers of the Mosquito and Vector Control Association of California Volume 85
2017
Old Bones, New Face: Managing a Mosquitofish Program from the Ground Up
Sandi Courcier
Lake County Vector Control District410 Esplanade, Lakeport, CA 95453
(707)263-4770; email [email protected]
The Lake County Vector Control District was established in 1948 to control the Clear Lake gnat, a non-biting phantom midge, that emerged in huge numbers from Clear Lake, Lake County, California. In 1962, the District purchased a nearby property to evaluate different pesticide and biocontrol strategies to control the gnat nuisance. Eleven ponds were constructed on this site and an agricultural well was dug to provide water for the ponds. Although the ponds were once a critical part of the District’s program, our mission evolved over time toward mosquito control. Over the decades, the property was used for storage and because of the outdated construction of the small ponds, a limited amount of mosquitofish production. The ponds were unlined and required filling at least twice a week, and therefore, the majority of our mosquitofish were retrieved offsite. We relied heavily on trapping in golf course ponds and other pools and ponds on private property to keep up with the demand of fish that we needed for routine mosquito control applications and distribution to the public. In 2013, the District began making changes to the pond property to improve our fish-rearing capabilities. Existing buildings on the property were demolished, trees were felled and burned, and dozers were brought in to regrade the terrain. With a cleaned and graded site, we aimed to develop 2-quarter acre ponds in the middle of the property, 1 large, deep fifth acre pond towards the rear of the property, a well delivering water to each individual pond, 12” drainage culverts connecting the ponds for over
Figure 1: A blueprint of Lake County Vector Control District’s proposed fish-rearing facility.
flow, concrete launch ramps at the head of the ponds for easy fish retrieval, and a large shop/garage building at the entrance (Figure 1). Our goal was to mimic the pond design created by Woody Schon which featured a contoured bottom, flanked by flat walkways on either side to assist in seining the fish. When the water levels in the pond are decreased, the fish collect in the contoured trough, and two people can easily walk down the sides and seine the fish towards the ramps. For several months, dirt was excavated and compacted. Eventually a perfectly rounded trough was produced through the center of the pond, flanked by two flat walkways on either side. You can also see the where the launch ramps are going to be poured. (Figure 2). By midsummer, liners were installed and a welding process was used to connect the large pieces together. The liners are constructed of 8 millimeter plastic, smooth on one side and textured on the other for gripping while you walk (Figure 3). Another important feature of these ponds is river rap rocks. Studies have shown that ponds containing rip rap rock along the perimeter are hugely successful in the reproduction of mosquitofish. The rocks provide the necessary harborage for gravid females and warm, shallow crevices for newly released fry. Because the original pond design consisted of earthen ponds, we needed a way to protect our delicate liner from the rocks and also prevent them from sliding into the pond. Our solution was a thick felt liner (Figure 4). Several other key elements are essential for the ponds to function properly. A water delivery system distributes clean water to each
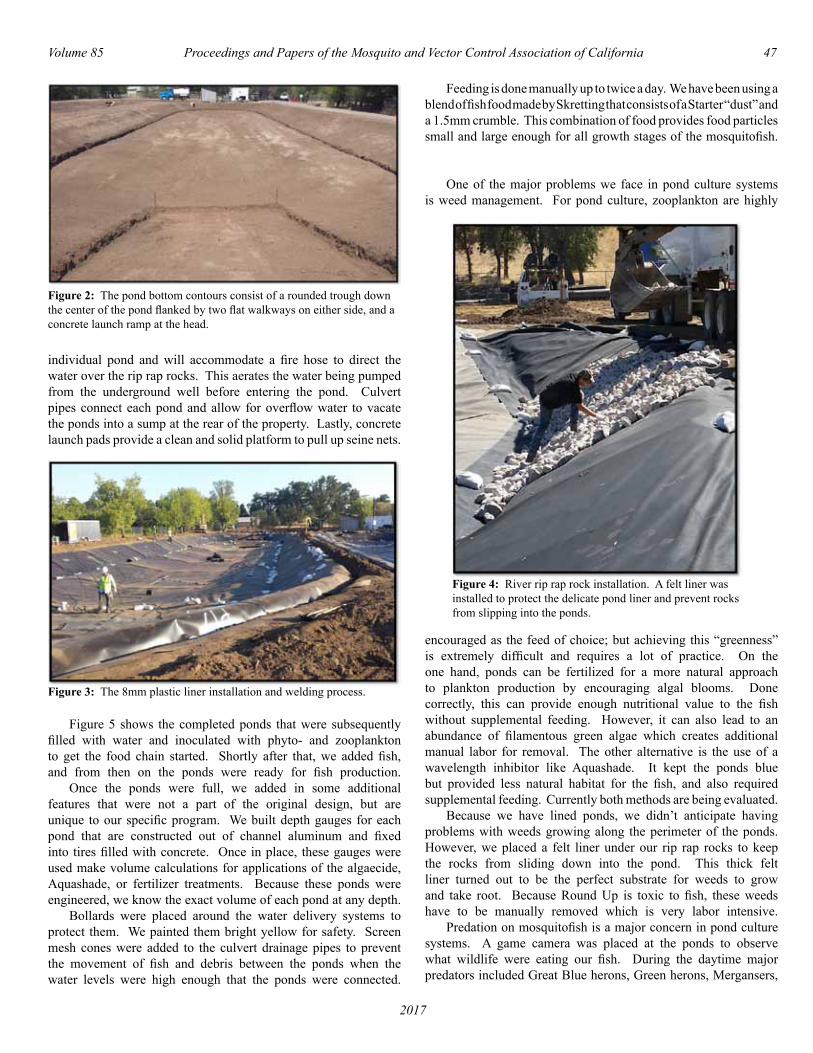
Volume 85 Proceedings and Papers of the Mosquito and Vector Control Association of California 47
2017
individual pond and will accommodate a fire hose to direct the water over the rip rap rocks. This aerates the water being pumped from the underground well before entering the pond. Culvert pipes connect each pond and allow for overflow water to vacate the ponds into a sump at the rear of the property. Lastly, concrete launch pads provide a clean and solid platform to pull up seine nets.
Figure 2: The pond bottom contours consist of a rounded trough down the center of the pond flanked by two flat walkways on either side, and a concrete launch ramp at the head.
Figure 3: The 8mm plastic liner installation and welding process.
Figure 4: River rip rap rock installation. A felt liner was installed to protect the delicate pond liner and prevent rocks from slipping into the ponds.
Figure 5 shows the completed ponds that were subsequently filled with water and inoculated with phyto- and zooplankton to get the food chain started. Shortly after that, we added fish, and from then on the ponds were ready for fish production. Once the ponds were full, we added in some additional features that were not a part of the original design, but are unique to our specific program. We built depth gauges for each pond that are constructed out of channel aluminum and fixed into tires filled with concrete. Once in place, these gauges were used make volume calculations for applications of the algaecide, Aquashade, or fertilizer treatments. Because these ponds were engineered, we know the exact volume of each pond at any depth. Bollards were placed around the water delivery systems to protect them. We painted them bright yellow for safety. Screen mesh cones were added to the culvert drainage pipes to prevent the movement of fish and debris between the ponds when the water levels were high enough that the ponds were connected.
Feeding is done manually up to twice a day. We have been using a blend of fish food made by Skretting that consists of a Starter “dust” and a 1.5mm crumble. This combination of food provides food particles small and large enough for all growth stages of the mosquitofish.
One of the major problems we face in pond culture systems is weed management. For pond culture, zooplankton are highly
encouraged as the feed of choice; but achieving this “greenness” is extremely difficult and requires a lot of practice. On the one hand, ponds can be fertilized for a more natural approach to plankton production by encouraging algal blooms. Done correctly, this can provide enough nutritional value to the fish without supplemental feeding. However, it can also lead to an abundance of filamentous green algae which creates additional manual labor for removal. The other alternative is the use of a wavelength inhibitor like Aquashade. It kept the ponds blue but provided less natural habitat for the fish, and also required supplemental feeding. Currently both methods are being evaluated. Because we have lined ponds, we didn’t anticipate having problems with weeds growing along the perimeter of the ponds. However, we placed a felt liner under our rip rap rocks to keep the rocks from sliding down into the pond. This thick felt liner turned out to be the perfect substrate for weeds to grow and take root. Because Round Up is toxic to fish, these weeds have to be manually removed which is very labor intensive. Predation on mosquitofish is a major concern in pond culture systems. A game camera was placed at the ponds to observe what wildlife were eating our fish. During the daytime major predators included Great Blue herons, Green herons, Mergansers,
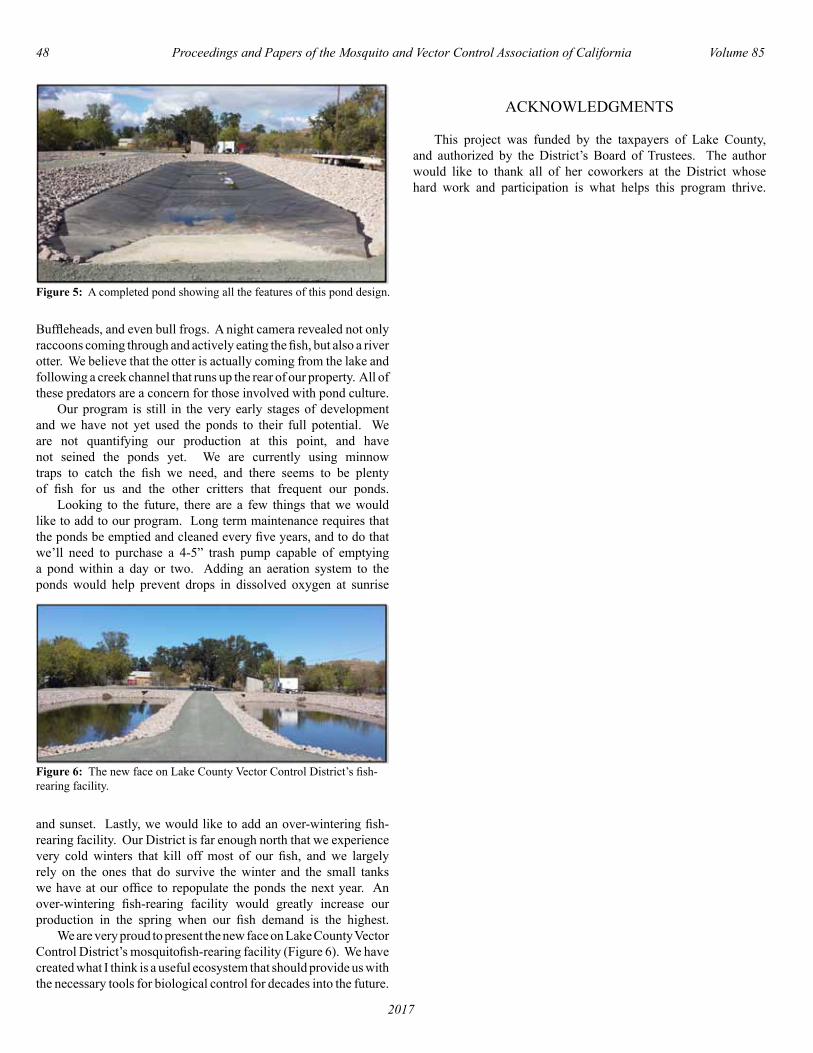
48 Proceedings and Papers of the Mosquito and Vector Control Association of California Volume 85
2017
Figure 5: A completed pond showing all the features of this pond design.
Figure 6: The new face on Lake County Vector Control District’s fish-rearing facility.
Buffleheads, and even bull frogs. A night camera revealed not only raccoons coming through and actively eating the fish, but also a river otter. We believe that the otter is actually coming from the lake and following a creek channel that runs up the rear of our property. All of these predators are a concern for those involved with pond culture. Our program is still in the very early stages of development and we have not yet used the ponds to their full potential. We are not quantifying our production at this point, and have not seined the ponds yet. We are currently using minnow traps to catch the fish we need, and there seems to be plenty of fish for us and the other critters that frequent our ponds. Looking to the future, there are a few things that we would like to add to our program. Long term maintenance requires that the ponds be emptied and cleaned every five years, and to do that we’ll need to purchase a 4-5” trash pump capable of emptying a pond within a day or two. Adding an aeration system to the ponds would help prevent drops in dissolved oxygen at sunrise
and sunset. Lastly, we would like to add an over-wintering fish-rearing facility. Our District is far enough north that we experience very cold winters that kill off most of our fish, and we largely rely on the ones that do survive the winter and the small tanks we have at our office to repopulate the ponds the next year. An over-wintering fish-rearing facility would greatly increase our production in the spring when our fish demand is the highest. We are very proud to present the new face on Lake County Vector Control District’s mosquitofish-rearing facility (Figure 6). We have created what I think is a useful ecosystem that should provide us with the necessary tools for biological control for decades into the future.
ACKNOWLEDGMENTS
This project was funded by the taxpayers of Lake County, and authorized by the District’s Board of Trustees. The author would like to thank all of her coworkers at the District whose hard work and participation is what helps this program thrive.
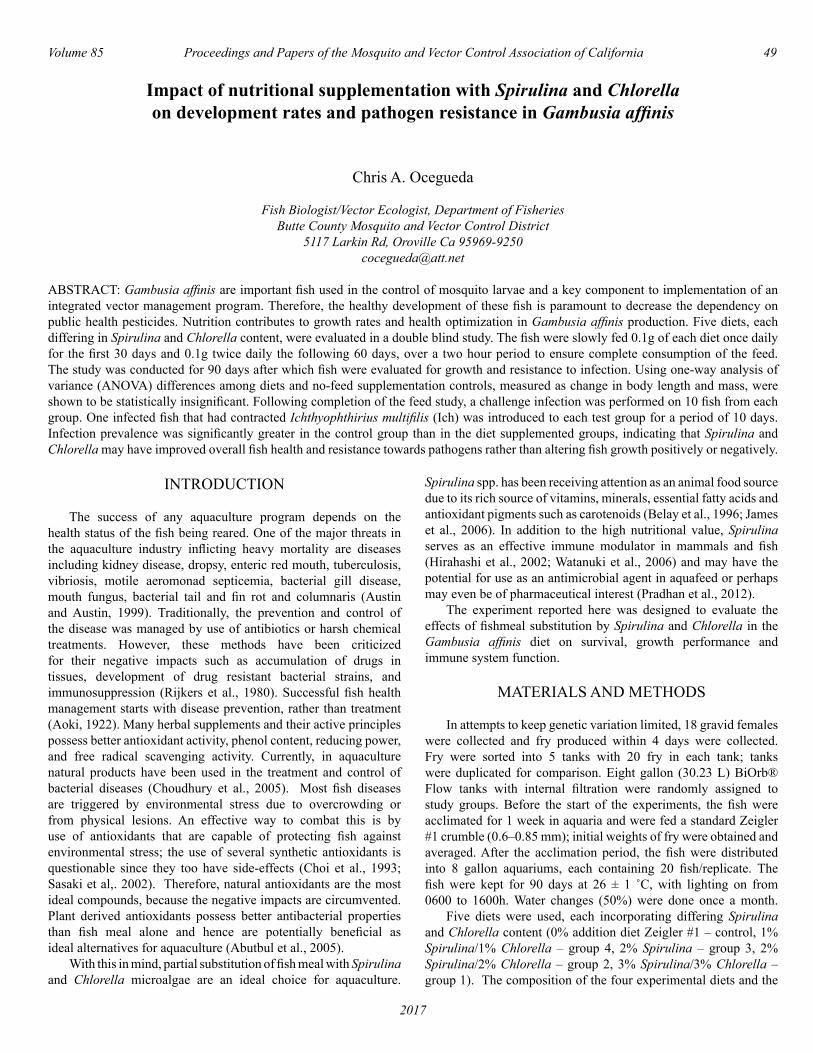
Volume 85 Proceedings and Papers of the Mosquito and Vector Control Association of California 49
2017
Impact of nutritional supplementation with Spirulina and Chlorella on development rates and pathogen resistance in Gambusia affinis
Chris A. Ocegueda
Fish Biologist/Vector Ecologist, Department of FisheriesButte County Mosquito and Vector Control District
5117 Larkin Rd, Oroville Ca [email protected]
ABSTRACT: Gambusia affinis are important fish used in the control of mosquito larvae and a key component to implementation of an integrated vector management program. Therefore, the healthy development of these fish is paramount to decrease the dependency on public health pesticides. Nutrition contributes to growth rates and health optimization in Gambusia affinis production. Five diets, each differing in Spirulina and Chlorella content, were evaluated in a double blind study. The fish were slowly fed 0.1g of each diet once daily for the first 30 days and 0.1g twice daily the following 60 days, over a two hour period to ensure complete consumption of the feed. The study was conducted for 90 days after which fish were evaluated for growth and resistance to infection. Using one-way analysis of variance (ANOVA) differences among diets and no-feed supplementation controls, measured as change in body length and mass, were shown to be statistically insignificant. Following completion of the feed study, a challenge infection was performed on 10 fish from each group. One infected fish that had contracted Ichthyophthirius multifilis (Ich) was introduced to each test group for a period of 10 days. Infection prevalence was significantly greater in the control group than in the diet supplemented groups, indicating that Spirulina and Chlorella may have improved overall fish health and resistance towards pathogens rather than altering fish growth positively or negatively.
INTRODUCTION
The success of any aquaculture program depends on the health status of the fish being reared. One of the major threats in the aquaculture industry inflicting heavy mortality are diseases including kidney disease, dropsy, enteric red mouth, tuberculosis, vibriosis, motile aeromonad septicemia, bacterial gill disease, mouth fungus, bacterial tail and fin rot and columnaris (Austin and Austin, 1999). Traditionally, the prevention and control of the disease was managed by use of antibiotics or harsh chemical treatments. However, these methods have been criticized for their negative impacts such as accumulation of drugs in tissues, development of drug resistant bacterial strains, and immunosuppression (Rijkers et al., 1980). Successful fish health management starts with disease prevention, rather than treatment (Aoki, 1922). Many herbal supplements and their active principles possess better antioxidant activity, phenol content, reducing power, and free radical scavenging activity. Currently, in aquaculture natural products have been used in the treatment and control of bacterial diseases (Choudhury et al., 2005). Most fish diseases are triggered by environmental stress due to overcrowding or from physical lesions. An effective way to combat this is by use of antioxidants that are capable of protecting fish against environmental stress; the use of several synthetic antioxidants is questionable since they too have side-effects (Choi et al., 1993; Sasaki et al,. 2002). Therefore, natural antioxidants are the most ideal compounds, because the negative impacts are circumvented. Plant derived antioxidants possess better antibacterial properties than fish meal alone and hence are potentially beneficial as ideal alternatives for aquaculture (Abutbul et al., 2005). With this in mind, partial substitution of fish meal with Spirulina and Chlorella microalgae are an ideal choice for aquaculture.
Spirulina spp. has been receiving attention as an animal food source due to its rich source of vitamins, minerals, essential fatty acids and antioxidant pigments such as carotenoids (Belay et al., 1996; James et al., 2006). In addition to the high nutritional value, Spirulina serves as an effective immune modulator in mammals and fish (Hirahashi et al., 2002; Watanuki et al., 2006) and may have the potential for use as an antimicrobial agent in aquafeed or perhaps may even be of pharmaceutical interest (Pradhan et al., 2012). The experiment reported here was designed to evaluate the effects of fishmeal substitution by Spirulina and Chlorella in the Gambusia affinis diet on survival, growth performance and immune system function.
MATERIALS AND METHODS
In attempts to keep genetic variation limited, 18 gravid females were collected and fry produced within 4 days were collected. Fry were sorted into 5 tanks with 20 fry in each tank; tanks were duplicated for comparison. Eight gallon (30.23 L) BiOrb® Flow tanks with internal filtration were randomly assigned to study groups. Before the start of the experiments, the fish were acclimated for 1 week in aquaria and were fed a standard Zeigler #1 crumble (0.6–0.85 mm); initial weights of fry were obtained and averaged. After the acclimation period, the fish were distributed into 8 gallon aquariums, each containing 20 fish/replicate. The fish were kept for 90 days at 26 ± 1 ˚C, with lighting on from 0600 to 1600h. Water changes (50%) were done once a month. Five diets were used, each incorporating differing Spirulina and Chlorella content (0% addition diet Zeigler #1 – control, 1% Spirulina/1% Chlorella – group 4, 2% Spirulina – group 3, 2% Spirulina/2% Chlorella – group 2, 3% Spirulina/3% Chlorella – group 1). The composition of the four experimental diets and the
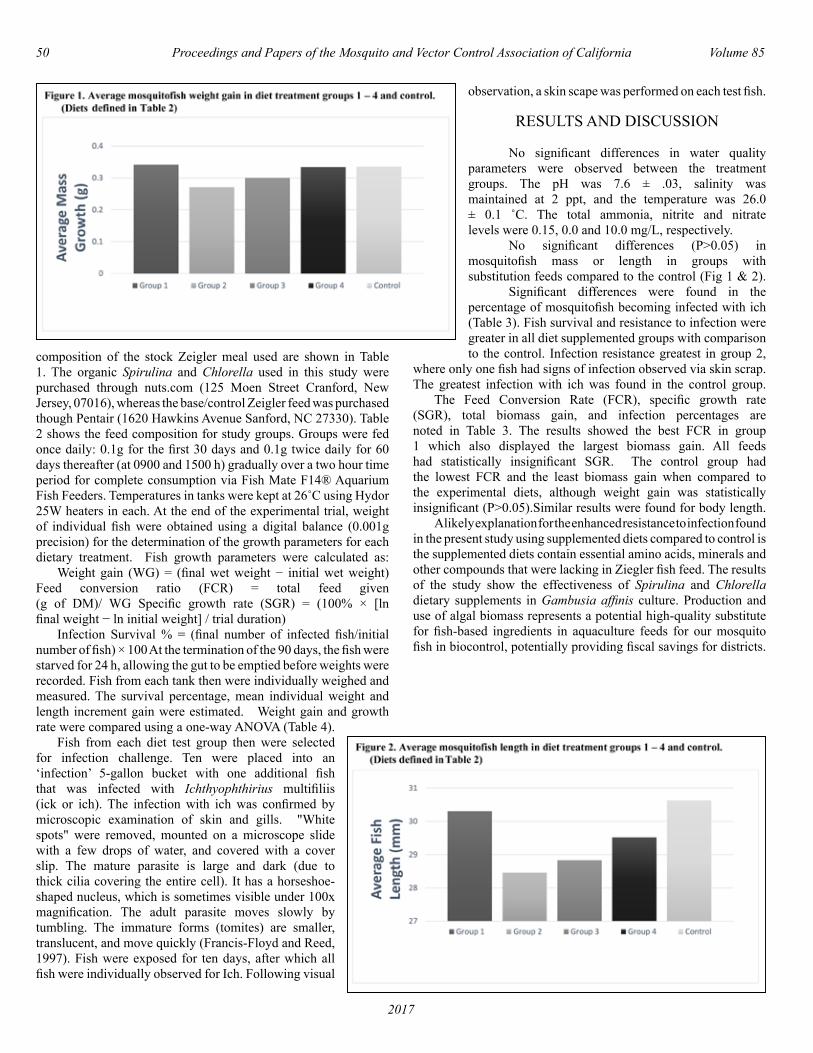
50 Proceedings and Papers of the Mosquito and Vector Control Association of California Volume 85
2017
composition of the stock Zeigler meal used are shown in Table 1. The organic Spirulina and Chlorella used in this study were purchased through nuts.com (125 Moen Street Cranford, New Jersey, 07016), whereas the base/control Zeigler feed was purchased though Pentair (1620 Hawkins Avenue Sanford, NC 27330). Table 2 shows the feed composition for study groups. Groups were fed once daily: 0.1g for the first 30 days and 0.1g twice daily for 60 days thereafter (at 0900 and 1500 h) gradually over a two hour time period for complete consumption via Fish Mate F14® Aquarium Fish Feeders. Temperatures in tanks were kept at 26˚C using Hydor 25W heaters in each. At the end of the experimental trial, weight of individual fish were obtained using a digital balance (0.001g precision) for the determination of the growth parameters for each dietary treatment. Fish growth parameters were calculated as: Weight gain (WG) = (final wet weight − initial wet weight) Feed conversion ratio (FCR) = total feed given (g of DM)/ WG Specific growth rate (SGR) = (100% × [ln final weight − ln initial weight] / trial duration) Infection Survival % = (final number of infected fish/initial number of fish) × 100 At the termination of the 90 days, the fish were starved for 24 h, allowing the gut to be emptied before weights were recorded. Fish from each tank then were individually weighed and measured. The survival percentage, mean individual weight and length increment gain were estimated. Weight gain and growth rate were compared using a one-way ANOVA (Table 4). Fish from each diet test group then were selected for infection challenge. Ten were placed into an ‘infection’ 5-gallon bucket with one additional fish that was infected with Ichthyophthirius multifiliis (ick or ich). The infection with ich was confirmed by microscopic examination of skin and gills. "White spots" were removed, mounted on a microscope slide with a few drops of water, and covered with a cover slip. The mature parasite is large and dark (due to thick cilia covering the entire cell). It has a horseshoe-shaped nucleus, which is sometimes visible under 100x magnification. The adult parasite moves slowly by tumbling. The immature forms (tomites) are smaller, translucent, and move quickly (Francis-Floyd and Reed, 1997). Fish were exposed for ten days, after which all fish were individually observed for Ich. Following visual
observation, a skin scape was performed on each test fish.
RESULTS AND DISCUSSION
No significant differences in water quality parameters were observed between the treatment groups. The pH was 7.6 ± .03, salinity was maintained at 2 ppt, and the temperature was 26.0 ± 0.1 ˚C. The total ammonia, nitrite and nitrate levels were 0.15, 0.0 and 10.0 mg/L, respectively. No significant differences (P>0.05) in mosquitofish mass or length in groups with substitution feeds compared to the control (Fig 1 & 2). Significant differences were found in the percentage of mosquitofish becoming infected with ich (Table 3). Fish survival and resistance to infection were greater in all diet supplemented groups with comparison to the control. Infection resistance greatest in group 2,
where only one fish had signs of infection observed via skin scrap. The greatest infection with ich was found in the control group. The Feed Conversion Rate (FCR), specific growth rate (SGR), total biomass gain, and infection percentages are noted in Table 3. The results showed the best FCR in group 1 which also displayed the largest biomass gain. All feeds had statistically insignificant SGR. The control group had the lowest FCR and the least biomass gain when compared to the experimental diets, although weight gain was statistically insignificant (P>0.05).Similar results were found for body length. A likely explanation for the enhanced resistance to infection found in the present study using supplemented diets compared to control is the supplemented diets contain essential amino acids, minerals and other compounds that were lacking in Ziegler fish feed. The results of the study show the effectiveness of Spirulina and Chlorella dietary supplements in Gambusia affinis culture. Production and use of algal biomass represents a potential high-quality substitute for fish-based ingredients in aquaculture feeds for our mosquito fish in biocontrol, potentially providing fiscal savings for districts.
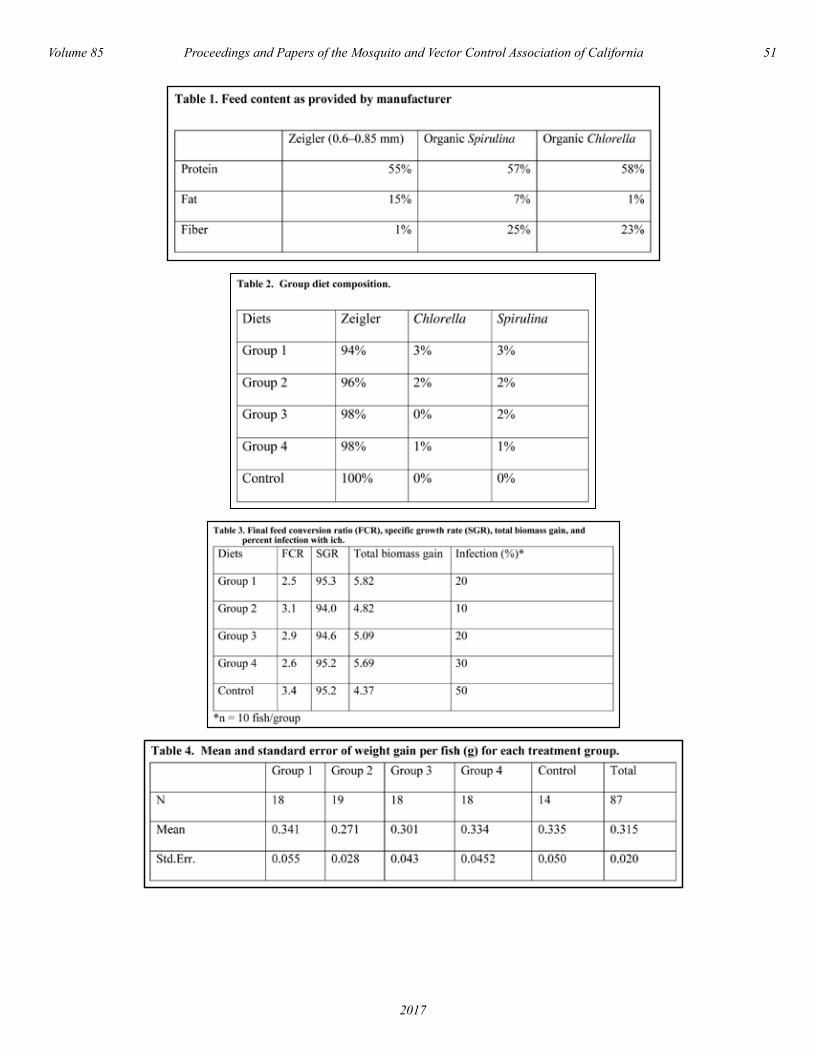
Volume 85 Proceedings and Papers of the Mosquito and Vector Control Association of California 51
2017

52 Proceedings and Papers of the Mosquito and Vector Control Association of California Volume 85
2017
REFERENCES
Aoki, T., 1922. Chemotherapy and drug resistance in fish farms in Japan. In: Sheriff, M., Subasinghe, R., Arthur, J. (Eds.), Diseases in Asian Aquaculture. Fish Health section, Asian Fisheries Society, Manila, Philippines, pp. 519–529.
Austin, B., Austin, D.A., 1999. Bacterial Fish Pathogens: Disease of Farmed and Wild Fish (3rd Edn). Springer-Praxis, Chichester, UK.
Abutbul, S., Goldhirsh, G.A., Barazani, O., Ofir, R., Zilberg, D., 2005. Screening of desert plants for use against bacterial pathogens in fish. Isr. J. Aquacult. Bamidgeh 57: 71–80.
Belay, A., Kato, T., Ota, Y., 1996. Spirulina (Arthrospira): potential application as an animal feed supplement. J. Appl. Phycol. 8: 303–311.
Choi, J.S., Lee, J.H., Park, H.J., Kim, H.G., Young, H.S., Mun, S.I., 1993. Screening for antioxidant activity of plants and marine algae and its active principles from Prunus davidiana. Korean J. Pharmacol. 24: 299–303.
Choudhury, S., Sree, A., Mukherjee, S.C., Pattnaik, P., Bapuji, M., 2005. In vitro antibacterial activity of extracts of selected marine algae and mangroves against fish pathogens. Asian Fish. Sci. 18: 285–294.
Francis-Floyd R., Reed P., 1997 Ichthyophthirius multifiliis (White Spot) Infections in Fish, http://agrilifecdn.tamu.edu/fisheries/ files/2013/09/ Ichthyophthirius-multifiliis-White-Spot-Infections-in-Fish.pdf , Accessed Feb 2017
Hirahashi, T., Matsumoto, M., Hazeki, K., Saeki, Y., Ui, M., Seya, T., 2002. Activation of the human innate immune system by Spirulina: augmentation of interferon production and NK cytotoxicity by oral administration of hot water extract of Spirulina plantesis. Int. Immunopharmacol. 2: 423–434.
James, R., Sampath, K., Thangarathinam, R., Vasudevan, J., 2006. Effect of dietary Spirulina level on growth, fertility coloration and leucocyte count in red swordtail, Xiphophorous helleri. Isr. J. Aquac. Bamidgeh 58: 97–104.
Pradhan, J., Das, B.K., Sahu, S., Marhual, N.P., Swain, K.A., Mishra, B.K., Eknath, E.A., 2012. Traditional antibacterial activity of freshwater microalga, Spirulina platensis to aquatic pathogens. Aquac. Res. 43: 1287–1295.
Rijkers, G.T., Teunissen, A.G., Oosteron, V.R., Muiswinkel, V.W.B., 1980. The immune system of cyprinid fish. The immuno- suppressive effects of the antibiotic oxytetracycline in carp (Cyprinus carpio L.). Aquaculture 19, 177–189.
Sasaki, M.S., Ejima, Y., Tachibana, A., Yamada, T., Ishizaki, K., Shimizu, T., Nomura, T., 2002. DNA damage response pathway in radioadaptive response. Mutat. Res. 504, 101–118.
Volume 85 Proceedings and Papers of the Mosquito and Vector Control Association of California 53
2017
South San Joaquin Valley Region Mosquitofish Health Workshop
Katherine S. Ramirez
Consolidated Mosquito Abatement District, 2425 Floral Ave, Selma, CA 93662, [email protected], (559) 896-1085
ABSTRACT: The MVCAC has provided workshops to assist Districts in identifying mosquitofish diseases and assess their overall care. The last two workshops given by Paul Curtis, an expert in aquaculture, provided valuable information on mosquitofish diseases and care. The lessons learned from the Diseases and Pathology Workshop were compiled into a presentation for a Regional Continuing Education program. This presentation sparked an interest within the South San Joaquin Valley Region to hold another workshop with a focus on mosquitofish health. This workshop was made available to one scientific or fish management staff per District within the South San Joaquin Valley Region.
INTRODUCTION
Since April 1922, mosquitofish (Gambusia affinis) have been used as the primary method for biological control of mosquitoes in California. Under the California Fish and Game Code Title 14, Section 238.5, many Mosquito and Vector Control Districts can legally release healthy mosquitofish without obtaining a stocking permit. The Mosquito and Vector Control Association of California’s Mosquitofish subcommittee has provided workshops to assist Districts in identifying mosquitofish diseases and assess their overall care. The last two workshops were given by Paul Curtis. Mr. Curtis has worked in the aquaculture field for almost 20 years. He gained a Bachelors degree in Marine Biology and Masters in Fish Education from the University of Guelph in Ontario, Canada. In the first workshop in 2015 called Aquaculture 101, he discussed the best practices in fish management systems, basic water quality, and how all of these can influence fish health. The second workshop in 2016, focused on common fish disease and pathology, and treatment options. The information learned from both workshops, experience, and additional research results were included in the regional continuing education program in March of 2016. There was a good deal of interest from the members of our region who found difficulties in caring for mosquitofish. So shortly after the continuing education program, all the managers within the region received an announcement of an upcoming mosquitofish health workshop. This letter contained specific information about the workshop. There are eleven districts in this region with five districts sending one or two people. There was a total of six attendees at this workshop. Prior to this workshop, none of the participants conducted internal investigations of the health of the mosquitofish they stock.
METHODS
The workshop began with a presentation on basic fish health and water quality. In order to handle these small fish and take skin samples, anesthesia is necessary to reduce stress and ‘calm’ the fish while skin is sampled. The only FDA approved anesthesia is MS-222 – Tricaine Methanesulfonate. This product was not available during this workshop, so Clove Oil was used. Clove
oil is not FDA approved, so it cannot be used as a fish anesthetia if those fish will be put back into the water system and possibly consumed as food by other species (US Fish & Wildlife Services, www.fws.gov/fisheries/aadap/resources_clove_oil.html). It is also somewhat messy to use. The anesthetized fish in our workshop were sacrificed and not returned into any runway or pond. After anesthesia, a mosquitofish was observed which had a skin lesion and scale loss. A skin scrape was gathered by lightly scraping the fish skin in a downward motion using a cover slip. The same cover slip was then placed on top of the microscope slide and observed with a compound microscope at x4, x10 and x40. Another way to assess fish health is through gill dissections. After anesthesia, the gills were removed by clipping the gill arch and pulling the gill segments out of the fish head. The gill segments were separated onto a microscope slide and a cover slip placed on top of the separated segments. A small amount of clean water was added to the side under the cover slip. Then the gill segments were observed with a compound microscope at x4, x10 and x40 (US Fish & Wildlife Services, Fish Necropsy for student www.fws.gov/aah/lr-education.html).
DISCUSSION
During this workshop, we observed parasites in the tissues gathered from skin scrapes and the gill segments. All of the attendees were able to gain hands on experience in sampling tissues from the small mosquitofish. This workshop allowed attendees to develop skills to develop a plan of action for a comprehensive mosquitofish program, including quarantine processes when bringing in new fish stock, water quality testing, health sampling procedures, and schedules for the visual observation of the fish. There are many reasons why fish can have lesions and scraping the skin or observing the gill segments can be good diagnostic tools to assess the health of the fish. The gills can also provide some information about the water quality. If darkened color or gill fusion is seen that is a good indication that the water quality is not optimum. After a plan is developed, keeping good records provides the basis for sound, cost-effective management decisions. This will also help keep track of treatment plans and help determine health issues early to reduce fish loss.

54 Proceedings and Papers of the Mosquito and Vector Control Association of California Volume 85
2017
ACKNOWLEDGEMENTS
I would like to acknowledge the many people that made this workshop possible. Steve Mulligan, Manager, Consolidated Mosquito Abatement District, for allowing the time to make the workshop possible; Anton Cornel, UC Davis Mosquito Research Lab, for the use of facility; Chenoa De Freece, Fresno Mosquito and Vector Control District, collaborator and workshop attendee; John Krolnik, Kern Mosquito and Vector Control District, workshop attendee; Aleece Richter, Fresno Westside Mosquito Abatement District, workshop attendee; Chance Rowen, Fresno Westside Mosquito Abatement District, workshop attendee; Jay Thao, Delano Mosquito Abatement District, workshop attendee; Mike Saba and all persons on the MVCAC Mosquitofish Subcommittee, for their valuable insight and resources.
REFERENCES CITED
Downs, C. 1991. Fishes in California Mosquito Control. The Biological Control Committee, California Mosquito and Vector Control Association, Inc., Sacramento, CA.
Swanson, C. , J. Cech, and R. Piedrahita. 1996. Mosquitofish Biology, Culture and Use in Mosquito Control. Mosquito and Vector Control Association of California and The University of California Mosquito Research Program., University of California, Davis, CA.
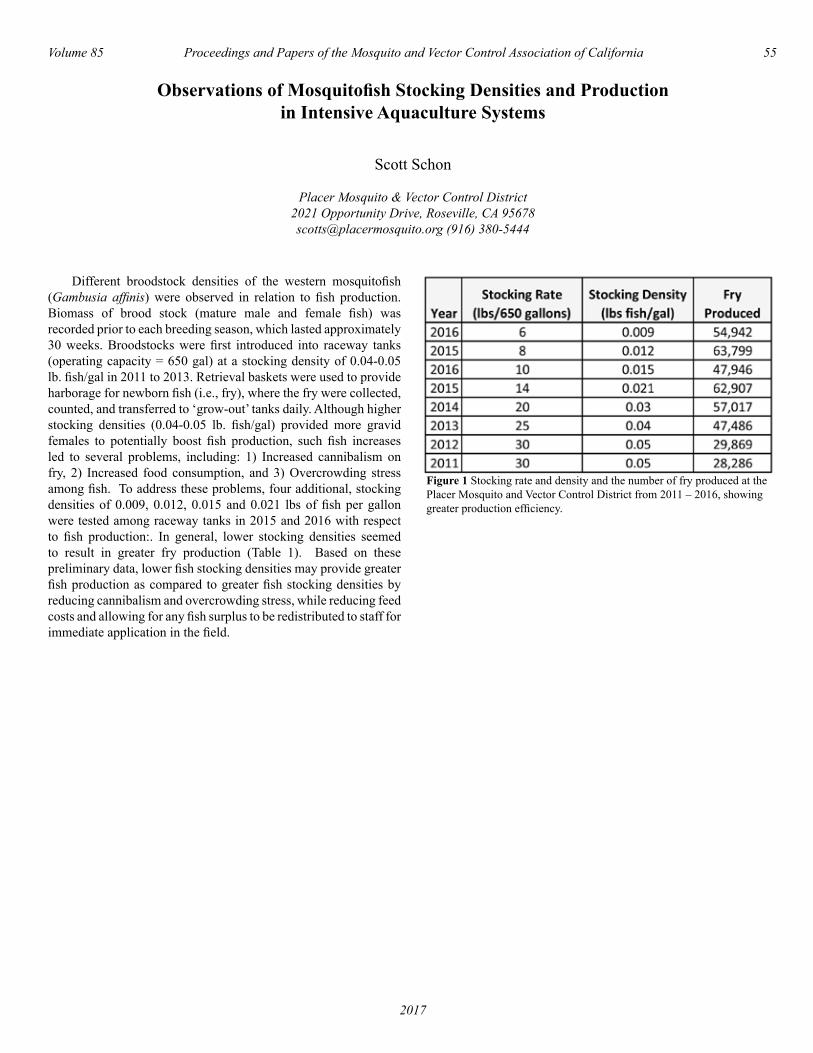
Volume 85 Proceedings and Papers of the Mosquito and Vector Control Association of California 55
2017
Observations of Mosquitofish Stocking Densities and Production in Intensive Aquaculture Systems
Scott Schon
Placer Mosquito & Vector Control District2021 Opportunity Drive, Roseville, CA [email protected] (916) 380-5444
Figure 1 Stocking rate and density and the number of fry produced at the Placer Mosquito and Vector Control District from 2011 – 2016, showing greater production efficiency.
Different broodstock densities of the western mosquitofish (Gambusia affinis) were observed in relation to fish production. Biomass of brood stock (mature male and female fish) was recorded prior to each breeding season, which lasted approximately 30 weeks. Broodstocks were first introduced into raceway tanks (operating capacity = 650 gal) at a stocking density of 0.04-0.05 lb. fish/gal in 2011 to 2013. Retrieval baskets were used to provide harborage for newborn fish (i.e., fry), where the fry were collected, counted, and transferred to ‘grow-out’ tanks daily. Although higher stocking densities (0.04-0.05 lb. fish/gal) provided more gravid females to potentially boost fish production, such fish increases led to several problems, including: 1) Increased cannibalism on fry, 2) Increased food consumption, and 3) Overcrowding stress among fish. To address these problems, four additional, stocking densities of 0.009, 0.012, 0.015 and 0.021 lbs of fish per gallon were tested among raceway tanks in 2015 and 2016 with respect to fish production:. In general, lower stocking densities seemed to result in greater fry production (Table 1). Based on these preliminary data, lower fish stocking densities may provide greater fish production as compared to greater fish stocking densities by reducing cannibalism and overcrowding stress, while reducing feed costs and allowing for any fish surplus to be redistributed to staff for immediate application in the field.

56 Proceedings and Papers of the Mosquito and Vector Control Association of California Volume 85
2017
Testing the Effectiveness of Barley Straw as an Algaecide or Growth Inhibitor
Darrell Jew
Sutter-Yuba Mosquito and Vector Control District, 701 Bogue Road, Yuba City, CA [email protected]
ABSTRACT: Barley straw (Hordeum vulgare L.) has been used as a treatment to inhibit phytoplankton growth in pond culture, but critics question its effectiveness. The objective of this study was to test the effectiveness of barley straw in controlling aquatic vegetation. Pond 1 had phytoplankton and pond 2 had filamentous algae. Each of the 2 ponds was inoculated with a 15 pound wattle of barley straw. In addition, two buckets of water from mosquitofish rearing tanks without any observable aquatic vegetation were also tested. Bucket 1 served as a control with no barley straw introduced, and Bucket 2 was inoculated with the straw. Ponds and buckets were checked daily. The measurements of the operational experiment were based on observations in changes of growth in filamentous algae and phytoplankton. Data was recorded twice a week. Observations indicated Pond 1 did not show an increase in phytoplankton growth. Pond 2 filamentous algae continued to grow with no observable change in phytoplankton growth. Control bucket 1 (without barley straw) demonstrated filamentous algae growth, and bucket 2 (with barley straw) had almost no aquatic vegetation growth. Results showed barley straw did not hinder filamentous algae growth but appeared to inhibit phytoplankton.
Volume 85 Proceedings and Papers of the Mosquito and Vector Control Association of California 57
2017
Developing a Viable Supplemental Protein Feed for Mosquitofish using Aquatic Organisms
Darrell Jew
Sutter-Yuba Mosquito and Vector Control District, 701 Bogue Road, Yuba City, CA [email protected]
ABSTRACT: Fish feed can be costly for Mosquito and Vector Control Districts. Using a low cost alternative food source that is readily available can maintain fish growth without compromising the budget. This operational experiment evaluated the use of aquatic organisms such as the Red Swamp Crayfish (Procambarus clarkii), White River Crayfish (Procambarus acutus) and various metamorphic stages of the American Bullfrog (Lithobates catesbeianus) as a supplemental protein source for mosquito fish production. Developing a processing method for these pest animals potentially creates a viable food product. The animals were captured and homogenized in a food processor to produce particle sizes suitable for mosquitofish to feed on. In addition, processing methods were developed to reduce feed waste by freezing the processed animal for storage. Fish were fed by defrosting the floating frozen food chunk in the fish ponds thereby slowly dispersing the processed animal and giving mosquitofish time to feed and thereby reducing the amount of unfed food from reaching the bottom of the ponds. Results show mosquitofish fed readily on the processed supplemental feed. Fish continued to appear healthy throughout the course of feeding on this supplemental protein source as did the fish that were not given the supplemental diet.

58 Proceedings and Papers of the Mosquito and Vector Control Association of California Volume 85
2017
The Mosquitofish and Biocontrol Subcommittee: Looking Back and Ahead
Michael V. Saba
Orange County Mosquito and Vector Control District, 13001 Garden Grove Blvd, Garden Grove, CA 92843, [email protected],
ABSTRACT: The Mosquitofish and Biocontrol Subcommittee (Subcommittee) was formed in December 2013 to provide specialized support and resources for members of the Mosquito and Vector Control Association of California (MVCAC) that manage mosquitofish and biological control programs. Since 2013, the Subcommittee has hosted quarterly meetings, presented symposia during annual MVCAC conferences, published information describing statewide mosquitofish use and production, and hosted numerous mosquitofish and aquaculture workshops. Looking ahead, the Subcommittee will work with the MVCAC to launch an online forum to improve communication and technical support, host additional workshops, maintain awareness about regulatory and environmental policies germane to statewide aquaculture operations, and explore aquaculture and other related partnerships beneficial to mosquitofish program operation and productivity. The Subcommittee provides ongoing support for those who oversee established and new programs. To learn more about what we do and how we may assist you, please contact Scott Schon or Michael Saba.

Volume 85 Proceedings and Papers of the Mosquito and Vector Control Association of California 59
2017
CalSurv Gateway: Mapping and Data Visualization Tools for Invasive Aedes
Jody K. Simpson and Christopher M. BarkerDART Laboratory, Department of Pathology, Microbiology, and Immunology, School of Veterinary Medicine,
University of California, Davis
ABSTRACT: Invasive mosquitoes in the genus Aedes have continued their rapid spread in California, and new tools are needed to visualize these changes over time and to quantify population size in ways that inform control programs. This presentation describes the latest updates to CalSurv Gateway tools for mapping and visualizing data from Aedes trapping, inspections, and insecticide resistance testing.

60 Proceedings and Papers of the Mosquito and Vector Control Association of California Volume 85
2017
Implementation of MapVision, a Geospatial Data Management System,and Entrance into the Information Age
David E. Heft and Monica Patterson
Turlock Mosquito Abatement District, 4412 N. Washington Road, Turlock, CA [email protected]; [email protected]
Efficient data collection and utilization has become critical in today’s mosquito and vector control workplace. Traditional practices in the mosquito control industry typically included paper-and-pencil data entry and storage. As data base systems became more user friendly, data may have been entered into a computer database such as Microsoft Access or Visual FoxPro. While storing the data in a digital fashion may have made storage more efficient, effective reporting and utilization of the data were often absent. Within the past decade, geospatial data management systems have improved dramatically due to the increased effectiveness of GPS measurements, GIS digital mapping systems and high-speed internet access. Correspondingly, as these systems have been implemented and used more-and-more in government, the public’s expectations concerning transparency and data access have increased. In today’s world public agencies who don’t have a significant presence on the internet are increasingly viewed in a negative fashion. Policy issues affecting mosquito and vector control agencies have changed over the last decade. West Nile virus is now found throughout the state of California and many counties are battling invasive species such as Aedes albopictus and Aedes aegypti. These invasive species transmit new viruses such as Zika, dengue and chikungunya. In addition, adult mosquitoes in California are showing significant amounts of resistance to pyrethroids which posees a direct threat to the effectiveness of mosquito control programs. Finally, districts face mounting regulatory and legal pressures requiring extensive reporting and detailed logging of all chemical applications. To be frank, districts are being asked to do more than ever before, with less and less resources. In response, many districts, such as the Turlock Mosquito Abatement District (“District”), have turned to geospatial data management systems, such as MapVision, to help overcome these additional commitments and constraints and to meet growing public expectations. In 2015, the District purchased the MapVision data management system with the following goals in mind: • Meet public expectations • Assist with regulatory reporting requirements • Improve communication and efficiency • Assist supervision and enable timely decisions • Reduce costs
Using the MapVision system, the District significantly improved transparency to the public. West Nile virus positive
dead birds and mosquito pools are mapped online providing the public the opportunity to view where virus transmission is taking place in their communities. In addition, colored polygons are overlaid onto the map representing the areas where the District will be conducting aerial and/or ground adulticide spraying missions. This allows the public to reconcile District control activities directly with virus transmission events reinforcing the District’s message that where, when and why we spray is directly correlated with surveillance data. All control activities are directly entered into MapVision from the field eliminating time and errors by not requiring data entered multiple times by multiple employees. Reporting requirements, such as monthly Pesticide Use Reports and annual NPDES reports, have been automated and continue to be improved. In addition, the process of tracking and sending out billing has been significantly simplified. Considering that personnel costs are the largest part of the District’s budget, anything that improves efficiency and allows staff to take on additional projects without increasing staff size is a considerable cost savings. Control staff get immediate access to surveillance data in their zones allowing for much more timely decision making. Questions or complaints by the public can be immediately processed since all control activities are logged and mapped for easy retrieval. This immediacy conveys a level of confidence to the public which often diminishes any complaints because it portrays to the public that the district is well managed and in control of their activities. In terms of future development, the District and Leading Edge plan to design dashboards for control technicians in which chemical use and costs are tracked in real-time and compared against assigned budgets. Employees will be expected to make choices based on sound control strategies, resistance rotations, and cost effectiveness. In addition, sources will be linked to APN numbers and control costs at individual properties will be tracked. Using “cost” as a data indicator, the District will be able to identify those properties that are having significant breeding issues immediately and take steps to eliminate these sources avoiding long-term control costs. This not only allows the District to significantly reduce costs but allows for quick identification and elimination of noteworthy breeding sources. By embracing the use of GIS and data management, the District has increased public confidence in what we do, improved our service to the public and reduced current in future costs by continuing to do more, with less.

Volume 85 Proceedings and Papers of the Mosquito and Vector Control Association of California 61
2017
Fighting Vector-borne Disease – Putting the Pieces Together with Geospatial Solutions
Chad Minteer
Frontier Precision, Inc. (formerly Electronic Data Solutions)154 1st Avenue W. Jerome, Idaho 83338
A geospatial business solution “puzzle pieces” has been developed that assist with mosquito control operations, including Zika virus response. Frontier Precision, Inc. (formerly Electronic Data Solutions (Elecdata) has been actively involved in developing, implementing, and supporting GIS-based mosquito control software solutions for more than a decade. Our experience has been that using GIS in a targeted manner can improve operational efficiency and provide solid information for intelligent decision support. In this presentation, we discuss and demonstrate new developments in our geospatial operations solutions, FieldSeeker GIS & Sentinel GIS, including our new Windows ULV Extension, the new Juniper Mesa 2 Windows 10 tablet, our Geospatial Value Plan, and the positive changes from merging with Frontier Precision. Weshare specific examples from the Esri Vector-Borne Disease Surveillance & Control business solution and demonstrate how they can work with any solution you currently have or are planning on using, including FieldSeeker GIS, Sentinel GIS, home-grown systems, or other vendor products.
62 Proceedings and Papers of the Mosquito and Vector Control Association of California Volume 85
2017
Alameda County Mosquito Abatement District 2016 Update
Ryan Clausnitzer
District Manager Alameda County Mosquito Abatement District
23187 Connecticut Street , Hayward, CA 945021 [email protected]
ABSTRACT: The Alameda County Mosquito Abatement District is a mosquito-only vector control independent special district focused on protecting the public health by controlling mosquitoes. This was accomplished by empowering employees throughout the organization while honestly communicating with the public whom we serve. We value internal communication, good governing strategies, and fiscal prudency, while encouraging a work-life balance that allows us to integrate with and reflect the values of our community. During 2016, our District certified our Programmatic Environmental Impact Report, implemented a new logo, obtained the California Special District Association Transparency Certificate of Excellence, and completely rewrote our administrative policies. We also changed our database, payroll company, payroll bank and independent audit firm, while weathering a 50% change in staff, a 50% change in trustees, and managing an accidental laboratory release of Aedes aegypti. These successes and challenges were managed by a staff of 16, a 14-member Board of Trustees, and the 1.6 million residents within 819 square miles who support us.
Volume 85 Proceedings and Papers of the Mosquito and Vector Control Association of California 63
2017
Alameda County Vector Control’s Wildlife Programs
Robert Gay1, David Hammett2, Michael Mooney3
1Alameda County Vector Control, Vector Control Manager, 1131 Harbor Bay Parkway, [email protected]
2USDA, Wildlife Specialist, 1131 Harbor Bay Parkway, Alameda [email protected]
3Alameda County Vector Control, Vector Control Biologist, 1131 Harbor Bay Parkway, [email protected]
Alameda County Vector Controls’ wildlife program provides a high degree of service to the public while responding to a wide variety of scenarios. Consideration of public health, local ecology, and damage to private property is exercised in each service request. This presentation outlines the scope, practices, and strategies employed for the management of urban wildlife.
64 Proceedings and Papers of the Mosquito and Vector Control Association of California Volume 85
2017
Control of Urban Wildlife in Alameda County
Michael R. Mooney
Alameda County Vector Countrol Services District, 1131 Harbor Bay Parkway, Alameda, CA 94502, (510) [email protected]
The goal of Alameda County Vector Control Service District wildlife program is to educate the public to peacefully coexist with urban wildlife. Problematic wildlife activity accounted for 21% of total service requests received in 2016. As wildlife services provided by other agencies have decreased, the District has developed wildlife removal protocols to address the public need. All staff biologists are trained and experienced in wildlife eviction; however, the District also retains the services of a USDA wildlife expert through a memorandum of understanding between the two agencies. Disease transmission and property damage from wildlife are serious concerns for Alameda County residents. Due to the volume of wildlife service requests, a protocol has been developed for successful evictions.The strategy is to implement humane, effective, and long term solutions for nuisance wildlife. Eviction focuses on denying availability of food and preventing access to shelter. During the initial inspection the Vector Control Biologist surveys the property for physical evidence related to the problem. This includes footprints, travel patterns, waste, attractants, location, shelter, and interviews with residents. Monitoring devices like wildlife cameras, tracking powder, and paper barriers provide information about species, travel, and presence of litters. Eviction relies on harassment during daylight hours to interrupt sleep including intermittent noise (leaf blower, run in five minute intervals three times per hour) or scents (eviction fluid, ammonia). The use of recordings of aggressive male vocalizations to evict females with litters is also being investigated. For exclusion it is necessary to channel the animal through a single monitored opening, often affixed with a one way door. Following eviction, exclusion is performed by the home owner using our recommendations. The success of this wildlife program relies on education and cooperation of the home owner. During the inspection process the home owner is taught what has attracted wildlife, and given recommendations on how to change these conditions permanently. Biologists must spend enough time to adequately inspect, educate residents, and provide recommendations to home owners. Through this process we garner support of the home owner in making long term changes to the behaviors and conditions that attracted nuisance wildlife, creating a more permanent solution.
Volume 85 Proceedings and Papers of the Mosquito and Vector Control Association of California 65
2017
Vector control response to an elevated WNV health risk adjacent to sensitive natural habitat
KariLyn Merlos, Jessica Dieckmann, Nikos Gurfield
County of San Diego Vector Control Program, Department of Environmental Health5570 Overland Ave Ste 102, San Diego, CA 92123
ABSTRACT: In the spring of 2016, high numbers of WNV-infected Culex tarsalis mosquitoes were detected in EVS traps around Los Penasquitos Marsh and Lagoon, a natural preserve adjacent to the ocean in San Diego, California. Failure to unplug the lagoon mouth by the organization that maintains the lagoon resulted in highly conducive conditions for mosquito production. Despite multiple applications of larvicide by helicopter, boat and foot, WNV-infected Cx. tarsalis numbers continued to increase. Risk analysis revealed that communities immediately adjacent to the lagoon, as well as a business park and UCSD were at a high potential risk for WNV. For the first time in over 30 years, in order to mitigate an elevated risk to public health, the San Diego County Vector Control Program initi-ated a multiday adulticide ULV operation in the community adjacent to the lagoon. The communication and operational strategies used to successfully conduct this operation in a potentially pesticide-adverse community adjacent to sensitive natural habitat was described.
66 Proceedings and Papers of the Mosquito and Vector Control Association of California Volume 85
2017
Evidence-based Thresholds for Adult Mosquito Control
Pascale Stiles1 and Christopher Barker
Davis Arbovirus Research and Training (DART) Lab, Department of Pathology, Microbiology, and Immunology, University of California, Davis, CA 95616
1Author contact: [email protected]
ABSTRACT: The vector index (VI) is used to estimate the relative abundance of arbovirus-infected mosquitoes in an area as the product of two commonly monitored quantities: mosquito trap counts and mosquito infection rates. It is used increasingly to guide control programs as an entomological indicator of human infection risk for arboviruses, especially for zoonotic pathogens such as West Nile virus (WNV). Currently, there is no established VI threshold below which transmission to humans would not be expected. To provide a better evidence basis for adult control decisions, we have developed models to relate VI to the incidence of human WNV disease using surveillance data from several mosquito control agencies. In this study, we present a general relationship between VI and disease incidence by pooling data from all agencies. The results of this study will help to inform decisions about the most relevant entomological thresholds for targeting broad-scale control measures.
INTRODUCTION
West Nile virus (WNV) is a zoonotic arbovirus (family Flaviviridae, genus Flavivirus) that remains an important cause of human disease in California. Vector control is intensified when routine surveillance detects elevated mosquito abundance or infection rates, sentinel chicken infections, and/or clusters of dead birds (California Department of Public Health, 2017). Mosquito surveillance provides objective information on the intensity of local arbovirus transmission, but quantification of the relationship between surveillance metrics and human infection risk is needed to inform policy on when to implement broad-scale mosquito control measures such as spraying aerial adulticides.The vector index (VI) quantifies the relative abundance of infected female mosquitoes by taking the product of mosquito trap counts and mosquito infection rates for a given location and time period (Gujral et al. 2007). This single value is easily understood, leading to its increase in popularity as a risk indicator (Jones et al. 2011). In addition, changes in the VI have been shown to be correlated with changes in human disease risk (Kwan et al. 2012). This project aims to identify a threshold for VI below which transmission to humans would not be expected and to generalize the relationship to spatial scales that are relevant for control decisions.
METHODS Human WNV disease case data from 2003 through 2016 were obtained at the county level for the counties affiliated with contributing vector control agencies from the California Department of Public Health (CDPH) WNV surveillance program and were aggregated by week of onset. West Nile fever and West Nile neuroinvasive disease cases were not distinguished for the purposes of this study. Entomological data were obtained from routine mosquito surveillance conducted by local vector control agencies (see acknowledgments) from 2003 through 2016 through the CalSurv Gateway hosted by the Davis Arbovirus
Research and Training (DART) laboratory at the University of California, Davis. These included mosquito collection records from gravid and CO2 baited traps and mosquito infection prevalence from pools tested for WNV by RT-PCR. All analyses were carried out in R version 3.3.3 (R Core Team, 2017). To examine the effect of VI on WNV disease incidence, WNV incidence was calculated by dividing the total number of cases by county population in the target year. Because WNV is highly seasonal, only weeks from July 1 through September 30 as the peak period of WNV activity were considered. For each week in each county in the study period, the abundance of Culex tarsalis and Culex pipiens adult females per trap-night (combined gravid and CO2) and maximum likelihood estimates for mosquito infection prevalence per 1,000 females were calculated and multiplied to obtain the VI. A simple linear regression model was fitted to relate the VI to cumulative human disease incidence in the three weeks following a VI observation for the full scope of the data as well as for each county within the study area. Both WNV disease incidence and VI were log-transformed to reduce influence of outliers and skewness. We excluded zero values for VI, because a VI of zero is not informative for vector control decisions.
RESULTS AND DISCUSSION
Overall, human disease incidence increased at higher values of VI. However, there was evidence for heterogeneity among counties, with the strongest correlation in two counties that do not currently conduct aerial mosquito control. There was higher-than-average incidence in Orange and Yolo Counties and lower-than-average incidence in Los Angeles County for a given VI. Placer, Sacramento, and Stanislaus Counties showed approximately average incidence for a given VI. Furthermore, when incidence was considered as a binary outcome of cases versus no cases in a week-long period, there was no threshold below which transmission to humans did not occur during the peak period of WNV activity. This is

Volume 85 Proceedings and Papers of the Mosquito and Vector Control Association of California 67
2017
especially true in highly populated counties like Los Angeles County where the probability of having at least one case is high at all times during summer, even when VI is low. Additional analyses will consider this relationship at finer spatial scales.We plan to consider decision points using receiver operating characteristic (ROC) curve analyses to determine which VI threshold is most predictive of human disease occurrence, and whether this threshold can be applied across different spatial scales. We will also account for other possible sources of heterogeneity, such as demographic differences in at-risk areas and predominant mosquito species, in the subsequent models. Older individuals are more at risk for WNV, so it could make sense to target control interventions to risk areas where higher proportions of older individuals reside.
REFERENCES
California Department of Public Health. 2017. California Mosquito-Borne Virus Surveillance and Response Plan. http://west nile.ca.gov/resources.php
Gujral, I. B., E. C. Zielinski-Gutierrez, A. LeBailly, and R. Nasci. 2007. Behavioral risks for West Nile virus disease, Northern Colorado, 2003. Emerg. Infect. Dis. 13: 419-425
Jones, R. C., K. N. Weaver, S. Smith, C. Blanco, C. Flores, K. Gibbs, D. Markowski, and J. P. Mutebi. 2011. Use of the vector index and geographic information system to prospectively inform West Nile Virus interventions. J. Am. Mosq. Control Assoc. 27: 315-319
J. L. Kwan, B. K. Park, T. E. Carpenter, V. Ngo, R. Civen, and W. K. Reisen. 2012. Comparison of enzootic risk measures for predicting West Nile disease, Los Angeles, California, USA, 2004-2010. Emerg. Infect. Dis. 18: 1298-1306
R Core Team. 2017. R: A language and environment for statistical computing. R Foundation for Statis
ACKNOWLEDGMENTS
We want to thank the following vector control agencies for their contributions of funding and data for this study: Orange County Vector Control District, Greater Los Angeles County Vector Control District, San Gabriel Valley Mosquito and Vector Control District, Turlock Mosquito Abatement District, Sacramento-Yolo Mosquito and Vector Control District, and Placer Mosquito and Vector Control District.
68 Proceedings and Papers of the Mosquito and Vector Control Association of California Volume 85
2017
Continued Aerial ULV Adulticide Trials in Salt Lake City, Utah
Gregory S. White, Ary Faraji, Nadja Mayerle
Salt Lake City Mosquito Abatement District, 2020 N Redwood Rd., Salt lake City, UT 84116, [email protected]
Ultra-low volume (ULV) applications of adulticides are an important part of the integrated mosquito vector management (IVM) method used by many mosquito control districts. In the Salt Lake City Mosquito Abatement District (SCLMAD) there are large wetland habitats that produce high populations of mosquitoes. During summer months when mosquito populations are high and arbovirus circulation is occurring, these areas are often treated once or twice a week with aerial ULV applications of adulticides as part of the IVM program. For the past five years, the average acreage treated by aerial ULV applications was over 220,000 acres. Because this is a large expense to the district, SLCMAD wants to ensure the applications are effective at controlling the target mosquitoes. Some post application surveillance data has indicated that in certain trap areas mosquito numbers actually increase following aerial ULV applications. There are a number of factors that could affect the efficacy of aerial applications including thermal inversions, wind patterns, heat, humidity, product choice and vector movement. Studies of aerial ULV adulticide applications were initiated in 2015 and continued in 2016 to look at droplet penetration and characterization. Results in 2016 showed that droplets from aerial ULV applications are reaching target sites, and that droplet densities and sizes are within desired parameters. However, monitoring of vector populations before and after applications has produced mixed results, but generally indicated that aerial ULV applications temporally reduced mosquito abundance. Different products were evaluated in these studies. We present an overview of aerial ULV trials during 2016 and discuss the results in relation to operational accountability.
Volume 85 Proceedings and Papers of the Mosquito and Vector Control Association of California 69
2017
Using Vector Index To Determine When To Conduct Ultra-low Volume Aerial AdulticideMosquito Control Operations Over Urban Areas
Sarah S. Wheeler, Paula A. Macedo, Gary Goodman
Sacramento-Yolo Mosquito and Vector Control District, Elk Grove, CA [email protected]
ABSTRACT: In 2005 the Sacramento-Yolo Mosquito and Vector Control District (SYMVCD) implemented an urban aerial adulticide program to augment routine control efforts in response to the invasion and establishment of West Nile virus (WNV). Each year during peak WNV transmission, mosquito abundance and virus activity are closely monitored to determine whether an urban aerial adulticide treatment is necessary to interrupt viral transmission and protect human health. Initially, the determination of whether to proceed with the operation was based on a combination of elevated minimum infection rates, mosquito abundance, and increasing risk based on the California Mosquito-Borne Virus Risk Assessment. In 2015 we incorporated vector index calculations into the decision process and consider urban aerial applications when the vector index demonstrates a weekly upwards trend towards 500 and does not respond to ground operations.
INTRODUCTION
Mosquito surveillance, including both trapping for abundance and testing for vector-borne pathogens, is an important part of an integrated vector management program. Once traps are collected and mosquito pools are tested the end result can be large quantities of data. These data must be analyzed quickly and result in decision support for mosquito control operations. Currently, there is an array of entomological indicators that can be used to assess human risk, including vector abundance, number of positive pools, percent positive pools, infection rate, and vector index. Each of these entomological indicators has the advantages and disadvantages discussed briefly below. The vector index is a relatively new indicator of risk and has been used by SYMVCD to inform the decision making process with regard to ultra-low volume (ULV) aerial adulticide operations over urban areas. In the Sacramento Valley, West Nile virus (WNV) is currently the most important human pathogen in the region, and sustained elevated WNV activity is the event that triggers urban aerial adulticide operations. Therefore, the entomological indicators described herein were discussed in the context of WNV transmission to humans, but these indicators can also be adapted to other mosquito-borne pathogens.
METHODS
Vector abundance is the total number of mosquitoes of the vector species(s) collected divided by the number of trap nights. This number can be estimated at varying scale so that vector abundance at a single site or across a wide area can be assessed. Vector abundance is a useful metric for looking at mosquito populations over time and provides good information for an integrated vector management program. However, vector abundance does not provide information about WNV activity. The total number of positive pools is another simple metric that provides information about WNV activity in a given area and time period. Although the total number of positive pools can give
a clear indication of the presence of virus in an area, without a denominator (number of pools tested), it cannot convey the relative level of WNV activity. However this lack can easily be remedied by the calculation of percent positive pools (number of positive pools / number of pools tested x 100). Although percent positive pools is an improvement over positive pools alone, comparisons between sites and/or years can be confounded unless high numbers of pools are tested and the number of mosquitoes per pool is constant. Mosquito infection rate is a useful calculation used to estimate the prevalence of WNV infection in a population, and it is an improvement on percent positive pools because it accounts for the total number of mosquitoes collected, not just the number of pools tested. This is an advantage when the number of mosquitoes per pool is variable. Infection rates can be used to indicate human risk and can be calculated in two different ways. The minimum infection rate (MIR) is the total number of positive pools divided by the total number of mosquitoes tested and is generally expressed as the number of infected mosquitoes per 1000. Because the MIR calculation is based on the assumptions that infection rates in a population are generally low and numbers per pool relatively constant, the MIR calculation assumes that there is only one positive mosquito per positive pool. This assumption may not be valid during epizootic outbreaks and can lead to an underestimate of the infection rate. Therefore the maximum likelihood estimate calculation was developed (Biggerstaff 2008), which provides a more accurate estimate when infection rates are high (Gu et al. 2008). The maximum likelihood estimate (MLE) is more complicated to calculate than the MIR, but calculations can be made using an available tool on the CalSurv Gateway (https://gateway.calsurv.org/) or a Microsoft Excel ® Add-In available for download from the Centers for Disease Control and Prevention (https://www.cdc.gov/westnile/resourcepages/mosqsurvsoft.html). Vector index is the infection rate per 1000 (MLE) multiplied by the average number of mosquitoes collected per trap night, or mosquito abundance. Vector index can be used to estimate the
70 Proceedings and Papers of the Mosquito and Vector Control Association of California Volume 85
2017
abundance of infected mosquitoes in a given area, and combines information about the vector species present, relative abundance of those species, and their infection rate. Elevated vector index numbers have been shown to be a good indicator of human infection risk (Bolling et al. 2009; Jones et al. 2011; Kwan et al. 2012; Colborn et al. 2013) and can be easily calculated using a tool available on the CalSurv Gateway. The vector index values generated by the CalSurv Gateway are multiplied by 1000, other publications have not made this adjustment (Gujral et al. 2007; Jones et al. 2011), have multiplied by 10 (Bolling et al. 2009), or presented vector index as a squared root (Kilpatrick and Pape 2013). Therefore, the literature has examples of vector index values that are reported with orders of magnitude of difference, despite representing the same index. Defining a critical vector index threshold for performing an aerial adulticide operation over urban areas, in order to mitigate WNV infection risk, is not simple and may vary from area to area. One study conducted in Colorado (Kilpatrick and Pape 2013) found that at least one human case occurred in the week after the vector index was above 562.5 (vector index values were transformed from published values for comparison to values calculated by Gateway), but few cases occurred when vector index was <562.5. This study also found that epidemic conditions (approximately four cases per week) occurred when vector index values were >1000. Because this study was not performed in Sacramento and Yolo counties, we do not know if the risk levels are the same. However, a vector index >500 is generally considered ‘elevated’ and any increasing trends in vector index are monitored. To calculate vector index in the Gateway, it is first necessary to define a polygon comprising all surveillance locations of interest. Definition of a polygon should be contingent upon the area of interest and the scale of surveillance effort. Where a more robust surveillance program may support smaller polygons, less densely sampled areas require larger polygons. For the purpose of urban aerial adulticide applications polygons were constrained by the capacity limitations of the aircraft used to apply aerial treatments, or spray block. Additionally, weekly trapping occurred both within and outside the spray blocks to delineate the areas of WNV activity. Another important consideration for calculating vector index is the time scale used for evaluation. Bolling et al. (2009) found that vector index was strongly associated with weekly numbers of WNV human cases 1-2 weeks prior to disease onset. Kilpatrick and Pape (2013) found that both the statewide weekly estimates and the local two week estimates were significantly correlated with WNV human cases 1 – 3 weeks prior to onset of symptoms. These data indicated that effective time scales for analysis are probably windows of 1 – 2 weeks. Because SYMVCD has a robust weekly surveillance program used to monitor mosquito populations, WNV activity, and control efforts, seven-day intervals were used for calculating the vector index to most accurately capture the current state of WNV risk for decision support of urban aerial adulticiding.
DISCUSSION
At SYMVCD the use of ULV aerial adulticide over urban areas is a component of an integrated vector management program and is never the first measure taken in attempt to control WNV activity. Elevated trap counts, WNV-positive mosquito pools, and
WNV-positive dead birds are always responded to first with ground operations including: source reduction, larviciding, and ground ULV. When an area of elevated WNV activity is detected, a polygon defining the area is created and the vector index calculated. Ground operations are conducted and followed by surveillance both within and outside of the defined polygon. Depending on the outcome of the ground operations and the findings of surveillance, polygons may require editing in order to best delineate the area of elevated WNV activity. These data are then used to assess the outcome of ground operations where vector index numbers trending downward and <500 indicate effective control and vector index numbers trending upward and >500 trigger consideration of an aerial ULV application. The decision to conduct aerial adulticide operations over urban areas has often been met with scrutiny, requiring that the decision be supported by robust mosquito surveillance both inside and outside of potential spray zones. These surveillance efforts allow for the creation of targeted spray blocks, calculation of accurate vector index numbers, and thus a better assessment of human risk. In summation, at SYMVCD elevated abundance and increasing vector index values are always first addressed with ground operations. However, when ground operations do not result in a sufficient reduction in vector index numbers and the index steadily trends upward toward or above 500, aerial ULV operations are considered in order to best interrupt WNV transmission and protect human health.
Volume 85 Proceedings and Papers of the Mosquito and Vector Control Association of California 71
2017
REFERENCES
Biggerstaff BJ. 2008. Confidence Intervals for the difference of two proportions estimated from pooled samples. J Agric Biol Environ Stat 13:478–496.
Bolling BG, CM Barker , CG Moore , WJ Pape, L Eisen. 2009. Seasonal patterns for entomological measures of risk for exposure to Culex vectors and West Nile virus in relation to human disease cases in northeastern Colorado. J Med Entomol 46:1519–1531.
Colborn JM, KA Smith , J Townsend, D Damian, RS Nasci, JP Mutebi. 2013 West Nile Virus outbreak in Phoenix, Arizona, 2010: entomological observations and epidemiological correlations. J Am Mosq Control Assoc 29:123–132.
Gujral IB, Zielinski-Gutierrez EC, LeBailly A, Nasci R .2007. Behavioral risks for West Nile virus disease, northern Colorado, 2003. Emerg Infect Dis 13:419–425.
Gu W, TR Unnasch, CR Katholi, R Lampman, RJ Novak. 2008. Fundamental issues in mosquito surveillance for arboviral transmission. Trans R Soc Trop Med Hyg 102:817–822.
Jones RC, Weaver KN, Smith S, C Blanco, C Flores, K Gibbs, D Markowski, JP Mutebi. 2011. Use of the vector index and geographic information system to prospectively inform West Nile virus interventions. J Am Mosq Control Assoc 27:315–319.
Kilpatrick AM, WJ Pape.2013. Predicting human West Nile virus infections with mosquito surveillance data. Am J Epidemiol 178:829–835.
Kwan JL, BK Park, TE Carpenter, V Ngo, R Civen, WK Reisen. 2012. Comparison of enzootic risk measures for predicting West Nile disease, Los Angeles, California, USA, 2004–2010. Emerg Inf Dis 18:1298-1306.
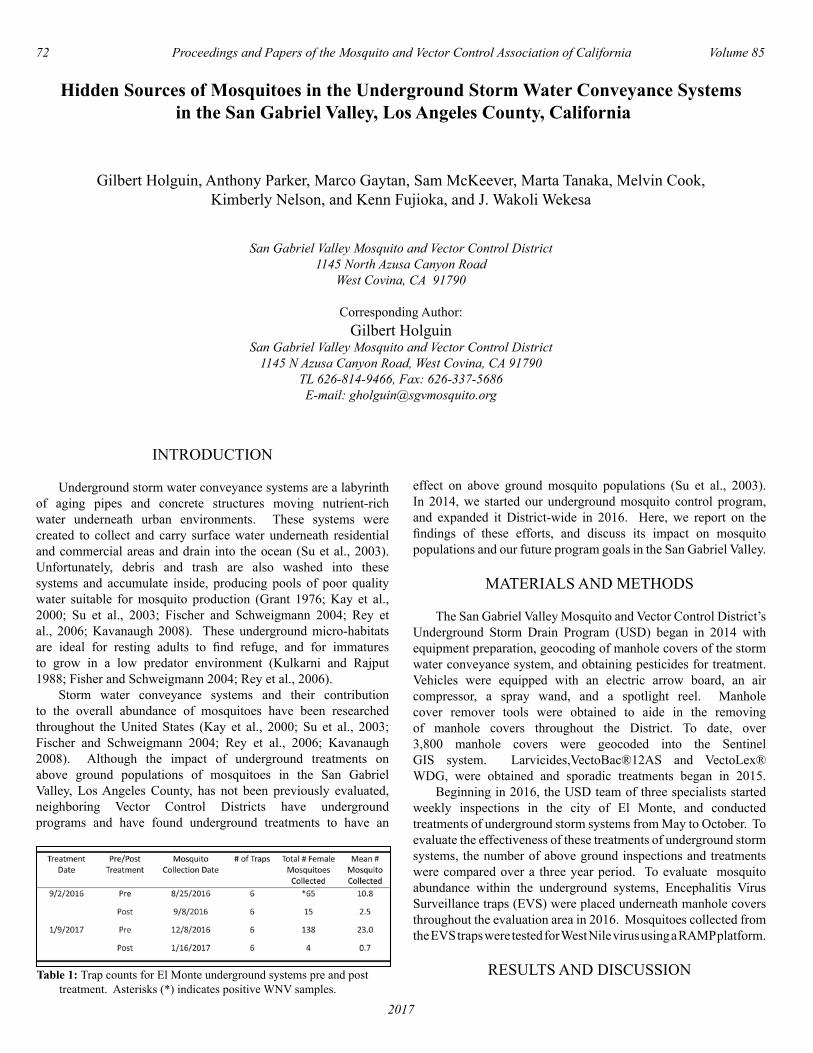
72 Proceedings and Papers of the Mosquito and Vector Control Association of California Volume 85
2017
Hidden Sources of Mosquitoes in the Underground Storm Water Conveyance Systems in the San Gabriel Valley, Los Angeles County, California
Gilbert Holguin, Anthony Parker, Marco Gaytan, Sam McKeever, Marta Tanaka, Melvin Cook,
Kimberly Nelson, and Kenn Fujioka, and J. Wakoli Wekesa
San Gabriel Valley Mosquito and Vector Control District1145 North Azusa Canyon Road
West Covina, CA 91790
Corresponding Author:Gilbert Holguin
San Gabriel Valley Mosquito and Vector Control District1145 N Azusa Canyon Road, West Covina, CA 91790
TL 626-814-9466, Fax: 626-337-5686E-mail: [email protected]
INTRODUCTION
Underground storm water conveyance systems are a labyrinth of aging pipes and concrete structures moving nutrient-rich water underneath urban environments. These systems were created to collect and carry surface water underneath residential and commercial areas and drain into the ocean (Su et al., 2003). Unfortunately, debris and trash are also washed into these systems and accumulate inside, producing pools of poor quality water suitable for mosquito production (Grant 1976; Kay et al., 2000; Su et al., 2003; Fischer and Schweigmann 2004; Rey et al., 2006; Kavanaugh 2008). These underground micro-habitats are ideal for resting adults to find refuge, and for immatures to grow in a low predator environment (Kulkarni and Rajput 1988; Fisher and Schweigmann 2004; Rey et al., 2006). Storm water conveyance systems and their contribution to the overall abundance of mosquitoes have been researched throughout the United States (Kay et al., 2000; Su et al., 2003; Fischer and Schweigmann 2004; Rey et al., 2006; Kavanaugh 2008). Although the impact of underground treatments on above ground populations of mosquitoes in the San Gabriel Valley, Los Angeles County, has not been previously evaluated, neighboring Vector Control Districts have underground programs and have found underground treatments to have an
effect on above ground mosquito populations (Su et al., 2003). In 2014, we started our underground mosquito control program, and expanded it District-wide in 2016. Here, we report on the findings of these efforts, and discuss its impact on mosquito populations and our future program goals in the San Gabriel Valley.
MATERIALS AND METHODS
The San Gabriel Valley Mosquito and Vector Control District’s Underground Storm Drain Program (USD) began in 2014 with equipment preparation, geocoding of manhole covers of the storm water conveyance system, and obtaining pesticides for treatment. Vehicles were equipped with an electric arrow board, an air compressor, a spray wand, and a spotlight reel. Manhole cover remover tools were obtained to aide in the removing of manhole covers throughout the District. To date, over 3,800 manhole covers were geocoded into the Sentinel GIS system. Larvicides,VectoBac®12AS and VectoLex® WDG, were obtained and sporadic treatments began in 2015. Beginning in 2016, the USD team of three specialists started weekly inspections in the city of El Monte, and conducted treatments of underground storm systems from May to October. To evaluate the effectiveness of these treatments of underground storm systems, the number of above ground inspections and treatments were compared over a three year period. To evaluate mosquito abundance within the underground systems, Encephalitis Virus Surveillance traps (EVS) were placed underneath manhole covers throughout the evaluation area in 2016. Mosquitoes collected from the EVS traps were tested for West Nile virus using a RAMP platform.
RESULTS AND DISCUSSIONTable 1: Trap counts for El Monte underground systems pre and post treatment. Asterisks (*) indicates positive WNV samples.
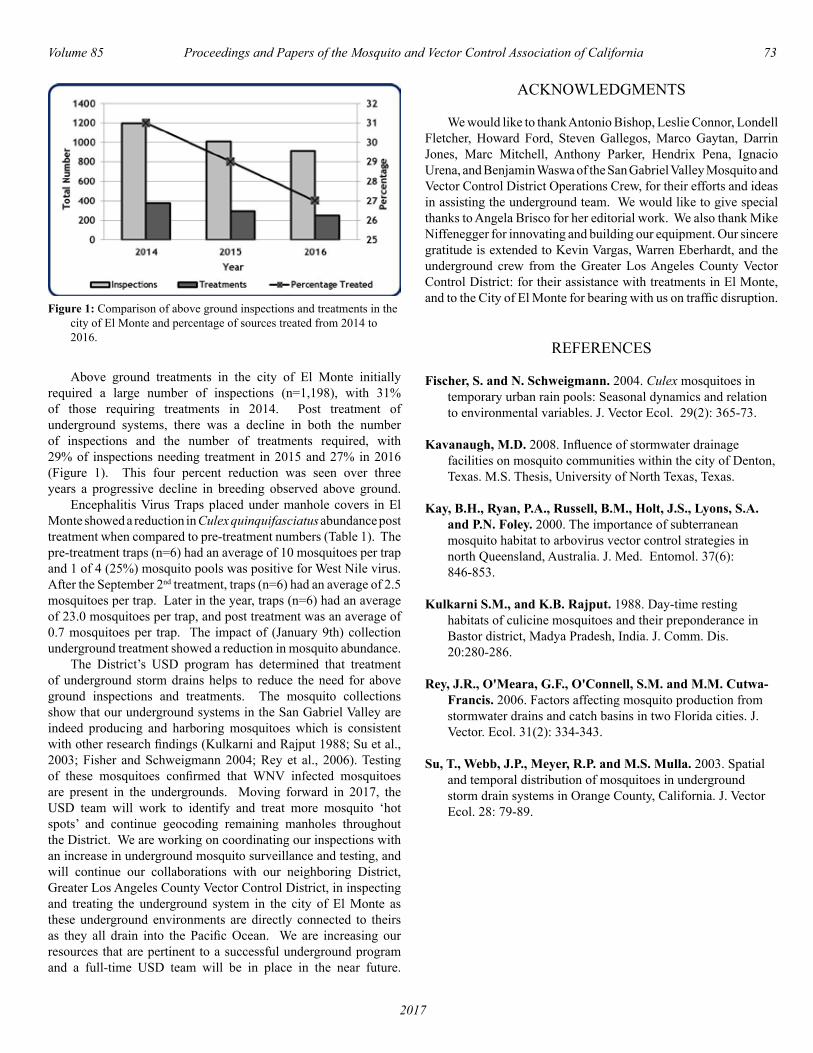
Volume 85 Proceedings and Papers of the Mosquito and Vector Control Association of California 73
2017
Above ground treatments in the city of El Monte initially required a large number of inspections (n=1,198), with 31% of those requiring treatments in 2014. Post treatment of underground systems, there was a decline in both the number of inspections and the number of treatments required, with 29% of inspections needing treatment in 2015 and 27% in 2016 (Figure 1). This four percent reduction was seen over three years a progressive decline in breeding observed above ground. Encephalitis Virus Traps placed under manhole covers in El Monte showed a reduction in Culex quinquifasciatus abundance post treatment when compared to pre-treatment numbers (Table 1). The pre-treatment traps (n=6) had an average of 10 mosquitoes per trap and 1 of 4 (25%) mosquito pools was positive for West Nile virus. After the September 2nd treatment, traps (n=6) had an average of 2.5 mosquitoes per trap. Later in the year, traps (n=6) had an average of 23.0 mosquitoes per trap, and post treatment was an average of 0.7 mosquitoes per trap. The impact of (January 9th) collection underground treatment showed a reduction in mosquito abundance. The District’s USD program has determined that treatment of underground storm drains helps to reduce the need for above ground inspections and treatments. The mosquito collections show that our underground systems in the San Gabriel Valley are indeed producing and harboring mosquitoes which is consistent with other research findings (Kulkarni and Rajput 1988; Su et al., 2003; Fisher and Schweigmann 2004; Rey et al., 2006). Testing of these mosquitoes confirmed that WNV infected mosquitoes are present in the undergrounds. Moving forward in 2017, the USD team will work to identify and treat more mosquito ‘hot spots’ and continue geocoding remaining manholes throughout the District. We are working on coordinating our inspections with an increase in underground mosquito surveillance and testing, and will continue our collaborations with our neighboring District, Greater Los Angeles County Vector Control District, in inspecting and treating the underground system in the city of El Monte as these underground environments are directly connected to theirs as they all drain into the Pacific Ocean. We are increasing our resources that are pertinent to a successful underground program and a full-time USD team will be in place in the near future.
ACKNOWLEDGMENTS
We would like to thank Antonio Bishop, Leslie Connor, Londell Fletcher, Howard Ford, Steven Gallegos, Marco Gaytan, Darrin Jones, Marc Mitchell, Anthony Parker, Hendrix Pena, Ignacio Urena, and Benjamin Waswa of the San Gabriel Valley Mosquito and Vector Control District Operations Crew, for their efforts and ideas in assisting the underground team. We would like to give special thanks to Angela Brisco for her editorial work. We also thank Mike Niffenegger for innovating and building our equipment. Our sincere gratitude is extended to Kevin Vargas, Warren Eberhardt, and the underground crew from the Greater Los Angeles County Vector Control District: for their assistance with treatments in El Monte, and to the City of El Monte for bearing with us on traffic disruption.
REFERENCES
Fischer, S. and N. Schweigmann. 2004. Culex mosquitoes in temporary urban rain pools: Seasonal dynamics and relation to environmental variables. J. Vector Ecol. 29(2): 365-73.
Kavanaugh, M.D. 2008. Influence of stormwater drainage facilities on mosquito communities within the city of Denton, Texas. M.S. Thesis, University of North Texas, Texas.
Kay, B.H., Ryan, P.A., Russell, B.M., Holt, J.S., Lyons, S.A. and P.N. Foley. 2000. The importance of subterranean mosquito habitat to arbovirus vector control strategies in north Queensland, Australia. J. Med. Entomol. 37(6): 846-853.
Kulkarni S.M., and K.B. Rajput. 1988. Day-time resting habitats of culicine mosquitoes and their preponderance in Bastor district, Madya Pradesh, India. J. Comm. Dis. 20:280-286.
Rey, J.R., O'Meara, G.F., O'Connell, S.M. and M.M. Cutwa- Francis. 2006. Factors affecting mosquito production from stormwater drains and catch basins in two Florida cities. J. Vector. Ecol. 31(2): 334-343.
Su, T., Webb, J.P., Meyer, R.P. and M.S. Mulla. 2003. Spatial and temporal distribution of mosquitoes in underground storm drain systems in Orange County, California. J. Vector Ecol. 28: 79-89.
Figure 1: Comparison of above ground inspections and treatments in the city of El Monte and percentage of sources treated from 2014 to 2016.

74 Proceedings and Papers of the Mosquito and Vector Control Association of California Volume 85
2017
What Lies Beneath: A Practical Approach to Mosquito Suppression in Underground Storm Drains
Kevin Vargas and Mark A. Daniel
Greater Los Angeles County Vector Control District , 12545 Florence Ave., Santa Fe Springs, CA 90670
Our paper outlines the Underground Storm Drain (USD) program at the Greater Los Angeles County Vector Control District . Our USD program was established to address the breeding of Culex qinquefaciatus in the extensive underground storm drain systems in Los Angeles county. Recently, Aedes aegypti have been found in small numbers in the underground systems in the City of Commerce and present a different challenge for our program.

Volume 85 Proceedings and Papers of the Mosquito and Vector Control Association of California 75
2017
Mandated Trash Capture Devices: Impeding Trash Without Impeding Mosquito Abatement
Joseph Huston, Ryan Clausnitzer, Erika Castillo, Robert Ferdan
Alameda County Mosquito Abatement District, 23187 Connecticut Street, Hayward, CA [email protected]
The installation of trash capture devices (TCD) into catch basins (CB) was mandated and implemented by the San Francisco Bay Regional Water Quality Board (SFBRWQB) for San Francisco Bay Area Counties. CB may hold water throughout the year, and if left untreated, are intense breeding sources for mosquitoes that can transmit arboviruses to humans. The SFBRWQB had approved several TCD that complied with their mandate. However, impacts of the TCD design on mosquito control activities were not considered during the review and approval process. Therefore, after noticing these devices in the field, Alameda County Mosquito Abatement District (ACMAD) staff reviewed the diagrams and specifications of TCD that were approved by the SFBRWQCB, and identified TCD that would pose the least impediments to mosquito control activities. To convey the importance of TCD design on mosquito control, we prepared a simple flyer that described the ACMAD mission to protect public health through effective mosquito control, and indicated which of the SFBRWQB-approved TCD permitted inspection and treatment of CB, those that would require more research, and TCD that were unacceptable in terms of mosquito abatement activities. This flyer was disseminated by the Bay Area Storm-water Management Agencies Association (BASMAA) to their member cities in the San Francisco Bay Area. We also participated in a BASMAA meeting that was attended by city representatives to discuss our concerns with TCD. Following the meeting, Fremont, one of our largest cities, contacted ACMAD to discuss the TCD they had installed and were indicated on the flyer as unacceptable. Subsequently, a TCD manufacturer contacted ACMAD regarding one of their TCD indicated as unacceptable. In both cases modifications were made to the TCD that permitted mosquito abatement activities. These interactions have helped reinforce our relationships and partnerships with local cities and agencies in our region, and have helped put mosquito control in the mind of government officials and contractors when devising and implementing storm water regulations.
76 Proceedings and Papers of the Mosquito and Vector Control Association of California Volume 85
2017
Mosquito Control Challenges at the Largest Waste Water TreatmentFacility west of the Mississippi – Hyperion Treatment Plant
Mark Brooks
Field Operations Manager, LA County West VectorControl District, 6750 Centinela Ave, Culver City, CA 90230.
ABSTRACT: Hyperion Treatment Plant is a 125 year-old Public Works Facility, processing over 340 million gallons of wastewater daily, servicing 4 million customers, and located on a 144 acre site in El Segundo, California. This talk describes Hyperion’s unique mosquito breeding sources (from large obsolete offline units built in the 1950’s to present day massive filtration units and miles of underground piping running the length and breadth of the property) where we investigated and created an effective mosquito trapping and pesticide application program.
Volume 85 Proceedings and Papers of the Mosquito and Vector Control Association of California 77
2017
The Effect of a Robust Abatement Policy on Efforts to Control Mosquitoesin the San Gabriel Valley, Los Angeles County, California
Marta Tanaka, Marco Gaytan, Darrin Jones, Hendricks Pena, Gilbert Holguin, Antonio Bishop,Melvin Cook, Kimberly Nelson, and J. Wakoli Wekesa.
San Gabriel Valley Mosquito and Vector Control District, 1145 N. Azusa Canyon Rd., West Covina, CA 91790
CORRESPONDING AUTHOR:
Marta TanakaSan Gabriel Valley Mosquito and Vector Control District, 1145 N. Azusa Canyon Rd., West Covina, CA 91790
Tel: 626-814-9466; Fax: 626-337-5686; [email protected]
At the San Gabriel Valley Mosquito and Vector Control District (District) we have used a number of methods to help motivate residents into taking responsibility of reducing mosquito breeding on their property, especially neglected swimming pools by restoring them to operable or functional state. In 2015, the District developed a robust abatement policy whose process promulgated the Health and Safety Code requiring residents to be compliant, and the non-compliant be processed through legal abatement procedures to comply . The program which was approved by the Board of Trustees and became operational in 2016 created an Abatement Hearing Committee of the board under which all non-compliant residents were referred to by staff. Of the 3,700 large mosquito breeding sites monitored by the district staff, 1,484 were neglected swimming pools. In addition to large bodies of water such as flood control channels and underground water conveyance systems, neglected swimming pools seem to form the bulk of the mosquito breeding sources monitored by district staff. Use of the abatement process focused the District on gaining compliance and educating residents that the responsibility of controlling mosquitoes is on the home owner, thus gaining long-term or permanent solutions instead of short fixes. To gain compliance, the initial step was for the “vector control technician” to issue a formal letter requesting homeowners’ cooperation to resolve the violation. If access was denied, a formal letter requesting access was mailed. Failure to granting access, an inspection warrant was sought and eventually executed on the property. The process thereafter required issuing of notice of correction, notice of violation and/or notice of public nuisance. Once the notice of public nuisance had been issued, the out of compliance resident was given a specific amount of time to correct the problem or appear at the next scheduled Abatement Hearing meeting. Properties chosen to receive abatement notices were carefully selected based on several sets of criteria, including the length of time the nuisance had existed, and lack of cooperation from the resident. In 2016, 33 formal letters requesting access were sent and 11 inspection warrants obtained to gain entry to properties where previous access was denied. Overall abatement effort included
37 notice of corrections, 30 notices of violation and 13 notices of public nuisance. A total of 15 previously neglected pools were returned to full operation. The impact of this abatement process was realized at the initial stage of work by field staff where residents resolved the issue expeditiously and thoroughly knowing the cost of non-compliance explicitly outlined in the program. Using the legal abatement process to control breeding sources and mosquitoes in the community has reduced the number of swimming pools monitored by district staff allowing them to focus on other breeding sites within the district. Consequently, this has reduced the impact of mosquitoes, and the potential risk for mosquito-borne disease. We look forward to further refining our abatement policy and procedures; we anticipate problematic residents will be more inclined to allow for inspections on their properties further reducing mosquito breeding.
ACKNOWLEDGEMENTS:
We would like to thank the San Gabriel Valley Mosquito and Vector Control Board of Trustees and Abatement Hearing Committee for their support throughout this process; and Jenkins and Hogin, LLP, our District Counsel for legal review and direction. We would like to give special thanks to Angela Brisco for her editorial work; San Gabriel Valley Clerk to the Board, Esther Elliott, and Operation Assistant, Michael Rhambo for their hard work getting documents completed and mailed. We also, would like to thank the field staff Leslie Conner, Steven Gallegos, Marc Mitchell, Hendricks Peña, Ignacio Ureña, Benjamin Waswa for working hard to ensure the success of this abatement process. Last, we thank the Extra Help Technicians Anthony Parker, Londell Fletcher and Howard Ford for keeping up the zone work to allow the rest of the crew to focus on getting this process right.
78 Proceedings and Papers of the Mosquito and Vector Control Association of California Volume 85
2017
Lysinibacillus sphaericus resistance in Culex pipiens in Salt Lake City, UT
Tianyun Su1, Greg White2, Ary Faraji2, Jennifer Thieme1, Taylor Lura1 and Min Lee Cheng1
1West Valley MVCD, 1295 E. Locust St., Ontario, CA 91761. 2Salt Lake City MAD, 2020 N Redwood Rd, Salt Lake City, UT 84116.
Bacillus sphaericus Neide, recently renamed as LysiniBacillus sphaericus Meyer and Neide, is a spore-forming bacterium that possesses various levels of larvicidal activity against some mosquito species. Products based on most active strains such as 2362, 2297, 1593, C3-41 that bare binary toxins have been developed to combat mosquito larvae worldwide. Resistance in field Culex mosquito populations has been reported since 1994 from France, Brazil, India, China, Tunisia and USA. Laboratory studies to evaluate resistance development risk have been conducted by many groups of scientists. Management tactics to prevent resistance development and restoration of susceptibility to B. sphaericus have also been developed and implemented. The use of product based on B. sphaericus strain 2362 has increased considerably since invasion of West Nile virus. This report documents the second occurrence of high levels resistance to B. sphaericus in a natural population of Cx. pipiens in North America, where the resistance ratio was 12,988-25,975-fold at LC50 and 31,105-62,210-fold at LC90 as compared with susceptible laboratory and field populations. Resistance management and susceptibility monitoring strategies are discussed.
Volume 85 Proceedings and Papers of the Mosquito and Vector Control Association of California 79
2017
Evaluation of Natular G30 and Artesian Wells
Scott Bradshaw
Tooele Valley Mosquito Abatement District1535 Sunset Rd, Lake Point UT 84074
The Tooele Valley Mosquito Abatement District located in Utah has an abundance of artesian wells. We evaluated the efficacy of Clarke Natular G30 on mosquito habitats created by artesian wells. Natular is in the IRAC Class 5 chemical, and contains the patented ingredient, spinosad. We wanted to study its residual effect on mosquitoes and non-target organisms. Data from this field trial supports that Natular G30 offers good control for Culex tarsalis mosquitoes at the desired sites. The results showed a significant decrease in larvae 24 hours after treatment. Site #1 maintained control for the duration of the 30-day trial period. During the trial, fish, damselflies, dragonflies, and mayflies were collected by dipping , indicating minimal non-target effects. Site #2 maintained control for approximately 21 days after which there was an increase in mosquito larvae. The possible explanation for the increase of larvae after 21 days could have been because only a one acre of the 5 acre site was treated.
80 Proceedings and Papers of the Mosquito and Vector Control Association of California Volume 85
2017
Culex erythrothorax: Temporal Pattern of Adult Activityand Resistance to Pesticides
Allen Esterly1, Dereje Alemayehu1, Cheryl Sebay2, Theresa Shelton2, Nayer Zahiri2, Eric Haas-Stapleton1
1 Alameda County Mosquito Abatement District23187 Connecticut Street, Hayward, CA 94545; 510.783.7744
2 San Mateo County Mosquito and Vector Control District, 1351 Rollins Road, Burlingame, CA 94010; 650.344.8592
Culex erythrothorax Dyar is a West Nile virus (WNV) vector produced in wetland habitats that contain bulrush and cattails. In the absence of effective mosquito control, Cx. erythrothorax can be extremely abundant. We quantified the temporal abundance of adult Cx. erythrothorax at 3 h intervals in a marsh bordering the San Francisco Bay of California (USA) over 3 days using a CO2- and light-baited collection bottle rotator trap. Mosquito abundance was highest during the first 3 h after sunset (>5000 mosquitoes per trap night) and declined in a linear fashion during the subsequent 21 h. By comparison, the abundance of Culex tarsalis Coq., another important WNV vector species that also exploits wetland habitats, peaked 3 – 6 h after sunset (>80 mosquitoes per trap night) and then declined over the following 18 h. Although the susceptibility of Cx. tarsalis to a wide range of insecticides has been well studied, less is known of Cx. erythrothorax. Adult Cx. erythrothorax were collected using CO2-baited suction traps and tested for insecticide resistance using the CDC bottle bioassay. Our results showed Cx. erythrothorax were more sensitive to permethrin and naled compared to a laboratory-reared insecticide-sensitive strain of Culex pipiens (Cx. pipiensSEN; LC50 for Cx. erythrothorax and Cx. pipiensSEN were < 0.8 µg / bottle). Field-collected Cx. erythrothorax were also more sensitive to etofenprox than Cx. pipiensSEN, however, the quantity of insecticide required to elicit mortality was higher than what was needed for permethrin (LC50 for etofenprox was < 4 µg / bottle). In contrast, Cx. pipiensSEN were more sensitive to resmethrin relative to field-collected Cx. erythrothorax (LC50 for Cx. erythrothorax was < 0.6 µg / bottle). Inclusion of piperonyl butoxide (PBO) in the CDC bottle assay test containing 0.5 µg of permethrin reduced survivorship of Cx. erythrothorax by 8%. The results of this study demonstrated that Cx. erythrothorax in wetland habitats can be very abundant with peak adult flight activity occurring shortly after sunset. In laboratory trials, this species was highly susceptible to permethrin, resmethrin, naled and etofenprox. Quantifying the pesticide susceptibility of mosquito populations in ecologically sensitive habitats, such as wetlands, may provide the opportunity to establish a regional baseline for insecticide resistance in mosquitoes.

Volume 85 Proceedings and Papers of the Mosquito and Vector Control Association of California 81
2017
Adulticides Etofenprox and Pyrethrin: Laboratory and Field Investigations
Noor S. Tietze1, Glencijoy David1, Kayvon Solaimanpour2 and Nayer Zahiri1
1Santa Clara County Vector Control District, 1580 Berger Drive, San Jose, CA 951122The Harker School, 500 Saratoga Avenue, San Jose
ABSTRACT. During 2016, Santa Clara County Vector Control District (District) conducted laboratory and field tests, as well as operational efficacy assessments for two adulticides: etofenprox (Zenivex E4) and pyrethrin (Merus 2.0). Nine truck-mounted adulticiding operations were conducted by the District in 2016 including five using etofenprox and four with unsynergized pyrethrin. To assess and compare efficacy of the two products, laboratory bottle bioassays, field simulation tests and operational fogging assessments were conducted. Bottle bioassays included tests using susceptible laboratory colony Culex pipiens to establish the diagnostic dose for each material, as well as tests using field-collected Cx. pipiens for each material. Open field tests included replicated cage exposures of susceptible laboratory colony mosquitoes, field crickets and honey bees at three distances from the path of the fogging truck (25, 75, and 175 feet). Operational fogging events during 2016 included caged mosquito exposures using susceptible laboratory colony Cx. pipiens and one trial using field-collected Culex. Operational fogging assessments using caged mosquitoes were not significantly different (P>0.05) comparing etofenprox to pyrethrin. Bottle bioassays yielded higher acute toxicity of etofenprox to Cx. pipiens with a diagnostic dose of 1 µg/bottle, whereas that of pyrethrin was 10 µg/bottle. Using field-collected Culex, the pyrethrin bottle bioassays exhibited 13% recovery likely due to knock down resistance (KDR) gene mutations. KDR investigations were conducted via real time-PCR using our laboratory colony and wild Cx. pipiens collected from urban and agricultural zones. These results confirmed that the laboratory colony was 100% susceptible, whereas urban and agricultural mosquito samples contained KDR mutated and some fully resistant individual mosquitoes. The PCR results confirmed bottle bioassay and field trial results of lowered efficacy of wild-caught mosquitoes using pyrethrins and to a lesser degree, etofenprox.
INTRODUCTION
Since the first detection of West Nile Virus (WNV) in Santa Clara County in late June of 2004, the District has provided suppression of infected adult mosquitoes in targeted WNV foci in urban and suburban areas (Tietze et al. 2008). From 2005 to 2012, detection of infected adult mosquitoes triggered adulticide treatments of synergized (piperonyl butoxide) pyrethrin (Pyrenone 25-5 Public Health Insecticide). Then, from 2012 to 2016, the District opted for using a “third generation” pyrethroid, etofenprox (Zenivex E4) that is not synergized and had beneficial properties believed to reduce nontarget impacts. During a Santa Clara County Board of Supervisors meeting in 2015, there was a request for the Vector Control District to evaluate alternative mosquito adulticides for consideration in our urban fogging program. The “organic productions” or OMRI labeled, Merus 2.0 was selected as a candidate to be investigated and compared to Zenivex E4 for use in our truck-mounted fogging operations. To compare the two products, we conducted (1) laboratory bottle bioassays using colony and field-derived Culex pipiens (2) field efficacy tests and (3) nontarget assessments in simulated field tests. Product efficacy was also compared using caged mosquitoes deployed during operational fogging events. In addition, to assess the presence of then knockdown resistance (KDR) gene in local mosquito populations, an internship program was formed between The Harker School and the District. The intern assessed the presence of KDR mutation in Cx. pipiens samples and compared frequencies among urban and agricultural zones.
MATERIALS AND METHODS
A series of laboratory and field tests were used to compare the toxicity and efficacy of Merus and Zenivex products. Before conducting bottle bioassays, “range-finding” tests were needed to establish the diagnostic doses to be used as per CDC guidelines (Brogdon and Chan, 2010). Bottle bioassays were then conducted and followed by simulated field trials and determination of KDR genetic makeup in local Cx. pipiens populations and the District colony. The District Cx pipiens colony (Santa Clara VCD Colony) was started in 2008 originating from egg rafts collected at 1580 Berger Drive, San Jose, California. Since then, the colony progressed through more than 100 generations and has been utilized in a variety of bioassay tests.
Range-finding Bioassay An initial wide range of pesticide exposures or ‘range-finding tests’ were conducted in the laboratory using the bottle bioassay technique on both laboratory-reared and field-collected Cx. pipiens. Ten to 20 mosquitoes were placed in 250 ml Wheaten bottles treated with pesticide as per the CDC guidelines.Initial range-finding tests were conducted for both Zenivex and Merus 2.0 using a single bottle per concentration. Merus 2.0 and Zenivex were formulated to create exposures of 1, 5, 10, 25 and 50 µg/bottle. Mosquito mortality was checked approximately every 15 or 30 minutes. Based on the CDC guidelines it was determined that thediagnostic dose for Zenivex was 1.0 µg/ bottle, while that of Merus 2.0 was 10 µg/bottle.

82 Proceedings and Papers of the Mosquito and Vector Control Association of California Volume 85
2017
Bottle Bioassay Tests Diagnostic doses were used to assess the degree of resistance expressed by laboratory colony and field-collected Cx. pipiens. Field collections of mosquitoes were made at the San Francisco Bird Observatory area (latitude 37.434464, longitude -121.928977) along Coyote Creek north of Highway 237 near Milpitas and tested that same day. Colony Cx. pipiens were collected from holding boxes containing recently eclosed adult mosquitoes (about 4 days post-eclosion). Bottles were coated with 10 µg/bottle Merus 2.0 (pyrethin 5%) or 1 µg/bottle Zenivex (etofenprox 4%). Results were graphed to display mortality over time for each product to compare colony and field results.
Simulated Field Tests A F150 pickup truck was mounted with a Guardian ULV sprayer (Adapco) and calibrated to produce Merus 2.0 droplets, where 50% were <30 microns and 90% were <50 microns at a flow rate of 2.0 fluid ounces per minute (based on 5 mile per hour vehicle speed). Rotating impingers using Teflon-coated glass slides were used to collect droplets for analyses that was performed using DropVision system on a Leica compound microscope fitted with Motec camera that was displayed and processed on a computer. The same truck and ULV sprayer were used to apply Zenivex E4, but were calibrated at a flow rate of 4.5 fluid ounces per minute . Open field tests were conducted at Columbus Park, San Jose, located south of the Norman Mineta International Airport that was found to have a consistent northerly wind during evenings and
a dirt road running perpendicular to the wind direction to allow for the path of the spray truck. Trials were performed during the evening just before sunset. To assess the adulticides we hung caged mosquitoes, crickets (purchased at Petsmart) and honey bees obtained from local beehives in San Jose, California. Mosquitoes were obtained from the District Cx. pipiens colony and about 25 were placed in each cage. The cages were fabricated from six inch diameter PVC pipe cut in 2 inch sections with the open sides covered with window screen. Metal window screen was used due to the cricket’s ability to chew through nylon. Ten adult crickets were placed in each cage. Honey bees were obtained from local hives the same afternoon of each trial and immediately provisioned 50% sugar water solution on dental wicks inside the cages. Five honey bees were placed in each cage. The nontarget organisms and mosquitoes were placed at distances of 25, 75 and 175 feet from the path of the fogging truck. Rotating impingers were also placed at each distance. At each distance, cages and impingers were hung and fastened, respectively, on PVC stanchions held vertically using rebar that was pounded into the ground. Wind speed and direction was closely monitored before each trial to ensure conditions met pesticide label standards. Cages were retrieved after about
30 minutes post application, placed in separate holding boxes and transported back to the laboratory for assessment. This was replicated three times for each of the two materials tested.
Operational Fogging Assessments During each community-wide fogging event, three cages of mosquitoes were hung inside the fogging zone and three outside fogging zone. This was done nine times during the 2016 summer season. About 25 mosquitoes were aspirated into each cage using susceptible laboratory colony Cx. pipiens. Each cage was provisioned with raisons for nourishment. The cages were hung in the evening of the fogging event and retrieved on the following morning.
Knockdown Resistance Gene Investigation To determine the prevalence of the KDR gene, adult female Cx. pipiens were collected using carbon dioxide baited EVS traps from three locations: (1) an urban/suburban site called the Golden Wheel Mobile Home Park at 900 Golden Wheel Park Drive, San Jose, (2) an agricultural site in Gilroy (latitude
Figure 1 Bottle bioassay results for Merus 2.0 using field and laboratory mosquitoes
Table 1 Bottle bioassay range-finding test results for laboratory and field- collected Cx. pipiens exposed to 5 concentrations of Merus
Figure 2 Bottle bioassay results for Zenivex E4 using field and laboratory mosquitoes

Volume 85 Proceedings and Papers of the Mosquito and Vector Control Association of California 83
2017
36.984411, longitude -121.530174) and (3) the Santa Clara VCD mosquito colony. Fifty adult female Cx. pipiens were collected from each area and individually preserved at -80ºC. Mosquitoes were transferred individually into Omni 2mL Tough Microtubes with 2.8mm ceramic beads. 500 µL of Lysis/Binding Solution was added to each tube. The samples were homogenized in an Omni Bead Ruptor 24, set to run for 30 sec. The samples were centrifuged at 12,000 rpm for four minutes. Next, the Magmax™ (ThermoFisher Scientific) microplate was prepared and run using extraction protocol AM1836_v2.The extracted samples were then transferred to a separate microplate for storage at -80ºC. Polymerase chain reaction tests were made to detect the presence of the KDR mutation (L1014F) using a protocol similar to Chen et al. (2010). Two primers were used to amplify the sodium channel cDNA fragments: Primer F (5’ GTGTCCTGCATTCCGTTCTT 3’) and Primer R (5’ TTCGTTCCCACCTTTTCTTG 3’). The two probes used in addition were Probe L1014F (5’ FAM - CACGACAAAATTTC - MGB 3’) and Probe Wildtype (5’ VIC - CTCACGACTAAATTTC - MGB 3’). The plate with the DNA solution was placed in the PCR and was heated to 50ºC
for two minutes, then 95ºC for ten minutes, followed by 40 cycles of PCR reaction (95ºC for 10s and 60ºC for 60s). When analyzing the results, CT Values under 35 were considered to be representative of appropriate amplifications of cDNA.
RESULTS AND DISCUSSION
Initial rangefinding tests (Table 1) established diagnostic doses of 10.0 ug/bottle for Merus 2.0 and 1.0 ug/bottle for Zenivex E4. Laboratory bottle bioassay tests were conducted using those diagnostic doses. As observed during the bottle bioassay tests, 13% of field-collected mosquitoes recovered after 40 min exposure while lab specimens exposed to Merus did not recover (Figure 1). This suggested the existence of knockdown resistance (KDR) in field-mosquito populations, but not in the lab colony.Zenivex demonstrated a ten-fold greater acute toxicity than
Merus and no recovery in field or laboratory specimens. Compared to the colony mosquitoes, there initially was slightly lower mortality for field-collected mosquitoes (Figure 2). Open field studies using Merus 2.0 and Zenivex E4 both yielded positive results based on replicated Merus trials and one Zenivex trial (Table 2). These tests evaluated product efficacy for adult caged susceptible colony mosquitoes and effect on nontarget organisms: honey bees and crickets. Open field tests using Merus 2.0 yielded 85 to 96% mortality in caged mosquito exposures and Zenivex had equally good results of 84 to 100% mortality. Honey bees had high control group mortality (22.9% after one hour) and during one trial, did not survive 24 hours post testing held inside cages even when provisioned with sugar water solution. Caged honey bees directly sprayed by ULV Merus had lower observed mortality when compared to that of Zenivex, but all bees deployed within 75ft of the fogging truck died within 24 hrs of exposure. Crickets, on the other hand, exhibited lower mortalities when treated with Zenivex compared to Merus at distances beyond 75ft of the fogging truck (Table 2) . Droplet analyses for Merus 2.0 showed only very slight decreases in droplet size with distance indicating a good homogeneous drift pattern (Table 3). Droplet density was also found to be consistent among distances. Compared to Zenivex E4, droplet Dv0.5 of Merus was smaller by about 9-10 µm (Table 4). Since the same ULV equipment was used to apply both
Table 2. Averaged mortality of mosquitoes, honey bees, and crickets by distance and post-treatment time interval for Merus 2.0 and Zenivex E4
Figure 3 Mosquito adulticide efficacy based on caged susceptible colony Cx. pipiens for Zenivex and Merus applications
Table 3. Merus 2.0 field trial droplet analysis per replicate and distance sampled

84 Proceedings and Papers of the Mosquito and Vector Control Association of California Volume 85
2017
adulticides, the change in droplet size may be attributed to different physical characteristics of the materials (density and viscosity) or perhaps differing flow rates (2.0 ml/min versus 4.5 ml/min) .
Operational Field Results During 2016, the District conducted nine community-wide (~3 mi2 each) fogging operations: the first five used Zenivex followed by four using Merus 2.0. Replicated caged mosquito exposures to fogging with Zenivex resulted in an average of 65% mortality (+26.4%), whereas Merus 2.0 resulted in 83% mortality (+9.7%) (Figure 3). It must be noted that the results of these operational assessments were at the vagary of wind direction that made it difficult to predict which side of the street to place the cages and whether they would be downwind of the fogging truck during the time of fogging (11:00 pm to 2:00 am). The measured mortality in caged mosquitoes was compared using two sample t-test (Systat) between the two adulticides and was found to be not significantly (P>0.05) different .
Internship Project Results A student intern project conducted collaboratively with our District and San Mateo MVCD in July 2016 analyzed the presence of the KDR gene based on Cx. pipiens collections from (1) Santa Clara County residential and (2) agricultural zones and (3) our Cx. pipiens mosquito colony. Fifty mosquitoes were individually extracted and tested using PCR for presence/absence of “KDR-mutated” and “wildtype” sequences on the same gene. Presence of
Figure 4. Polymerase chain reaction results for Cx. pipiens collected from wild populations and tested for presence KDR mutated genes
Table 4. Zenivex field trial droplet analysis per replicate and distance sampled
both KDR mutated and wildtype sequences in the same mosquito indicated the expression of resistance as a heterozygous condition (Rr). Presence of “Wildtype” without “KDR-mutated” indicated susceptibility (rr) and presence of KDR-Mutated without Wildtype indicated the presence of homozygous resistance expression (RR). The laboratory colony was found to be completely susceptible, the agricultural zone mosquitoes were largely predisposed for KDR expression (homozygous resistant), and the residential zone mosquitoes was a mixture of all three categories including a small percentage (4%) expressing homozygous resistance (Figure. 4). This supported the bottle bioassay test results where laboratory colony mosquitoes did not recover from Merus 2.0, whereas field-collected mosquitoes did recover to a certain degree (13%) Comparable published studies on KDR resistance of Cx. pipiens in the San Francisco Bay Area are lacking. One study in Marin County (McAbee et al. 2004) investigated Culex pipiens var molestus tolerance to pyrethroids, resmethrin and pyrethrum measuring resistance ratios of 18.3x and 3.3x, respectively. In that case, the subspecies’ preferred underground habitat may have increased selection pressure causing pesticide resistance or tolerance to develop. The current study was based on above-ground collection sites and thus different mosquito subspecies, habitat types and consequent selection pressures. In addition to District adulticide operations, pyrethroids are applied by private pest control services and homeowners throughout the urban and suburban zones and by farmers in the agricultural zones of the county. Those applications contribute to potential development of pyrethrin/pyrethroid tolerance and resistance in local populations of mosquitoes. The relatively limited dispersal capability of Cx pipiens (Service 1993) can play an important role in their capacity to develop resistance, but that is tempered by ubiquitous populations found throughout the region that reintroduce susceptible genome into local gene pools.
CONCLUSIONS
Upon review of these results, it was decided to continue using both products (Merus and Zenivex), but to closely monitor for resistance to detect whether there is further loss of efficacy due to mosquito recovery from KDR resistance or enzyme based resistance. Mosquitoes exposed to Zenivex E4 were not found to exhibit phenotypic KDR resistance (i.e., they did not recover) and were ten-fold more susceptible compared to Merus 2.0. Our plan for 2017 is to split our treatments between the two materials during each fogging event for comparison. Also mosquitoes trapped for West Nile virus testing will be routinely sampled for KDR testing by removing a leg. Further replicated KDR and enzyme-based resistance testing across the county will provide crucial information in our ongoing Response Plan and Integrated Pest Management Plan.
Volume 85 Proceedings and Papers of the Mosquito and Vector Control Association of California 85
2017
REFERENCES CITED
Brogdon, WG and A. Chan, 2010. Guideline for Evaluating Insecticide Resistance in Vectors Using the CDC Bottle Bioassay https://www.cdc.gov/malaria/resources/pdf/fsp/ir_manual/ir_cdc_bioassay_en.pdf
Chen, L., D. Zhong , D. Zhang, L. Shi, G. Zhou, M. Gong, H. Zhou, Y. Sun, L. Ma, J. He, S. Hong, D. Zhou, C. Xiong,
C. Chen, P. Zou, C. Zhu and G. Yan. 2010. Molecular ecology of pyrethroid Knockdown resistance in Culex pipiens pallens mosquitoes. PLoS ONE 5:e11681.
McAbee, R.D., K.D. Kang, M.A. Stanich, J.A. Christiansen, C.E. Wheelock, A.D. Inman, B.D. Hammock, A.J. Cornel. 2004. Pyrethroid tolerance in Culex pipiens pipiens var molestus from Marin County, California. Pest Management Science 60(4):359-368.
Service, M.W. 1993. Mosquito Ecology Field Sampling Methods. Elsevier Applied Science. Ch. 9 Mark-Recapture Techniques and Adult Dispersal. Pp 652-751.
Tietze, N.S. , T. Mulligan, R. Parman and N. Zahiri. 2008. Responding to West Nile Virus in Santa Clara County. Proceedings of the Mosquito and Vector Control Assoc. Calif. 76:98-102.

86 Proceedings and Papers of the Mosquito and Vector Control Association of California Volume 85
2017
Organophosphate Use as a Pyrethroid Resistance Management Strategy ~Why It May Not Be the Solution We Are Looking For
Deborah Dritz, Kara Kelley, Paula Macedo
Sacramento-Yolo MVCD8631 Bond Rd., Elk Grove, CA 95624
Resistance to pyrethroids has been a major concern for mosquito control agencies that utilize adulticides as part of their Integrated Pest Management (IPM) programs. The evaluation of insecticide susceptibility of target mosquito populations is recommended on a regular basis. Depending on resistance testing results, rotation of pesticides or the use of a different class of pesticides is usually recommended as a resistance management strategy. Currently there are only two classes of adulticides registered for use against adult mosquitoes. Organophosphates have been used by some agencies as an attempt to manage resistance to pyrethroids. This presentation will discuss resistance testing results against both pyrethroids and organophosphates and why agencies should be careful when using products with past resistance history.
Volume 85 Proceedings and Papers of the Mosquito and Vector Control Association of California 87
2017
Laboratory and Field Assays of Adulticides
Jennifer A. Henke, Melissa Snelling, Gabriela Perezchica-Harvey, and Gregory White
Coachella Valley Mosquito and Vector Control District P.O. Box 2967 Indio, CA 92202
The Coachella Valley Mosquito and Vector Control District routinely conducts CDC bottle bioassays to examine whether mosquito populations are resistant to the adulticide products considered for use. In 2016, we examined whether three populations of Cx. quinquefasciatus mosquitoes were resistant to pyrethroid products. Resistance to pyrethroids was detected at varying levels in all three populations tested. One population tested is from an area where the District has not conducted adulticide applications, so the resistance is expected to be due to the use of products around residences. To further examine the populations, staff created a large cage stand to treat the populations with a backpack fogger under similar environmental field conditions. Troubleshooting conducted as part of the semi-field trialand barrier applications and the methodology determined that one product was not providing optimal control results.
88 Proceedings and Papers of the Mosquito and Vector Control Association of California Volume 85
2017
Modeling the Efficacy of Aerial Spraying on the Relative Abundanceof Culex tarsalis and Culex pipiens
Karen M. Holcomb1*, Robert C. Reiner2, and Christopher M. Barker1
1Davis Arbovirus Research and Training (DART) Lab, Department of Pathology, Microbiology, and Immunology,University of California, Davis, CA, 95616
2Institute for Health Metrics and Evaluation, University of Washington, Seattle, WA, 98121*Contact: [email protected]
ABSTRACT: In order to minimize transmission of West Nile virus to humans, mosquito control districts utilize a variety of methods to reduce the abundance of adult and larval mosquitoes. Of the available control options, aerial adulticides are among the most effective tools for immediate reduction of infectious adult mosquito populations during periods of epidemic risk. We used trap collection data from CO2-baited traps in Sacramento and Yolo counties from 2006-2015 to fit a generalized additive model that captured spatial and temporal trends in adult female abundance for Culex tarsalis and Culex pipiens. The resulting model allowed us to estimate the duration of spray effects and proportional reduction in relative abundance for both species at a population scale.
INTRODUCTION
The Sacramento-Yolo County Mosquito and Vector Control District (SYMVCD) utilizes integrated control methods guided by surveillance to reduce the abundance of infectious Culex mosquitoes with the aim of reducing human cases of West Nile virus (Geraghty et al. 2013; Macedo et al. 2010). During periods of epidemic risk, SYMVCD uses aerial sprays to achieve immediate reduction in mosquito populations. A common method for assessing the efficacy of individual sprays is to compare pre- and post-treatment mosquito numbers (Elnaiem et al. 2008). This method has shown that aerial sprays can be effective in reducing mosquito populations and human risk for disease, but estimates of efficacy vary spatially and temporally (Carney et al. 208; Elnaiem et al. 2008; Macedo et al. 2010) and are subject to stochastic variation in mosquito population dynamics and night-to-night differences in trapping success.In order to provide more stable estimates of the efficacy of aerial sprays, we fitted a statistical model with a decade of trap data for Culex tarsalis and Culex pipiens from Sacramento and Yolo counties. We aimed to capture spatial and temporal trends in adult female abundances as a baseline for assessing proportional reductions of adult numbers in response to spray events.
METHODS
Using CO2-baited trap data from SYMVCD for 2005-2016, we fitted a generalized additive model (GAM) to estimate the expected mosquito counts throughout the district. A GAM is a statistical model with flexible parameterization that explains spatial and temporal trends as smooth functions of covariates. Covariates included to explain trends in mosquito abundance as measured by trap counts were daily minimum temperature, location (latitude and longitude), day of the year, and year.
Control variables included terms for the occurrence of the last two spray events within a temporal window of 1-6 weeks prior to the trap collection and the specific pesticide product used.
RESULTS
Our results indicate that aerial sprays were effective in reducing the abundance of both Cx. tarsalis and Cx. pipiens during the weeks following spray events, although the amount and duration of reduction differed by species and product. Cx. pipiens experience a longer duration and larger proportional reduction in abundance in response to sprays, as compared to Cx. tarsalis, with the time since last spray the most predictive of reduction in this species. Time since second to last spray was most predictive of Cx. tarsalis reduction. Dibrom, Pyrocide 7396, and Pyronyl 525, were only used 2, 22, and 37 times, respectively, over the study period, so we were unable to evaluate the efficacy of these products with our model. In contrast, Anvil 10+10, Trumpet EC, and Evergreen 60-6 were used 164, 231, and 366 times, respectively, and our model indicated that Trumpet EC and Anvil 10+10 had higher efficacy for Cx. tarsalis compared to Evergreen 60-6. For Cx. pipiens, Anvil 10+10 had the highest efficacy of the three products while Evergreen 60-6 had approximately the same effect as Trumpet EC.
DISCUSSION
Taken together, our findings to date indicate that aerial sprays are effective in reducing Cx. tarsalis and Cx. pipiens abundance and that the effects persist during the weeks following the spray event. In addition, as time since second to last spray was the most predictive for reduction of Cx. tarsalis, this suggests that repetition of sprays increases the effects for this species. Differences in responses between the species could be due to

Volume 85 Proceedings and Papers of the Mosquito and Vector Control Association of California 89
2017
differences in habitat distributions; larval and adult Cx. pipiens are typically localized to urban areas, whereas Cx. tarsalis larvae are found in agricultural areas and adults live in both agricultural and urban areas (Reisen and Reeves 1990). Replacement of Cx. tarsalis adults due to immigration from surrounding untreated areas could diminish the estimated effect of spray events. Our findings for Cx. tarsalis support the recent shift away from using pyrethrins due to their limited efficacy compared to pyrethroids and Naleds. The reduced effect of Evergreen 60-6 in this species mirrors observed pyrethrin resistance in Culex species (McAbee et al. 2003). Our findings for Cx. pipiens mirror reported Naled and pyrethrin resistance (CDPH-VBDS 2005; McAbee et al. 2003). Comparisons of spray effects between
REFERENCES CITED
Carney, R. M., S. Husted, C. Jean, C. Glaser, and V. Kramer. 2008. Efficacy of aerial spraying of mosquito adulticide in reducing incidence of West Nile virus, California, 2005. Emerg. Infect. Dis. 14:747-754.
(CDPH-VBDS) California Department of Public Health – Vector-borne Disease Section. 2005. California mosquito pesticide resistance summary table. CDPH-VBDS, Sacramento, CA. http://westnile.ca.gov/website/mosq_control/Pesticide%20Resistance%20Summary%20Table.pdf.
Elnaiem, D. A., K. Kelly, S. Wright, R. Laffey, G. Yoshimura, M. Reed, G. Goodman, T. Thiemann, L. Reimer, W. K. Reisen, and D. Brown. 2008. Impact of aerial spraying of pyrethrin insecticide on Culex pipiens and Culex tarsalis (Diptera: Culicidae) abundance and West Nile virus infection rates in an urban/suburban area of Sacramento County, California. J. Med. Entomol. 45:751-757.
Geraghty, E. M., H. G. Margolis, A. Kjemtrup, W. K. Reisen, and P. Franks. 2013. Correlation between aerial insecticide spraying to interrupt West Nile virus transmission and emergency department visits in Sacramento County, California. Public Health Rep. 128:221-230.
McAbee, R. D., K. Kang, M. A. Stanich, J. A. Christiansen, C. E. Wheelock, A. D. Inman, B. D. Hammock, and A. J. Cornel. 2003. Pyrethroid tolerance in Culex pipiens pipiens var molestus from Marin County, California. Pest. Manag. Sci. 60:359-368.Macedo, P. A., J. L. Schleier III, M. Reed, K. Kelly, G. W. Goodman, D. A. Brown, and R. K. Peterson. 2010. Evaluation of efficacy and human health risk of aerial ultra-low volume applications of pyrethrins and piperonyl butoxide for adult mosquito management in response to West Nile virus activity in Sacramento County, California. J. Am. Mosq. Control Assoc. 26:57-66.
Reisen, W. K. and W. C. Reeves. 1990. Bionomics and ecology of Culex tarsalis and other potential mosquito vector speics. pp.: 254-329. In: W. C. Reeves, (ed.) Epidemiology and control of mosquito-borne arboviruses in California, 1943-1987. California Mosquito and Vector Control Assoc, Sacramento, CA.
Reisen, W. K., H. Lothrop, R. Chiles, M. Madon, C. Cossen, L. Woods, S. Husted, V. Kramer, and J. Edman. 2004. West Nile virus in California. Emerg. Infect. Dis. 10:1369-1378.
habitat types (urban vs. agricultural) is ongoing. The methods used in this study can be applied to different trap types or control methods in order to enhance the understanding of their effects on relative abundance of mosquitoes, particularly for effects that are difficult to measure on the per-treatment basis.
ACKNOWLEDGMENTS
We thank Ruben Rosas, Paula Macedo, and Gary Goodman from the Sacramento-Yolo Mosquito and Vector Control District for providing records of trap collections and aerial sprays. Funding for the project was provided by the Floyd and Mary Schwall Fellowship in Medical Research.
90 Proceedings and Papers of the Mosquito and Vector Control Association of California Volume 85
2017
Epidemiology of Zika Virus in California
Wendy Jilek, Charsey Cole Porse, Vicki Kramer
Vector-Borne Disease Section, California Department of Health Services, Sacramento, CA [email protected]
ABSTRACT: Zika is a mosquito-borne virus which is primarily transmitted by Aedes aegypti (the yellow fever mosquito), and secondarily by Aedes albopictus (the Asian tiger mosquito). Zika has emerged as a global concern; in February 2016, the World Health Organization declared Zika virus infection a public health emergency of international concern. Zika virus has been shown to cause microcephaly and other pregnancy outcomes in infants as well as Guillain-Barré syndrome in rare cases. Non-vector modes of Zika virus transmission, including congenital, perinatal, and sexual have been also been documented. All Zika cases reported in California through December 2016 have been travel-associated, sexually-transmitted, or congenital. Zika poses an additional concern in California because Aedes aegypti and/or Aedes albopictus have been detected in 12 California counties, increasing the risk for local transmission. This presentation highlights the current epidemiologic knowledge of Zika in California, describes the enhanced surveillance activities being implemented, and briefly outlines the outreach and education to public and medical communities.
While the risk for autochthonous transmission of Zika remains low, numerous Aedes aegypti and Aedes albopictus detection sites in the vicinity of returned infected travelers and California’s proximity to Mexico reinforces the importance of Zika awareness and effective surveillance measures by the California Department of Public Health, local health departments, and vector control agencies.
Volume 85 Proceedings and Papers of the Mosquito and Vector Control Association of California 91
2017
Establishment of an Aedes sierrensis colony for laboratory bioassays
Bret Barner and Sarah Wheeler
Sacramento-Yolo Mosquito and Vector Control District 8631 Bond Road, Elk Grove, CA [email protected], 800-429-1022
ABSTRACT: The western treehole mosquito (Aedes sierrensis) is a major pest species in western North America that is a known vector of dog heartworm (Dirofilaria immitis) and deer body worm (Setaria yehi). The laboratory at the Sacramento-Yolo Mosquito and Vector Control District has maintained colonies of different Culex species for many years but lacked a colony of Aedes species that could be used for laboratory and field trials to better understand mosquito biology, the interaction between vector and parasite, and bioassays testing susceptibility/resistance to pesticides. A colony of Ae. sierrensis was started in 2016 and procedures for maintenance were optimized including housing, bloodfeeding, oviposition medium, timing and triggering of egg hatch, and conditions for larval development. Our rearing protocol can also be used to identify eggs laid on oviposition strips as part of an invasive species surveillance program.

92 Proceedings and Papers of the Mosquito and Vector Control Association of California Volume 85
2017
Ovipositional responses of Culex tarsalis to fish-associated semiochemicals in laboratory bioassays
Adena M. Why, Dong-Hwan Choe and William E. Walton
Department of Entomology, University of California, Riverside, CA 92521Email: [email protected]
ABSTRACT: We isolated and characterized semiochemicals associated with the Western mosquitofish, Gambusia affinis, that influence oviposition by Culex tarsalis. Semiochemicals were isolated from water containing mosquitofish using solid-phase microextraction (SPME) and liquid-phase chromatography and were analyzed using a variety of chemistry techniques, mainly gas-chromatograph mass spectrometry (GCMS). These compounds, as well as the natural blend of semiochemicals, were presented to gravid female Cx. tarsalis to determine their affect on ovipositional site-selection. The volatile compounds identified to date appear to act as an oviposition attractant, indicating to the female that a suitable oviposition site is present. The non-volatile class of compounds appears to be acting as an ovipositional deterrent.
INTRODUCTION
Culex tarsalis, the Western encephalitis mosquito, is one of the important vectors of arboviruses in western North America. It is responsible for the maintenance, amplification and epidemic transmission of Western Equine Encephalomyelitis (WEEV) virus, St. Louis Encephalitis (SLEV) virus, and is currently a predominant vector of West Nile virus (WNV) in the western U.S. The USDA-APHIS has highlighted WEE and Eastern Equine Encephalomyelitis viruses as “Animal Health Emerging Issues” because these arboviruses have the potential to impact United States animal agriculture. Culex tarsalis is also the predominant vector of WEEV in the U.S and breeds readily in large bodies of water, such as natural and man-made wetlands. While searching for oviposition sites, female insects will most likely encounter a range of microhabitats over which survival of offspring varies. Several components of habitat quality could influence offspring survival, such as the density of competitors, seasonal duration (e.g. vernal or temporary pools), overall productivity of the habitat (e.g. available food resources) and the risk of predation present (Angelon and Petranka 2002). Natural selection should then favor ovipositing females that can assess habitat quality and choose microhabitats that would maximize offspring survival. Gravid female mosquitoes use a combination of cues from the environment, including physical, biological and chemical, to select oviposition sites (Bentley and Day 1989; Isoe and Millar 1995). More recently investigators have begun looking at the semiochemical(s) produced by fish, specifically kairomones, and how they affect site selection during oviposition by female mosquitoes (Ritchie and Laidlaw-Bell 1994; Angelon and Petranka 2002; Van Dam and Walton 2008; Pamplona et al. 2009; Walton et al. 2009). A kairomone is defined as a semiochemical that mediates interactions between individuals of different species, where the information transfer is beneficial for the receiver but not the individual producing the signal, also called the sender (Brönmark and Hansson 2012). To date, the vast majority of these chemical compounds have yet to be identified and their efficacy as potential control agents has not been evaluated. Previous research has shown that female mosquitoes respond to the chemical signature(s) put off by certain fish species in breeding sites, leading to a decrease in number of
egg rafts/eggs laid (Van Dam and Walton 2008; Pamplona et al. 2009; Walton et al. 2009; Why et al. 2016). This response was seen in both laboratory and field trials. Van Dam and Walton (2008) found that Cx. tarsalis responds strongly to the presence of fish-associated chemicals in oviposition sites. On average, four times as many egg rafts were laid on control water when compared with water conditioned with fish in the laboratory. In our current study, we isolated and characterized semiochemicals associated with the Western mosquitofish, Gambusia affinis. Semiochemicals were isolated from water containing Gambusia-semiochemicals using solid-phase microextraction (SPME) and liquid-phase chromatography and analyzed using a variety of chemistry techniques, mainly gas-chromatograph mass spectrometry (GCMS). These compounds, as well as the natural blend of semiochemicals, were presented to gravid female Cx. tarsalis to determine their affect on ovipositional site-selection.
METHODS
Culex tarsalis adults were reared from a colony derived from wild individuals collected from San Jacinto, CA in 2001. Culex tarsalis larvae were reared in enamel pans under standard laboratory conditions. The resulting adults were allowed to feed on a 10% sucrose mixture and hydrated raisins sprinkled with 5 ml of granulated sugar. Once each week, female mosquitoes were fed overnight on a 2–5-d-old restrained chick. Mosquito oviposition preference was tested in binary choice assays. Semiochemical-laden water was made during 3-day incubations in the laboratory. Ten fish were fed ad libitum on flaked fish food for 24 h in a 18.5 liter plastic bucket containing 10 liters of aged tap water. On day 2, the fish were moved to a clean bucket containing 10 liters of aged tap water and allowed to empty their guts. On day 3, the fish were moved to a new, clean container holding 10 liters of aged tap water. The fish were removed after 24 h and the latter fish-conditioned water was used to test ovipositional responses of the mosquitoes. The control consisted of 10 liters of tap water that had been aged using an aerator for 24 h in same type of 18.5 liter plastic bucket. The tap

Volume 85 Proceedings and Papers of the Mosquito and Vector Control Association of California 93
2017
water was not treated in any way, nor was anything added to it. Within 18 h of ingesting a bloodmeal, 30 blood-fed female Cx. tarsalis were aspirated into cages measuring 30 by 30 by 30 cm3 (Model # 1450B; Bioquip Products, Rancho Dominguez, CA). After 3-4 days had elapsed, gravid females in each cage were presented with two white 200-ml wax-lined cups (Solo Cup Co.), containing either 150 ml of fish-conditioned water or the control. Oviposition cups were replaced daily. Three to six replicate cages were used in each trial. Mosquitoes were allowed to lay egg rafts for three successive nights. The number of egg rafts in each cup was counted. Each gravid female mosquito was used only once. Semiochemicals were isolated from water containing mosquitofish using solid-phase microextraction (SPME) and liquid-phase chromatography and were analyzed using a variety of chemistry techniques, mainly gas-chromatograph mass spectrometry (GCMS). These compounds, as well as the natural blend of semiochemicals, were presented to gravid female Cx. tarsalis to determine their affect on ovipositional site-selection.
RESULTS
Our current results indicate that there are two classes of chemical compounds associated with mosquitofish that affect
oviposition behavior: volatile and non-volatile. In laboratory bioassays the natural blend of these compounds led to a reduction in the number of egg rafts laid by female Cx. tarsalis, (N=7, P < 0.036). Three volatile compounds appeared to act as an oviposition attractant, indicating to the female that a suitable oviposition site is present with adequate larval resources, i.e. food source. The non-volatile class of compounds appeared to act as an ovipositional deterrent. It is only when female Cx. tarsalis land on the water and taste the chemicals present that she was deterred from ovipositing.
ACKNOWLEDGEMENTS
The authors would like to thank Dr. Margaret Wirth, David Popko and other members of the Walton lab, as well as Kathleen Campbell, for their assistance with the project. Funding was provided by the Department of Entomology, the Anderson Endowed Scholarship in Immature Insects, the Robert and Peggy Van den Bosch Scholarship, the Jameson Foundation Scholarship and US Department of Agriculture National Institute of Food and Agriculture, Hatch project 1007869. The vertebrate animals in these experiments were used in accordance with fair treatment of animals under protocols 20130030 and 20160029 in compliance with the Institutional Animal Care and Use Committee.
REFERENCES
Angelon, K. A., and J. W. Petranka. 2002. Chemicals of predatory mosquitofish (Gambusia affinis) influence selection of oviposition site by Culex mosquitoes. J. Chem. Ecol. 28: 797–806.
Bentley, M. D., and J. F. Day. 1989. Chemical ecology and behavioral aspects of mosquito oviposition. Ann. Rev. Entomol. 34: 401–421.
Bronmark, C., and L. Hansson. 2012. Chemical Ecology in Aquatic Systems. Oxford University Press Inc. New York.
Isoe, J., and J. G. Millar. 1995. Characterization of factors mediating oviposition site choice by Culex tarsalis. J. Am. Mosq. Control Assoc. 11: 21–28.
Pamplona, L. G. C., C. H. Alencar, J. W. O. Lima, and J. Heukelbach. 2009. Reduced oviposition of Aedes aegypti gravid females in domestic containers with predatory fish. Trop. Med. Int. Health. 14: 1347–1350.
Ritchie, S. A., and C. Laidlaw-Bell. 1994. Do fish repel oviposition by Aedes taeniorhynchus. J. Am. Mosq. Control Assoc. 10: 380–384.
Van Dam, A. R., and W. E. Walton. 2008. The effect of predatory-fish exudates on the ovipositional behaviour of three mosquito species: Culex quinquefasciatus, Aedes aegypti and Culex tarsalis. Med. Vet. Entomol. 22: 399–404.
Walton, W. E., A. R. Van Dam, and D. A. Popko. 2009. Ovipositional responses of two Culex (Diptera: Culicidae) species to larvivorous fish. J. Med. Entomol. 46: 1338–1343.
Why, A. M., J. R. Lara and W. E. Walton. 2016. Oviposition of Culex tarsalis (Diptera: Culicidae) differs on water conditioned by potential fish and insect predators. J. Med. Entomol. 53: 1093–1099.
94 Proceedings and Papers of the Mosquito and Vector Control Association of California Volume 85
2017
Ectoparasite Treatment of Wild Rodents in Suburban Parks to Reduce Ticks and Tick-Borne Disease
Theresa L. Shelton, Nayer Zahiri,Warren Macdonald, Cheryl Sebay
San Mateo County Mosquito and Vector Control District , Laboratory Technician, 1351 Rollins Road, Burlingame, CA 94010
ABSTRACT: Questing ticks alongside trails in well-visited parks can be both a nuisance and a disease risk for walkers and their pets. This experiment involved placing PVC tubes lined with carpet treated with deltametherin dust in transects near trails in two city parks for three months. Each tube contained a non-toxic census block in the middle. Each park had a trail designated as control (non-dusted tubes) and a trail designated as treatment (dusted tubes). Tick population density was assessed in January/February 2016 and the following year in January/February 2017 by tick flagging, and captured ticks were tested for Borrelia miyamotoi and Borrelia burgdorferi. Rodents were trapped on three occasions: before, during and after the PVC tubes were placed near trails. Captured rodents were checked for ticks, and ear punches were taken, which were tested for Borrelia miyamotoi and Borrelia burgdorferi. Tick abundance on wild rodents was greatly decreased during and after the treatment. Infection prevalence in ticks and rodents was too low to formulate conclusions. Tick abundance along trails pre and post study will be compared in February, 2017.

Volume 85 Proceedings and Papers of the Mosquito and Vector Control Association of California 95
2017
The Possible Role of Invasive Hedera (ivy) Species in the Amplification of Ixodes Pacificus Abundance and Prevalence of Borrelia burgdorferi sensu stricto in a Park in Oakland, CA
Bruce Kirkpatrick, Sutapa Biswas, Joyce E. Kleinjan, Natalia Fedorova, David James, Robert Gay, Lucia T. Hui
Alameda County Vector Control Services District, 1131 Harbor Bay Parkway, Alameda Ca [email protected]
INTRODUCTION
The Alameda County Vector Control Services District (ACVCSD) routinely conducts tick surveillance on public trails throughout Alameda County. Nymphal and adult Ixodes pacificus ticks are collected and tested for the presence of Borrelia. In the spring and summer of 2016, a previously unsampled trail was investigated for tick activity. A distinguishing characteristic of this trail was the thick understory of ivy (Hedera). Ixodes nymphal abundance in the ivy was higher than that found on other County trails, and Borrelia infection rates were also higher than County averages. Understanding the biology and ecology of Ixodes ticks and their role in Lyme disease epidemiology requires knowledge of the diversity of the bacterial spirochete Borrelia. Of the 52 known species of Borrelia, 21 are considered members of the Lyme disease group. This group, the Borrelia burgdorferi sensu lato complex, includes the classic causative agent of Lyme disease, Borrelia burgdorferi sensu stricto. The ACVCSD performs ongoing Borrelia surveillance, and we have identified five members of the B. burgdorferi sensu lato complex in our county: B. bissettii, B. americana, B. californiensis, B. genomospecies 2, and B. burgdorferi sensu stricto. In Alameda County B. burgdorferi sensu stricto is the most common Borrelia species, and B. bissettii is the second most common. It is unclear whether B. bissettii causes Lyme disease in humans. Correlations can be made between tick abundance, tick infection rates, vegetation types, and climatic zones. In Alameda County, we have previously found the highest abundance of nymphal ticks in the leaf litter of California bay and coast live oak, and some of the highest infection rates in areas of California sycamore alliance. Some of the lowest abundance and infection rates have been found in the leaf litter of coastal redwood. Alameda County has two distinct climatic zones, the Western maritime zone and the Eastern continental zone. In the cooler, humid maritime areas, B. bissettii is most commonly detected, whereas in the hot drier continental regions, B. burgdorferi sensu sticto predominates.
METHODS
The study area, Joaquin Miller Park, is located in the Oakland hills on the maritime side of the Pacific Coast Range. It is approximately 500 acres and consists of several trails frequented by thousands of visitors yearly. The specific area of interest, the Lower Sinawik trail, was sampled biweekly from June through October 2016. Nymphal tick sampling was done with a standard tick drag Collected ticks were sterilized in hydrogen peroxide and 70% ethanol, and then dissected. Hindguts were placed in BSK-H medium and held at 34°C for 2-4 days, and checked for the presence of spirochetes using dark field microscopy. DNA extraction, PCR, and sequence analysis of 5S-23S intergenic spacer rRNA then were performed to determine which species of Borrelia was isolated. In addition, mammal sampling was conducted between 9/12/2016 and 9/22/2016. “National” traps were used for larger rodents and “Sherman” traps for smaller rodents. Each trap type was placed for four consecutive nights. Ear punches were taken of trapped animals and were placed in culturing medium and processed as described above. The ACVCSD measures tick abundance on specific trails by recording the number of ticks collected by dragging per unit of time, usually per half hour or hour. Nymphal I. pacificus collections typically begin in March, and can extend into August, especially on the maritime side of the coastal range. During the 2016 collection season, nine separate trails were sampled on the maritime side of the range.
RESULTS AND DISCUSSION
The vegetation type of the Lower Sinawik trail is primarily the redwood alliance; however, the understory consists predominantly of ivy. As this trail descends, the redwood trees become more abundant, the ivy becomes thicker, and the nymphal Ixodes abundance increases. Hedera is considered invasive in many parts of the world, including California. The California Invasive Plant Council’s website describes two species of Hedera found in the state. Both Hedera helix (English ivy) and Hedera canariensis (Algerian ivy) can be found growing in coastal areas, where it inhibits the normal
96 Proceedings and Papers of the Mosquito and Vector Control Association of California Volume 85
2017
growth of understory native plants. In addition to its impact on native flora, Hedera has a well-known association with Rattus species. Among rat control professionals, both the nonnative Rattus norvegicus and Rattus rattus have established themselves as intimately linked with this plant. They use the vegetation for harborage and consume the tender young shoots as a food source. Of the nine maritime trails sampled during the 2016 season, tick abundance was the greatest on the Lower Sinawik trail, averaging 17.1 ticks collected per hour. ACVCSD collects data for all trails sampled in the county; this data is organized by vegetation type, climatic zone, and B. burgdorferi sensu lato infection rates. From the Lower Sinawik, a total of 189 ticks were collected; 34 were positive, for an infection rate of 18%, making this trail an anomaly for a redwood forest habitat. Over a four year period (2009-2012), the nymphal I. pacificus infection prevalence in redwood forests has averaged only 1.3% (234 tested). In addition, of the 34 positive nymphs, 85% of them were positive for B. burgdorferi sensu stricto. This is unusual because most of the B. burgdorferi sensu stricto ‘hot spots’ in Alameda County are found on the continental side of the range, not the maritime side. Of 189 positive ticks collected from 2019-2012, 77% of those positive for B. burgodorferi sensu stricto were from continental areas. Small mammal sampling was conducted over a two week period in September 2016. The Sherman traps collected four Peromyscus truei; all were Borrelia negative. National traps collected two Neotoma fuscipes, and two Rattus rattus. One Neotoma was released untested, and the second was positive for B. burgdorferi sensu stricto. Of the two Rattus, both were positive for B. burgdorferi sensu stricto, and one was co-infected with B. bissettii, suggesting that the roof rat may play an important role as a host for the Lyme disease pathogen in this habitat.

Volume 85 Proceedings and Papers of the Mosquito and Vector Control Association of California 97
2017
Tick-borne Disease Surveillance in Wild Rodent Populations
Warren P. Macdonald, Nayer Zahiri, Theresa Shelton, Cherly Tina Sebay
San Mateo County Mosquito and Vector Control District 1351 Rollins Rd, Burlingame, CA 94010 [email protected]
Tick-borne diseases, such as Lyme disease, are a continual problem in coastal California regions. Because there is still some debate about which west coast animals can act as reservoir hosts of tick-borne rickettsia, it may be beneficial for agencies to test their own local populations of wild rodents for presence of these pathogens. At the San Mateo County MVCD we have adapted the CDC Hantavirus rodent capture and processing protocol to focus on collecting rodent tissue and blood for tick-borne pathogen surveillance. In spring through fall of 2016, 10 rodent surveys at 5 different locations were performed and 152 rodents (12 recaptures) were sampled. The majority of rodent species captured were dusky-footed woodrats (Neotoma fuscipes) and mice from the genus Peromyscus. Blood samples and 2mm ear punch biopsies were tested via quantitative PCR. 48 ear tissue samples and 2 blood samples were positive for Borrelia burgdorferi s.l., giving it a county wide infection rate of 32%. No samples were positive for Borrelia miyamotoi. Rodents from Thornewood OSP were additionally tested for Anaplasma phagocytophilum and 3 were found positive, two of which were co-infections with B.burgdorferi.
98 Proceedings and Papers of the Mosquito and Vector Control Association of California Volume 85
2017
Vector Control, We Mite Have a Problem:Biting Arthropods on a School Campus
Timothy Morgan1, Steve Bennett, Laura Krueger, Jared Dever, and Robert Cummings
Orange County Mosquito and Vector Control District,13001 Garden Grove Blvd.Garden Grove, CA 92843
1Corresponding author (714) 971-2421, ext.146; email: [email protected]
ABSTRACT: In September, 2016, the Orange County Mosquito and Vector Control District (OCMVCD) was alerted to a mysterious outbreak of purported arthropod bites afflicting over 49 students and staff at an elementary school in the city of Lake Forest, California. From the outset, this event received nationwide attention and caused a great amount of consternation among parents and school staff, and bewildered local medical practitioners. In response to this alert, OCMVCD conducted an ecological investigation to determine if arthropods were the potential source of the outbreak. This report describes the investigation and the following discoveries of several species of mites collected on the property and the control strategy that was developed to reduce arthropod-human contact at the school. Several factors, including mite abundance, location of mites, and their proximity to high foot-traffic areas, point to mesostigmatid mites as being the primary cause of the problem.
INTRODUCTION
When biting arthropods are suspected of causing pruritic dermatitis and the culprit cannot be discovered and identified, an affected person may experience high levels of anxiety. This can be further exacerbated when multiple people occupying a common area experience the same dermatitis symptoms of unknown origin. A rapid response to such an outbreak, with an intensive effort to locate the cause and identify and eliminate the source, is essential to quickly alleviate escalating anxiety and discomfort. Several types of mites are associated with cases of dermatitis in humans. Biting mites may cause pruritic dermatitis, a condition characterized by raised red papules accompanied by intense itching, and can be the cause of dermatitis outbreaks in groups of people (Goddard 1993). Diagnosis of mite infestations can be difficult because of the small size of most mites and the lack of irritation at the time of biting. Humans typically report itching from mite bites 10 - 16 hours after contact and well after the initial exposure (Goddard 1993). In California, outbreaks of mite-induced dermatitis have been attributed to members of several taxonomic orders and families, including larvae of immature Eutrombicula spp. mites (chiggers, family Trombiculidae), straw itch mites (family Pyemotidae), poultry mites (family Dermanyssidae), and rat and bird mites (family Macronyssidae) (Nakano 2016, CDPH 2016). The order Mesostigmata is composed of a diverse collection of mites that exhibit various feeding relationships with their associated prey or hosts, such as free-living predators, obligate and facultative parasites, and nest-dwellers (Lindquist et al. 2009). Although humans are not typical hosts of mesostigmatids, humans can become incidental food sources in the absence of their preferred hosts. Although several studies demonstrate that some mesostigmatid mites are capable of transmitting pathogens in a laboratory setting, very few are known to transmit these to humans (Valiente-Moro et al. 2005, Reeves et al. 2006, Mullen
and O’Connor 2009). Bites on humans from mesostigmatid mites have been reported worldwide and include species represented by families such as Macronyssidae, Dermanyssidea, Laelapidae, and Mechalidae, among others (Andrews and Ramsay 1982, Chung et al. 1998, Rosen et al. 2002, Cafiero et al. 2009). On September 16, 2016, the Orange County Vector Control District (OCMVCD) received a report of a mysterious rash-like outbreak affecting what would ultimately become 49 people (mostly children) who attended an elementary school in the city of Lake Forest, Orange County, California. Around the same time, a distraught parent released images of a child with bites to local television media. Coverage and interest in the story rapidly became widespread, reaching national and international news headlines (Konstantinides 2016). The current report documents the results of a six week investigation of an outbreak of pruritic dermatitis in children and adults at an elementary school in Orange County, California, and highlights the methodology of the ecological investigation conducted by the OCMVCD.
MATERIALS AND METHODS
Symptom onset for the index case was reported as September 3, 2016, with a child presenting pruritic dermatitis on the dorsal trunk (Figure 1). After several more similar cases appeared among school students and staff, medical personnel from public and private sources were contacted. No clear cause of the dermatitis was identified, but one physician of a child suggested that the source of the bites were chiggers (OC Health Care Agency, personal communication). Upon the suggestion of biting arthropods, OCMVCD was contacted on September 16 and an OCMVCD inspector performed the first inspection of the school grounds on September 21. The inspector noted that the affected children and staff utilized the same three portable classrooms (P1 – P3) and playground areas (Figure 2). Many were part of an after-school program

Volume 85 Proceedings and Papers of the Mosquito and Vector Control Association of California 99
2017
where they resided on campus before and after regular school hours (8:15 a.m. – 2:30 p.m.). Initial surveillance entailed: 1) setting two gravid mosquito traps (Cummings 1992) and one carbon dioxide-baited encephalitis virus surveillance (EVS) trap (Rohe and Fall 1979) to assess local mosquito abundance; 2) setting non-lethal rodent traps around portable classrooms; and 3) visual inspections for mosquito breeding, red imported fire ant (RIFA, Solenopsis invicta Buren) mounds, and bird/rat nests on or under buildings that may contain biting arthropods. On September 24, a private pest control operator conducted an ultra-low volume (ULV) pesticide treatment with the active ingredient bifenthrin (MasterLine® Bifenthrin 7.9, Univar) inside the three portable classrooms (P1 – P3) and on the northern grass field of the campus (Figure 2). OCMVCD was informed that access to the treated playgrounds and grass field by staff and students would be restricted until the issue was resolved. On September 26, an OCMVCD inspector returned to the school campus and set a Biogents Sentinel™ (BG-Sentinel) mosquito trap (Biogents AG, Regensburg Germany) with a human-scent and carbon-dioxide lure near the portable classrooms to detect invasive Aedes aegypti (L.) and Ae. albopictus (Skuse). Additionally, the grass field in the northern portion of the school was flagged for ticks and mites using a 1 m2 white cotton flag attached to a 1.2 m wooden dowel. Sampling was performed along linear transects that were spaced approximately 12 m apart. Glue boards (25 cm x 11 cm) were placed inside the portable classrooms for arthropod surveillance. On September 28, an OCMVCD vector ecologist and inspector conducted mite surveillance by placing black rectangular plastic cards (10 cm x 5 cm x 0.08 cm) every 8 m along linear transects spaced approximately 12 m apart in the northern grass field playground and in a grass section near the classrooms of concern, over an area totaling 5,225 m2 (Figure 2). [Black-colored cards warm under exposure to sunlight to a temperature higher than that of the surrounding vegetation and attract parasitic mites (Loomis 1956)]. Cards were left on the grass for approximately 10 min, then retrieved and immediately inspected for arthropods. Contents were transferred to vials with 70% isopropyl alcohol. In addition, “lint rollers” with disposable adhesive sheets (16.5 cm x 10 cm) were used to sample floor carpeting and potential access points on walls and ceilings (e.g., air conditioning vents, electrical
panels, and window sills) for mites in each of the three classrooms. Each adhesive sheet was examined later under a dissecting scope. On October 3, two OCMVCD vector ecologists returned to the school to conduct additional mite surveillance using black plastic cards in the northern (5,225 m2) and southern grass fields (2,450 m2) (Figure 2). Woodchips covering the ground of four play areas were sampled by collecting 2 - 3 handfuls of woodchips from areas where human activity and exposure risk was suspected to be the highest: below swings where children drag their feet, slide landing areas, anchor points of ladders and other playground structures children may climb on, and near the perimeters where the woodchips transitioned to grass, concrete, or asphalt. Woodchip and soil samples were processed through Berlese-Tullgren funnels. Mite specimens were sorted and preliminarily identified in the OCMVCD laboratory and sent to the University of Michigan, Ann Arbor (Dr. Barry O’Connor) for morphological identification. One mite was sent to the University of California, Riverside (Dr. Richard Stouthamer), for sequencing of the 28S ribosomal RNA gene
Figure 2. Map of Lake Forest Elementary School depicting arthropod sampling locations, including four playgrounds with wood chips (WC-1, 2, 3, 4), three portable classrooms (P1, P2, P3), and mite surveillance transects (dashed white lines).
Figure 1. Child exhibiting pruritic dermatitis on dorsal trunk, reportedly occurring from arthropod bites while attending Lake Forest Elementary School (photo: http://ktla.com/tag/lake-forest-elementary-school/).
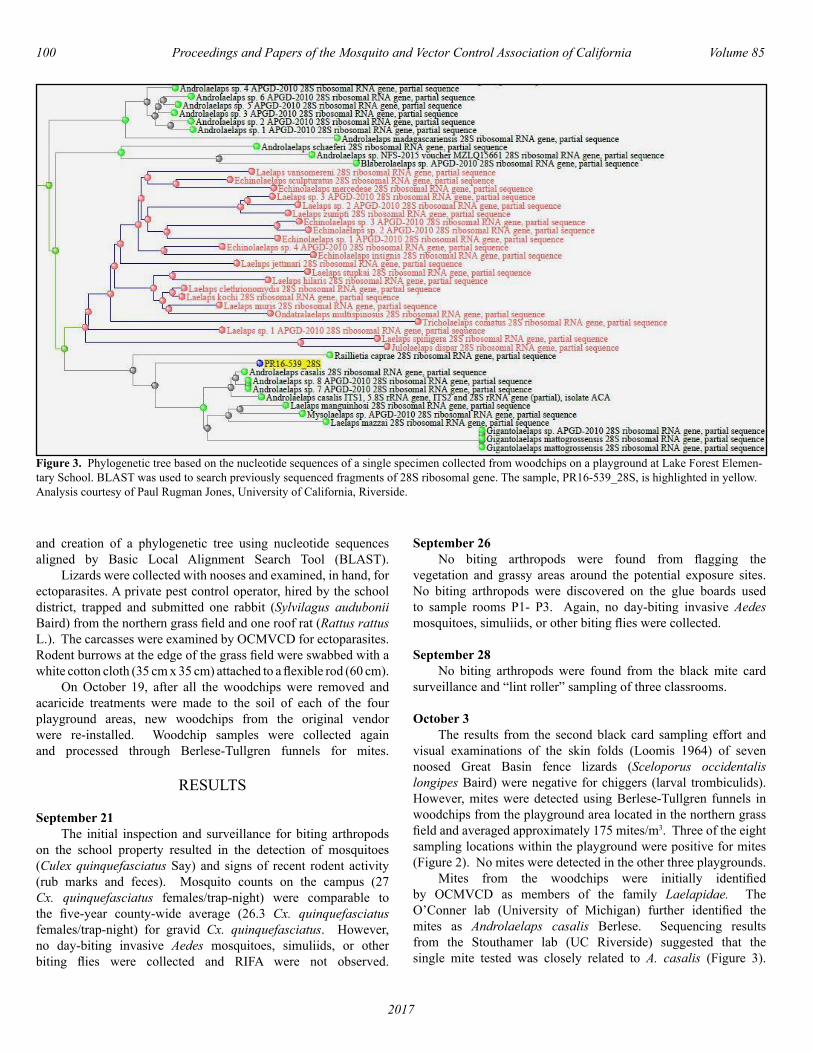
100 Proceedings and Papers of the Mosquito and Vector Control Association of California Volume 85
2017
and creation of a phylogenetic tree using nucleotide sequences aligned by Basic Local Alignment Search Tool (BLAST). Lizards were collected with nooses and examined, in hand, for ectoparasites. A private pest control operator, hired by the school district, trapped and submitted one rabbit (Sylvilagus audubonii Baird) from the northern grass field and one roof rat (Rattus rattus L.). The carcasses were examined by OCMVCD for ectoparasites. Rodent burrows at the edge of the grass field were swabbed with a white cotton cloth (35 cm x 35 cm) attached to a flexible rod (60 cm). On October 19, after all the woodchips were removed and acaricide treatments were made to the soil of each of the four playground areas, new woodchips from the original vendor were re-installed. Woodchip samples were collected again and processed through Berlese-Tullgren funnels for mites.
RESULTS
September 21 The initial inspection and surveillance for biting arthropods on the school property resulted in the detection of mosquitoes (Culex quinquefasciatus Say) and signs of recent rodent activity (rub marks and feces). Mosquito counts on the campus (27 Cx. quinquefasciatus females/trap-night) were comparable to the five-year county-wide average (26.3 Cx. quinquefasciatus females/trap-night) for gravid Cx. quinquefasciatus. However, no day-biting invasive Aedes mosquitoes, simuliids, or other biting flies were collected and RIFA were not observed.
September 26 No biting arthropods were found from flagging the vegetation and grassy areas around the potential exposure sites. No biting arthropods were discovered on the glue boards used to sample rooms P1- P3. Again, no day-biting invasive Aedes mosquitoes, simuliids, or other biting flies were collected.
September 28 No biting arthropods were found from the black mite card surveillance and “lint roller” sampling of three classrooms.
October 3 The results from the second black card sampling effort and visual examinations of the skin folds (Loomis 1964) of seven noosed Great Basin fence lizards (Sceloporus occidentalis longipes Baird) were negative for chiggers (larval trombiculids). However, mites were detected using Berlese-Tullgren funnels in woodchips from the playground area located in the northern grass field and averaged approximately 175 mites/m3. Three of the eight sampling locations within the playground were positive for mites (Figure 2). No mites were detected in the other three playgrounds. Mites from the woodchips were initially identified by OCMVCD as members of the family Laelapidae. The O’Conner lab (University of Michigan) further identified the mites as Androlaelaps casalis Berlese. Sequencing results from the Stouthamer lab (UC Riverside) suggested that the single mite tested was closely related to A. casalis (Figure 3).
Figure 3. Phylogenetic tree based on the nucleotide sequences of a single specimen collected from woodchips on a playground at Lake Forest Elemen-tary School. BLAST was used to search previously sequenced fragments of 28S ribosomal gene. The sample, PR16-539_28S, is highlighted in yellow. Analysis courtesy of Paul Rugman Jones, University of California, Riverside.
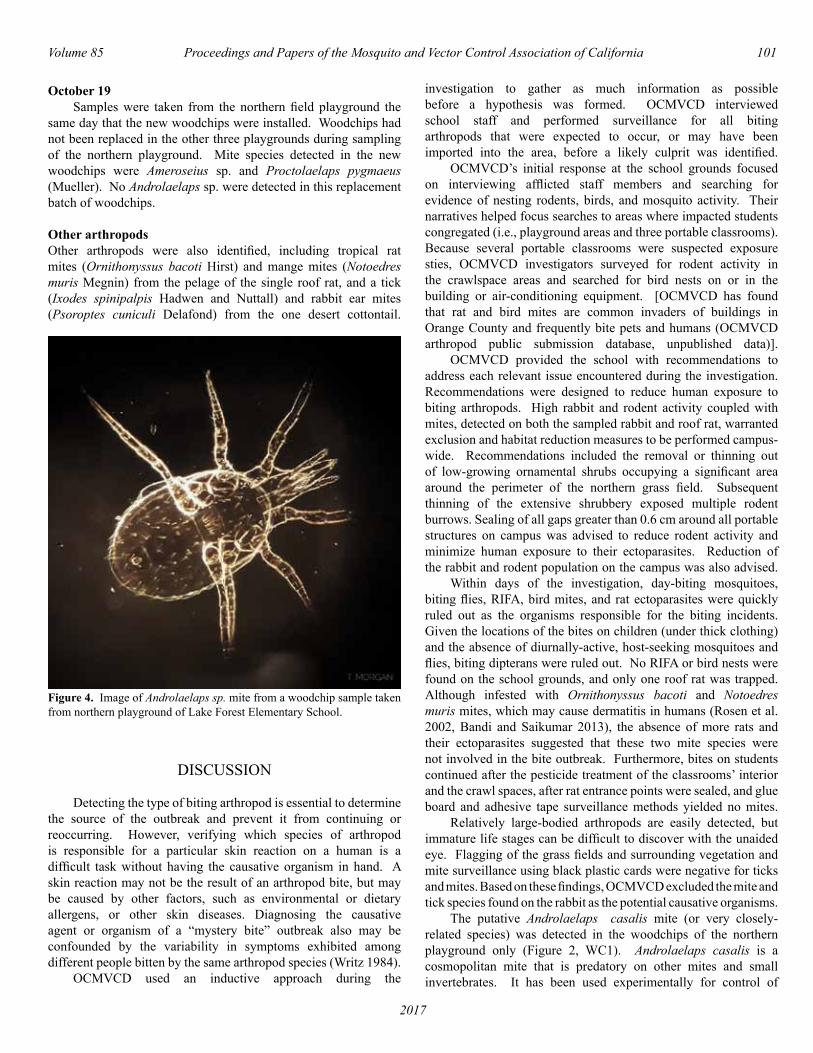
Volume 85 Proceedings and Papers of the Mosquito and Vector Control Association of California 101
2017
October 19 Samples were taken from the northern field playground the same day that the new woodchips were installed. Woodchips had not been replaced in the other three playgrounds during sampling of the northern playground. Mite species detected in the new woodchips were Ameroseius sp. and Proctolaelaps pygmaeus (Mueller). No Androlaelaps sp. were detected in this replacement batch of woodchips.
Other arthropodsOther arthropods were also identified, including tropical rat mites (Ornithonyssus bacoti Hirst) and mange mites (Notoedres muris Megnin) from the pelage of the single roof rat, and a tick (Ixodes spinipalpis Hadwen and Nuttall) and rabbit ear mites (Psoroptes cuniculi Delafond) from the one desert cottontail.
DISCUSSION
Detecting the type of biting arthropod is essential to determine the source of the outbreak and prevent it from continuing or reoccurring. However, verifying which species of arthropod is responsible for a particular skin reaction on a human is a difficult task without having the causative organism in hand. A skin reaction may not be the result of an arthropod bite, but may be caused by other factors, such as environmental or dietary allergens, or other skin diseases. Diagnosing the causative agent or organism of a “mystery bite” outbreak also may be confounded by the variability in symptoms exhibited among different people bitten by the same arthropod species (Writz 1984). OCMVCD used an inductive approach during the
investigation to gather as much information as possible before a hypothesis was formed. OCMVCD interviewed school staff and performed surveillance for all biting arthropods that were expected to occur, or may have been imported into the area, before a likely culprit was identified. OCMVCD’s initial response at the school grounds focused on interviewing afflicted staff members and searching for evidence of nesting rodents, birds, and mosquito activity. Their narratives helped focus searches to areas where impacted students congregated (i.e., playground areas and three portable classrooms). Because several portable classrooms were suspected exposure sties, OCMVCD investigators surveyed for rodent activity in the crawlspace areas and searched for bird nests on or in the building or air-conditioning equipment. [OCMVCD has found that rat and bird mites are common invaders of buildings in Orange County and frequently bite pets and humans (OCMVCD arthropod public submission database, unpublished data)]. OCMVCD provided the school with recommendations to address each relevant issue encountered during the investigation. Recommendations were designed to reduce human exposure to biting arthropods. High rabbit and rodent activity coupled with mites, detected on both the sampled rabbit and roof rat, warranted exclusion and habitat reduction measures to be performed campus-wide. Recommendations included the removal or thinning out of low-growing ornamental shrubs occupying a significant area around the perimeter of the northern grass field. Subsequent thinning of the extensive shrubbery exposed multiple rodent burrows. Sealing of all gaps greater than 0.6 cm around all portable structures on campus was advised to reduce rodent activity and minimize human exposure to their ectoparasites. Reduction of the rabbit and rodent population on the campus was also advised. Within days of the investigation, day-biting mosquitoes, biting flies, RIFA, bird mites, and rat ectoparasites were quickly ruled out as the organisms responsible for the biting incidents. Given the locations of the bites on children (under thick clothing) and the absence of diurnally-active, host-seeking mosquitoes and flies, biting dipterans were ruled out. No RIFA or bird nests were found on the school grounds, and only one roof rat was trapped. Although infested with Ornithonyssus bacoti and Notoedres muris mites, which may cause dermatitis in humans (Rosen et al. 2002, Bandi and Saikumar 2013), the absence of more rats and their ectoparasites suggested that these two mite species were not involved in the bite outbreak. Furthermore, bites on students continued after the pesticide treatment of the classrooms’ interior and the crawl spaces, after rat entrance points were sealed, and glue board and adhesive tape surveillance methods yielded no mites. Relatively large-bodied arthropods are easily detected, but immature life stages can be difficult to discover with the unaided eye. Flagging of the grass fields and surrounding vegetation and mite surveillance using black plastic cards were negative for ticks and mites. Based on these findings, OCMVCD excluded the mite and tick species found on the rabbit as the potential causative organisms. The putative Androlaelaps casalis mite (or very closely-related species) was detected in the woodchips of the northern playground only (Figure 2, WC1). Androlaelaps casalis is a cosmopolitan mite that is predatory on other mites and small invertebrates. It has been used experimentally for control of
Figure 4. Image of Androlaelaps sp. mite from a woodchip sample taken from northern playground of Lake Forest Elementary School.

102 Proceedings and Papers of the Mosquito and Vector Control Association of California Volume 85
2017
poultry red mites (Lesna et al. 2012), but is also known to cause dermatitis in humans (Rosen et al. 2002). No mites were detected in the woodchips sampled from the other three playgrounds. Each playground was constructed with a concrete border designed to be even with the adjacent outer surface (grass, concrete, asphalt) and retain the playground substrate. The estimated depth of the woodchips within the playground was on average 60 cm. Although genetic analysis of a single specimen collected at the school did not match the reference nucleotide sequence of A. casalis, it was placed within the genus Androlaelaps and was found to be closely related to A. casalis (Figure 3). The mouth structures of the collected specimens (Figure 4) were similar to those of A. casalis and are capable of inflicting a bite on a person. Another related species considered during the investigation was A. fahrenholzi Berlese. It is associated with rodents and is considered a potential human biter. However, because the specimens did not match the morphological characteristics of A. fahrenholzi, it was not included in the BLAST analysis. After woodchips from the mite infested playground were treated and removed, the underlying soil was treated with an acaricide, and then the exposed soil was covered over with a new shipment of woodchips from the original vendor. Sampling of the newly-installed woodchips revealed a different species of mite, P. pygmaeus. Proctolaelaps pygmaeus has been implicated in bite cases from different regions of the world, and one case involved workers handling timber (Andrews and Ramsay 1982). These mites were not detected in the initial woodchip samples and were only detected in the newly-installed woodchips after the last bite incident was reported to the school. Therefore, this species was not thought to be the causative organism. Most of the afflicted children and adult staff were involved in an after-school program where they were on or near the playground where the mites were detected. Students used the play area before and after regular school-day hours. Average ambient temperature during the investigation, between the first bite case (September 3) and last reported bite case (October 16) was 28.6° C (83.5° F), with 9 days reaching over 32.2° C (90° F). The average low for the same period was 17.4° C (63.4° F). We hypothesized that mite activity at the surface of the woodchips was higher when temperatures were lower, before and after school, than during regular school hours when temperatures were highest and detrimental to exposed mites (DeNardo and Wozniak 1997). If mites retreated deep into the woodchips during high ambient temperatures, other children using the equipment during these times would have less contact with the mites. This would account for the disproportionate number of children and supervising adults experiencing bites on the playground during cooler times of the day, compared to other students not in the after-school program. Sampling of the woodchips was conducted on days that were particularly hot. Woodchips were taken from approximately 20 - 30 cm below the surface. Overwatering of vegetation around the perimeter cooled the adjacent woodchips considerably compared to those near the center of the playground. Androlaelaps casalis mites were detected both on the edges and in the center of the playground. However, their distribution through the woodchip column was not assessed. OCMVCD’s recommendation after the initial discovery of
the mites was to replace the woodchips with an alternative ground cover, such as rubber. This recommendation was made because the origin of the mites could not be conclusively determined but was suspected to be related to the imported woodchips. Further use of woodchips was discouraged because mites could be reintroduced on replacement woodchips, or they may have been dispersed and become established in areas outside of the playground, thereby increasing the likelihood of a re-infestation. After mites were detected in the newly-installed woodchips, a rubberized surface was finally installed on all playgrounds. Although no mites were recovered from a body or personal item of a student or teacher at the school, evidence from this investigation supports OCMVCD’s conclusion that A. casalis, or a close relative thereof, was the causative agent of the outbreak of mite-induced dermatitis. This would possibly be the first documented, large-scale outbreak caused by an Androlaelaps sp. in the U.S., where the likely source was imported woodchips. No new mite complaints have been noted after the school undertook the corrective measures recommended by OCMVCD.
ACKNOWLEDGEMENTS
We gratefully acknowledge the assistance of Caroline Reisinger with inspections and surveillance during the investigation, operational support of Saddleback Valley Unified School District’s Maintenance, Operations and Construction staff, OCMVCD staff, and Rick Howard, OCMVCD District Manager. We thank the O’Connor lab at the University of Michigan and the Stouthamer Lab at the University of California, Riverside, for assistance with mite identification and genetic analysis, respectively.
Volume 85 Proceedings and Papers of the Mosquito and Vector Control Association of California 103
2017
REFERENCES
Andrews, J. R. H., and G. W. Ramsay. 1982. A case of papular dermatosis in man attributed to an ascid mite (Acari). J. Med. Entomol. 19: 111-112.
Bandi, K. M., and C. Saikumar. 2013. Sarcoptic mange: a zoonotic ectoparasitic skin disease. J. Clin. Diagn. Res. 7: 156-157.
Cafiero, M. A., A. Camarda, E. Circella, D. Galante, and M. Lomuto. 2009. An urban outbreak of red mite dermatitis in Italy. Int. J. Dermatol. 48: 1119-1121.
CDPH (California Department of Public Health). 2016. Arthropods of public healthsignificance in California, version 3. Vector-borne Disease Section. https://archive.cdph.ca.gov/certlic/occupations/Documents/ CatCArthropodsofPublicHealth Significance.pdf. (accessed 21 July 2017).
Chung, S. L., S. J. Hwang, S. B. Kwon, D. W. Kim, J. B. Jun, and B. K. Cho. 1998. Outbreak of rat mite dermatitis in medical students. Int. J. Dermatol. 37: 591-594.
Cummings, R. F. 1992. The design and use of a modified Reiter gravid mosquito trap for mosquito-borne encephalitis surveillance in Los Angeles County, California. Proc. Calif. Mosq. Vector Control Assoc. 60: 170 – 176.
DeNardo, D., and E. Wozniak. 1997. Understanding the snake mite and current therapies for its control. Proc. 4th Annual Conf. Assoc. Rept. Amphi. Vet. pp. 137-147.
Goddard, J. 1993. Physician's Guide to Arthropods of Medical Importance, Third Edition. CRC Press. Boca Raton, FL.
Konstantinides, A. 2016. Mysterious outbreak at Orange County elementary school leaves 30 children and 10 staff members covered in bites and blisters. Daily Mail. http://www.dailymail.co.uk/news/article-3814150/30-children-covered-mysterious- rash-California-elementary-school.html. (accessed 20 July 2017).
Lesna, I., M. W. Sabelis, T. G. C. M. van Niekerk, and J. Komdeur. 2012. Laboratory tests for controlling poultry red mites (Dermanyssus gallinae) with predatory mites in small ‘laying hen’ cages. Exp. Appl. Acarol. 58: 371–383.
Lindquist, E. E., G. W. Krantz, and D. E. Walter. 2009. Order Mesostigmata. pp. 124-232. In G. W. Krantz and D. E. Walter (eds.), A Manual of Acarology, Third Edition. Texas Tech University Press, Lubbock, TX.
Loomis, R. B. 1956. The chigger mites of Kansas (Acarina: Trombiculidae). Univ. Kan. Sci. Bull. 37: 1195-1443.
Loomis, R. 1964. A new species of chigger (Acarina: Trombiculidae) from lizards of western North America. Great Basin Nat. 24: 13-17.
Mullen, G. R., and B. M. O’Connor. 2009. Mites (Acari). pp. 433-492. In G. R. Mullen and L. A. Durden (eds.), Medical and Veterinary Entomology, Second Edition. Academic Press, Burlington, MA.
Nakano, A. 2016. An unusual encounter with biting mites (family: Pyemotidae) at a wildlife recue center. Proc. Calif. Mosq. Vector Control Assoc. 83: 10 – 14.
Reeves, W. K., A. P. G. Dowling, and G. A. Dasch. 2006. Rickettsial agents from parasitic Dermanyssoidea (Acari: Mesostigmata). Exp. Appl. Acarol. 38: 181-188.
Rohe, D. L., and R. P. Fall. 1979. A miniature battery powered CO2-baited trap for mosquito-borne encephalitis surveillance. Bull. Soc. Vector Ecol. 4: 24-27.
Rosen, S., I. Yeruham, and Y. Braverman. 2002. Dermatitis in humans associated with the mites Pyemotes tritici, Dermanyssus gallinae, Ornithonyssus bacoti, and Androlaelaps casalis in Israel. Med. Vet. Entomol. 16: 442-444.
Valiente-Moro, C., C. Chauve, and L. Zenner. 2005. Vectorial role of some dermanyssoid mites (Acari, Mesostigmata, Dermanyssoidea). Parasite. 12: 99-109.
Writz, R. A. 1984. Allergic and toxic reactions to non-stinging arthropods. Ann. Rev. Entomol. 29: 47-69.
104 Proceedings and Papers of the Mosquito and Vector Control Association of California Volume 85
2017
Increased Incidence of the Tropical Rat Mite (Ornithonyssus bacoti) inAlameda County, CA and Control Concepts for Mite Infestations
David K. James
Alameda County Vector Control Services District, [email protected] Harbor Bay Pkwy #166, Alameda, CA 94502
Service requests related to tropical rat mite infestations have increased in Alameda County since 2000 and have become more widespread throughout the region. From 1991 to 2000, our District received one to two service requests per year for Tropical rat mites. Since 2000 there has been an average of 18 service calls per year, with a peak of 29 in 2016. A tropical rat mite infestation is a serious problem and can cause major discomfort, anxiety and emotional distress in humans. Many people, including physicians, are not aware of this problem. Individuals can suffer for weeks before the problem is identified. In most cases pest management professionals and public health technicians do not know how to adequately handle ‘mite’ infestations.This nest dwelling mite requires a rodent host to complete its life cycle. Roof rats (Rattus rattus) are the primary host in residential mite infestations. Tropical rat mite bites are characteristic and fairly consistent. Bites normally appear ‘pimple-sized’ and mainly occur on the torso in areas with clothing constrictions such as the waist line, underarms and under breasts. Bites are extremely itchy and may cause emotional distress. Women and young children are often the only ones affected by the bites. It is important to get a description of the bites and what the resident is experiencing. This will help differentiate mite infestations from other biting arthropods or non-biting situations (delusional infestations). If a tropical rat mite infestation is suspected from the description of the bites, the target for control should not be the mites, as some will assume, but rather the roof rat hosts. Inspect for roof rats. Collecting and identifying mites is time consuming and difficult. Directing efforts towards rodent control is more productive and will solve the problem sooner. For temporary relief, mites can be controlled by applying insecticidal dusts to rodent nesting areas, such as attics. ULV applications or insecticide foggers can also be applied in these areas. Spot and crack and crevice residual pesticide treatments can be applied to the interior of homes. However, mite control should be considered optional. The solution for a tropical rat mite infestation is a good and prompt rodent control program. Eliminating the roof rat infestation and rodent-proofing should be the main concern and a priority. Two stages of the tropical rat mite require a rodent blood meal to complete their life cycle. A complete generation usually takes about two weeks. Therefore, without a rodent blood meal, the mite infestation will disappear within two to three weeks or sooner.
Volume 85 Proceedings and Papers of the Mosquito and Vector Control Association of California 105
2017
Oriental Cockroach (Blatta orientalis) Ecology and Control in Residential Alameda County
Cody Schaaf
Vector Control BiologistAlameda County Vector Control Services District
1131 Harbor Bay Pkwy, Suite 166, Alameda, CA [email protected]
510-567-6821
ABSTRACT: The oriental cockroach (Blatta orientalis) has become a common and unsightly pest in many residential and suburban areas of Alameda County over the past decades. Although it primarily lives outdoors, it occasionally enters human dwellings and has the potential to be a vector of various pathogens. Through years of observation, we have determined utility boxes are the main source of these insects in Alameda County. Alameda County Vector Control Services District has made agreements with the City of Pleasanton, CA to treat and control oriental cockroaches at their primary source: water meter boxes. To determine the efficacy of a fipronil-based gel bait in eliminating cockroaches in dark and humid outdoor sources such as water meter boxes, we took advantage of a rare oriental cockroach infestation in a sanitary sewer system to carry out our study since accurate population estimations are difficult to make in water meter boxes. We documented a 66-90% reduction in cockroach populations one day after application at multiple sites. Results from this study and observational experience show that this treatment method is effective and efficient in controlling outdoor oriental cockroach populations in residential areas of Alameda County.
INTRODUCTION
The oriental cockroach (Blatta orientalis) is a common pest insect that was once endemic to the Black Sea region (Robinson 2005) but has spread worldwide in recent centuries (Arnett and Ross 2000). It is commonly associated with human habitats (Goddard 2003) and can vector a variety of pathogens, including avian tuberculosis (Fischer et al. 2003), Salmonella (Kopanic Jr et al. 1994), and pathogens that cause gastroenteritis (Jacobs 2013). Similarly, the oriental cockroach, along with other cockroach species, is known to cause allergic reactions in sensitive people who come into contact with them (Helm et al. 1990). Although this species is frequently found in dwellings throughout the world, it lives mainly outdoors in warm, humid habitats (Jacobs 2013). Studies on their recent distribution are sparse, but past research has suggested that oriental cockroaches are able to spread efficiently outdoors without human assistance (Alexander et al. 1991). Their ability to invade and establish in new outdoor areas is likely attributed to their fast nymphal development (185-216 days at 27 °C), long adult lifespan (87-135 days at 27 °C), and high reproductive rates (1 ootheca laid every 6-7 days by adult females, 8-14 nymphs per ootheca) (Short and Edwards 1991). With the ability to readily reproduce at temperatures above 15 °C (Patourel 1995), temperate climate zones like California create ideal outdoor habitat for oriental cockroaches. An analysis of recent requests for service from county residents at Alameda County Vector Control Services District (ACVCSD) indicates that oriental cockroach populations are increasing in many suburban and residential areas of the eastern San Francisco Bay Area of California (Fig. 1). Through years of observation and cockroach treatment, we have confirmed that in-ground utility boxes (e.g. water meter, sprinkler, and telephone/cable boxes) are the main habitats and breeding sources of these insects (Fig. 2), because they provide
the preferred high temperature, humidity and surplus of organic matter that oriental cockroaches often seek (Jacobs 2013). Through an agreement with the City of Pleasanton, CA, ACVCSD has been granted approval to apply a gel bait in water meter boxes infested with oriental cockroaches as an attempt to reduce cockroach population abundance and ease concerned residents who often find oriental cockroaches in their garages and outside of their homes at night. To test the efficacy of a fipronil-based gel bait against oriental cockroaches, we designed a study to document oriental cockroach treatment success in an environment similar to a utility box where population estimates could be reliably determined. We predicted that adult oriental cockroaches would readily consume the gel bait and that a subsequent reduction in population would be seen within a few days.
MATERIALS AND METHODS
Four sanitary sewer manholes infested with oriental cockroaches in Pleasanton were chosen as our study sites. Although it is rare for oriental cockroaches to be found in sewers in Alameda County, we took advantage of the accurate counting and visual estimation of cockroach populations that the long entry tubes of sewer manholes afforded. Cockroaches were found mostly near the top of the manhole and were quickly and easily counted with the aid of a bright flashlight. This type of estimation is not possible in a water meter box, where cockroaches often hide out of view along buried water pipes immediately after the box is opened. Beginning on June 20, 2016, we visually counted and recorded the number of adult and nymphal oriental cockroaches in each of the manholes. Three were treated with 30 grams of Maxforce® FC Roach Killer Bait Gel (Fipronil 0.01%), applied in a thin band along the upper rim of the manhole tube, just beneath the lid, on June 20 and 22. One was left untreated as a
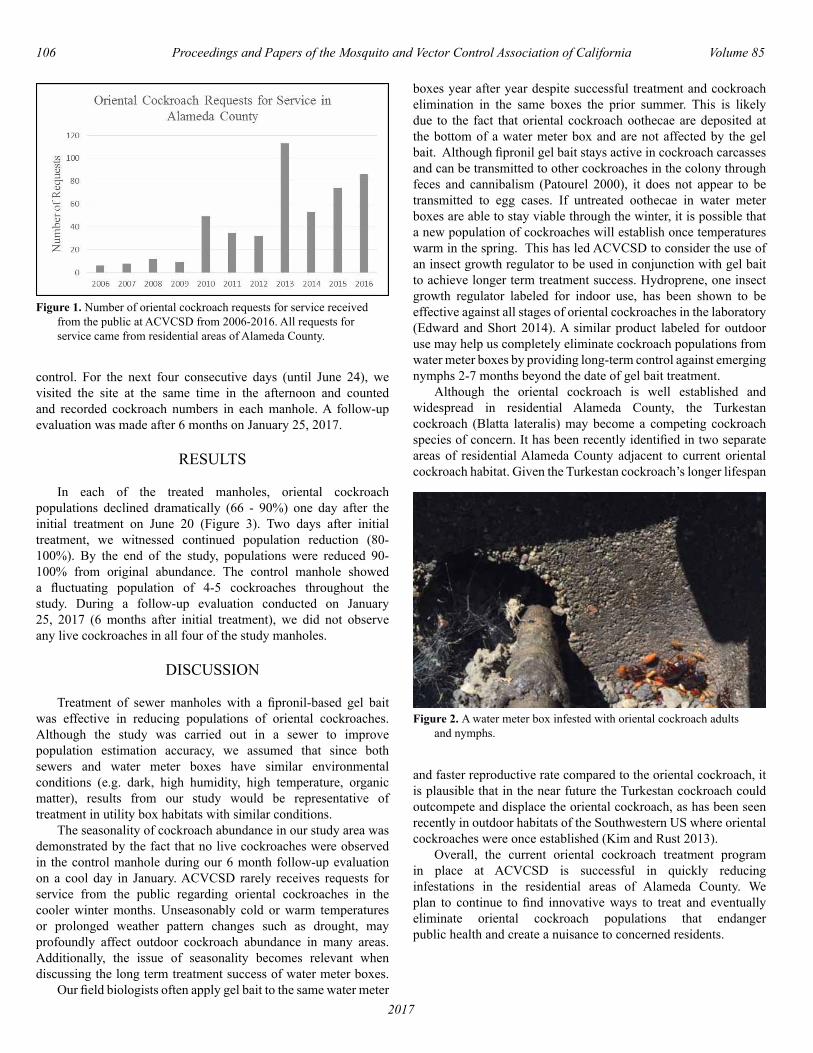
106 Proceedings and Papers of the Mosquito and Vector Control Association of California Volume 85
2017
control. For the next four consecutive days (until June 24), we visited the site at the same time in the afternoon and counted and recorded cockroach numbers in each manhole. A follow-up evaluation was made after 6 months on January 25, 2017.
RESULTS
In each of the treated manholes, oriental cockroach populations declined dramatically (66 - 90%) one day after the initial treatment on June 20 (Figure 3). Two days after initial treatment, we witnessed continued population reduction (80-100%). By the end of the study, populations were reduced 90-100% from original abundance. The control manhole showed a fluctuating population of 4-5 cockroaches throughout the study. During a follow-up evaluation conducted on January 25, 2017 (6 months after initial treatment), we did not observe any live cockroaches in all four of the study manholes.
DISCUSSION
Treatment of sewer manholes with a fipronil-based gel bait was effective in reducing populations of oriental cockroaches. Although the study was carried out in a sewer to improve population estimation accuracy, we assumed that since both sewers and water meter boxes have similar environmental conditions (e.g. dark, high humidity, high temperature, organic matter), results from our study would be representative of treatment in utility box habitats with similar conditions. The seasonality of cockroach abundance in our study area was demonstrated by the fact that no live cockroaches were observed in the control manhole during our 6 month follow-up evaluation on a cool day in January. ACVCSD rarely receives requests for service from the public regarding oriental cockroaches in the cooler winter months. Unseasonably cold or warm temperatures or prolonged weather pattern changes such as drought, may profoundly affect outdoor cockroach abundance in many areas. Additionally, the issue of seasonality becomes relevant when discussing the long term treatment success of water meter boxes. Our field biologists often apply gel bait to the same water meter
boxes year after year despite successful treatment and cockroach elimination in the same boxes the prior summer. This is likely due to the fact that oriental cockroach oothecae are deposited at the bottom of a water meter box and are not affected by the gel bait. Although fipronil gel bait stays active in cockroach carcasses and can be transmitted to other cockroaches in the colony through feces and cannibalism (Patourel 2000), it does not appear to be transmitted to egg cases. If untreated oothecae in water meter boxes are able to stay viable through the winter, it is possible that a new population of cockroaches will establish once temperatures warm in the spring. This has led ACVCSD to consider the use of an insect growth regulator to be used in conjunction with gel bait to achieve longer term treatment success. Hydroprene, one insect growth regulator labeled for indoor use, has been shown to be effective against all stages of oriental cockroaches in the laboratory (Edward and Short 2014). A similar product labeled for outdoor use may help us completely eliminate cockroach populations from water meter boxes by providing long-term control against emerging nymphs 2-7 months beyond the date of gel bait treatment. Although the oriental cockroach is well established and widespread in residential Alameda County, the Turkestan cockroach (Blatta lateralis) may become a competing cockroach species of concern. It has been recently identified in two separate areas of residential Alameda County adjacent to current oriental cockroach habitat. Given the Turkestan cockroach’s longer lifespan
and faster reproductive rate compared to the oriental cockroach, it is plausible that in the near future the Turkestan cockroach could outcompete and displace the oriental cockroach, as has been seen recently in outdoor habitats of the Southwestern US where oriental cockroaches were once established (Kim and Rust 2013). Overall, the current oriental cockroach treatment program in place at ACVCSD is successful in quickly reducing infestations in the residential areas of Alameda County. We plan to continue to find innovative ways to treat and eventually eliminate oriental cockroach populations that endanger public health and create a nuisance to concerned residents.
Figure 1. Number of oriental cockroach requests for service received from the public at ACVCSD from 2006-2016. All requests for service came from residential areas of Alameda County.
Figure 2. A water meter box infested with oriental cockroach adults and nymphs.

Volume 85 Proceedings and Papers of the Mosquito and Vector Control Association of California 107
2017
REFERENCES CITED
Alexander, J.B., J. Newton, and G.A. Crowe. 1991. Distribution of Oriental and German cockroaches, Blatta orientalis and Blattella germanica (Dictyoptera), in the United Kingdom. Med. Vet. Entomol. 5: 395-402.
Arnett Jr., R.H. 2000. American Insects: A Handbook of the Insects of America North of Mexico, 2nd ed. CRC Press, Boca Raton, FL.
Edwards, J.P. and J.E. Short. 1993. Elimination of a population of the Oriental cockroach (Dictyoptera: Blattidae) in a simulated domestic environment with the insect juvenile hormone analogue (S)-hydroprene. J. Econ. Entomol. 86: 436-443.
Fischer, O.A., L. Matlova, L. Dvorska, P. Svastova, and I. Pavlik. 2003. Nymphs of the Oriental cockroach (Blatta orientalis) as passive vectors of causal agents of avian tuberculosis and paratuberculosis. Med. Vet. Entomol. 17: 145-150.
Goddard, J. 2003. Physician's Guide to arthropods of Medical Importance. CRC Press, Boca Raton, FL.
Helm, R.M., D.L. Squillace, R.T. Jones, and R.J. Brenner. 1990. Shared allergenic activity in Asian (Blattella asahinai), German (Blattella germanica), American (Periplaneta americana), and Oriental (Blatta orientalis) cockroach species. Int. Arch. Allergy Immunol. 92: 154-161.
Jacobs, S. 2013. Oriental Cockroaches. http://ento.psu.edu/extension/factsheets/pdf/orientalcockroaches.pdf
Kim, T. and M.K. Rust. 2013. Life History and Biology of the Invasive Turkestan Cockroach (Dictyoptera: Blattidae). J. Econ. Entomol. 106: 2428-2432.
Kopanic Jr., R.J., B.W. Sheldon, and C.G. Wright. 1994. Cockroaches as vectors of Salmonella: laboratory and field trials. J. Food Prot. 57: 125-135.
Patourel, G. 1995. Effect of environmental conditions on progeny production by the oriental cockroach Blatta orientalis. Entomol. Exp. Appl. 74: 1-6.
Patourel, G. 2000. Secondary transmission of fipronil toxicity between oriental cockroaches Blatta orientalis L in arenas. Pest. Manag. Sci. 56: 732-736.
Robinson, W. H. 2005. Urban Insects and Arachnids: A Handbook of Urban Entomology. Cambridge University Press, New York, NY.
Short, J.E. and J.P. Edwards. 1991. Reproductive and developmental biology of the oriental cockroach Blatta orientalis (Dictyoptera). Med. Vet. Entomol. 5: 385-394.
Figure 3. Oriental cockroach population decline in treated manhole sites over the course of the study
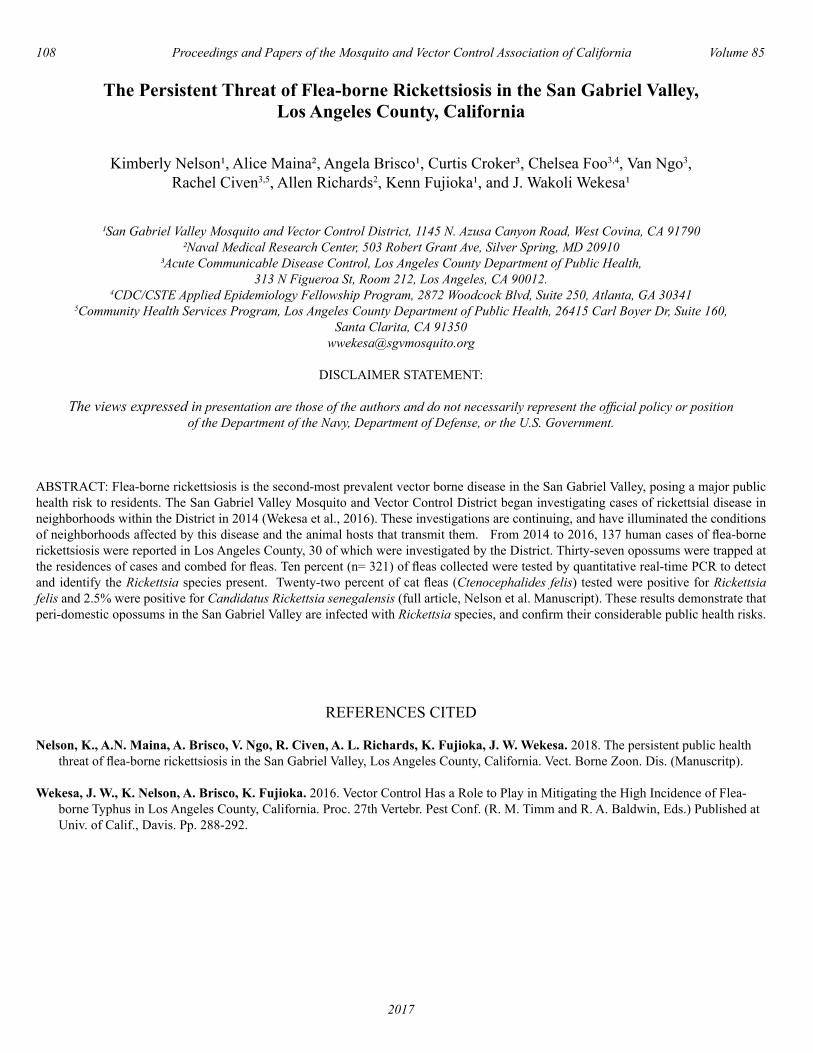
108 Proceedings and Papers of the Mosquito and Vector Control Association of California Volume 85
2017
The Persistent Threat of Flea-borne Rickettsiosis in the San Gabriel Valley, Los Angeles County, California
Kimberly Nelson¹, Alice Maina², Angela Brisco¹, Curtis Croker³, Chelsea Foo3,4, Van Ngo3,Rachel Civen3,5, Allen Richards2, Kenn Fujioka¹, and J. Wakoli Wekesa¹
¹San Gabriel Valley Mosquito and Vector Control District, 1145 N. Azusa Canyon Road, West Covina, CA 91790²Naval Medical Research Center, 503 Robert Grant Ave, Silver Spring, MD 20910
³Acute Communicable Disease Control, Los Angeles County Department of Public Health,313 N Figueroa St, Room 212, Los Angeles, CA 90012.
4CDC/CSTE Applied Epidemiology Fellowship Program, 2872 Woodcock Blvd, Suite 250, Atlanta, GA 30341 5Community Health Services Program, Los Angeles County Department of Public Health, 26415 Carl Boyer Dr, Suite 160,
Santa Clarita, CA [email protected]
DISCLAIMER STATEMENT:
The views expressed in presentation are those of the authors and do not necessarily represent the official policy or position
of the Department of the Navy, Department of Defense, or the U.S. Government.
ABSTRACT: Flea-borne rickettsiosis is the second-most prevalent vector borne disease in the San Gabriel Valley, posing a major public health risk to residents. The San Gabriel Valley Mosquito and Vector Control District began investigating cases of rickettsial disease in neighborhoods within the District in 2014 (Wekesa et al., 2016). These investigations are continuing, and have illuminated the conditions of neighborhoods affected by this disease and the animal hosts that transmit them. From 2014 to 2016, 137 human cases of flea-borne rickettsiosis were reported in Los Angeles County, 30 of which were investigated by the District. Thirty-seven opossums were trapped at the residences of cases and combed for fleas. Ten percent (n= 321) of fleas collected were tested by quantitative real-time PCR to detect and identify the Rickettsia species present. Twenty-two percent of cat fleas (Ctenocephalides felis) tested were positive for Rickettsia felis and 2.5% were positive for Candidatus Rickettsia senegalensis (full article, Nelson et al. Manuscript). These results demonstrate that peri-domestic opossums in the San Gabriel Valley are infected with Rickettsia species, and confirm their considerable public health risks.
REFERENCES CITED
Nelson, K., A.N. Maina, A. Brisco, V. Ngo, R. Civen, A. L. Richards, K. Fujioka, J. W. Wekesa. 2018. The persistent public health threat of flea-borne rickettsiosis in the San Gabriel Valley, Los Angeles County, California. Vect. Borne Zoon. Dis. (Manuscritp).
Wekesa, J. W., K. Nelson, A. Brisco, K. Fujioka. 2016. Vector Control Has a Role to Play in Mitigating the High Incidence of Flea- borne Typhus in Los Angeles County, California. Proc. 27th Vertebr. Pest Conf. (R. M. Timm and R. A. Baldwin, Eds.) Published at Univ. of Calif., Davis. Pp. 288-292.

Volume 85 Proceedings and Papers of the Mosquito and Vector Control Association of California 109
2017
Reverse Transcription Quantitative Polymerase Chain Reaction (RT-qPCR): Singleplexfor West Nile Virus and Multiplex for WNV, St. Louis and Western Equine
Encephalomyelitis Viruses
Tianyun Su
West Valley Mosquito and Vector Control District, 1295 E. Locust St., Ontario, CA 91761
Phone: (909) 635-0307; Email: [email protected]
ABSTRACT: A RT-qPCR (Reverse Transcription Quantitative Polymerase Chain Reaction) system was established, evaluated and applied at the WVMVCD, Ontario, California. Separate laboratories for sample preparation, PCR plate loading and PCR processing are highly recommended. The MagMAX RNA/DNA extraction station is highly efficient to process a large number of samples. The 7500 Fast Real Time PCR system demonstrated the advantages of short running time and consistent performance. The system consistently met the performance standards by CVEC/DART at University of California at Davis which set up the proficiency panel quality controls. The sequences of the primers and probes for WNV, SLEV and WEEV recommended by CVEC/DART showed desired sensitivity and specificity. The fluorescent dyes such as FAM (WNV), VIC (SLEV) and ABY (WEEV) identified the target well, and the lower Ct values as compared with other laboratories seemed to be related to use of the QSY quencher. This system is also amenable for detection of other arthropod-borne pathogens in biological specimens.
INTRODUCTION
Quantitative Polymerase Chain Reaction (qPCR) is recognized for its high specificity and sensitivity and has been extensively applied to detect trace amounts of genetic material such as deoxyribonucleic acid (DNA) and ribonucleic acid (RNA) in a wide variety of biological preparations. Detection of arthropod-borne pathogens in arthropods or vertebrate hosts by qPCR has advantages over traditional immunoassays in terms of enhanced specificity and sensitivity (Su and Cheng 2012). To obtain rapid test results, the West Valley Mosquito and Vector Control District (WVMVCD) acquired a 7500 Fast qPCR system from Applied Biosystems (Carlsbad, CA) to detect West Nile virus (WNV), Saint Louis encephalitis virus (SLEV) and Western equine encephalomyelitis virus (WEEV) infections in mosquito and dead bird specimens. Presented in this paper are laboratory space requirements and design, equipment, reagents, assay protocols and quality control for a qPCR system. The basic assay protocols (Brault et al. 2015) were adapted, evaluated and applied to detect WNV, SLEV and WEEV in mosquito and dead bird brain specimens, and satisfactory results were obtained in 2015-2016. Our established qPCR system will be adaptable for detection of other vector-borne pathogens, pesticide resistance testing, fauna identification and other purposes.
MATERIALS AND METHODS
Laboratory space Separate laboratories were designated for different tasks. Laboratory One was dedicated to mosquito specimen homogenization, centrifugation, loading extraction and elution plates, and RNA extraction. A biosafety hood with negative pressure was used to confine potentially pathogen
positive specimens. Laboratory Two was used to load PCR plates where a PCR bench with positive pressure (Horizontal Clean PCR Bench) was used to avoid contamination of PCR plates. Laboratory Three was dedicated to the PCR process.
Equipment and supplies The following essential equipment for a qPCR system was acquired from various sources: Tissue Disruptor Genie from Scientific Industries (Bohemia, NY); temperature regulated centrifuge (5424R), manual and electronic, as well as single and multi-channel micropipettes from Eppendorf (Hamburg, Germany); Class II Biosafety Hood and Horizontal Clean PCR Bench from Labconco (Kansas City, MO); MagMAX Express 96 extraction system and 7500 Fast Real Time PCR system, as well as consumables (96-well deep well plates, regular washing and elution plates, optical PCR plates) from Applied Biosystems (Carlsbad, CA). The PCR machine was calibrated for most commonly used dyes, particularly ones used in the probes for the targets described in this paper such as FAM, VIC, and ABY. Other minor equipment included PCR plate spinner (VWR, Radnor, PA), micro-centrifuge (Cole-Parmer, Vernon Hills, IL) and Vortex Mixer (Labnet, Edison, NJ). Reagents The reagents included: Lonza BioWhittaker Classic Cell Culture Media (VWR) for sample homogenization, analytical grade pure ethanol and isopropanol (VWR) for making washing solutions after lysis and binding, Ambion AMB1836-5 RNA extraction kit (Beads, lysis/binding enhancer, carrier RNA, lysis/binding concentrate, and washing solution concentrates, elution buffer) from Applied Biosystems for RNA extraction. TaqMan® Fast Virus 1-Step Master Mix, forward and reverse primers as well as probes were also purchased from Applied Biosystems for PCR. Information on primers and probes are presented in Table 1.
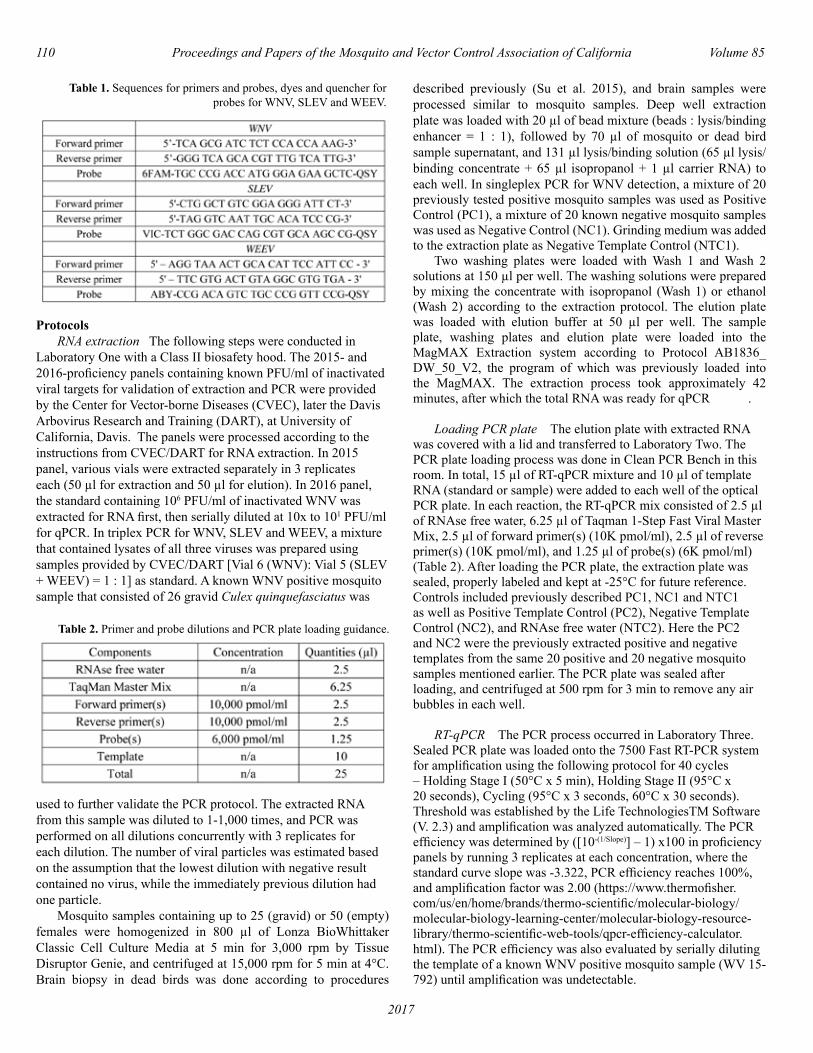
110 Proceedings and Papers of the Mosquito and Vector Control Association of California Volume 85
2017
Protocols RNA extraction The following steps were conducted in Laboratory One with a Class II biosafety hood. The 2015- and 2016-proficiency panels containing known PFU/ml of inactivated viral targets for validation of extraction and PCR were provided by the Center for Vector-borne Diseases (CVEC), later the Davis Arbovirus Research and Training (DART), at University of California, Davis. The panels were processed according to the instructions from CVEC/DART for RNA extraction. In 2015 panel, various vials were extracted separately in 3 replicates each (50 µl for extraction and 50 µl for elution). In 2016 panel, the standard containing 106 PFU/ml of inactivated WNV was extracted for RNA first, then serially diluted at 10x to 101 PFU/ml for qPCR. In triplex PCR for WNV, SLEV and WEEV, a mixture that contained lysates of all three viruses was prepared using samples provided by CVEC/DART [Vial 6 (WNV): Vial 5 (SLEV + WEEV) = 1 : 1] as standard. A known WNV positive mosquito sample that consisted of 26 gravid Culex quinquefasciatus was
used to further validate the PCR protocol. The extracted RNA from this sample was diluted to 1-1,000 times, and PCR was performed on all dilutions concurrently with 3 replicates for each dilution. The number of viral particles was estimated based on the assumption that the lowest dilution with negative result contained no virus, while the immediately previous dilution had one particle. Mosquito samples containing up to 25 (gravid) or 50 (empty) females were homogenized in 800 µl of Lonza BioWhittaker Classic Cell Culture Media at 5 min for 3,000 rpm by Tissue Disruptor Genie, and centrifuged at 15,000 rpm for 5 min at 4°C. Brain biopsy in dead birds was done according to procedures
described previously (Su et al. 2015), and brain samples were processed similar to mosquito samples. Deep well extraction plate was loaded with 20 µl of bead mixture (beads : lysis/binding enhancer = 1 : 1), followed by 70 µl of mosquito or dead bird sample supernatant, and 131 µl lysis/binding solution (65 µl lysis/binding concentrate + 65 µl isopropanol + 1 µl carrier RNA) to each well. In singleplex PCR for WNV detection, a mixture of 20 previously tested positive mosquito samples was used as Positive Control (PC1), a mixture of 20 known negative mosquito samples was used as Negative Control (NC1). Grinding medium was added to the extraction plate as Negative Template Control (NTC1). Two washing plates were loaded with Wash 1 and Wash 2 solutions at 150 µl per well. The washing solutions were prepared by mixing the concentrate with isopropanol (Wash 1) or ethanol (Wash 2) according to the extraction protocol. The elution plate was loaded with elution buffer at 50 µl per well. The sample plate, washing plates and elution plate were loaded into the MagMAX Extraction system according to Protocol AB1836_DW_50_V2, the program of which was previously loaded into the MagMAX. The extraction process took approximately 42 minutes, after which the total RNA was ready for qPCR .
Loading PCR plate The elution plate with extracted RNA was covered with a lid and transferred to Laboratory Two. The PCR plate loading process was done in Clean PCR Bench in this room. In total, 15 µl of RT-qPCR mixture and 10 µl of template RNA (standard or sample) were added to each well of the optical PCR plate. In each reaction, the RT-qPCR mix consisted of 2.5 µl of RNAse free water, 6.25 µl of Taqman 1-Step Fast Viral Master Mix, 2.5 µl of forward primer(s) (10K pmol/ml), 2.5 µl of reverse primer(s) (10K pmol/ml), and 1.25 µl of probe(s) (6K pmol/ml) (Table 2). After loading the PCR plate, the extraction plate was sealed, properly labeled and kept at -25°C for future reference. Controls included previously described PC1, NC1 and NTC1 as well as Positive Template Control (PC2), Negative Template Control (NC2), and RNAse free water (NTC2). Here the PC2 and NC2 were the previously extracted positive and negative templates from the same 20 positive and 20 negative mosquito samples mentioned earlier. The PCR plate was sealed after loading, and centrifuged at 500 rpm for 3 min to remove any air bubbles in each well.
RT-qPCR The PCR process occurred in Laboratory Three. Sealed PCR plate was loaded onto the 7500 Fast RT-PCR system for amplification using the following protocol for 40 cycles – Holding Stage I (50°C x 5 min), Holding Stage II (95°C x 20 seconds), Cycling (95°C x 3 seconds, 60°C x 30 seconds). Threshold was established by the Life TechnologiesTM Software (V. 2.3) and amplification was analyzed automatically. The PCR efficiency was determined by ([10-(1/Slope)] – 1) x100 in proficiency panels by running 3 replicates at each concentration, where the standard curve slope was -3.322, PCR efficiency reaches 100%, and amplification factor was 2.00 (https://www.thermofisher.com/us/en/home/brands/thermo-scientific/molecular-biology/molecular-biology-learning-center/molecular-biology-resource-library/thermo-scientific-web-tools/qpcr-efficiency-calculator.html). The PCR efficiency was also evaluated by serially diluting the template of a known WNV positive mosquito sample (WV 15-792) until amplification was undetectable.
Table 1. Sequences for primers and probes, dyes and quencher for probes for WNV, SLEV and WEEV.
Table 2. Primer and probe dilutions and PCR plate loading guidance.
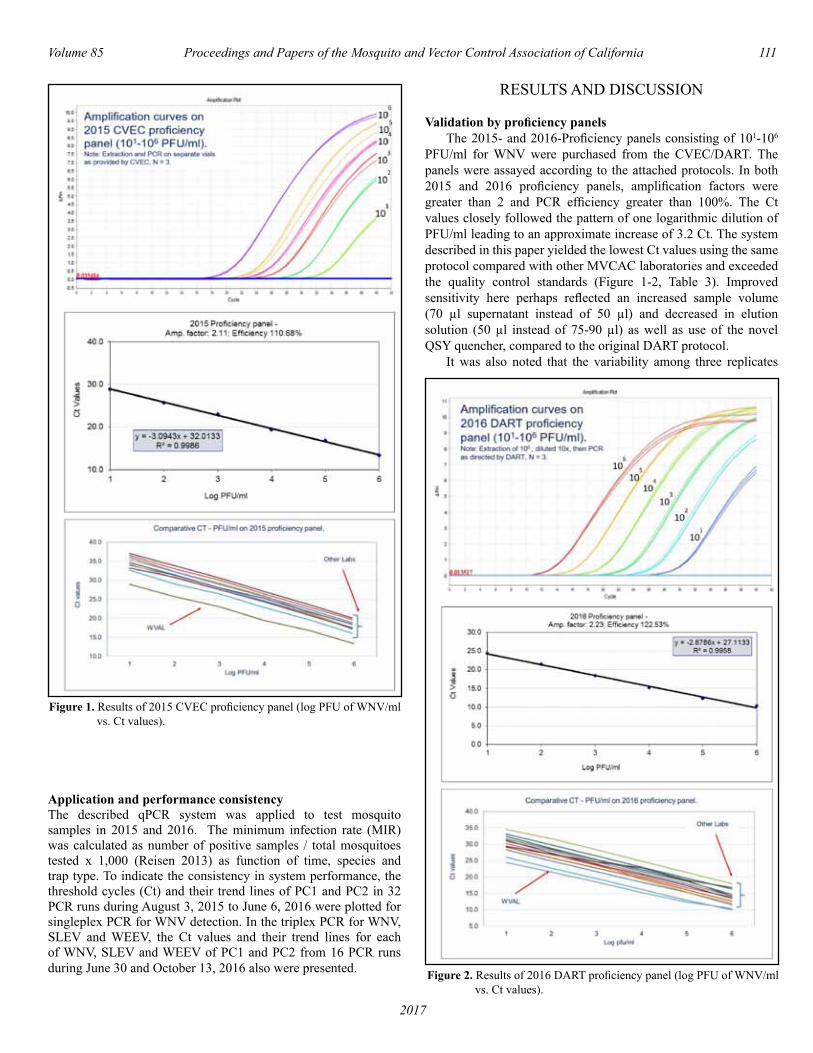
Volume 85 Proceedings and Papers of the Mosquito and Vector Control Association of California 111
2017
Application and performance consistencyThe described qPCR system was applied to test mosquito samples in 2015 and 2016. The minimum infection rate (MIR) was calculated as number of positive samples / total mosquitoes tested x 1,000 (Reisen 2013) as function of time, species and trap type. To indicate the consistency in system performance, the threshold cycles (Ct) and their trend lines of PC1 and PC2 in 32 PCR runs during August 3, 2015 to June 6, 2016 were plotted for singleplex PCR for WNV detection. In the triplex PCR for WNV, SLEV and WEEV, the Ct values and their trend lines for each of WNV, SLEV and WEEV of PC1 and PC2 from 16 PCR runs during June 30 and October 13, 2016 also were presented.
RESULTS AND DISCUSSION
Validation by proficiency panels The 2015- and 2016-Proficiency panels consisting of 101-106 PFU/ml for WNV were purchased from the CVEC/DART. The panels were assayed according to the attached protocols. In both 2015 and 2016 proficiency panels, amplification factors were greater than 2 and PCR efficiency greater than 100%. The Ct values closely followed the pattern of one logarithmic dilution of PFU/ml leading to an approximate increase of 3.2 Ct. The system described in this paper yielded the lowest Ct values using the same protocol compared with other MVCAC laboratories and exceeded the quality control standards (Figure 1-2, Table 3). Improved sensitivity here perhaps reflected an increased sample volume (70 µl supernatant instead of 50 µl) and decreased in elution solution (50 µl instead of 75-90 µl) as well as use of the novel QSY quencher, compared to the original DART protocol. It was also noted that the variability among three replicates
Figure 2. Results of 2016 DART proficiency panel (log PFU of WNV/ml vs. Ct values).
Figure 1. Results of 2015 CVEC proficiency panel (log PFU of WNV/ml vs. Ct values).

112 Proceedings and Papers of the Mosquito and Vector Control Association of California Volume 85
2017
at each dilution was greater in 2015 panel than in 2016 panel, which may be partially attributable to the fact that dilution occurred before extraction in 2015, but after extraction in 2016. The variability in Ct values reflected both extraction and PCR process in 2015, but only PCR process in 2016 (Figure 1-2). In development of the triplex for WNV, SLEV and WEEV, the extracted RNA from mixture of Vial 5 (SLEV + WEEV) : Vial 6 (WNV) = 1 : 1 (CVEC/DART panels) was diluted to 1 to
Figure 3. The standard curves for WNV, SLEV + WEEV and WNV + SLEV + WEEV when assayed by triplex in 2016, where three targets are dif ferentiated at various dilutions.
10,000 times for PCR. The three targets were well separated and Ct values approximately reflected the dilution factors (Figure 3). The dyes (FAM, VIC and ABY) and QSY quencher showed great stability, sensitivity and specificity during two years of testing. Validation by positive template from a mosquito sample The extracted RNA from WNV positive mosquito sample 15-792 (26 gravid Cx. quinquefasciatus) was diluted 1 to 1,000

Volume 85 Proceedings and Papers of the Mosquito and Vector Control Association of California 113
2017
times, where the Ct values well reflected the dilution factor, i.e. approximately 3.2 increase in Ct values in response to each 10-fold dilution. The amplification factor and efficiency exceeded the standards listed in Table 3. The estimated number of WNV particles in the mosquito sample was 57,143.
Application Mosquito pools In 2015, 1,754 mosquito samples were tested, and 273 WNV positives were identified (15.6%). Ct values during warmer months were generally lower than during colder moths. The main reason for lower Ct values during warmer months is that virus replication is faster when mosquitoes are at warmer temperatures and there is less probability of collecting individuals that have not had a chance for virus replication. The positive samples prevailed during weeks 23 – 49, with a peak
in week 33 (MIR = 28.7). The MIR was much higher in Culex quinquefasciatus (7.23) and Cx. stigmatosoma (6.39) than in Cx. tarsalis (2.44) and Cx. erythrothorax (2.06). Samples collected by gravid traps (8.55) had more than double the MIR than CO2 traps (4.11), and this was attributable to the fact that gravid mosquitoes have had at least one blood meal previously, hence a greater chance of viral infection (Figure 6). In 2016, 76 WNV positive samples were identified from 2,897 pools (2.6%). Lower Ct values were also seen during hotter months, but not as profound as in 2015. This might be related in part to smaller number of positive samples in 2016 than in 2015. The positive samples prevailed mainly during weeks 18 – 45, with peak in week 34 (MIR = 4.79). Culex quinquefasciatus
Figure 4. Relationship of dilution of extraction and Ct values in WNV positive mosquito sample 15-792.
Figure 5. Seasonal pattern of mean Ct values for WNV positive mosquito samples in 2015 and 2016 (Poly. = Polynomial at degree 3 curve fit to show the general trend).
Figure 6. Minimum infection rate (MIR) as a function of time in weeks, mosquito species and trap types in 2015 and 2016.
(1.60) showed a much higher minimum infection rate than Cx. tarsalis (0.52) and Cx. erythrothorax (0.11). In in 2015. samples collected by gravid traps (2.55) had much higher infection rate than those collected by CO2 traps (0.45) (Figure 6).
Dead birds In 2015, 18 dead bird brain biopsy samples were tested and five (1 finch, 1 kestrel, 3 American crows) were positive for WNV, with Ct = 16.77 – 30.28. In 2016, 2 of 16 dead birds (American crows) tested positive for WNV, with Ct values of 9.83 and 11.68. It was realized again that sampling brain tissues from dead bird carcasses was advantageous over other tissues (Su et al. 2015). The brain tissue was protected within the skull
Table 3. Quality control parameters of RT-qPCR.
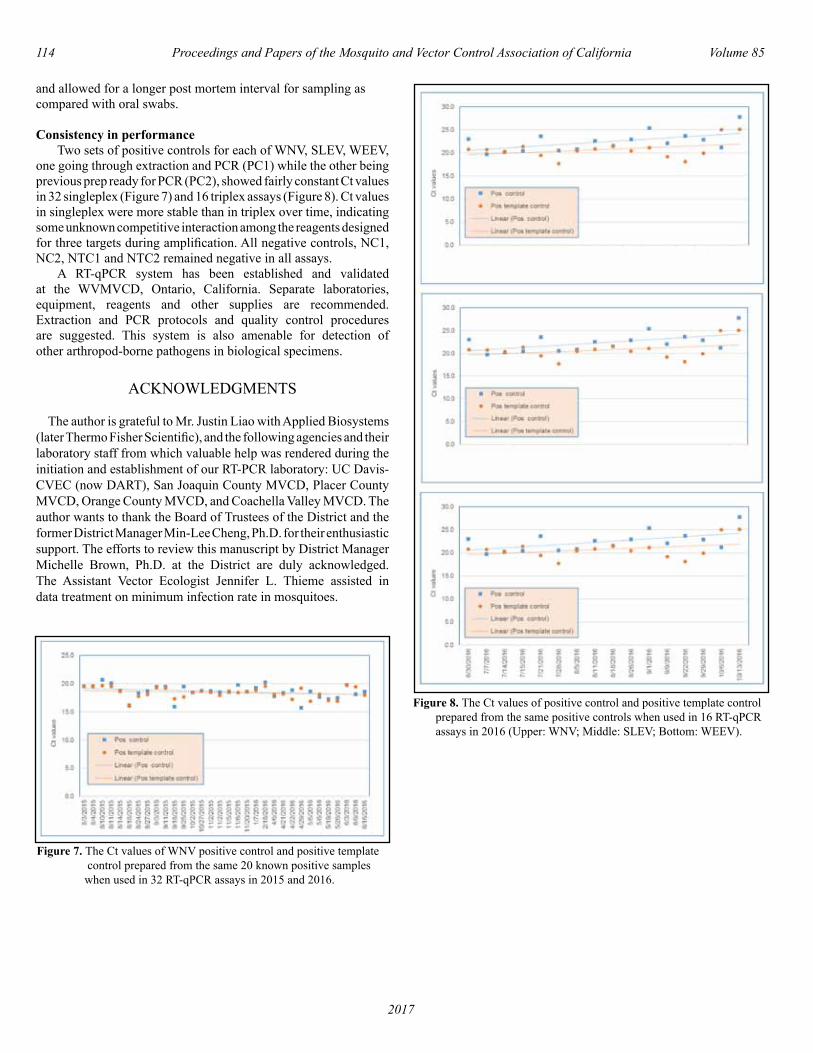
114 Proceedings and Papers of the Mosquito and Vector Control Association of California Volume 85
2017
Figure 7. The Ct values of WNV positive control and positive template control prepared from the same 20 known positive samples when used in 32 RT-qPCR assays in 2015 and 2016.
and allowed for a longer post mortem interval for sampling as compared with oral swabs.
Consistency in performance Two sets of positive controls for each of WNV, SLEV, WEEV, one going through extraction and PCR (PC1) while the other being previous prep ready for PCR (PC2), showed fairly constant Ct values in 32 singleplex (Figure 7) and 16 triplex assays (Figure 8). Ct values in singleplex were more stable than in triplex over time, indicating some unknown competitive interaction among the reagents designed for three targets during amplification. All negative controls, NC1, NC2, NTC1 and NTC2 remained negative in all assays. A RT-qPCR system has been established and validated at the WVMVCD, Ontario, California. Separate laboratories, equipment, reagents and other supplies are recommended. Extraction and PCR protocols and quality control procedures are suggested. This system is also amenable for detection of other arthropod-borne pathogens in biological specimens.
ACKNOWLEDGMENTS
The author is grateful to Mr. Justin Liao with Applied Biosystems (later Thermo Fisher Scientific), and the following agencies and their laboratory staff from which valuable help was rendered during the initiation and establishment of our RT-PCR laboratory: UC Davis-CVEC (now DART), San Joaquin County MVCD, Placer County MVCD, Orange County MVCD, and Coachella Valley MVCD. The author wants to thank the Board of Trustees of the District and the former District Manager Min-Lee Cheng, Ph.D. for their enthusiastic support. The efforts to review this manuscript by District Manager Michelle Brown, Ph.D. at the District are duly acknowledged. The Assistant Vector Ecologist Jennifer L. Thieme assisted in data treatment on minimum infection rate in mosquitoes.
Figure 8. The Ct values of positive control and positive template control prepared from the same positive controls when used in 16 RT-qPCR assays in 2016 (Upper: WNV; Middle: SLEV; Bottom: WEEV).
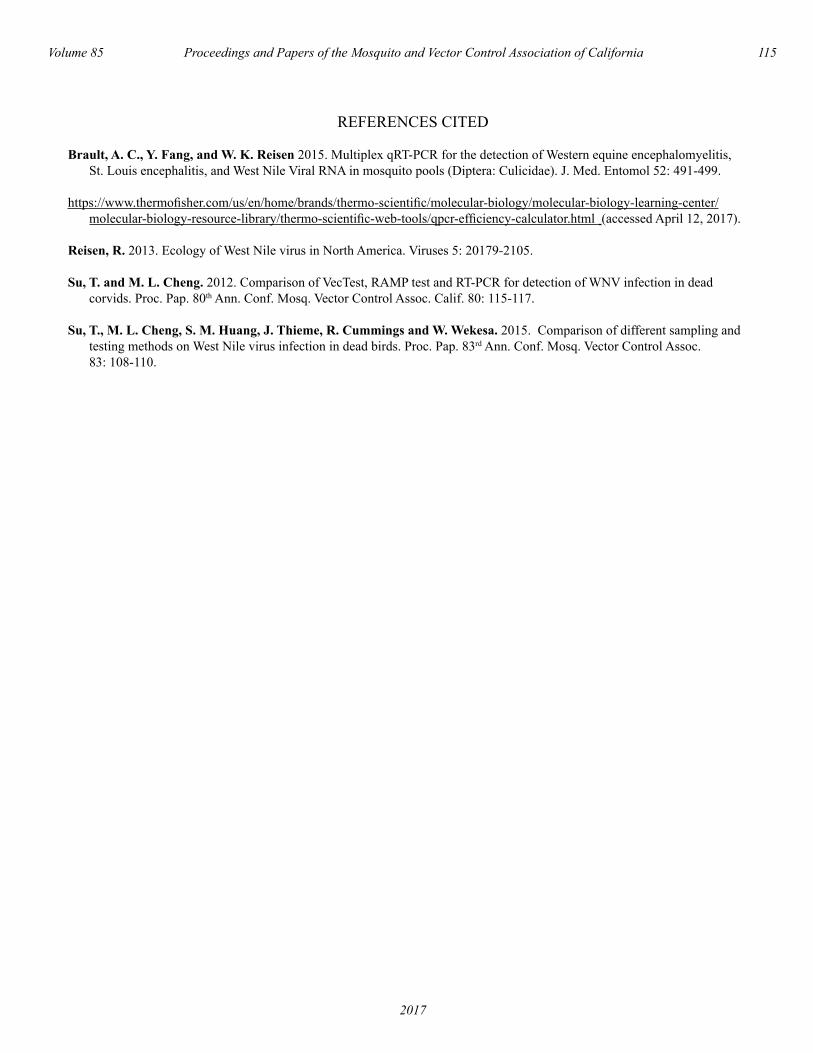
Volume 85 Proceedings and Papers of the Mosquito and Vector Control Association of California 115
2017
REFERENCES CITED
Brault, A. C., Y. Fang, and W. K. Reisen 2015. Multiplex qRT-PCR for the detection of Western equine encephalomyelitis, St. Louis encephalitis, and West Nile Viral RNA in mosquito pools (Diptera: Culicidae). J. Med. Entomol 52: 491-499.
https://www.thermofisher.com/us/en/home/brands/thermo-scientific/molecular-biology/molecular-biology-learning-center/ molecular-biology-resource-library/thermo-scientific-web-tools/qpcr-efficiency-calculator.html (accessed April 12, 2017).
Reisen, R. 2013. Ecology of West Nile virus in North America. Viruses 5: 20179-2105.
Su, T. and M. L. Cheng. 2012. Comparison of VecTest, RAMP test and RT-PCR for detection of WNV infection in dead corvids. Proc. Pap. 80th Ann. Conf. Mosq. Vector Control Assoc. Calif. 80: 115-117.
Su, T., M. L. Cheng, S. M. Huang, J. Thieme, R. Cummings and W. Wekesa. 2015. Comparison of different sampling and testing methods on West Nile virus infection in dead birds. Proc. Pap. 83rd Ann. Conf. Mosq. Vector Control Assoc. 83: 108-110.

116 Proceedings and Papers of the Mosquito and Vector Control Association of California Volume 85
2017
Current Status of West Nile virus Dead Bird Surveillance Programs in the United States
Leslie Foss1 and Kerry Padgett1
1California Department of Public Health, Vector-Borne Disease Section850 Marina Bay Parkway
Richmond, California [email protected]
ABSTRACT: Now endemic throughout North America, West Nile virus (WNV) is closely associated with avian mortality, particularly with dead crows. The virus is maintained in avian reservoirs and is transmitted to birds and humans primarily by Culex spp. mosquitoes. WNV dead bird testing is an important component of WNV surveillance, and along with mosquito surveillance, focuses mosquito control efforts in time and place. Nevertheless, dead bird testing has decreased since the initial spread of WNV. Herein, we investigated WNV surveillance practices in each state to better understand the role of dead bird testing in WNV surveillance today. Thirty-three out of the 48 contiguous states with WNV (Alaska and Hawaii have not detected WNV) currently test dead birds for WNV surveillance, although involvement ranges from occasional testing to large-scale integrated testing efforts accompanied by public outreach. After speaking with officials from 47 continental states, the authors conclude that despite limited resources and diminished interest, dead birds remain a useful WNV surveillance tool in many U.S. states.
INTRODUCTION
West Nile virus (WNV) (Flaviviridae: Flavivirus) was first introduced to the United States in 1999 into the New York City area. Avian morbidity and mortality were the first signs of this novel pathogen in North America (Komar et al. 2001), followed by human cases involving febrile illness or encephalitis (Lanciotti et al. 1999). WNV is now considered endemic in North America, having spread across the continent to California within 4 years. The virus is transmitted via ornithophilic mosquitoes (primarily Culex spp.) to wild bird hosts in a bird-mosquito-bird cycle; humans and horses can become ill but are considered “dead-end hosts.” Since 1999, WNV-positive dead birds and mosquitoes have helped to determine both the time and place with high risk of WNV transmission to humans, and dead bird reporting and testing has become a cornerstone of WNV surveillance and public outreach (Eidson et al. 2001; Mostashari et al. 2001). In advance of the westward spread of WNV, each state created or enhanced existing arbovirus surveillance by adding WNV testing, many by incorporating dead bird surveillance. California’s WNV surveillance program is a close collaboration between the California Department of Public Health, local vector control and environmental agencies, and the University of California, Davis (McCaughey et al. 2003). Dead birds were tested in California as early as 2001. In 2003, WNV was first detected in mosquitoes in Southern California followed by sentinel chickens in nearby areas. The first positive dead bird (an American Crow, Corvus brachyrhynchos) was collected in Los Angeles County in September 2003 (Hom et al. 2004). After nearly two decades since WNV was introduced into the continental United States, the recurrence of WNV in the mosquito-bird life cycle each spring and summer is expected in most states; however, knowing when and where outbreaks will occur, as well as their intensity, is largely unpredictable (Reisen 2013). Continued enhanced WNV surveillance is necessary to support focused mosquito control efforts and public education as humans are at continued risk of WNV exposure in many regions of the U.S. In
2015, there were 2,175 WNV human cases reported nationwide from 41 states and the District of Columbia (Krow-Lucal et al. 2017). Our objective was to assess current WNV dead bird surveillance practices in the continental United States. We surmised that many states were no longer testing birds due to resource limitations. Of those states with WNV dead bird surveillance, we investigated their surveillance program components, including prioritization and funding, seasonal duration, bird species collected, the degree of agency and public interest, and future plans and projections.
METHODS
States were divided into four regions (Northeast, Midwest, Southeast/Southern, and Western) loosely based on U.S. Census Bureau designations (U.S. Census Bureau 2017). We visited the websites of state and county health, environmental health, agriculture, fish and wildlife, and vector control departments to find the entities that conduct WNV surveillance. Because dead bird surveillance depends on public participation, state and county websites were indicators of the involvement of that state in dead bird surveillance. We searched state websites with a focus on dead bird reporting and testing news, instructions, and data. In most cases, a phone call or calls were made to the agencies spearheading WNV surveillance in the state. We spoke to professionals including biologists, entomologists, epidemiologists, and managers about their current WNV dead bird surveillance practices and future plans. Tables were compiled noting the status of each state’s program, whether or not it has been reduced or discontinued, and reasons for the changes. We also assigned a “1” to the state if the source indicated that dead bird surveillance added unique information important to disease control efforts, “2” if dead bird surveillance is supplementary in the state and useful if resources are available, or “3”, if the source explained that dead bird surveillance is no longer conducted because WNV is endemic (and the source reports that dead birds do not supply additional information).

Volume 85 Proceedings and Papers of the Mosquito and Vector Control Association of California 117
2017
RESULTS
As of May 2017, 33 of 48 contiguous states monitor dead bird reports and/or conducted WNV dead bird surveillance testing in the United States, including California (Table 1). Eighteen of these states utilize this surveillance tool more extensively (Table 2). Of these, five states maintain a hotline or specific phone number(s) for residents to call to report dead birds and seven states offer an online reporting portal. Overall, in 15 states dead bird surveillance adds unique information important to disease control efforts; in 21 states it is a useful yet supplementary tool employed if resources are available; and in 12 states dead bird surveillance was discontinued (Table 1, column 2).
Northeast Region: Pennsylvania is the only state in the northeast region that currently conducts WNV dead bird testing (Tables 1 and 2). Dead bird reports from the public are encouraged and a maximum of five dead birds in each county are collected for potential testing each week. Of the other states in the Northeast region, some state websites provided information about why dead bird testing was discontinued: Connecticut terminated dead bird testing in 2005 because public reporting volume dropped sharply during the 2004-5 season; Massachusetts and New Hampshire cited that dead bird testing became less useful in monitoring WNV activity; in New Jersey, dead bird testing remains available by special request only; and Vermont terminated dead bird testing in 2012 due to decreased federal funding.
Midwest Region: Five states in the Midwest region test dead birds as part of WNV surveillance (Tables 1 and 2). To preserve resources, some states established testing limits. In Illinois, dead bird testing is discontinued at the county level after one to two positive dead birds are confirmed. In Illinois Cook County (includes Chicago) dead birds are an important component of WNV surveillance. Cook County’s mosquito populations are monitored and controlled by four mosquito abatement districts, and the area is populated with corvids and other susceptible bird species. In Wisconsin, dead bird testing is discontinued in a given county after one positive bird is confirmed. Nebraska will stop testing in a given county after WNV is detected in a dead bird or mosquito sample. In Michigan, dead bird reports are monitored and birds are tested with the help of citizens who are willing to drop off the carcasses at their local Department of Natural Resources. Among other Midwestern states, a source from Indiana explained that dead bird testing was discontinued because their robust mosquito testing program is sufficient, given their comparatively low levels of WNV activity and low human incidence.
Southeast/Southern Region: South Carolina’s WNV surveillance program emphasizes dead bird testing and encourages the public to report dead birds (Tables 1 and 2). The South Carolina Department of Health and Environmental Control website features bird identification, a surveillance map, and photos and descriptions of common local birds. Four other states in the southeast and southern regions test dead
birds for WNV: Georgia, Tennessee, Texas, and West Virginia. However, dead bird testing (as well as mosquito testing) is limited to select metropolitan areas where WNV is more prevalent. Among other states in the Southeast/Southern region, three state websites (Louisiana, Mississippi, and Oklahoma) recognized past dead bird testing for WNV and cite that the endemic status of the virus negates the need to test dead birds to monitor WNV activity. Instead they rely primarily on mosquito testing. West Nile virus surveillance programs in Florida and Delaware use sentinel chickens to monitor the virus. In Delaware, sentinel chickens are the preferred WNV surveillance tool because chicken flocks are immobile, providing specific location data. The public is encouraged to report dead birds via two advertised phone numbers, and suitable select dead bird species are tested. However, dead birds are viewed as confirmatory data, rather than indicator (chicken) data.
Western Region: In the Western region, Oregon is active in WNV dead bird surveillance (Tables 1 and 2). In 2016, 12 dead birds from three counties (denominator unknown) tested positive for WNV. A source in Oregon said that dead bird testing not only provides WNV tracking data, but also serves to replace mosquito testing in parts of Oregon where mosquito surveillance is not possible due to funding and staffing limitations. Colorado tests corvids and raptors in some counties. Due to their susceptibility to WNV, raptors are useful in Colorado, acting as ecological indicators in expansive areas where mosquito testing would not be possible. The Idaho Department of Fish and Game records dead bird reports but seldom tests birds for WNV. California’s WNV surveillance program (which we are a part of) includes a WNV and dead bird hotline and website, dead bird testing, and mosquito and sentinel chicken testing. The program also experienced funding decreases and in September 2013 year-round hotline staffing and dead bird necropsies for WNV testing were eliminated. Modifications were made; the hotline is now staffed seasonally from April to October, and dead birds are tested using an alternative method.
Dead Bird Data from other Sources: Another subset of states no longer test dead birds as part of WNV surveillance, but may acquire avian necropsy or testing results voluntarily from partnering federal or local agencies. Sources from Arizona, Kentucky, and Missouri verified they acquire dead bird data passively from other agencies such as the state Department of Natural Resources. As expected, a review of the United States Geological Survey website (United States Geological Survey 2016) provided 2016 positive dead bird data in states that conduct WNV dead bird surveillance. However, positive dead birds were also reported from Arizona, Florida, Maryland, Washington, and Wyoming; these carcasses may have been tested under special circumstances or as part of a research study.
DISCUSSION
Many factors created the current mosaic of dead bird testing in the United States. States are operating arbovirus surveillance programs with limited resources, and earlier funding provided

118 Proceedings and Papers of the Mosquito and Vector Control Association of California Volume 85
2017
by the U.S. Centers for Disease control and Prevention (CDC) through Epidemiology and Laboratory Capacity (ELC) grants has been reduced. Some sources said they would like to be more active in WNV testing; in the past, positive dead birds were predictive of human cases, but the implementation of such a program was no longer possible. Many states that do not conduct dead bird testing conduct some degree of mosquito trapping and testing and monitor human cases. Equine cases are often monitored as well, and sentinel chicken testing is used in six states. California, Illinois, Michigan, and Wisconsin maintain the most active state WNV hotlines that the public can call to find out more about WNV or to report a dead bird. One reason for maintenance of a dead bird surveillance program may be that California and those upper Midwest states experience relatively high WNV activity compared to their neighboring states and therefore need to conduct more active surveillance for intervention decision support. States with less extensive dead bird testing programs are nonetheless able to operate by advertising the need for dead bird reports via press articles every spring or early summer about mosquito awareness and bite prevention. These timely articles may encourage residents to call their local health department to report dead birds. Newspapers, online news, and social media help galvanize public participation in dead bird reporting (Foss and Padgett 2015). Many states lack an arbovirus program coordinated under one agency. Environmental health, public health, and occasionally fish and wildlife departments may help to carry out surveillance activities in addition to other duties. Vector control agencies may exist in cities, but there may not be any vector control coverage in rural areas. Sparse human population may negate the need for multiple WNV surveillance elements, such as in Indiana, Nevada, and Montana. Some also argue that adding dead bird surveillance would not help to track WNV activity in less populated regions (even if human WNV incidence may be high) because there are few people to find and report dead birds. Factors such as bird species and locally endemic mosquito vectors present, and past WNV activity, are also considered. Historically high incidence of human WNV should influence surveillance practices as well. Each state grapples with a unique set of public health issues and must allocate resources appropriately to address them. For example, local transmissions of Zika virus in Florida and Aedes aegypti control in all affected states was top priority in 2016. The arrival of Zika in North America has renewed general interest in mosquito monitoring and control; this heightened vigilance may confer benefits to surveillance for other mosquito-borne viruses. Many state public health officials indicated that renewed interest in mosquito monitoring in their state had extended to other species besides Aedes mosquitoes such as Culex (vectors of WNV, Eastern and Western encephalitis viruses, and St. Louis encephalitis virus). West Nile virus surveillance in the United States has transitioned beyond initial discovery and response, to routine monitoring of a now endemic virus. For many public health departments, WNV is one of several vector-borne diseases of concern and its surveillance is conducted as time and resources permit. In our experience, testing dead birds as part of WNV surveillance is a valuable tool to detect the virus early in the season, to track amplification, and to discover virus in areas not routinely sampled for mosquitoes. Initially, we expected to find that the decrease in dead bird surveillance in the
United States was the result of decreased funding. We found that, indeed, about a quarter of states are not conducting and do not want to reinstate dead bird testing for various reasons; the most common reasons cited were funding constraints, the fact that WNV was now endemic, and (in personal communications) that it was too labor intensive to pick up dead birds. Officials in the remaining states affirmed that it is a useful surveillance tool and they perform dead bird testing either as supplementary data, or as a key component of their WNV tracking and response program. The wide range of involvement in dead bird testing detailed in this study highlights the diversity of WNV disease ecology in different landscapes as well as that of city and state approaches to arbovirus surveillance.
ACKNOWLEDGEMENTS
The authors thank interviewees from numerous states for providing information about their WNV surveillance programs. We thank CDPH Vector-Borne Disease Section staff, the UC Davis Arbovirus Research and Training laboratory, and the Mosquito and Vector Control Association of California for their contributions and collaboration in the California WNV dead bird surveillance program. In addition, this study was supported in-part by the Epidemiology and Laboratory Capacity for Infectious Diseases Cooperative Agreement number 5 NU50CK000410-03 from the US Centers for Disease Control and Prevention.
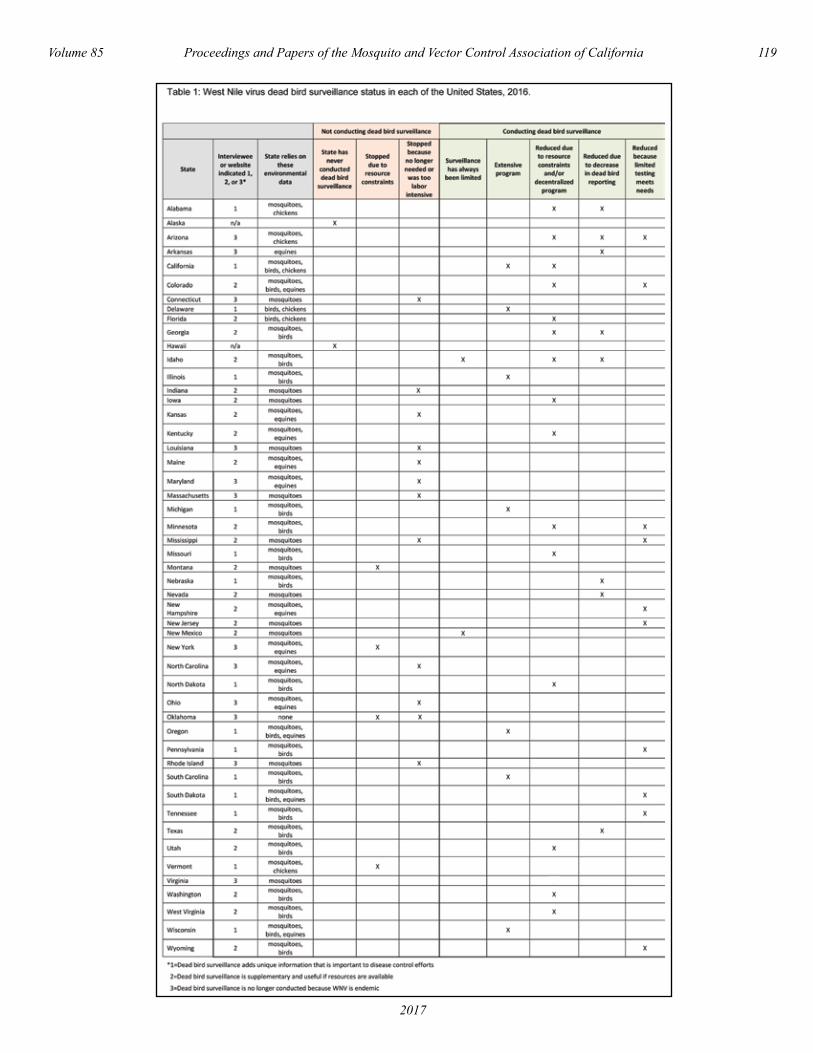
Volume 85 Proceedings and Papers of the Mosquito and Vector Control Association of California 119
2017

120 Proceedings and Papers of the Mosquito and Vector Control Association of California Volume 85
2017
Volume 85 Proceedings and Papers of the Mosquito and Vector Control Association of California 121
2017
REFERENCES
Eidson M., N. Komar, F. Sorhage, R. Nelson, T. Talbot, F. Mostashari, R. McLean, and the WNV Avian Mortality Surveillance Group. 2001. Crow deaths as a sentinel surveillance system for West Nile virus in the northeastern United States, 1999. Emerg. Infect. Dis. 7:615–620.
Foss L., and K. Padgett. 2016. Public usage of the West Nile virus dead bird hotline and website in 2015. Proc. Mosq. Vector Control Assoc. Calif. 84:37-42.
Hom A., A.B. Houchin, K. McCaughey, V.L. Kramer, R.E. Chiles, W.K. Reisen, E.H. Tu, C. Glaser, C. Cossen, E. Baylis, B. Eldridge, B. Sun, et al. 2004. Surveillance for mosquito borne encephalitis virus activity and human disease, including West Nile virus in California, 2003. Proc. Mosq. Vector Control Assoc. Calif. 72:33-47.
Komar N, N.A. Panella, J.E. Burns, S.W. Dusza, T.M. Mascarenhas, and T.O. Talbot. 2001. Serologic evidence for West Nile virus infection in birds in the New York City vicinity during an outbreak in 1999. Emerg. Infect. Dis. 7:621-625.
Krow-Lucal E., N.P. Lindsey, J. Lehman, M. Fischer, and J.E. Staples. 2017. West Nile virus and other nationally notifiable arboviral diseases — United States, 2015. MMWR Morb. Mortal Wkly Rep. 66:51–55. DOI: http://dx.doi.org/10.15585/mmwr.mm6602a3.
Lanciotti R., S. Roehrig, J.T. Deubel, V. Smith, J. Parker, M. Steels, K. Crise, B. Volpe, K.E. Crabtree, M.B. Scherret, J.H. Hall, R.A. MacKenzie, et al. 1999. Origin of the West Nile virus responsible for an outbreak of encephalitis in the northeastern United States. Science 286:2333-2337.
McCaughey K, S.Q. Miles, L. Woods, R.E. Chiles, A. Hom, V.L. Kramer, M. Jay-Russell, B. Sun, W.K. Reisen, T. Scott, L. Hui, D. Steinlein, et al. 2003. The California West Nile virus dead bird surveillance program. Proc. Mosq. Vector Control Assoc. Calif. 71:38-43.
Mostashari F., M. Kulldorff, J. Hartman, J. Miller, and V. Kulaserkera. 2003. Dead bird clusters as an early warning system for West Nile virus activity. Emerg. Infect. Dis. 9:641-646.
Reisen, W.K. 2013. Ecology of West Nile virus in North America. Viruses 5:2079-2105.
United States Census Bureau 2017. https://www2.census.gov/geo/pdfs/maps-data/maps/reference/us_regdiv.pdf. Last accessed May 2017.
United States Geological Survey 2016. Arbovirus surveillance maps. https://diseasemaps.usgs.gov/mapviewer/. Last accessed May 2017.