Procedure of submersible equipment reliability measurement ...
17
This paper was prepared for presentation at the 2005 Society of Petroleum Engineers - Gulf Coast Section Electric Submersible Pump Workshop held in Houston, Texas 27-29 April 2005. This paper was selected for presentation by the ESP Workshop Panels (Rotating and Permanent) following review of information contained in an abstract submitted by the author(s). Contents of the paper, as presented, have not been reviewed by the ESP Workshop Panels and are subject to correction by the author(s). The material, as presented, does not necessarily reflect any position of the ESP Workshop or its panel members. The author(s) retain copyright to this paper and have given permission to the ESP Workshop to publish it in proceedings (electronic and hardcopy). Any other electronic reproduction, distribution, or storage of any part of this paper for commercial purposes without the written consent of the author(s) is prohibited. A procedure of submersible equipment reliability measurement by incomplete operational data has been suggested by Novomet. Its algorithm is based on a combination of computational methods of the nonparametric statistics ensuring high accuracy of the reliability calculation and methods of the parametric statistics that allow forecasting the equipment performance. For the first time we had the opportunity to apply objective methods of mathematical statistics to measure submersible equipment reliability, to find weak components of a unit and main operational mistakes when using ESP installations. As an example of the procedure implementation we did a comparative analysis of the reliability of the equipment made by Russian and leading American companies and run in the Western Siberia. Operational properties of submersible equipment are characterized by two groups of parameters. The first group includes discharge head, performance and power consumption. The second group defines the ability of the equipment to keep the above-mentioned values during operation, that is, reliability. Both groups are equally important in describing operational properties. Therefore, it is necessary to have valid measurement procedures for both parameters. Today it is an accepted practice to measure the parameters of the first group on the test bench, while the parameters of the second group are evaluated in working conditions. It is possible to measure equipment reliability in bench tests, but these bench (i.e. accelerated) tests can only approximately imitate the real working conditions and, therefore, they are not attractive. In the present work we limit ourselves to considering the problem of reliability measurement in working conditions. Failures are stochastic; therefore the characteristics of submersible equipment reliability can be obtained using the probability theory, to be more precise, its part – mathematical statistics. However, in practice of the oil production industry ubiquitous are such empirical characteristics as “overhaul period” and “mean time between failures” [1]. These characteristics have the following drawbacks: 1. They are not stochastic, which contradicts the nature of the characterized process. 2. They artificially limit the volume of data subject to analysis to one year. 3. The precision of the reliability measurement is not defined, so the proper comparison of the obtained results is not possible. Therefore, the Novomet Company has developed a procedure based on the probability theory that allows realizing submersible equipment reliability measurement by operational data. The procedure has been implemented in a number of oil companies of the Western Siberia (Russia). Procedure of the reliability measurement. In accordance with the accepted approach of the reliability theory [2], we will divide the operational data about the equipment operating time into two groups. To the first group we refer the operating time that ended in failure, meaning every case of irreversible work stoppage. This operating time will be called complete. Procedure of submersible equipment reliability measurement and experience of its implementation Perelman O.M., Peshcherenko S.N., Rabinovich A.I., Slepchenko S.D - Closed SJC Novomet, Perm, Russia
Transcript of Procedure of submersible equipment reliability measurement ...
This paper was prepared for presentation at the 2005 Society of Petroleum Engineers - Gulf Coast Section Electric Submersible Pump Workshop held in Houston, Texas 27-29 April 2005. This paper was selected for presentation by the ESP Workshop Panels (Rotating and Permanent) following review of information contained in an abstract submitted by the author(s). Contents of the paper, as presented, have not been reviewed by the ESP Workshop Panels and are subject to correction by the author(s). The material, as presented, does not necessarily reflect any position of the ESP Workshop or its panel members. The author(s) retain copyright to this paper and have given permission to the ESP Workshop to publish it in proceedings (electronic and hardcopy). Any other electronic reproduction, distribution, or storage of any part of this paper for commercial purposes without the written consent of the author(s) is prohibited.
A procedure of submersible equipment reliability measurement by incomplete operational data has been suggested by Novomet. Its algorithm is based on a combination of computational methods of the nonparametric statistics ensuring high accuracy of the reliability calculation and methods of the parametric statistics that allow forecasting the equipment performance. For the first time we had the opportunity to apply objective methods of mathematical statistics to measure submersible equipment reliability, to find weak components of a unit and main operational mistakes when using ESP installations. As an example of the procedure implementation we did a comparative analysis of the reliability of the equipment made by Russian and leading American companies and run in the Western Siberia.
Operational properties of submersible equipment are characterized by two groups of parameters. The
first group includes discharge head, performance and power consumption. The second group defines the ability of the equipment to keep the above-mentioned values during operation, that is, reliability. Both groups are equally important in describing operational properties. Therefore, it is necessary to have valid measurement procedures for both parameters.
Today it is an accepted practice to measure the parameters of the first group on the test bench, while the parameters of the second group are evaluated in working conditions. It is possible to measure equipment reliability in bench tests, but these bench (i.e. accelerated) tests can only approximately imitate the real working conditions and, therefore, they are not attractive. In the present work we limit ourselves to considering the problem of reliability measurement in working conditions.
Failures are stochastic; therefore the characteristics of submersible equipment reliability can be obtained using the probability theory, to be more precise, its part – mathematical statistics. However, in practice of the oil production industry ubiquitous are such empirical characteristics as “overhaul period” and “mean time between failures” [1]. These characteristics have the following drawbacks:
1. They are not stochastic, which contradicts the nature of the characterized process. 2. They artificially limit the volume of data subject to analysis to one year. 3. The precision of the reliability measurement is not defined, so the proper comparison of the
obtained results is not possible.
Therefore, the Novomet Company has developed a procedure based on the probability theory that allows realizing submersible equipment reliability measurement by operational data. The procedure has been implemented in a number of oil companies of the Western Siberia (Russia).
Procedure of the reliability measurement. In accordance with the accepted approach of the reliability
theory [2], we will divide the operational data about the equipment operating time into two groups.
To the first group we refer the operating time that ended in failure, meaning every case of irreversible work stoppage. This operating time will be called complete.
Procedure of submersible equipment reliability measurement and experience of its implementation Perelman O.M., Peshcherenko S.N., Rabinovich A.I., Slepchenko S.D - Closed SJC Novomet, Perm, Russia
2 Perelman O.M., Peshcherenko S.N., Rabinovich A.I., Slepchenko S.D - Closed SJC Novomet, Perm, Russia
To the second group we refer the operating time of the equipment that was interrupted or stopped, not due to failure but because of other reasons. This operating time will be called incomplete or censored.
The incomplete operating time contains less information about the equipment reliability than the complete one that ended in failure. However, the volume of the censored operating time is usually substantial. If we take it into account we will increase the precision of the reliability measurement.
The main value that exhaustively describes reliability is the probability of survival P(t) or a proportion of the equipment that worked during the period t without failure (see Supplement, аnd [2]). All other reliability characteristics are expressed through P(t) and give an additional pictorial information.
In the present work, apart from , we used T( )P t γ – the guaranteed resource or time that the portion of
the equipment equal toγ will work without failure. For example, – is the time during which 50% of the equipment will work without failure. We also used the function or the portion of the equipment with the survival time equal to , for example 1000 days. These values are easily definable from the diagrams P(t).
0.5T
0( )P t
0t
The calculations has been carried out with the software NeoStat-Pro developed by Novomet, that applies general approaches of the mathematical reliability theory based on multiplying algorithms of reliability evaluation (Kaplan-Meyer, Herd, life time table) to the given task. The novelty of this method, described in Supplement 1, consists in the combination of methods of the nonparametric statistics (based on multiplying algorithms and ensuring high accuracy of the reliability measurement) and methods of the parametric statistics (we offered a model of failures that allows forecasting equipment performance).
The level of the confidence probability was assumed to be equal to 80%. It means that in 80% of the cases the true values of P(t) will be within the confidence intervals shown on the diagrams below, and in 20% out of them.
For all the diagrams, the solid line corresponds to the results of the reliability calculation, while the dotted line shows the forecast. The reliability of the forecast is based on the hypothesis that during the forecasted period the mechanism of failures will not change.
The reliability of the «well – ESP installation» system According to the accepted practice in the industry, we will divide the failures into operational (due to
exploitation mistakes) and design/constructional (equipment failure under the regular exploitation).
In accordance with this classification we should distinguish operational and constructional reliability [4]-[6]. The operational reliability of the «well – ESP installation» system is characterized by the unfaulty operation of the exploiting equipment of the plan, the constructional reliability of ESP installation – the unfaulty operation of the manufacturer.
The operational reliability of the « well – ESP installation» system can be structured or divided into reliability types by different operational factors. The constructional reliability of ESP installation includes the reliability of the individual ESP components, see fig. 1.
Besides, by the results of the pulled-out equipment inspection (if it is carried out) the portion of faultless ESP installations’ components suitable for reuse can be calculated.
We should note, that to achieve the maximum reliability of the « well – ESP installation» system one should not carry out optimization separately by operational and constructional parameters. This scheme makes it improbable to find the global maximum. Optimization should be realized by all parameters at once [7].

Procedure of submersible equipment reliability measurement and experience of its implementation 3
Reliability of the «well – ESP» system
Operational reliability of the system
Constructional reliability of ESP
installations and its components
Failures due to operational causes: errors in selection and estimation of the layer behavior, mode selection and running, clogging, salt bridge, unstable power supply, geological-engineering actions (GEA – additional perforations, hydrochloric acid treatment, frac operations, etc ), using for water injection
Failures in ESP components (pump, submersible motor, etc), are detected in the process of the pulled-out equipment inspection.
Fig. 1. Classification of the reliability types of the «well – ESP installation» system
Procedure of data preparation for the calculation. The source data are based on the operational data
bases of oil companies. These data bases usually contain the following information: running time of ESP installations before pulling-out, causes of stoppage and causes of ESP installations failures, data about the defects of the ESP components detected during the equipment dismantling, and some other.
At the first stage of the sample from the data base, we should ensure the representativeness of sample. The sample must include units that work in all conditions typical for the given oilfield. It is indispensable, for example, to compare reliability of submersible equipment of different manufacturers.
The important stage of the sampling is classification of the operating data into complete operating time (that did not end in failure) and censured operating time. For example, when calculating the reliability of the «well – ESP installation» system, we should classify any case of equipment pull-out as failure. When we calculate the reliability of a pump – we consider as failure only supply stoppage due to pump breakage. In this case all other causes of ESP operation stoppage (operational factors or breakdown of ESP motor, cables, seal sections) are not considered as failures, because the pump is still operable.
The input data about operating time must include all available information about the equipment operation. It is inadmissible to take into account only information about the equipment operation during the present year, as it usually done when calculating the overhaul period or the mean time between failures. Discarding the failures that took place before, we refuse to take into consideration the less successful units and artificially overstate the reliability of the assessed equipment.
Sampling is the most responsible stage of the reliability evaluation process. Only at this stage calculation errors can occur. Calculations by the suggested method do not use presumptions about probability laws of the equipment failures and do not introduce errors.
Evaluation of the necessary amount of sampling and of the test period. The amount of sampling
should be sufficient to ensure its representativeness and the required accuracy of the reliability characteristics evaluation.

4 Perelman O.M., Peshcherenko S.N., Rabinovich A.I., Slepchenko S.D - Closed SJC Novomet, Perm, Russia
The accuracy of evaluation is defined by the amount of sampling and the test period . N 0tOur calculations showed [4], that if the test period is not limited, at the confidence probability of 0.67,
the evaluation accuracy will be about at 0.5T 10%± 100N = and 5%± at 500N = . If the test period is limited by the value , the calculations show [4] that the accuracy of 0t 20%± is
attained at or , while 0 0100, 0.5N t= = .5T 0.5T050, 0.7N t= = ⋅ 10%± at or .
0 0100, 2.0N t= = ⋅ .5T
.5T0 0200, 0.8N t= = ⋅These data allow evaluating the necessary amount of equipment and time of its exploitation just at the
planning stage, which is important to achieve the required accuracy of the calculations made by these data.
Insufficiency of the applied empiric reliability indexes. Until recently oil companies applied such reliability indexes as “mean time between failures” (MTBF) and “operating time between overhauls” (OTBO). Their advantage is a simple algorithm and small amount of calculations. Calculations can be done on the simplest calculators.
The drawback is the inaccuracy of these indexes not only from the point of view of the mathematical reliability theory, but also from the point of view of the common sense. This is true, that by the definition: OTBO = Total operating time of all installations for one year (1) Number of failures MTBF = Total operating time of all failed installations for one year (2)
Number of failures
The conception «cumulative operating time» is inaccurate. For example, if 365 units of one type work without failures 24 hours each, and one unit of other type works 365 days, their MTBF and OTBO will be the same. However, in the first case the tests did not even properly start!
Besides, it is not admissible to sum up failures that occurred during a long exploitation time, because their weight it different: failures during a short operating time indicate errors, while during a long operating time – the high quality of the equipment.
The MTBF and OTBO indexes do not take into account the stage of the life span of the equipment put into operation more than a year ago. Every system goes through the “youth” stage, characterized by running-in failures, “maturity” and “old age” – when deterioration failures are most common.
Besides, OTBO ignores the operating time that did not end in failure, while these units are the best! The disadvantages of calculation of the MTBF and OTBO indexes result in the dependence of the
values from the time when the equipment was put in operation.
Let’s take an example of calculation of MTBF, OTBO and T - guaranteed resource of MTBF of 50% units (one of the criteria accepted by the mathematical reliability theory). We used operating data of the Western Siberia oil companies. During the test period the running conditions and the applied equipment were the same. The obtained results are shown in fig. 2
0.5
As shown in the picture, the reliability calculated by the suggested method did not change. Empirical reliability characteristics changed dramatically.
The definition of the Operating Time Between Overhauls (1) can be formulated as follows:
OTBO = Average installation’s operating time for one year Failure probability
With increase of the observation time the average operating time is almost constant, while the failure probability increases, and the overhaul period decreases, as it is shown on fig.2.

Procedure of submersible equipment reliability measurement and experience of its implementation 5
The definition of MTBF (2) can be formulated as follows:
MTBF = Average operating time of the failed ESP installation for one year
Failure probability
The average operating time of faulty units increases with the observation time, because at the initial stage fail the less reliable units. Therefore, MTBF increased, see fig. 2b – fig. 2d.
From definitions (1) and (2) we can conclude that OTBO will be equal to MTBF when all the equipment ends in failure.
And, finally: by changing the schedule of putting the equipment into operation, you can make the dependences OTBO and MTBF non-monotone, see fig. 2b.
Further we will give examples of implementation of the developed procedure in different oil companies. We will also show a reliability comparison of the Novomet equipment and the equipment of the leading American manufacturers.
The results of the method implementation in JSC Surgutneftegas: In the middle of 2002 Novomet started to supply JSC Surgutneftegas with complete installations equipped with wear-resistant pumps. The principles of the wear-resistant pumps construction are described in [8]. The general data about the results of the equipment exploitation by 01.01.05 are shown in tables 1 and 2.
Table 1. General information about the operational data of JSC Surgutneftegas used in the study
Type
Put into operation Total sum of mountings
In operation Pulling-out
Novomet units with flowrates of 25 m3/a day
July 2002 136 18 108
Novomet units with flowrates of 79 m3/a day
December 2002 71 44 27
Imported units with flowrates of 65 m3/a day July 2002 473 355 118
From table 2 we see, that the gas separator and pump failures were caused by the “degradation” of the
walls of the stage guide vanes and the gas separator body, i.e. were not connected with abrasive damage of the bearings. This type of deterioration was detected during an operational test. We managed to reproduce it and find out its nature on the Novomet stands. It allowed us to find a way to neutralize this type of deterioration and design pumps with a longer operating time in these conditions. Today we supply these advanced pumps and gas separators to Surgutneftegas.
Table 2 does not contain complete data about the failures structure, because every failure carries different weight regardless of operating time before failure. However, at the first stage of the equipment reliability analysis the failures structuring shown in table 2 can be useful. Later we will make the information about failures more precise using methods of the reliability theory.
6 Perelman O.M., Peshcherenko S.N., Rabinovich A.I., Slepchenko S.D - Closed SJC Novomet, Perm, Russia
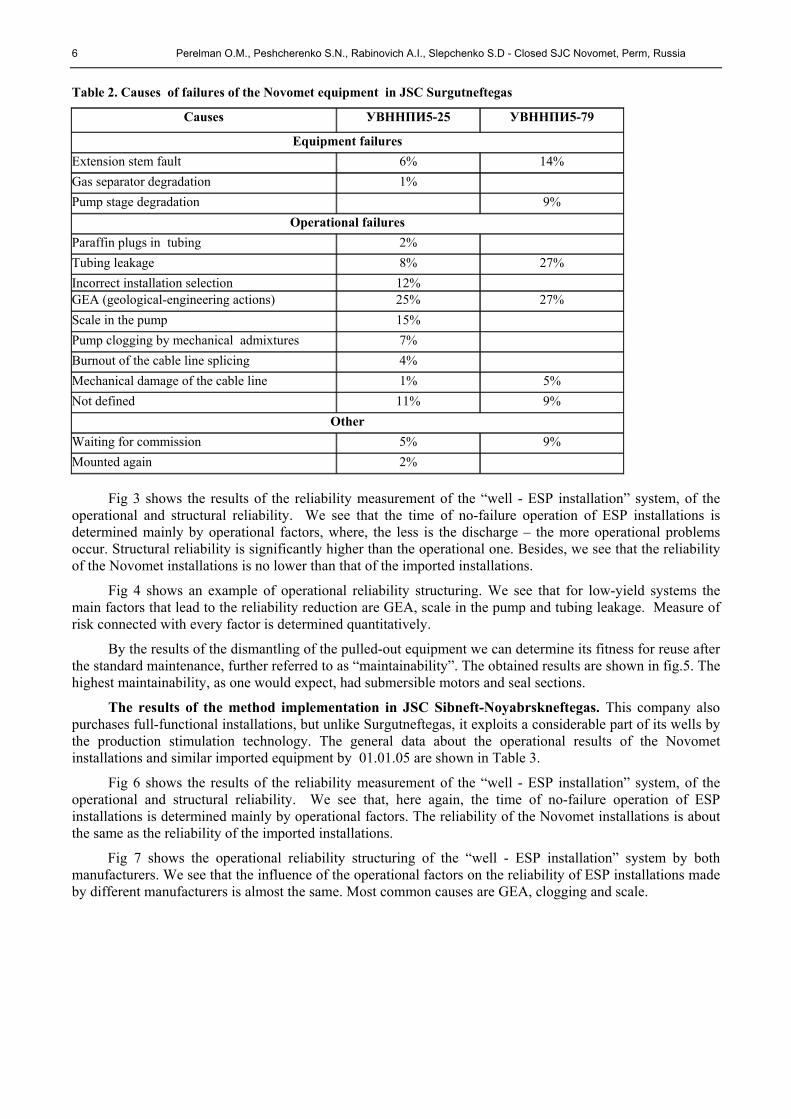
Table 2. Causes of failures of the Novomet equipment in JSC Surgutneftegas
Causes УВННПИ5-25 УВННПИ5-79
Equipment failures Extension stem fault 6% 14% Gas separator degradation 1% Pump stage degradation 9%
Operational failures Paraffin plugs in tubing 2% Tubing leakage 8% 27% Incorrect installation selection 12% GEA (geological-engineering actions) 25% 27% Scale in the pump 15% Pump clogging by mechanical admixtures 7% Burnout of the cable line splicing 4% Mechanical damage of the cable line 1% 5% Not defined 11% 9%
Other Waiting for commission 5% 9% Mounted again 2%
Fig 3 shows the results of the reliability measurement of the “well - ESP installation” system, of the operational and structural reliability. We see that the time of no-failure operation of ESP installations is determined mainly by operational factors, where, the less is the discharge – the more operational problems occur. Structural reliability is significantly higher than the operational one. Besides, we see that the reliability of the Novomet installations is no lower than that of the imported installations.
Fig 4 shows an example of operational reliability structuring. We see that for low-yield systems the main factors that lead to the reliability reduction are GEA, scale in the pump and tubing leakage. Measure of risk connected with every factor is determined quantitatively.
By the results of the dismantling of the pulled-out equipment we can determine its fitness for reuse after the standard maintenance, further referred to as “maintainability”. The obtained results are shown in fig.5. The highest maintainability, as one would expect, had submersible motors and seal sections.
The results of the method implementation in JSC Sibneft-Noyabrskneftegas. This company also purchases full-functional installations, but unlike Surgutneftegas, it exploits a considerable part of its wells by the production stimulation technology. The general data about the operational results of the Novomet installations and similar imported equipment by 01.01.05 are shown in Table 3.
Fig 6 shows the results of the reliability measurement of the “well - ESP installation” system, of the operational and structural reliability. We see that, here again, the time of no-failure operation of ESP installations is determined mainly by operational factors. The reliability of the Novomet installations is about the same as the reliability of the imported installations.
Fig 7 shows the operational reliability structuring of the “well - ESP installation” system by both manufacturers. We see that the influence of the operational factors on the reliability of ESP installations made by different manufacturers is almost the same. Most common causes are GEA, clogging and scale.

Procedure of submersible equipment reliability measurement and experience of its implementation 7
Table 3. General information about the operational data of JSC Sibneft-Noyabrskneftegas
Type
Put into operation Total sum of mountings
In operation Pulling-out
Novomet installations with flowrates of 124 - 280 m3/a day
August 2003 103 31 72
Imported installations with flowrates of 125 - 300 m3/a day
August 2003 96 30 66
Fig 8 shows structural reliability of pumps and submersible motors made by Novomet and by foreign
manufacturers. Within the range of the definition error the obtained dependences closely agree.
The results of the method implementation in JSC Yuganskneftegas. From the point of view of the present analysis, the company has the following peculiarities. Firstly, the company does not purchase complete ESP installations, but only its separate parts: pumps, submersible motors,etc, out of which ESP installations are mounted. Secondly, it practices on a large scale hydraulic bed separations accompanied by proppant pumping into the created creases and lowering of ESP installations on a considerable depth (in the area of higher temperatures). That’s why its submersible equipment works in substantially more complicated conditions (the average level of on fig. 2а and fig. 2с). General data about the results of the exploitation by 01.02.05 are shown in Table 4.
0.5T
Table 4. General information about the operational data of JSC Yuganskneftegas
Type
Put into operation Total sum of mountings
In operation Pulling-out
Novomet pumps with flowrates of 124 - 280 m3/a day
January 2003. 187 37 150
Imported pumps with flowrates of 160 - 560 m3/a day
January 2003 76 22 54
Fig 9 shows the results of the reliability measurement of the “well – ESP installation” system,
operational reliability of the ESP installation and structural reliability of the Novomet pumps. We see that, here again, the dependability of the “well – ESP installation” system with the Novomet pumps and with imported pumps is the same. And, as before, the structural reliability is substantially higher than the operational reliability. It’s interesting to note that even in such complicated operational conditions, as it is shown on fig.9, more than 60% of the Novomet pumps can operate without failure more than 1000 days.
The results of the method implementation in Lukoil-Western Sieberia LLC. This company also does not purchase complete ESP installations. They purchase separate units: pumps, submersible motors, etc, out of which ESP installations are mounted. Unlike Nefteyugansk, this company does not implement large-scale oil production intensification. General data about the results of the exploitation by 01.01.05 are shown in Table 5
Fig 10 shows the results of the reliability measurement of the “well – ESP installation” system, operational reliability of the ESP installation and structural reliability of the Novomet pumps. We see that the dependability of the “well – ESP installation” system with the Novomet pumps and with imported pumps is almost the same; while the structural reliability of the pumps is substantially higher, to be more precise - no incidence of the pump failure was registered during the guaranteed operation life, equal to one year. According to the existing regulations of the company, the equipment that worked longer than its guaranteed operation period is not subject to the commission analysis.
Maintainability of the ESP units is shown on fig. 11. We see that the Novomet pumps and submersible motors showed a higher reliability than the corresponding imported equipment.

8 Perelman O.M., Peshcherenko S.N., Rabinovich A.I., Slepchenko S.D - Closed SJC Novomet, Perm, Russia
Таблица 5. General information about the operational data of Lukoil-Western Sieberia LLC
Type
Put into operation Total sum of mountings
In operation Pulling-out
Novomet pumps with flowrates of 25 m3/a day
April 2002 924 424 500
Imported pumps with flowrates of 50 m3/a day
April 2001 1224 458 766
Conclusion
A procedure of submersible equipment reliability measurement by incomplete operational data has been suggested by Novomet. Every stage of the procedure – from the initial sampling to the final result – is strictly formalized by methods of the mathematical reliability theory. The human factor is totally excluded. We calculate characteristics that give a comprehensive description of reliability. The calculations are made by the specially designed software - NeoStat-Pro.
We did an analysis of the submersible equipment working in the Western Siberia. It showed that today it is the operational factors that cause most of failures. The structural reliability of ESP installations is substantially higher than the operational reliability of the “well – ESP installation” systems.
The analysis of the extensive statistical data showed that the structural reliability of the Novomet equipment is not lower that that of the imported equipment run in the Western Siberia.
Besides, the method allows detecting the weak units of the equipment basing on the operational data, and therefore – knowingly improving their quality. In the process of cooperation with the oil companies of the Western Siberia we created equipment with the first-rate operational reliability and structural reliability of more than 1000 days.

Procedure of submersible equipment reliability measurement and experience of its implementation 9
Supplement. Description of the method of the operational data processing. The main value that gives comprehensive description of reliability is the probability of no-failure work
or the part of installations that worked time t without failures. It can be explained as follows: is also the distribution function of the random value t − time of no-failure work of the installation, and, in terms of the reliability theory [4], gives a comprehensive description of reliability.
( )P t )(tP
In the oil production industry they started to apply the probability approach apparently in the 60s of the last century [9], [10]. However, due to the fact that it required considerable calculations and the computer techniques were not easily accessible, it did not have the wide distribution it deserved.
To calculate in the reliability theory we use the algorithms based on the hypothesis about independence of the failures that occurred in the adjacent moments. Calculations by this algorithm reduce to the multiplication of probabilities of no-failure work at these moments, that’s why these algorithms are called multiplying [11]:
( )P t
1 2
1 2
ˆ 1 1 1 kk
k
rr rPs s s
⎛ ⎞⎛ ⎞⎛ ⎞= − − −⎜⎜ ⎟⎜ ⎟⎝ ⎠⎝ ⎠ ⎝ ⎠
L ,⎟
1
(П1)
Here − estimation of at the moment , − number of failures, while − number of objects under
investigation in the interval from to . k̂P ( )P t kt ir is
1it − itOur calculations showed that the classical multiplying algorithms of the reliability calculation (foe
example, those of Kaplan-Meyer and Gerd), as well as a comparatively new one – life tables, when processing the data about ESP installations give almost the same results.
It was found out that the time dependence of the probability of no-failure work in all cases can be approximated by the function:
( )P t
(П2) 11( ) exp( )n n
n nP t a t a t a t−−= − − − −K
Coefficients were calculated by the orthogonal method of least-squares [10]. Their significance was evaluated by − Fisher criterion, which allowed calculating the power of the polynomial , and thus totally exclude the human factor when selecting the approximating function.
naF n
Then, by the residual sum of the squared approximation errors, using the methods of the mathematical statistics we calculated the dispersion of the probability of no-failure work . It allowed calculating the
calculation error , i.e. the confidence interval
( )D P( )P t ( )P D Pκ± . The corresponding confidence probability
β in the general case can be calculated by the criterion of Chebyshev [12]. Thus, at we have 2κ =0.75β ≥ . If the calculation error is not big (the standard deviation does not exceed 20−30% from the
calculated value), according to the experience [13], β can be approximately estimated by the normal distribution.
The approximating function (П2) allows forecasting the dependence of the probability of no-failure work from the time outside the time period under investigation.
Other reliability characteristics are expressed through and give additional visual information. Generally, we have the following characteristics: the function of the probability density:
( )P t
( )f t dP dt= − (П3) The intensity of failures ( )tλ (a ratio of the number of installations that had a failure per time unit to the number of fault-free installations):
( )
11 1
11 1
( )( )( ) exp
n nn n
n nn n
a t a t a tf ttP t a t a t a t
λ−
−−
−
− − −= =
− + + +K
K, (П4)
The average no-failure work : mT
, (П5) 11 1
0 0 0
( ) ( ) exp( )n nm n nT tf t dt P t dt a t a t a t dt
∞ ∞ ∞−
−= = = − + + +∫ ∫ ∫ K

10 Perelman O.M., Peshcherenko S.N., Rabinovich A.I., Slepchenko S.D - Closed SJC Novomet, Perm, Russia
The guaranteed resource Tγ (the time period during which the given part of installations will work without
failure, usually 0.5γ = ):
( 11 1exp n n
n na T a T a Tγ γ γ ) γ−−− + + + =K . (П6)
The methods of the mathematical statistics [7] allow calculating the dispersions for the coefficients
in (3)−(6), i.e. . The values of were used to find the calculation errors of ja
( )jD a ( )jD a ( )f t , ( )tλ , и
. mT
0.5TThe method does not use any assumptions about the probable model of failures. Therefore, the
calculated characteristics can be considered as the generalization of the empirical information about the operational reliability.
Function of failures distribution of the submersible equipment. In general, failures can have
different nature. There are sudden and gradual failures. The sudden failures are caused by chance factors, which can appear at any moment. They have the intensity of failures 1 constλ = that does not depend on time, see [2]. These are defects that appeared during the construction, errors at the stage of the well preparation, equipment selection, its operation. Gradual failures occur due to the accumulation of damages during the exploitation: deterioration, corrosion, scale in the flowing channel and in the bearing, ageing of the electric cable, etc. Their intensity of failures 2 ( )tλ depends on time. As these mechanisms of failures are independent, then
1 2( ) ( )t tλ λ λ= + . (П7) The time dependence of the probability of no-failure work of the submersible equipment in all
cases considered above is approximated by the function: ( )P t
{ }21 2( ) expP t a t a t= − − (П8)
The corresponding (8) probability of failure per time unit, i.e. the function of the intensity of failures (4), is equal to:
1( ) 2t a a2tλ = + . (П9) If , then the function of the intensity of failures is constant and has an exponential distribution [2].
If , then the Waybull distribution, for which in the general case 2 0a = ( )P t
2 0a ≠ { }( ) expP t tαλ= − . In our case, see
(П4), (П9), 2α = . Therefore, the sudden failures of the submersible equipment are described by the exponential law, while
the gradual failures are described by the Waybull distribution. Literature 1. Hogan J. R. Performance benchmarking of ESP Installations//SPE ESP Workshop, Houston, Texas
(25-27 April 2001) 2. Gendenko B.V., Belyaev Y.K., Soloviev A.D. Mathematical methods in the reliability theory. M:
Nauka. 1965. p. 524. 3. Perelman O.M., PescherenkoS.N., Rabinovich A.I., Slepchenko S.D. Statistical analysis of the
submersible pumps reliability in field conditions//Reliability and certification of oil and gas production equipment. 2003. N 3. P. 28–34.
4. Nuryaev A.S., Mukhamadeev G.R., Perelman O.M., Slepchenko S.D. Experience of creating highly reliable domestically produced submersible equipment// Oil energy industry technology magazine, 2004. №3. P.42 – 45.
5. Kudryashov S.I., Levin Y.A., Markelov V.D., Perelman O.М., PescherenkoS.N., Rabinovich A.I., Slepchenko S.D. Submersible equipment reliability in the complicated conditions of the oil fields of JSC «Yuganskneftegas» // Oil energy industry technology magazine. 2004. №5. P. 54-59.
6. Inushin N.V., Valeev A.S., Perelman O.М., PescherenkoS.N., Rabinovich A.I., А.И., Slepchenko S.D. Evaluation of submersible equipment reliability in the operational conditions of «Lukoil-
Procedure of submersible equipment reliability measurement and experience of its implementation 11
Western Siberia» LLC// Oil energy industry technology magazine. 2004. №6. С.
7. Moiseev N.N., Ivanilov Y.P., Stolyarova E.M. Optimization methods. М: Nauka. 1978. 351 p. 1. Ageev Sh.P., Kuprin P.B., Maslov V.N., Melnikov M.Y., Perelman2 O.M., Pescherenko2 S.N.,
Rabinovich2 A.I. Reliable centrifugal units with minor feeding for oil production in complicated conditions// ESP Workshop 2005
2. Pomazkova Z.S., Limonchikov V.D. Distribution of failures during exploitation of ESP installations. RNTS: the series Machines and oil equipment. M: VNIIOENG. 1969. № 9.
3. Filippov V.N. Reliability of ESP installations for oil production//Brief information. Pump construction. Насосостроение. Series ХМ-4. М: Tsintokhneftemash, 1983. 50 p.
4. Kaplan T.L., Meier P. Nonparametric estimation from incomplete observations// Journal of the American Statistical Assosiation. V. 53. 1958. pp. 457-481.
5. Hudson D. Statistics for physics. M: Mir. 1970. p.296. 6. Bendat G., Pirsol А. The applied analysis of stochastic data. M: Mir. 1989. p. 540.

12 Perelman O.M., Peshcherenko S.N., Rabinovich A.I., Slepchenko S.D - Closed SJC Novomet, Perm, Russia
0
500
1000
1500
2000
2500
01.07.2002 01.07.2003 30.06.2004 30.06.2005
Ope
ratin
g tim
e, d
ay
0
100
200
300
400
500
600
01.01.2002 01.01.2003 01.01.2004 31.12.2004
Ope
ratin
g tim
e, d
ay
100
60
40
20
Inst
alla
tions
1
2
30
25
20
15
10
5
Inst
alla
tions1
2
a) b)80
33
2002 2003 2004 2005 2003 2004 2005
Fig. 2. The dynamics of the reliability changes of the “well – ESP installation” system made by Novomet and operated in the oil companies: a) Surgutneftegas, b) Sibneft-Noyabrskneftegas, c) Yuganskneftegas, d) Lukoil – Western Siberia. Lines: 1 – a) overhaul period, b)-d) mean time between failures, 2 – , calculated by the suggested method, 3 – number of installations put into operation during the period
0.5T
0
100
200
300
400
500
600
700
800
900
01.01.2001 01.01.2002 01.01.2003 01.01.2004 31.12.2004
Ope
ratin
g tim
e, d
ay
180
160
140
120
100
80
60
40
20
Inst
alla
tions
0
50
100
150
200
01.01.2003 01.01.2004 31.12.2004
Ope
ratin
g tim
e, d
ay 1
2
60
45
30
15
Inst
alla
tions
1
2
с) 3
2001 2002 2003 2004 2005
d)
3
2003 2004 2005

Procedure of submersible equipment reliability measurement and experience of its implementation 13
0 400 800 1200Operating time, day
0
0.2
0.4
0.6
0.8
1
Sur
viva
l fun
ctio
n
1
2
3
a)
0 400 800 1200Operating time, day
0
0.2
0.4
0.6
0.8
1
Sur
viva
l fun
ctio
n
1
2
3
4
b)
Fig. 3. By the operational data of JSC Surgutneftegas: ; 1 – reliability of the system “well – ESP installation”, 2 – operational reliability, 3 – structural reliability, 4 – reliability of imported installations. а) UVNNPI5-25 (Novomet), b) UVNNPI5-79 (Novomet) and imported installations.
0 400 800 1200Operating time, day
0
0.2
0.4
0.6
0.8
1
Sur
viva
l fun
ctio
n
1
5
2
34
6
Fig. 4. Operational reliability of UVNNPI5-25 at JSC Surgutneftegas: 1 – operational reliability, 2 – GEA, 3 – scale, 4 – tubing leakage, 5 – wrong selection, 6 – clogging.

14 Perelman O.M., Peshcherenko S.N., Rabinovich A.I., Slepchenko S.D - Closed SJC Novomet, Perm, Russia
0 400 800 1200Operating time, day
0
0.2
0.4
0.6
0.8
1
Sur
viva
l fun
ctio
n
1
2
3
4
Fig. 5. Maintainability of ESP units in JSC Surgutneftegas: 1 – wear proof pumps, 2 – wear proof and corrosion-resistant pumps, 3 – seal sections, 4 – submersible motors.
0 200 400 600 800Operating time, day
0
0.2
0.4
0.6
0.8
1
Sur
viva
l fun
ctio
n
1а)
2a)2b)
1c)
1b)
2c)
Fig. 6. By the data of JSC Sibneft-Noyabrskneftegas: а) reliability of the “well – ESP installation” system, b) operational reliability, с) structural reliability. 1 – Novomet installations, 2 – imported installations.

Procedure of submersible equipment reliability measurement and experience of its implementation 15
0 200 400 600 800Operating time, day
0
0.2
0.4
0.6
0.8
1
Sur
viva
l fun
ctio
n
1
3
4
2
a)
0 200 400 600 800Operating time, day
0
0.2
0.4
0.6
0.8
1
Sur
viva
l fun
ctio
n
13
4
2
b)
Fig. 7. Operational reliability in JSC Sibneft-Noyabrskneftegas а) Novomet installations, b) imported installations 1 – GEA, 2 – clogging, 3 - scale, 4 – insufficient inflow
0 200 400 600 800Operating time, day
0.5
0.6
0.7
0.8
0.9
1
Sur
viva
l fun
ctio
n
1
2
a)
0 200 400 600 800Operating time, day
0.5
0.6
0.7
0.8
0.9
1
Sur
viva
l fun
ctio
n
1
2
b)
Fig. 8. Structural reliability of ESP installation units in JSC Sibneft-Noyabrskneftegas: а) pumps, b) submersible motors. 1 – Novomet equipment, 2 – imported equipment.

16 Perelman O.M., Peshcherenko S.N., Rabinovich A.I., Slepchenko S.D - Closed SJC Novomet, Perm, Russia
0 200 400 600 800 1000Operating time, day
0
0.2
0.4
0.6
0.8
1
Sur
viva
l fun
ctio
n
1а)
2a)
1b)
Fig. 9. By the data of JSC Yuganskneftegas: а) reliability of the “well – ESP installation” system, b) structural reliability of pumps. 1 – installations with Novomet pumps, 2 – installations with imported pumps.
0 400 800 1200Operating time, day
0
0.2
0.4
0.6
0.8
1
Sur
viva
l fun
ctio
n
1а)
1б)
2
Fig. 10. By the data of Lukoil-Western Siberia LLC: а) reliability of the “well – ESP installation” system, b) structural reliability of pumps 1 – installations with Novomet pumps, 2 – installations with imported pumps.

Procedure of submersible equipment reliability measurement and experience of its implementation 17
0 200 400 600Operating time, day
0.5
0.6
0.7
0.8
0.9
1
Sur
viva
l fun
ctio
n
2
1
a)
0 200 400 600Operating time, day
0.5
0.6
0.7
0.8
0.9
1
Sur
viva
l fun
ctio
n 2
1
b)
0 200 400 600Operating time, day
0.5
0.6
0.7
0.8
0.9
1
Sur
viva
l fun
ctio
n
21
c)
Fig. 11. Maintainability of installation units in “Lukoil-Western Siberia” LLC: а) pumps, b) submersible motors, с) seal sections. 1 – Novomet equipment, 2 – imported equipment.


![Dependable Systems Reliability Prediction · • Procedure of system reliability prediction [Misra] • Define system and its operating conditions • Define system performance](https://static.fdocuments.us/doc/165x107/5e1a77ce89782215020e022d/dependable-systems-reliability-prediction-a-procedure-of-system-reliability-prediction.jpg)