PROCEDURE FOR COMPUTATION AND INTERPRETATION OF …
7
6 Volume 2 Issue 206 EUROPEAN JOURNAL OF ECONOMICS AND MANAGEMENT Yaschenko L., PhD in Economics, Research Instute of Stascs, Studies, Ukraine Motuzka О., PhD in Economics, Naonal Academy of Stascs, Accounng and Audit, Ukraine PROCEDURE FOR COMPUTATION AND INTERPRETATION OF bUSINESS ClIMATE INDICATOR FOR UKRAINE Abstract. Construcon of indicators of business expectaons used to monitor the periods of economic growth and recession with monthly or quarterly periodicity and to predict turning points, has become of special importance today. In construcng indicators of business expectaons countries tend to use the results from Business Tendency Survey of Enterprises (BTSE) supplying informaon about the current situaon and future expectaons of enterprises. The objecve of the arcle is to show the procedure for computaon of business climate indicator by use of factor analysis implemented in SPSS. Business climate indicator that sums up the opinions and esmates of many economic agents can be compared with aggregated stascal indicators, such as the seasonally adjusted rates of GDP growth. Keywords: Business Tendency Survey of Enterprises, indicators of business expectaons, business climate indicator, factor analysis, method of principal components. Construction of indicators of business expectations used to monitor the periods of economic growth and recession with monthly or quarterly periodicity and to predict turning points, has become of special importance today. When constructing indicators of business expectations, countries tend to use the results from Business Tendency Survey of Enterprises (BTSE) supplying information about the current situation and future expectations of enterprises. BTSE, as a survey aiming to study the opinions of enterprise managers, provide a tool for studies of economic phenomena with due consideration to subjective opinions of market agents. The key indicators of business expectations, computed in the EU member countries in keeping with the Harmonized Program of the EU 1 are as follows: – indicators of business confidence in industry, construction, retail trade, services sector, financial services sector; – business clime indicator; – economic sentiment indicator. These indicators, incorporated in the system of obligatory harmonized European composite indicators, are computed on monthly basis by the European Commission’s General Directorate of Economic and Financial Issues. The purpose of computation of business expectations indicators in Ukraine is to produce statistical information on business activity tendencies, comparable with relevant data of EU member countries. Methodological framework for computation is “Methodological Guidelines for Computation of Indicators of Business Expectations According to the Requirements of the Special Standard for Dissemination of Data of the International Monetary Fund” 2 . 1 The Joint Harmonised EU Programme of Business and Consumer Surveys: User Guide (2014). Brussels: European Commission, Directorate General for Economic and Financial Affairs. <http://ec.europa.eu/economy_finance/db_ indicators/surveys/documents/bcs_user_guide_en.pdf> 2 Методика розрахунку індикаторів ділових очікувань згідно з вимогами розширеного Спеціального стандарту поширення даних Міжнародного валютного фонду (Державна служба статистики України). Офіційний сайт Державної служби статистики України. < http://ukrstat.org/uk/metod_polog/metod_doc/2014/411/411_2014.htm>
Transcript of PROCEDURE FOR COMPUTATION AND INTERPRETATION OF …
6�
Volume 2 Issue � 20�6 EuropEan Journal of EconomIcs and managEmEnt
Yaschenko L., PhD in Economics,Research Institute of Statistics, Studies, UkraineMotuzka О., PhD in Economics, National Academy of Statistics, Accounting and Audit, Ukraine
PROCEDURE FOR COMPUTATION AND INTERPRETATION OF bUSINESS ClIMATE INDICATOR FOR UKRAINE
Abstract. Construction of indicators of business expectations used to monitor the periods of economic growth and recession with monthly or quarterly periodicity and to predict turning points, has become of special importance today. In constructing indicators of business expectations countries tend to use the results from Business Tendency Survey of Enterprises (BTSE) supplying information about the current situation and future expectations of enterprises. The objective of the article is to show the procedure for computation of business climate indicator by use of factor analysis implemented in SPSS. Business climate indicator that sums up the opinions and estimates of many economic agents can be compared with aggregated statistical indicators, such as the seasonally adjusted rates of GDP growth.Keywords: Business Tendency Survey of Enterprises, indicators of business expectations, business climate indicator, factor analysis, method of principal components.
Construction of indicators of business expectations used to monitor the periods of economic growth and recession with monthly or quarterly periodicity and to predict turning points, has become of special importance today.
When constructing indicators of business expectations, countries tend to use the results from Business Tendency Survey of Enterprises (BTSE) supplying information about the current situation and future expectations of enterprises. BTSE, as a survey aiming to study the opinions of enterprise managers, provide a tool for studies of economic phenomena with due consideration to subjective opinions of market agents.
The key indicators of business expectations, computed in the EU member countries in keeping with the Harmonized Program of the EU 1 are as follows:
– indicators of business confidence in industry, construction, retail trade, services sector, financial services sector;
– business clime indicator;– economic sentiment indicator. These indicators, incorporated in the system of obligatory harmonized European composite indicators,
are computed on monthly basis by the European Commission’s General Directorate of Economic and Financial Issues.
The purpose of computation of business expectations indicators in Ukraine is to produce statistical information on business activity tendencies, comparable with relevant data of EU member countries. Methodological framework for computation is “Methodological Guidelines for Computation of Indicators of Business Expectations According to the Requirements of the Special Standard for Dissemination of Data of the International Monetary Fund”2.
1 The Joint Harmonised EU Programme of Business and Consumer Surveys: User Guide (2014). Brussels: European Commission, Directorate General for Economic and Financial Affairs. <http://ec.europa.eu/economy_finance/db_indicators/surveys/documents/bcs_user_guide_en.pdf>2 Методика розрахунку індикаторів ділових очікувань згідно з вимогами розширеного Спеціального стандарту поширення даних Міжнародного валютного фонду (Державна служба статистики України). Офіційний сайт Державної служби статистики України. < http://ukrstat.org/uk/metod_polog/metod_doc/2014/411/411_2014.htm>
62
EVROPSKÝ ČASOPIS EKONOMIKY A MANAGEMENTU
Issues of constructing indicators of business expectations have been in focus of studies of Ukrainian and other researchers, such as R. Nilsson, E. Guidetti3, L. Kitrar4, M. Pugachova5, N. Raiska, Ya. Sergiyenko, F. Frenkel6.
The article aims to highlight the procedure for computation of business climate indicator by use of factor analysis implemented in SPSS and compare the estimates of business climate indicator and seasonally adjusted rates of GDP growth in Ukraine.
Business climate indicator is an aggregate estimate produced by factor analysis (method of principal components) of seasonally adjusted balances of production output for the latest three months and the forthcoming three months, estimates of the current domestic demand measured by the amount of domestic orders, the current export demand measured by the amount of orders from abroad, the current stocks of finished goods.
Factor analysis allows for breaking the data array into a small number of groups referred to as factors7. For purposes of constructing business climate indicator the number of factors is defined as 1. One factor combines the variables with high correlation.
Computation of business climate indicator (IДКt) involves searching for a linear combination of
standardized variables ~X1t, ~X2t
, ~X3t, ~X4t
, ~X5t given the following condition:
where ai is derived from the matrix of estimates’ ratios;i = 1, ..., 5;
де j = 1, …, 5; t = 1, …, T ′;T ′ – length of a time series (number of quarters in our case);X1t – seasonally adjusted estimate of the balance of the current demand at the time t;X2t – seasonally adjusted estimate of the balance of change in production output in the forthcoming three
months at the time t;X3t – seasonally adjusted estimate of the balance of the current stocks of finished goods at the time t;X4t – seasonally adjusted estimate of the balance of change in business situation over the past three
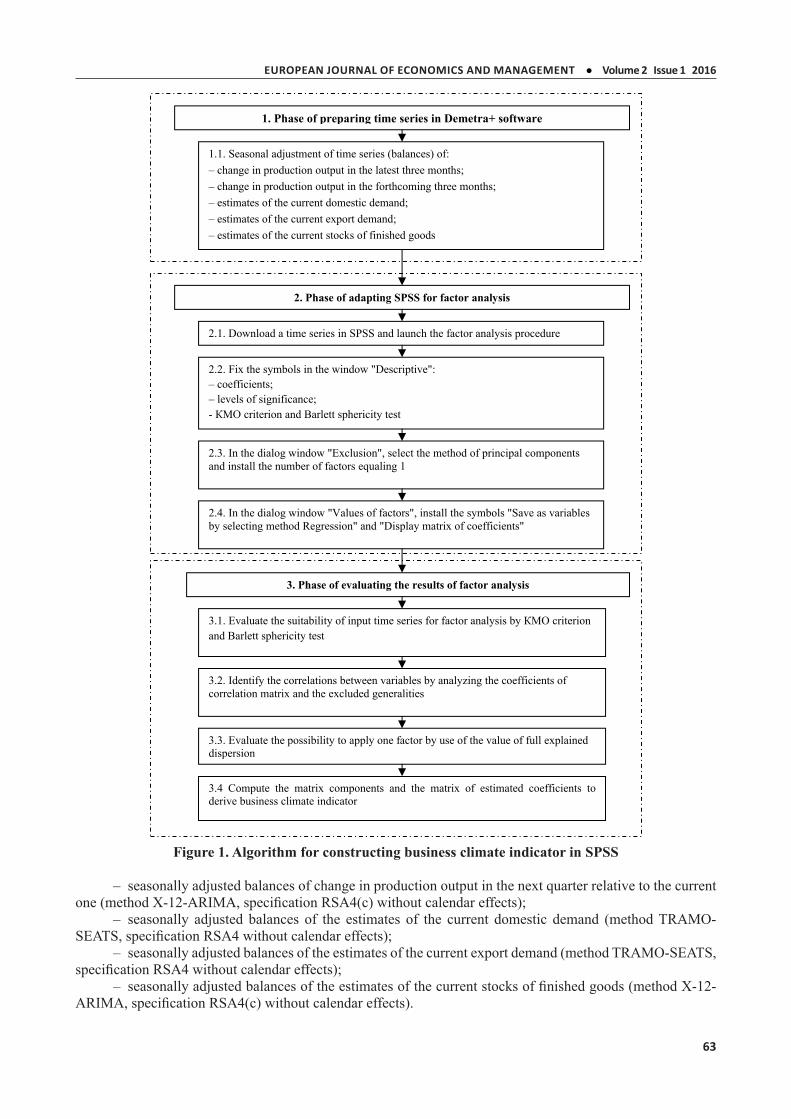
months at the time t;X5t – seasonally adjusted estimate of the balance of export demand at the time t.Figure 1 shows the algorithm for computation of business climate indicator in SPSS.Practical implementation of the above algorithm is highlighted below.1. Preparing time series in Demetra+ softwareThe following data are used for factor analysis:– seasonally adjusted balances of change in production output in the current quarter relative to the
previous one (method Х-12-ARIMA, specification RSA4(с) without calendar effects);3 Nilsson, R., Guidetti E. (2008). Predicting the Business Cycle: How Good are Early Estimates of OECD Composite Leading Indicator? OECD Statistics Brief No. 14, February.4 Китрар, Л.А., Остапкович, Г.В. (2013). Интегрированный подход к построению композитных индикаторов со встроенным алгоритмом оценки цикличности в динамике результатов конъюнктурного мониторинга. Вопросы статистики, 12, 23–34.5 Пугачова, М.В. (2013). Індикатори ділових очікувань у Спеціальному стандарті поширення даних: світовий досвід та український погляд. Статистика України, 4 (63), 15–23.6 Райская, Н.Н., Сергиенко, я.В., Френкель, А.А. (2010). Синхронность динамики интегральных индексов как индикатор поворотных точек экономического цикла. Вопросы статистики, 12, 47–50.7 Наследов, А. (2013). IBM SP SS Statistics 20 и AMOS: профессиональный статистический анализ данных.
1
1 1 2 2 3 3 4 4 5 5
,
1 ,
%
% % % % %
jt jjt
j
T
j jtt
t t t t ttX X
XS
X XT
I a X a X a X a X a X
1
1 1 2 2 3 3 4 4 5 5
,
1 ,
%
% % % % %
jt jjt
j
T
j jtt
t t t t ttX X
XS
X XT
I a X a X a X a X a X
2
1( )
1 ,1
T
j jt jt
X XST
1
1 1 2 2 3 3 4 4 5 5
,
1 ,
%
% % % % %
jt jjt
j
T
j jtt
t t t t ttX X
XS
X XT
I a X a X a X a X a X
6�
Volume 2 Issue � 20�6 EuropEan Journal of EconomIcs and managEmEnt
Figure 1. Algorithm for constructing business climate indicator in SPSS
– seasonally adjusted balances of change in production output in the next quarter relative to the current one (method Х-12-ARIMA, specification RSA4(с) without calendar effects);
– seasonally adjusted balances of the estimates of the current domestic demand (method TRAMO-SEATS, specification RSA4 without calendar effects);
– seasonally adjusted balances of the estimates of the current export demand (method TRAMO-SEATS, specification RSA4 without calendar effects);
– seasonally adjusted balances of the estimates of the current stocks of finished goods (method Х-12-ARIMA, specification RSA4(с) without calendar effects).
1
Figure 1. Algorithm for constructing business climate indicator in SPSS
– seasonally adjusted balances of the estimates of the current domestic
demand (method TRAMO-SEATS, specification RSA4 without calendar effects);
– seasonally adjusted balances of the estimates of the current export demand
(method TRAMO-SEATS, specification RSA4 without calendar effects);
2. Phase of adapting SPSS for factor analysis
2.1. Download a time series in SPSS and launch the factor analysis procedure
2.2. Fix the symbols in the window "Descriptive": – coefficients; – levels of significance; - criterion and Barlett sphericity test
2.3. In the dialog window "Exclusion", select the method of principal components and install the number of factors equaling 1
2.4. In the dialog window "Values of factors", install the symbols "Save as variables by selecting method Regression" and "Display matrix of coefficients"
3. Phase of evaluating the results of factor analysis
3.1. Evaluate the suitability of input time series for factor analysis by criterion and Barlett sphericity test
3.2. Identify the correlations between variables by analyzing the coefficients of correlation matrix and the excluded generalities
3.3. Evaluate the possibility to apply one factor by use of the value of full explained dispersion
3.4 Compute the matrix components and the matrix of estimated coefficients to derive business climate indicator
1. Phase of preparing time series in Demetra+ software
1.1. Seasonal adjustment of time series (balances) of: – change in production output in the latest three months; – change in production output in the forthcoming three months; – estimates of the current domestic demand; – estimates of the current export demand; – estimates of the current stocks of finished goods

6�
EVROPSKÝ ČASOPIS EKONOMIKY A MANAGEMENTU
The procedure of seasonal adjustment in Demetra+ software is given in8.2. Adapting SPSS for factor analysisThe method of principal components uses standardized data (computerized procedure of SPSS
package).The Kaiser–Meyer–Olkin criterion (KMO criterion) and Barlett sphericity test are used to evaluate the
suitability of data. KMO criterion is the value characterizing the applicability of factor analysis to the available variables:
– > 0.9 – full applicability (adequacy); – > 0.8 – high applicability (adequacy); – > 0.7 – acceptable applicability (adequacy); – > 0.6 – satisfactory applicability (adequacy); – > 0.5 – low applicability (adequacy); – < 0.5 – not applicable to the variables. Barlett sphericity test is the criterion of the correlativity of variables (with zero hypothesis indicating on
absence of correlation between variables). If P < 0.05, the data are quite applicable for factor analysis, because the correlations between variables are essential.
The correlation matrix is derived, to identify the correlations between variables. If the correlation coefficient > 0.3 occurs in each line of the matrix, it shows that the variables can be applied for further analysis.
3. Phase of evaluating the results from factor analysis 3.1. Evaluate the suitability of input time series for factor analysis by КМО criterion and barlett
sphericity testThe suitability of input data for factor analysis is determined by KMO criterion value (>0.5) and р-value
for Barlett sphericity test (< 0.05) (Table 1).
Table 1КМО criterion and barlett sphericity test
KMO criterion and Barlett sphericity test KMO criterion 0.623
Barlett sphericity test
Approx. Хі-square 129.050
Statistical parameters 10
High 0.000
3.2. Identify the correlations between variables by analyzing the coefficients of correlation matrix and excluded the generalities The correlation matrix of variables is shown in Table 2.
Table 2Correlation matrix VAR1 VAR2 VAR3 VAR4 VAR5
Correlation
VAR1 1.000 0.759 0.642 –0.217 0.393VAR2 0.759 1.000 0.532 –0.322 0.555VAR3 0.642 0.532 1.000 0.266 0.485VAR4 –0.217 –0.322 0.266 1.000 –0.070VAR5 0.393 0.555 0.485 –0.070 1.000
High (one-way)
VAR1 – 0.000 0.000 0.053 0.001VAR2 0,000 – 0.000 0.007 0.000VAR3 0,000 0.000 – 0.023 0.000VAR4 0,053 0.007 0.023 – 0.302VAR5 0,001 0.000 0.000 0.302 –
8 ященко, Л.О., Мотузка, О.М. (2014) Сезонне коригування як один з основних етапів розрахунку індикатора ділової впевненості для промисловості. Статистика України, 3, 17–24.

6�
Volume 2 Issue � 20�6 EuropEan Journal of EconomIcs and managEmEnt
Because a correlation coefficient that is > ±0.3 and the significant correlation coefficients (with р-value < 0.05) occur in each row of the correlation matrix, the studied variables are suitable for factor analysis.
The variables and the generalities are shown is Table 3. The values of the initial generalities equal 1.
Table 3Generalities
Initial Excluded
VAR1 1.000 0.764
VAR2 1.000 0.799
VAR3 1.000 0.605
VAR4 1.000 0.035
VAR5 1.000 0.514
3.3. Evaluate the possibility to apply one factor by use of the value of full explained dispersionThe columns of Table 5 contain the characteristics of the factors: their sequence numbers, sums of the
square loads of exclusion, the share of overall dispersion caused by a factor, and the respective cumulative (accumulated) share.
Table 4 Full explained dispersion
ComponentInitial values Sums of the square loads of exclusion
Total % dispersion cumulative % Total % dispersion cumulative %
1 2.717 54.334 54.334 2.717 54.334 54.334
2 1.233 24.653 78.988 – – –
3 0.635 12.708 91.696 – – –
4 0.239 4.778 96.474 – – –
5 0.176 3.526 100.000 – – –
The higher is the share of dispersion caused by a factor, the higher is this factor’s significance. The higher is the cumulative share accumulated to the last factor, the more significant is the factor solution. If this accumulated share is less than 50%, then either the number of variables needs to be decreased or the number of factors needs to be increased. In our case, the accumulated share of dispersion is quite acceptable for use of one factor.
3.4. Compute matrix components and matrix of estimates coefficients to derive business climate indicator
The matrix of components for one factor is shown in Table 5.
Table 5Matrix of components
Component 1
VAR1 0.874
VAR2 0.894
VAR3 0.778
VAR4 –0.186
VAR5 0.717
66
EVROPSKÝ ČASOPIS EKONOMIKY A MANAGEMENTU
The matrix of the coefficients of estimated components (matrix of standardized scoring coefficients), shown in Table 6, is used for computation of the standardized values of the computed component.
Table 6Matrix of the coefficients of estimated components
Component 1
VAR1 0.322
VAR2 0.329
VAR3 0.286
VAR4 –0.069
VAR5 0.264
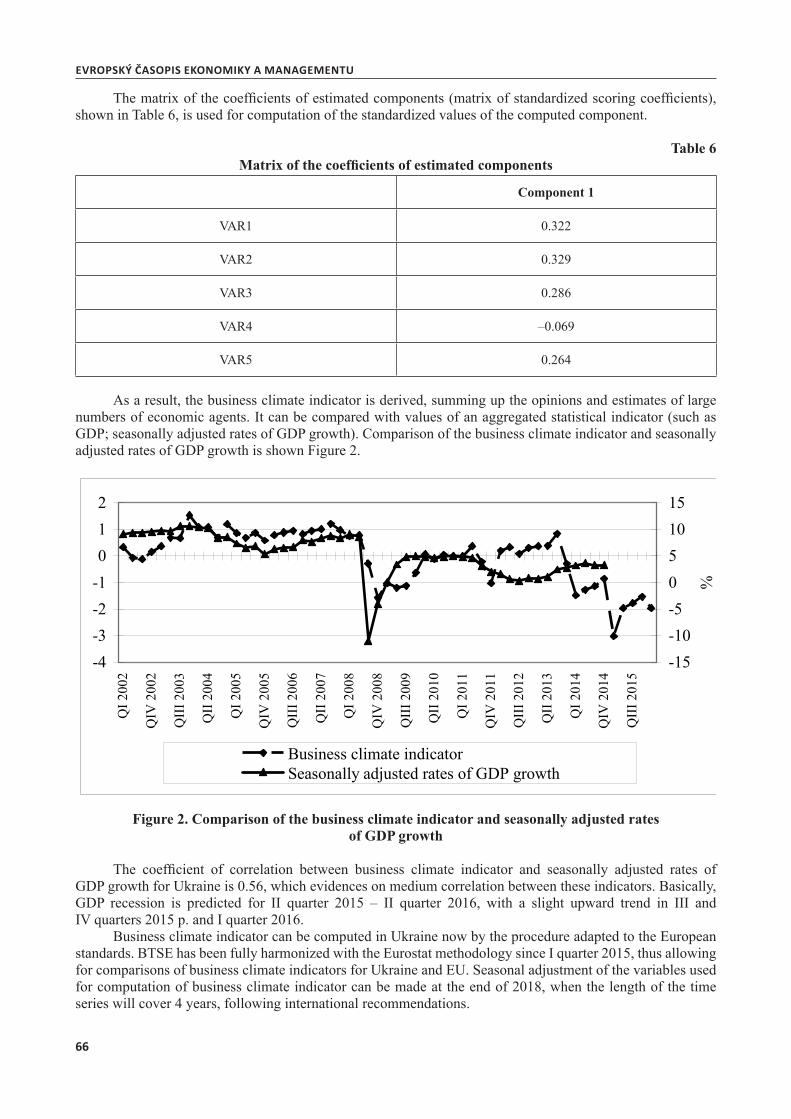
As a result, the business climate indicator is derived, summing up the opinions and estimates of large numbers of economic agents. It can be compared with values of an aggregated statistical indicator (such as GDP; seasonally adjusted rates of GDP growth). Comparison of the business climate indicator and seasonally adjusted rates of GDP growth is shown Figure 2.
Figure 2. Comparison of the business climate indicator and seasonally adjusted rates of GDP growth
The coefficient of correlation between business climate indicator and seasonally adjusted rates of GDP growth for Ukraine is 0.56, which evidences on medium correlation between these indicators. Basically, GDP recession is predicted for ІІ quarter 2015 – ІІ quarter 2016, with a slight upward trend in ІІІ and ІV quarters 2015 р. and І quarter 2016.
Business climate indicator can be computed in Ukraine now by the procedure adapted to the European standards. BTSE has been fully harmonized with the Eurostat methodology since І quarter 2015, thus allowing for comparisons of business climate indicators for Ukraine and EU. Seasonal adjustment of the variables used for computation of business climate indicator can be made at the end of 2018, when the length of the time series will cover 4 years, following international recommendations.
1
As a result, the business climate indicator is derived, summing up the
opinions and estimates of large numbers of economic agents. It can be compared
with values of an aggregated statistical indicator (such as GDP; seasonally adjusted
rates of GDP growth). Comparison of the business climate indicator and seasonally
adjusted rates of GDP growth is shown Figure 2.
-4-3-2-1012
Q 2
002
QIV
200
2
Q 2
003
Q 2
004
Q 2
005
QIV
200
5
Q 2
006
Q 2
007
Q 2
008
QIV
200
8
Q 2
009
Q 2
010
Q 2
011
QIV
201
1
Q 2
012
Q 2
013
Q 2
014
QIV
201
4
Q 2
015
-15-10-5051015
%
Business climate indicatorSeasonally adjusted rates of GDP growth
Figure 2. Comparison of the business climate indicator and seasonally adjusted
rates of GDP growth
The coefficient of correlation between business climate indicator and
seasonally adjusted rates of GDP growth for Ukraine is 0.56, which evidences on
medium correlation between these indicators. Basically, GDP recession is predicted
for quarter 2015 – quarter 2016, with a slight upward trend in and V
quarters 2015 . and quarter 2016.
Business climate indicator can be computed in Ukraine now by the procedure
adapted to the European standards. BTSE has been fully harmonized with the
Eurostat methodology since quarter 2015, thus allowing for comparisons of
business climate indicators for Ukraine and EU. Seasonal adjustment of the
variables used for computation of business climate indicator can be made at the end
of 2018, when the length of the time series will cover 4 years, following
international recommendations.
6�
Volume 2 Issue � 20�6 EuropEan Journal of EconomIcs and managEmEnt
References
1. Kytkar, L.А., Ostapkovich, G.V. (2013). Integrirovannyi podkhod k postroyeniyu kompozitnykh indikatorov so vstroyennym algoritmom otsenki tsiklichnosti v dinamike rezultatov konyunktyrnogo monitoringa. Voprosy statistiki, 12, 23–34.
2. Metodyka rozrakhunku indykatoriv dilovykh ochikuvan zhidno z vymohamy rozshyrenoho Spetsialnoho standartu poshyrennya danykh Mizhnarodnoho Valyutnoho Fondu. (Derzhavna sluzhba statystyky Ukrainy). Ofitsiinyi sait Derzhavnoi sluzhby statystyky Ukrainy. <http://ukrstat.org/uk/metod_polog/metod_doc/2014/411/411_2014.htm>.
3. Nasledov, А. (2013). IBM SP SS Statistics 20 i AMOS: professionalnyi statisticheskyi analiz dannykh.
4. Nilsson, R., Guidetti, E. (2008). Predicting the Business Cycle: How Good are Early Es-timates of OECD Composite Leading Indicators? OECD Statistics Brief, No. 14, February.
5. Pugachova, М.В. (2013). Indykatory dilovykh ochikuvan u Spetsialnomu standarti poshyrennya danych: svitovyi dosvid ta ukrainskyi pohlyad. Statystyka Ukrainy, 4 (63), 15–23.
6. Raiskaya, N.N., Sergiyenko, Ya.V., Frenkel, A.A. (2010). Sinkhonnost dinamiki integralnykh indeksov kak indicator povorotnykh tochek ekonomicheskogo tsikla. Voprosy statistiki, 12, 47–50.
7. The Joint Harmonised EU Programme of Business and Consumer Surveys: User Guide (2014). Brussels: European Commission, Directorate General for Economic and Financial Affairs. <http://ec.europa.eu/economy_finance/db_indicators/surveys/documents/bcs_user_guide_en.pdf>
8. Yaschenko, L.O, Motuzka, O.M. (2014). Sezonne koryhuvannya yak odyn z osnovnykh etapiv rozrakhunky indykatoriv dilovoyi vpevnenosti dlya promyslovosti. Statystyka Ukrainy, 3, 17–24.