Problems and Prospects for Industrial … No. 1647-IND Problems and Prospects for Industrial...
114
Report No. 1647-IND Problems and Prospects for Industrial Clevelopment in Indonesia (In Two Volumes) Volume II: Industry Surveys May 25, 1978 Industrial Development and Finance Department Industrial Projects Department FOR OFFICIAL USE ONL'Y Document of the World Bank This document has a restricted distribution and may be used by recipients only in the performance of their official duties. Its contents may not otherwise be disclosed without World Bank authorization. Public Disclosure Authorized Public Disclosure Authorized Public Disclosure Authorized Public Disclosure Authorized Public Disclosure Authorized Public Disclosure Authorized Public Disclosure Authorized Public Disclosure Authorized
Transcript of Problems and Prospects for Industrial … No. 1647-IND Problems and Prospects for Industrial...

Report No. 1647-IND
Problems and Prospectsfor Industrial Clevelopment in Indonesia(In Two Volumes)
Volume II: Industry SurveysMay 25, 1978
Industrial Development and Finance DepartmentIndustrial Projects Department
FOR OFFICIAL USE ONL'Y
Document of the World Bank
This document has a restricted distribution and may be used by recipientsonly in the performance of their official duties. Its contents may nototherwise be disclosed without World Bank authorization.
Pub
lic D
iscl
osur
e A
utho
rized
Pub
lic D
iscl
osur
e A
utho
rized
Pub
lic D
iscl
osur
e A
utho
rized
Pub
lic D
iscl
osur
e A
utho
rized
Pub
lic D
iscl
osur
e A
utho
rized
Pub
lic D
iscl
osur
e A
utho
rized
Pub
lic D
iscl
osur
e A
utho
rized
Pub
lic D
iscl
osur
e A
utho
rized

CURRENCY EQUIVALENTS
Currency: Rupiah (Rp)
US$1 = Rp 415 (January 1978)
Rp 100 = US cents 2.4
Rp 1,000, 000 = US$2,409
PRINCIPAL ABBREVIATIONS AND ACRONYMS USED
BAPPENAS Government Planning Agency
BKPM Badan Koordinasi Penanaman Model(Investment Coordinating Board), also ICB
BPS Biro Pusat Statistek(Central Bureau of Statistics), also CBS
CBS Central Bureau of Statistics
GOI Government of Indonesia
ICB Investment Coordinating Board
IDFC Indonesian Development Finance Corporation
KIK Kredit Investasi Kecil(Small-Scale Investment Credit Program)
KMKP Kredit Model Kerja Penanaman(Working Capital Credit Program)
NAFED National Agency for Export Development
PDFCI Private Development Finance Corporation of Indonesia
PLN State Electricity Corporation
PMA Penanaman Modal Asing(Foreign Investment Projects)
PMDN Penanaman Modal Dalam Negeri
(Domestic Investment Projects)
FOR OFFICIAL USE ONLY
PROBLEMS AND PROSPECTS FOR INDUSTRIAL DEVELOPMENT IN INDONESIA
Volume II: Industry Surveys
Table of Contents
Page
SUMMARY i
VI. MECHANICAL WOOD PRODUCTS INDUSTRY 1
Introduction 1
Forest Resource Base 2
Industrial Development 5Development Prospects 9
Conclusions 14
VII. THE PULP AND PAPER INDUSTRY 16
Introduction 16Structure of the Industry 16
Conclusions 33Recommendations 34
ANNEXTHE DEVELOPMENT POTENTIAL IN THE PULP AND
PAPER SECTOR 35
VIII. THE ENGINEERING INDUSTRIES 58
Introduction 58
Present Status of the Industries 58
Technical Considerations 63
Market Factors 68
Major Constraints on Development 73
Future Trends and Project Identification 75
Areas for Further Investigation 80Summary and Conclusions 85
IX. THE TEXTILE INDUSTRY 87
Current Status of the Industry 87
Future Trends 96
APPENDICES
I. Profit and Cost Calculation of Some Knitting Mills; Cost Sl:ructure
of some Spinning Mills
II. Cost Calculations of 36" Blended Shirting; Cost Calculation of Cotton
Yarn
This report is based on the findings of an industrial mission that visited
Indonesia in November-December 1976. The mission included: Frederick T. Moore,
Chief of Mission, Vladimir Dragomanovic, Economist, Andrew Ewing, Engineer,
Yao-Su Hu, Economist, Anthony Johns, Engineer (Consultant), Peter MaCawley,Economist (Consultant), Has Tampubolon, Economist (Consultant).
This document has a restricted distribution and may be used by recipients only in the performanceof their official duties. Its contents may not otherwise be disclosed without World Bank authorization.


PROBLEMS AND PROSPECTS FOR INDUSTRIAL DEVELOPMENT IN INDONESIA
Volume II: Industry Surveys
Summary
Introduction
i. The industrial. mission from the World Bank visited Indonesiain late 1976; this report reviews the changes in the structure and per-formance of industry in the prior five years and what may reasonably beacconplished in the next. five to eight years. The report is not primarilyconcerned with short-run problems, but in order to arrive successfully atthe objectives in five t:o eight years, it will be necessary to take someactions to correct situations that have deteriorated and to exploit newopportunities that now exist.
ii. This report is in two volumes. Volume I, The Current Situationand Policy Issues, reviews the recent growth of industry, the characteristicsof industrial investment, and policy issues concerning the planning for futuregrowth. Volume II, Industry Surveys presents an analysis of four industries:mechanical wood products; pulp and paper; the engineering industries; andtextiles.
Mechanical Wood Products
iii. The policies of the Indonesian Government have been successful inbringing about the const:ruction of substantial new sawnwood and. plywood pro-duction capacity over a relatively short period of time. However, if thiscapacity and the substantial addition which are planned for the next fewyears is to be effectively utilized to bring about the desired effect ofincreasing value-added and employment in this industry in Indonesia, thencertain positive steps will have to be undertaken by the industry and byGovernment.
iv. On the basis of this preliminary overview, it has been concludedthat such solutions might include:
(a) The establishment of an effective export timbermarketing board. This Board would initially be-set up by the Government but financed throughcontributions from industry to establish andmonitor quality standards, and to develop mar-kets and marketing channels. The board would

- ii -
also establish links with major log importingorganizations in order to assist in promotingan orderly phasing down of log exports in con-junction with a building up of processed woodexports into the same markets;
(b) The establishment of training and other tech-nical facilities designed to assist plants toproduce sawnwood and plywood to defined qualitystandards; and
(c) A review of taxing and pricing policies aimedat giving the industry more incentive to producesawnwood and plywood domestically, and less in-centive to export unprocessed logs.
Pulp and Paper
v. The main conclusions concerning this industry are as follows:
(a) The Indonesian pulp and paper industry has beenslow to develop with the result that the countrynow imports over 80% of its paper requirements.No other country in the world with suitable fiberresources is so dependent on imports;
(b) Development of the industry now as in the past isconfined to the construction and expansion of verysmall production units. Although these mills appearto be quite efficiently operated, they could neverbe profitable if not protected from import compe-tition by a 60% tariff barrier;
(c) The protective tariff not only allows the existingindustry to keep operating but is also attractingnew private capital. New plants are also very smalland this strategy is seen to be yielding a negativeeconomic rate of return; and
(d) Large plants have been proposed for various locationsin the country which would materially improve thedomestic supply solution. At current world paperprices these projects are only marginally attractivebut rates of return would improve substantially withthe higher prices which are projected.
vi. Under these circumstances, a number of alternative developmentstrategies could be considered but the one that appears to have the bestchance of being effective would be for the Government to:

- iii -
(a) Form a public sector pulp and paper company whichwould take over control of the five existing govern-ment-owned pulp and paper mills. The company couldbe staffed with people from the mills and from theCellulose Industries Division of the Department ofChemical Industrcies;
(b) Empower this coinpany to engage consultants as neces-sary, and to negotiate with the sponsors of the fiveor six major puLp and paper projects under considera-tion in the country;
(c) Select the best project for immediate developmentand form a partnership with the existing sponsorif this is deemed appropriate;
(d) Contract for a bankable feasibility study to secureloan finance for the project. Raise equity througha combination of government grant, funds generatedby the existing plants, and contributions from anyprivate partners; and
(e) Proceed to implement the project and commence eval-uating a second project.
Engineering Industries
vii. In the period 1972-1976 the engineering industries have more thandoubled in size and becoma wider-based and generally more efficient. However,comparisons of different industries within the subsector indicate that thisdevelopment has taken place unevenly. In the consumer-based product areas theelectronics and automotive industries have expanded rapidly over the periodboth in terms of output and employment, and are still expanding, though notalways in an efficient way. The heavy engineering industries have expandedbut excess capacity is widespread and there is currently little growth.
viii. The main causes of this apparent imbalance are: low productivityand poor, outdated machinery and equipment; shortage of skilled manpowerand the lack of technical and managerial talent; difficulties in obtainingfinance at reasonable terms; heavy additional costs which offset any compara-tive advantage from low wage rates; preference given to imported products inthe capital goods sector.
ix. There is a need to have an overall strategy for developingIndonesia's engineering industries as a whole. Two major studies are recom-mended in this connection to assess possible measures to deal wiith key problem

- iv -
areas and assist the development of an effective industrial strategy. Theseare: (1) an in-depth study of the problems in the capital goods sector; and(2) a study of the possibility of developing a strong export business.
x. Project areas suggested for early attention include:
(a) New Products: woodworking machinery; agriculturalmachinery; construction equipment; materialshandling equipment; valves; specialist vehicles;small petrol and diesel engines.
(b) Productivity Improvement: extension of MIDC,linked to a new scheme to train graduate engi-neers.
Textile Industry
xi. The textile industry has been growing considerably in recent years.Its share in total industrial value added was 11% in 1970 and rose to 17% in1973. In 1969 the output of knitting and weaving was 450 million meters andincreased by 141% to 1,085 million meters in 1975/76. The number of spindlesincreased from around 482,000 in 1969 to 1,152,000 in 1975/76. This increasein capacity was also accompanied by an increase in productivity. The outputper spindle was .07 MT p.a. in 1969, and .10 ton p.a. in 1976. The totalcapacity of dyeing, finishing and printing amounted to 665 million metersin 1970 and the actual output was 933 million meters in 1975/76. All non-cotton fiber was imported in 1969, but in 1975/76 there were four syntheticfiber making units with capacity totalling 59,000 MT per annum. The growthwas also accompanied by the production of new products such as blended andtexturized yarn, suiting and shirting, double knit, embroidery, brocade, andlaces.
xii. Although the industry is in difficult times now, in the longer term,to the mid-1980's the prospects are much more favorable since present percapita consumption is low and is expected to grow steadily.
xiii. In an attempt to indicate the relative priorities or comparativeadvantages within the textile industry, an analysis was made of "represen-tative" projects in weaving, spinning, fiber-making and garment making. Thecomparative calculations indicate quite clearly that garment making offersthe best opportunities for investment within the textile industry, followedby weaving. Both spinning and fiber making appear quite unattractive. Theinternal rate of return is highest in garment making and the investment costper job created is the lowest. The sensitivity measures and the foreignexchange effects are also generally the best. On these same points, weavingappears to be a favorable field by comparison to the other two.

- 1 -
VI. 1IECHANICAL WOOD PRODUCTS INDUSTRY
Introduction
6.01 In less than 10 years, log exports from Indonesia have developedfrom a very small base to the point where the country is now the world'slargest exporter of non-coniferous sawlogs and veneer logs. The rapid de-velopment of this position, and the relative importance of Indonesia as alog exporter is revealed by the statistics in the following table:
Table 6.1
Major Exporters of Non-ConiferousSawlogs and Veneer Logs
Country Export Volume1964 1969 1974(million cubic meters)
Indonesia 0.1 3.7 18.0Malaysia 5.1 11.1 12.2Philippines 6.1 9.4 4.7Ivory Coast 1.9 3.3 3.2France 0.7 0.7 1.5Other 1/ 6.0 6.9 7.2
World Total 19.9 35.1 46.8
Source: FAO Yearbook of Forest Products, 1974
1/ Including Papua New Guinea, the United States, Cameroon, Congo,and other countries, all exporting less than I million cubic metersannually in 1974.
6.02 The volume of exports from Indonesia peaked in 1973 and subse-quently declined. Most of this decline is due to a general slackening inthe demand for timber which can be directly linked to the level of housingstarts in Japan and North America. Log export data for recent years aresummarized in the following table:

- 2 -
Table 6.2
Recent Export Figuresfor Indonesian Logs
Year Volume 5 Value(million m ) (US$ million)
1972 14.1 2211973 18.7 5531974 17.5 7031975 13.5 4691976 1/ 15.0 550
1/ Preliminary estimate
6.03 Almost 60% of Indonesia's log exports are shipped to Japan, 20% toSouth Korea, and 15% to Taiwan. In these countries the logs are processedinto sawnwood, plywood, and manufactured wood products, and in the case ofKorea and Taiwan, most of these products are re-exported to the United Statesand Japan. Korea and Taiwan have become the world's largest exporters ofplywood and this entire industry is based on logs from Indonesia, Malaysiaand the Philippines. The Indonesian Government has recognized that by ex-porting unprocessed logs, the country is forsaking domestic employment po-tential. Therefore, all timber concession agreements now contain provisionsthat require the concession holder to provide for domestic processing ofcertain proportions of the timber harvested within a specified time.
6.04 This chapter examines the structure of the Indonesian timber in-dustry and in particular the extent to which Government policies have beensuccessful in promoting the growth of domestic processing as an alternativeto log exports. A brief review of the forest resource base is given followedby a description of the existing industry. Finally the main factors whichwill determine the direction of future development are examined, includingmarkets, economic aspects and Government policies.
Forest Resource Base
6.05 Timber is now Indonesia's second most valuable export commodity(after petroleum products). Attempts have been made to determine the ex-tent of the resource base in order to project how long the current rate ofextraction can continue, and although the information is not complete cer-tain indicative conclusions can be drawn.
Area of Forest Land
6.06 About 120 million hectares, or over 60% of Indonesia's totalland area, is classed as forest land. This is the largest forest resourcein Asia and one of the largest in the world. The geographical distribu-tion of forest land is approximately as follows:

- 3 -
Table 6.3
Oistribution of Forest Land
Province Total Land Forest LandArea Area(million hectares)
Sumatra 47 28Kalimantan 54 41Sulawesi 19 10Maluku 8 6West Irian 42 32Java, Madura 13 3Bali, Nusa Tenggara 7 2
190 122
Source: Central Bureau of Statistics. Other sources suggest Indonesia'stotal land area is as much as 202.7 million hectares.
6.07 According to 1973 designations by the Directorate General ofForestry, this 122 million hectares of forest land was categorized asfollows:
Table 6.4
Forest Land Categories, 1973
Type Area(million ha) (%)
Production 35.4 29.0Protection 11.5 9.4Production and Protection 4.7 3.8Bare Land 12.7 10.4Conservation 3.1 2.5Not Categorized 54.8 44.9
Total 122.2 100.0
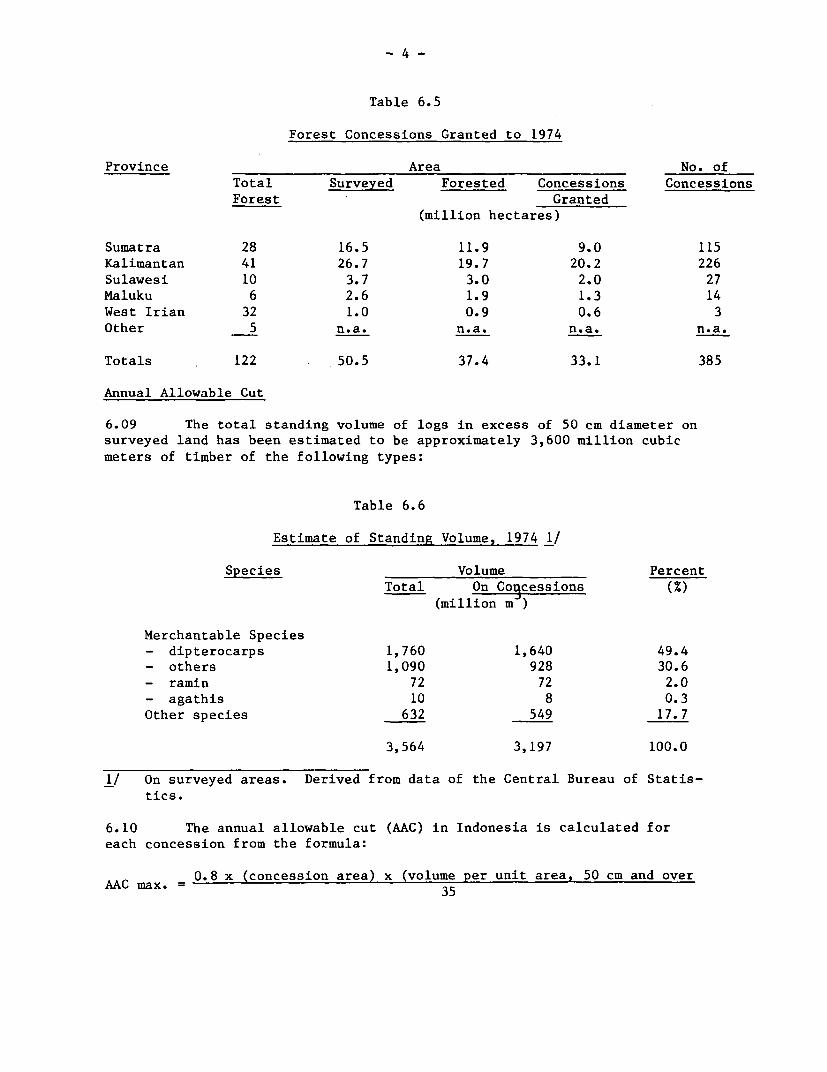
6.08 Up to June 1974, 50.5 million hectares or about 41% of thecountry's forest land had been surveyed for forest exploitation. Con-cessions for approximately 33.1 million hectares had been granted asfollows:
- 4 -
Table 6.5
Forest Concessions Granted to 1974
Province Area No. of
Total Surveyed Forested Concessions Concessions
Forest Granted(million hectares)
Sumatra 28 16.5 11.9 9.0 115
Kalimantan 41 26.7 19.7 20.2 226
Sulawesi 10 3.7 3.0 2.0 27
Maluku 6 2.6 1.9 1.3 14
West Irian 32 1.0 0.9 0.6 3
Other 5 n.a. n.a. n.a. n.a.
Totals 122 50.5 37.4 33.1 385
Annual Allowable Cut
6.09 The total standing volume of logs in excess of 50 cm diameter on
surveyed land has been estimated to be approximately 3,600 million cubic
meters of timber of the following types:
Table 6.6
Estimate of Standing Volume, 1974 1/
Species Volume Percent
Total On Cogcessions (%)(million m )
Merchantable Species- dipterocarps 1,760 1,640 49.4
- others 1,090 928 30.6
- ramin 72 72 2.0
- agathis 10 8 0.3
Other species 632 549 17.7
3,564 3,197 100.0
1/ On surveyed areas. Derived from data of the Central Bureau of Statis-
tics.
6.10 The annual allowable cut (AAC) in Indonesia is calculated for
each concession from the formula:
0.8 x (concession area) x (volume per unit area, 50 cm and overAAC max. = 35
-5-
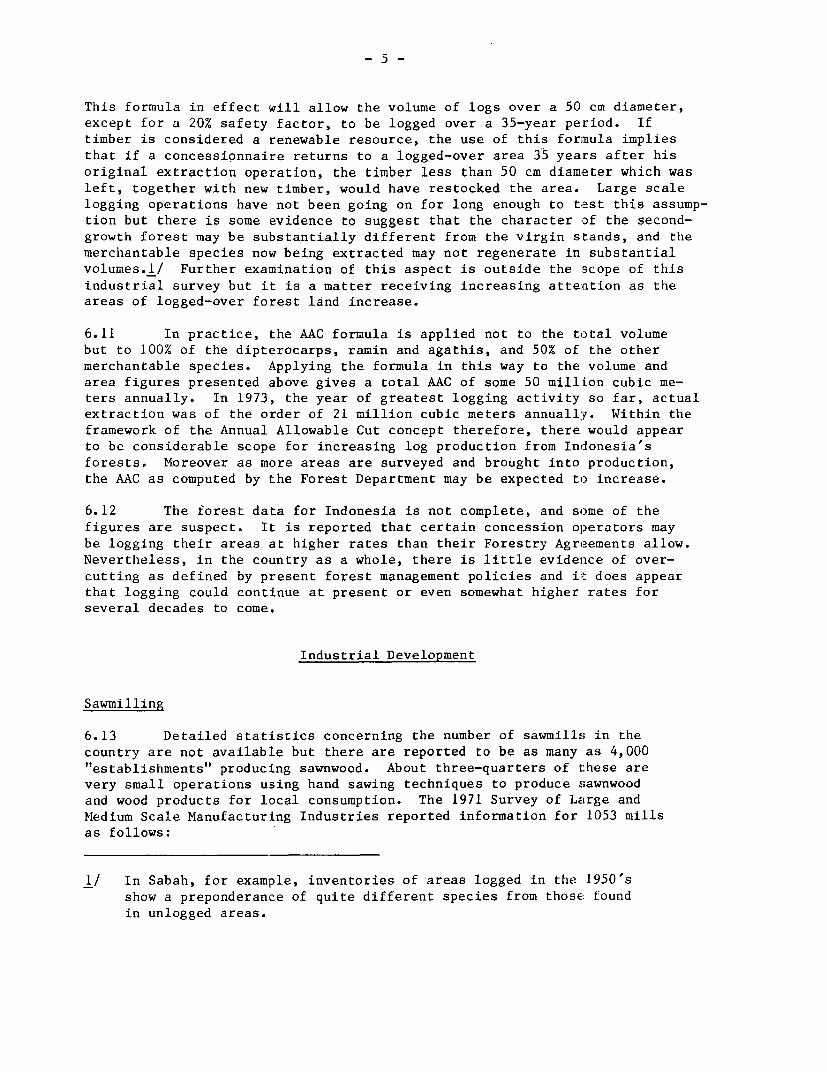
This formula in effect will allow the volume of logs over a 50 cm diameter,except for a 20% safety factor, to be logged over a 35-year period. Iftimber is considered a renewable resource, the use of this formula impliesthat if a concessionnaire returns to a logged-over area 35 years after hisoriginal extraction operation, the timber less than 50 cm diameter which wasleft, together with new timber, would have restocked the area. Large scalelogging operations have not been going on for long enough to test this assump-tion but there is some evidence to suggest that the character of the second-growth forest may be substantially different from the virgin stands, and themerchantable species now being extracted may not regenerate in substantialvolumes.l/ Further examination of this aspect is outside the scope of thisindustrial survey but it is a matter receiving increasing attention as theareas of logged-over forest land increase.
6.11 In practice, the AAC formula is applied not to the total volumebut to 100% of the dipterocarps, ramin and agathis, and 50% of the othermerchantable species. Applying the formula in this way to the volume andarea figures presented above gives a total AAC of some 50 million cubic me-ters annually. In 1973, the year of greatest logging activity so far, actualextraction was of the order of 21 million cubic meters annually. Within theframework of the Annual Allowable Cut concept therefore, there would appearto be considerable scope for increasing log production from Indonesia'sforests. Moreover as more areas are surveyed and brought into production,the AAC as computed by the Forest Department may be expected to increase.
6.12 The forest data for Indonesia is not complete, and some of thefigures are suspect. It is reported that certain concession operators maybe logging their areas at higher rates than their Forestry Agreements allow.Nevertheless, in the country as a whole, there is little evidence of over-cutting as defined by present forest management policies and it does appearthat logging could continue at present or even somewhat higher rates forseveral decades to come.
Industrial Development
Sawmilling
6.13 Detailed statistics concerning the number of sawmills in thecountry are not available but there are reported to be as many as 4,000"establishments" producing sawnwood. About three-quarters of these arevery small operations using hand sawing techniques to produce sawnwoodand wood products for local consumption. The 1971 Survey of Large andMedium Scale Manufacturing Industries reported information for 1053 millsas follows:
1/ In Sabah, for example, inventories of areas logged in the 1950'sshow a preponderance of quite different species from those foundin unlogged areas.

- 6 -
Table 6.7
Sawmill and Wood Processing Plants, /1971
Item Units "large" plants "Medium" Plants Total
No. of Plants No. 38 1,015 1,053
Log Input 3
- total m3/A 365,000 775,000 1,140,000
- average/plant m /A 9,600 800 1,100
Production 3
- total m3/A 205,000 410,000 615,000
- average/plant m /A 5,400 400 600
Employees- total No. 6,136 13,005 19,141
- average/plant No. 161 13 18
Value of Output 6,900,000 13,300,000
- total US$/A 6,400,000 6,800 12,600
- average/plant US$/A 170,000
1/ These statistics include some plants which further process sawnwood into
various wooden manufactures; however about 85% of the value of the out-
put is sawnwood.
6.14 These plants, designated "large" and "medium" in the survey are
nevertheless small by world standards. At the time of the 1971 survey, most
of the mills of any size were on Java and were sawing teak. About one-half
of the mills in the "large" category were operated by Perhutani, a Government
timber extraction and processing corporation. Total recorded timber produc-
tion in recent years is not reliably available but the available data from
three sources are reported in the following table:
Table 6.8
Reported Sawnwood Production
Year Volume1/ 2/ _3/
Source 1- Source 2- Source 3-(thousand cubic meters)
1971 1,700 615
1972 - 1,700
1973 249 1,690
1974 545 1,6901975 5691976 1,100 (prelim.)
1/ Department of Industry.2/ FAO Forestry Yearbook.
3/ Survey of Manufactguring Industries.

7-
6.15 As previously noted, the figure of 615,000 cubic metersshown for 1971 by Source 3 (The Survey of Manufacturing Industries) appliesto 1,053 medium and large sawmills in operation in that year. It is esti-mated that an additional 3,000 small sawmills were in operation and on theassumption that they processed an average of 200 cubic meters each duringthe year, total production for that year would be of the order of 1.2 mil-lion cubic meters. The FAO figures are reported as estimated and presumablyinclude an estimate of production from all types of sawmill. The figuresfrom the Department of Industry are substantially less than those from anyother source and presumably apply only to those relatively new sawmillswhich have been licensed by the Department.
6.16 Although accurate estimates of sawnwood production are impossiblewith the available data, it would appear that in the early 1970's domesticproduction was between I and 2 million cubic meters annually. In the past2-3 years the construction of new sawmills has been undertaken as a condi-tion of timber concession operation and in 1976, it appears that these saw-mills produced about 1.1 million cubic meters of sawnwood.
New Sawmill Construction
6.17 In 1976, there were 78 sawmills registered in the Department ofIndustry, 67 of these registered as domestic industries while 11 had someforeign ownership and were registered as such. Most of these plants have beenconstructed in the paslt 5 years and are not therefore listed in the data ofthe Survey of Manufacturing Industries presented in Para. 6.13. Some detailsof these new sawmills are presented in the following table.
Table 6.9
Registered Sawmills, 1976
Item Units PMA Plants 1/ PMDN Plants 2/
Number of Plants No.. 11 67
Capacity 3- total m3JA 350,000 1,500,000- average/plant m /A 32,000 22,000
1975 Production 3- total m3'A n.a. 430,000 3/- average/plant m3 OA --- 10,500
Employees
- total No. n.a. 9,700- average/plant 3/ No. --- 145
1/ Foreign investmeni: projects (Penanaman Modal Asing)2/ Domestic investment projects (Penanaman Modal Dalam Negeri)3/ 1975 production statistics were available for only 41 of the PMDN plants.
Average capacity utilization in those plants reporting production was 49%.
-8-
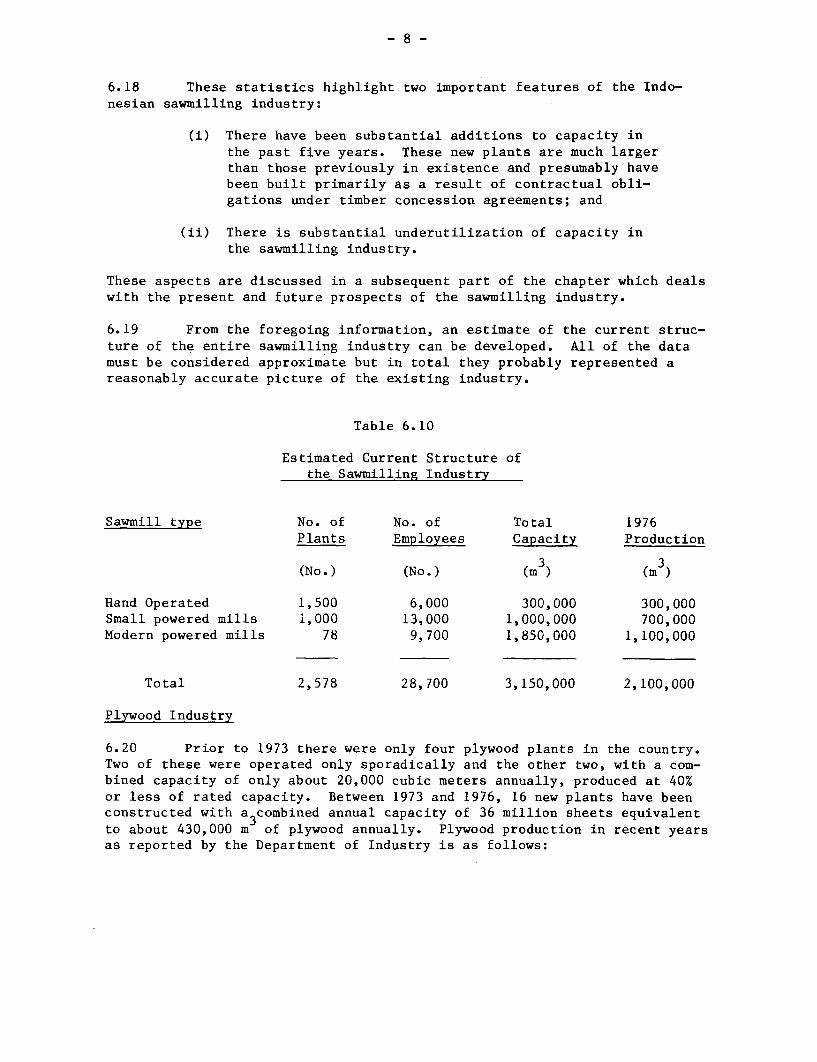
6.18 These statistics highlight two important features of the Indo-nesian sawmilling industry:
(i) There have been substantial additions to capacity inthe past five years. These new plants are much largerthan those previously in existence and presumably havebeen built primarily as a result of contractual obli-gations under timber concession agreements; and
(ii) There is substantial underutilization of capacity inthe sawmilling industry.
These aspects are discussed in a subsequent part of the chapter which dealswith the present and future prospects of the sawmilling industry.
6.19 From the foregoing information, an estimate of the current struc-ture of the entire sawmilling industry can be developed. All of the datamust be considered approximate but in total they probably represented areasonably accurate picture of the existing industry.
Table 6.10
Estimated Current Structure ofthe Sawmilling Industry
Sawmill type No. of No. of Total 1976Plants Employees Capacity Production
(No.) (No.) (m 3) (m3)
Hand Operated 1,500 6,000 300,000 300,000Small powered mills 1,000 13,000 1,000,000 700,000Modern powered mills 78 9,700 1,850,000 1,100,000
Total 2,578 28,700 3,150,000 2,100,000
Plywood Industry
6.20 Prior to 1973 there were only four plywood plants in the country.Two of these were operated only sporadically and the other two, with a com-bined capacity of only about 20,000 cubic meters annually, produced at 40%or less of rated capacity. Between 1973 and 1976, 16 new plants have beenconstructed with a3combined annual capacity of 36 million sheets equivalentto about 430,000 m of plywood annually. Plywood production in recent yearsas reported by the Department of Industry is as follows:

- 9 -
Table 6.11
Plywood Production
Year Sheets Volme(million) (m )
1973 2.3 27,0001974 6.0 71,0001975 10.0 120,0001976 (prelim) 20.0 240,000
Source: Department of Industry
General Assessment
6.21 The past five years have seen impressive growth in capacity inboth the sawmilling and plywood industries. In 1976, out of a total logharvest estimated at .1 million cubic metres, about 6 million cubic metresor nearly 30% were processed domestically. Despite this impressive growththere is clearly suff.cient scope for more domestic processing providedmarkets can be secured and an attractive investment climate established.These aspects are examined in the following sections of this chapter.
Development Prospects
6.22 The requirement of timber concession agreements that new timberprocessing plants must: be built as a condition of operation of the con-cession have been quite effective in bringing about the construction ofnew domestic capacity.. Furthermore, substantial new capacity is plannedas shown in the following table:

- 10 -
Table 6.12
Proposed New Sawmills and Plywood Mills
Item Units Foreign Domestic TotalInvestment Investment
Plants proposed- sawmills No. 25 44 69- plywood mills No. 6 6 12
Total Capacity 3- sawmills m3/A 1,400,000 1,300,000 2,700,000- plywood mills m /A 440,000 80,000 520,000
Employees- sawmills No. 6,600 6,400 13,000- plywood mills No. 5,000 2,200 7,200
Investment- sawmills $ million 64.3 60.0 124.3- plywood mills $ million 47.0 17.0 64.0
- Total $ million 111.3 77.0 188.3
6.23 Assuming that these new plants are built, and that by 1980 allnew and existing plants are operating at 70% of capacty, total log inputto the domestic processing industry will be of the order of 12 millioncubic meters annually. If annual log exports stabilize at about 15 millioncubic meters, this would imply that domestic processing of Indonesian logswould increase from the present level of 30% to nearly 45%. This figurecompares with about 43% in the Philippines and 50% in Malaysia and is clearlya feasible as well as a desirable objective.
6.24 Such progress would be impressive. However at the present timesome of the existing plants are operating at substantially less than ratedcapacity and in some cases are not operating at all. To overcome theseproblems and to ensure that as new plants come on stream they make an ef-fective contribution to output in this subsector, careful attention will haveto be paid to ensuring that:
(i) Suitable markets are available for the processedtimber; and
(ii) The industrial climate is such that the plants canbe operated so as to generate reasonable rates ofreturn on investment.

Markets
6.25 Up to the present time, all of the plywood and most of the sawn-
wood produced in Indonesia is consumed domestically. According to projec-
tions of the Department of Forestry, there is still considerable unsatisfied
demand for these products in the country as shown below:
Table 6.13
Projected Domestic Demand of Sawnwood and Plywood
Item 1976 1980Supply Demand Supply 1/ Demand
(million cubic meters)
Sawnwood 2.1 5.8 4.1 6.6
Plywood 0.24 0.28 0.7 0.31
1/ Supply in 1980 projected on basis of 70% utilization of projected
capacity.
6.26 The demand figures for 1976 are based on expected figures of per-
capital demand for sawnwood and plywood. Actual consumption was considerablylower and after allowing for exports, only about one-third of the reported
domestic demand for sawnwood was met. This presumably reflects the inability
of many Indonesians to finance timber purchases, making do with lower-costtraditional building materials. Prices of timber have risen sharply in re-
cent months and it would seem inevitable that the actual domestic consumption
of both plywood and sawnwcod will be considerably less than the theoreticaldemand for many years to come. Thus realistically, although projectionssuggest a shortage of sawnwood in the domestic market for 1980, there will
almost certainly be potential for an exportable surplus of several millioncubic meters. An exportable surplus of plywood is also expected, in thiscase amounting to several hundred thousand cubic meters. These figures are
disturbingly imprecise but in the absence of more definitive informationconcerning capacity, operating ratios and domestic consumption, it is im-
possible to pinpoint them with any greater accuracy. Nevertheless it is
possible to briefly review the international markets for sawnwood and ply-wood of the types which would be produced in Indonesia and thereby assessthe potential for marketing volumes of the magnitudes projected.
6.27 The Asian sawnwood trade is based on the logs of Indonesia, Malaysia
and the Philippines. Statistics for 1974 based on the published data of
FAO are as follows:

- 12 -
Table 6.14
Trade from Selected South-east AsianSawnwood Producers, 1974
Importing Country Exporting Countryor Region Malaysia Singapore Indonesia Philippines Total
(thousand cubic meters)
Asia- Japan 249 51 18 91 409- Singapore 563 - 130 - 693- Other 120 199 78 20 417North America 164 68 5 74 311Europe 636 210 85 41 972Africa 62 175 5 - 242Oceania 201 68 9 58 336
Total 1,995 771 330 284 3,380
6.28 These data suggest the following:
(i) The total market for South-east Asian sawnwood is onlyabout 3.4 million cubic meters annually. There wouldclearly have to be some significant structural changesif Indonesia is to effectively market "several" millioncubic meters; and
(ii) Japan, Singapore and Europe are the major markets forsawnwood from this region.
6.29 Similar statistics are available for plywood:
Table 6.15
Trade in Asia Plywood, 1974
Importing Country Exporting Countryor Region S. Korea China Philippines Singapore Malaysia Japan
(thousand cubic meters)
Japan 190 127 - 10 1 -Other Asia 16 104 24 95 106 16North America 643 357 78 47 29 93Europe 23 62 12 93 55 12Other 4 35 4 44 8 2
Total 876 685 118 289 199 123

- 13 -
6.30 Indonesia exported a few thousand cubic meters of plywood in 1976but if exports are to rise to the "several hundred thousand" cubic metersprojected for 1980, the country will clearly become a significant factor inthis market.
6.31 Because it is a major supplier of logs to the sawmill and plywoodindustries of Japan, China (Taiwan) and Korea, Indonesia has the power togradually bring about the type of structural change in the markets which willsubstantially increase trade in these products while at the same time lessen-ing the trade in unprocEssed logs. There is little incentive in the coun-tries where processing is already undertaken to institute this type of struc-tural change and it will have to be brought about by the deliberate initia-tion of policies within Indonesia. Such policies have been adopted with somesuccess in Malaysia and in the Philippines. In fact the extent to which thesepolicies have only been partially successful must be attributed to the verygreat increase in log exports from Indonesia over the past several years.
6.32 To date there has been little work specifically aimed at presenting"Indonesian timber" effejctively in world markets. Much of the groundworkhas already been accomp:lished in that the Indonesian species are virtuallyidentical to those successfully marketed from Malaysia, Singapore and thePhilippines. The major markets in Europe and Japan know these species andthus one of the major hurdles of marketing timber from a new supply source hasbeen overcome. Product quality standards (the Malaysian Grading Rules) areaccepted in world markets and an Indonesian version should further improveproduct marketability. Unfortunately, some of the early shipments of Indo-nesian timber did not meet specified quality standards and in some marketsthis has given the product a questionable reputation. To ensure that thissituation does not deteriorate further and a healthy market is developedit is imperative that:
(i) The industry adopt and conform .to a set of qualitystandards and grading rules; and
(ii) Steps be taken to ensure that the mills have theequipmernt and the trained personnel to produce sawn-wood and, plywood which conform to these quality stan-dards.
Financial and Economic Climate
6.33 The export of unprocessed logs from Indonesia over the past 6-7years has, for the most part, been a very profitable activity. The pro-duction of sawnwood ancl plywood for sale in the domestic and export mar-kets has not. The reasons most frequently cited for this latter situationare:

- 14 -
(i) Capital costs are high in Indonesia because of: (a)the high cost of infrastructure associated with many ofthe developments; (b) rapidly escalating equipmentprices; and (c) the high costs of importing equipmentand materials into Indonesia due to high freight rates,and handling and other charges.
(ii) Operating costs are high in Indonesia because of (a)the cost of operating and maintaining associatedinfrastructure; (b) the lack of skilled labor whichadversely affects operating efficiency; and (c) thehigh cost of importing operating and maintenancesupplies due to high freight rates and handling charges.
6.34 In the past 2-3 years, world prices for sawnwood and plywood havedropped sharply as a result of declining demand due to a slowing-down inconstruction, particularly residential construction in Japan and the UnitedStates. Indonesian producers with new high-cost plants are in competitionwith existing plants in other countries which were built at lower cost, andwhich now have highly trained operating crews. In the future prices maybe expected to rise again but at the present time it is exceedingly diffi-cult for an Indonesia plant to compete in world markets with establishedplants in Malaysia, Japan, Korea and Taiwan.
6.35 This type of situation exists in many industries and in manycountries but in this case, since many of the competing plants are usingIndonesian logs, the means for a partial remedy is in the hands the Gov-ernment. Specifically if taxation policies were reviewed to provide moreincentive for domestic processing and less incentive for log exports topotential competitors in other countries, the competitive situation couldbe improved.
Conclusions
6.36 The policies of the Indonesian Government have been successfulin bringing about the construction of substantial new sawnwood and plywoodproduction capacity over a relatively short period of time. However, ifthis capacity and the substantial addition which are planned for the nextfew years is to be effectively utilized to bring about the desired effectof increasing value-added and employment in this industry in Indonesia,then certain positive steps will have to be undertaken by the industry andby Government. The critical problems which have been identified as im-peding progress towards these goals are:

- 15 -
(i) The lack of well-defined markets into which largevolumes oi- Indonesian-produced sawnwood and ply-
wood can move; and
(ii) The lack of major financial incentive to shift from
log exporits to domestic processing.
6.37 Under normal circumstances it might be expected that t:here would
be considerable incentive from within the industry to overcome these prob-
lems. However in Indonesia:
(i) The organizations who have constructed and are opera-ting most of these plants are timber concession holders
whose main business is exporting logs;
(ii) In many cases the plants were constructed reluctantly
by the concession holder, merely in order to allowhim to continue extracting and exporting logs; andtherefore
(iii) Under these circumstances the normal motives for en-suring efficient operation of these plants are at
least partially absent.
6.38 It is therefore imperative that the Government take steps to en-
sure that the considerable investments in sawmilling and plywood machinery
are effectively and economically utilized. The first step should undoubtedly
be an in-depth survey of the problems of the industry leading to recommen-
dations for solutions. On the basis of this preliminary overview, it has
been concluded that such solutions might include:
(i) The establishment of an effective export timbermarketing board. This Board would initially be setup by the Government but financed through contribu-tions from industry to establish and monitor quality
standards, and to develop markets and marketing chan-nels. The board would also establish links withmajor log importing organizations in order to assistin promoting an orderly phasing down of log exportsin conjunction with a building up of processed wood
exports into the same markets;
(ii) The establishment of training and other technical fa-cilities designed to assist plants to produce sawn-wood and plywood to defined quality standards; and
(iii) A review of taxing and pricing policies aimed at
Giving the industry more incentive to produce sawn-
wood and plywood domestically, and less incentive toexport unprocessed logs.

- 16 -
VII. THE PULP AND PAPER INDUSTRY
Introduction
7.01 Although the pulp and paper industry has obvious linkages to thetimber industry, in the context of Indonesia the separate examination ofthese two subsectors is warranted because:
(i) The timber resources which constitute the major part ofIndonesia's large and profitable timber trade are not ne-cessarily those which would be most suitable for thedomestic manufacture of pulp and paper;
(ii) At the present time, most of the paper manufactured inthe country is produced from non-wood fibers; and
(iii) The development problems and prospects for the two sub-sectors are not the same.
7.02 The most significant feature of the Indonesia pulp and paper in-dustry is the slow development of domestic production leading to a verylarge dependence on imports, despite the availability of a wide variety offibers suitable for paper-making. Only 20% of the country's requirement forpaper and paperboard is produced domestically, and much of this productionis from imported pulp. In 1975, even though world prices were significantlydepressed, imports of pulp, paper and paper products were valued at overUS$70 million.
7.03 This chapter examines the history, present status and futureprospects of the pulp and paper industry in Indonesia, giving particularemphasis to the factors which have constrained its development in the past,and to identifying programs and specific projects which could enhance itsdevelopment in the future.
Structure of the Industry
Imports
7.04 Because 80% of Indonesia's paper requirements are imported, it islogical to begin any examination of the structure of the industry with abrief review of the paper importing business. In 1975, the volume of im-ports by principal grade and origin were as shown in the following table.

- 17 -
Table 7.1
Pattern of Paper Imports (1975) 1/
Grade Group Amount by OriginJapan Other Asia N.America Europe Other Total
(thousands of tons)
Newsprint 14.1 3.3 16.0 9.2 4.1 46.7Printing & Writing 19.0 5.5 7.2 3.5 0.1 35.3Packaging Paper & Board 16.9 19.7 13.5 9.2 7.5 66.8Speciality Papers 4.7 2.1 1.4 4.7 - 12.9Paper Products 2.5 3.1 1.0 0.8 0.4 7.8
Total 57.2 33.7 39.1 27.4 12.1 169.5
1/ Foreign Trade Statistics of Indonesia
7.05 Although Japan is the largest single supplier country, it by nomeans dominates the supply picture. Substantial volumes of newsprint, forexample, are imported from Canada, New Zealand, Norway and Fin:Land. Kraftsack paper and linerboard are shipped primarily from the United States.Other important suppliers of various grades include China, Taiwan, Singapore,Sweden and France. The large number of suppliers make this market (and othersin Southeast Asia) very competitive with few long-term contracts between theproducer and the Indonesian importer or agent. Prices vary considerably,often being lower than the world prices between major trading partners duringperiods of over-supply, and very much higher when paper is in short-supply.The region is known as a "dumping ground" for major producers where neitherformal nor informal price agreements are observed.
7.06 Imports of paper are important not only as the major source of papersupply, but also because the import price is the major determinant of theprices obtained by local producers. Most domestic production is in the print-ing and writing grades and the prices of competing domestic and importedsupplies of these grades, after adjustment for all duties, taxes, and othercharges, are generally within 5% of one another. Thus the variability of theprices of imported paper provides an element of instability in the domesticproducers' market which is, however, partly offset by the system of check-pricing 1/ used to assess import duties.
Existing Domestic Capacity
7.07 At the present time there are 8 paper plants in operation in thecountry. In total these plants employ about 6,000 people. The current value
1/ Check-pricing is a system whereby prices are set by the Government forthe purposes of computing import and export taxes. This removes themajor incentive for under-invoicing to minimize these taxes.

- 18 -
of the assets of the industry is not known but to replace the existing capa-city at today's prices would require an investment of the order of $150million. The existing mills are as follows:
Table 7.2
Operating Pulp and Paper Plants in Indonesia
Plant and Ownership Year Started Capacity 1975 Production(tons/annum)
Government-Owned- Padalarang 1923 4,900 4,700 1/- Lejes 1940 14,000 13,800- Blabak 1961 7,200 6,500- Basuki Rachmat 1969 14,000 10,000- Gowa 1967 15,000 10,900
Privately-Owned:- Surya Kertas 1975 9,000 - 2/- Delta Paper Mill 1975 1,200 - 2/- Inpama 1975 1,500 - 2/Total 66,800 45,900
1/ Estimated2/ These mills commenced operation in 1975; their production in that
year is not known.
7.08 The Basuki Rachmat and Gowa mills have recently expanded, but theexpansions were not fully operational in 1975. Otherwise, all of theGovernment-owned mills which are operating are running at close to fullcapacity. Most of this capacity is for printing and writing grades al-though cigarette paper, tissue, and some light boards are also produced.Two other mills are owned by the Government but are not now operating. ThePematang Siantar mill in North Sumatra was designed to produce 5,000 tonsof newsprint annually and operations first commenced in 1962. It was closeddown in 1965 but operated again in the late 1960's and early 1970's at verylow production rates. In 1975, the paper machine from this mill was dis-mantled and shipped to Gowa where it formed the nucleus of that mill's ex-pansion. The other mill which is not in operation is the Martapura milllocated near Bandjarmasin in South Kalimantan. Construction of this millcommenced in 1959 and the first commercial operation was in 1972. At thepresent time, however, it is shut down and it is not clear whether it willever be started up again. Brief descriptions of the operating mills arecontained in the following paragraphs.
7.09 The Padalarang mill located near Bandung in West Java is theoldest in the country. Operations commenced in 1923 and were expanded

- 19 -
in 1938 with the addition. of a second paper machine. A third paper ma-
chine to produce cigarette paper was added recently. The mill now pro-
duces up to 5,000 tons annually of printing, writing, cigarette and wrap-
ping papers from rice-straw pulp made at the mill, supplemented with pur-
chased pulp and waste paper. With the exception of the new paper machine,most of the equipment in the plant is obsolete and not in very good condi-
tion. Thus, although operations are as efficient as equipment limitationsallow, chemical costs are high and paper quality off the older paper ma-
chines is low. The mill is reported to be modestly profitable but only
as a consequence of the highly protected domestic market. The mill is lo-cated in a major rice growing region and there is apparently adequate ricestraw over and above existing requirements to supply an expanded operation.However, no expansion is planned.
7.10 The Lejes mill in East Java is the country's largest and is cur-
rently expanding to a capacity of 24,000 tons through a program of pulp-mill expansion and paper machine modernization. This program is being
financed indirectly by the Bank through Bapindo, the Development Bank ofIndonesia. The mill produces printing and writing papers on two paper ma-
chines, from bleached rice-straw pulp manufactured at the mill, supplemented
with purchased long-fibered pulp and waste paper. As part of the current
expansion plan, a chlorine and caustic plant is being installed. The millhas generated profits in each year since 1972 when domestic paper prices
rose sharply through the imposition of higher duties on imports. The cur-rent expansion should improve the financial position of the mill. as sub-stantial increases in production will be achieved for a relatively modestinvestment. The Lejes mill has tentative plans for further expansion by
the addition of a new puLping line and a new paper machine with a capa-city of 45,000 tons annually. There is insufficient rice straw in the re-gion to support an expansion of this magnitude and the company proposes to
use bagasse.
7.11 The Blabak mill in Central Java has the capacity to produce 7,200tons of printing and writing papers annually using bleached rice-straw pulpmanufactured at the mill together with purchased long-fibered pulp. The
mill was built in the late 1950's, partially financed through Italian aid,and was later owned and operated by Bapindo. Like the four other Government-owned mills it is now run as an independent corporation under the supervision
of the Directorate General of Chemical Industries. The mill was built to usethe Italian two-stage Poinilio pulping process but this has been modified to
a conventional soda cook, similar to that utilized in the Padalarang andLejes mills. There is apparently ample excess rice-straw in the region and
the mill is proposing an expansion of some 14,000 tons annually. Applica-
tion has been made to Bapindo for assistance in financing this project. At
the present time, the mill is reported to be barely profitable.
7.12 The Basuki Rachmat mill near Banjuwangi in East Java producesprinting and writing papers from bleached sulphate bamboo and pine pulp.
The mill was supplied under a Japanese reparation scheme and includes a
chemical recovery system. With the assistance of a loan from Bapindo the
- 20 -
mill has recently been optimized and effective capacity increased from9,000 to 14,000 tons annually. An electrolytic plant for producing chlorineand caustic soda was included in this project. The mill was originally de-signed to utilize solely bamboo as raw material but harvesting and operatingproblems in the early years led to the establishment of plantations of Pinusmerkusii. The mill began using pine several years ago, apparently success-fully. At the expanded production level, this mill is expected to be mod-erately profitable.
7.13 The Gowa paper mill near Ujung Padang in South Sulawesi was de-signed and built along with the Basuki Rachmat mill as part of a Japanesereparation scheme. The mills are similar in design and concept. The Gowamill has recently expanded production from the original 9,000 tons annuallyto 15,000 tons, by adding the rebuilt machine taken from the now defunctPematang Siantar mill. A coating line for printing and writing paper pro-duction was added at the same time, and this expansion, financed in part byBapindo, is now in commercial operation. This mill is operated efficientlywithin the limitation of the available equipment. Gowa's paper is consi-dered to be among the best of the domestically produced grades and the com-pany generates modest profits. To decrease the problems associated withusing bamboo as a raw materials, the company is also utilizing locally ob-tained mangrove. In addition, plantations of pine and eucalyptus are beingestablished and in the long term, an expansion based on these raw materialsis contemplated.
7.14 None of the three newly constructed private mills includes an in-tegrated pulping facility and all use imported pulp. The Impama mill inJakarta is designed to produce 1,500 tons per annum of tissue and in thiscase the pulp furnish is supplemented with waste paper. The Surya Kertasmill in Central Java will produce 9,000 tons of printing and writing paper.The Delta paper mill in North Sumatra will produce 1,200 tons of cigarettepaper annually.
Current Development Activity
7.15 The Directorate of Chemical Industries reports that nine new mills,all in the private sector, are presently under construction in Indonesia,and licenses have been granted to a number of others. Key features ofthose mills reported to be actually under construction are summarized inthe following table.

- 21 -
Table 7.3
New Pulp and/or Paper MillsUnder Construction in Indonesia
Capacity Type 1/ Start-up Estimated(tons/A) Date Capital
($ million)
West Java- Bekasi Tegush 12,000 (d) 1977 n.a.- Pindodeli 9,000 (a) 1977 4.5- Unipa Daya 18,000 (a) 1977 5.0- Karya Tulada 4,000 (c) n.a. n.a.- Papyrus Sakti 4,000 (c) 1977 1.0
East Java- Tjiwi Kimia 12,000 (a) 1977 6.0- Sarawati Bhakti 14,000 (a) 1977 9.5- Pakerin 24,000 (b) n.a. n.a.- Eureka Abad. 12,000 (d) n.a n.a.
1/ Type Key: (a) printing & writing, imported pulp(b) printing & writing, pulping included(c) other grades, imported pulp(d) other grades, pulping included
7.16 If completed on schedule, this program will bring the installedpaper production capacii:y in Indonesia to a total of 176,000 tons annually(equivalent to above 160,000 tons of effective capacity), of which approxi-mately 110,000 tons would be in printing and writing grades. By 1980, thetotal demand for paper is expected to reach approximately 410,000 tons, sothat substantial imports would still be required in all grades except printingand writing paper. Moreover, because much of the new capacity would usepurchased pulp, imports of pulp would increase from a present level of 20,000tons to about 70,000 toiis annually. Although current development activity isimpressive in terms of the number of projects, these are on a very small scaleand in view of the grow:ing demand, they will not materially reduce thecountry's reliance on imports.
Technology
7.17 The existing industrial plants, and those under construction, canbe grouped in three categories according to the level of technology employed.
(i) Non-intepgrated Paper Mills: These are the simplestmills, comprising one or more paper machines with astock preaparation system and associated service plants.Fiber fu:cnish for the paper machine, consisting of pulpand sometimes waste paper, is purchased externally. Thethree existing privately-owned mills, and six of thenine milLs under construction are of this type.
- 22 -
(ii) Integrated Pulp and Paper Mills without ChemicalRecovery: Three of the Government mills (Padalarang,Lejes and Blabak), and three of the mills under con-struction are of this type. All are pulping ricestraw by the soda process and the spent liquor aftercooking is simply discharged from the mill as effluent.Chemical recovery processes are technically feasiblefor these plants but they would be complicated by thehigh levels of silica in the rice straw, and would beof doubtful economic worth in view of the small plantsizes.
(iii) Integrated Pulp and Paper Mills with Chemical Recovery:The Basuki Rachmat and Gowa Mills are fully integratedsulphate pulp mills with chemical recovery sytems. Inbasic process design they are therefore similar to mo-dern pulp and paper mills throughout the world. How-ever, their design production capacity is perhaps one-fifth of what might be considered the minimum economicsize for this type of plant and, as discussed below,the costs of production are therefore excessivelyhigh.
7.18 Basic processes in the pulp and paper industry have not changedsubstantially over the past 20 years although many technological improve-ments have led to improved yields, better product quality and lower pro-duction costs. Most of the equipment in use in Indonesian mills is thussimilar in concept to the large, modern equipment constructed today andcan, at least in principle, produce similar grades of paper. The newermills in Indonesia are still very small by modern standards, and in orderto keep their capital costs low the designers have patterned their equip-ment along the lines of that in the older mills. Again, these mills arecapable of producing good quality paper but operating costs are high be-cause:
(i) The equipment is smaller and slower and has somecosts which are more-or-less fixed per piece ofequipment (labor and some overheads, for example),making them much higher on a per ton of paperproduct basis;
(ii) Modern mills incorporate extensive facilitiesfor the recovery and re-use of fiber and chemi-cals whereas older mills (or very small millsusing old designs) do not;
(iii) Older mills are less efficient in terms of theirutilization of heat and power; and
- 23 -
(iv) Older mills incorporate less sophisticated qualitycontrol features and the varying quality of paperleads to losses in the finishing operations. InIndonesia's oldest mill, Padalarang, these lossesrange up) to 25% of the production off the papermachine; in the newer mills, 10-15 seems to benormal.
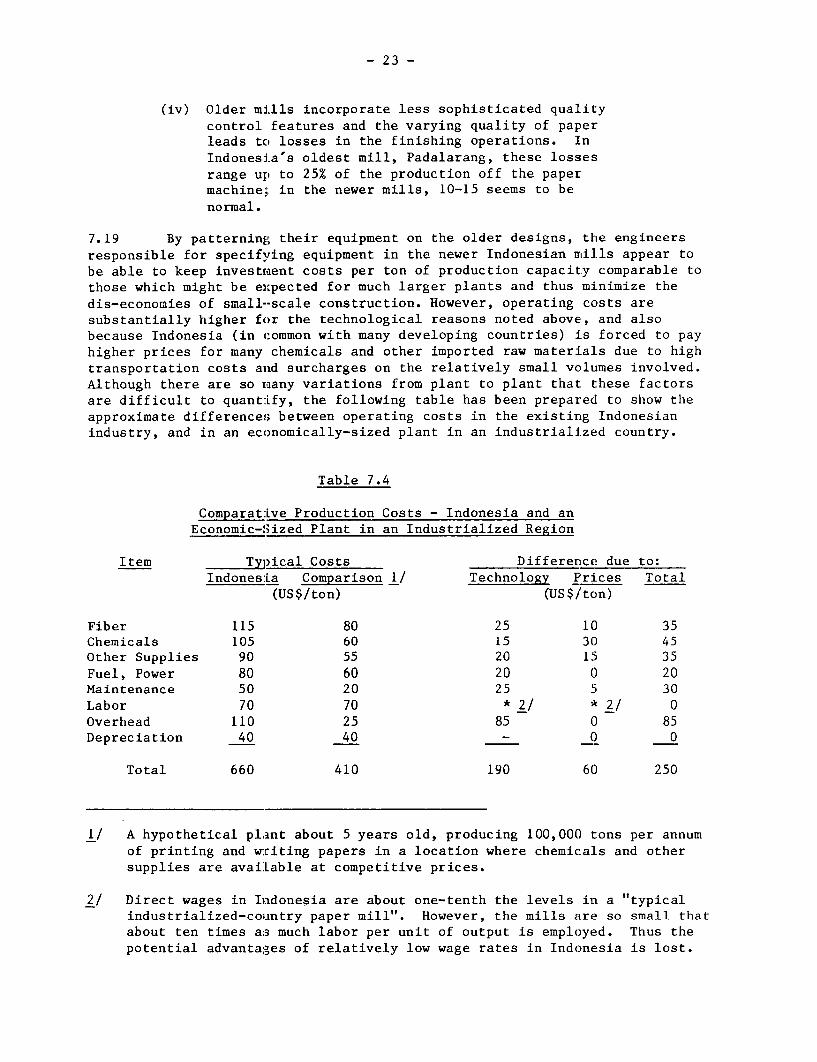
7.19 By patterning their equipment on the older designs, the engineers
responsible for specifying equipment in the newer Indonesian mills appear tobe able to keep investrment costs per ton of production capacity comparable tothose which might be expected for much larger plants and thus minimize the
dis-economies of small--scale construction. However, operating costs aresubstantially higher for the technological reasons noted above, and alsobecause Indonesia (in common with many developing countries) is forced to payhigher prices for many chemicals and other imported raw materials due to hightransportation costs and surcharges on the relatively small vclumes involved.Although there are so maany variations from plant to plant that. these factorsare difficult to quant:ify, the following table has been prepared to show theapproximate differences between operating costs in the existing Indonesianindustry, and in an economically-sized plant in an industrialized country.
Table 7.4
Comparative Production Costs - Indonesia and anEconomic-Sized Plant in an Industrialized Region
Item _Tvical Costs Difference due to:Indonesia Comparison 1/ Technology P'rices Total
(US$/ton) (US$/'ton)
Fiber 115 80 25 10 35Chemicals 105 60 15 30 45Other Supplies 90 55 20 15 35Fuel, Power 80 60 20 0 20Maintenance 50 20 25 5 30Labor 70 70 *2/ * 2/ 0Overhead 110 25 85 0 85Depreciation 40 40 - 0 0
Total 660 410 190 60 250
1/ A hypothetical plant about 5 years old, producing 100,000 tons per annumof printing and writing papers in a location where chemicals and othersupplies are avaiLable at competitive prices.
2/ Direct wages in Indonesia are about one-tenth the levels in a "typicalindustrialized-coiantry paper mill". However, the mills are so small thatabout ten times as much labor per unit of output is employed. Thus thepotential advantages of relatively low wage rates in Indonesia is lost.

- 24 -
It can be seen that the existing Indonesian pulp and paper mills suffera basic cost disadvantage due to equipment size, the lack of equipmentsophistication, and their location. No matter how efficiently these plantsmay be operated, they suffer a substantial cost disadvantage by comparisonwith economically sized plants in other regions. Most of the plants nowunder construction in the country will suffer a similar disadvantage.
Profitability
7.20 Recent production and operating cost data were examined for fourof the Government-owned mills and using this data, an approximate overallprofit-and-loss statement for the existing pulp and paper industry has beendeveloped. The following table shows the results of this analysis on a "perton of paper" basis. The table also illustrates how the CIF cost of importedpaper sets the price for the domestic industry.
Table 7.5Economics of Pulp and Paper Production in Indonesia 1/
Item Amount(US$/ton)
Imported PaperCIF Cost 460Duty 280Handling and Other Changes 80 360Prices ex-warehouse 820
Domestic ProductionPrice ex-warehouse 820Discounts 2/ 20Freight & Handling 50Commission, etc. 3/ 30 100
Mill Net Sales Revenue 720
Production CostsFiber 115Chemicals 105Other Supplies 90Fuel, Power 80Maintenance 50Labor 70Overhead 110Depreciation 40 660 4/Total
Profit Before Taxes 60
1/ Based on average data -from operating mills.2/ These discounts are probably given to volume customers, or for prompt payment.3/ Commissions are paid to sales agents in the main consuming centers.4/ Of which about US$300/ton is foreign exchange.

- 25 -
7.21 These data show quite clearly that:
(i) Direct operating costs exceed by a wide margin the cost of
importing paper;
(ii) The profit margin of the domestic industry is subst:antially
less than the duty applied to imported paper; and
(iii) The profit margin is extremely sensitive to the CIF cost
of imported paper; a reduction in the import price of
less than 10% would eliminate the profits of the Indonesian
industry.
Development Potential in the Industry
7.22 Despite the fact that three of the five Government-.owned mills
have recently completed expansion programs, three new privately-owned mills
have just commenced operation, and nine more mills are currently under con-
struction, Indonesia :Lmports more paper now than in 1970 and, unless a timely
start is made on some of the large projects which have been proposed but not
yet started, import requirements will be substantially more by 1980. This
situation is illustrai:ed in the following Table which shows demand and capacity
for 1970 and 1975, wit:h a projection to 1980.
Table 7.6
Past:, Present and Projected Future I/
Supply and Demand Balance
Plants in Effective Total Approximate
Operation Capacity 2/ Demand Supply Gap Import Value 4/
(No.) (tons/A) (tons/A) (tons/A) ($/A)
1970 5 24,000 140,000 116,000 60,000,000
1975 8 60,000 230,000 170,000 85,000,000
1980 17 160,000 410,000 3/ 250,000 120,000,000
1/ Considering only those plants actually under construction.2/ Calculated as 90,' of reported rated capacity.
3/ For details of this demand projection and projections to 1985, see Annex 7-1.
4/ At 1977 prices.
7.23 Because it takes from 3-4 years to plan, design and build a major
pulp and paper plant it is unlikely that the situation in 1980 will be substan-
tially different from that projected above. After 1980, development could
follow a number of alt:ernative routes including:

- 26 -
(i) A halt in the construction of new capacity, withincreased reliance on imports;
(ii) The continuation of the present practice of constructingand expanding small units primarily using imported pulpor agricultural residues; or
(iii) The construction of one or more relatively large unitsto supply both pulp and paper to the domestic market.
The Government's present policy is to attempt to promotedevelopment in the private sector. Licenses have been given for the con-struction of large and small mills but, up to the present time, only smallmills have been built and, as illustrated above, the supply gap is widening.In implementation, therefore, development strategy lies somewhere betweenalternatives '(i)' and '(ii)' above. Annex 7-1 contains a preliminarycomparative analysis of the costs and benefits associated with each of thesestrategies. 1/ The following table shows the results of this comparison.
1/ Annex 7-1 "Development Potential in the Pulp and Paper Sector" presentsdetails of the strategies examined, analyses of the fiber resources ofIndonesia as they related to the potential for pulp and paper production,and reviews of the domestic and export markets in this sector.

- 27 -
Table 7.7
Comparison of Alternative Development Strategies
In the Pulp and Paper Subsector
Item Strategy 1 Strategy 2 Strategy 3Brief Description No New Mill Continue Small Large and Medium
Construction Mill Construction Mill Construction
Domestic Supply (thousand. tons)1980 (Demand: 410) 146 146 1461985 (Demand: 600) 160 210 4461990 (Demand: 880) 160 320 650
Self-Sufficiency (percent)1980 36% 36% 36%1985 27% 35% 74%1990 18% 36% 74%
Projected Cost of Pulp and PaperImports in 1990 ($ million) 410 370 140
Investment Program1978 - 1990 ($ million) 0 290 1,200
Employment Created (jobs) 0 10,000 10,000
Cost of Employment Creatjion($/job) - 29,000 120,000
Return on Investment 1/ (percent)Financial 6% 17%Economic - negative 11%
Cost of Strategy1978 - 2000 ($ million)Imports 10,100 9,360 5,550Production Cost 1,300 2,050 3,550Capital 0 290 1,200
Total 11,400 11,700 10,300of Which Foreign Excchange 10,600 10,400 7,700
Net Benefit 2/ of Strategy, UsingEconomic Prices, Discounted toPresent Value at 10% ($ million)At Current Paper Prices 0 (180) 70At prices up by 20% 0 (140) 380At prices down by 20% 0 (230) (270)
1/ Financial returns estimated using current 60% duty protection on most grades.Economic return based on international prices but foreign exchange and laborshadow prices estimated at 125% and 50% of current market values.
2/ The "benefit" of Strategies 2 and 3 has been taken to be the differentialnet present value b't comparison with Strategy 1. Thus the net benefitof Strategy 1 is by definition, zero.

- 28 -
7.24 The above results, although based on data assumptions which mustbe considered approximate, allow the following conclusions to be drawn.
(i) By 1990, imports of paper could cost Indonesia betweenUS$140 million and US$400 million annually (in 1977 prices)depending on the development strategy adopted for the pulpand paper industry;
(ii) The present strategy of small mill construction is inefficientand expensive. It generates a low rate of financial return,a negative rate of economic return, and irrespective ofpaper price assumptions over a wide range, it is consistentlythe highest cost solution to Indonesia's paper supplyproblem; and
(iii) A program of large mill construction considered overallis not outstandingly attractive in terms of financial oreconomic rate of return but it would substantially reducethe foreign exchange cost of supplying paper. If thepaper prices used in the analysis are reasonably represen-tative of the real price level (in relation to productioncosts and capital costs) then building large pulp andpaper mills generates an economic rate of return slightlybetter than 10% and the incremental net present valueof this strategy (at a 10% discount rate) is $70 million.If paper prices increase in relation to other costs, how-ever, then the construction of large mills becomes a muchmore attractive alternative.
7.25 The generally low rates of return which are projected for anyinvestment in Indonesia's paper industry are typical of the results obtainedat the present time when evaluating investments in this industry in mostareas of the world. The costs of building and operating pulp and papermills have increased more rapidly than product prices and at the same timethe demand for paper has slumped as a result of the world economic slowdown.Present price levels are not sufficiently high to warrant construction ofnew capacity and as demand begins to pick up, a supply shortage in the mediumterm future, leading to price increases, appears inevitable.
Project Analysis
7.26 The tentative program of large mill construction evaluated inthe preceding analysis included: four medium-sized, partially integratedmills to produce printing, writing and packaging grades; a chemical pulp mill;a kraft paper and board mill; and a newsprint mill. The overall profitabilityof this program was shown to be marginal, by comparison with importing paper,but would become more attractive if world paper prices increases. If aprogram of large mill construction is to be embarked upon, it is evidentthat some ranking of the projects within such a program should be undertakenin order that priorities can be assigned.

- 29 -
7.27 At least six mills which would fit into such a program have beenproposed as projects in Indonesia. In some cases foreign partners havebeen found, the necessary licenses obtained, and timber concession agreementsreached. Nevertheless, at the present time not one of these projects isbeing implemented and there has been no notable progress towards implementationin the past 1-2 years. Reasons for this include:
(i) The high cost of the infrastructure which would berequired for some of the projects;
(ii) The large amount of investment capital required, whichin some cases may be beyond the resources of the presentsponsors to mobilize; and
(iii) The rather modest projections of profitability of theprevious projects.
7.28 In order to analyze these projects more closely, updated estimatesof costs and benefits have been developed and are presented in Annex 7-1. Theprojects have been reviewed more or less as proposed although in some casesthe capacity and product, line were modififed to better suit the projecteddomestic market. The projects are listed below. It should be noted that someof them would be complementary in supplying the domestic market in Indonesiawhereas others would be competing for the same market.
(i) Aceh: an unbleached kraft paper and board mill whichat full capacity would produce 170,000 tons per annumof sack kraft paper, linerboard, and other kraft paperfor the domestic market.
(ii) South Sumatra: a bleached kraft pulp and paper millwhich at full capacity would produce 80,000 tons perannum of printing and writing paper, and 100,000 tonsper annum of pulp, all for the domestic market.
(iii) Central Java: a newsprint mill which at full capacitywould produce 160,000 tons of newsprint for the domesticmarket. The 24,000 tons of chemical pulp required forthis production would be manufactured elsewhere.
(iv) East Java: a bagasse-line addition to the Lejes millto produce 45,000 tons of printing and writing paperfor the domestic market.
(v) South Central Kalimantan: a 200,000 ton per annum longand short fibered bleached kraft pulp mill. By 1990,as much as 140,000 tons of this product could be soldin Indonesia, the balance would have to be exported.

- 30 -
(vi) East Kalimantan: a 200,000 ton per annum short-fiberedbleached kraft pulp mill. By 1990, approximately70,000 tons of this product could be sold in Indonesia,the balance would have to be exported.
7.29 The following table summarizes the key features and the resultsof preliminary financial and economic analyses for each of the six projectsexamined. The financial rates of return were estimated using 60% duty onall paper grades except newsprint, where a 10% duty was applied. No duty wasapplied to pulp prices. The economic rates of return were estimated usinginternational prices except that unskilled labor and foreign exchange wererespectively shadow-priced at 60% and 125% of current market prices.

Table 7-8
Comparison of Potential Pulpand Paper Projects
Project1 2 3 4 5 6
Location South Central East South/Central EastAceh Sumatera Java Java Kalimantan Kalimantan
(US$ million)
Production (thousand tons)- Kraft Paper and Board 170 -
- Printing and Writing - 80 - 45 - -- Bleached Pulp - 100 - - 200 200- Newsprint - - 160 -
Exports- Bleached Pulp - - - - 60 130
Capital Cost ($ million>$ 410 375 225 140 350 350Employment Created (jobs) 3,200 3,200 2,000 1,000 1,600 1,600Cost of EmploymentCreation ($/Job) 128,000 117,000 112,000 140,000 187,000 187,000
Return on Investment- Financial (%) 17 15 10 9 10 9- Economic (%) 10 12 12 7 14 13
Factor by which costs or benefitsmus+t ^ 4lt±4plid to obtai.n a '15%Economic Rate of Return
- Paper Prices 1.27 1.13 1.09 1.36 1.06 1.10- Capital Costs 0.72 0.83 0.85 0.57 0.90 o.86- Production Costs 0.12 0.63 0.82 0.24 0.83 0.71

- 32 -
Discussion
7.30 The data contained in the preceding table is of a preliminary
nature, and based on tentative estimates of markets, prices, and capital
costs. Nevertheless, comparison with other projects for which detailed
analyses have been undertaken shows the results to be of the right order.
The results lead to the following conclusions:
(i) The two projects which show a reasonably attractive financial
rate of return (Aceh and South Sumatra) are those which wouldbe selling in the domestic market with 60% duty protection;
(ii) The two projects which show a reasonably attractive economicrate of return (the pulp export projects on Kalimantan) would
be selling significant tonnage into rather uncertain inter-
national markets. Moreover a significant part of the returnis derived from the 125% valuation of foreign exchange which
may or may not be realistic. Without this adjustment, theeconomic rates of return for these two projects would dropby 2-3 percentage points.
(iii) All projects are quite sensitive to market price changes, and
less sensitive to changes in capital costs or productioncosts; and
(iv) As might be expected, the larger mills generate the highestrate of return.
7.31 None of the projects stands out as being particularly attractive
in financial and economic terms. Nevertheless, all would provide the country
with needed supplies of pulp and paper and provide insulation against fluctua-
tions in world supply and prices; all would contribute to the transfer of
technology to Indonesia; all would generate attendant benefits in associated
industries such as paper converting, construction, engineering, transportation
and chemicals; and with the exception of the two projects in Java, all would
have a substantial development effect in regions which are presently under-
populated and underindustrialized. Moreover, relatively modest increases
in world prices would raise the rate of return for several of these projects
to acceptable levels. Given the small amount of new capacity which is being
installed worldwide, and the expected steady increases in the demand for
paper and paperboard, such prices increases would appear to be inevitable if
capital for new capacity is to be attracted back to the industry.
7.32 The main conclusions which can be drawn from the analysis of develop-
ment prospects presented in Annex 7-1 and summarized in the preceeding para-
graphs are:
(i) Indonesia has the fiber resources for a wide range of pulpand paper projects. Of particular value are the long-fiberedresources (both natural and planted) which are rare in Asia; and
- 33 -
(ii) The domestic market in Indonesia is large enough to provideimmediate opportunities for large-scale development producinga variety of products. The export market for long-fiberedgrades is also attractive, and could provide a temporary outletfor excess production from large-scale plants.
Conclusions
7.33 The main conclusions which can be drawn from the material containedin this Chapter are:
(i) The Indonesian pulp and paper industry has been slowto develop with the result that the country nowimports over 80% of its paper requirements. No othercountry in the world with suitable fiber resources isso dependent on imports;
(ii) Development of the industry now as in the past isconfined to the construction and expansion of verysmall production units. Although these mills appearto be quite efficiently operated, they could neverbe profitable if not protected from import competitionby a 60% tariff barrier;
(iii) The protective tariff not only allows the existingindustry to keep operating but is also attracting newprivate capital. New plants are also very small andthis strategy is seen to be yielding a negative economicrate of return; and
(iv) Large plants have been proposed for various locationsin the country which would materially improve the domesticsupply solution. At current world paper prices theseprojects are only marginally attractive but rates ofreturn would improve substantially with the higherprices which are projected.
7.34 Indonesia has many development options and the pulp and paper sectoris only one of them. :t is hoped that the material contained herein will beof assistance to the Government in determining:
(i) What priorities should be given to promoting developmentof this sector in relation to others; and
(ii) What projects (or types of project) should be considered ofhighest priority within the sector.

- 34 -
Recommendations
7.35 If development of the pulp and paper sector is given priorityby the Government, there are a number of steps which should be taken tofacilitate the implementation of projects which would provide an economicbenefit to the country. Recent experience shows that leaving such developmentto the private sector is not an effective way to secure the desired results,primarily because of the high investment costs of an economic-sized plant,the high costs of related infrastructure, and the relatively marginal ratesof financial return. Under these circumstances, a number of alternativedevelopment strategies could be considered but the one that appears to havethe best chance of being effective would be for the Government to:
(i) Form a public sector pulp and paper company which wouldtake over control of the five existing government-ownedpulp and paper mills. The company could be staffed withpeople from the mills and from the Cellulose IndustriesDivision of the Department of Chemical Industries;
(ii) Empower this company to engage consultants as necessary,and to negotiate with the sponsors of the five or sixmajor pulp and paper projects under consideration in thecountry;
(iii) Select the best project for immediate development andform a partnership with the existing sponsor if this isdeemed appropriate;
(iv) Contract for a bankable feasibility study to secure loanfinance for the project. Raise equity through a combinationof government grant, funds generated by the existing plants,and contributions from any private partners; and
(v) Proceed to implement the project and commence evaluatinga second project.

- 35 -
INDONESIA
INDUSTRIAL MISSION
ANNEX TO CHAPTER VII
DEVELOPMENT POTENTIAL IN THE PULP AND PAPER SECTOR
A. Introduction
1. At the present time, capacity in the Indonesian pulp and papersubsector is limited to a number of relatively small production units andalthough plans have been announced for the construction of some large plants,none of these appear to be sufficiently far advanced to have any impact onthe projected supply gap before 1980. In that year, projections suggestthat although 17 plants will be in operation with a combined annual capacityof 160,000 tons, (compared with 8 plants and 60,000 tons capacity at present),paper and paperboard imports will have risen from a current level of 170,000tons to 250,000 tons annually. Moreover much of the new capacity will useimported pulp causing pulp imports to increase from 20,000 to 70,000 tons.
2. By 1980, the country will be producing most of its requirementsfor printing and writing papers and for some packaging grades. However,large quantities of newsprint, kraft packaging grades and pulp will stillhave to be imported. The most efficient way to avoid these imports wouldbe to construct large plants using wood as a raw material. Projects ofthis type have been identified but progress towards their implementation hasbeen slow. This Annex supports and expands the material contained in ChapterVII dealing with the pot:ential for development of the pulp and paper sector inIndonesia. It begins wi.th an examination of the fiber resource base and areview of the domestic and export market potential. The alternative sectorialdevelopment strategies and potential project opportunities compared in theChapter are then described.
B. Fiber Resources
3. Indonesia's forest and non-wood fiber resources suitable for pulpand paper manufacture have been examined in a number of studies undertakenby the Bank and others during the past five years. 1/ No detailed coverage
1/ IBRD; Agricultural Sector Summary, 1972.IBRD; Planning for Industrial Development in Indonesia, 1972.FAO; Forest Resources in the Asia and Far East Region, 1976.CIDA; National Pulp and Paper Survey, 1972.University of Gadjah Mada, Indonesia; Foreign Investment in the Forest
Based Sector of Indonesia, 1975.Government of Indonesia; Sumatra Regional Planning Study, 1976.

- 36 -
of this material is presented here because the quantity and diversity of theavailable resources, together with the potential for the development ofindustrial forest plantations, are substantial enough to allow the establish-ment of almost any conceivable pulp and paper industry. The following para-graphs therefore merely summarize the significant factors concerning eachmajor type of fiber resource.
Natural Forest Resources
4. About 120 million hectares, or over 60% of Indonesia's total landarea, is classed as forest land. This is the largest forest resource in Asiaand one of the largest in the world. The geographical distribution of forestland is approximately as follows:
Distribution of Forest Land
Total Land Forest LandLocation Area Area
----- (million hectares)------
Sumatra 47 28Kalimantan 54 41Sulawesi 19 10Maluku 8 6West Irian 42 32Java, Madura 13 3Bali, Nusa Tenggara 7 2
190 122
Source: Central Bureau of Statistics. Other sources suggestIndonesia's total land area is as much as 202.7 millionhectares.
5. The total growing stock of timber in excess of 50 cm diameter onland for which concessions have already been granted 1/ has been estimatedby the Directorate General of Forestry to be about 3,200 million cubic meters.An approximate breakdown by region and major species group has been preparedfrom a variety of sources as follows:
1/ Based on 1974 data when 385 concessions covering about 33 millionhectares had been granted.

- 37 -
Distribution of Growing Stock
Location VolumeDipterocarp Ramin Agathis Pine Other Total
--------------- (million cubic meters)----------------
Sumatra 394 1 - 21 344 760Kalimantan 1,166 74 6 - 834 2,080
Sulawesi 3 - 2 - 175 180
Maluku 77 - 1 - 62 140
West Irian - - - - 40 40
Java, Madura - - - 8 n.a. n.a.
Bali, Nusa Tenggara - - _
1,640 75 9 29 1,455 3,200
6. The figures are approximate but they indicate that more than one-
half of the standing wood volume in Indonesia is in the dipterocarp species
family whereas most of the remainder, designated "other", is made up of
a large number of mixed, tropical hardwood species. The figures also show
that almost 90% of the country's surveyed timber resources are in Sumatra
and Kalimantan.
7. The use of dipterocarps and mixed hardwood species for manufacturing
pulp and paper is a reasonably well established practice. A mill in the
Philippines is producing newsprint and packaging paperboard using a large per-
centage of dipterocarp species, and for several years Japanese pulp and paper
producers have been impiorting chipped wood from southeast Asia. Nevertheless
it must be recognized that these woods are not preferred species for paper-
making, primarily because of their short fibers (which do not provide much
of the strength necessary in many grades), their dark color, and the lack
of uniformity which results from an uncontrollable mix of species. The mill
in the Philippines is overcoming these problems by switching to fast-growing
plantation species as qjuickly as they become available, and in the meantime
by doing some sorting of the tropical hardwood finish. The Japanese mills
are confining their usage of these woods to a limited number of grades where
their shortcomings are of relatively minor importance, and to minor propor-
tions of the total fiber furnish. In both countries the paper products
manufactured from dipterocarps and mixed tropical hardwoods are consumed
domestically and do not: face international competition in world markets.
Thus, although there are a number of countries which, like Indonesia, have
large resources of tropical hardwoods, generally believed to be suitable for
producing pulp and paper, there has been relatively little activity in this
area, particularly if t:he product is to be sold in international markets.
Instead many countries are establishing plantations of fast-growing eucalyptus
and other hardwood species which can generally be grown and harvested at costs
comparable to or cheaper than those which would be encountered when logging
a natural tropical forest.

- 38 -
8. Despite these reservations, it would certainly be possible to estab-lish a project using indigenous Indonesian hardwoods, and several such projects,particularly in Kalimantan, have been proposed. However in considering anysuch project, certain factors should be kept in mind:
(i) The project would benefit by having as much as possible ofits market within Indonesia, to avoid the problems ofentering international markets with an unknown product;
(ii) To the extent that the project would sell in internationalmarkets, price discounts should be anticipated; and
(iii) Any such project should be carefully compared with a planta-tion pulpwood alternative which would not face the samemarketing problems.
9. In addition to the very large quantities of dipterocarps andother mixed hardwoods, there are also substantial amounts of ramin, agathisand pine in various parts of the country. Ramin has been tested and foundto be quite suitable for the manufacture of certain grades of paper but itsoccurrence in the natural forest is rather scattered. Thus, although thereare an estimated 70 million cubic meters or more of ramin in Kalimantan,it could not be economically harvested as a single species. Agathis andpine, on the other hand occur in relatively consolidated areas. The naturalpinus kerkusii forest of northern Sumatra is the basis for one project underconsideration, and the relatively large areas of agathis which are reportedto occur with dipterocarps and ramin in Central and South Kalimantan arebeing considered for another. In Central Java, plantations of pine andagathis are said to be large enough to provide the fiber resource for a largepaper mill producing newsprint or other grades of paper.
10. The close attention by the pulp and paper sector to the availablestands of natural and planted pine and agathis is technologically very sound.These species possess the valuable characteristics of having a relativelylong fiber enabling them to be used in many grades of paper and paperboardwhere short fibers would be less desirable or, in some cases, just not suit-able. Specific examples of such grades are newsprint and kraft paper andboard, which together account for over 40% of Indonesia's total paper andpaperboard consumption. In addition most other grades benefit from theaddition of some proportion of long-fibered pulp. Moreover, all of Asia isdeficit in long-fibered pulpwood resources and although plantations are beingestablished in a number of countries, the region will be a net importer formany years to come. Thus, from the point of view of both domestic marketsand regional export potential, the long-fibered pine and agathis resourcesof Indonesia are the country's most valuable raw material for pulp and papermanuf ectuire.

- 39 -
Agricultural Residues
11. Agricultural residues used for pulp and paper manufact:ure includestraw from rice and various grains, bagasse from sugarcane, and cottonlinters. In Indonesia, rice straw has been the most important cdomesticfibrous raw material for pulping and is used in the Lejes, Padalarang andBlabak mills. In addition, several of the mills now under const:ructionwill use rice straw. Bagasse is not used at present but a major expansionproposed for the Lejes mill would use bagasse, and two mills under construc-tion are planning to use bagasse as one part of their fiber furnish.
12. Rice straw fibers are short and for that reason pulps manufacturedfrom it are best used in grades where strength it not of primary importance.In particular, printing and writing papers of good quality can be made fromrice straw and because of its relative abundance in Java, the principaldirection of Indonesia's pulp and paper industry development has been themanufacture of printing and writing papers from rice straw. The better gradesof printing and writing paper produced from straw include some proportion oflong-fibered pulp which at present, must be imported. Another grade which canbe produced satisfactorily from short fibered raw materials is corrugatingmedium, where the quality of principal importance is stiffness. In Europeand elsewhere, considerable quantities of corrugating medium are made fromstraw. However, although good quality paper of various types can be producedfrom rice straw, its use on a large scale has particular economic and technicaldisadvantages.
13. The principal technical disadvantage of rice straw is its relative-ly high silica content which makes the recycling and recovery of cookingchemicals difficult. This leads to high costs for pulping chemicals and apollution problem which increases as plant size increases. The principaleconomic disadvantage is the relatively high cost of collection and trans-portation operations; if enough rice straw is to be collected for a moderatelylarge-sized plant than the area over which it must be collected becomes solarge as to raise transportation costs to prohibitively high levels. Moreover,because rice is a seasonal crop, rather large inventories must be kept at theplants during certain times of the year which further adds to the cost.
14. In Indonesia, there is enough rice straw (particularly in Java)to support substantial Expansion of this segment of the industry. However,for the reasons noted above, such expansion is likely to be limited to smalladditions to existing mills or the construction of new small-scale mills.Moreover the market requirements and proposed new construction are suchthat it is conceivable that the demand which can satisfactorily be suppliedby paper produced from rice straw may be fully supplied. If some of theproposed mill developments which would use wood and bagasse were to proceed,there could be a real danger of an oversupply in the short-fibered portionof the domestic market. Under these circumstances, the rice-straw millswith their high cost structure and possibly lower product quality couldbe the most seriously affected.

- 40 -
15. Bagasse is the fibrous residue left after sugar cane has beencrushed to remove the sucrose and is used on a large scale for pulp and papermanufacture in many areas of the world. The bagasse is not usually a wastematerial as it is used as fuel in the sugar mills for steam and power produc-tion. Thus to the extent that the bagasse is used in this way, its costis the cost of an alternative fuel in the sugar mill. The material can bereadily pulped by a variety of processes. It is short-fibered, but within therange of products which can be satisfactorily produced with this type of fiberresource, it is one of the more highly regarded. Grades produced from bagasseto date have been primarily printing and writing paper and corrugating mediumbut plants are under construction in Mexico and Peru which will producenewsprint from bagasse. At this stage, however, this development is in itsearly stages and its technical and economic feasibility has not been fullydemonstrated.
16. The Indonesian sugar industry is primarily in Central and East Javaand thus pulp and paper developments based on bagasse are most likely to belocated in these regions. The Lejes mill (which proposes a bagasse-basedexpansion) and the two mills under construction which will reportedly usesome bagasse are all located in East Java. From a technical point of view,the construction of bagasse mills poses no particular difficulties but theeconomics require careful evaluation, particularly in considering the cost offuel replacement in the sugar mills. Moreover, from the domestic market pointof view, there is some danger of an oversupply of short-fibered grades asnoted above. In this respect, bagasse-based mills are likely to be somewhatbetter off than those using rice-straw.
Other Fibers
17. Other fibers of importance to the Indonesian pulp and paper industryare bamboo and waste paper. Bamboo is used in the Banjuwangi and Gowa millsand these mills are producing satisfactory grades of paper. However, becausethe harvesting of bamboo is often expensive, and regeneration is not alwaysassured, both of these mills are investing in plantations of pine and hardwoodspecies and thereby hope to improve both the security of their fiber resourcesupply and the quality of their products. So long as other less troublesomefiber supplies are available or can be developed, no new developments basedon bamboo are likely.
18. Waste paper is widely used throughout the world in the manufactureof most grades of paper. The existing mills in Java use waste to the extentthat they can obtain it, and at least two small mills in the Jakarta areaproduce cheap grades of tissue and board from a combination of waste paperand imported pulp. No estimates are available of the amount of waste paperrecovered for this use in Indonesia but recovery rates in most countries ofthe world range between 20 and 40% of total paper consumed. Because of itsbasic low-cost advantage, Indonesian paper producers, particularly thosefavored by locations near large consumption centers, are expected to continueto develop the mechanisms for waste paper collection.

- 41 -
General Assessment
19. The preceding review of the various types of fibrous resourcesavailable to the pulp and paper industry shows that coniferous forestresourc,ss offer the best: potential for the large-scale development of adomestic or export oriented industry. Among the available short-fiberedresourcess, bagasse probably offers the best potential for developmentbut any bagasse-based project should be carefully evaluated against thealternative of developing fast-growing plantations of short-fibered pulp-wood spescies.
C. Markets
20. Given the very large current levels of imports, the principalobjective of any expanded production program should clearly be to increasethe supply of paper and paperboard to the Indonesian domestic market. Never-the-less because Indonesia has substantial fiber resources, in particularlong-fibered resources which are in short supply in Asia, the possibilitiesfor exports should not be overlooked.
Domestic Market
21. The most recent detailed study of the domestic market for paper inIndonesia was undertaken as part of a CIDA-financed study in 1971. Theproject[ons produced as part of this study remain the official estimates ofthe Department of Chemical Industries, but recent experience has shown thatthey are somewhat on the high side. The CIDA projections, and actual expe-rience, are compared in the following table.
Projected and Act:ual Market for Paper and Paperboard, 1970-75
Year ConsumptionActual 1/ Projected-------(thousand tons)------
1970 148 1401971 161 1601972 183 1901973 233 2201974 234 2601975 216 300
1/ Apparent consumption: domestic production plus netimports.

- 42 -
22. The slackening in the rate of growth of demand which has beenevident since 1973 is believed to be due to some slowing down in the rateof expansion of the Indonesian economy, coupled with the effect of verysharp increases in paper prices. 1/ Although the demand for paper and paper-board is expected to increase substantially over the next decade it is un-likely that the demand levels formerly projected can now be attained. Thus,in order to provide a reasonable basis for examining possible developmentstrategies in the Indonesian pulp and paper industry, a reassessment of thelikely market growth over the next decade must be undertaken. Any detailedmarket projections is beyond the scope of this survey but it is possible toreview the assumptions upon which the previous projections were made, modifythem in the light of recent experience, and thereby prepare a new set ofpreliminary projections which should be reasonably indicative of marketdemand in the medium term future.
23. The CIDA projections for the period to 1975 were based on an anti-cipated real economic growth rate (measured in terms of GNP) of 6.5% annually,and an elasticity of the per capita demand for paper with respect to percapita GNP of 4.1. In fact, over this period the economy grew at an averagerate of 6.7% annually in real terms, but the income elasticity of paper demandwas only about 2.0. Demand growth expectations in the CIDA study were clear-ly, in retrospect, overoptimistic. It would appear that the projections wereinfluenced too much by the growth experienced during the period 1960-1970when demand elasticity averaged a very high level of 5.8. Moreover, thedampening effect of the increase in paper prices was not anticipated. 2/
24. To make new estimates of future demand, new assumptions regardingthe growth of the economy, population increases, and the income elasticity ofpaper demand have to be made. The Second Five-Year Plan (April 1974 to March1979) anticipates an overall growth in the economy of 7.5% annually. Theofficial current estimate of population increase is 2.5% annually. Recentexperience with actual paper consumption in the country show that the incomeelasticity of paper demand has averaged about 2.0. Projection of those datathrough 1980 give an overall figure for paper and paperboard consumption inthat year of about 470,000 tons, compared with a current level of about230,000 tons. This could be considered a somewhat optimistic projection ofdemand.
25. Other assumptions can be used to give a somewhat less optimisticview. Analysis of 1975 data for paper demand and per capita GNP in 26 Asian
1/ World paper and paperboard prices increased substantially during theperiod 1972-74 and this effect was compounded in Indonesia by increasesin both duty and sales tax. Thus 1975 domestic prices for some gradesare 2-3 times 1971 levels.
2/ Recent fluctuations in paper prices appear to have had some effect ondemands in most areas of the world. However, this is a relativelynew phenomena and price effects have not been reliably quantified.
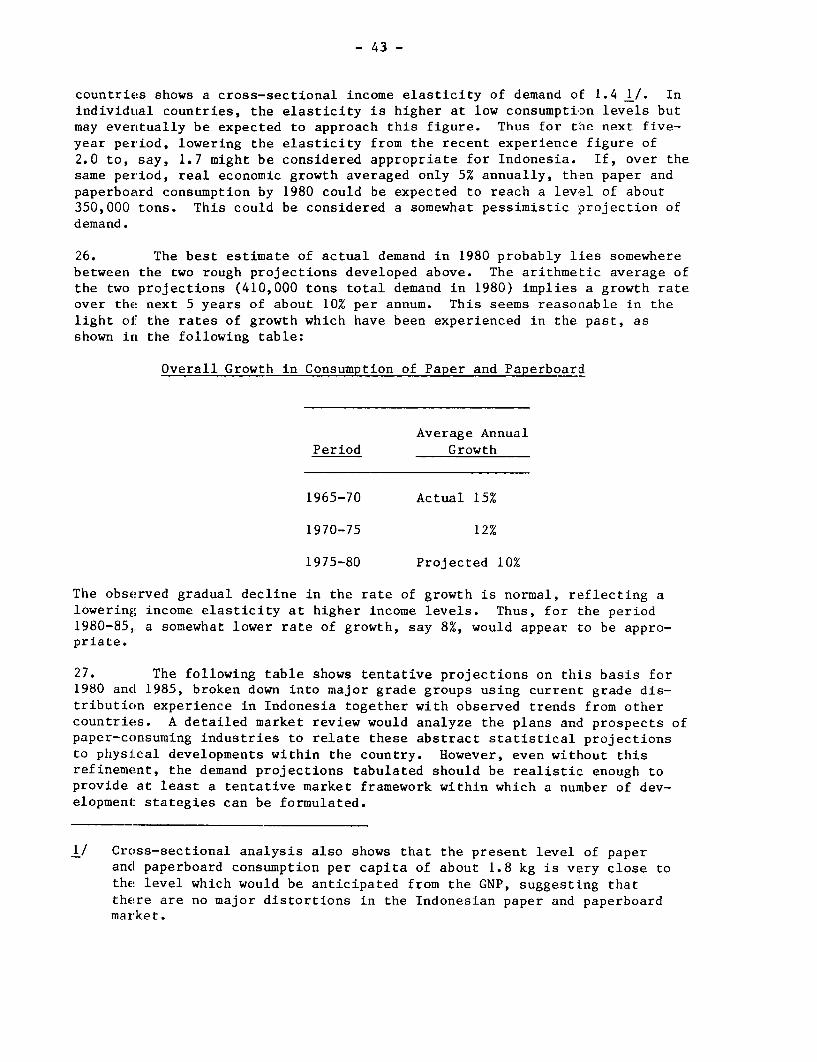
- 43 -
countries shows a cross-sectional income elasticity of demand of 1.4 1/. Inindividual countries, the elasticity is higher at low consumption levels butmay eventually be expected to approach this figure. Thus for the next five-year period, lowering the elasticity from the recent experience figure of2.0 to, say, 1.7 might be considered appropriate for Indonesia. If, over thesame period, real economic growth averaged only 5% annually, then paper andpaperboard consumption by 1980 could be expected to reach a level of about350,000 tons. This could be considered a somewhat pessimistic projection ofdemand.
26. The best estimate of actual demand in 1980 probably lies somewherebetween the two rough projections developed above. The arithmetic average ofthe two projections (410,000 tons total demand in 1980) implies a growth rateover the next 5 years of about 10% per annum. This seems reasonable in thelight of: the rates of growth which have been experienced in the past, asshown in the following table:
Overall Growth in Consumption of Paper and Paperboard
Average AnnualPeriod Growth
1965-70 Actual 15%
1970-75 12%
1975-80 Projected 10%
The observed gradual decline in the rate of growth is normal, reflecting alowering income elasticity at higher income levels. Thus, for the period1980-85, a somewhat lower rate of growth, say 8%, would appear to be appro-priate.
27. The following table shows tentative projections on this basis for1980 ancl 1985, broken down into major grade groups using current grade dis-tribution experience in Indonesia together with observed trends from othercountries. A detailed market review would analyze the plans and prospects ofpaper-consuming industries to relate these abstract statistical projectionsto physical developments within the country. However, even without thisrefinement, the demand projections tabulated should be realistic enough toprovide at least a tentative market framework within which a number of dev-elopment: stategies can be formulated.
1/ Cross-sectional analysis also shows that the present level of paperand paperboard consumption per capita of about 1.8 kg is very close tothe level which would be anticipated from the GNP, suggesting thatthere are no major distortions in the Indonesian paper and paperboardmarket.

- 44 -
Tentative Projection of Domestic Paper and Paperboard Demand
Grade DemandCurrent 1/ 1980 1985… --- (thousand tons)----------
Newsprint 50,000 82,000 110,000Printing 75,000 123,000 166,000Kraft Packaging Grades 40,000 82,000 130,000Other Packaging Grades 31,000 67,000 114,000Cigarette Paper 8,000 10,000 12,000Other Grades 26,000 46,000 68,000
Total 230,000 410,000 600,000
1/ Approximate: based on recent production and import data.
Export Market
28. Although world production and consumption of paper and paperboard iscurrently of the order of 140 million tons annually, a great deal of this isproduced and consumed in the same country, and a substantial amount of thebalance moves between neighboring countries within Europe, or between Canadaand the United States. Thus the true extra-regional market for paper, inwhich exported products from Indonesia would have to compete, is only about8 million tons annually, or 5% of total world production. Similarly, theextra-regional market for pulp is about 7 million tons out of a total produc-tion of 120 million tons. About three-quarters of this tonnage of both pulpand paper originates in Scandinavia and North America, and is shipped to avariety of countries throughout the world.
29. Detailed grade information concerning those shipments is not reliablyavailable but the following estimates have been developed from a variety ofsources.
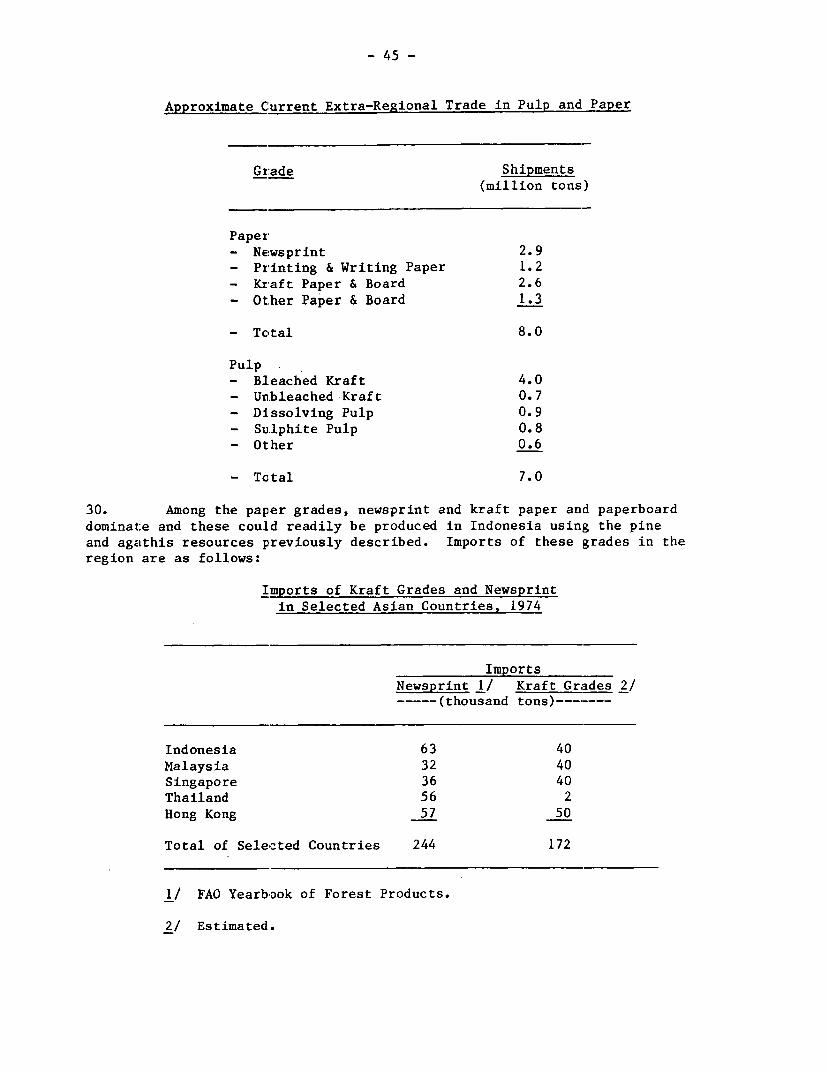
- 45 -
Approximate Current Extra-Regional Trade in Pulp and. Paper
Grade Shipments(million tons)
Paper- Newsprint 2.9- Printing & Writing Paper 1.2- Kraft Paper & Board 2.6- Other Paper & Board 1.3
- Total 8.0
Pulp -- Bleached Kraft 4.0- Un.bleached Kraft 0.7- Dissolving Pulp 0.9- Sulphite Pulp 0.8- Other 0.6
- Total 7.0
30. Among the paper grades, newsprint and kraft paper and paperboarddominat:e and these could readily be produced in Indonesia using the pineand agathis resources previously described. Imports of these grades in theregion are as follows:
Imports of Kraft Grades and Newsprintin Selected Asian Countries, 1974
ImportsNewsprint 1/ Kraft Grades 2/----- (thousand tons)---
Indonesia 63 40Malaysia 32 40Singapore 36 40Thailand 56 2Hong Kong 57 50
Total of Selected Countries 244 172
1/ FAO Yearbook of Forest Products.
2/ Estimated.

- 46 -
31. Indonesia is one of the major importers in the region and clearlyany program of domestic production should be initially aimed at fillingdomestic demand. Nevertheless, the regional deficit in these grades issubstantial and is unlikely to diminish significantly in the medium termfuture because of the lack of suitable fiber resources in the countrieslisted. It is apparent that production of these grades from any new plantwhich may be built could be marketed in neighboring countries where Indonesiais likely to have a freight advantage over the traditional suppliers inScandinavia and Canada.
32. Of the pulp grades listed, bleached kraft pulp is dominant in worldtrade. Moreover almost all of the growth which has taken place in world pulptrade has been in this grade. Both long-fibered and short-fibered gradesof bleached kraft pulp are marketed. While it is conceivable that Indonesiacould produce long-fibered pulp for export, the domestic demand for all-long-fibered grades is so great as to make this development unlikely. The inter-national market for short-fibered pulp has grown rapidly in recent years andFAO estimates that some 4 million tons of new capacity (much of it in LatinAmerica) will come on stream in the next five years. The recent downturnin the major economies of the world sharply reduced pulp and paper demandduring 1975 and 1976 and while there has been a substantial recovery, it nowappears that there could conceivably be some excess short-fiber pulping capa-city in the early 1980s. If this situation occurs, then competitive advantageand disadvantage will determine which supplies are the most seriously affectedand for Indonesia, the following factors would have to be considered.
(i) At least initially, any short-fibered pulp produced inIndonesia in a plant scaled for the export market wouldhave to be produced from dipterocarps and mixed tropicalhardwoods. The competitiveness of these grades ininternational markets is not known;
(ii) Wood costs from indigenous tropical forests are usuallyfound to be higher than wood from plantation forests inthose countries (such as Brazil) which are developingsubstantial export pulp industries using establishedplantation species; and
(iii) New plant construction costs have risen dramatically inthe past 2-3 years and a new Indonesian producer wouldbe competing, at least to some extent, with the ownersof older, lower cost plants.
33. While these factors do not exclude the possibility of an export-oriented pulping operation in Indonesia they do suggest that in view of thedanger of possible over-supply, prior marketing arrangements for a substantialproportion of the tonnage would have to be made. This is particularlyimportant because there is little justification for believing that Indonesiawould have any competitive advantage in producing and marketing short-fiberedbleached kraft pulp.

- 47 -
34. In general, export markets for pulp and paper are likely to bequite good for the long-fibered grades (such as newsprint, kraft paper andpulp) and not so attractive for the short-fibered grades. Whereas Indonesiadoes have long-fibered pulpwood resources, these are not so extensive as toallow the contemplation of a large-scale export-oriented pulp and paperindustry, particularly since the supply to the domestic market is so seriouslydeficient. Nevertheless, the export market could provide a valuable outlet fora proportion of the output for plants aimed primarily at the domestic market,allowing them to be built in an economic size range.
B. Development of Alternative Development Strategies
Alternat:ives for Consideration
35. Future development of the pulp and paper sub-sector in Indonesiacould follow one of a number of alternative strategies and the followinganalysis is an attempt to ascertain the costs and benefits associated withthese alternatives. Considering only the supply to the domestic market,the strategies which could be considered include:
(i A halt in construction of new capacity after those plantsalready started are completed. Under this alternativecapacity would remain at the 160,000 ton level, and paperrequirements above this figure (together with the 70,000tons of pulp required to support this domestic production)would be imported;
(ii) A continuation of the construction and expansion of smallplants, using agricultural residues and imported pulp, tomaintain the anticipated 1980 level of self-sufficiency inspecified grades. Other grades, and the pulp required tosupport domestic production, would continue to be imported;and
(iii) The construction of suitable large integrated pulp andpaper mills to obtain a high degree of self-sufficiencyin most paper grades. These mills could also supply pulpto the existing plants.
36. Actual development could, and probably will, encompass all ofthese strategies to some extent. The following preliminary comparativeanalysis treats them as independent options and provides some insight intothe relative merits of each. It is hoped that the results will be useful tothe Government in making decisions aimed at influencing the development ofthis sub-sector.

- 48 -
Basic Assumptions
37. The assumptions basic to the formulation of the strategies areas follows:
(i) The construction of new plants required would take placeover a 10-year period beginning in 1978, with all new plantsin operation by 1988 to meet supply objectives based onthe projected 1990 market;
(ii) Fibrous resources would be available to meet the projectedneeds of the various plants discussed below; and
(iii) All costs and benefits are projected in terms of constant1977 prices for the period 1978-2000.
Market Assumptions
38. Tentative projections of the domestic market to 1985 have beendeveloped previously in this Annex (para. 27). Consumption in subsequentyears has been estimated by applying a further overall 8% annual growthrate to the 1985 figure, with some adjustments for individual grades. Totalconsumption of paper and paperboard in 1990 would thus be 880,000 tons.
39. Under the alternative development strategies proposed, the require-ments of the market in 1990 would be met as follows:
Supply and Demand Balance in 1990under Alternative Development Strategies
Supply
Strategy 1/ Strategy 2 -/ Strategy 3/Grades Demand Domestic Imports Domestic Imports Domestic Imports
Newsprint 160 - 160 - 160 160 -Printing & Writing 240 112 128 190 50 190 50Kraft Packaging 190 - 190 - 190 170 20Other Packaging 170 45 125 120 50 120 50Cigarette Paper 17 3 14 10 7 10 7Other 103 - 103 - 103 - 103
Total 880 160 720 320 560 650 230Pulp Imports 4/ - 70 - 140 - 0Self-sufficiency 18% 36% 74%
1/ No new plants after 1980.2/ Continue building small plants to maintain 1980 level of self-sufficiency.3/ Construct large plants.4/ Pulp demand varies according to strategy.

- 49 -
40. The prices used to measure the cost of imports in this analysisare an average of the very high prices which prevailed in 1974, and themuch lower prices which are in effect at the moment as a result of a tem-porary oversupply in Japan and elsewhere. The values are an attempt torepresent a true "1977 price" (CIF) in terms of long-range trends and areshown in the following table:
CIF Prices for Imported Paper
Grades Price 1/(US$/ton)
Newsprint 450Printing & Writing 650Kraft Packaging 500Other Packaging 350Cigarette Paper 900Other 700Pulp 500
1/ Average for various types included in the broad grade categories listed.
Details of Strategy 1
41. By 1978, all of the mills presently under construction would bein operation giving an effective domestic production capacity of 160,000tons oi paper and paperboard. Actual production would reach this level in1982. Under this strategy no new mills would be constructed in the period1978-2000, and thus no investment would be required. Costs incurred duringthe period would comprise:
(i) The cost of pulp and paper imports; and
(ii) The cost of production in the existing mills,estimated to average $500 per ton for paper pro-duced from domestic pulp, and $150 per ton (ex-cluding the cost of pulp) for paper producedfrom imported pulp.
Details of Strategy 2
42. In this strategy, domestic production would continue to increaseas small mills are constructed to maintain a high level of self-sufficiencyfor those grades which can readily be produced with the technoLogy and fibersavailable for this type of mill. Based on experience in Indonessia and else-

- 50 -
where, it has been assumed that 80% of the total demand for printing and writ-ing papers, 70% of the demand for non-kraft packaging papers and 50% of thedemand for cigarette papers are levels which can be realistically reachedand maintained in Indonesia. Thus in projecting costs for this strategy,it has been assumed that new mills would be built between 1978 and 1990 tomaintain those levels of self-sufficiency in the face of growing demand overthis period. Domestic production in 1990 would amount to 320,000 tons annu-ally; imports would be 560,000 tons. (It is obvious that new mills wouldcontinue to be built after 1990; however, in this analysis constructionafter that date has not been considered as the benefits of further new millswould not be substantially realized before the end of the projection period).
43. Cost incurred during the period would comprise:
(i) The cost of importing pulp and paper not supplied bythe domestic industry;
(ii) The cost of constructing the new capacity required,estimated to be $550,000 per daily ton of capacity; 1/and
(iii) The cost of production in the existing and new smallmills estimated to average $500 per ton for paper pro-duced in mills manufacturing their own pulp, and $150per ton (excluding the cost of pulp) for paper pro-duced from imported pulp.
Details of Strategy 3
44. For this strategy it is assumed that domestic mills would beconstructed to produce by 1990:
(i) 100% of all newsprint;
(ii) 80% of all printing and writing paper;
(iii) 90% of all kraft packaging grades;
(iv) 70% of all other packaging grades;
(v) 50% of all cigarette paper; and
(vi) 100% of all pulp.
1/ This is a relatively low figure, reflecting the experience of actualsmall-mill construction in Indonesia to date, and the fact that someof the new capacity is for paper-making only, using imported pulp andnot requiring integrated pulping capacity.

- 51 -
Overall, this represents 74% of all of Indonesia's projected pulp andpaper requirements which is a realistically attainable objective.
45. In physical terms, it has been assumed that this capacity wouldbe achieved by:
(i) Building four moderately-sized mills, which woulduse a mixture of agricultural residues and pulpfrom another mill to be established to maintain, pro-jected self-sufficiency levels in packaging, cig-arette, printing and writing grades;
(ii) Building one chemical pulp mill in the early 1S980'sto supply the existing industry and the four millsdescribed above, and subsequently expanding it;
(iii) Building one large kraft paper and board mill inthe early 1980's, and subsequently expanding it; and
(iv) Building one newsprint mill in the early 1980's andsubsequently expanding it.
46. Costs for this strategy include:
(i) The cost: of importing the paper grades which wouldnot be supplied by the existing industry;
(ii) The cost: of constructing the new capacity required.For the moderately-sized mills without full pulpingcapacity, an average of $550,000 per daily ton ofcapacity has been used. For the large integratedmills, $650,000 per daily ton has been used. Thesefigures reflect experience in other regions and allowfor a moderate degree of associated infrastructuraldevelopment; and
(iii) The cost. of production in the new large mills esti-mated at an overall average of $220 per ton, in theexisting small mills estimated at the same levels asfor Strategy 1, and in the new moderate-sized millsat $150 per ton for the non-integrated and $300 perton for the integrated capacity.
Compar:Lson of Strategies
47. The three strategies are compared and the results discussed inParas. 7.22 - 7.25 of Chapter VII.
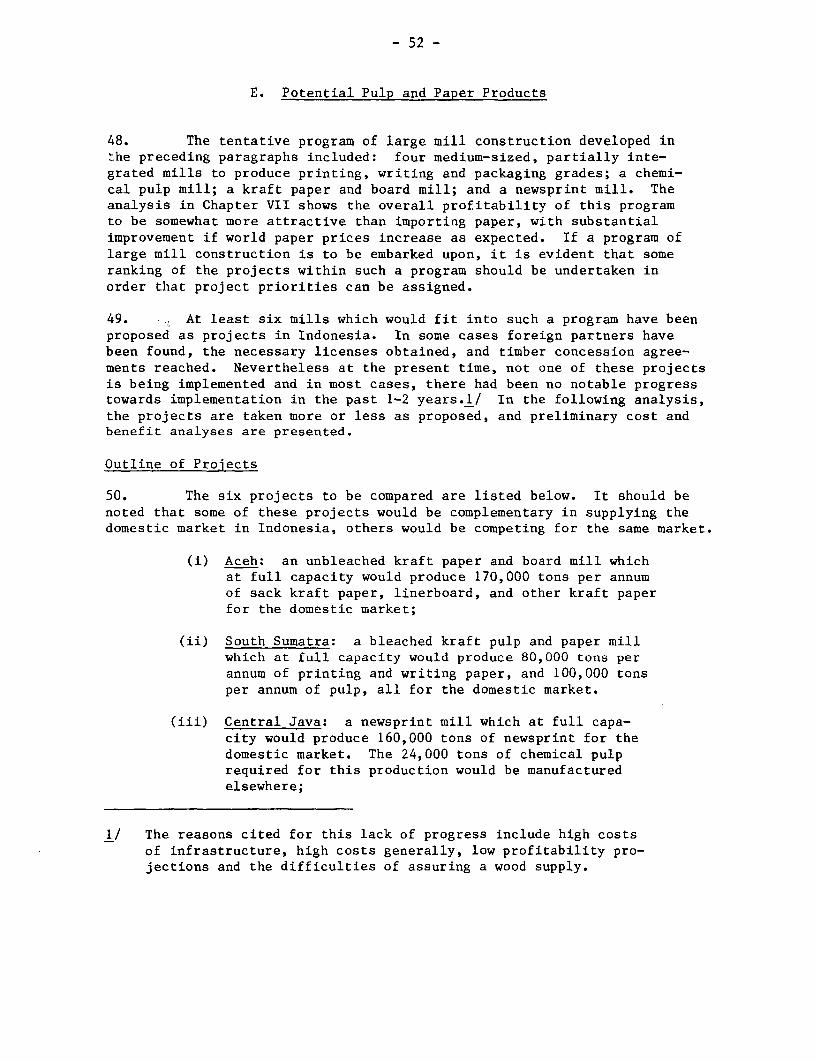
- 52 -
E. Potential Pulp and Paper Products
48. The tentative program of large mill construction developed inThe preceding paragraphs included: four medium-sized, partially inte-grated mills to produce printing, writing and packaging grades; a chemi-cal pulp mill; a kraft paper and board mill; and a newsprint mill. Theanalysis in Chapter VII shows the overall profitability of this programto be somewhat more attractive than importing paper, with substantialimprovement if world paper prices increase as expected. If a program oflarge mill construction is to be embarked upon, it is evident that someranking of the projects within such a program should be undertaken inorder that project priorities can be assigned.
49. At least six mills which would fit into such a program have beenproposed as projects in Indonesia. In some cases foreign partners havebeen found, the necessary licenses obtained, and timber concession agree-ments reached. Nevertheless at the present time, not one of these projectsis being implemented and in most cases, there had been no notable progresstowards implementation in the past 1-2 years.1/ In the following analysis,the projects are taken more or less as proposed, and preliminary cost andbenefit analyses are presented.
Outline of Projects
50. The six projects to be compared are listed below. It should benoted that some of these projects would be complementary in supplying thedomestic market in Indonesia, others would be competing for the same market.
(i) Aceh: an unbleached kraft paper and board mill whichat full capacity would produce 170,000 tons per annumof sack kraft paper, linerboard, and other kraft paperfor the domestic market;
(ii) South Sumatra: a bleached kraft pulp and paper millwhich at full capacity would produce 80,000 tons perannum of printing and writing paper, and 100,000 tonsper annum of pulp, all for the domestic market.
(iii) Central Java: a newsprint mill which at full capa-city would produce 160,000 tons of newsprint for thedomestic market. The 24,000 tons of chemical pulprequired for this production would be manufacturedelsewhere;
1/ The reasons cited for this lack of progress include high costsof infrastructure, high costs generally, low profitability pro-jections and the difficulties of assuring a wood supply.

- 53 -
(iv) East Java: a bagasse-line addition to the Lejesmill to produce 45,000 tons of printing and writingpaper for the domestic market;
(v) South/Central Kalimantan: a 200,000 ton per annumlong and short-fibered bleached kraft pulp mill. By1990, as much as 140,000 tons of this product couldbe sold in Indonesia, the balance would have to beexported; and
(vi) East Kalimantan: a 200,000 ton per annum short-fiberedbleached kraft pulp mill. By 1990, approximately 70,000tons of this product could be sold in Indonesia, thebalance would have to be exported.
The Aceh Project
51. A 40,000 hectare concession of natural pine forest has been grantedto P.T. Atlas Helau, an Indonesian company. Preliminary studies have beenundertaken which suggest that a kraft paper and board mill in this regioncould be feasible. The mill would initially be constructed to use the exist-ing resource, but concurrently pine plantations would be established closeto the mill site for future utilization. At the present time, the companyis carrying out some nursery and plantation trials but detailed studies forthe project have yet to be prepared.
52. For this analysis, it has been assumed that the mill would be de-signed to produce 90% of the projected Indonesian demand for kraft paperand board in 1990, namely 90,000 tons of sack kraft paper, 60,000 tons oflinerboard, and 20,000 tons of other kraft paper for a total production of170,000 tons per annum. Having regard to the projected growth pattern ofthe demand, the mill would logically be constructed in two stages. Thefirst stage would come on stream in 1982, with a design output: capacity of120,000 tons annually. Provision for expansion would be included whereappropriate and the whole mill would be expanded to its ultimate capacityof 170,000 tons in 1987.
53. The estimated capital cost of the project in terms of 1977 prices,is as follows:

- 54 -
Estimated Capital Cost ofAceh Kraft Paper and Board Mill
Item Amount(US$ million)
Plant Capital 335Working Capital 15Training and Management 12Logging Operations 10Plantation Establishment 27Townsite 11
Total 410
The South Sumatra Project
54. This project was conceived as a productive way to utilize largeareas of degraded forest land in South Sumatra, by establishing planta-tions of pine to supply a pulp and paper mill. This concept was developedas part of a Sumatra Regional Planning Study undertaken for the Governmentof Indonesia by an American consulting company, Robert Nathan AssociatesIncorporated of Washington, D. C. As proposed by Nathan the mill wouldproduce 300,000 tons annually of a mixture of bleached pulp and printingand writing papers, using pine from the plantations to be established andexisting resources of mangrove.
55. For this analysis, the project has been scaled down to matchthe projected domestic demand for printing and writing papers and forbleached pulp in 1990. This gives a total capacity of 180,000 tons an-nually, 80,000 tons of which would be printing and writing paper, thebalance pulp for sale. This mill would commence operation in 1985.
56. The total estimated capital cost of this project, in terms of1977 prices, is as follows:
Estimated Capital Cost of South SumatraPulp and Paper Mill
Item Amount(US$ million)
Plant Capital 300Working Capital 20Training and Management 5Logging Operations 8Plantation Establishment 27Townsite 5
Total 365

- 55 -
The Central Java Project
57. A concession to cut Pinus merkusii located in Central Java hasbeen granted to an Indonesian company (PT Anem Kesong Anem) together witha license to build a 60,000 ton per annum newsprint mill. A subsequent ex-pansiorn to 99,000 tons capacity has been proposed. The company has madepartnership agreements with a Canadian company (Kruger) and a Hong Kongcompany (UDI) but the project is not progressing at the present time, prob-ably because of the high cost of plant construction and infrastructure de-velopment. The project as conceived would use the pine from Central Javafor the mechanical pulp portion of the newsprint furnish, and would importsemi-bleached long-fibered pulp as required for the chemical pulp portion.
58. For this analysis, the project concept has been modified slightlyto betl:er meet the projected newsprint requirements in Indonesia. It hasbeen assumed that the mill would be constructed with an initial capacity of120,000 tons annually, to commence operation in 1982, and would subsequentlyexpand to 160,000 tons to match the projected 1990 market demand.
59. The total estimated capital cost of this project (including theexpansion), estimated in terms of 1977 prices, is as follows:
Estimated Capital Cost ofCentral Java Newsprint Mill
Item Amount(US$ million)
Plant Capital 180Working Capital 20Training and Management 8Logging Operations 12Townsita 5
Total 225
The Eazst Java Project
60. This project has been conceived by the Government-owned LejesPulp and Paper Mill as a major expansion project raising output from 24,000tons to 69,000 tons annually. The addition would, in effect, be a com-pletely new pulp and paper mill which would utilize bagasse from adjacentsugar mills. The current operations at Lejes are using rice straw. Thecompany has discussed possible financing for this project with Canadaand Abu Dhabi but at the present time, no full scale feasibility studyhas been undertaken.
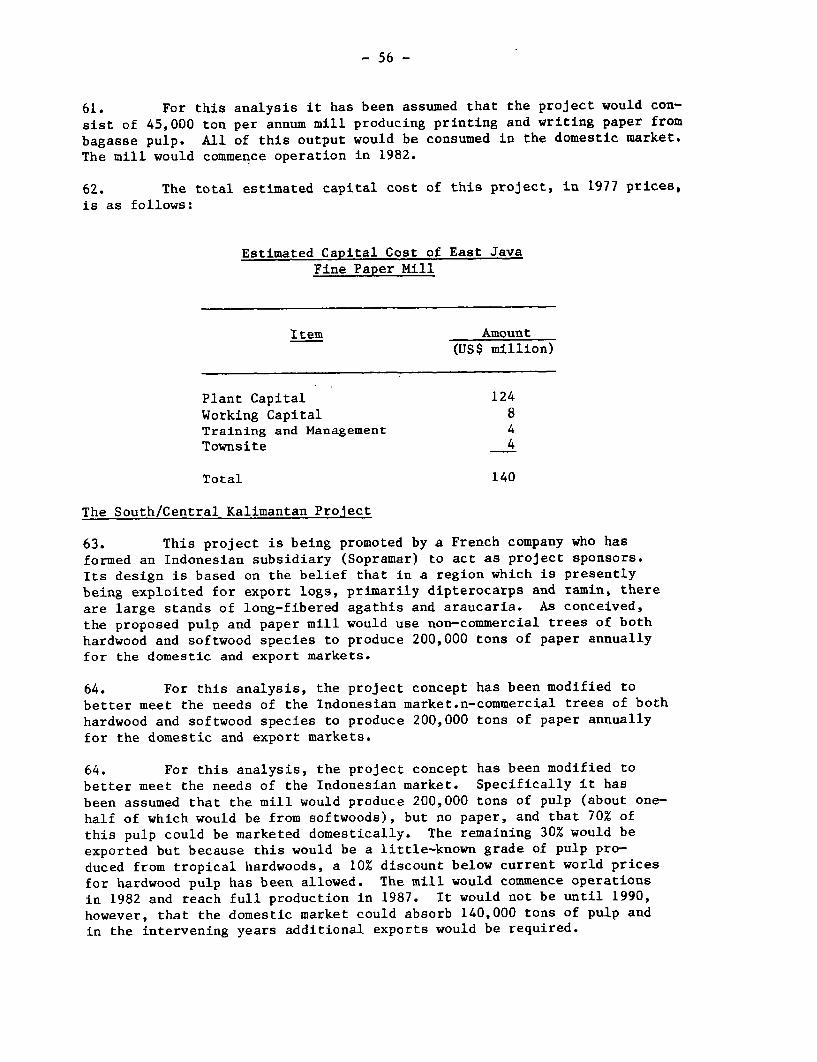
- 56 -
61. For this analysis it has been assumed that the project would con-
sist of 45,000 ton per annum mill producing printing and writing paper from
bagasse pulp. All of this output would be consumed in the domestic market.The mill would commence operation in 1982.
62. The total estimated capital cost of this project, in 1977 prices,is as follows:
Estimated Capital Cost of East JavaFine Paper Mill
Item Amount(US$ million)
Plant Capital 124Working Capital 8Training and Management 4Townsite 4
Total 140
The South/Central Kalimantan Prolect
63. This project is being promoted by a French company who hasformed an Indonesian subsidiary (Sopramar) to act as project sponsors.Its design is based on the belief that in a region which is presentlybeing exploited for export logs, primarily dipterocarps and ramin, thereare large stands of long-fibered agathis and araucaria. As conceived,the proposed pulp and paper mill would use non-commercial trees of bothhardwood and softwood species to produce 200,000 tons of paper annuallyfor the domestic and export markets.
64. For this analysis, the project concept has been modified to
better meet the needs of the Indonesian market.n-commercial trees of bothhardwood and softwood species to produce 200,000 tons of paper annuallyfor the domestic and export markets.
64. For this analysis, the project concept has been modified tobetter meet the needs of the Indonesian market. Specifically it hasbeen assumed that the mill would produce 200,000 tons of pulp (about one-half of which would be from softwoods), but no paper, and that 70% ofthis pulp could be marketed domestically. The remaining 30% would beexported but because this would be a little-known grade of pulp pro-duced from tropical hardwoods, a 10% discount below current world pricesfor hardwood pulp has been allowed. The mill would commence operationsin 1982 and reach full production in 1987. It would not be until 1990,however, that the domestic market could absorb 140,000 tons of pulp andin the intervening years additional exports would be required.

- 57 -
65. The total estimated capital cost of this project, in terms of 1977prices, is as follows:
Estimated Capital Cost of South/CentralKalimantan Pulp Mill
Item Amount(US$ million)
Plant Capital 302Working Capital 19Training and Management 10Logging Operations 8Townsite 11
Total 350
The East Kalimantan Prcject
66. This project is being investigated by the Austrian Government as aprelude to possible Austrian involvement in its implementation. It would pro-duce pulp and paper for the domestic market and for export, using those gradesof tropical hardwoods which are not now commercially exploited. The projecthas no formal sponsor as yet but Inhutani, a Government-owned forestry com-pany, has large concessions in the area under consideration and is workingclosely with the Austr:ians in evaluating the project.
67. For this analysis the project has been considered as producing onlypulp, at a capacity of 200,000 tons annually. Because this pulp would beentirely a hardwood grade, a smaller proportion of it could be consumeddomestically than in the case of the South/Central Kalimantan mill. It hasbeen assumed that the mill would start-up in 1982 and that donestic saleswould reach and stabilLze at 70,000 tons by 1990. The balance of productionwould be exported, at prices discounted from current world pr:Lces by 10%.Although there would undoubtedly be physical differences between this pro-ject and that of South/Central Kalimantan, it has been assumed for this analy-sis that overall capital investment requirements would be the same.
Summarv of Results
68. Paragraphs 7.29 - 7.32 of Chapter VII contain a presentation anddiscussion of the results of preliminary financial and economic analyses foreach cf the six projects examined. The overall conclusions and recommenda-tions arising from this study of development options in Indonesia's pulpand p&per industry are also presented in Chapter VII.

- 58 -
VIII. THE ENGINEERING INDUSTRIES
Introduction
8.01 The engineering industries are an important element of the manu-facturing sector in Indonesia, with products ranging from fabricated steeland other metals to complex machinery, components and intermediate goods,vehicles, small ocean-going ships and, recently, light aircraft assembly.Despite various economic and technological difficulties, this subsectorhas grown considerably since the 1950s and now employs more than 100,000people. In addition to an assessment of problem areas and reviews of specificproject, this report drew attention to the need for an effective long-termstrategy in planning its future development.
8.02 The objectives of the 1976 subsector study were to assess the pro-gress made by the industry and to identify possible project or investmentopportunities for the next stage of development. The latter was taken to coverthe period five to eight years ahead. Particular emphasis was given to the
major constraints or obstacles affecting development to determine possiblemeasures to deal with them. The study has concentrated on metal products,mechanical machinery and electrical industries although some aspects of the
automotive industry were also covered. In this connection, visits were madeto typical firms in the Jakarta, Surabaya and Bandung industrial centers.Discussions were also held with the Ministry of Industry and representativesfrom leading manufacturers' associations.
8.03 This chapter is in two parts. First, it contains a general reviewof the engineering industries in Indonesia in terms of structure, technology,and existing constraints on performance. Particular reference is made tothe problem of imports and the factors which affect the ability of domesticfirms to compete. It then discusses questions of overall strategy, emphasiz-
ing important areas of uncertainty which need to be resolved. It also out-lines a number of possible development projects which would strengthen theexisting product range and facilitate the industry's future growth.
Present Status of the Industries
Size and Structure
8.04 The engineering industries have expanded steadily over the fiveyears since 1971. Whilst accurate statistics covering the whole of this periodwere unfortunately not available to the 1976 mission, it is clear that thesubsector has more than doubled in size. This is confirmed by the growth inoutput that has taken place, the production rates of key engineering products*that have been achieved, and the increases in employment recorded since then.Table 8.1 shows that output in value added terms from large- and medium-scale

- 59 -
engineering firms, other than the automotive industry, increased from Rp 14.4billion in 1971 to Rp 28.9 billion in 1973 (at constant 1973 prices). This isbased on the relevant surveys of manufacturing industries. 1/ Also shown areestimates for 1975, indicating further growth in line with the data presentedin Chapters I and II of this report.
8.05 This growth has been achieved despite cutbacks associated with theworld-wide recession in 1973/74 which affected the demand for steel productsand heavy equipment. The explanation for this is to be found in the increasesin sales of consumer goods since then, notably household appliancles, and theemergence of new industries in the electrical equipment and electronic prod-uct areas. An indication of the volume and range of engineering productscurrently made in Indonesia is given in Table 8.2. These items account fora large proportion of grosS output from the whole subsector which totalledRp 601 billion in value during 1975. Production rates for 1969 are also shown.
8.06 Significant increases in production have been made in nearlyevery case. Output of heavy steel structures, for example, rose by a factorof five between 1972 and 1975 to reach 40,000 tons. Production of machineryand spares advanced from 3,000 tons in 1971 to an estimated 8,000 tons in1976. The output of road rollers also increased, boosted by the introductionof 100% protection. Considerable expansion has taken place in electronics,where the production of radio and television receivers increased Erom 416,000and 65,000 respectively in 1971 to 1,100,000 and 166,000 in 1975. In 1976,the number of television s-ets produced is expected to reach 200,000.
8.07 The growth of the automotive industry has been spectacular, espe-cially since the ban on CBU cars was imposed in January 1974. Primarilyan assembly operation, the output of passenger cars and commercial vehiclesnow totals some 86,000 units compared with 16,000 in 1971 and only 5,000 in1969. This has, however, been achieved more by the introduction of new makesand models than the expansion of existing lines. Operating costs remainextremely high, with average prices more than three times the landed equiva-lents. Despite the proliferation of vehicle types, production of a limitedrange of automotive compon,ents began during the period. These in,zludedmufflers (15,000 in 1975), shock absorbers (30,000), pistons (50,000) andbrake linings (19,000 sets). A number of truck chassis were also made(1,000).
1/ The data for the automotive industry has been excluded to minimize thedistortion that would otherwise occur because of differences in oper-ating margins and taxation levels, and the changes resulting from thetotal ban on CBU passenger cars from January 1974.
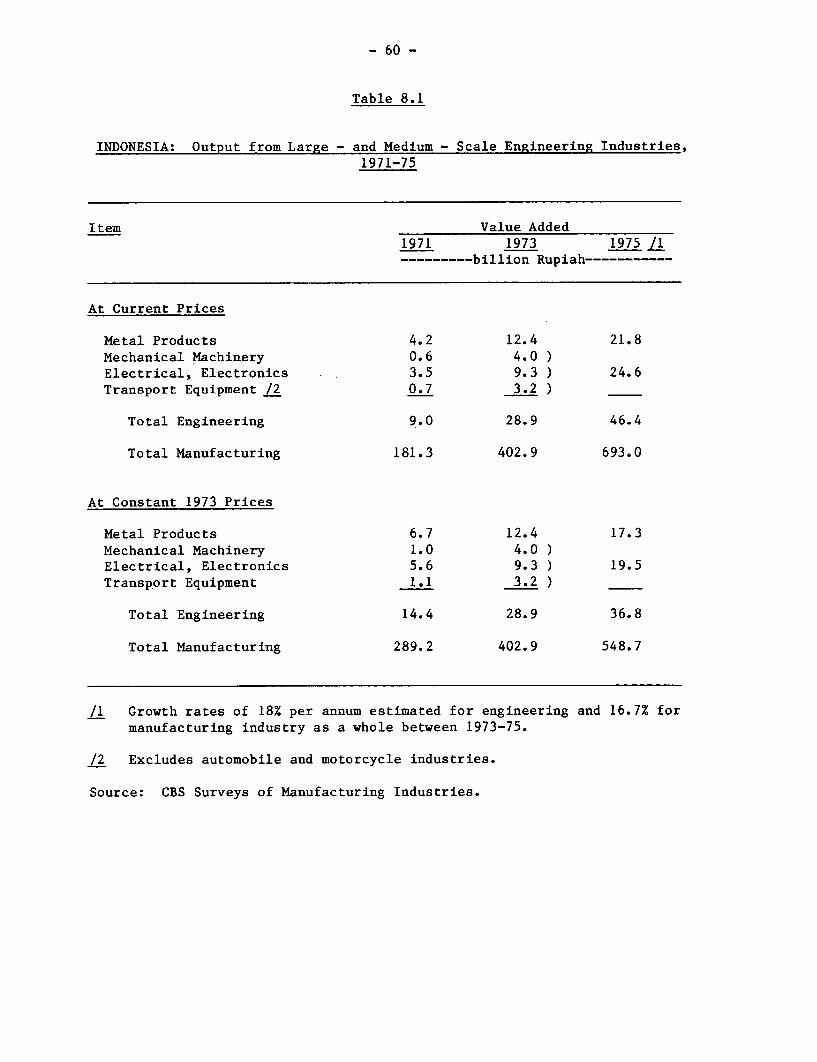
- 60 -
Table 8.1
INDONESIA: Output from Large - and Medium - Scale Engineering Industries,1971-75
Item Value Added1971 1973 1975 L1---------billion Rupiah-----------
At Current Prices
Metal Products 4.2 12.4 21.8Mechanical Machinery 0.6 4.0 )Electrical, Electronics 3.5 9.3 ) 24.6Transport Equipment /2 0.7 3.2 )
Total Engineering 9.0 28.9 46.4
Total Manufacturing 181.3 402.9 693.0
At Constant 1973 Prices
Metal Products 6.7 12.4 17.3Mechanical Machinery 1.0 4.0 )Electrical, Electronics 5.6 9.3 ) 19.5Transport Equipment 1.1 3.2 )
Total Engineering 14.4 28.9 36.8
Total Manufacturing 289.2 402.9 548.7
/1 Growth rates of 18% per annum estimated for engineering and 16.7% formanufacturing industry as a whole between 1973-75.
/2 Excludes automobile and motorcycle industries.
Source: CBS Surveys of Manufacturing Industries.

- 61 -
Table 8.2
INDONESIA: Production of Selected Engineering Products
Product Unit 1969 1971 1973 1975 1976Est.
Metal Products
Light Steel Construction 000 tons - - - 1.5 N/A
Heavy Steel Construction 000 tons - 8(1972) N/A 40 N/A
Bolts and Nuts 000 tons - - - 2 N/A
Steel Wire 000 tons - - - 36 N/A
Mechanical Machinery
Machinery and Spares 000 tons 2.4 3 8 8 8
Hullers 000 pcs. 2.3 - 3.5 4 5
Sprayers 000 pcs. 20 - - 20 25
Water Pumps 000 pcs. 0.9 - - 2 2
SewirLg Machines 000 pcs. 14 292 500 520 550Diesel Engines 000 pcs. - - - 11 12
Road Rollers units 200 200 360 575 600
Electri'cal. Electronics. Etc.
Transformers units N/A N/A N/A 630 N/AElect:rical Cable 000 tons - - 7 9 9
Lamps 000 pcs. 3.5 6 18 21 25Radio Sets 000 pcs. 363 416 900 1,100 1,200Television Sets 000 pcs. 4 65 70 166 200Refr:igerators 000 pcs. - 21 10 37 40Air Conditioners 000 pcs. 4 32 20 23 25Car I3atteries 000 pcs. 32 262 140 220 240Dry-Cell Batteries Mill. pcs. 54 72 132 180 250Transistors Mill. pcs. - - - 3.8 N/A
L.E.D.s Mill. pcs. - - - 2.4 N/A
Transport Equipment
Automobiles 000 units 5 16 37 79 86Motorccycles 000 units 21 50 150 300 350Shipbuilding 000 Dwt. - - - 19 23
Ship Repairs 000 Dwt. - - - 775 N/AAircraft units - - - 1 24
Note: The years are fiscal years.
Source: Department of Industry 26 August 1976 and Almanak Industri 1976.
The Production shown for heavy steel construction in 1972 is takenfrom the 1973 Sector Study by FGU-KRONBERG/KU Gummersbach.

- 62 -
8.08 Several new products have appeared since 1971 and some examples ofthese are also shown in the table. Perhaps the most notable development interms of the engineering know-how and skills required is the start of dieselengine manufacture in Indonesia. In 1977 no less than six different typesare expected to be in production. The project being undertaken by the State-owned P.T. BBI to make Deutz diesel engines under license at Surabaya isparticularly interesting. With assembly already underway, new machinery isbeing installed which will enable 45% of the machining content to be donelocally. Buying imported materials in the first instance, they hope to usedomestically produced castings and forgings when these become available. Ata later stage, local content is planned to rise first to 60% and then to 80%.
8.09 By far the greatest number of new products to be manufactured overthe last three to four years has come from the fast-growing electronicsindustry. A high proportion of these are sold to domestic consumers, such aslocally assembled televisions and cassette players, but there is a small butincreasing range of electronic products being made exclusively for export.Two examples of these are light emitting diodes and linear integrated cir-cuits. It must be pointed out, however, that the three major supplierssimply "sell" their output to another subsidiary of the parent company (e.g.,Monsanto, Fairchild) and are not generating genuine markets. They are simplyone stage in an integrated operation. Manufacturers of this type of productare able to import materials and equipment duty free on the bonded warehouseprinciple. As a result of these and other measures to promote exports inthis subsector, the value of electronics goods other than instruments shippedabroad has risen rapidly and in 1975 totalled US$6.6 million. Preliminaryresults for 1976 suggest that this will be more than doubled. Exports fromother engineering industries were negligible in comparison.
Employment
8.10 The numbers employed in the engineering industry almost doubledbetween 1971 and 1973, before the economic recession took full effect. Thisis clear from the comparisons for large- and medium-scale firms shown inTable 8.3, where the industry totals rose from 36,000 in 1971 to 71,000 in1973. The fastest growth in employment was recorded by the mechanicalmachinery and electrical industries which both increased by a factor greaterthan three times. Employment in the transport industries also more thandoubled. In contrast, the metal products group while still dominant in thetotal number of establishments and employment, expanded by less than a third.
8.11 The results for 1975 indicate a much more modest rate of growth from1973 compared with 1971-73, with a virtual standstill outside the metal prod-ucts group. It must be emphasized, however, that these statistics are basedon preliminary data which probably underestimate the true position - possiblyby as much as 20% for a particular group. This view is based on previousexperience, and is supported by the significant increases in output reportedfor a wide range of engineering products between 1973 and 1975. The resultsfor 1975 are also complicated by a change in classification affecting medium-and small-scale firms. Formerly, establishments with five to nine workersnot using power were excluded from the returns. This appears to account formuch of the increase in employment shown for the metal products group.

- 63 -
Table 8.3
INDONESIA: Employment in Large- and Medium-ScaleEngineering Firms, 1971-75
Industrr Group No. of Establishments Employment (000's)1971 1973 1975 1971 1973 1975
Metal Products 720 942 2,490 21 27 42
MechanicaL Machineryand EquLpment 44 155 245 4 13 11
Electrical Machinery,Electronics, etc. 78 95 160 5 1.6 15
Transport Equipment 305 182 337 6 1.5 18
Total L,147 1,374 3,232 36 71 86
Note: The 1971 statistics cover power-using establishments with five ormore workers and establishments with ten or more using no power.The statistics for 1975 are preliminary results, and include allestablishments with five or more workers.
Source: CBS Surveys of Manufacturing Industry.
Technical Considerations
Technological Change
8.12 Perhaps the most striking of the many changes that have taken placein the engineering industry over the last five years or so has been the wayin which technology has developed. Much of this, of course, has resultedfrom the introduction of new products especially in the electronics industry.But there have also been significant advances in the more traditional metalproducts and heavy engineering areas. Some of these were foreshadowed earlier,for example, the regional foundry centers which should make a considerableimpact in, terms of improved product quality when fully operational. Severalfactories using modern technology and equipment have also been built to makesuch products as diesel engines and electric power cables.
8.13 Technological change is also noticeable in many of the older engi-neering concerns, although some that were originally set up as repair shops.

- 64 -
Although there is still a demand from the industry's customers for pre-warmachinery spares, they are increasingly replacing obsolete plant by moreup-to-date equipment. The requirement for modern designs has also beenboosted as a result of various projects undertaken during Repelita I and II.In line with this trend, considerable product diversification has taken placein engineering. In some instances, joint ventures have been established withforeign partners to manufacture machinery and equipment which would otherwisehave to be imported. Agricultural tools and centrifugal pumps are examplesof these. Several firms have turned to making structural steelwork as thedemand for some of the foundry-based products has declined or become unpro-fitable.
8.14 The process of technological change is continuing, but it is alsoexpensive. Some indication of the order of investment likely to be made inthe engineering subsectors over the next two years or so is given by Table8.4. This is based on the applications registered with the Directorate-General of Basic Industries as of November 1976, and summarizes the foreignand domestic capital requirements for various projects in the four mainproduct groupings. It can be seen that the projected investment for thetransport subsector is considerably more than the others. However, almosthalf this is accounted for a single shipbuilding project worth US$29 million.
8.15 The investment projected for the mechanical machinery group issignificantly higher than that for the electrical and electronic industriesand approximately equal to that for transport equipment other than ship-building. The range of products includes tea processing and sugar machinery,
Table 8.4
INDONESIA: ProJected Investment for the Engineering Industry(as at November 1976)
Foreign Investment Domestic InvestmentNo. Value US$ Million No. Value Rp Billion
Metal Products 5 19.7
Mechanical Engineeringand Equipment 13 31.2
Electrical Machinery,Electronics, Etc. 10 21.6 5 3.12
Transport Equipment 13 53.5 3 2.31
Total 41 128.0 8 5.43

- 65 -
boilers and overhead travelling cranes, and two projects involve dieselengine manufacture. Small electric motors and generators are notably newproducts in the electrical industry group, whereas the main emphasis inthe tranLsport subsector is on automotive components. The latter includesradiators, pistons, filters and brake linings, and also front forks andshock absorbers for motorcycles.
Condition of Plant and Machinery
8.16 The poor condition of machine tools and other plant continues togive cause for concern. Although re-equipment has taken place since 1971,out-dated and badly maintained machinery still predominates in the small-and medi:um-size firms. Several examples were noted during visits by themission,, and it is clear that little progress is being made in dealing withthis problem. There is, however, one notable development - the rehabilita-tion center now being established in Surabaya by P.T. Barata. When fullyoperational this will be capable of reconditioning about eight machines amonth. Unfortunately, with an estimated 60% of their own machines requir-ing attention, there is unlikely to be any capacity for other companies'machines for at least three years unless the planned facilities are con-siderably expanded.
8.17 In 1972 it was estimated that 8,500 machine tools out of a totalof some 14,000 needed repair, although of these only 6,000 were worth over-hauling. 1/ The remainder of 2,500 should be scrapped. Thus a single unitprocessing some 100 machines a year is unlikely to make a significant dif-ference. However, at the time the original survey was carried out, the mixof machine types was found to be at variance with that commonly found inindustrialized countries, particularly with regard to lathes, drills, andshapers used in repair and rehabilitation work. These accounted for 48%of the total, half as much again in comparison to industrialized countries,which reflects the heavy demand for repair work in Indonesia. With thechanges in technology tlnat have already occurred and are likely over thenext decade, many of the existing machine tools will almost certainly be-come redundant thereby reducing the numbers to be overhauled. Althoughthis would clearly ease the problem, it would by no means eliminate it.
Machine Utilization
8.18 It was clear from the visits to various factories that machineutilization, other than possibly in the electronics industry, is still amajQr problem. Whole departments or machine sections were found to be idlefor lack of work; single shift work is also predominant. This is true offactories built within the last five years as well as old established con-cerns, and applies to both public and privately-owned companies. Data formachine utilization were difficult to obtain. Some information was, however,provided by the Department of Industry. Typical usages stated were: steel
1/ FGU-KRONBERG/KU Gummersbach (Sector Study, Engineering Studies inInidonesia).

- 66 -
wire manufacture - 27%, machine shops - 25%, electric cable manufacture -50%, automotive assembly - 92%, and motorcycle assembly - 63%. The problemis, of course, closely related to the level of demand. The overwhelmingopinion among many zenior executives with whom this question was discussedwas that the problem centered on industry's failure - for a variety of rea-sons - to secure an adequate share of the market against foreign competitionrather than over-capacity.
Productivity Levels
8.19 Productivity also remains a cause for concern except in the newer,better-equipped firms. In 1973 a comparison among a wide-ranging sample ofjobs done in Indonesia and the same type of work in Holland showed that theaverage time taken differed by a factor of six to one. Poor equipment andtooling, lack of work preparation and the use of oversize materials werefound to be the main contributory reasons. 1/ It was not possible duringthe visit to check whether these findings were still relevant, but the mis-sion formed the opinion that productivity in heavy engineering was typicallyone-third to one-fifth that was found in European plants.
8.20 Several instances were noted where productivity in terms of physi-cal effort and skill compared favorably with European experience. Commentingon this aspect, a number of managers attributed it to the general employmentsituation and the scarcity of jobs. And there seems little doubt that thisis an important factor. Management at one electronics factory which employsseveral hundred female workers stated that they had proved their staff couldmatch the output levels achieved in other developing countries such as Koreaand Taiwan, provided workflow was maintained. The latter, of course, dependson efficient management; that is one of the critical problems in trying toincrease the indigenous staff.
8.21 Outside the new, more advanced industries, methods leave a greatdeal to be desired in terms of efficient production, and it is clear thatsubstantial improvements could be made. The problems are well known and havebeen reported at length by different agencies, as indeed, have their remedies.But the inescapable fact remains that productivity in many areas of industryis seriously impaired by poor methods, equipment, tooling, etc., so that muchof Indonesia's so-called comparative advantage in terms of low wage rates islargely if not totally eroded. Typical examples noted during the visit were:
- a general lack of suitable handling and lifting equipmentin the small/medium size companies. Dirt floors arecommon; overhead hoists or cranes are found only in thelarger factories;
- badly laid-out and congested shops with too much workbeing done on the floor instead of on benches;
1/ Bandung Institute of Technology with Dutch technical assistance.

- 67 -
- poor metal-removal rates. Much of the machinery unsuit-able, in a bad state of repair or outdated. There arestill large numbers of pre-war, belt-driven machine toolsin operation;
little modern tooling;
the frequent use of oversize or poor-quality importedmaterials. Because of time constraints and other fac-tors, many of the smaller firms obtain their require-ments through local markets where the range of sizes isrestricted and the control of material specifications.often totally inadequate.
8.22 Fortunately, the picture is not wholly black. One of the encourag-ing findings from visits3 to different factories was the remarkable ingenuityexercised on the part of some firms in adapting little-used machinery ormaking special purpose eaquipment. To meet the delivery and quality require-ments of a contract to supply thin pre-formed stainless steel panels for anew mosque, one company had designed and made its own set of powered rolls toshape the intricate sections that were needed. Another small i-irm had builtits own stamping machinery and also a simple low-cost wire forraing machineto manufacture fencing. But perhaps the most important development that hastaken place has been the setting up of formal production/indusirial engineer-ing departments in some of the bigger firms. This has led to increased atten-tion being given to method specification and improvement, and ensuring theshop-floor is made aware of the way in which jobs should be done. Examplesof the useful progress being made in this area were seen during visits tothe machine shops of two large engineering concerns in Surabaya. In linewith best modern practice, information on the equipment and tooling reuired,machine settings and sequence of operations to be followed to complete eachjob is set out on detailed method sheets given to the operator. Optimumspeeds and feeds are adjusted to take account of machine tool condition,available tooling, etc; standard times determined by study and including abonus element where required are also specified.
8.23 In cost terms, no advantage is gained from improved labor produc-tivity or methods of working if the net result is simply to increase thelevel of non-productive time. Conversely, significant improvements in outputand hence lower operating costs can be achieved by reducing the nonproductiveor idle time of the key resource - machine or manpower. Thus utilization isan important aspect of productivity. The main factors here are (i) workload,which tlepends ultimately on sales, and (ii) work-flow, which can be improvedby better production p]anning and control. Progress has clearly been madein these areas since the previous visit, particularly by some of the biggerfirms. The need for a separate marketing function is now more widely ac-cepted, and greater importance is attached to the need for effective controlsin the manufacturing area. The contribution made by the Metal IndustriesDevelopment Centre (MIDC) at Bandung both in training and in a consultancycapacity in these fields is to be commended.

- 68 -
Product Standards and Quality Aspects
8.24 Two aspects of technical performance which continue to be frequent
subjects for discussion are standardization and quality. Taking standardi-zation first, the problem here is essentially external in that there is a
large measure of agreement on standards amongst producers but still a wide
divergence on the part of certain major consumers especially in the publicsector. Sometimes difficulties arise because of differences in interna-
tional standards. On other occasions problems are caused by wide variationsin technical requirements for similar products specified by different users.
These can be particularly acute in the case of certain volume producers such
as electronics and cable manufacturers.
8.25 The problem is currently being tackled on an industry-by-industry
basis through the various manufacturers' associations by MIDC. Despite
Government backing it is doubtful whether real progress can be made without
directly involving the various ministries and other public bodies concerned.This might be difficult to arrange for administrative, commercial and other
reasons, and some other approach may be needed. One alternative which might
prove acceptable to the interested parties would be to set up an independent
Standards Institute, on which manufacturers, customers in both the publicand private sectors, universities and other technical interests would be
fully represented. This would necessarily comprise several groups, for
example: materials, mechanical, electrical, electronics, instrumentation,etc., with cross links through the various operating committees that would
be needed.
8.26 There is, of course, a close relationship between standards and
quality in an engineering context. Inadequate or over-exacting standardscan result in inferior goods being made on the one hand or excessive costs
arising on the other, both of which lead to problems in marketing. Much
of the improvement is due to investment in new plant and equipment, better
training, and the installation of more effective controls. One of the
difficulties now facing some companies is that of convincing their customersthat the quality and reliability of Indonesian products are equal to those
of most foreign competitors. This is clearly a difficult problem and one
which could take several years to overcome.
Market Factors
8.27 As already stated, the new consumer-based industries are expandingat a faster rate than their counterparts in heavy engineering. The reaons
for this and possible steps to promote more even growth were discussed at
length with senior officials and company executives. Indeed, more time was
spent on this topic than on any other aspect. Whilst various internal weak-
nesses have undoubtedly tended to limit output in the metal products and
mechanical machinery industries, it is clear that 'lack of sales' rather than
problems in the production areas has been the major cause of this situation.
The ability of a company or an industry to compete successfully in the marketplace depends on many factors. These are often complex and frequently inter-
act one with another.
- 69 -
The Type of the Market
8.28 The market for capital goods in Indonesia is dominated by large-
scale public sector programs to develop the country's economy. Much of the
finance for this type of investment is obtained through foreign governments,
with the donor countrie.s often providing hardware and know-how as integral
parts of an aid package. Thus, apart from some local building construction
and other site work, domestic industry is often precluded from the manufac-
ture of any plant and equipment required, regardless of technical capability,
price, or other considerations.
8.29 Major projects are also financed by international banks and other
agencies. The supply of plant and machinery in these cases is usually sub-
ject to competitive tender, and is therefore open to domestic as well as
foreign manufacturers. Although some degree of preference is usually given
to Indonesian industry - 15% on capital equipment in projects funded by the
World Bank, for example - overseas companies are also favorably dealt with in
that their equipment is exempt from import duties and other ta.xes. Another
form of public sector project is one in which the funding is largely or wholly
sourced internally. In this instance, local industry does not receive any
preferential financial treatment. Foreign-made equipment, on the other hand
is still exempt from duty and taxes.
8.30 Price, of course, is not the only factor which detennines a sale.
For example, one design of machine may be unable to meet the specified re-
quirements or perhaps running costs are too high in comparison with another
manufacturer's product. Quality and reliability are other obvious, important
considerations. There is a widely-held view among Indonesian producers that
sales are lost to imports because the officials concerned with public sector
programs wrongly believe that local products must be inferior. Although it
would be difficult to prove or disprove this assertion, the implications are
such that further investigation would almost certainly prove worthwhile what-
ever the outcome.
Domestic Marketing
8.31 From discussions with various firms, there appears to be some com-
petition among domestic producers, especially amongst the larger privately-
owned companies. At the same time, there is increasing collaboration between
them through their respective trade associations, and quasi-cartel arrange-
ments are beginning to emerge. Perhaps, not surprisingly, the electronics
and automotive firms have led the way in building up selling organizations
to develop their markets. There is little doubt that this is due to the
influence of the overseas companies and their managers involved in setting
up these new businesses.
8.32 There is, however, still a general lack of marketing effort by
the smaller firms that typically rely on taking orders from a few regular
customers instead of going out to sell new business. As a result, oppor-
tunitiEs are lost and expansion is stifled through a failure to compete.
- 70 -
MIDC is conscious of the problems faced by this type of company which oftenhas very limited resources and whose markets tend to be confined to nearbygeographical areas. Professional assistance is currently being given tothree such firms in the Bandung area on a pilot-study basis to improve theireffectiveness in marketing, product design and manufacturing. The scheme isplanned to be extended to other engineering companies during 1977.
Imports and the Ability to Compete
8.33 The main competition in the engineering sector comes from abroad inthe shape of imports. In 1975 the value of engineering products (excludingthe automotive categories) imported during 1975 was Rp 625 billion (US$1,505million) more than four times greater than the combined output from Indonesianmanufacturers in value added terms. This is based on the estimates shown inTable 8.5. The ratio has doubled since 1972 when the corresponding importstotalled Rp 196 billion. 1/ At that time, the greatest imbalance was foundin the mechanical machinery product group where the volume of imports wasseven times that of domestic production. As Chapter III shows, in 1971 inthe "machinery" industry only 5% of total supplies were domestically produced.Unfortunately, it was not possible to make up-to-date comparisons of importsand production levels in this particular category because of the lack ofdata. But the available evidence suggests that the situation has probablychanged very little in the interim.
8.34 Various measures have been taken to contain imports. In certaininstances a total ban on imports has been instituted, namely passenger carsand commercial vehicles other than C.K.D. units, galvanized iron sheets,and road rollers (6-12 tons). In other cases, varying levels of duties andimport sales taxes have been applied. Some examples of these are given inTable 8.6. Part of the import total can be accounted for by the high propor-tion of foreign produced materials and components used by local manufacturers.This applies not only to the assembly-based automotive and electronic indus-tries, but also to the metal products and machinery groups though to a lesserextent. Typical requirements are:
Raw Materials
Wire rod, steel forgings, hot and cold rolled steel sheet,steel plate and sections, aluminum plate, copper wire androds.
Components
Diesel engines, fasteners, instruments, and parts for theautomotive and electronics industries.
With very few exceptions, import duties and taxes have to paid for materialsor components procured from abroad. These can result in significant addi-tions to product costs and, in turn, adversely affect prices.
1/ FGU-Kronberg/KU Gummersbach.
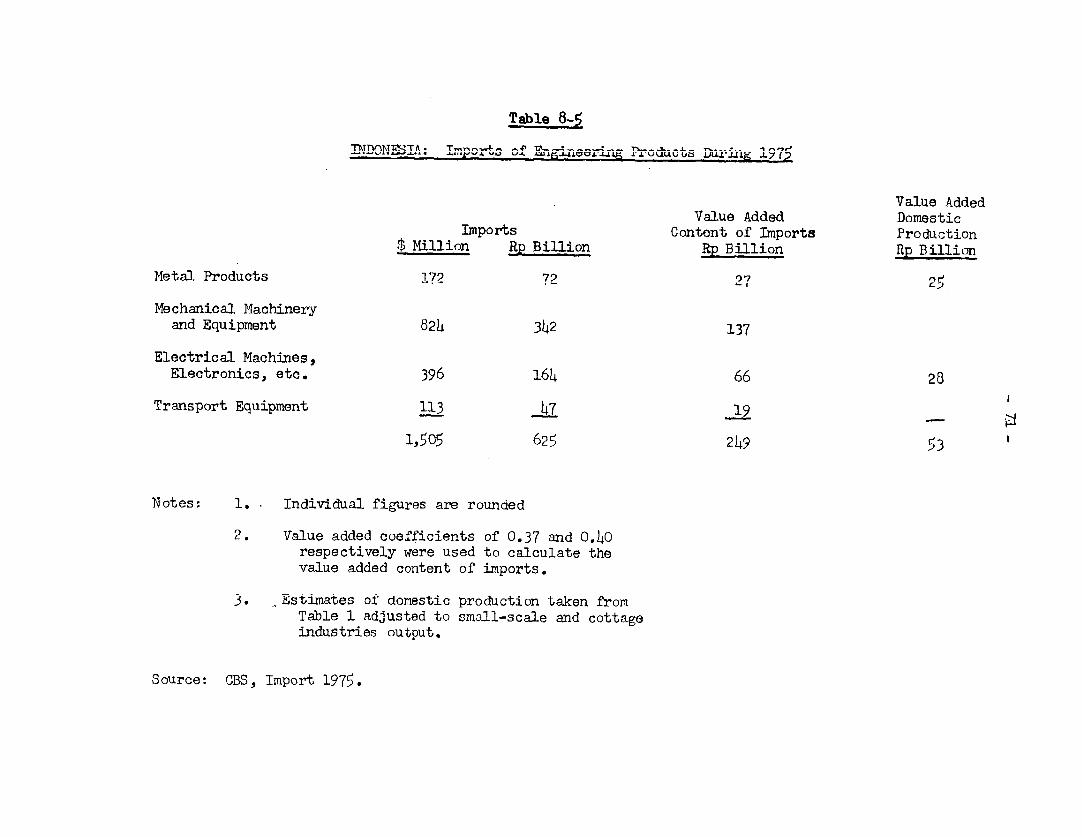
Table 8-5
| 'fl'V Z-.* -^^ ^ A:sjs s £S £. -uuLu id_ LAvu llg .Ly t
Value AddedValue Added Domestic
Imports Content of Imports Production$ Million Rp Billion Rp Billion Rp Billion
Metal Products 122 72 27
Mechanical Machineryand Equipment 824 342 137
Electrical Machines,Electronics, etc. 396 164 66 28
Transport Equipment 13 47 19
1,505 625 249 53
Notes: 1. - Individual figures are rounded
2. Value added coefficients of 0.37 and 0.40respectively were used to calculate thevalue added content of imports.
3. Estimates of domestic production taken fromTable 1 adjusted to small-scale and cottageindustries output.
Source: CBS, Import 1975.

- 72 -
Table 8.6
INDONESIA: Import Duties and Taxes for Various-Engineering Materials and Products
Item Dutr Import Sales Tax-- -- -- -- -- -- - -- %- -- -- -- -- -- -
Steel billets/scrap 5 5Steel wire/pipes 40 15Aluminum sheet 5 5Aluminum extrusions 55 15Diesel engines 30 10Water Pumps 30 10Hullers 40 10Sewing machines 70 10Copper wire 5 5Cable 60 10Refrigerator/air conditioners 60 (built up) 20 (built up)
it " "30 (CKD) 10 (CKD)Automobiles 100 (CKD) 20 (CKD)Commercial vehiclesMotorcycles 30 (CKD) 10 (CKD)
8.35 It is widely believed that, because wages are low in comparisonto other countries, Indonesian manufacturers ought to be able to competesuccessfully against foreign producers. Whilst there are, indeed, instanceswhere this is true, this is demonstrably not the general case. The fact isthat the wage cost advantage is more than offset by a variety of other fac-tors including: inadequate and poorly maintained equipment; poorly trainedlabor in many industries which leads to low productivity; uncertain marketdemand leading to poor work scheduling; dependence on imported inputs whosecosts include duties and excise taxes; and weak marketing organizations whichin turn reflect back on production scheduling. These are all interrelatedfactors.
8.36 Accurate price comparison, which are also representative, betweenlocally-made and imported products are difficult to make without undertakinga fully detailed survey. 1/ There are also considerable differences in
1/ The Germany Study Team made a detailed analysis of 21 engineering firmsand 23 workshops in 1973, but were only able to make direct comparisonsof prices with imported products in a few instances. Generally, heavyengineering products were considerably more expensive than imports.Domestic appliances were relatively competitive.
- 73 -
import charges and taxation as has been shown. At one end of the scale, someelectronic components are made as cheaply as anywhere in the world. At thesame time, automobiles cost three times the C&F equivalent because of uneco-nomic production rates and high taxation levels. From the data available,heavy engineering products as a group are estimated to cost between 25% and60% more than their imported counterparts. It will require a concentrateddevelopment program to improve the competitive position in these industries
.Major Constraints on Development
8.37 In addition to current problems, considerable attention was given tothe key factors likely to inhibit further growth in the engineering industry.Although there were differences in emphasis, a surprisingly wide measure ofagreement was found between those who took part in the various discussions onthis important aspect. The factors can be grouped together under two mainclassifications, internal and external. The internal category covers the kindof problem which can be tackled'to some extent by an individual firm provided,of course, it has or can be given the necessary resources. External factors,on the other hand, concern the wider issues facing industry over which it haslittle or no control. These are discussed in turn below.
Internal Factors
8.38 Apart from a widespread need to overhaul or replace machine toolsand other plant in many firms, the main internal problem facing industryconcerns the continuing lack of key people. This covers both skilled produc-tion wcrkers and the technical and managerial staff. Considerable effortshave been made to deal with this problem by expanding and uprating trainingfacilities and programs. In the case of skilled workers, extensive use hasbeen made of the Regional Training Centers and other bodies such as MIDC,along with in-plant training. One large engineering company has spent someRp 4.5 million on training 500 machine operators and welders during 1976as part; of a long-term plan to ensure it has the skills iL needs. This hasproved a successful form of investment so far as this firm is concerned.
8.39 Although the supply of skilled labor has undoubtedly increased,there is still an underlying shortage. This is evident from the frequentcomplaints of 'hi-jacking' from the larger firms by companies unable orunwilling to train their own staff, and is reflected in the high rates of paythat are offered. At one end of'the scale, unskilled laborers and helpersreceive a minimum of around Rp 12,500 per month excluding overtime and othercash payments. This compares with gross earnings of Rp 50,000 to Rp 100,000a month quoted for top-skilled welders and other engineering grades. Thesefigures were obtained partly from official sources and partly from companiesvisited. In most instances the variation between the lowest and highestearnings within a single company was of the order 2.5 to 1. In one case itwas as much as 5 to 1. It would also appear that differentials have widenedover the last five years or so in contrast to the reverse trend in othercountries.

- 74 -
8.40 Substantial fringe benefits are also paid to induce workers tostay with their employers. These include family allowances, transportto-and-from work, free meals, overalls, medical care, and, in some instances,accomodation. Special bonuses of one month's wages or more are paid at the'Idul Fitri' day or Christmas holiday as appropriate. Long service awardsmay also be given. The value of these benefits varies from firm to firm.In terms of production costs, they can add some 15-25% to the labor cost.
8.41 The availability of good technical and managerial staff remainsa problem in the industry. The salary levels offered to newly qualifiedgraduates, Rp 100,000 and higher per month, reflect their scarcity value.Extensive and costly industrial training is also necessary for these men,much of it abroad, because of their lack of practical experience at univer-sity. There is particular difficulty in finding suitable men for designand production engineering work because of the time it takes to acquire thenecessary depth of knowledge and experience. As a result, many engineeringcompanies lack the technical staff to adapt or extend their product rangesthemselves. Similarly, only limited effort is devoted to the major task ofimproving production methods and efficiency in the heavy engineering areas.
External Factors
8.42 There is almost universal agreement that the lack of funds atreasonable terms is restricting the growth of the engineering industry inIndonesia. Some private firms have extreme difficulty obtaining any moneyfor expansion, others are forced to limit their borrowing because of thehigh interest rates that have to be paid. As a result, long-term develop-ment is very largely dependent on short-term profitability. A director ofone small firm was justifiably proud of the fact that they were able tofinance expansion, albeit slowly, out of trading profits. He was doubtfulwhether many others could make a similar claim and was generally worriedabout the industry's future. Interest rates are currently 18% per annumfor investment capital, and 24% for working capital. The problem is accen-tuated where debt/equity ratios are high, as in the case of certain state-owned enterprises which were found to have ratios greater than nine to one.
8.43 In the capital goods sector, competition from imported productsis regarded as the biggest single factor limiting expansion. This is blamedfor the heavy underutilization of plant and the consequent loss of employ-ent opportunities. A good deal of criticism is levelled at the duty andtax exemption given to foreign suppliers. There is also concern at theapparent unwillingness of some public bodies to specify machinery and equip-ment made by Indonesian firms, even where this is cheaper and manufacturedto the required international standards. Although there is no doubt thatthe market for heavy engineering products has been badly distorted by thelevel of imports, no one seems able to quantify this in meaningful terms.There is, of course, no shortage of specific examples where local firms havefailed to secure contracts against foreign competition. But much more infor-mation would appear to be needed to prepare a case convincing enough to bringabout any desirable changes in policy.

- 75 -
8.44 Day-to-day operations and the development of new ventures in theengineering industry are both badly affected by the unnecessary delays thatoccur in. dealing with various public authorities. The excessive time re-quired t.o obtain customs clearance for production materials imported by sea,for exaniple, can result in significant 'hidden' costs with multiple paymentsrequired in order to get official approvals. In one instance t'his involved84 checkpoints, and 10 signatures were required before a consignment wasreleased.. By contrast, items sent by air freight are processed with verylittle delay. Problems frequently arise in the interpretation of tariffrates. Duties on items not specifically listed are often set at arbitraryhigh levels, which are seldom challenged to avoid even more delays andconsequent costs. Problems also occur when exporting. In general, littleincentive is given to the industry to export and, in many respects, thereappear t:o be positive disincentives. In particular, the time taken torecover duties paid on imported materials and components subsequently re-exported in finished product form is almost absurd in comparison with thesituation found elsewhere. Delays of twelve months are common; drawbacktook three years in the case of one electronics company. If the engineeringsector :Ls to become export-minded - an essential long-term requirement foran efficient industry - considerable changes are clearly going to be neededin this area.
Future Trends and Prolect Identification
8.45 Although a gocid deal of attention was necessarily directed towardsthe present-day problems of the engineering industry, the mission was primar-ily concerned with development needs. Particular consideration was given toassessing the broad reqtuirements five to eight years ahead to improve andexpand this important sector, and to identifying possible projects or invest-ment oplportunities of a type compatible with this program. This section ofthe report considers those aspects, looking first at the question of overallstrategy. Particular emiphasis is given here to important areas of uncertaintywhich need to be taken i;nto account.
The Need for an Overall Strategy
8.46 A comprehensive ten-year strategy to develop Indonesia's engineer-ing industry was set out: earlier. This was based on the manufacture of keyproducts mainly for the public sector, with priority given to t:he followingareas:
- agricultural equipment
- construction equipment
- trucks and buoes
- industrial electrical equipment
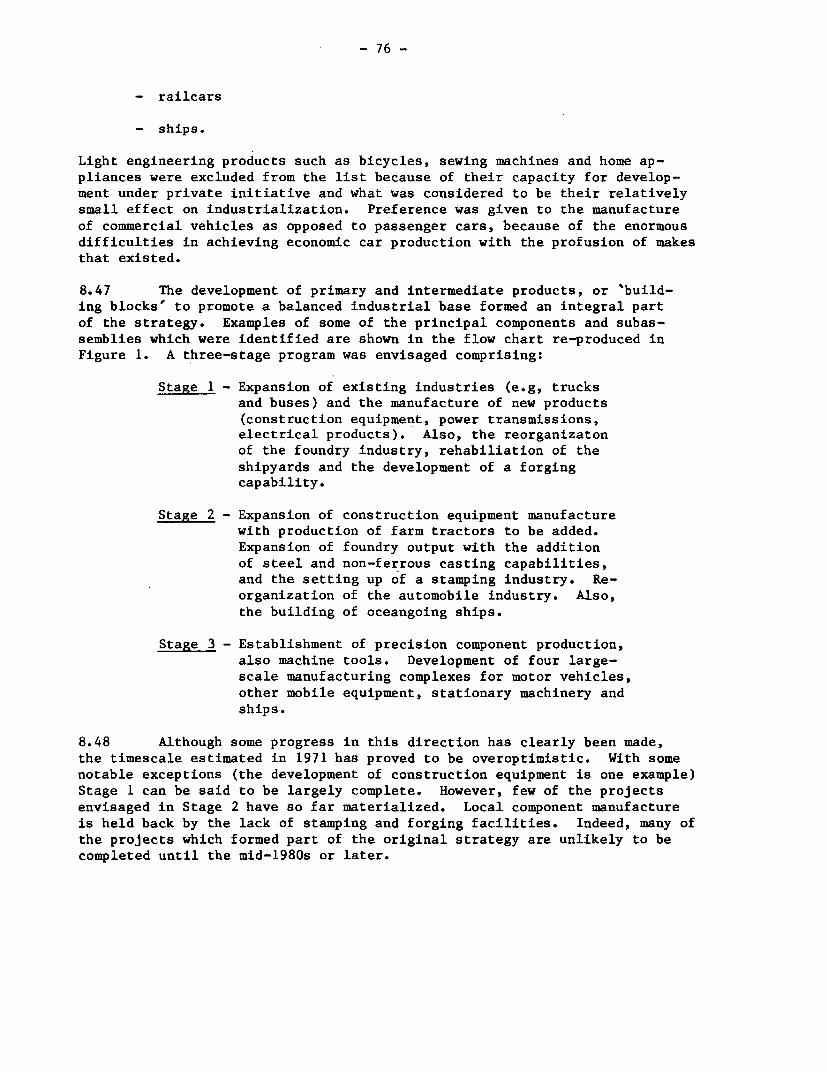
-76-
- railcars
- ships.
Light engineering products such as bicycles, sewing machines and home ap-pliances were excluded from the list because of their capacity for develop-ment under private initiative and what was considered to be their relativelysmall effect on industrialization. Preference was given to the manufactureof commercial vehicles as opposed to passenger cars, because of the enormousdifficulties in achieving economic car production with the profusion of makesthat existed.
8.47 The development of primary and intermediate products, or 'build-ing blocks' to promote a balanced industrial base formed an integral partof the strategy. Examples of some of the principal components and subas-semblies which were identified are shown in the flow chart re-produced inFigure 1. A three-stage program was envisaged comprising:
Stage 1 - Expansion of existing industries (e.g, trucksand buses) and the manufacture of new products(construction equipment, power transmissions,electrical products). Also, the reorganizatonof the foundry industry, rehabiliation of theshipyards and the development of a forgingcapability.
Stage 2 - Expansion of construction equipment manufacturewith production of farm tractors to be added.Expansion of foundry output with the additionof steel and non-ferrous casting capabilities,and the setting up of a stamping industry. Re-organization of the automobile industry. Also,the building of oceangoing ships.
Stage 3 - Establishment of precision component production,also machine tools. Development of four large-scale manufacturing complexes for motor vehicles,other mobile equipment, stationary machinery andships.
8.48 Although some progress in this direction has clearly been made,the timescale estimated in 1971 has proved to be overoptimistic. With somenotable exceptions (the development of construction equipment is one example)Stage I can be said to be largely complete. However, few of the projectsenvisaged in Stage 2 have so far materialized. Local component manufactureis held back by the lack of stamping and forging facilities. Indeed, many ofthe projects which formed part of the original strategy are unlikely to becompleted until the mid-1980s or later.

RAW PRIMARY PRIMARY GENERAL SPECIAL ENDMATgRIALS CONVERSIONS COMPONENTS SUB-X i kBLIES SUB-ASSEMBLIES PRODUCTS
Steel Mill* Foundry Fasteners Boilers Structures AgriculturalProducts rLOUUUCL tanks, etc. Equipment
Special Forgings Bearings Transmissions Parts for Pro- Construction*Alloy Steel cessing Mills Equipment
Foundry Stampings Transmission Pumps & * Industrial Trucks, Buses rPig Iron Components Cotpr,ess&rs Hardware" _
Non-Ferrous Valves, etc. Hydraulic Accessory 'Electttcal* .Material Devices Equipment Equipment r H
Engines* Brake Ships HSystems __o
Electrical* Suspension RailcarsComponents Systems
ControlSystems
DeckMachinery
Note: Products underlined designate sectors wherethere was a significant activity or capabilityin 1971. Areas where substantial developmenthas subsequently taken place are marked withan asterisk.

- 78 -
8.49 A different approach was adopted by the FGU-Kronberg/KU GummersbachGroup in a major study of the engineering sector in 1973. The study did notattempt to define a comprehensive strategy or framework for the development ofthe industry. Instead, more emphasis was given to the development of finishedproducts. It covered both consumer and capital goods industries; a largenumber of possible projects was identified using import substitution as astarting point of the selection process. In the supply areas, feasibilitystudies were undertaken of plastic mould manufacture, the production of machinecutting tools, and the production of carbide metals. The rehabilitation ofmachine tools and measures to improve the efficiency of a number of existingenterprises were also studied.
8.50 Having considered the problems of Indonesia's engineering industryat length for a second time, the mission is convinced that the need for anoverall strategy is as important as ever. This should cover the whole sub-sector, from the manufacture of raw materials and components through tofinished products. It should also include consumer items as well as capitalgoods and make provision for the small-scale industries. There are obviousadvantages for developing such a strategy as opposed to a piecemeal approach.For instance:
- industrial planning would be facilitated; the relevantpart of the strategy could be incorporated into RepelitaIII.
- uneconomic use of scarce resources, particularly localfunds and talents, would be minimized.
- technology transfer would be achieved more cohesivelyand rapidly.
- a broad-based, more efficiently managed industry wouldresult which should attract much higher overseas invest-ment.
8.51 The thinking behind the ten-year plan referred to above is stillvalid, and could be readily adapted to the current situation. The matrixof building block products would, of course, need to be modified as wouldtiming. There are, however, a number of factors which need to be taken intoaccount before a revised strategy can be determined in other than generalterms. For example, action is required to deal with the problems of heavyengineering which are holding back development in this key area. Also, thefragmentation of automobile assembly is affecting the growth of componentmanufacture. The longer-term possibility of exporting selected products isalso a relevant question. Each of these is discussed more fully below.
Areas of Uncertainty
8.52 Some of the changes that have occurred in the engineering subsec-tor since the date of the previous visit could have an important bearing on

- 79 -
the industry's future development. The comparatively explosive growth inelectronics is a case in point. This has created new employment:, involvednew technology, and established a thriving business. There are signs,though, that the rate of expansion in this area will be less dramatic overthe next five years unlesss some stimulus is given.
8.53 In the metal products and engineering machinery areas, the failureof domestic industry to secure a bigger share of the capital goods marketis clearly a cause for concern. Underutilization of capacity is widespread,even amongst the newer companies. Indeed, some of these could founder ifpresent levels of production are not increased. With trading al: or nearbreak-even point, many firms are unable to generate sufficient funds tofinance future growth. 'Whilst the reasons for this situation are knownwell enough, the full extent of the problem is not. The industry has nodoubt that the problem is serious, but cannot begin to answer such ques-tions as:
- what proportion of the market is accounted for by importswhich have no Indonesian equivalents?
- of the remainder, what is the proportion of imports?
- how much of this is tied to foreign investment which mightotherwise be lost?
- how much is exempt from import duties and sales taxes?
- how much potential business is lost because no one isaware of a requirement or responds to the inquiry?
8.54 The automotive industry has also expanded rapidly over the lastfive yecrs. However, this has been achieved at the expense of much neededrationalization, by allowing too many firms to establish local assemblyoperations. By 1975, the number of assemblers had increased to 18. A yearlater this had risen to 28 firms who, between them, produced 23 makes of carand 27 makes of commercial vehicle. As a result production rates are grosslyuneconomic. In 1974 the cost of assembling small- and medium-size passengercars was approximately equal to the landed cost of CKD components after thepayment of all import duties and taxes. 1/ Present day indications are thatthe ratio is close to 1.5 to 1 despite increased import tariffs. Not sur-prising]Ly, only limited progress has been made towards the local manufac-ture of components. Also, the plan to divert resources from car assemblyto commercial vehicle manufacture has only been partially successful.
8.55 In an attempt to regulate the situation, the Department of Industryannounced new curbs in June 1976. The numbers of makes of passenger carsand commaercial vehicles would be reduced to ten each by the end of 1984; no
1/ R.S). Sharma. Department of Industry Report on the Automobile Industryin Indonesia, May 1974.
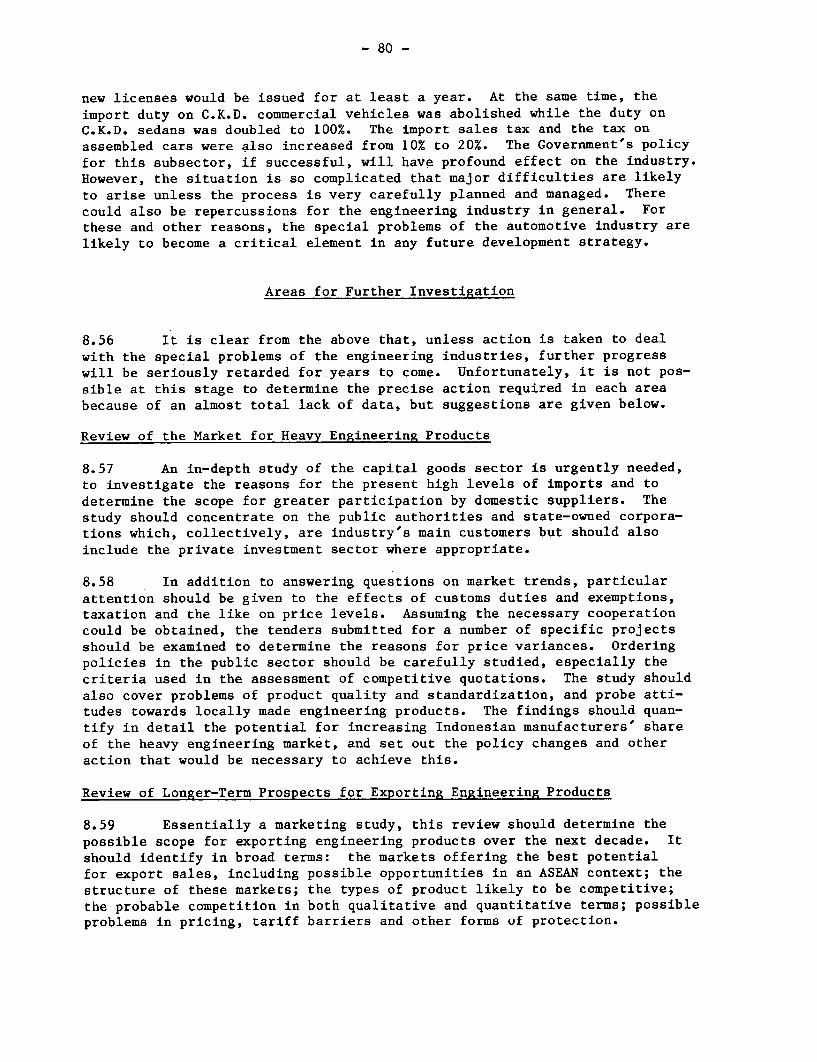
- 80 -
new licenses would be issued for at least a year. At the same time, theimport duty on C.K.D. commercial vehicles was abolished while the duty onC.K.D. sedans was doubled to 100%. The import sales tax and the tax onassembled cars were also increased from 10% to 20%. The Government's policyfor this subsector, if successful, will have profound effect on the industry.However, the situation is so complicated that major difficulties are likelyto arise unless the process is very carefully planned and managed. Therecould also be repercussions for the engineering industry in general. Forthese and other reasons, the special problems of the automotive industry arelikely to become a critical element in any future development strategy.
Areas for Further Investigation
8.56 It is clear from the above that, unless action is taken to dealwith the special problems of the engineering industries, further progresswill be seriously retarded for years to come. Unfortunately, it is not pos-sible at this stage to determine the precise action required in each areabecause of an almost total lack of data, but suggestions are given below.
Review of the Market for Heavy Engineering Products
8.57 An in-depth study of the capital goods sector is urgently needed,to investigate the reasons for the present high levels of imports and todetermine the scope for greater participation by domestic suppliers. Thestudy should concentrate on the public authorities and state-owned corpora-tions which, collectively, are industry's main customers but should alsoinclude the private investment sector where appropriate.
8.58 In addition to answering questions on market trends, particularattention should be given to the effects of customs duties and exemptions,taxation and the like on price levels. Assuming the necessary cooperationcould be obtained, the tenders submitted for a number of specific projectsshould be examined to determine the reasons for price variances. Orderingpolicies in the public sector should be carefully studied, especially thecriteria used in the assessment of competitive quotations. The study shouldalso cover problems of product quality and standardization, and probe atti-tudes towards locally made engineering products. The findings should quan-tify in detail the potential for increasing Indonesian manufacturers' shareof the heavy engineering market, and set out the policy changes and otheraction that would be necessary to achieve this.
Review of Longer-Term Prospects for Exporting Engineering Products
8.59 Essentially a marketing study, this review should determine thepossible scope for exporting engineering products over the next decade. Itshould identify in broad terms: the markets offering the best potentialfor export sales, including possible opportunities in an ASEAN context; thestructure of these markets; the types of product likely to be competitive;the probable competition in both qualitative and quantitative terms; possibleproblems in pricing, tariff barriers and other forms of protection.

- 81 -
8.60 The review should also consider problems of overseas representation,
distribution and necessary after-sales back-up. The question of incentives
and other forms of assistance for the industry should also be examined. This
would include, for example, waiving of export taxes, improving the draw-back
arrangements on materials re-exported, streamlining documentation, and the
provision of special credit facilities. The role that could be played by
new offshore joint venture companies in the export field should be carefully
assessed. This project should not take longer than the proposed study of the
capital goods sector in terms of elapsed time as much of the basic fact-find-
ing work could be done by desk research.
Specific Project Possibilities
8.61 In addition to the broad-based studies described above, a number
of possible development projects should merit early attention. These include
some new ideas along with others previously canvassed. The list is based on
observations and information obtained during the visits to engineering firms
and other relevant data. Account has also been taken of the findings and
recommendations made by the 1971 Mission and the 1973 German Study Team. The
projects are grouped under two main headings: new products and service-based
industries. Additionally, a possible program to tackle the problem of low
productivity is discussed.
New Products
8.62 The following group of products is considered well within the
capabilities of the engineering industry, although extensive external de-
sign artd manufacturing know-how would be necessary at the outset. Detailed
studies; would, of course, need to be undertaken to establish the full market
potential, manufacturing facilities required, probable viability, employment
prospects, capital costs, etc.
(a) Woodworking Machinery
8.63 Long-term development of the country's wood-based industries in
such areas as sawmill products, pre-finished building materials including
floorirLg and wall panelling, and furniture could create a substantial demand
for woodworking machines of all types (see Chapter VI). Currently imports of
this machinery are running at an annual rate of around US$3.6 million - three
times that of 1971. The product range includes sawmill machinery, small and
medium size circular saws, band saws, other woodworking machines.
8.64 The feasibility of manufacturing woodworking machinery was examined
by the FGU-Kronberg/KU Gummersbach Group in 1973. They estimated that the
market for sawmills and woodworking machinery would comprise 6,000 to 7,000
machines by 1979 based on an annual growth rate of 30%. While the manufacture
could start as an assembly-based operation, a high proportion of domestically
produced components should be possible within three years. Associated with
this development, there should also be scope for other wood-processing equip-
ment to be made in Indcnesia. Kiln driers are one example. The sophisticated
control instrumentation these require would still need to be imported.

- 82 -
(b) Agricultural Machinery
8.65 The continued emphasis on agricultural development in Repelita II
has led to an increased demand for agricultural machinery and related products.
Excluding tractors, imports of this equipment are likely to total more than
$3 million in 1976. An interesting development in this area is the attention
now being given to crop diversification outside the island of Java. This
could lead to a requirement for a wide range of light agricultural equipment
very different from the machinery currently produced in Indonesia for rice
and sugar processing plants. There may also be the possibility of export
business later on. Relevant data is, however, not available. Because of
the undoubted long-term potential in this area, a full-scale study should be
undertaken.
(c) Construction Equipment
8.66 Infrastructure is another major development area which has resulted
in large investments in machinery and equipment. During 1976 bulldozers,
mechanical shovels and excavators and levelling and tamping machines were
being imported at the rate of US$95 million per annum. Dumper trucks imports
were likely to be worth an additional $40 million. One project to make the
heavier type of equipment is being considered by P.T. Barata who already
manufacture road rollers. They are currently looking for a suitable overseas
partner for a joint venture operation. With the wide range of construction
equipment that is used, there should also be scope for other manufacturers -
particularly in the lighter, more specialized equipment which includes, for
example, tractor-based equipment, small rollers and levellers, and dumper
trucks.
(d) Materials Handling Equipment
8.67 Requirements for this type of equipment go hand in hand with indus-
trialization. The range of products is considerable and covers, for example,
overhead travelling cranes and hoists, tower cranes, mobile cranes, screw
conveyors and other bulk handling equipment, roller conveyors, warehousingand storage equipment including racking. There are also several marine appli-
cations such as winches and deck cranes. It is difficult to obtain a detailed
breakdown of imports but the category which includes cranes accounted for $38
million in the year up to August 1976. In the case of overhead cranes and
hoists, a project has already been submitted to the authorities for approval.
Three other product groups could also provide substantial scope for develop-
ment, namely: conveyor systems, warehousing and storage equipment and desk
handling equipment.
(e) Valves
8.68 Although several types of pumps are made in Indonesia, very few
valves for pipeline and other applications are manufactured locally. This is
surprising as valve bodies and pump casings are often similar in design andrequire the same production processes, whereas the moving parts of a valve

- 83 -
are generally much simpler than a rotating pump impeller. In terms of
imports, valves currently account for some US$14 million per annum - 40%
of that for pumps. There is, of course, a wide range of applications and
designs, depending on flow rates, pressures, and the liquids involved. With
the hi.gh rate of investment in two public sector areas, namely oil produc-
tion and distribution, and irrigation systems, the manufacture of valves
appear to be an area of investment opportunity that has been overlooked.
From the point of view of linkages, the main components are caLstings and
would provide additional outlets for cast-iron, steel, and non-ferrous
foundries.
'f) Specialist Vehicle Manufacture
8.69 With bus and truck assembly now well established, there is scope
for extending the product range by adding specialized body-building and
vehic:Le manufacture. The range of products envisaged included: mobile
airport equipment such as transporters, loaders, recovery vehicles, and crash
tenders, etc,; refrigerated vans and trailers; refuse and sewage collection
vehicLes. Unfortunately statistics are difficult to obtain fcr the whole
range. Some indication of demand is given, however, by the current import
data for road-sweeper trucks. In 1976, imports in this category were averag-
ing US$15 million on a. yearly basis.
(g) Small Petrol. and Diesel Engines
8.70 The possibility of manufacturing a range of small engines for the
home market has previously been examined. Typical applications include:
semi-Submersible and cither pumps; small standby generating sets, air compres-
sors, and machine tools and other equipment. Inboard and outboard motors for
small boats are additional possibilities. A production rate of some 5,000
units a year was envisaged in the project studied by the FGU-KRONBERG/KU
Gummersbach Group in 1973, on the basis of domestic consumption. The poten-
tial for exporting was not considered, but could add significantly to themarket, especially in the longer term.
8.71 The list of projects could well be extended to include the manufac-
ture of light electrical equipment (transformers, circuit breakers, electric
motors, etc.) for the utility and other industries, as well as a greatly
expanded shipbuilding and repair activities. It is clear that even for the
somewlhat limited number of product groups described above, development pri-
orities would need to be established within each group covering not only the
items identified but also the related components that could bes locally manu-
factured. In additiort, the present system of incentives may require modifica-
tion to encourage existing Indonesian firms to participate in these projects.
Service-Based Industries
8.72 The requiremlent for engineering spares and service back-up has
changed in line with the changes in technology that have occurred in recent
years. As a result, new opportunities for investment in this field are now
becoming apparent. The following three areas are considered to offer par-
ticular opportunities in this connection.

- 84 -
(a) Textile Machinery Spares
8.73 Although detailed statistics are difficult to obtain, it is clearthat there is a substantial demand for textile machinery spares. There area number of firms that can make some of the items required but a high propor-tion of the parts still have to be imported. Although some precision machine-ry is called for, the work is well within the capability of many firms exceptin one respect. There is a significant lack of gear cutting and grindingfacilities to cover the wide range of spare gears that are needed. A smallproduction unit initially is envisaged producing spur, helical and othertypes of gearing which should provide a very useful service to the textileindustry. The machine tools required include: hobbers, gear shapers,lathes, internal and external grinders, and a key-seater. Heat treatmentand hardening facilities would also be needed.
8.74 In addition to textile spares, there is likely to be a considerabledemand for gears from other industries. Production quantities would, however,be small, and could not be mixed with the manufacture of high volumes ofgearing for, say, automotive industries. Ideally, such a venture should beundertaken with an existing medium-sized engineering firm which has reasonablyup-to-date machine shops. Further study would, of course, be needed toestablish the viability and probable costs involved.
(b) Machine Tool Rehabilitation
8.75 Reference has been made earlier to the problem of out-dated andpoorly maintained machinery. Although some progress is being made at lastwith the center established by P.T. Barata, it is clear that this will onlypartly solve the problem. Additional facilities are likely to be needed ifmany of the older medium- and smaller-sized engineering firms are to becomeefficient. The feasibility of constructing a second rehabiliatation workshopwas examined by the German Study Team in 1973. They concluded that a centercapable of overhauling 200-250 machine tools a year was justifiable providedalso there was a long-term aim both to manufacture spare parts and to buildnew machines.
(c) Electrical Re-winds
8.76 There is likely to be a growing requirement for a repair capabilityin the electrical area. Motor re-winds is one such example. This is aspecialized operation but one involving less technical know-how and capitalequipment than that required for original manufacture. Although similar inmany respects, it would differ from a machine tool overhaul facility in onekey aspect - the need to offer a very fast service. It could be coupled withan agency for selling spares and new equipment, and possibly also form partof a broader-based electrical contracting business involving site wiring andother installation work.
Productivity Improvement
8.77 Low productivity is holding back progress in a number of areas,particularly among some of the older mechanical engineering companies. As

- 85 -
already stated, MIDC has begun to make a significant contribution in thisdirecticn but much more needs to be done if industry is to become efficient,especially in the context of import competition. MIDC is active in twoimportant areas here. Firstly, it provides training in management techniquesand controls. And secondly, it offers a consulting service to industry. Thelack of staff and funds, however, largely restricts their present field ofoperations to the Bandung area.
8.78 The MIDC approach is proving to be very successful and in the viewof the mission, deserves to ½_ extended. This could be accomplished in twoways, by expanding the present facilities, or by setting up separate centersin other key locations such as Jakarta, Surabaya and Jogyakarta. The firstof these alternatives has obvious advantages in that it would be based onan organization that is already operating effectively. Of course, it wouldneed to establish branches in the other main industrial centers, but couldcontinue to use Banoung as a central training facility.
SUMMARY AND CONCLUSIONS
8.79 In the five-year interval since the visit by the previous mission,the engineering industries have more than doubled in size and become wider-based and generally more efficient. However, comparisons of differentindustries within the subsector indicate that this development has takenplace unevenly. In the consumer-based product areas the electronics andautomotive industries have expanded rapidly over the period both in termsof outptut and employment, and are still expanding, though not always in anefficient way. The heavy engineering industries have expanded but excesscapacity is widespread and there is currently little growth.
8.80 The main causes of this apparent imbalance are:
Internal. Difficulties
- low productivity and poor, out-dated machinery andequipment;
- shortage of skilled manpower and the lack of technicaland managerial talent.
External. Problems
- difficulties in obtaining finance at reasonable terms;
- heavy additional costs which offset any comparativeadvantage from low wage rates;
- preference given to imported products in the capitalgoods sector.

- 86 -
The external problems are particularly important. And, if present policiesremain unchanged these are likely to retard further development of the sub-sector especially in the heavy engineering areas.
8.81 Looking ahead, the mission is convinced of the need to have anoverall strategy for developing Indonesia's engineering industries as a whole.Although the broad guidelines set out in the 1971 report are generally stillvalid, these need to be revised and updated to take account of the changessince 1971 and the factors likely to inhibit progress. Two major studies arerecommended in this connection to assess possible measures to deal with keyproblem areas and assist the development of an effective industrial strategy.These are: (1) an in-depth study of the problems in the capital goods sector;and (2) a study of the possibility of developing a strong export business.
8.82 Project areas suggested for early attention include:
(a) New Products: woodworking machinery; agricultural ma-chinery; construction equipment; materials handlingequipment; valves; specialist vehicles; small petroland diesel engines.
(b) Service-based Industries: textile, machinery spares;machine tool rehabilitation; electrical motor rewinds.
(c) Productivity Improvement: extension of MIDC, linkedto a new scheme to train graduate engineers.
8.83 Progress has been achieved so far despite many difficulties andconstraining factors. Opportunities for further expansion also look promis-ing, but there is a need to have an effective strategy and program of actionto guide the development of this important subsector of manufacturing indus-try through the 1980s.

- 87 -
IX. THE TEXTILE INDUSTRY
Current Status of the Industry
9.01 The textile industry has been growing considerably in recent years.Its share in total industrial value added was 11% in 1970 and rose to 17% in1973. In 1969 the output of knitting and weaving was 450 million meters andincreased by 141% to 1,085 million meters in 1975/76. The number of spindlesincreased from around 482,000 in 1969 to 1,152,000 in 1975/76. This increasein capacity was also accompanied by an increase in productivity. The outputper spindlle was .07 MT p.a. in 1969, and .10 ton p.a. in 1976. The totalcapacity of dyeing, finishing and printing amounted to 665 million meters in1970 and the actual output was 933 million meters in 1975/76. All non-cottonfiber was imported in 1969, but in 1975/76 there were four synthetic fibermaking units with capacity totalling 59,000 MT per annum. The growth wasalso accompanied by the production of new products such as blended and tex-turized yarn, suiting and shirting, tricot double knit, embroidery, brocade,and laces.
Weaving
9.02 The weaving industry grew rapidly during 1969 - 1975/76. Thenumber of power looms increased from around 35,000 in 1969 to around 60,000in 1975/76 as can be seen in Table 9.1. Total output (excluding knit goods)more tharL doubled from around 372 million meters in 1969 to around 877 mil-lion meters in 1975/76. And capacity also doubled from around 682 millionmeters in 1969 to around 1,637 million meters in 1975/76. This increase incapacity and output was one of the main programs in Repelita I and continuedin Repelita II.
9.03 The Directorate General of the Textile Industry (Ditjentek) definesa weaving; unit with hand looms, or 100 or less power looms as small scale.By this definition 81.5% of the existing mills in 1975/76 and 40.6% of powerlooms belong to small scale. The average size of weaving mill is 78 powerlooms.
9.04 As regards locational distribution, most of these weaving millsare located in Java, particularly in West Java. The data in Table 9.3 showsthat 94.2% of the mills, 96.8% of the power looms and 97% of the output werelocated in Java. Only a very small part is located in other islands. Outof the total in Indonesia, 65.0% of the mills, 56.3% of the loom3, and 58.4%of the output were in West Java. These figures also show that the size ofthe mills on the average in West Java is smaller than in the rest of Javaor Indonesia as a whole.

- 88 -
Table 9.1
The Weaving Industry
1969 1973 1975/76
Power looms (000) 35 50 60
Handlooms (000) 166 50 69 /4
Total output (m. meters) 372 769 877 /1
Output per looms:Power looms (000 meters) 6.54 /2 - 13.62Handloom (000 meters) .87 /2 - .87
Capacity:Powerlooms (m. meters) 420 1000Handlooms (m. meters) 262 75 7 -
/1 Consist of 816 m. meters of power looms and 60 m. meters of handlooms.
/2 Estimated./3 Calculated from Repelita II for 1977/78 and 1978/79./4 The numbers shown are those registered and may not be in operation.
Source: The 1969 and 1973 figures are basically from Ditjentek: "PolaPembangunan Industri Tekstil Repelita Tahap II" and Draft ofR.G. David: "Notes on Textile Subsectors". The figures for 1973are targets, except the total output figure is the realized figuretaken from CAFI No. 621, Oct. 1976 less the estimate of knittingoutput. The 1975/76 figures are from the Feb. 1976 census ofDitjentek.
Table 9.2
Distribution of Power Looms in 1975/76
Size Mills Looms(No. of Looms) Number Percentage Number Percentage
0-100 630 81.5 24,500 40.6101 or more 143 18.5 35,872 59.4Total 773 100.0 60,372 100.0
Source: February 1976 Census of Ditjentek.

- 89 -
Table 9.3
Locatic,nal Distribution of Weaving Mills
Mills Power looms OutputNumber , Number % (000 meter) %
Java 727 94.2 58,459 96.8 792,200 97.0DKI 27 3.5 3,456 5.8 63,621 7.8West 503 65.0 33,974 56.3 470,802 58.4Central 136 17.6 13,577 22.5 158,811 19.4DIY 19 2.5 1,735 2.9 30,681 3.8East 43 5.6 5,711 9.5 68,283 8.4
Others 46 5.8 1,913 3.2 24,859 3.0
Total 773 100.0 60,372 100.0 817,057 100.0
Source: February 1976 Census of Ditjentek.
9.05 There have been some significant changes in employment as a resultof the increase in power looms and a decline in the number of hand looms.The additional power looms during 1969 - 1975/76 were around 25,000. Taking1.1 as the ratio of workers per loom, the labor force absorbed would bearound 27,500. The number of hand looms dropped to 69,000 in 1975/76 from166,000 in 1969. If 1.3 is taken as the ratio of workers per hand loom, thismeans that around 126,10C0 workers lost employment as a result of the displace-ment of hand looms by power looms located in larger-sized units. 1/
9.06 The displacement took place in 1969 to 1973; after that the smalland large mills specialized in different products. After 1973 the small millsspecialized in products such as sarung, singket and other traditional products.Thus it seems likely that no further sharp decrease in hand looms will occur.
9.07 As has been indicated, a significant part of the weaving industryis in the hands of small enterprises. They suffer from many disabilities,compared to the larger units, including low productivity per loom or perworker, difficult access to credit, lacking production planning and control,and in other management aspects. Also, all the weaving industry has had tocontend with competition from cloth illegally smuggled into the country. In1974 and 1975 it is estimated that smuggled cloth amounted to 765 millionmeters and 443 million meters respectively. This amounted to roughly 75% -80% of domestic output and has led to severe competitive pressures on thedomestic producers. In 1976 the incidence of smuggling apparently decreasedrather sharply, and the industry is beginning to rebound. But there havebeen many complaints and requests for total bans on imports and tightercontrol of smuggling.
1/ The figure of 1.5 workers per loom is used by the Ministry of Industry.

- 90 -
9.08 Imposing total import bans does not appear to be an appropriatesolution to the problems. It would remove competitive pressure on theindustry to rationalize and improve its competitive position. Moreover, asis shown later, a strong growth in market demand is expected over the nextfive to ten years and in those circumstances adjustments may be easier.
Knitting
9.09 The knitting industry was started in 1952. Up to 1967, the prod-ucts were limited to coarse products such as T shirts, socks, underwear.Output amounted to 90.8 million meters in 1972 and rose to 208.0 millionmeters in 1975/76. The annual rate of growth was 25.8%. This growth wasalso accompanied by the introduction of new product lines such as tricot,double knit, laces, etc., and most of the new mills were using syntheticyarn such as nylon, polyester and acrylic bulky yarn as raw materials.
9.10 Almost all of the mills are concentrated in Java, particularlyin DKI and West Java, as can be seem from the following table. In terms ofnumbers, 95.3% of the mills were in Java and 73.6% were in DKI and West Java.In terms of machines, DKI and West Java have 100% embroidery, 83.3% raschel,82.8% flat and 69.2% circular knitting.
Table 9.4
Knitting Industry in 1975/76No.
Region Enterprises Output No. Machines(m. meters) Circular Flat Raschel Embroidery
1. Java 224 207.0 5,418 939 570 52DKI 73 65.3 2,000 399 78 30West 100 78.9 1,877 455 412 22Central 16 27.1 752 7 41 -DIY 3 6.6 51 - 27 -East 32 29.0 738 78 12 -
2. Others 11 1.0 182 92 18 _
Total 235 208.0 5,600 1,031 588 52
Source: Ditjentek, February 1976 Census.
9.11 The machines in the knitting industry can be divided into twogroups. The first includes those established prior to 1967. These weremainly circular knitting machines of old and low technology producing coarseproducts. In 1972 there were 3,741 machines in this group. The secondgroup includes those established after 1967. These consisted of raschel,warp, circular, and flat knitting. Their products are of much better quality.

- 91 -
9.12 During 1969-75, the total number of knitting machines proposed tobe installed and approved by the Government amounted to about 11,000, includ--ing both foreign and domestic investments. Out of all foreign investmentprojects in that period, 58.3% in terms of mills and 44.9% in terms ofinvestment have been producing. For domestic investment the correspondingfigures were 61.5% and 74.4%. 1/ The number of new knitting machines alreadyproducing would be 6,625 (based on mills percentage) or 6,678 (based oninvestment volume). Combined with the old machines in place prior to 1969,the total machines in 1975/76 should have been much larger than 7,271, thefigure shown in Table 9.4. These figures suggest that the replacement of oldmachines was taking place. This happened by the displacement of old mills,and apparently many entrepreneurs moved to other businesses.
9.13 Despite the ccmpetition from a large volume of imports in 1974/75,the impression from the interviews and the factory visits was that the millsare maklng a profit. The profit and cost calculations for some mills aregiven in Appendix I. Some of the products have even been exported. Atpresent the knitting industry enjoys nominal tariffs ranging from 50 to 90%with 10 to 60% nominal tariff for raw materials. The real value is likelyto be lower due to the presence of smuggling.
Spinning,
9.14 This industry has grown rapidly from 1969 to 1976 as figures inthe folLowing Table 9.5 show. From 482,000 spindles in 1969 it increased to802,000 in 1973 and therL to 1,238,500 in February 1976. Repelita II sets thetarget at only 1,222,000C spindles by 1978/79. With this growth, the outputof the spinning industry can now supply around 83% of the total yarn andfilament input for weaving and knitting as opposed to around 55% in 1973. 2/
1/ Dept. Parindustrian, Team Investarisasi Perizianan Proyek 2, PMDN danPMA Buku I, Laporan Umum, Jakarta, March 1, 1976.
2/ The 83% was calculated from the Census data. The 55% was directly takenfrom Repelita II.

- 92 -
Table 9.5
Spinning Industry
Ownership Number of spindles (000)1969 1975 1976
P.N. Sandang Group Government ) 242 302
Pinda Sandang Group Regional Gov.) 135
GKBI Private ) 482 44 53
Private Private ) 441 789 /1
Other Government ) 8 8
Total 482 870 /2 1,152 /L3
Total output (000 ton) 33 80 /4 116 /5
Capacity (000 tons) 48 97.2 /4 137 /6
Source: Ditjentek and R.G. David notes on Textile Subsectors.
/1 Including the Pinda group.
/2 With the addition of 5 spinning mills at the end of 1975, the numberof spindles became 982.
/3 This data was for January 1976. The census in February 1976 showsthat the figure was 1,238,500 spindles.
/4 Commercial Advisory Foundation in Indonesia (CAFI) No. 621, Oct. 13,1976.
/5 February 1976.
/6 Estimated. The data from Ditjentek is only .06 Ton/sp. (see Ditjentek:"The Development of Textile Industries in Indonesia", May 1976.

- 93 -
9.15 In 1971, there were 18 mills with 484,000 installed spindles. In
1976, there were 56 mills with over 1.2 million installed spindles. Theaverage size dropped from 27,000 to 22,000 spindles per mill. This meansthat the investment in spinning taking place during 1971 to 1976 has beenin many smaller size mills. Taking 30,000 spindles/mill as a rough optimumsize, this seeras to imply that the spinning industry may have lost somecompetitive edge.
9.16 In 1971, 89% of the mills and 88% of the spindles were concentratedin Java. In 1976 the concentration increased to 93% in terms of mills aswell as spindles. In 1976, 96% of the total output of the spinning industrywas produced by mills located in Java and 65% were in West Java.
9.17 The factory visits show that in general the mills were workingthree shifts per day, seven days per week. But spinning is less labor-in-tensive than weaving and knitting, and its competitivenes.o is less. The sizeof the new mills is smaller than 30,000 spindles on the average which wouldperhaps explain part of the problem. The factory visits tend to support thisview. From the four mills whose cost data are presented in Appendix II, onlytwo of them (B and D) could cover their full costs while the other two (A andC) cou]d not. Spinning also has a lower nominal tariff protection than doesweaving and knitting, and although the coarse cotton yarns are banned fromimport, supplies from smuggling are available in the market.
9.18 Many if not most spinning mills are high cost producers. This isdue partly to the high price of cotton. But it also results from the ratherhigh waste in converting cotton into yarn. All in all, the competitive posi-tion of: the spinning industry is weaker than for weaving and knitting.
Fiber Making
9.19 In 1976 there were four mills producing synthetic fiber. Their
capacil:y as a whole for several kinds of products are given in the followingtable.
Table 9.6
Fiber Making Industry in 1976
Product Capacity (Ton/year)
Polyester staple fiber 41,790
Polyester filament yarn 10,950
Nylon filament yarn 6,330
59,070Source: Ditjentek.
All of the mills are located in West Java.

- 94 -
9.20 This industry is facing competition from imported products. Ac-cording to a team recently sent by Indonesia to several countries in Asia,import was based on a dumping price which was much lower than the priceand the production cost in the exporting countries. The data obtained bythe team is given in the following table.
Table 9.7
Inter-Country Comparison on Polyester Staple Fiber
Taiwan Thailand South Korea Indonesia
Production Cost(US$/Kg.) 1.60 1.80 1.75 1.90
Selling Price(US$/Kg.)In the Country 1.24 1.70 1.55 1.32
Export (f.o.b.) .88 .95 .93
Source: Laporan Team Evaluasi Kalkulasi Polyester staple fiber, November1976. These figures suggested that the main source of the prob-lem was not the difference in production cost but in the pricingpolicy.
9.21 The fiber plants are in a somewhat poor position now, and the exist-ing plants seem to have enough capacity to satisfy current demand. Competitionfrom imports has made plans for domestic expansion appear unfavorable. Butit is expected that in the future the demand for blended fabrics (involvingsynthetics) is likely to rise more rapidly than for cotton fabrics, and thelong-term prospects for capacity expansion appear much more favorable, pro-viding that domestic producers can compete with imports at prices comparableto those applying to the home markets of exporters (i.e., not at a dumpingprice). At present domestic producers suffer cost disadvantages vis-a-visimports primarily because of raw material freight costs, higher interestcharges in Indonesia, higher electric power charges (per Kg. of product), andeven higher labor charges per unit output (because of low productivity).
Finishing. Dyeing and Printing
9.22 The finishing, dyeing and printing industries are concentrated inWest Java. Many enterprises are quite small and concentrate on traditionalproducts such as batik. In 1970, the capacity of the existing printing unitswas around 352 million meters. This capacity was higher than the output in1975/76. The capacity of the existing dyeing and finishing units in 1970 wasaround 313 million meters.

- 95 -
9.23 The finishing, dyeing and printing mills can be divided into twobroad categories: those not integrated and those integrated with weaving andknitting mills. The latter have processed their own knitted and woven prod-ucts and sold services to others that did not have the facilities. On theother hcnd, the non-integrated mills have had to rely on buying materialsfrom the market or have undertaken job orders. They are facing difficultiesboth in getting consistent quality of material from the internal market andin getting continuous job orders. Almost all the new mills are integratedunits with balanced capacities. Excess capacity has prevailed in thisindustry, and the new demand in the next ten years is expected to be satis-fied by the integrated type of investment. The non-integrated mills willcontinue to have difficulty in maintaining production.
Garment Making
9.24 Compared to other segments in the textile industry, garment makingis still a very small segment. In 1975/76 there were 123 enterprises and4,267 sewing machines in. this segment of the industry as given in the follow-ing table.
Table 9.8
Garment Making Industry
Number Number ofof Firms Sewing Machines
1. Java 119 3,843DKI 71 2,076West 22 872Central 9 501DIY 2 35East 15 359
2. Others 4 424
Total 123 4,267
Source: Textile Industry Census, February 1976.
In 1974, it was estimated that around 85% of the domestic clothing consump-tion was bought in the form of cloth which was then given to local tailorsto be sewn. Only 3% of this consumption was supplied by the real garmentindustry, while 7% was supplied by the home industry and the rest 5% wasunderwecr.

- 96 -
9.25 It is very clear that the garment industry in Indonesia is in itsinfancy. It has not developed at all. The present capacity is minisculeby any standards. As is shown later, the major change in the whole of thetextile industries should be a very rapid growth in garment making. Itis, without doubt, the major industrial sector that could absorb labor inthe future.
Batik
9.26 The batik industry is one of the traditional industries of Indonesiaand will continue to grow at a slow but steady rate. Most of the batik under-takings are under one association called GKBI (Indonesian Batik CooperativeAssociation). The GKBI supplies the raw material and the finishing servicesto the undertakings and in some cases also helps in marketing. The laboremployed 1975/76 is estimated at about 43,000 in block printing and 250,000in traditional batik. Most of these products are domestically consumed. In1974 the total batik output was estimated at 29.4 million pieces or around73.5 million meters.
Future Trends
9.27 The consumption per capita of textiles in 1969/70 was 6.2 meters,and in 1974 rose to about 10 meters. The growth rate of consumption percapita during Repelita I 1969/70 - 1973/74 was around 11.3% per year. Theprojected figure for Repelita II 1974/75 - 1978/79 is 10 meters in 1974 to11.5 meters in 1978/79 or a growth rate around 3.9% per year. For the period1979/80 - 1983/84, the consumption per capita is projected to be 18.0 metersin 1983/84 or a growth rate around 9.4% per year. These growth rate projec-tions are suspect. The 11.3% growth rate in Repelita I followed by a dropto 3.9% in Repelita II and then an increase to 9.4% as projection for RepelitaIII seems inconsistent. It appears that the projection figure in Repelita IIis too low.
9.28 In order to make a projection of textile consumption per capita forthe future, a comparison was made to the experience of other (tropical) coun-tries. Data were collected on 62 countries and consumption per capita wasrelated to income (as measured by the GDP). Several functional forms for therelationship were tested and finally an equation that is linear in logarithmswas chosen. This gave the best fit and has the advantage that the coefficientof the independent variable shows the elasticity of consumption of textilesper capita to income. In this way a projection of future consumption basedon the average or normal experience of other countries was derived. The re-sults of this statistical analysis are as follows:

- 97 -
ln y = -2.8332 + .6775 ln x
(.3113) (.0510)
2R = .65
F = 112.0
where y equals consumption of textiles per capitax equals GDP per capita in 1970 US$.
9.29 The results indicate an income elasticity of demand of only .68,which :is lower than other estimates that have been made for Indonesia, whichtypically have been greater than one. But even with what may be a conserva-tive estimate of the income elasticity of demand at Indonesia's level of percapita income, the projected rate of growth of consumption of textiles issubstantial. Per capita inc.ome in 1986 is estimated at $250 based on recentgrowth trends. Then the estimated value of consumption per capita in 1986 is2.5 Kg. If Indonesian consumption per capita 1986 is assumed to be on theregression line, and taking the consumption per capita in 1973 as 1.3 Kg.,then the consumption per capita growth rate is 5.2% per year. With thepopulation growth rate 2.1% per year, the total consumption growth rate is7.3% per year.
9.30 The total knitting and weaving output was 63% of domestic outputplus import in 1969 ancd then increased to 70% in 1975/76. In 1986, thisfigure is expected to be higher and is taken to be around 80% for the sub-sequent discussion in this paper. In 1975, the census showed that knittedoutput was 19.2% of total Indonesian knitting and weaving production. It isassumed that the percentage of knitting output is still increaLsing and thatin 1986 will settle at about 25%. Then with a figure on exports, the outputof Indonesian production could be broken down into knitting anLd weavingproducts.
9.31 The export figures for textile products so far are very small.They were less than 1% of the corresponding consumption figures. Based ontheir assessment of the Indonesian textile industry, H.J. Blydenstein andM. Minlce said: "Provided a sizeable percentage of the present applicationsfor new investments are approved and effectuated at a reasonable machineutilization, an estimate of an export volume of 250-400 m. meters in 1979does not seem unrealistic. This metrage undoubtedly can be more competi-tively exported in the form of garments rather than piece goods". 1/ Ifthe consumption in 1979 is estimated from the regression above, this levelof export is 13.6% - 2].7% of total consumption in that year.
1/ H.J. Blydenstein and M. Minke, Observations on Garment Making inIndonesia, Jakarta, September 1974, p. 10.

- 98 -
9.32 The fiber composition of output has been changing. In 1970 cottonaccounted for 79% of output, synthetics (nylon, polyester, acrylics) forabout 17%, and rayon for about 4%. By 1979 it is estimated that cotton willaccount for just under 60%; synthetics will increase to about 35% and rayonto 5%.
9.33 Several other targets are also acceptable for the analysis. Theproduction target for yarn is taken at 80% of the yarn consumption. In theconversion of yarn into woven and knitted fabrics it is assumed that thewaste is 10%. The same assumption is also applied for fiber. The productiontarget for synthetic fiber is 80% of consumption.
Analysis of Representative Projects
9.34 Based on the foregoing estimates of future total consumption, ex-ports, the level of self-sufficiency in domestic production, and the otherpoints raised above, in the remainder of this chapter an analysis is madeof "representative" projects in each of the main divisions of the industry:spinning, weaving, garment making, and fiber making. The objective is toanalyze potentially efficient projects in each of the divisions, but not toattempt to identify these with a specific project with all the details thatthat requires. For example, in the spinning industry the representativeproject is one that has 30,000 spindles and has investment costs derived fromestimates made for such a plant in 1972, as updated to 1976. Product pricesare those existing typically in 1976.
9.35 The purpose of this type of analysis is not primarily to identify aspecific investment project, but to compare the relative profitability and/orcomparative advantages that Indonesia has in the different divisions of thetextile industry. It is an attempt to provide a rough screening whetherinvestments in spinning, weaving, garment making, or fiber production areapt to be best. This is a rough screening since calculations of economic(as opposed to market) prices and costs often had to be treated in a crudefashion or ignored entirely. Consequently, the results of the analysis areuseful primarily as indicators of directions for further detailed analyses.The results are very definitely not intended to recommend operational deci-sions on investment programs.
9.36 In the project analyses that follow, many assumptions are made forsimplification:
- The scrap value at the end of the lifetime of the proj-ect is taken to be zero.
- The project lifetime is assumed ten years.
- Depreciation is taken straight line.
- Working capital equals three months output and this isreleased at the end of the lifetime of the project.

- 99 -
No loan is assumed (all equity investment).
- No reinvestment is assumed.
- Investment is evenly spread over three years.
- Production starts in Year Three, directly at full capacity.
- Wage and salary on the average is taken at Rp. 216,000per man year.
9.36 The characteristics of representative investment projects have beenderived from previous analyses of the textile industry and from work of themission itself. Brief descriptions of these projects plus other pertinentmarket and price information are presented below.
9.37 Weaving: The representative investment project has been derivedfrom prior work done by Werner International as updated by the mission.
No. of Power Looms: 400
Capacity: 3.7 m. lbs. or 15.6 m. metersof 26's/26's.
Warp and Weft: 60 x 60 ends and picks per sq. inch.
No. of Employees: Supervisory 20 - Production 400.
Investment Cost per P'lant: $5.3 million.
This is not the most automated capital intensive type of plant. Based on theprior demand projections it is estimated that by 1986 543 million meters ofnew capacity will be justified, after allowing for the fact that the numberof hand looms is assumed to stay constant and that domestic production willaccount for 85% of total supply (i.e., 20% of imports minus 5% exports). Thelargest demand will be in cotton products. The representative p].ant is assumedto produce 36 inch T/C shirting (annual capacity 12.8 million meters). 1/ Theproduct price is assumed at Rp. 350 per meter (see Appendix II).
9.38 Spinning: The representative investment project is based on aplant with 30,000 spindles and the plant is assumed to produce cotton yarnswith counts in the 20's, 30's, and 40's. It is recognized that by 1986 thecomposition of output will, change toward synthetics but cotton will still bethe major part of output. The 1986 demand will require 172,000 tons of newcapacity on the assumption that domestic output will supply 80% of total re-quirements. The representative project has the following characteristics:
No. of Spindles: 30,000
Capacity: 3,677 tons per year
1/ 44 inch may be becoming more common.

- 100 -
Employees: Supervisory - 30Production - 600
Investment Cost of Plant: $14.4 million.
Appendix II shows the cost calculation for cotton yarn, from which rates ofreturn and other measures have been calculated.
9.39 Fiber Making: Calculations indicate that domestic production ofpolyester yarn is not an attractive investment in the time period up to 1986since demand is not expected to increase sufficiently to support one plantof minimum efficient size. However, the demand for nylon filament yarn issomewhat more attractive. Current domestic production capacity is around6,300 tons per year and by 1986 one plant of minimum efficient size (20,000tons per year) may be justified. The characteristics of the project are asfollows:
Product: Nylon Filament Yarn
Capacity: 20,000 tons per year
Employment: 575
Investment Cost of Plant: $119 million.
9.40 Garment Making (Shirts): As has been indicated earlier, it appearsthat the garment making industry may offer the most favorable market condi-tions for expansion. The existing mills have already been able to export,and face a growing domestic market. Many types of garments could be pro-duced; the representative project is a plant for manufacture of shirts,with the following characteristics:
Product: Shirts
Capacity: 180,000 dozen or 2.16 million pieces peryear
Employment: 500
Investment Cost of Plant: $3.85 million.
Preliminary calculations seem to indicate that Indonesia may have a strongcompetitive edge even over Japan or Taiwan in this labor intensive industry,since productivity in Indonesia (shirts in man-day) is about one-third toone-quarter the productivity in the other countries but hourly wage ratesare one-twentieth as much.
9.41 Summary cost calculations for each of the four representativeprojects in weaving, spinning, fiber making, and garment making are given inAppendix II. These calculations are then used to compute the internal ratesof return and various other measures indicating the "worth" of the projects.The results are shown in Table 9.9.
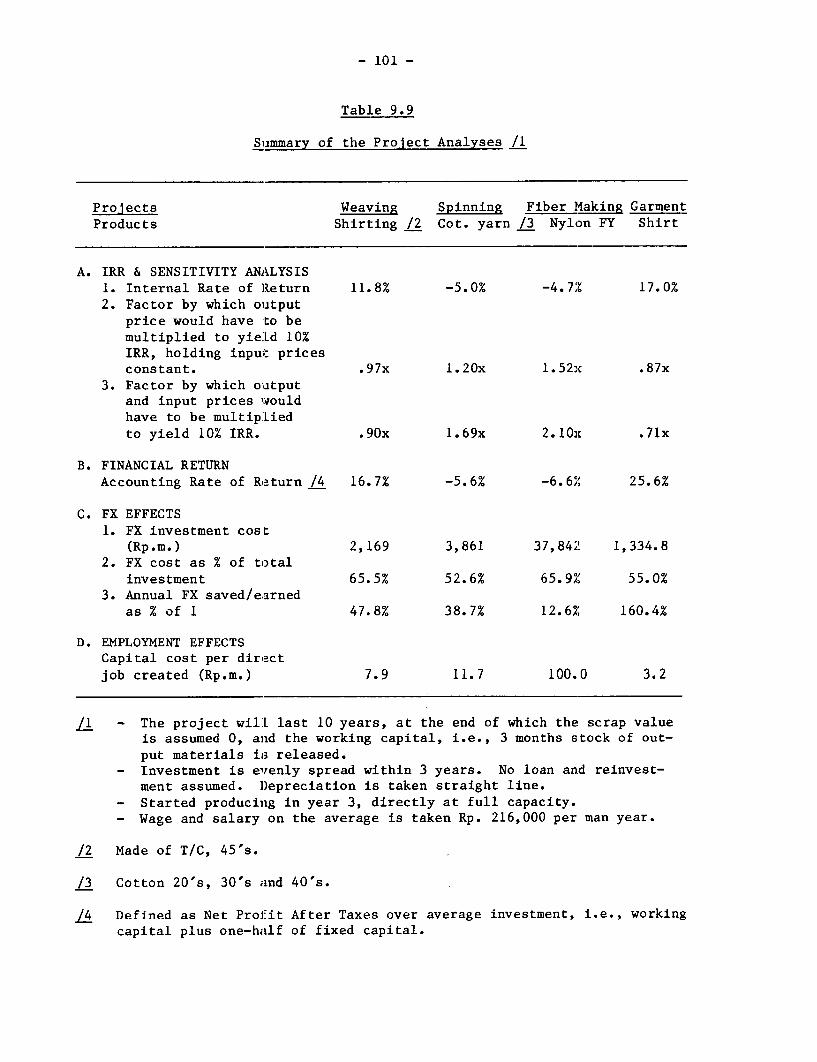
- 101 -
Table 9.9
Summary of the Project Analyses /1
Projects Weaving Spinning Fiber Making GarmentProducts Shirting /2 Cot. yarn /3 Nylon FY Shirt
A. IRR & SENSITIVITY ANALYSIS1. Internal Rate of Return 11.8% -5.0% -4.7,y 17.0%2. Factor by which ouitput
price would have to bemultiplied to yield 10%IRR, holding inpujt pricesconstant. .97x 1.20x 1.52x .87x
3. Factor by which ouitputand input prices wouldhave to be multipLiedto yield 10% IRR. .9Ox 1.69x 2.10x .71x
B. FINANCIAL RETURNAccounting Rate of Return /4 16.7% -5.6% -6.6,' 25.6%
C. FX EFFECTS1. FX investment cost
(Rp.m.) 2,169 3,861 37,842 1,334.82. FX cost as % of total
investment 65.5% 52.6% 65.9%' 55.0%3. Annual FX saved/earned
as % of 1 47.8% 38.7% 12.66% 160.4%
D . EMPLOYMENT EFFECTSCapital cost per directjob created (Rp.m.) 7.9 11.7 100.0 3.2
/1 - The project wilL last 10 years, at the end of which the scrap valueis assumed 0, and the working capital, i.e., 3 months stock of out-put materials i1S released.
- Investment is evenly spread within 3 years. No loan and reinvest-ment assumed. ])epreciation is taken straight line.
- Started producing in year 3, directly at full capacity.- Wage and salary on the average is taken Rp. 216,000 per man year.
/2 Made of T/C, 45's.
/3 Cotton 20's, 30's and 40's.
/4 Defined as Net Proi-it After Taxes over average investment, i.e., workingcapital plus one-half of fixed capital.

- 102 -
9.42 The comparative calculations indicate quite closely that garmentmaking offers the best opportunities for investment within the textileindustry, followed by weaving. Both spinning and fiber making appear quiteunattractive. The internal rate of return is highest in garment making andthe investment cost per job created is the lowest. The sensitivity measuresand the foreign exchange effects are also generally the best. On these samepoints, weaving appears to be a favorable field by comparison to the othertwo.
9.43 It is important to emphasize the limitations of the analyses thatwere conducted. Due to limitations of time and availability of data theanalyses are crude; the absolute values, such as the internal rate of return,are not necessarily significant by themselves, but they are valid for makingcomparisons among projects, and that is the primary purpose. This is arough means of attempting to screen the various alternatives and to indicatethe directions for detailed analyses. For that purpose the analyses arevalid and useful.
9.44 We have not attempted to shadow price the inputs nor to identifythe representative projects with a specific plant location. The productlines seem relatively homogeneous and do not reflect the fact that in actualsituations the product-mix might be more complex (e.g., a garment plant mightproduce other products in addition to shirts). Finally, the costing andprice selections are based on current conditions as best we could determinethem, but a closer analysis might reveal differences.
9.45 Subject to all the above qualifications, the analytical results doreveal in what directions relative priorities lie in the textile industry.Even with a more detailed analysis it is very unlikely that the relativeorder of the results would be changed though the margins of difference mightwell be less.
9.46 It is suggested that in evaluating proposals for further devel-opments in the textile industry, a greater attention be given to the oppor-tunities in garment making and weaving.

- 103 -
KPPENDIX I
Profit and Cost Calculation of SomeKnitting Mills
A Bcost per dozen cost per dozen
Variable cost Rp. % Rp. %
Raw material 1,227 47% 1,702 61%
Auxiliary materials 727 28 214 8
Direct labor 114 4 180 6
Maintenance 18 1 65 2
Selling cost 68 3 34 1
Others 57 2 -
Total variable cost 2,211 85 2,194 78
Fixed cost
Depreciation 261 10 44 2
Indirect labor 64 3 108 4
Insurance 3 - 21 1
Maintenance - - -
Interest 60 2 151 5
Others 1 - 277 10
Total fixed cost 389 15 606 22
Total cost per dozen 2,600 100 2,800 100
Product underwear underwear
Total output per year 45,000 dozen 275,000 dozen
Sales revenue per dozen 2,977 3,676
Gross profit per dozen 377 876
Corporate tax 165 385
Net profit per dozen 212 491

- 104 -
APPENDIX I
Cost Structure of Some Spinning Mills(Rp/I)
A L B C D
Raw material 120600 58% 71%/ 93200 70% 170200 81% 124000 87%Aux. material 2300 1 1 9
Wages 10200 5W 10 8200 6 12300 6 11700 8
Salaries 5600 3 3
Depreciation 6500 3 4 9600 7 4900 2 1500 1
Maintenance &spare parts 8500 4 5 7800 6 3900 2 4300 3Utilities 7600 4 4 7 3900 2 4
Interest 40500 19 - - - 12200 6 - -
Others 7800 4 5 14500 11 3400 2 1300 1
Total cost 209600 100% 100% 133300 100% 210800 100% 142800 100%
Product avg.count 25.5's 29's 30's 23'sOutput 10000 g 13000 g 16000 % 19000 g
Sales Revenue/3 172100 182000 195000 167000
L A is for 1975. Others for 1976.
/2 Without interest payment.
/3 Recalling that cotton yarn of 12's and 12'2 up to 42's and 42's havebeen banned from import, the CIF price would likely be significantlylower than the market price. The Ditjentek data on CIF are Rp. 173000,Rp. 20300 and Rp. 220000 per $ for 20's, 30's and 40's respectively.
It is worth noting that the CIF price does not necessarily reflect thecost of standard international spinning mill.

- 105 -
APPENDIX II
Cost Calculations of 36" Blended Shirting
(capacity 12.8 m. meter p.a.)
Rp/meter
Material 168Wages and salaries 7Maintenance & spare parts 4Depreciation 17Others 16
212Sales tax 5% 11
223Sales revenue 275 /1Gross Profit 52Taxes 23Net profit 29
/1 The retail price Rp. 350.
Cost Calculation of Cotton Yarn
(a mixture of 20's, 30's and 40's, one third each)(capacity 3,187 ton or 17,550 bales p.a.)
(Rp/%)
Raw Material /1 127,820Wages and salaries 7,760Maintenance & spare parts 6,780Depreciation 33,930Others 14,500
190,790Sales tax 6% 5,724
196,514Sales revenue /2 182,667Loss 13,847
/1 The price of cotton is taken 70w/lb.
/2 The price of 20's, 30's and 40's are takenat Rp. 150,000, Rp. 195,000 and Rp. 198,000per bale.

- 106 -
APPENDIX II
Cost Calculation of Nylon Filament Yarn
(capacity 20,000 ton p.a.)(Rp/kg)
Raw material 501Auxiliary material 77Wages and salaries 49
Maintenance & spare parts 36Depreciation 249
Technical fee & royalty 36
Insurance 14Selling cost 35Others 59
1,056Sales tax 5% 53
1,109Sales revenue 1.000Loss 109
Cost Calculation of Shirt Making
(capacity 2,160,000 pieces p.a.)(Rp/piece)
Raw material 675
Wages and salaries 50Maintenance & spare parts 36Depreciation 74
Technical fee & royalty 5Insurance 3
Others 20863
Sales tax 5% 43906
Sales revenue 1.250Gross Profit 344
Taxes 151Net Profit 193