Problem Solving - Minnesota Solving Minnesota Office of ... evaluating solutions, ... are wrong and...
10
Problem Solving Minnesota Office of Continuous Improvement http:/mn.gov/CI Solving Problems Isn’t Always Elementary
Transcript of Problem Solving - Minnesota Solving Minnesota Office of ... evaluating solutions, ... are wrong and...

Problem Solving
Minnesota Office of Continuous Improvement http:/mn.gov/CI
Learn more and register at http:/mn.gov/CI [Tailor footer and logo if applicable]
Solving Problems Isn’t
Always Elementary

August 2015 mn.gov/CI 1
Contents
7 Step Problem Solving Process .................................................................................................................................... 1
A3 Problem Solving Tool ............................................................................................................................................... 2
Brainstorming ............................................................................................................................................................... 3
Affinity Diagram ............................................................................................................................................................ 3
Gathering Data .............................................................................................................................................................. 4
Root Cause Analysis Methods ....................................................................................................................................... 6
5 Whys .......................................................................................................................................................................... 6
Cause and Effect (Fishbone) Diagram ........................................................................................................................... 6
Relations Diagram ......................................................................................................................................................... 7
Impact & Cost Matrix .................................................................................................................................................... 8
Action Plan .................................................................................................................................................................... 8
For more information, tool templates, and support:
Minnesota Office of Continuous Improvement: mn.gov/CI | [email protected]
Cristine Leavitt | CI Consultant | 651-201-2567 | [email protected]
Cathy Beil | Improvement Data Coordinator| 651-201-2564 | [email protected]

August 2015 mn.gov/CI 1
7 Step Problem Solving Process
1. Define the problem
Be as specific as possible (What, Where, Who, When, How)
2. Gather data What don’t you know and need to find out? Prepare a Data Collection Plan if needed.
What specific performance measure needs to improve?
Prepare your “Problem Statement” — Format: Reduce/Increase the number/percent of <topic> from <current level> to <target level> by <date>.
3. Analyze data to identify why the problem is occurring Use 5 Whys, Fishbone Diagram, or Affinity and Relations diagrams to get to root causes.
4. Identify, evaluate, and select solutions Brainstorm no cost/low cost to big, bold ideas.
Prioritize ideas using the Impact-Difficulty Matrix.
5. Identify and implement action items Develop an action plan if the action items are too extensive to be included in the A3 Tool
Remember to document and train people on new standard work.
6. Monitor results Collect and analyze performance measures to assess solution effectiveness (validate results).
7. Adjust and sustain improvement Adjust, adapt, or abandon the solutions as needed to achieve the performance target.
Transfer control and sustainment to the Process Owner
Good communication throughout the process will enhance your success!

August 2015 mn.gov/CI 2
A3 Problem Solving Tool The A3 Problem Solving Tool guides a team through the problem solving process in as little as a few hours. Problems that are more complex will require more time, but the process steps are the same.
1. Background/Business Case: Describe the problem and why you are trying to solve it. What benefits do you anticipate from solving the problem (e.g., quality, timeliness, cost, customer/employee satisfaction)?
2. Stakeholders: Identify internal and external customers. List team members working on the problem.
3. Current Condition: Define the Who, What, Where, When, How, Why questions about the problem to fully understand your current situation. You may need to develop a Data Collection Plan. Display data/information in bar charts, trend diagrams, pie charts, and process maps. Define/refine your “Problem Statement” (or Project Goal) in the format:
Reduce/Increase the number/percent of <?> from <current level> to <target> by <date>.
4. Analysis/Root Causes: Identify and verify the root causes of the problem. Use the most simple root cause
analysis tool first (5 Whys, fishbone diagram, affinity/relations diagrams).
5. Solutions: Identify solutions and resources needed to achieve the Problem Statement/Project Goal. When evaluating solutions, take time to identify and address how you will mitigate negative impacts. Get appropriate leadership approval of solutions and resources needed to implement solutions.
6. Action Items: Identify the necessary tasks to implement approved solutions, including tasks to: mitigate
negative impacts; communicate changes to internal and external audiences; document standard work; identify and resolve issues; train and coach people on changes; measure, track, and communicate progress and results; and capture lessons learned.
For each task, list who will coordinate it and when it will be done.
If the project is more complex, capture action items in a separate Action Plan.
7. Metrics/Follow-up: Define measures and results. List dates for monitoring progress, validating results, and adjusting action items.

August 2015 mn.gov/CI 3
Brainstorming Brainstorming is a team-based tool for quickly capturing diverse information, ideas, and perspectives.
For a problem solving project, brainstorming is used to identify possible contributors or causes of a problem and to identify possible solutions to root causes of the problem. When brainstorming use methods that balance contributions from introverts and extroverts, such as silent brainstorming. Brainstorming Options:
Silent — write down first, then share1
Open/Popcorn — call out ideas (favors extroverts)
Structured — provide themes for brainstormed ideas, like the categories in a fishbone diagram: facilities/equipment/tools, communication, people (training, roles, behaviors), process/procedures/policies, materials, and environment
Reverse — brainstorm how to make matters worse!
Analogy — relate a story to the issue(s) at hand, draw on parallels
Brainstorming Rules1: Rapid generation is the aim — strive for quantity
Be creative — there is no such thing as “wild” or “bad” idea2
Defer judgement
Clarify, combine, and build on ideas 1 NOTE: If you have team members record ideas on post-it notes, set a rule for one idea per post-it note.
2 Use this rule for brainstorming solutions, but exclude it for brainstorming possible causes.
If you are capturing brainstorming ideas (causes or solutions) on a flip chart, number each idea to make it easier to reference the idea. Numbered ideas will also make it easier to apply the Impact/Difficulty Matrix, which helps a team prioritize and select solutions.
Affinity Diagram An affinity diagram is a tool for simplifying and communicating a large number of ideas and feedback by grouping similar or related ideas into themes.
For a problem solving project, combine the team’s brainstormed contributors and causes for the problem into groups or themes. Record the theme at the top of the list of grouped ideas (see diagram at right).
For a problem solving project, the Affinity Diagram is used in combination with the Relations Diagram. The Relations Diagram helps a team rank which theme (or root cause) has the strongest influence over other causes. When you solve the cause with the greatest influence on other causes, you typically resolve or

August 2015 mn.gov/CI 4
minimize the impact of related causes. The Relations Diagram also helps a team see the problem from a systems perspective, which enhances the team’s understanding of the subject area and ability to make future improvements.
You have flexibility and discretion in how you group related ideas. Below is one approach you may use. 1. Facilitator instructs team members to record one idea per post-it note during the brainstorming exercise. 2. Using a round-robin approach, the facilitator collects two ideas (e.g., causes and contributors) from each
person. 3. Facilitator instructs team members to remove ideas from their list that are the same as ideas posted. 4. Facilitator reads aloud each idea and places it on a flip chart or white board (can use a sticky wall). 5. Facilitator asks the team, “Do you see any ideas that relate to each other?” Facilitator places related ideas
next to each other. 6. Facilitator follows the round-robin approach until all unique ideas are posted and works with the team to
group related ideas 7. Once all ideas are posted, the Facilitator records the team’s identified theme at the top of each group of
ideas.
Gathering Data Data and information about the problem helps us understand what is “really” going on. Remember, we want to solve the root cause of a problem, so that we do not waste resources addressing symptoms of the problem. When we only solve symptoms, the problem will still show up, and we have wasted precious time and goodwill chasing symptoms versus the “real” problem. Data can verify or validate our assumptions and provide historical context. Data may also help us identify why the problem is occurring. In many cases, data may not be enough and we may need to use a root cause analysis tool, like 5 Whys, the Fishbone Diagram, or Affinity and Relations Diagrams to identify the root cause of the problem.
Identifying Necessary Information You should collect the information and data needed to answer the questions below. The data you collect will help you develop a strong Problem Statement/Project Goal.
What errors are occurring?
Where are the errors occurring?
When are the errors occurring?
Who is making the errors?
How are the errors occurring?
Why are the errors occurring?
Collecting Necessary Information If you do not have the information you need, you may need to create a Data Collection Plan. The components to include in a Data Collection Plan are listed below.
Data Needed (including units of measure and frequency — hourly, daily, monthly)
Who will collect the data
Data sources
When the data will be collected
How the data will be collected
How the data will be displayed
How and when to communicate the data

August 2015 mn.gov/CI 5
Customer Data We exist to meet the needs and service preferences of our customers who may be external or internal to our organization. Our ability to provide great service is a function of how well we understand and meet the needs and preferences of our customers.
When solving problems, it is important to gather the Voice of the Customer (VOC) to identify correctly the ‘pain’ customers are experiencing. Avoid the tendency to assume the reason or source of the customer’s pain, because much of the time we are wrong and we do not want to waste resources solving the wrong problem. Be courageous and invest the time to hear directly from your customers regarding what is not working.
You may get customer input several times throughout your continuous improvement project. Customer input can help you:
Define the problem(s) in the process;
Identify improvement opportunities and solutions; and
Validate improvement ideas.
Customer Research Methods Surveys (electronic, paper, phone, key pads)
Interviews
Focus groups
Observation
Program and Process Data Typically we have an abundance of data, but need to put it into a format that helps us see what is going on. Some common program and process data to consider collecting are explained below.
Quantity
o Program: products and services made or delivered, cost per unit, clients served, training sessions provided, attendees
o Process: Number of process steps
Efficiency
o Program: cost per unit, cost per customer group, cost per service type, number of staff (FTEs)
o Process: lead time, cycle time, percent of scrap (waste), percent value-added steps
Quality
o Program: customer satisfaction rate, customer complaints
o Process: percent complete and accurate, errors or defects, percent of services delivered on-time
Effect/impact – Is the customer better off? Did the customer achieve desired results or outcomes? (e.g., percent customers who found a job, health statistics that are improved, graduation rate, etc.)
If you want to learn more about data and measures, we recommend you sign up for our Process Improvement Measurement course (http://mn.gov/admin/lean/training/courses/measurement/).
August 2015 mn.gov/CI 6
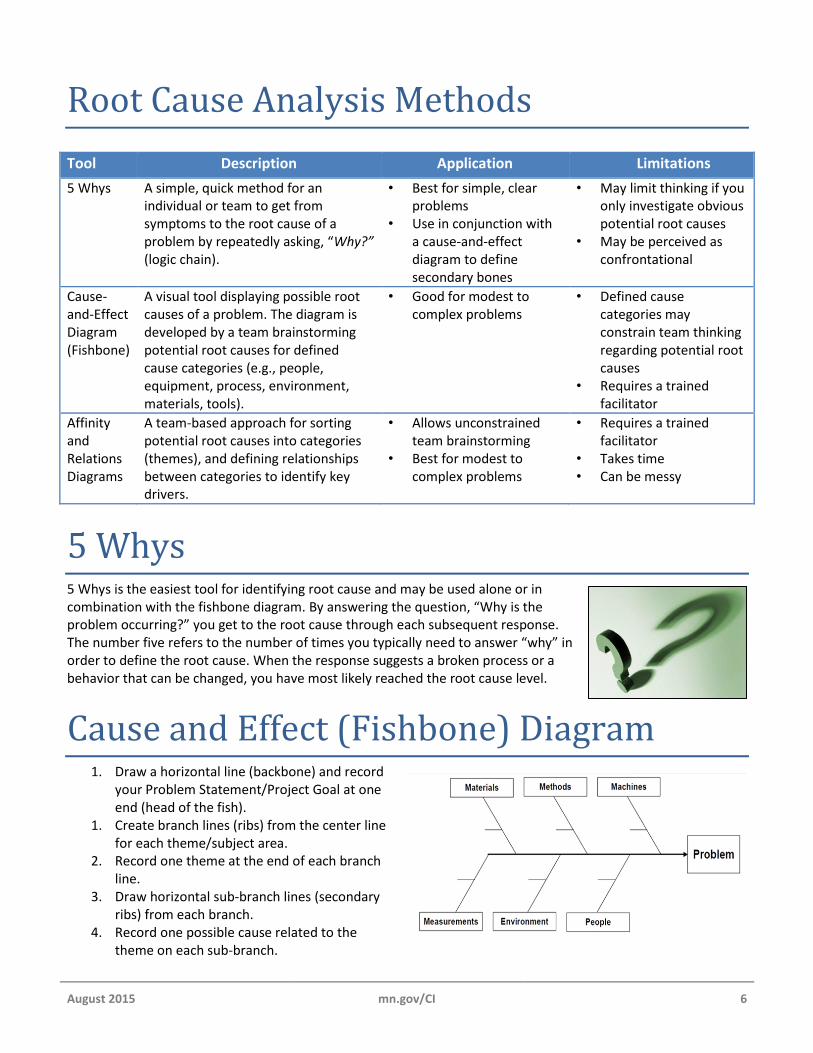
Root Cause Analysis Methods
Tool Description Application Limitations
5 Whys A simple, quick method for an individual or team to get from symptoms to the root cause of a problem by repeatedly asking, “Why?” (logic chain).
• Best for simple, clear problems
• Use in conjunction with a cause-and-effect diagram to define secondary bones
• May limit thinking if you only investigate obvious potential root causes
• May be perceived as confrontational
Cause-and-Effect Diagram (Fishbone)
A visual tool displaying possible root causes of a problem. The diagram is developed by a team brainstorming potential root causes for defined cause categories (e.g., people, equipment, process, environment, materials, tools).
• Good for modest to complex problems
• Defined cause categories may constrain team thinking regarding potential root causes
• Requires a trained facilitator
Affinity and Relations Diagrams
A team-based approach for sorting potential root causes into categories (themes), and defining relationships between categories to identify key drivers.
• Allows unconstrained team brainstorming
• Best for modest to complex problems
• Requires a trained facilitator
• Takes time • Can be messy
5 Whys 5 Whys is the easiest tool for identifying root cause and may be used alone or in combination with the fishbone diagram. By answering the question, “Why is the problem occurring?” you get to the root cause through each subsequent response. The number five refers to the number of times you typically need to answer “why” in order to define the root cause. When the response suggests a broken process or a behavior that can be changed, you have most likely reached the root cause level.
Cause and Effect (Fishbone) Diagram 1. Draw a horizontal line (backbone) and record
your Problem Statement/Project Goal at one end (head of the fish).
1. Create branch lines (ribs) from the center line for each theme/subject area.
2. Record one theme at the end of each branch line.
3. Draw horizontal sub-branch lines (secondary ribs) from each branch.
4. Record one possible cause related to the theme on each sub-branch.

August 2015 mn.gov/CI 7
5. Ask “Why did the cause occur?” to get at the root cause for each sub-branch. Record sub-causes branching out of each cause. You may have only one cause.
6. Repeat steps 4 and 5 for the remaining themes. 7. When you notice the same issues showing up for more than one theme, you have most likely identified a
key root cause.
Relations Diagram The purpose of the Relations Diagram is to identify which themes and root causes have the strongest influence over other causes. It also helps to see the interrelationship among causes.
Start with a list of brainstormed problems/causes. If the list is long (more than 10 causes), use the Affinity Diagram to identify themes or groups of related causes.
1. Record each theme or idea on a large post-it note and place notes in a large circle on a flip chart, white board, or sticky wall.
2. Start at the top of the circle with “Theme 1” and work your way clockwise through the remaining themes as they relate to Theme 1. Ask: “Does ‘Theme 1’ have a stronger influence on ‘Theme 2’ or does ‘Theme 2’ have a stronger influence on ‘Theme 1’?”
3. Draw arrows from the cause or theme that has the greater influence to the theme influenced. When themes influence each other, choose the stronger influence (no two-way arrows!). If there is no relationship among two themes (i.e., no influence) do not draw an arrow.
4. Then ask “Does ‘Theme 1’ have a stronger influence on ‘Theme 3’ or does ‘Theme 3’ have a stronger influence on ‘Theme 1?’” Proceed until you have recorded the relationships of all remaining themes to “Theme 1.”
5. Follow steps 2 through 4 with “Theme 2” until all relationships among remaining themes have been recorded for “Theme 2.”
6. Continue in a clockwise fashion until you have recorded all relationships with each subsequent theme. 7. Count the arrows going out and the arrows going in for each theme. Record as (<# of arrows out>, <# of
arrows in>). 8. The themes with the most arrows out and fewest arrows in will be root causes or drivers. The ones with
the most arrows in will be key outcomes, results, or symptoms of the root causes. Now that you have identified your root causes, the next step is brainstorming solutions to fix or mitigate the root causes. Follow the brainstorming rules on page 3.

August 2015 mn.gov/CI 8
Impact/Difficulty Matrix The Impact/Difficulty (Impact/Cost) Matrix is a simple 2x2 tool for prioritizing and selecting solutions. Solution ideas are sorted based on their impact or ability to achieve the Problem Statement (i.e., project goal) and on their level of difficulty or cost to implement. The four matrix categories are:
A: High Impact and Low Difficulty — these are great ideas to implement;
B: High Impact and High Difficulty — these ideas require sponsor approval;
C: Low Impact and Low Difficulty — these ideas should be implemented after having implemented ideas in category A; and
D: Low Impact and High Difficulty — it is not feasible to implement these ideas.
To sort solutions into the appropriate category, record the solution number in the appropriate area of the Impact/Difficulty table on a flip chart, white board, or sticky wall. If you wish to increase team participation, you can have team members read each of their ideas aloud and work with the team to place each idea in the appropriate matrix quadrant. Be aware that people have a tendency to view their ideas as having high impact, so you may need to verify idea impact with the team. Another tendency of teams is to view ideas that require a change in staff behavior as difficult. In these instances, remind team members that solving problems necessitates changes in behavior and encourage them to think more in terms of costs to implement the idea.
Action Plan If a project is complex and will take more than 30 days to implement solutions, you should create an action plan. An action plan is a document that defines the tasks, persons responsible, timelines, and status of each task for implementing approved solutions. The action plan is a work in progress and will need to be adjusted as the project rolls out. The action plan helps communicate roles and responsibilities and makes it easier for all participants to support each other and hold each other responsible for completing tasks. If you get stuck or need help completing a task, contact the project manager, process owner, or project sponsor for assistance.
Task (What?) Owner (Who?) Due Date (When?)
Status/ Comments
1.
2.
3.