Loyola Digest - Loyola Marymount University and Loyola Law ...
Upload
amber-warnerCategory
view
214download
0
PROBLEM-SOLVING AND RESPONSE TO INTERVENTION: IMPLICATIONS FOR POLICY AND
PRACTICE
October 2, 2007
David PrasseLoyola University Chicago
School Association for Special Education in DuPage County
Presents

Acknowledgements
• Jeff Grimes - Iowa
• Dave Tilly - Iowa
• George Batsche - Florida
• Joe Kovaleski - Pennsylvania
• Ed Shapiro – Pennsylvania
• Dan Reschly - Tennessee

Contextual Issues Affecting The Problem-Solving Process in General and
Special Education
• IDEA Re-Authorization– Focus on academic outcomes– General education as baseline metric– Labeling as a “last resort”– Increasing general education options– Pooling building-based resources– Flexible funding patterns– RtI Introduced as option for LD eligibility
• ESEA Legislation-No Child Left Behind• National Emphasis on Reading• Evidence-based Interventions
Getting Results- Research & Outcomes Based
• Scientifically-based research: 110 times
• Policy Decisions- based on research
• Evidenced-based teacher education
• Evidenced-based medicine: data over authority (gives authority to the data)
Why Problem-Solving ?BIG IDEAS
• AYP and Disaggregated Data (NCLB) move focus of attention to student progress, not student labels
• Building principals and superintendents want to know if students are achieving benchmarks, regardless of the students “type”
• Accurate “placements” do not guarantee that students will be exposed to interventions that maximize their rate of progress
• Effective interventions result from good problem-solving, rather than good “testing”
• Progress monitoring is done best with “authentic” assessment that is sensitive to small changes in student academic and social behavior

Big Ideas (con’d)
• Interventions must be “evidence based” (IDEA/NCLB)
• Response to Intervention(RtI) is the best measure of problem “severity”
• Program eligibility (initial and continued) decisions are best made based on RtI
• Staff training and support (e.g., coaching) improve intervention skills
• “Tiered” implementation improves service efficiency

Is It All About Reading? Yes!
• 52% of IDEA $$ go to LD Programs• 70% +/- of special education “activities” (e.g.,
evaluations, staffings, IEPs) related to LD cases• 94% of students in LD because of
reading/language arts• 46% of IDEA $$ go to improve reading• Changes in LD Rules will affect the vast majority
of special education “activities”

Reading Achievement
• Reading First – scientifically-based research
• Provide high quality reading instruction K-3
• Early Reading First – 5 key components• Phonemic Awareness, Phonics, Fluency• Vocabulary & Comprehension

PRESIDENT’S COMMISION SPECIAL EDUCATION: FINDINGS
• CURRENT SYSTEM – PROCESS ABOVE RESULTS
• CURRENT SYSTEM – WAIT TO FAIL MODEL
• DUAL SYSTEM- GENERAL AND SPECIAL• INADEQUATE PARENT OPTIONS AND
RECOURSE• CULTURE OF COMPLIANCE

PRESIDENT’S COMMISION SPECIAL EDUCATION: FINDINGS (CONT)
• IDENTIFICATION METHODS LACK VALIDITY
• BETTER TEACHER PREPARATION NEEDED
• RIGOROUS RESEARCH AND EVIDENCE-BASED PRACTICE
• FOCUS ON COMPLIANCE AND BUREAUCRATIC IMPERATIVES NOT ACADEMIC ACHIEVEMENT.

PRESIDENT’S COMMISSION SPECIAL EDUCATION: RECOMMENDATIONS
• FOCUS ON RESULTS – NOT ON PROCESS
• EMBRACE A MODEL OF PREVENTION NOT FAILURE
• CONSIDER CHILDREN WITH DISABILITIES AS GENERAL EDUCATON CHILDREN FIRST
Summary: Problems with the Discrepancy Approach
• Need to wait until discrepant to deliver SDI
• Doesn’t link with intervention
• False positives (high IQ; average achievement)
• False negatives (the slow learner myth)

Need to Document the Effectiveness of Special Education
Excedrin Headache #1 for Special Education!

Effectiveness of LD Programs based on Discrepancy Model
• Special education placements tend to stabilize the reading growth of students with reading disabilities rather than accelerate it. (Vaughn, 1998, Moody, 2000)
• Acceleration rates about .04 SD/year. It will take 8 years to move from 5th to 9th percentile (Torgeson, in press; Hanushek, 1998)
• Students who enter special education 2+ years below age mates can be expected to maintain disparity or fall farther behind.
• Effect size for LD programs is .29 (Reschly)
• It’s the nature of the program more than the label that makes the difference.

EHA 1975 Function and Purpose
• Find/identify children with disabilities
• Diagnosis/label – synonymous with program
• Provide procedural protections
• It worked well – children were “found.”
• Referred, tested, & placed – record numbers.

IDEA 97
• over 20 years of research and experience has demonstrated that education of children with disabilities can be made more effective by…. (A) having high expectations for such children and ensuring their access in the general education curriculum to the maximum extent possible; (F) providing incentives for whole-school approaches and pre-referral interventions to reduce the need to label children as disabled in order to address their learning needs; and (G) focusing resources on teaching and learning while reducing paperwork and requirements that do not assist in improving educational needs (Section 601 (C) (5), IDEA).
IDEA 1997
• Emphasis on student outcomes.
• From procedures to student performance.
• Stop focusing on testing and labeling
• Start emphasizing effective intervention.

IDEA 1997Eligibility Determination
• existing evaluation data (including that provided by the parents);
• current classroom-based assessments and observations, and
• teacher and related service providers observation.
• , “on the basis on that review, and input from the child’s parents, identify what additional data, if any, are needed” to determine special education eligibility needs [Sec. 614 (c) (1) (A) (B)]. (emphasis added).

Status of Reauthorization- IDEA 2004
• Title: “Individuals with Disabilities Education Improvement Act”
• Passed House in 2003, Senate in 2004• Signed by President Bush in December.• IN EFFECT July 1, 2005• Regulations August, 2006

IDEA 2004 CHANGES: Eligibility Determinations
• A child shall not be determined to be a child with a disability if determinant factor is:– Lack of scientifically-based instructional
practices and programs that contain the essential components of reading instruction.
– Lack of instruction in math– Limited English Proficiency

IDEA 2004 ChangesSpecific Learning Disabilities
• The LEA shall not be required to take into consideration whether the child has a severe discrepancy between achievement and intellectual ability in oral expression, listening comprehension, written expression, basic reading skill, reading comprehension, mathematical calculation, or mathematical reasoning.
Regulations
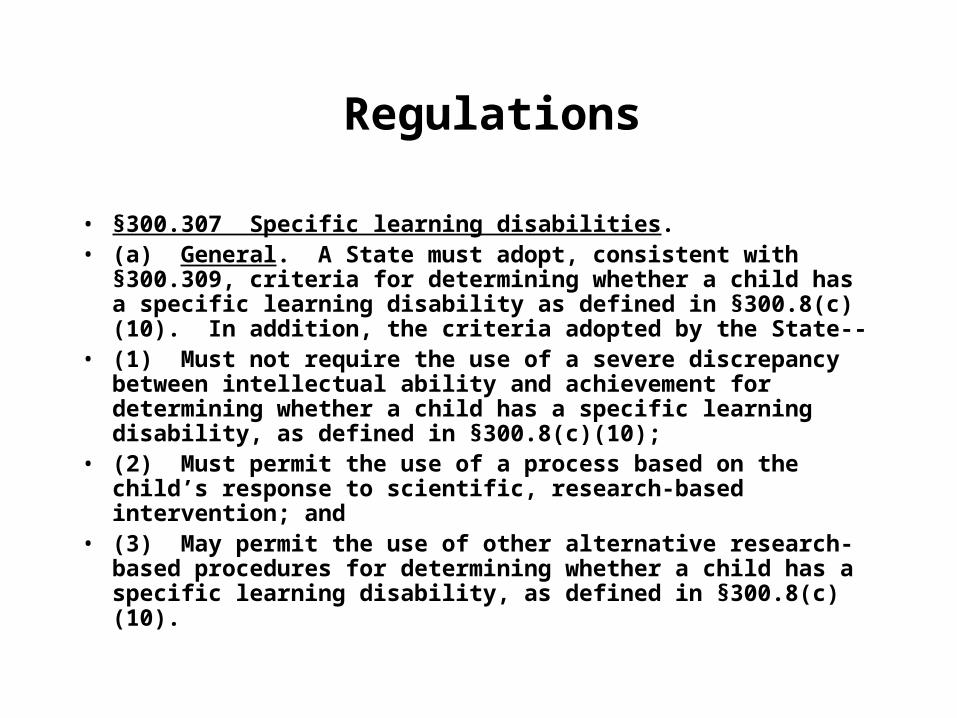
• §300.307 Specific learning disabilities.• (a) General. A State must adopt, consistent with §300.309,
criteria for determining whether a child has a specific learning disability as defined in §300.8(c)(10). In addition, the criteria adopted by the State--
• (1) Must not require the use of a severe discrepancy between intellectual ability and achievement for determining whether a child has a specific learning disability, as defined in §300.8(c)(10);
• (2) Must permit the use of a process based on the child’s response to scientific, research-based intervention; and
• (3) May permit the use of other alternative research-based procedures for determining whether a child has a specific learning disability, as defined in §300.8(c)(10).

Regulations
• (b) To ensure that underachievement in a child suspected of having a specific learning disability is not due to lack of appropriate instruction in reading or math, the group must consider, as part of the evaluation described in §§300.304 through 300.306--
• (1) Data that demonstrate that prior to, or as a part of, the referral process, the child was provided appropriate instruction in regular education settings, delivered by qualified personnel; and
• (2) Data-based documentation of repeated assessments of achievement at reasonable intervals, reflecting formal assessment of student progress during instruction, which was provided to the child’s parents.
Regulations
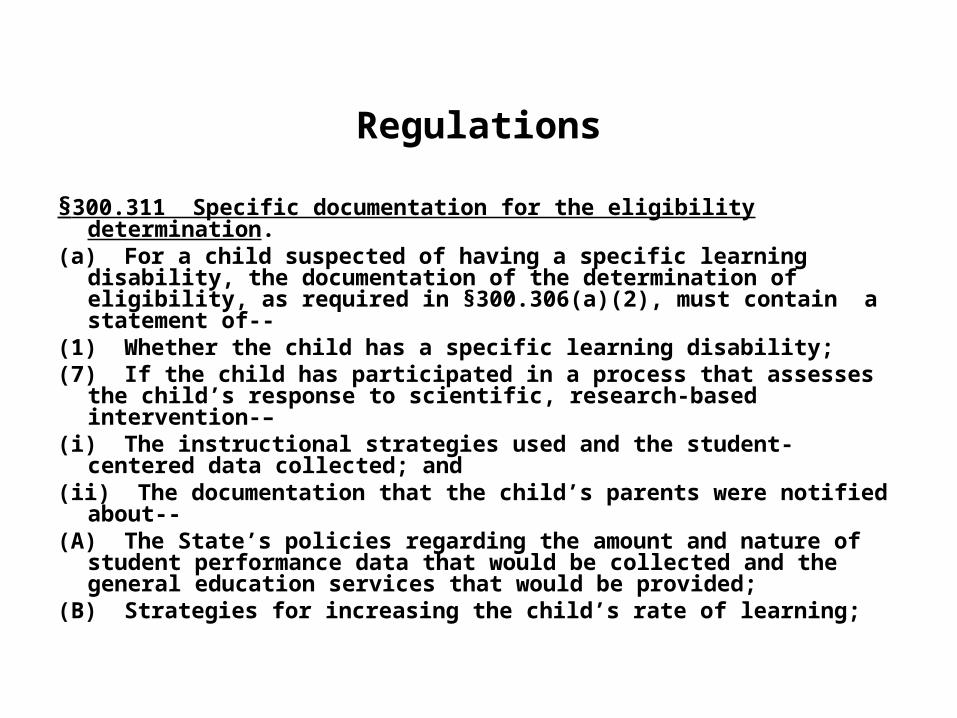
§300.311 Specific documentation for the eligibility determination.(a) For a child suspected of having a specific learning disability,
the documentation of the determination of eligibility, as required in §300.306(a)(2), must contain a statement of--
(1) Whether the child has a specific learning disability;(7) If the child has participated in a process that assesses the
child’s response to scientific, research-based intervention-–(i) The instructional strategies used and the student-centered
data collected; and (ii) The documentation that the child’s parents were notified
about--(A) The State’s policies regarding the amount and nature of
student performance data that would be collected and the general education services that would be provided;
(B) Strategies for increasing the child’s rate of learning;

State Regulations – Sec 226.130
• No later than Jan 1, 2009 each district shall develop a plan for the transition to the use of a process that determines how the child responds to scientific, research-based interventions as part of the evaluation procedure described in 34 CFR 300.304. Each district’s plan shall identify the resources the district will devote to this purpose and include an outline of the types of State-assistance the district expects to need, with particular reference to the professional development necessary for its affected staff members to implement this process.
Problem Solving
• A process that uses the skills of professionals from different disciplines to develop and evaluate intervention plans that improve significantly the school performance of students

Problem Solving Process
EvaluateResponse to
Intervention (RtI)
EvaluateResponse to
Intervention (RtI)
Problem AnalysisValidating ProblemIdent Variables that
Contribute to ProblemDevelop Plan
Problem AnalysisValidating ProblemIdent Variables that
Contribute to ProblemDevelop Plan
Define the ProblemDefining Problem/Directly Measuring Behavior
Define the ProblemDefining Problem/Directly Measuring Behavior
Implement PlanImplement As Intended
Progress MonitorModify as Necessary
Implement PlanImplement As Intended
Progress MonitorModify as Necessary

Problem Solving
• Can be applied to the student, classroom, building, district, and problem levels– Student- academic and/or behavior problem– Classroom- discipline, returning homework– Building- bullying, attendance– District- over-/under-representation– Problem- problem common to students in
building

Problem-Solving:What It Is and Is Not
• What it is….– A process designed to maximize student achievement
– A method focused on outcomes
– A method to ensure accountability and intervention evaluation
– It is all about student progress, regardless of where or who that student is
• What it is not…– A way to avoid special education placements
– A less expensive way of schooling
What Are the Barriers?
• It’s a different way of doing business for some.• It requires an expanded set of skills.• Interventions are integrated, not done by team members or
special educators only• Requires frequent data collection and analysis--different
culture• Focus is on HOW and WHAT student is doing, not WHERE
the student is going

What Are the Benefits?
• Enhanced Student Performance
• Accountability
• Greater staff involvement
• Greater parent involvement
• Greater student involvement

Discrepancy/Child Study vs Problem Solving
• Focus on interventions (not test scores)
– Low and high ability students respond equally well to phonemic awareness and phonics interventions.
• Assessment linked to developing and monitoring the effectiveness of interventions (not to diagnoses or categories)
• Balance between needs/resources (not strictly to eligibility)
• Change process (not a “fix”)
• Student outcome-based, not placement-based (What students DO is important, not what students are CALLLED)

ACADEMIC SYSTEMS BEHAVIORAL SYSTEMS
STUDENTS
The VISION: To Provide Effective Interventions to Meet the Needs of ALL Students Through Early and Scientifically Based Interventions Through Careful
Systems Planning
Tier 1 Core Instructional Interventions• All students• Preventive, proactive 80% 80%
Tier 1 Core Instructional Interventions• All settings, All students• Preventive, proactive
Tier 2 Targeted Group Interventions• Some students (at-risk)• High efficiency• Rapid response
15%Tier 2 Targeted Group Interventions• Some students (at-risk)• High efficiency• Rapid response
15%
Tier 3 Intensive, Individual Interventions• Individual Students• Assessment - based• Intense, durable procedures
5%
Tier 3 Intensive, Individual Interventions• Individual Students• Assessment - based• High intensity• Of longer duration
5%

What is ‘Response to Intervention (RtI)’?
(Batsche, Elliott, Graden, Grimes, Kovaleski, Prasse, Reschly, Scharg, Tilley, 2005)
• Identifying and providing high quality instruction and research-based interventions matched to students needs
• Measuring rate of improvement (ROI) over time to make important educational decisions
• Educators use ongoing student performance data to determine if an intervention is working. If it is not, it is time to do something different.

Response to Intervention:How Well Are We Doing?
• A systematic and data-based method for determining the degree to which a student has responded to intervention.
• Determined solely through analyzing data• Begins with using data to IDENTIFY the problem• Services should intensify for a student as the
student response to intervention is below expectations.
• It IS NOT Problem-Solving
Response to Intervention:How Well Are We Doing?
• What do we do when a student has been “placed” in special education but the student’s rate of progress has not changed significantly?
• This has significant implications for special education re-evaluations under the RtI model.

Use of RtI in the Student Eligibility Process
So, how does the eligibility process look different using the RtI approach vs. traditional practices?
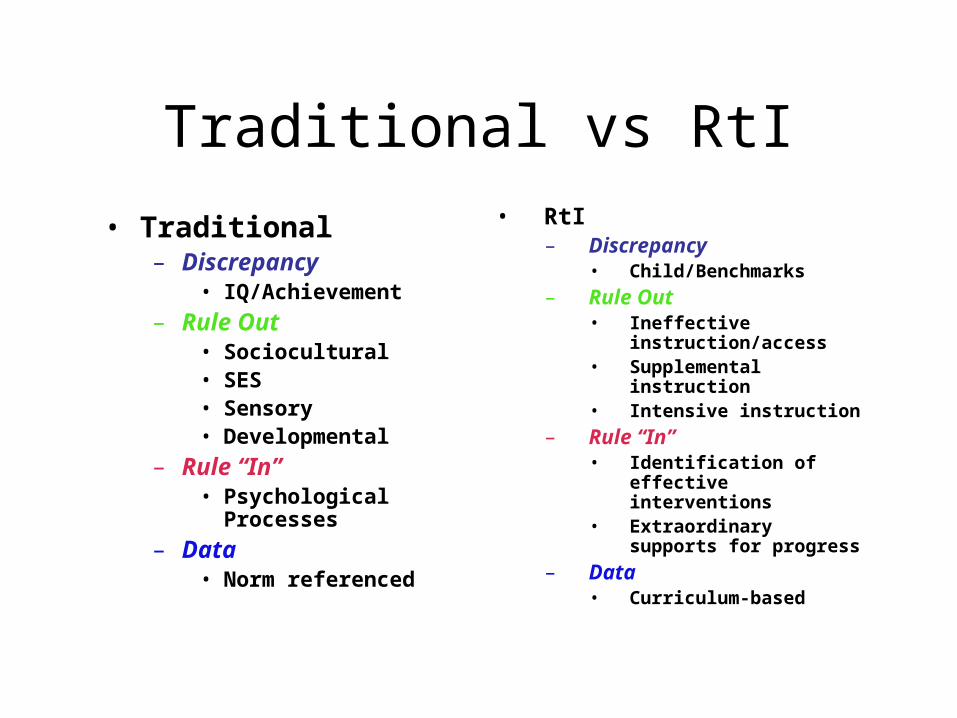
Traditional vs RtI
• Traditional– Discrepancy
• IQ/Achievement
– Rule Out• Sociocultural• SES• Sensory• Developmental
– Rule “In”• Psychological
Processes
– Data• Norm referenced
• RtI– Discrepancy
• Child/Benchmarks
– Rule Out• Ineffective
instruction/access• Supplemental instruction• Intensive instruction
– Rule “In”• Identification of effective
interventions• Extraordinary supports
for progress
– Data• Curriculum-based

Re-Evaluations
• Traditional– Discrepancy continues to
exist– Limited progress toward
benchmarks– Supports critical
• RtI– Gap is closing– If response is poor,
should we keep the student in the program?
– If response is good, can we transition to a Tier 3,2 or 1?

Problem Solving and RtI
• I really just want to be able to use RtI without all of that problem-solving stuff--can I do that?

Using Response to Instruction to Determine
Eligibility for Special Education: Three Tiers
1. Screening and Primary Intervention2. Assessing Response to Instruction
During Through Standard Protocol Interventions, and/or Team-based Problem Solving.
3. Appraising the Extent of Academic Deficiency and Evaluating the Need for Specially Designed Instruction.

Tier 1: School-wide Screening and Intervention
• Grades K-12• Identification of high risk students• Targeted intervention to high risk students
using research-based procedures (group)• Ongoing monitoring of performance
(quarterly) • Primary example: Early assessment of
marker variables (DIBELS). High school PBIS program.

TIER 1: Benchmark/SchoolwideBenchmark/Core Reading Programs:
1. Rigby Literacy (Harcourt Rigby Education, 2000)
2. Trophies (Harcourt School Publishers, 2003)3. The Nation’s Choice (Houghton Mifflin, 2003)
4. Macmillan/McGraw-Hill Reading (2003)5. Open Court (SRA/McGraw-Hill, 2002)
6. Reading Mastery Plus (SRA/McGraw-Hill, 2002)
7. Scott Foresman Reading (2004)8. Success For All (1998-2003)9. Wright Group Literacy (2002)
Reviewed by: Oregon Reading FirstComprehensive: Addressed all 5 areas
and included at least grades K-3

Tier 1: Data Analysis Teams
• Teams working together to…• Access critical data on all students’
performance related to achievement of standards
• Analyze data and find which students have which gaps in attainments
• Set measurable goals to close the gap• Design and implement instructional
strategies

Teams Working Together
• Like teachers = grade level or department level
• Use skills of other team members in collaborative consultation (e.g., problem identification, brainstorming)
• Need a structure (time, place, etc.)
Accessing Critical Data
• Two forms of data: group test and district performance tests/tasks
• Need a process for gathering data• Need someone to convert data into
teacher-friendly summary documents• Need to train teachers on how to
read summary documents
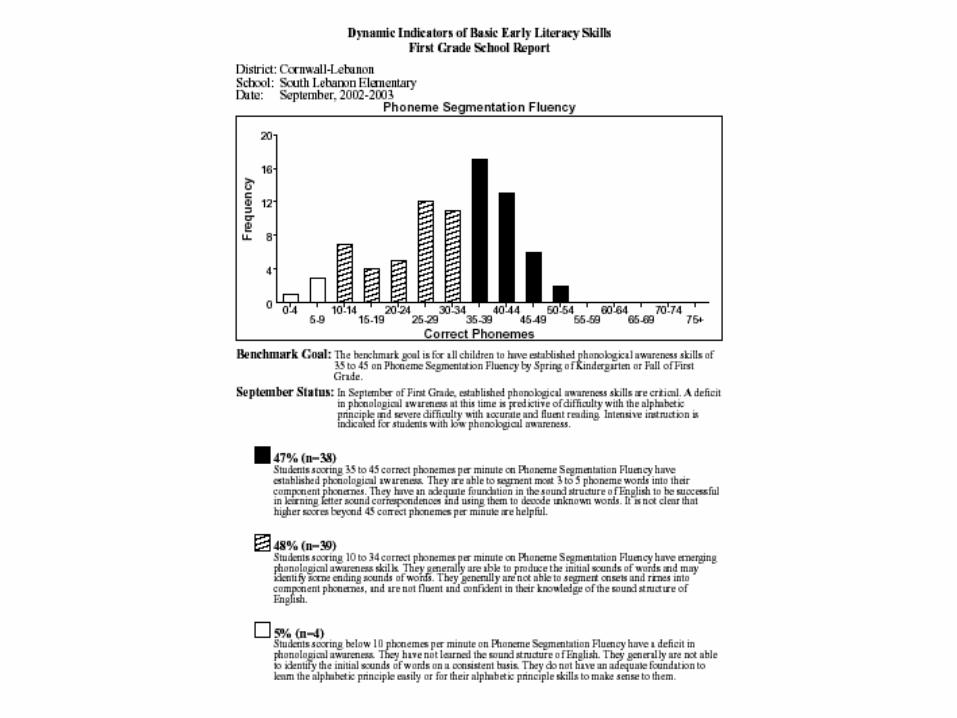

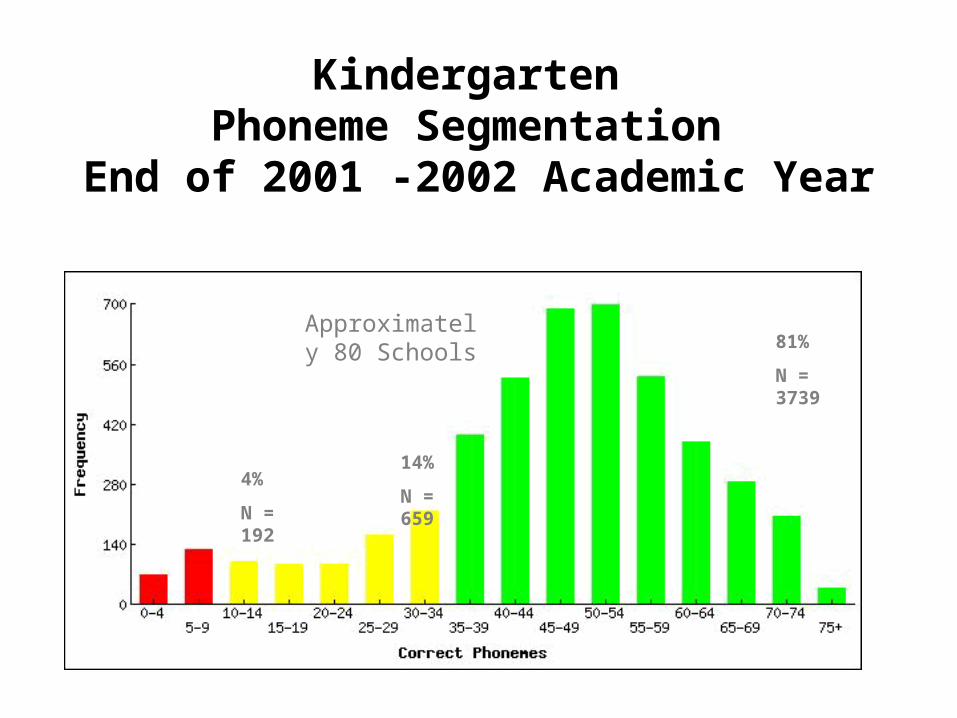
Kindergarten Phoneme Segmentation
End of 2001 -2002 Academic Year
4%
N = 192
81%
N = 3739
Approximately 80 Schools
14%
N = 659

Instructional
At Risk
Universal Screening can Identify School Wide Reading Deficits
Reading data- 1st grade
Mastery
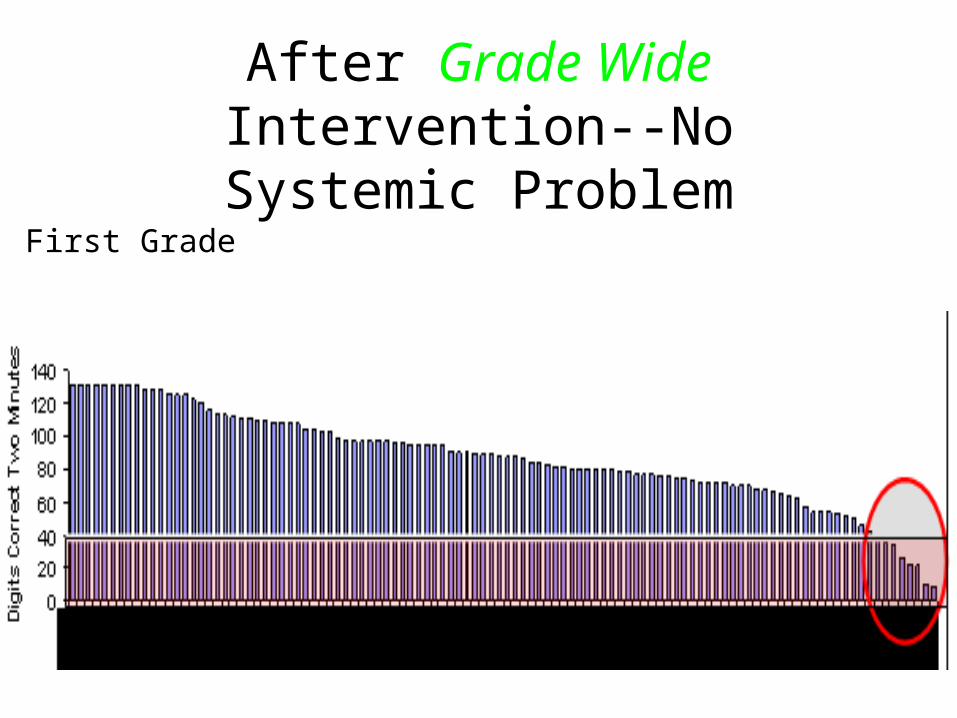
After Grade Wide Intervention--No Systemic Problem
First Grade

Standard-Based Standard-Based ApproachesApproaches
• Illinois AIMSweb Standards Tied to ISAT and Minnesota State
• Oregon DIBELS StandardsWith a Standards Based Approach, Use With a Standards Based Approach, Use
Linkages to High Stakes TestsLinkages to High Stakes TestsThe desired outcome is to have the student meet standards on High Stakes Tests.

Illinois AIMSweb Standards
(Cut Scores
for ISAT)

Standards-Based Approaches and Universal Screening
Red = Highly Unlikely to Pass the State TestGreen = Highly Like to PassYellow = Uncertain to Pass

Conceptualizing Tier 2
• Standard Protocol
• Problem solving teaming

A Standard Protocol Intervention …
• is scientifically based.• has a high probability of producing
change for large numbers of students.• is designed to be used in a standard
manner across students.• is usually delivered in small groups.• is often scripted or very structured.• can be orchestrated by a problem-solving
team.
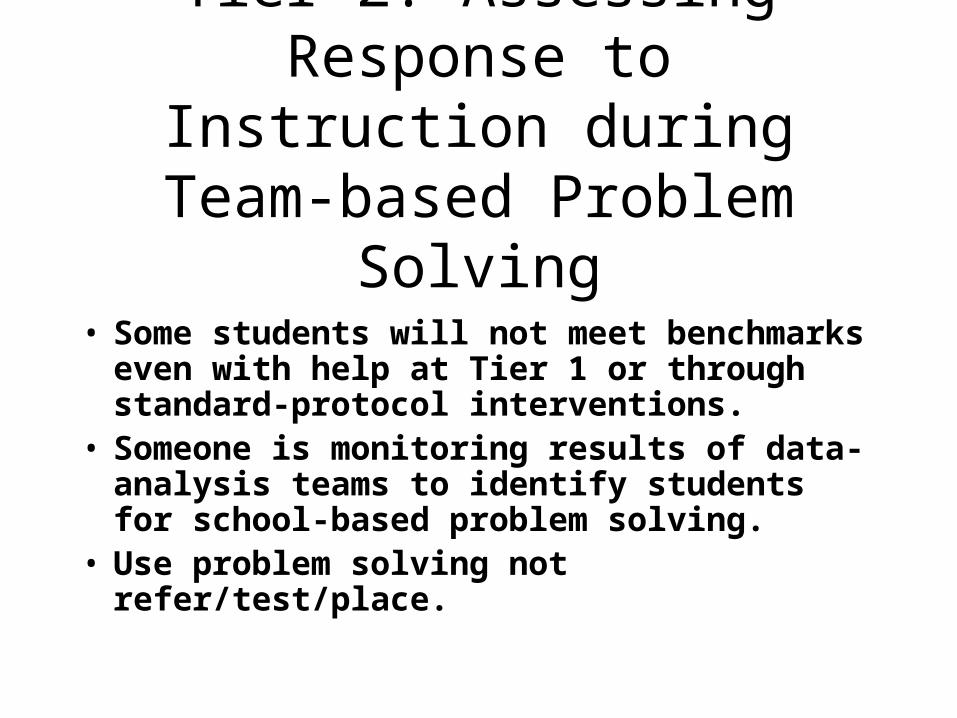
Tier 2: Assessing Response to Instruction during Team-based
Problem Solving
• Some students will not meet benchmarks even with help at Tier 1 or through standard-protocol interventions.
• Someone is monitoring results of data-analysis teams to identify students for school-based problem solving.
• Use problem solving not refer/test/place.

TIER 2: StrategicStrategic/Supplemental Reading Programs:
Early (Soar to) Success (Houghton Mifflin)Read Well (Sopris West)
Reading Mastery (SRA)
Early Reading Intervention (Scott Foresman)
Great Leaps (Diamuid, Inc.)REWARDS (Sopris West)
Ladders to Literacy (Brookes)
Read Naturally
Peer Assisted Learning Strategies (PALS)
0
10
20
30
40
50
60
70
80
90
100
1 2 3 4 5 6 7 8 9 10111213 14151617 18192021 22232425 26272829 30
.
wpm
Assessment Sessions
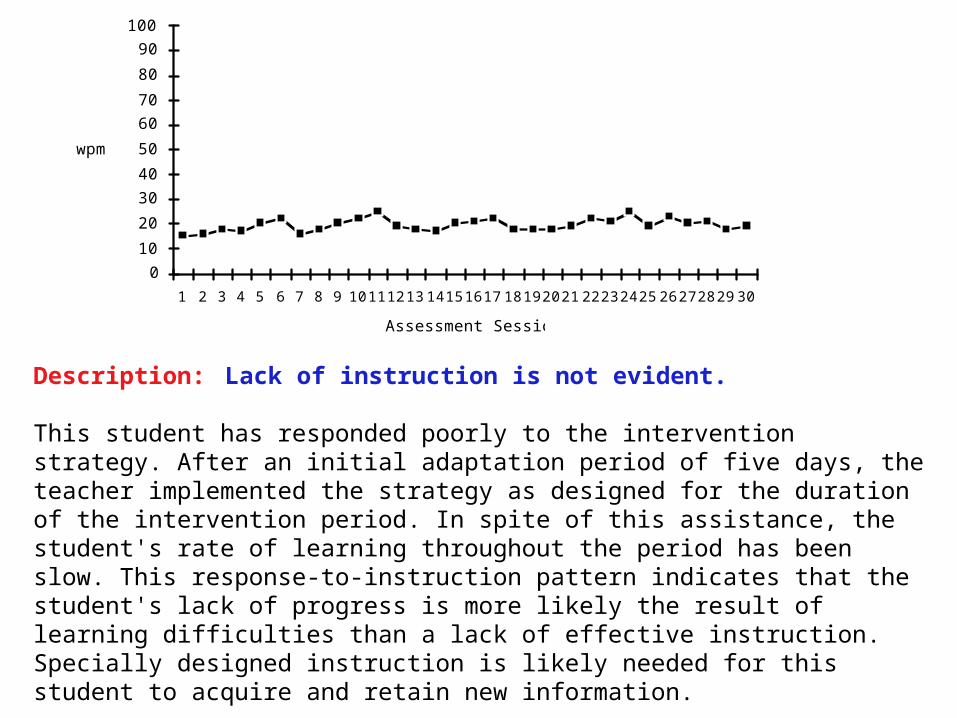
Description: Lack of instruction is not evident.
This student has responded poorly to the intervention strategy. After an initial adaptation period of five days, the teacher implemented the strategy as designed for the duration of the intervention period. In spite of this assistance, the student's rate of learning throughout the period has been slow. This response-to-instruction pattern indicates that the student's lack of progress is more likely the result of learning difficulties than a lack of effective instruction. Specially designed instruction is likely needed for this student to acquire and retain new information.
0
10
20
30
40
50
60
70
80
90
100
1 2 3 4 5 6 7 8 9 101112131415161718192021222324252627282930
wpm
Assessment Sessions
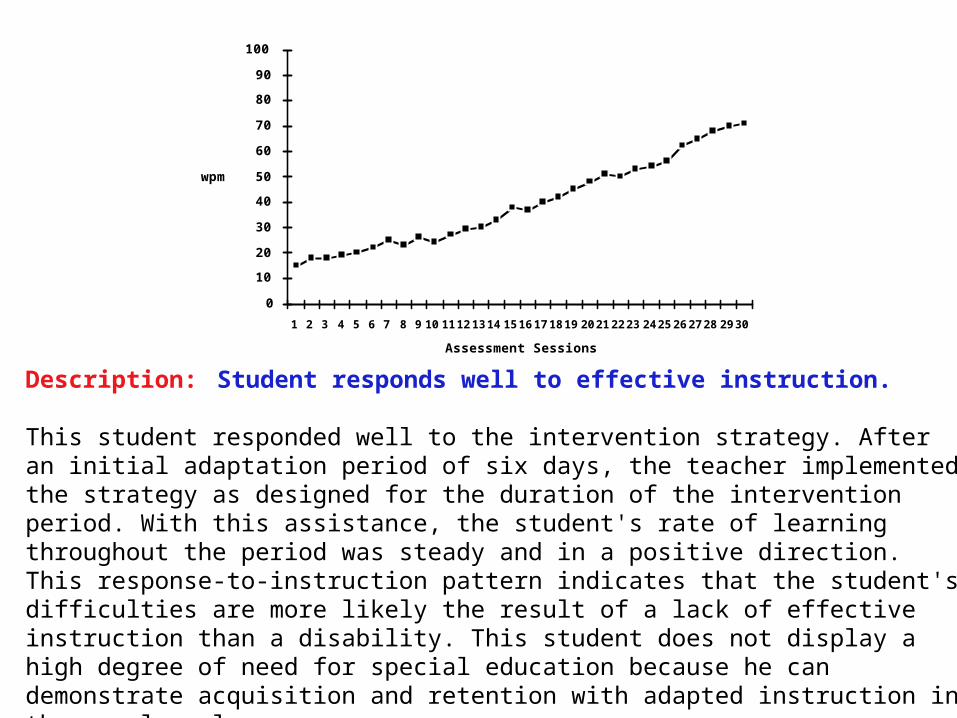
Description: Student responds well to effective instruction.
This student responded well to the intervention strategy. After an initial adaptation period of six days, the teacher implemented the strategy as designed for the duration of the intervention period. With this assistance, the student's rate of learning throughout the period was steady and in a positive direction. This response-to-instruction pattern indicates that the student's difficulties are more likely the result of a lack of effective instruction than a disability. This student does not display a high degree of need for special education because he can demonstrate acquisition and retention with adapted instruction in the regular classroom.
0
10
20
30
40
50
60
70
80
90
100
1 3 5 7 9 11 13 15 17 19 21 23 25 27 29
.
wpm
Assessment Sessions
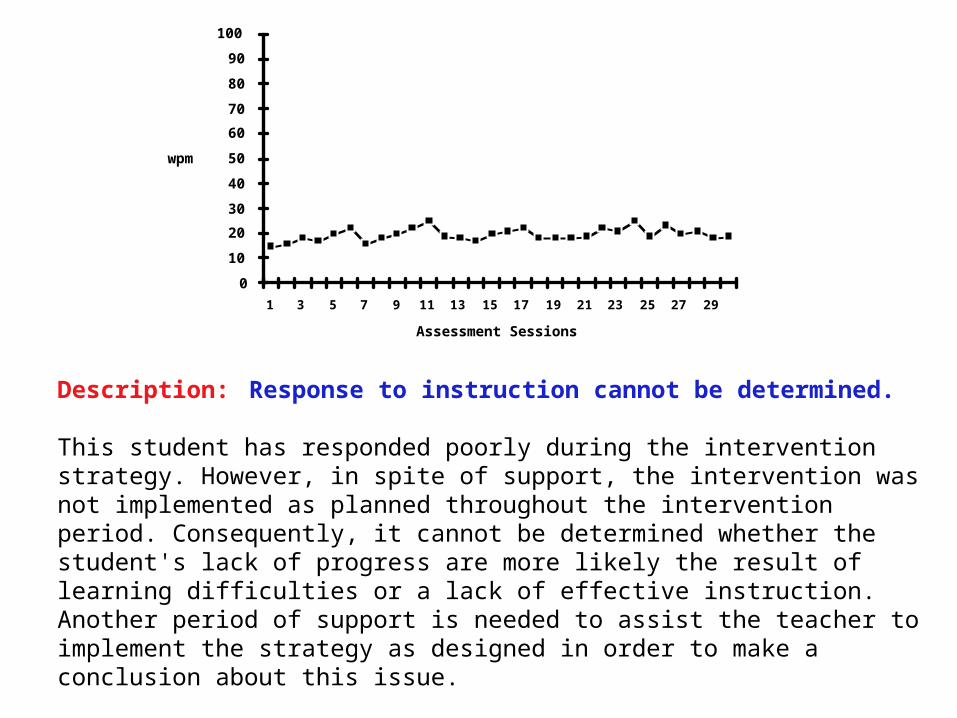
Description: Response to instruction cannot be determined.
This student has responded poorly during the intervention strategy. However, in spite of support, the intervention was not implemented as planned throughout the intervention period. Consequently, it cannot be determined whether the student's lack of progress are more likely the result of learning difficulties or a lack of effective instruction. Another period of support is needed to assist the teacher to implement the strategy as designed in order to make a conclusion about this issue.

Tier 3: Appraising the Extent of Academic Deficiency and Evaluating the Need for
Specially Designed Instruction.
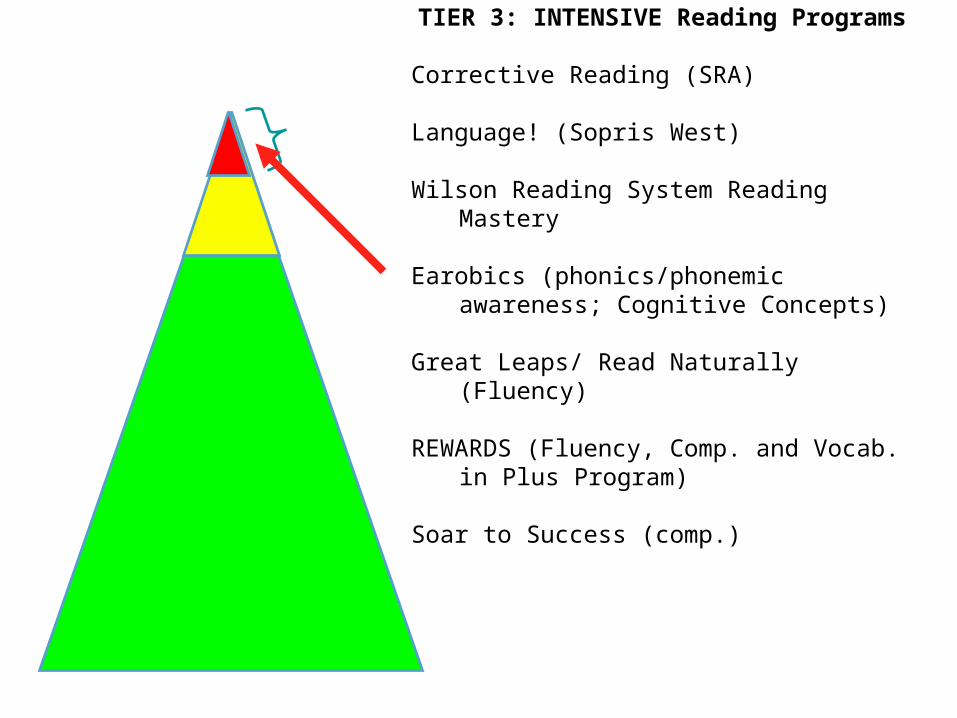
TIER 3: INTENSIVE Reading Programs
Corrective Reading (SRA)
Language! (Sopris West)
Wilson Reading System Reading Mastery
Earobics (phonics/phonemic awareness; Cognitive Concepts)
Great Leaps/ Read Naturally (Fluency)
REWARDS (Fluency, Comp. and Vocab. in Plus Program)
Soar to Success (comp.)
Entitlement Decision
Using Response-to-Intervention data for educational decision
making

Entitlement for Special Education
Educational Progress
Discrepancy InstructionalNeeds
Assessment and Progress DataFrom Problem Solving Process
Convergence of Data from aVariety of Sources
(Grimes and Tilley, 2003)

Step 1: Appraising the student’s rate of learning
• Evaluating the student’s response to scientifically based instruction.
• What was the student’s progress during the intervention?

Conditions for Special Education Entitlement:
Progress• Educational Progress - previous
interventions have not sufficiently improve a student’s rate of learning and additional resources are needed to enhance student learning or the interventions that have sufficiently improved the student’s learning are too demanding to be implemented without special education resources (Grimes & Tilly, 2003)
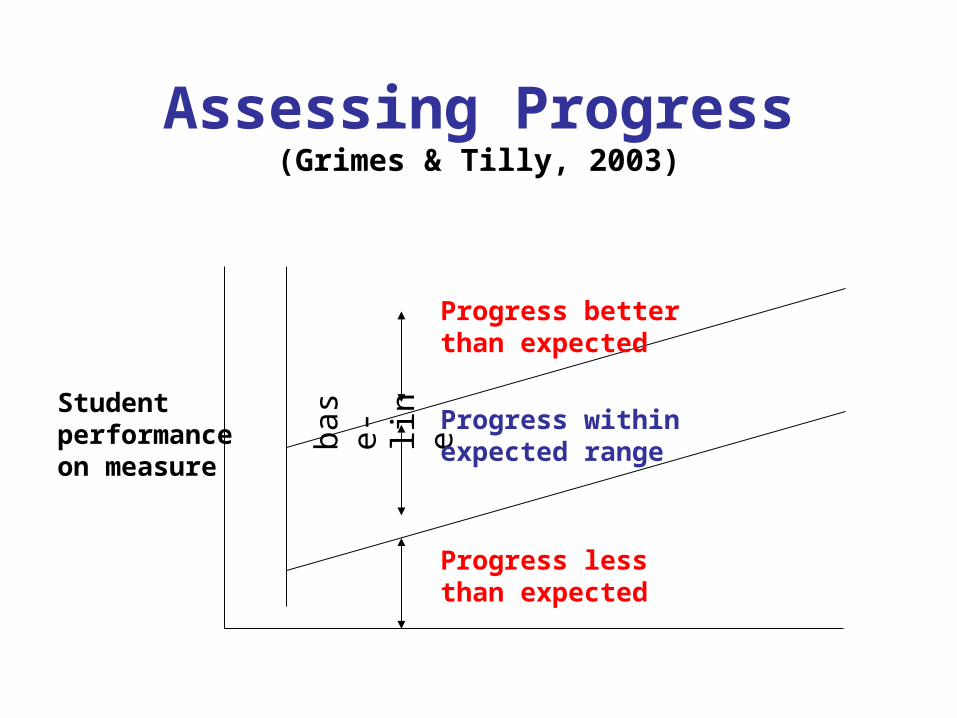
Assessing Progress (Grimes & Tilly, 2003)
base
-li
neStudent performance on measure
Progress within expected range
Progress less than expected
Progress better than expected

Conditions for Special Education Entitlement:
Discrepancy
• Discrepancy - given equal or enhanced opportunities, the student’s current level of performance is significantly lower than typical peers or identified standards (Grimes & Tilly, 2003)

Discrepancy (Grimes & Tilly, 2003)
Above the range of expected performance
Standardof expectedperformance
Within the range of expected performance
Below the range of expected performance
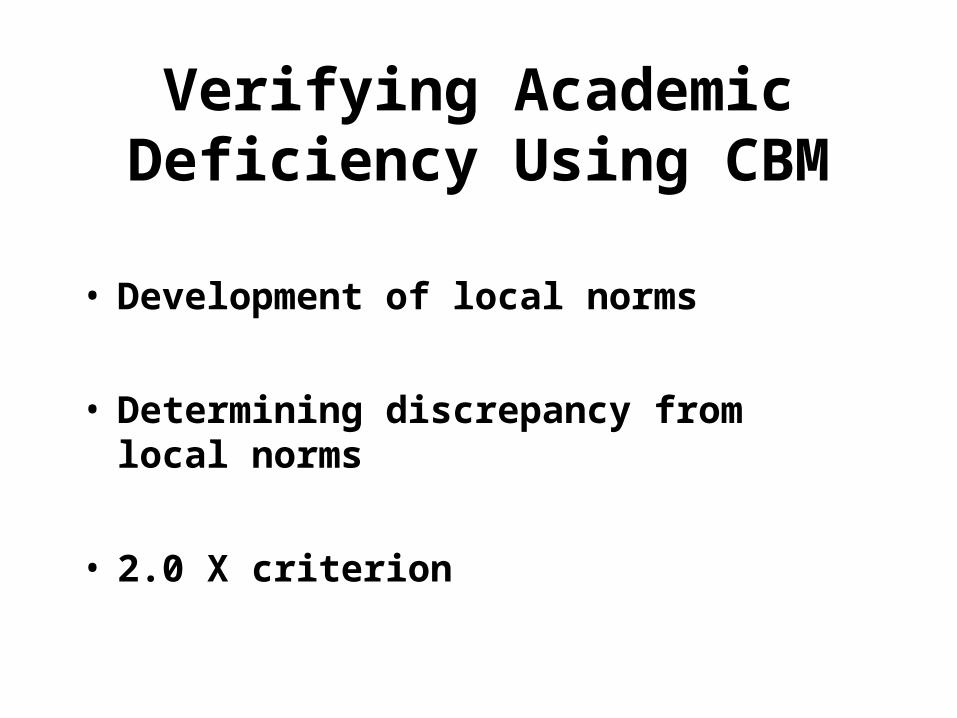
Verifying Academic Deficiency Using CBM
• Development of local norms
• Determining discrepancy from local norms
• 2.0 X criterion
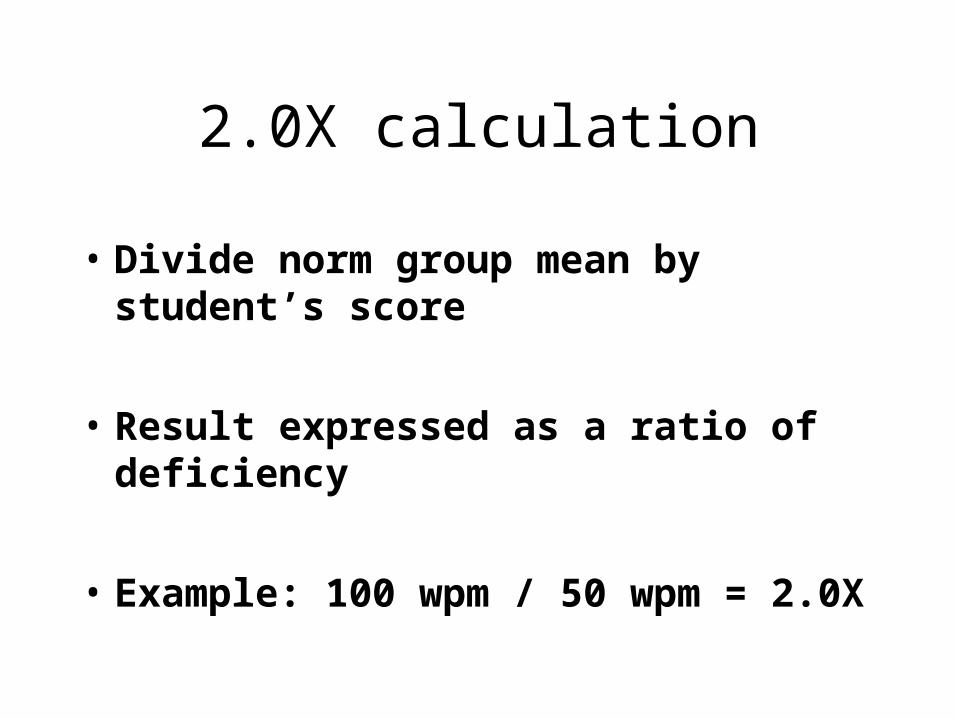
2.0X calculation
• Divide norm group mean by student’s score
• Result expressed as a ratio of deficiency
• Example: 100 wpm / 50 wpm = 2.0X

Cornwall-Lebanon SD Elementary
Oral Reading Fluency Norms
Grade 1F 1W 1S 2F 2S 3F 3S 4F 4S 5F 5S
WPM 18 42 69 76 113 79 107 107 125 129 146
EPM 10 6 4 4 2 5 3 3 3 2 2

Step 3: Evaluating the Need for Specially Designed Instruction
• Deviations in materials
• Deviations in planning
• Deviations in personnel

Conditions for Special Education Entitlement: Instructional Needs
• Instructional Needs - instructional needs have been identified that are beyond what can be provided in general education. This is evident when curriculum, instruction or environmental conditions need to be very different for the student as compared to the needs of other students in the general education environment. (Grimes & Tilly, 2003)
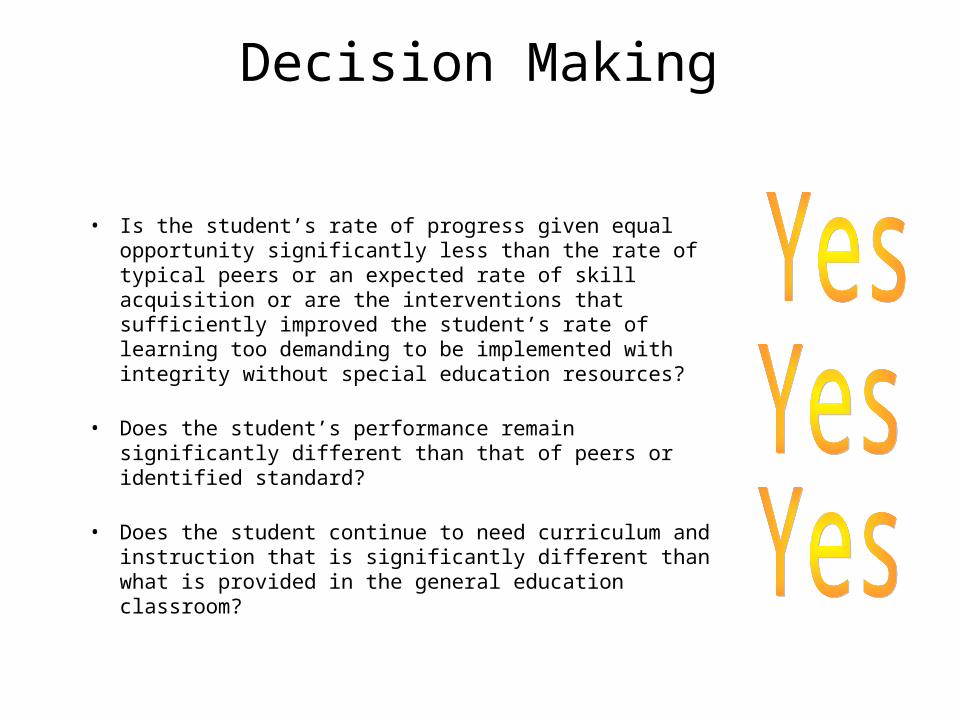
Decision Making
• Is the student’s rate of progress given equal opportunity significantly less than the rate of typical peers or an expected rate of skill acquisition or are the interventions that sufficiently improved the student’s rate of learning too demanding to be implemented with integrity without special education resources?
• Does the student’s performance remain significantly different than that of peers or identified standard?
• Does the student continue to need curriculum and instruction that is significantly different than what is provided in the general education classroom?

A. Educational
Progress
B. Discrepancy
C. Instructional
Needs
Entitlement Decision
Tells us whether or not interventions require special education.
Entitlement Decision
(Grimes and Tilley, 2003)
Tells us what accelerates learning.
Tells us how unique the student is compared to peers.
Tells us what and how to teach.

So What Is Special Education-Really?
• Characteristics AND Need (IDEA 04)• Instructional and Related Services Necessary to Profit from
Education • Supplements General Education
– Note: Does not supplant-particularly LD– “Unified” system of Education
• Funds (really??) Instructional and Related Services When Those Reach a Certain Level of Intensity
• What is “Special?” Intensity and Focus

Academic Case Examples
• Thanks to Joe Kovaleski and Ed Shapiro for the case examples
• PA State-wide RtI Initiative

LISA
50
0
10
20
30
40
50
60
70
80
90
100
Sept Oct Nov Dec Jan Feb
School Weeks
Wor
ds C
orre
ct P
er M
in
Benchmark

Decision Model at Tier 1- General Education Instruction
• Step 1: Screening• ORF = 50 wcpm, fall benchmark for some risk = 44
wcpm• Comprehension skills are judged as at levels equal
to ORF by her teacher • Is this student at risk?• Current Gen Ed Instruction is Working
No YesMove to Tier 2: Strategic Interventions
Lisa
Continue Tier 1 Instruction

Rita
• Second grade student• Beginning of school year• Regular Education• Scores at 20 wcpm in second grade material• Teacher judges (based on in-class
observation/evaluation) comprehension to not be substantially different from ORF

Rita
20
0
10
20
30
40
50
60
70
80
90
100
Sept Oct Nov Dec Jan Feb
School Weeks
Wor
ds C
orre
ct P
er M
in
Benchmark
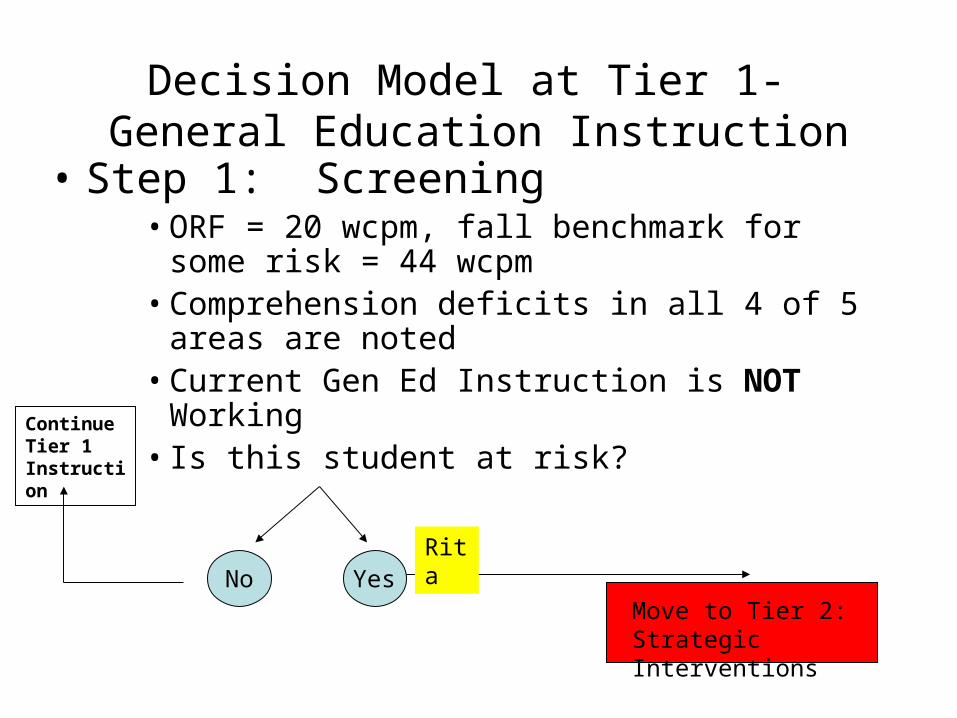
Decision Model at Tier 1- General Education Instruction
• Step 1: Screening• ORF = 20 wcpm, fall benchmark for some risk = 44
wcpm• Comprehension deficits in all 4 of 5 areas are
noted• Current Gen Ed Instruction is NOT Working• Is this student at risk?
No YesMove to Tier 2: Strategic InterventionsRita
Rita
Continue Tier 1 Instruction
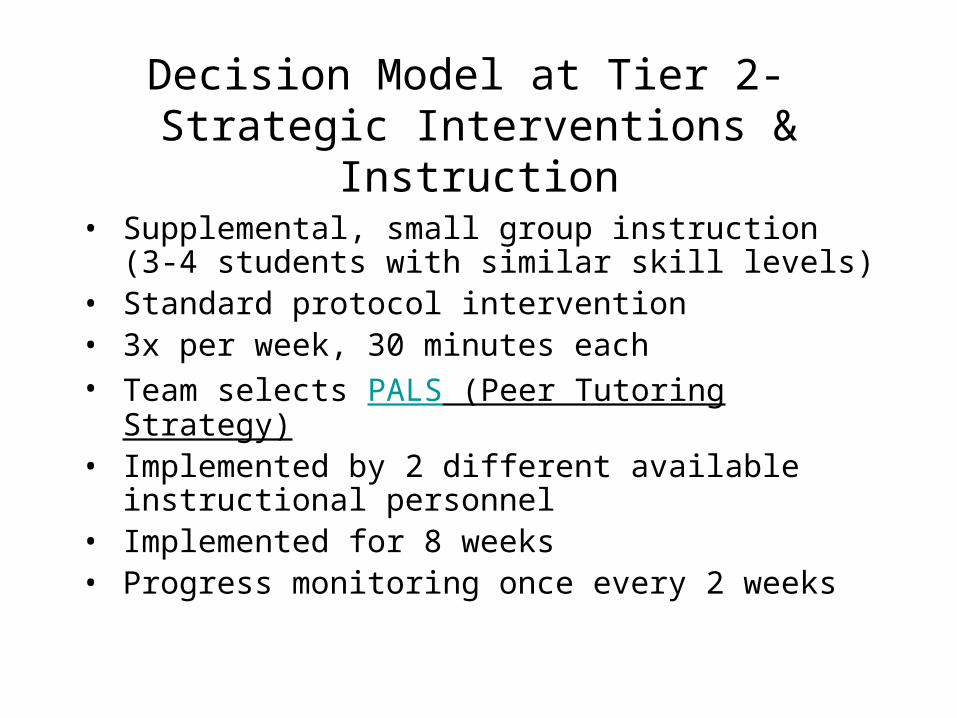
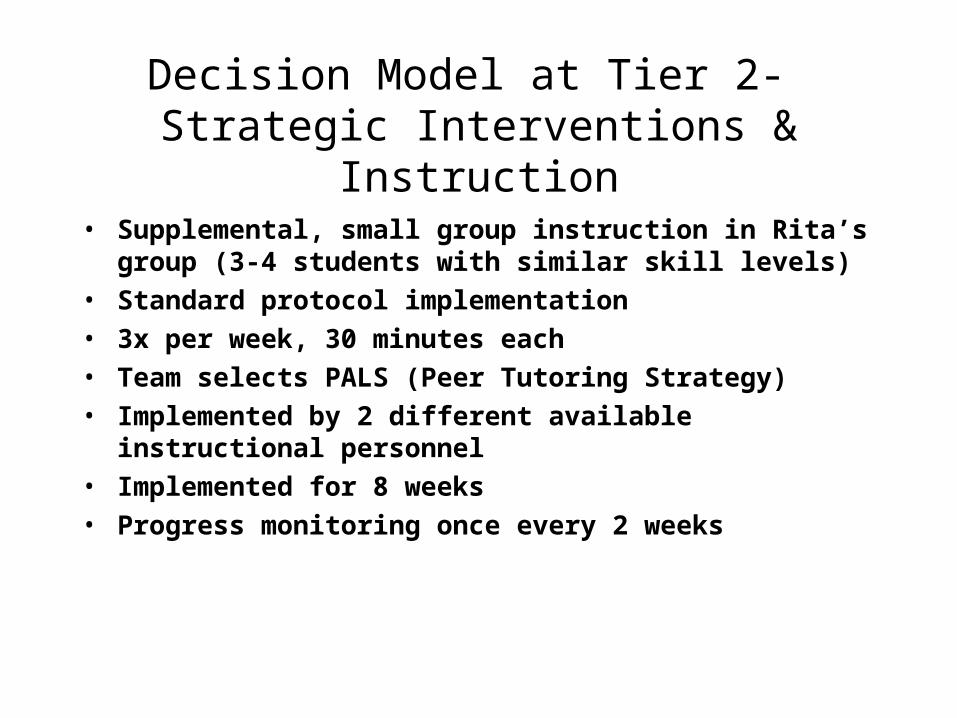
Decision Model at Tier 2- Strategic Interventions & Instruction
• Supplemental, small group instruction (3-4 students with similar skill levels)
• Standard protocol intervention• 3x per week, 30 minutes each• Team selects PALS (Peer Tutoring Strategy)• Implemented by 2 different available
instructional personnel• Implemented for 8 weeks• Progress monitoring once every 2 weeks

Rita- Tier 2
2024
28
35 34
0
10
20
30
40
50
60
70
80
90
100
Sept Oct Nov Dec Jan Feb
School Weeks
Wor
ds C
orre
ct P
er M
in
Tier 2: Strategic -PALS
Trendline = 1.85 words/week
Aimline= 1.50 words/week

Decision Model at Tier 2- Strategic Intervention & Instruction
• ORF = 34 wcpm, winter benchmark (still 8 weeks away) for some risk = 52 wcpm
• Target rate of gain over Tier 1 assessment is 1.5 words/week
• Actual attained rate of gain was 1.85 words/week• Gains above benchmark in 4 of 5 comprehension
areas• Student on target to attain benchmark• Step 2: Is student responsive to intervention?
NoYesMove to Tier 3: Intensive Interventions
Rita
Continue monitoring or return to Tier 1
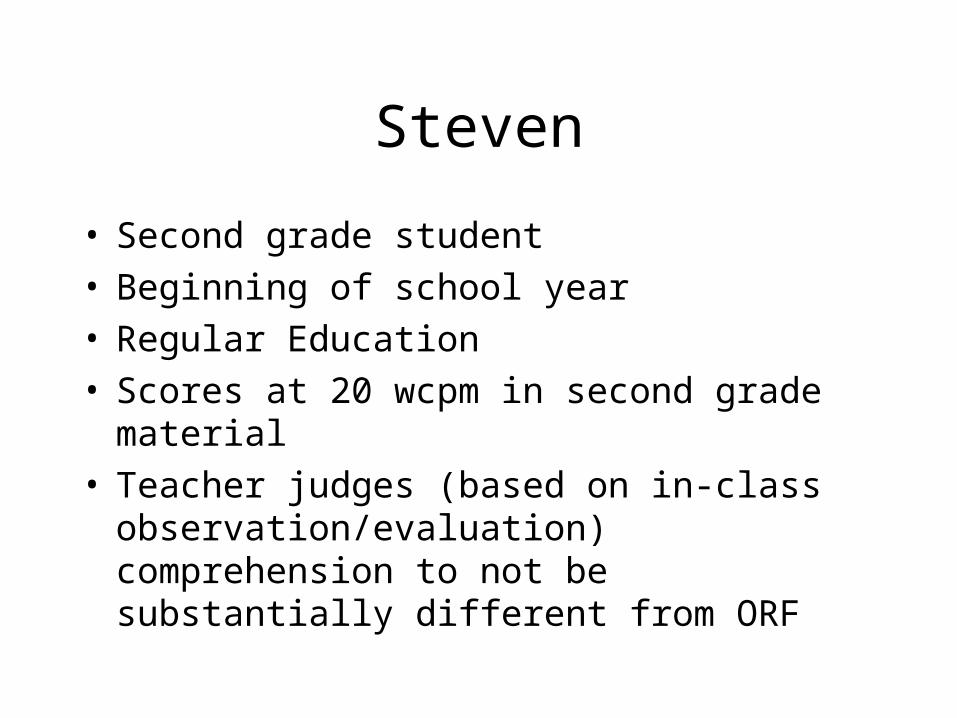
Steven
• Second grade student• Beginning of school year• Regular Education• Scores at 20 wcpm in second grade material• Teacher judges (based on in-class
observation/evaluation) comprehension to not be substantially different from ORF

Steven
20
0
10
20
30
40
50
60
70
80
90
100
Sept Oct Nov Dec Jan Feb
School Weeks
Wor
ds C
orre
ct P
er M
in
Benchmark

Decision Model at Tier 1- General Education Instruction
– Step 1: Screening• ORF = 20 wcpm, fall benchmark for some risk = 44
wcpm• Comprehension screen also shows deficits in all 5
areas• Current Gen Ed Instruction is NOT Working• Is this student at risk?
No YesMove to Tier 2: Strategic InterventionsRita
Steven
Continue Tier 1 Instruction
Decision Model at Tier 2- Strategic Interventions & Instruction
• Supplemental, small group instruction in Rita’s group (3-4 students with similar skill levels)
• Standard protocol implementation• 3x per week, 30 minutes each• Team selects PALS (Peer Tutoring Strategy)• Implemented by 2 different available instructional
personnel• Implemented for 8 weeks• Progress monitoring once every 2 weeks

Steven
20 1822 21
24
0
10
20
30
40
50
60
70
80
90
100
Sept Oct Nov Dec Jan Feb
School Weeks
Wor
ds C
orre
ct P
er M
in
Tier 2: Strategic -PALS
Aimline= 1.50 words/week
Trendline = 0.55 words/week

Decision Model at Tier 2- Strategic Intervention & Instruction– Step 2: Is student responsive to intervention?
• ORF = 24 wcpm, winter benchmark (still 8 weeks away) for some risk = 52 wcpm
• Target rate of gain over Tier 1 assessment is 1.5 words/week
• Actual attained rate of gain was 0.55 words/week• Below comprehension benchmarks in 4 of 5 areas• Student NOT on target to attain benchmark• Is student responsive to intervention at Tier 2?
NoYesMove to Tier 3: Intensive Interventions
Steven
Continue monitoring or return to Tier 1
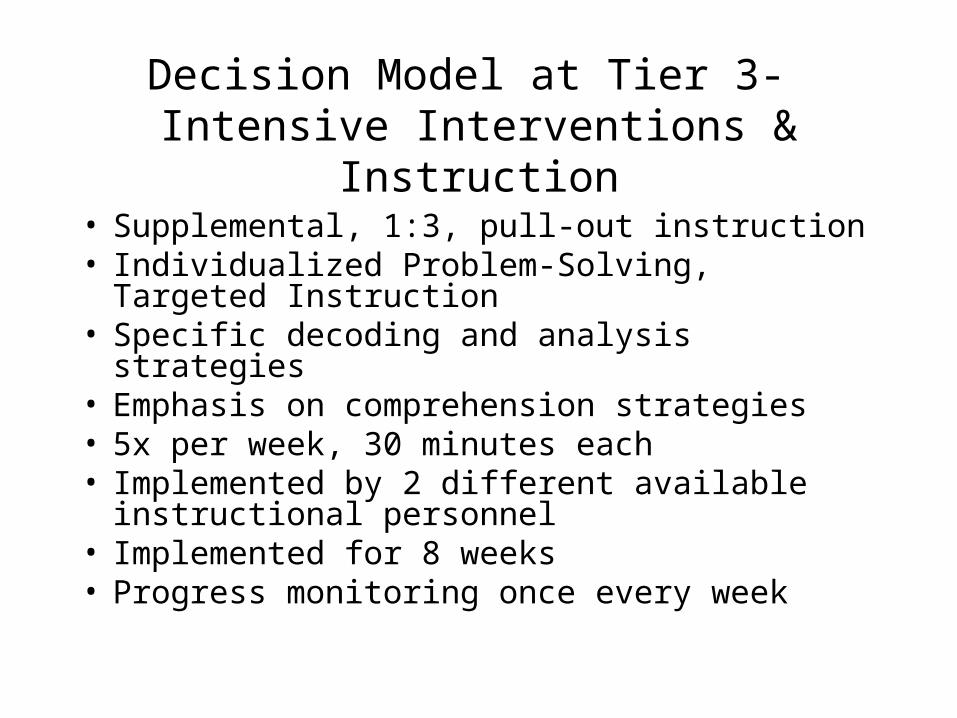
Decision Model at Tier 3- Intensive Interventions & Instruction
• Supplemental, 1:3, pull-out instruction• Individualized Problem-Solving, Targeted
Instruction• Specific decoding and analysis strategies • Emphasis on comprehension strategies• 5x per week, 30 minutes each• Implemented by 2 different available
instructional personnel• Implemented for 8 weeks• Progress monitoring once every week
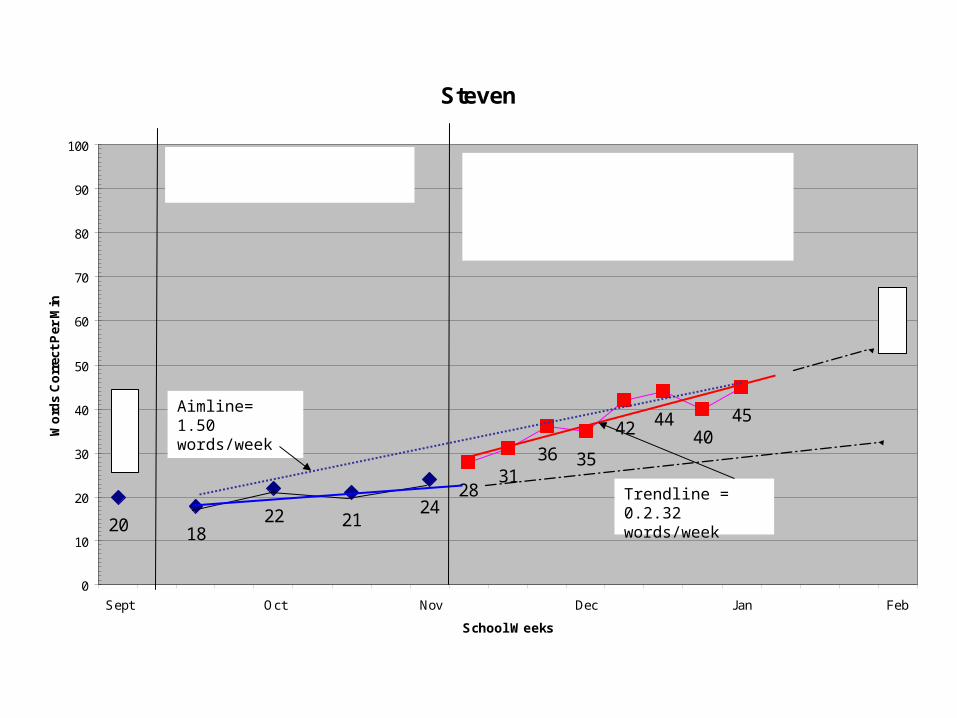
Steven
20 1822 21
2428
3136 35
42 4440
45
0
10
20
30
40
50
60
70
80
90
100
Sept Oct Nov Dec Jan Feb
School Weeks
Wo
rds
Co
rrec
t P
er M
in
Tier 2: Strategic -PALS
Tier 3: Intensive - 1:1 instruction, 5x/week, Problem-solving Model to Target Key Decoding Strategies, Comprehension Strategies
Aimline= 1.50 words/week
Trendline = 0.2.32 words/week
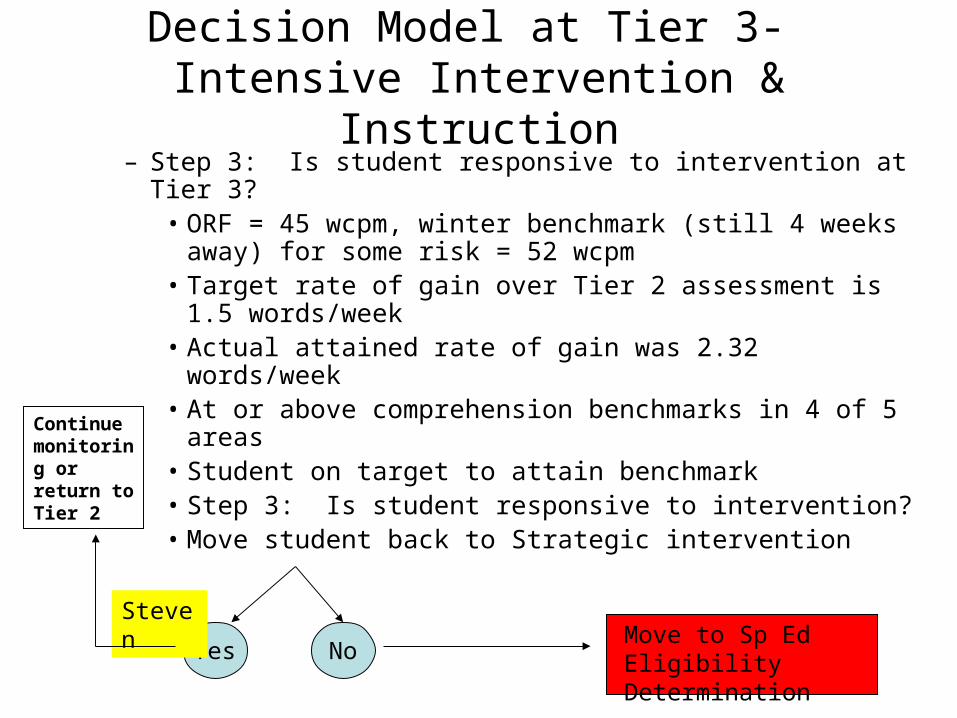
Decision Model at Tier 3- Intensive Intervention & Instruction
– Step 3: Is student responsive to intervention at Tier 3?• ORF = 45 wcpm, winter benchmark (still 4 weeks away)
for some risk = 52 wcpm• Target rate of gain over Tier 2 assessment is 1.5
words/week • Actual attained rate of gain was 2.32 words/week• At or above comprehension benchmarks in 4 of 5 areas• Student on target to attain benchmark• Step 3: Is student responsive to intervention?• Move student back to Strategic intervention
NoYesMove to Sp Ed Eligibility Determination
Steven
Continue monitoring or return to Tier 2

Bart
• Second grade student• Beginning of school year• Regular Education• Scores at 20 wcpm in second grade material• Teacher judges (based on in-class
observation/evaluation) comprehension to not be substantially different from ORF
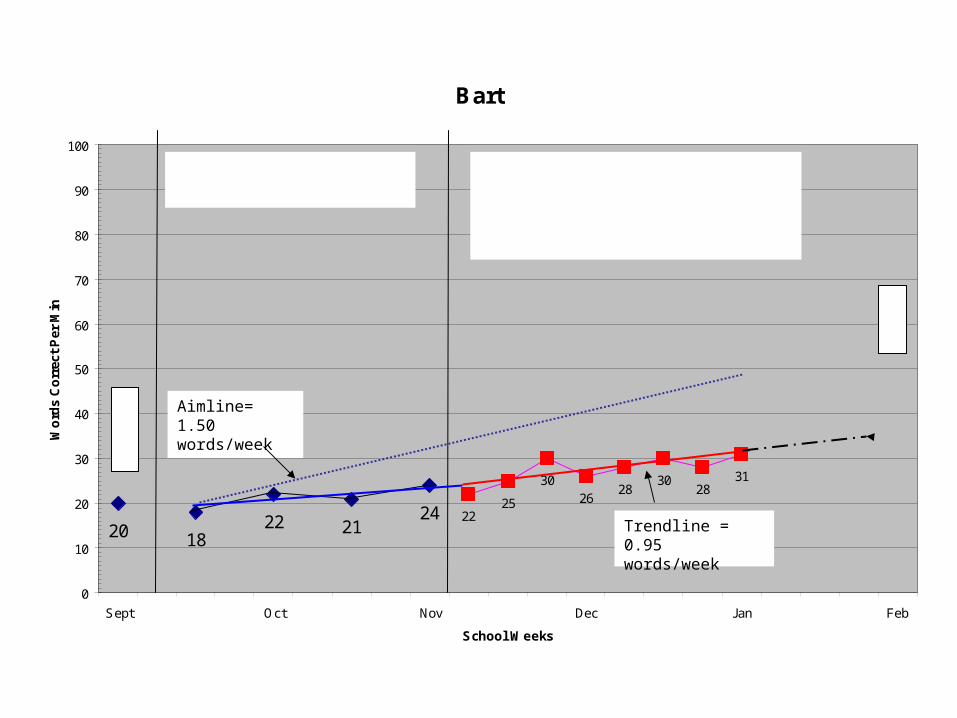
Bart
20 1822 21
24 2225
3026
2830
2831
0
10
20
30
40
50
60
70
80
90
100
Sept Oct Nov Dec Jan Feb
School Weeks
Wo
rds
Co
rrec
t P
er M
in
Tier 2: Strategic -PALS
Tier 3: Intensive - 1:1 instruction, 5x/week, Problem-solving Model to Target Key Decoding Strategies, Comprehension Strategies
Aimline= 1.50 words/week
Trendline = 0.95 words/week

Decision Model at Tier 3- Intensive Intervention & Instruction
– Step 3: Is student responsive to intervention at Tier 3?
• ORF = 31 wcpm, winter benchmark (still 4 weeks away) for some risk = 52 wcpm
• Target rate of gain over Tier 2 assessment is 1.5 words/week
• Actual attained rate of gain was 0.95 words/week• Below comprehension benchmarks in all areas• Student NOT on target to attain benchmark
NoYesMove to Sp Ed Eligibility Determination
Bart
Continue monitoring or return to Tier 2

Behavioral
Case
Examples

Tier 1 ŃUniversal Interventions
25 2328
3540
45
0
10
20
30
40
50
60
70
80
90
100S
ept
Oct
No
v
Dec
Jan
Feb
% C
om
pli
ance
• School-Wide Positive Behavior Support
• Grade Level Social Skill Training
35%
50%
55%
60%
Benchmark75%
= Peer Group
= Target Student
= Aim Line
= Trend Line

25 2328 27
3035
4347
52
0
10
20
30
40
50
60
70
80
90
100S
ep
t
Oc
t
No
v
De
c
Ja
n
Fe
b
% C
om
pli
ance
35%
50%
55%
Benchmark75%
= Peer Group
= Target Student
= Aim Line
= Trend Line
• School-Wide Positive Behavior Support
• Grade Level Social Skill Training
Tier 1 - Universal
65%
• Small Group SST (1X/week)
• Interdependent Group Procedure
Tier 2 - Supplemental
60%

25 2328 27
3035 37 36
41
0
10
20
30
40
50
60
70
80
90
100S
ep
t
Oc
t
No
v
De
c
Ja
n
Fe
b
% C
om
pli
ance
35%
50%
55%
Benchmark75%
= Peer Group
= Target Student
= Aim Line
= Trend Line
65%60
%
• School-Wide Positive Behavior Support
• Grade Level Social Skill Training
Tier 1 - Universal• Small Group SST (1X/week)
• Interdependent Group Procedure
Tier 2 - Supplemental

25 2328 27
3035 37 36
41 40 42 4045
5257
62
0
10
20
30
40
50
60
70
80
90
100S
ep
t
Oc
t
No
v
De
c
Ja
n
Fe
b
% C
om
pli
ance
35%
50%
55%
Benchmark 75%
= Peer Group
= Target Student
= Aim Line
= Trend Line
65%60
%
• School-Wide Positive Behavior Support
• Grade Level Social Skill Training
Tier 1 - Universal• Small Group SST (1X/week)
• Interdependent Group Procedure
Tier 2 - Supplemental• Behavior Intervention Plan (BIP)
• Home-School Notes
• Individual Self-Control Training
Tier 3 - Intensive
80%75
%