Problem Set - Distance-Time Graphs · page 1 Problem Set - Distance-Time Graphs Examine this graph...
2
page 1 Problem Set - Distance-Time Graphs Examine this graph carefully to answer questions 1 and 2. 10 800 0 20 30 40 200 50 400 600 t (s) d(m) B A E D C 1. What is the truck’s displacement from its starting point after: (a) 10 s (b) 15 s (c) 30 s (d) 43 s (e) 50 s 2. What is the truck’s velocity in each of the intervals A through E? A B C D E 3. Describe briefly the kind of motion that is taking place in each of the situations represented by the following displacement vs. time graphs. 0 t (s) d(m) 0 t (s) d(m) 0 t (s) d(m) 4. Describe briefly the motions represented by each of these graphs. If the speed is changing, state whether it is increasing or decreasing. 0 t (s) d(m) 0 t (s) d(m) 0 t (s) d(m) 300 m 300 m 2 oom 66 On Soon 30 mls 0m/s - 10ms 40mA 20Mt a person was running , then a car moving at a constant a cyclist pedals @ constant Speed then suddenly stopping speed then adds foster at constant Starts walking speed , stops , then continues @ constant speed an object Y increasing an object moving forward object Speeding up in the Speed but slowing down . beginning then swing down , them finally stopping
Transcript of Problem Set - Distance-Time Graphs · page 1 Problem Set - Distance-Time Graphs Examine this graph...
page 1
Problem Set - Distance-Time Graphs
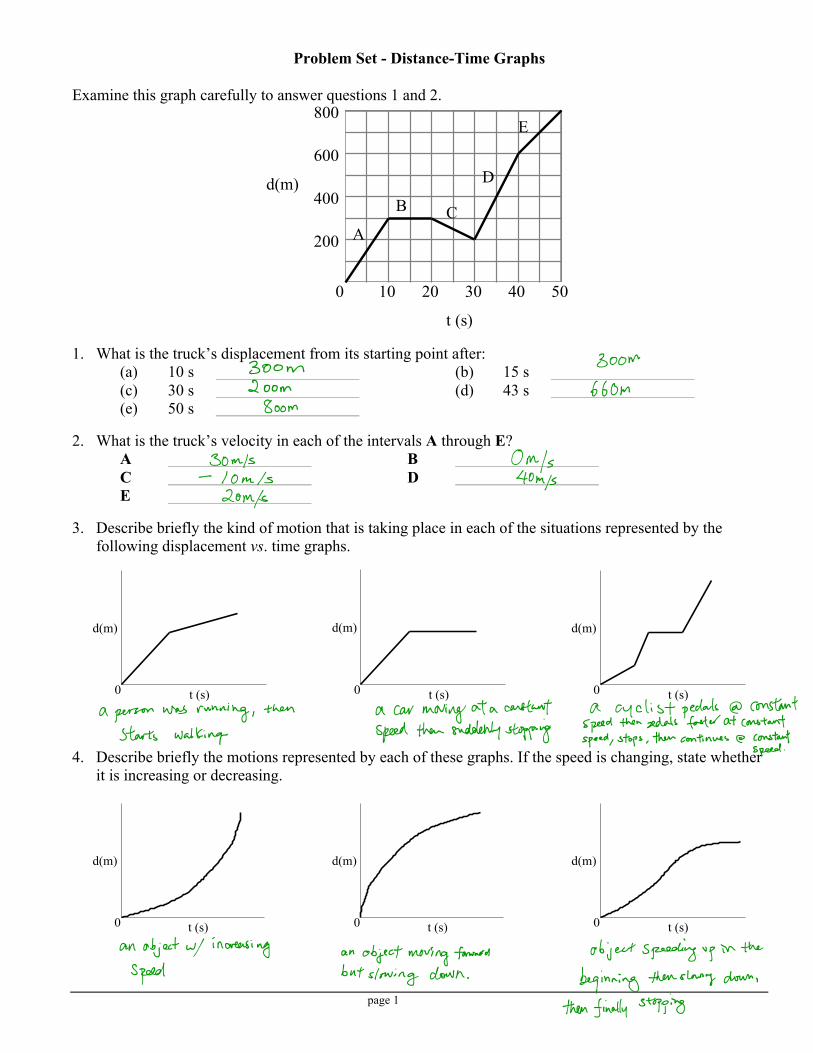
Examine this graph carefully to answer questions 1 and 2.
10
800
0 20 30 40
200
50
400
600
t (s)
d(m)B
A
E
D
C
1. What is the truck’s displacement from its starting point after: (a) 10 s (b) 15 s (c) 30 s (d) 43 s (e) 50 s 2. What is the truck’s velocity in each of the intervals A through E? A B C D E 3. Describe briefly the kind of motion that is taking place in each of the situations represented by the
following displacement vs. time graphs.
0 t (s)
d(m)
0 t (s)
d(m)
0 t (s)
d(m)
4. Describe briefly the motions represented by each of these graphs. If the speed is changing, state whether
it is increasing or decreasing.
0 t (s)
d(m)
0 t (s)
d(m)
0 t (s)
d(m)
300 m300 m
2 oom 66 On
Soon
30 mls 0m/s- 10ms 40mA20Mt
a person was running ,then a car moving at a constant a cyclist pedals @ constant
Speed then suddenly stopping speed then adds foster at constantStarts walking speed , stops ,
then continues @ constantspeed .
an object Y increasing an object moving forward object Speeding up in the
Speed but slowing down. beginning then swing down ,
them finally stopping
page 2
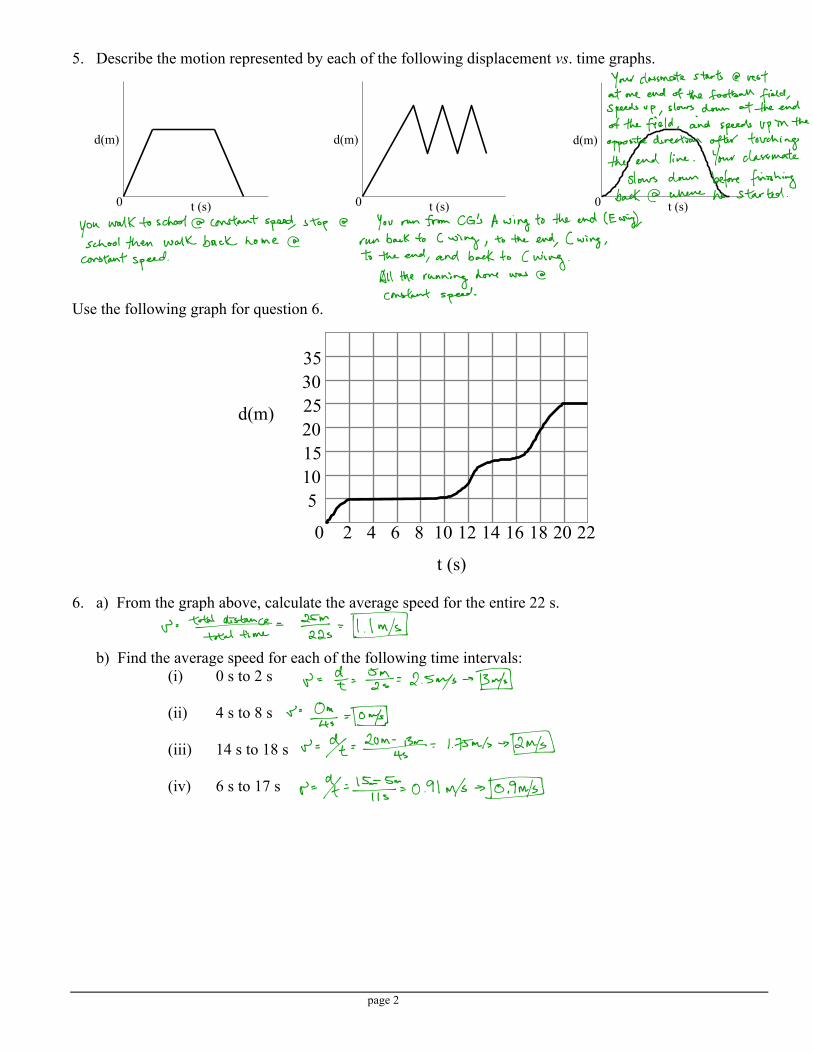
5. Describe the motion represented by each of the following displacement vs. time graphs.
0 t (s)
d(m)
0 t (s)
d(m)
0 t (s)
d(m)
Use the following graph for question 6.
10
35
0 2 124 20
t (s)
d(m)
5
15
25
10
20
30
6 8 14 16 18 22
6. a) From the graph above, calculate the average speed for the entire 22 s.
b) Find the average speed for each of the following time intervals:
(i) 0 s to 2 s
(ii) 4 s to 8 s
(iii) 14 s to 18 s
(iv) 6 s to 17 s
Your dais mate starts @ rest
at one end of the football field ,
Speeds up ,slows
.
down at the end
of the field , and speeds up in the
opposite direction after touchingthe end line .
Your classmate
slows down before finishingback @ where he started .
you walk to school @ Constant speed, stop @ You run from CG 's A wing to the end ( E wind,
school then walk back home @ run back to C wing ,to the end
,( wing ,
constant speed .
to the end, and back to C wing .
All the runningdone was @
Constant speed .
o=tIed¥Ie . Tessking= de .
. 512 : 2.sn/s 134J
s=q÷ .to#
w=%=20mft - 1.754 > HmD
on % .-155¥ , 0.91 m/s |o.9m/J