
Probing DNA shape and methylation state on a genomic scale ... · Probing DNA shape and methylation...
6
Probing DNA shape and methylation state on a genomic scale with DNase I Allan Lazarovici a,b , Tianyin Zhou c,1 , Anthony Shafer d,1 , Ana Carolina Dantas Machado c,1 , Todd R. Riley b,e , Richard Sandstrom d , Peter J. Sabo d , Yan Lu c , Remo Rohs c,2 , John A. Stamatoyannopoulos d,2 , and Harmen J. Bussemaker b,e,2 Departments of a Electrical Engineering and b Biological Sciences, Columbia University, New York, NY 10027; c Molecular and Computational Biology Program, Departments of Biological Sciences, Chemistry, Physics and Astronomy, and Computer Science, University of Southern California, Los Angeles, CA 90089; d Departments of Genome Sciences and Medicine, University of Washington, Seattle, WA 98195; and e Center for Computational Biology and Bioinformatics, Columbia University, New York, NY 10032 Edited by Steven Henikoff, Fred Hutchinson Cancer Research Center, Seattle, WA, and approved February 13, 2013 (received for review October 15, 2012) DNA binding proteins find their cognate sequences within genomic DNA through recognition of specific chemical and structural features. Here we demonstrate that high-resolution DNase I cleavage profiles can provide detailed information about the shape and chemical modification status of genomic DNA. Analyzing millions of DNA backbone hydrolysis events on naked genomic DNA, we show that the intrinsic rate of cleavage by DNase I closely tracks the width of the minor groove. Integration of these DNase I cleavage data with bisulfite sequencing data for the same cell type’s genome reveals that cleavage directly adjacent to cytosine-phosphate-guanine (CpG) dinucleotides is enhanced at least eightfold by cytosine methylation. This phenomenon we show to be attributable to methylation- induced narrowing of the minor groove. Furthermore, we demon- strate that it enables simultaneous mapping of DNase I hypersen- sitivity and regional DNA methylation levels using dense in vivo cleavage data. Taken together, our results suggest a general mech- anism by which CpG methylation can modulate protein–DNA inter- action strength via the remodeling of DNA shape. deoxyribonuclease I | DNA minor groove | functional genomics | protein-DNA recognition | 5-methylcytosine D Nase I is an endonuclease that cleaves the backbone of dou- ble-stranded DNA. It approximates the size and nuclear dif- fusion properties of a typical human transcription factor (TF) (1). The enzyme interacts with DNA via the minor groove (2), where it recognizes approximately six consecutive base pairs (3). In addition to its nearly ubiquitous use in the removal of DNA from cellular extracts, DNase I has been widely used as a structural probe of in vitro and in vivo DNA and chromatin structure (4, 5), and to map regulatory DNA in the human and other genomes (6–9). The in- teraction of DNase I with specific DNA sequences can be abro- gated through steric hindrance by DNA binding proteins, leading to its widespread use as a reagent for studying TF binding (10, 11). One of the best studied DNA modifications is the methylation of cytosines at position 5 of the pyrimidine ring. This covalent modi- fication, in the context of a CpG dinucleotide, can be found in eukaryotes from plants to humans and is observed on over 70% of CpGs in vertebrate DNA (12, 13). The patterns of methylation can be dynamic (14), can vary between cell lines and in the course of developmental processes, and therefore provide a mechanism for the generation of epigenetic variation at the level of the primary DNA sequence (12). The biological contribution of DNA methyl- ation is both significant and complex. First and foremost, CpG methylation has been linked to transcriptional silencing at pro- moters of genes on the inactive X chromosome, on imprinted loci and genes rendered inactive in cancers (13). Moreover, gene si- lencing may be mediated by the recruitment of repressor proteins by methyl CpG binding proteins to promoters (15), or by interference with TF action. Notably, however, some CpG-containing promoters can be both methylated and transcriptionally active (16, 17). How DNA methylation affects the binding of transcriptional regulators is currently unknown. It has long been speculated that steric occlusion by a bulky methyl group of the cognate recognition sequence of a TF could affect its binding affinity (18). However, this putative mechanism leaves various observa- tions unaccounted for. For instance, some TFs interact with the major groove, yet are not affected by DNA methylation despite the extra methyl group protruding in the major groove. Other TFs interact with the minor groove, yet are affected by DNA methylation. Increased TF occupancy upon DNA methylation within their recognition sites has also been observed (19). An explanation for these phenomena might be found in the 3D structure of DNA (20). We recently showed that DNA shape plays an important role in protein–DNA recognition (21–24). TFs can form direct and specific contacts with functional groups of the bases in the major groove. This base readout mechanism, however, does not suffice for the minor groove, where instead subtle sequence- dependent variation in DNA shape is read out by charged amino acid side chains via local variation in electrostatic potential (22, 25). Here, we expand this line of thought by analyzing the impact of adding a bulky methyl group in the major groove on the geometry of the minor groove. DNase I is an ideal molecule for asking this question, as it exclusively interacts with DNA via the minor groove. Under standard conditions, successful molecular recognition of double-stranded DNA by DNase I leaves a permanent record in the form of hydrolysis of the O3′-P bond between the phosphorus and the oxygen attached to the 3′ carbon of the deoxyribose sugar within one of the strands of the recognition sequence (26). We reasoned that massively parallel sequencing could be applied to characterize millions of such events in a single experiment, enabling precise reconstruction of the sequence features that influence this interaction with the genome in vivo. Indeed, as described below, we find that the intrinsic DNase I cleavage rate varies over three orders of magnitude with immediate hexamer context. Existing cocrystal structures of the DNase I–DNA complex reveal that DNase I docks in the minor groove of DNA (2). It has previously been suggested that sequence dependencies in DNase I cleavage rate might reflect differences in DNA shape, and specifically the configuration of the minor groove (27). Two separate studies have previously used autoradiogram data from DNase I digestions of a small number of end-labeled DNA fragments to quantify the sequence preferences of DNase I (28, 29). Their respective models, however, showed little correlation (29), and consequently the details of the intrinsic specificity of DNase I remained elusive when we began our study. Author contributions: A.L., T.Z., T.R.R., R.R., J.A.S., and H.J.B. designed research; A.L., T.Z., A.S., A.C.D.M., T.R.R., R.S., P.J.S., and Y.L. performed research; A.L., T.Z., A.C.D.M., Y.L., R.R., J.A.S., and H.J.B. analyzed data; and A.L., R.R., J.A.S., and H.J.B. wrote the paper. The authors declare no conflict of interest. This article is a PNAS Direct Submission. Freely available online through the PNAS open access option. 1 T.Z., A.S., and A.C.D.M. contributed equally to this work. 2 To whom correspondence may be addressed. E-mail: [email protected], [email protected], or [email protected]. This article contains supporting information online at www.pnas.org/lookup/suppl/doi:10. 1073/pnas.1216822110/-/DCSupplemental. 6376–6381 | PNAS | April 16, 2013 | vol. 110 | no. 16 www.pnas.org/cgi/doi/10.1073/pnas.1216822110 Downloaded by guest on May 22, 2020
Transcript of Probing DNA shape and methylation state on a genomic scale ... · Probing DNA shape and methylation...

Probing DNA shape and methylation stateon a genomic scale with DNase IAllan Lazarovicia,b, Tianyin Zhouc,1, Anthony Shaferd,1, Ana Carolina Dantas Machadoc,1, Todd R. Rileyb,e,Richard Sandstromd, Peter J. Sabod, Yan Luc, Remo Rohsc,2, John A. Stamatoyannopoulosd,2,and Harmen J. Bussemakerb,e,2
Departments of aElectrical Engineering and bBiological Sciences, Columbia University, New York, NY 10027; cMolecular and Computational Biology Program,Departments of Biological Sciences, Chemistry, Physics and Astronomy, and Computer Science, University of Southern California, Los Angeles, CA 90089;dDepartments of Genome Sciences and Medicine, University of Washington, Seattle, WA 98195; and eCenter for Computational Biology and Bioinformatics,Columbia University, New York, NY 10032
Edited by Steven Henikoff, Fred Hutchinson Cancer Research Center, Seattle, WA, and approved February 13, 2013 (received for review October 15, 2012)
DNA binding proteins find their cognate sequences within genomicDNA through recognitionof specific chemical and structural features.Here we demonstrate that high-resolution DNase I cleavage profilescan provide detailed information about the shape and chemicalmodification status of genomic DNA. Analyzing millions of DNAbackbone hydrolysis events on naked genomic DNA, we show thatthe intrinsic rate of cleavage by DNase I closely tracks the width ofthe minor groove. Integration of these DNase I cleavage data withbisulfite sequencing data for the same cell type’s genome revealsthat cleavage directly adjacent to cytosine-phosphate-guanine (CpG)dinucleotides is enhanced at least eightfold by cytosinemethylation.This phenomenon we show to be attributable to methylation-induced narrowing of the minor groove. Furthermore, we demon-strate that it enables simultaneous mapping of DNase I hypersen-sitivity and regional DNA methylation levels using dense in vivocleavage data. Taken together, our results suggest a general mech-anism by which CpGmethylation can modulate protein–DNA inter-action strength via the remodeling of DNA shape.
deoxyribonuclease I | DNA minor groove | functional genomics |protein-DNA recognition | 5-methylcytosine
DNase I is an endonuclease that cleaves the backbone of dou-ble-stranded DNA. It approximates the size and nuclear dif-
fusion properties of a typical human transcription factor (TF) (1).The enzyme interacts with DNA via the minor groove (2), where itrecognizes approximately six consecutive base pairs (3). In additionto its nearly ubiquitous use in the removal of DNA from cellularextracts, DNase I has been widely used as a structural probe of invitro and in vivo DNA and chromatin structure (4, 5), and to mapregulatory DNA in the human and other genomes (6–9). The in-teraction of DNase I with specific DNA sequences can be abro-gated through steric hindrance by DNA binding proteins, leadingto its widespread use as a reagent for studying TF binding (10, 11).One of the best studied DNA modifications is the methylation of
cytosines at position 5 of the pyrimidine ring. This covalent modi-fication, in the context of a CpG dinucleotide, can be found ineukaryotes from plants to humans and is observed on over 70% ofCpGs in vertebrate DNA (12, 13). The patterns of methylation canbe dynamic (14), can vary between cell lines and in the course ofdevelopmental processes, and therefore provide a mechanism forthe generation of epigenetic variation at the level of the primaryDNA sequence (12). The biological contribution of DNA methyl-ation is both significant and complex. First and foremost, CpGmethylation has been linked to transcriptional silencing at pro-moters of genes on the inactive X chromosome, on imprinted lociand genes rendered inactive in cancers (13). Moreover, gene si-lencing may be mediated by the recruitment of repressor proteins bymethyl CpG binding proteins to promoters (15), or by interferencewith TF action. Notably, however, some CpG-containing promoterscan be both methylated and transcriptionally active (16, 17).How DNA methylation affects the binding of transcriptional
regulators is currently unknown. It has long been speculated thatsteric occlusion by a bulky methyl group of the cognate
recognition sequence of a TF could affect its binding affinity(18). However, this putative mechanism leaves various observa-tions unaccounted for. For instance, some TFs interact with themajor groove, yet are not affected by DNA methylation despitethe extra methyl group protruding in the major groove. OtherTFs interact with the minor groove, yet are affected by DNAmethylation. Increased TF occupancy upon DNA methylationwithin their recognition sites has also been observed (19).An explanation for these phenomena might be found in the 3D
structure of DNA (20). We recently showed that DNA shape playsan important role in protein–DNA recognition (21–24). TFs canform direct and specific contacts with functional groups of the basesin the major groove. This base readout mechanism, however, doesnot suffice for the minor groove, where instead subtle sequence-dependent variation in DNA shape is read out by charged aminoacid side chains via local variation in electrostatic potential (22, 25).Here, we expand this line of thought by analyzing the impact ofadding a bulky methyl group in the major groove on the geometryof the minor groove. DNase I is an ideal molecule for asking thisquestion, as it exclusively interacts with DNA via the minor groove.Under standard conditions, successful molecular recognition of
double-stranded DNA by DNase I leaves a permanent record inthe form of hydrolysis of the O3′-P bond between the phosphorusand the oxygen attached to the 3′ carbon of the deoxyribose sugarwithin one of the strands of the recognition sequence (26). Wereasoned that massively parallel sequencing could be applied tocharacterize millions of such events in a single experiment, enablingprecise reconstruction of the sequence features that influence thisinteraction with the genome in vivo. Indeed, as described below, wefind that the intrinsic DNase I cleavage rate varies over three ordersof magnitude with immediate hexamer context.Existing cocrystal structures of the DNase I–DNA complex
reveal that DNase I docks in the minor groove of DNA (2). It haspreviously been suggested that sequence dependencies in DNaseI cleavage rate might reflect differences in DNA shape, andspecifically the configuration of the minor groove (27). Twoseparate studies have previously used autoradiogram data fromDNase I digestions of a small number of end-labeled DNAfragments to quantify the sequence preferences of DNase I (28,29). Their respective models, however, showed little correlation(29), and consequently the details of the intrinsic specificity ofDNase I remained elusive when we began our study.
Author contributions: A.L., T.Z., T.R.R., R.R., J.A.S., and H.J.B. designed research; A.L., T.Z.,A.S., A.C.D.M., T.R.R., R.S., P.J.S., and Y.L. performed research; A.L., T.Z., A.C.D.M., Y.L.,R.R., J.A.S., and H.J.B. analyzed data; and A.L., R.R., J.A.S., and H.J.B. wrote the paper.
The authors declare no conflict of interest.
This article is a PNAS Direct Submission.
Freely available online through the PNAS open access option.1T.Z., A.S., and A.C.D.M. contributed equally to this work.2Towhom correspondence may be addressed. E-mail: [email protected], [email protected],or [email protected].
This article contains supporting information online at www.pnas.org/lookup/suppl/doi:10.1073/pnas.1216822110/-/DCSupplemental.
6376–6381 | PNAS | April 16, 2013 | vol. 110 | no. 16 www.pnas.org/cgi/doi/10.1073/pnas.1216822110
Dow
nloa
ded
by g
uest
on
May
22,
202
0
Since cytosine methylation covalently alters DNA, it may alsoinfluence DNase I cleavage rate. Here we show that integratingDNase I cleavage data with bisulfite sequencing data for genomicDNA purified from the same cell type reveals marked (>eight-fold) enhancement of DNA backbone cleavage directly adjacentto CpG dinucleotides. Many TFs derive part of their DNAbinding specificity from interactions with the minor groove. NMRstudies have previously shown that a CpG dinucleotide flanked byA-tracts undergoes a severe narrowing at its center (30). By ex-amining the effect of CpG methylation on DNA geometry forhundreds of sequence contexts, our results provide a specificstructural mechanism that may explain how DNA methylationaffects regulatory factor binding and gene expression.
Results and DiscussionData Generation. To quantify the sequence sensitivity spectrum ofDNase I cleavage, we digested purified, deproteinated DNAfrom human fibroblast (IMR90) cells to an average size of ∼300bp using DNase I (SI Methods). DNA fragment ends were re-solved to the nearest 3′-strand cleavage through end repair (SIMethods) and sequencing adapter ligation. We then obtained 15million single-end 36 bp Illumina sequence reads and mappedthese to the human genome sequence, discarding any reads thatdid not map to unique genomic positions. This provided us witha large sample of individual, nucleotide-resolution cleavageevents across the genome (SRA accession SRX247626).
Modeling Intrinsic DNase I Specificity Reveals Strong SequencePreferences.We next developed a model that quantifies the relativerate of cleavage by DNase I in terms of local DNA sequencecontext. We first asked over what spatial range of nucleotide
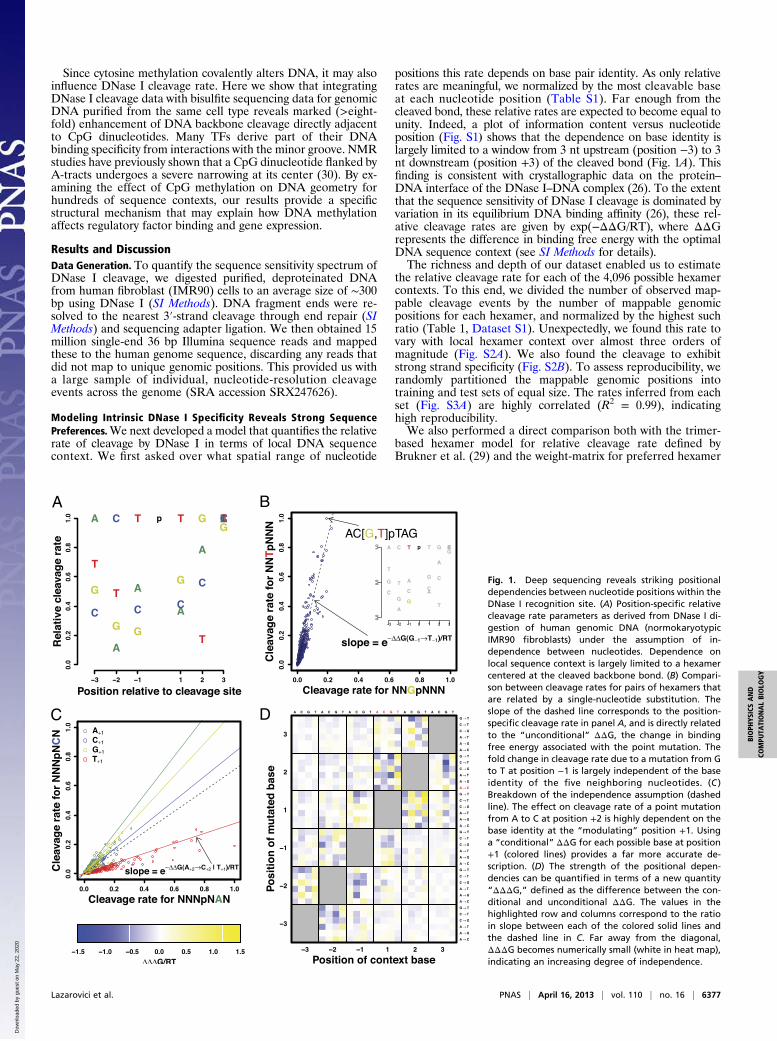
positions this rate depends on base pair identity. As only relativerates are meaningful, we normalized by the most cleavable baseat each nucleotide position (Table S1). Far enough from thecleaved bond, these relative rates are expected to become equal tounity. Indeed, a plot of information content versus nucleotideposition (Fig. S1) shows that the dependence on base identity islargely limited to a window from 3 nt upstream (position −3) to 3nt downstream (position +3) of the cleaved bond (Fig. 1A). Thisfinding is consistent with crystallographic data on the protein–DNA interface of the DNase I–DNA complex (26). To the extentthat the sequence sensitivity of DNase I cleavage is dominated byvariation in its equilibrium DNA binding affinity (26), these rel-ative cleavage rates are given by exp(−ΔΔG/RT), where ΔΔGrepresents the difference in binding free energy with the optimalDNA sequence context (see SI Methods for details).The richness and depth of our dataset enabled us to estimate
the relative cleavage rate for each of the 4,096 possible hexamercontexts. To this end, we divided the number of observed map-pable cleavage events by the number of mappable genomicpositions for each hexamer, and normalized by the highest suchratio (Table 1, Dataset S1). Unexpectedly, we found this rate tovary with local hexamer context over almost three orders ofmagnitude (Fig. S2A). We also found the cleavage to exhibitstrong strand specificity (Fig. S2B). To assess reproducibility, werandomly partitioned the mappable genomic positions intotraining and test sets of equal size. The rates inferred from eachset (Fig. S3A) are highly correlated (R2 = 0.99), indicatinghigh reproducibility.We also performed a direct comparison both with the trimer-
based hexamer model for relative cleavage rate defined byBrukner et al. (29) and the weight-matrix for preferred hexamer
A B
C D
Fig. 1. Deep sequencing reveals striking positionaldependencies between nucleotide positions within theDNase I recognition site. (A) Position-specific relativecleavage rate parameters as derived from DNase I di-gestion of human genomic DNA (normokaryotypicIMR90 fibroblasts) under the assumption of in-dependence between nucleotides. Dependence onlocal sequence context is largely limited to a hexamercentered at the cleaved backbone bond. (B) Compari-son between cleavage rates for pairs of hexamers thatare related by a single-nucleotide substitution. Theslope of the dashed line corresponds to the position-specific cleavage rate in panel A, and is directly relatedto the “unconditional” ΔΔG, the change in bindingfree energy associated with the point mutation. Thefold change in cleavage rate due to a mutation from Gto T at position −1 is largely independent of the baseidentity of the five neighboring nucleotides. (C )Breakdown of the independence assumption (dashedline). The effect on cleavage rate of a point mutationfrom A to C at position +2 is highly dependent on thebase identity at the “modulating” position +1. Usinga “conditional” ΔΔG for each possible base at position+1 (colored lines) provides a far more accurate de-scription. (D) The strength of the positional depen-dencies can be quantified in terms of a new quantity“ΔΔΔG,” defined as the difference between the con-ditional and unconditional ΔΔG. The values in thehighlighted row and columns correspond to the ratioin slope between each of the colored solid lines andthe dashed line in C. Far away from the diagonal,ΔΔΔG becomes numerically small (white in heat map),indicating an increasing degree of independence.
Lazarovici et al. PNAS | April 16, 2013 | vol. 110 | no. 16 | 6377
BIOPH
YSICSAND
COMPU
TATIONALBIOLO
GY
Dow
nloa
ded
by g
uest
on
May
22,
202
0

contexts defined by Herrera and Chaires (28). Reassuringly, wefind rather good agreement between our hexamer-level cleavagerate table and the model of Herrera and Chaires (R2 = 0.54). In-terestingly, Brukner et al. (29) reported that their model showedlittle correlation with that of Herrera and Chaires (28). Our ownanalysis confirms this (R2 = 0.01). We also observe low correlationbetween Brukner’s trimer-based predictions and our model (R2 =0.01). A plausible explanation is that the model of Brukner et al.(29) alone assumes reverse-complement symmetry, whereas wefind our tables to be strongly strand-specific (R2 = 0.33 whencomparing forward hexamers with their reverse complement).
Dissecting Dependencies Between Nucleotide Positions. Analysis ofposition-specific cleavage rates for each recognized hexamerrevealed significant dependencies between nucleotide positions(Fig. S3B). In some cases, single-nucleotide variations in thehexamer sequence behaved independently. For example, in Fig.1B, a single parameter (the slope of the dashed line) suffices tosummarize all 45 different point mutations of type NNTjNNN→NNGjNNN (with the mutated base in bold and the site ofcleavage indicated). However, most sensitivity to sequence variationwas highly interdependent. Fig. 1C shows that for the substitutionA+2→C+2 a single slope (dashed line) does not suffice to summarizeits effect on cleavage rate. Rather, there are two distinct diagonals,with different slopes. The points on the lower diagonal can beperfectly demarcated by the occurrence of a T at the modulatingposition +1 (Fig. 1C). As expected, the strength of the dependencybetween the mutated and modulating position—quantified here asthe difference, “ΔΔΔG,” between the conditional and uncon-ditional ΔΔG values—tends to be largest when these positions areadjacent (Fig. 1D, Fig. S4 A and B). Still, dependencies of highstatistical significance can be detected throughout the binding site(Fig. S5), underscoring the power of the massive sequencesampling approach.
Minor Groove Width Profile Is Predictive of DNase I Cleavage Rate.The positional dependencies identified above hinted at the im-portance of 3D DNA structure. Indeed DNase I is known tointeract with the minor groove of DNA (2, 26). We thereforeasked whether a quantitative relationship exists between minorgroove width (MGW) and cleavage rate. To this end, we useda high-throughput (HT) approach that can predict MGW at thecenter of any pentanucleotide to predict MGW across all sixnucleotide positions for each of the 46 possible hexamers. Thismodel was derived from a database of Monte Carlo (MC) sim-ulations for a large number of free DNA sequences (see SIMethods for details). Since the hexamers occur as part of longerdouble-stranded DNA sequences, we accounted for the influenceof flanking sequence by averaging over all possible ways ofadding a dinucleotide flank on each side. We used a base-pair–
centric coordinate system in which the MGW at position +1 ismeasured between the phosphate group connecting the +2 and +3nucleosides on the forward strand and that connecting the −2 and−1 position on the reverse strand, etc.To assess to what extent the variation in DNA shape might ex-
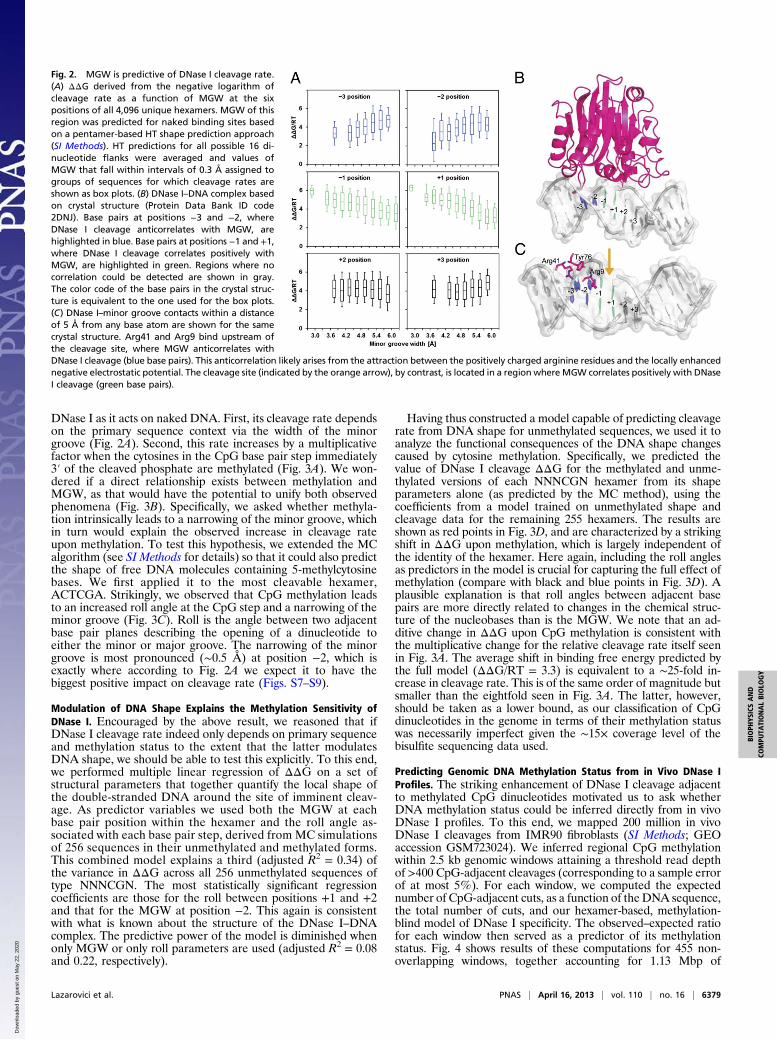
plain the observed variation in DNase I cleavage rate, we firstplotted the negative of the logarithm of the relative DNase Icleavage rate as a function of MGW at each base pair position. Weinterpret this negative logarithm as a binding free energy differenceΔΔG between a given sequence and the optimal sequence forDNase I cleavage. This analysis revealed a clear partitioning of thehexamer into three parts (Fig. 2A): at positions−3 and−2 a narrowminor groove is highly significantly associated with higher cleavagerate (with the t values measuring the regression coefficient in unitsof its SE equal to +19.8 and +15.1, respectively); at positions−1 and +1 this relationship is reversed but still highly significant(t values −15.6 and −26.3); at positions +2 and +3 a less strongassociation is observed (t values −6.0 and +6.4). The spatial profileof correlation between MGW and DNase I cleavage rate is con-sistent with features of a crystal structure of a complex of DNase Iwith a nickedDNAoctamer duplex (31) (Fig. 2B). In that structure,an arginine, Arg41, from DNase I can be seen to interact with theminor groove near the −3 position, while a second arginine, Arg9,contacts the minor groove between the −2 and −1 positions (Fig.2C). The narrower the minor groove is in the 5′ region of thehexamer at the −3 and −2 positions, the higher the cleavage rate is.The relationship between MGW and DNase I cleavage rate
indicates a recognition mechanism similar to the recently de-scribed binding of arginine residues to narrow regions of theminor groove (23). Such minor groove shape readout is based onthe enhancement of negative electrostatic potential in narrowgroove regions, which in turn allows for a stronger interactionwith positively charged arginine residues (22). The increase inDNase I cleavage rate with narrowing of the minor groove islikely to be based on the attraction of the two arginine sidechains through such locally enhanced negative electrostatic po-tential. The opposite sign of the correlation between MGW andcleavage rate at the −1 and +1 positions (Fig. 2A) also makesstructural sense. Earlier reports have shown that the phospho-diester backbone at purine–pyrimidine (RpY) dinucleotides,which intrinsically widen the minor groove, are cleaved by DNaseI at higher rates (32, 33). Having a widened minor groove wherethe backbone is cleaved would thus seem to be beneficial (34).
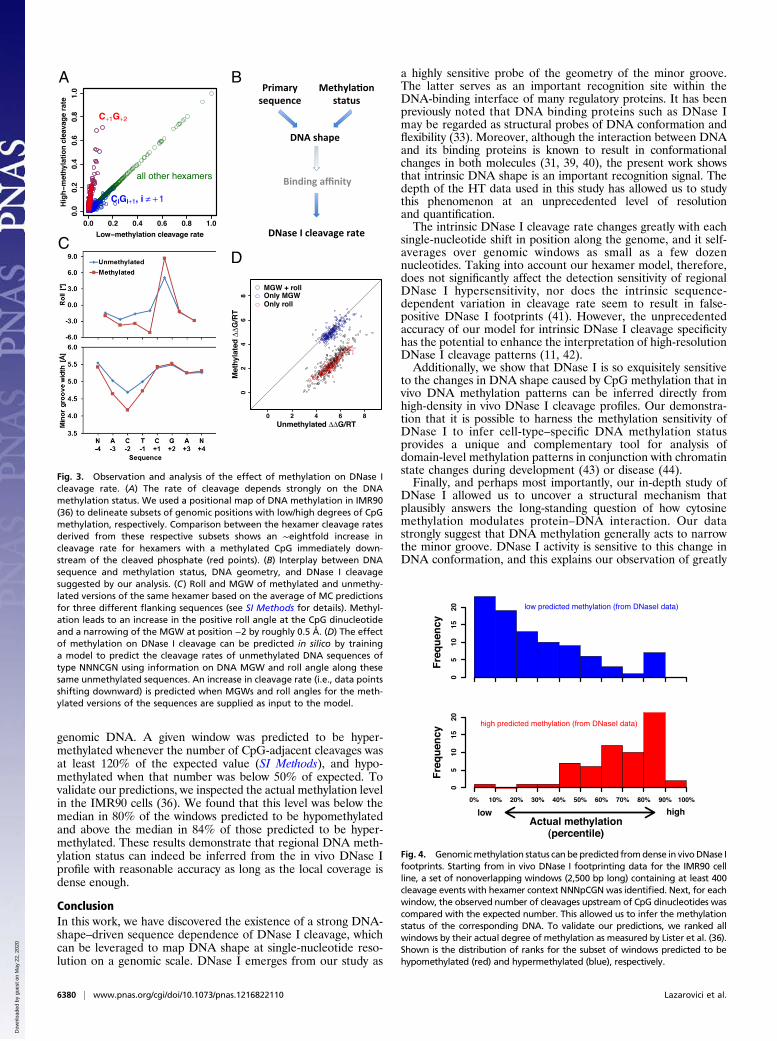
CpG Methylation Greatly Enhances Adjacent DNase I Cleavage. Theresults above indicate that molecular recognition of DNA byDNase I is subject to significant dependencies between nucleotides,consistent with readout of specific features of DNA shape (29).Since DNA methylation has the potential to alter the structuralproperties of DNA (35), we sought to analyze the influence ofmethylation on protein–DNA binding. To this end, we used whole-genome shotgun bisulfite sequencing data obtained from IMR90cells (36) to define two subsets of phosphate positions, with hex-amer contexts containing only hypermethylated or only hypo-methylated CpG dinucleotides (SI Methods). Direct comparison ofcleavage rates between both sets revealed a striking dependency onmethylation status for a subset of the hexamers (Fig. 3A). A sys-tematic search for DNA sequence features that could explain thisdependency (Fig. S6) revealed that it is almost completelyexplained by the occurrence of a CpG dinucleotide immediatelydownstream of the cleaved bond (Fig. 3A). Upon methylation ofthe two cytosines within the C+1G+2 base pair step, the rate ofcleavage byDNase I is enhanced∼eightfold (red points in Fig. 3A),and for the most cleavable CpG-containing hexamer (ACTjCGA)increases from ∼7% to ∼68% of the maximum. Our findings areconsistent with, but greatly extend, an earlier observation thatmethylation of the central cytosine in the sequence GCGC rendersthe 5′ phosphate more susceptible to cleavage by DNase I (37, 38).
CpG Methylation Narrows the Minor Groove at Adjacent Positions. Sofar, we have described two independent observations regarding
Table 1. Hexamer-based model of relative DNase I cleavagerate
Hexamer Observed cuts Genomic position Ratio Scaled ratio
ACTpTAG 90,964 1,092,889 0.08323 1.00000ACTpTGT 99,223 1,284,748 0.07723 0.92790ACTpTGG 91,281 1,360,831 0.06708 0.80590ACTpTAA 119,341 1,840,040 0.06486 0.77924TCTpTAG 85,512 1,335,788 0.06402 0.76912
CGGpTTT 10 201,805 0.00005 0.00060CGCpGCG 3 81,371 0.00004 0.00044GACpGCG 0 49,356 0.00000 0.00000
For each subclass of phosphates, as defined by the sequence of a hexamerwindow centered at each phosphate, the total number of cleavage eventsand the total number of mappable genomic positions were determined.Ratios of these counts were then taken and scaled to a maximum of unityfor the most cleavable hexamer.
6378 | www.pnas.org/cgi/doi/10.1073/pnas.1216822110 Lazarovici et al.
Dow
nloa
ded
by g
uest
on
May
22,
202
0
DNase I as it acts on naked DNA. First, its cleavage rate dependson the primary sequence context via the width of the minorgroove (Fig. 2A). Second, this rate increases by a multiplicativefactor when the cytosines in the CpG base pair step immediately3′ of the cleaved phosphate are methylated (Fig. 3A). We won-dered if a direct relationship exists between methylation andMGW, as that would have the potential to unify both observedphenomena (Fig. 3B). Specifically, we asked whether methyla-tion intrinsically leads to a narrowing of the minor groove, whichin turn would explain the observed increase in cleavage rateupon methylation. To test this hypothesis, we extended the MCalgorithm (see SI Methods for details) so that it could also predictthe shape of free DNA molecules containing 5-methylcytosinebases. We first applied it to the most cleavable hexamer,ACTCGA. Strikingly, we observed that CpG methylation leadsto an increased roll angle at the CpG step and a narrowing of theminor groove (Fig. 3C). Roll is the angle between two adjacentbase pair planes describing the opening of a dinucleotide toeither the minor or major groove. The narrowing of the minorgroove is most pronounced (∼0.5 Å) at position −2, which isexactly where according to Fig. 2A we expect it to have thebiggest positive impact on cleavage rate (Figs. S7–S9).
Modulation of DNA Shape Explains the Methylation Sensitivity ofDNase I. Encouraged by the above result, we reasoned that ifDNase I cleavage rate indeed only depends on primary sequenceand methylation status to the extent that the latter modulatesDNA shape, we should be able to test this explicitly. To this end,we performed multiple linear regression of ΔΔG on a set ofstructural parameters that together quantify the local shape ofthe double-stranded DNA around the site of imminent cleav-age. As predictor variables we used both the MGW at eachbase pair position within the hexamer and the roll angle as-sociated with each base pair step, derived from MC simulationsof 256 sequences in their unmethylated and methylated forms.This combined model explains a third (adjusted R2 = 0.34) ofthe variance in ΔΔG across all 256 unmethylated sequences oftype NNNCGN. The most statistically significant regressioncoefficients are those for the roll between positions +1 and +2and that for the MGW at position −2. This again is consistentwith what is known about the structure of the DNase I–DNAcomplex. The predictive power of the model is diminished whenonly MGW or only roll parameters are used (adjusted R2 = 0.08and 0.22, respectively).
Having thus constructed a model capable of predicting cleavagerate from DNA shape for unmethylated sequences, we used it toanalyze the functional consequences of the DNA shape changescaused by cytosine methylation. Specifically, we predicted thevalue of DNase I cleavage ΔΔG for the methylated and unme-thylated versions of each NNNCGN hexamer from its shapeparameters alone (as predicted by the MC method), using thecoefficients from a model trained on unmethylated shape andcleavage data for the remaining 255 hexamers. The results areshown as red points in Fig. 3D, and are characterized by a strikingshift in ΔΔG upon methylation, which is largely independent ofthe identity of the hexamer. Here again, including the roll anglesas predictors in the model is crucial for capturing the full effect ofmethylation (compare with black and blue points in Fig. 3D). Aplausible explanation is that roll angles between adjacent basepairs are more directly related to changes in the chemical struc-ture of the nucleobases than is the MGW. We note that an ad-ditive change in ΔΔG upon CpG methylation is consistent withthe multiplicative change for the relative cleavage rate itself seenin Fig. 3A. The average shift in binding free energy predicted bythe full model (ΔΔG/RT = 3.3) is equivalent to a ∼25-fold in-crease in cleavage rate. This is of the same order of magnitude butsmaller than the eightfold seen in Fig. 3A. The latter, however,should be taken as a lower bound, as our classification of CpGdinucleotides in the genome in terms of their methylation statuswas necessarily imperfect given the ∼15× coverage level of thebisulfite sequencing data used.
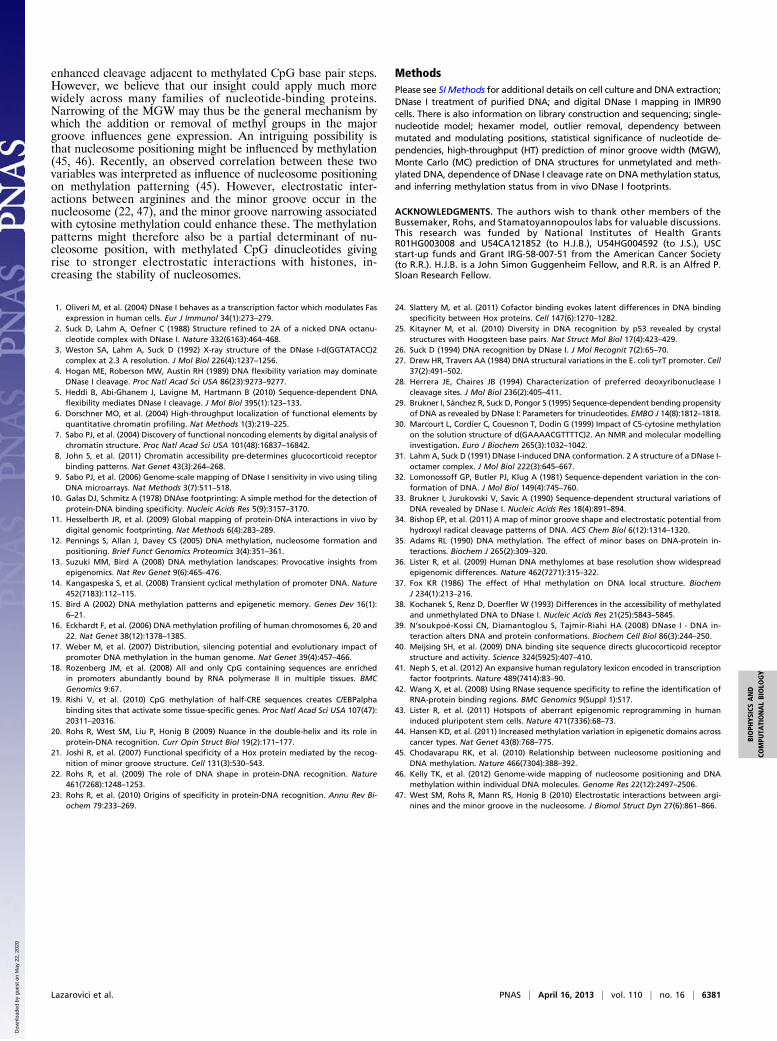
Predicting Genomic DNA Methylation Status from in Vivo DNase IProfiles. The striking enhancement of DNase I cleavage adjacentto methylated CpG dinucleotides motivated us to ask whetherDNA methylation status could be inferred directly from in vivoDNase I profiles. To this end, we mapped 200 million in vivoDNase I cleavages from IMR90 fibroblasts (SI Methods; GEOaccession GSM723024). We inferred regional CpG methylationwithin 2.5 kb genomic windows attaining a threshold read depthof >400 CpG-adjacent cleavages (corresponding to a sample errorof at most 5%). For each window, we computed the expectednumber of CpG-adjacent cuts, as a function of theDNA sequence,the total number of cuts, and our hexamer-based, methylation-blind model of DNase I specificity. The observed–expected ratiofor each window then served as a predictor of its methylationstatus. Fig. 4 shows results of these computations for 455 non-overlapping windows, together accounting for 1.13 Mbp of
Fig. 2. MGW is predictive of DNase I cleavage rate.(A) ΔΔG derived from the negative logarithm ofcleavage rate as a function of MGW at the sixpositions of all 4,096 unique hexamers. MGW of thisregion was predicted for naked binding sites basedon a pentamer-based HT shape prediction approach(SI Methods). HT predictions for all possible 16 di-nucleotide flanks were averaged and values ofMGW that fall within intervals of 0.3 Å assigned togroups of sequences for which cleavage rates areshown as box plots. (B) DNase I–DNA complex basedon crystal structure (Protein Data Bank ID code2DNJ). Base pairs at positions −3 and −2, whereDNase I cleavage anticorrelates with MGW, arehighlighted in blue. Base pairs at positions −1 and +1,where DNase I cleavage correlates positively withMGW, are highlighted in green. Regions where nocorrelation could be detected are shown in gray.The color code of the base pairs in the crystal struc-ture is equivalent to the one used for the box plots.(C) DNase I–minor groove contacts within a distanceof 5 Å from any base atom are shown for the samecrystal structure. Arg41 and Arg9 bind upstream ofthe cleavage site, where MGW anticorrelates withDNase I cleavage (blue base pairs). This anticorrelation likely arises from the attraction between the positively charged arginine residues and the locally enhancednegative electrostatic potential. The cleavage site (indicated by the orange arrow), by contrast, is located in a regionwhere MGW correlates positively with DNaseI cleavage (green base pairs).
Lazarovici et al. PNAS | April 16, 2013 | vol. 110 | no. 16 | 6379
BIOPH
YSICSAND
COMPU
TATIONALBIOLO
GY
Dow
nloa
ded
by g
uest
on
May
22,
202
0
genomic DNA. A given window was predicted to be hyper-methylated whenever the number of CpG-adjacent cleavages wasat least 120% of the expected value (SI Methods), and hypo-methylated when that number was below 50% of expected. Tovalidate our predictions, we inspected the actual methylation levelin the IMR90 cells (36). We found that this level was below themedian in 80% of the windows predicted to be hypomethylatedand above the median in 84% of those predicted to be hyper-methylated. These results demonstrate that regional DNA meth-ylation status can indeed be inferred from the in vivo DNase Iprofile with reasonable accuracy as long as the local coverage isdense enough.
ConclusionIn this work, we have discovered the existence of a strong DNA-shape–driven sequence dependence of DNase I cleavage, whichcan be leveraged to map DNA shape at single-nucleotide reso-lution on a genomic scale. DNase I emerges from our study as
a highly sensitive probe of the geometry of the minor groove.The latter serves as an important recognition site within theDNA-binding interface of many regulatory proteins. It has beenpreviously noted that DNA binding proteins such as DNase Imay be regarded as structural probes of DNA conformation andflexibility (33). Moreover, although the interaction between DNAand its binding proteins is known to result in conformationalchanges in both molecules (31, 39, 40), the present work showsthat intrinsic DNA shape is an important recognition signal. Thedepth of the HT data used in this study has allowed us to studythis phenomenon at an unprecedented level of resolutionand quantification.The intrinsic DNase I cleavage rate changes greatly with each
single-nucleotide shift in position along the genome, and it self-averages over genomic windows as small as a few dozennucleotides. Taking into account our hexamer model, therefore,does not significantly affect the detection sensitivity of regionalDNase I hypersensitivity, nor does the intrinsic sequence-dependent variation in cleavage rate seem to result in false-positive DNase I footprints (41). However, the unprecedentedaccuracy of our model for intrinsic DNase I cleavage specificityhas the potential to enhance the interpretation of high-resolutionDNase I cleavage patterns (11, 42).Additionally, we show that DNase I is so exquisitely sensitive
to the changes in DNA shape caused by CpG methylation that invivo DNA methylation patterns can be inferred directly fromhigh-density in vivo DNase I cleavage profiles. Our demonstra-tion that it is possible to harness the methylation sensitivity ofDNase I to infer cell-type–specific DNA methylation statusprovides a unique and complementary tool for analysis ofdomain-level methylation patterns in conjunction with chromatinstate changes during development (43) or disease (44).Finally, and perhaps most importantly, our in-depth study of
DNase I allowed us to uncover a structural mechanism thatplausibly answers the long-standing question of how cytosinemethylation modulates protein–DNA interaction. Our datastrongly suggest that DNA methylation generally acts to narrowthe minor groove. DNase I activity is sensitive to this change inDNA conformation, and this explains our observation of greatly
A B
CD
Fig. 3. Observation and analysis of the effect of methylation on DNase Icleavage rate. (A) The rate of cleavage depends strongly on the DNAmethylation status. We used a positional map of DNA methylation in IMR90(36) to delineate subsets of genomic positions with low/high degrees of CpGmethylation, respectively. Comparison between the hexamer cleavage ratesderived from these respective subsets shows an ∼eightfold increase incleavage rate for hexamers with a methylated CpG immediately down-stream of the cleaved phosphate (red points). (B) Interplay between DNAsequence and methylation status, DNA geometry, and DNase I cleavagesuggested by our analysis. (C) Roll and MGW of methylated and unmethy-lated versions of the same hexamer based on the average of MC predictionsfor three different flanking sequences (see SI Methods for details). Methyl-ation leads to an increase in the positive roll angle at the CpG dinucleotideand a narrowing of the MGW at position −2 by roughly 0.5 Å. (D) The effectof methylation on DNase I cleavage can be predicted in silico by traininga model to predict the cleavage rates of unmethylated DNA sequences oftype NNNCGN using information on DNA MGW and roll angle along thesesame unmethylated sequences. An increase in cleavage rate (i.e., data pointsshifting downward) is predicted when MGWs and roll angles for the meth-ylated versions of the sequences are supplied as input to the model.
Fig. 4. Genomicmethylation status can bepredicted fromdense in vivoDNase Ifootprints. Starting from in vivo DNase I footprinting data for the IMR90 cellline, a set of nonoverlapping windows (2,500 bp long) containing at least 400cleavage events with hexamer context NNNpCGNwas identified. Next, for eachwindow, the observed number of cleavages upstream of CpG dinucleotides wascompared with the expected number. This allowed us to infer the methylationstatus of the corresponding DNA. To validate our predictions, we ranked allwindows by their actual degree of methylation as measured by Lister et al. (36).Shown is the distribution of ranks for the subset of windows predicted to behypomethylated (red) and hypermethylated (blue), respectively.
6380 | www.pnas.org/cgi/doi/10.1073/pnas.1216822110 Lazarovici et al.
Dow
nloa
ded
by g
uest
on
May
22,
202
0
enhanced cleavage adjacent to methylated CpG base pair steps.However, we believe that our insight could apply much morewidely across many families of nucleotide-binding proteins.Narrowing of the MGW may thus be the general mechanism bywhich the addition or removal of methyl groups in the majorgroove influences gene expression. An intriguing possibility isthat nucleosome positioning might be influenced by methylation(45, 46). Recently, an observed correlation between these twovariables was interpreted as influence of nucleosome positioningon methylation patterning (45). However, electrostatic inter-actions between arginines and the minor groove occur in thenucleosome (22, 47), and the minor groove narrowing associatedwith cytosine methylation could enhance these. The methylationpatterns might therefore also be a partial determinant of nu-cleosome position, with methylated CpG dinucleotides givingrise to stronger electrostatic interactions with histones, in-creasing the stability of nucleosomes.
MethodsPlease see SI Methods for additional details on cell culture and DNA extraction;DNase I treatment of purified DNA; and digital DNase I mapping in IMR90cells. There is also information on library construction and sequencing; single-nucleotide model; hexamer model, outlier removal, dependency betweenmutated and modulating positions, statistical significance of nucleotide de-pendencies, high-throughput (HT) prediction of minor groove width (MGW),Monte Carlo (MC) prediction of DNA structures for unmetylated and meth-ylated DNA, dependence of DNase I cleavage rate on DNAmethylation status,and inferring methylation status from in vivo DNase I footprints.
ACKNOWLEDGMENTS. The authors wish to thank other members of theBussemaker, Rohs, and Stamatoyannopoulos labs for valuable discussions.This research was funded by National Institutes of Health GrantsR01HG003008 and U54CA121852 (to H.J.B.), U54HG004592 (to J.S.), USCstart-up funds and Grant IRG-58-007-51 from the American Cancer Society(to R.R.). H.J.B. is a John Simon Guggenheim Fellow, and R.R. is an Alfred P.Sloan Research Fellow.
1. Oliveri M, et al. (2004) DNase I behaves as a transcription factor which modulates Fasexpression in human cells. Eur J Immunol 34(1):273–279.
2. Suck D, Lahm A, Oefner C (1988) Structure refined to 2A of a nicked DNA octanu-cleotide complex with DNase I. Nature 332(6163):464–468.
3. Weston SA, Lahm A, Suck D (1992) X-ray structure of the DNase I-d(GGTATACC)2complex at 2.3 A resolution. J Mol Biol 226(4):1237–1256.
4. Hogan ME, Roberson MW, Austin RH (1989) DNA flexibility variation may dominateDNase I cleavage. Proc Natl Acad Sci USA 86(23):9273–9277.
5. Heddi B, Abi-Ghanem J, Lavigne M, Hartmann B (2010) Sequence-dependent DNAflexibility mediates DNase I cleavage. J Mol Biol 395(1):123–133.
6. Dorschner MO, et al. (2004) High-throughput localization of functional elements byquantitative chromatin profiling. Nat Methods 1(3):219–225.
7. Sabo PJ, et al. (2004) Discovery of functional noncoding elements by digital analysis ofchromatin structure. Proc Natl Acad Sci USA 101(48):16837–16842.
8. John S, et al. (2011) Chromatin accessibility pre-determines glucocorticoid receptorbinding patterns. Nat Genet 43(3):264–268.
9. Sabo PJ, et al. (2006) Genome-scale mapping of DNase I sensitivity in vivo using tilingDNA microarrays. Nat Methods 3(7):511–518.
10. Galas DJ, Schmitz A (1978) DNAse footprinting: A simple method for the detection ofprotein-DNA binding specificity. Nucleic Acids Res 5(9):3157–3170.
11. Hesselberth JR, et al. (2009) Global mapping of protein-DNA interactions in vivo bydigital genomic footprinting. Nat Methods 6(4):283–289.
12. Pennings S, Allan J, Davey CS (2005) DNA methylation, nucleosome formation andpositioning. Brief Funct Genomics Proteomics 3(4):351–361.
13. Suzuki MM, Bird A (2008) DNA methylation landscapes: Provocative insights fromepigenomics. Nat Rev Genet 9(6):465–476.
14. Kangaspeska S, et al. (2008) Transient cyclical methylation of promoter DNA. Nature452(7183):112–115.
15. Bird A (2002) DNA methylation patterns and epigenetic memory. Genes Dev 16(1):6–21.
16. Eckhardt F, et al. (2006) DNA methylation profiling of human chromosomes 6, 20 and22. Nat Genet 38(12):1378–1385.
17. Weber M, et al. (2007) Distribution, silencing potential and evolutionary impact ofpromoter DNA methylation in the human genome. Nat Genet 39(4):457–466.
18. Rozenberg JM, et al. (2008) All and only CpG containing sequences are enrichedin promoters abundantly bound by RNA polymerase II in multiple tissues. BMCGenomics 9:67.
19. Rishi V, et al. (2010) CpG methylation of half-CRE sequences creates C/EBPalphabinding sites that activate some tissue-specific genes. Proc Natl Acad Sci USA 107(47):20311–20316.
20. Rohs R, West SM, Liu P, Honig B (2009) Nuance in the double-helix and its role inprotein-DNA recognition. Curr Opin Struct Biol 19(2):171–177.
21. Joshi R, et al. (2007) Functional specificity of a Hox protein mediated by the recog-nition of minor groove structure. Cell 131(3):530–543.
22. Rohs R, et al. (2009) The role of DNA shape in protein-DNA recognition. Nature461(7268):1248–1253.
23. Rohs R, et al. (2010) Origins of specificity in protein-DNA recognition. Annu Rev Bi-ochem 79:233–269.
24. Slattery M, et al. (2011) Cofactor binding evokes latent differences in DNA bindingspecificity between Hox proteins. Cell 147(6):1270–1282.
25. Kitayner M, et al. (2010) Diversity in DNA recognition by p53 revealed by crystalstructures with Hoogsteen base pairs. Nat Struct Mol Biol 17(4):423–429.
26. Suck D (1994) DNA recognition by DNase I. J Mol Recognit 7(2):65–70.27. Drew HR, Travers AA (1984) DNA structural variations in the E. coli tyrT promoter. Cell
37(2):491–502.28. Herrera JE, Chaires JB (1994) Characterization of preferred deoxyribonuclease I
cleavage sites. J Mol Biol 236(2):405–411.29. Brukner I, Sánchez R, Suck D, Pongor S (1995) Sequence-dependent bending propensity
of DNA as revealed by DNase I: Parameters for trinucleotides. EMBO J 14(8):1812–1818.30. Marcourt L, Cordier C, Couesnon T, Dodin G (1999) Impact of C5-cytosine methylation
on the solution structure of d(GAAAACGTTTTC)2. An NMR and molecular modellinginvestigation. Euro J Biochem 265(3):1032–1042.
31. Lahm A, Suck D (1991) DNase I-induced DNA conformation. 2 A structure of a DNase I-octamer complex. J Mol Biol 222(3):645–667.
32. Lomonossoff GP, Butler PJ, Klug A (1981) Sequence-dependent variation in the con-formation of DNA. J Mol Biol 149(4):745–760.
33. Brukner I, Jurukovski V, Savic A (1990) Sequence-dependent structural variations ofDNA revealed by DNase I. Nucleic Acids Res 18(4):891–894.
34. Bishop EP, et al. (2011) A map of minor groove shape and electrostatic potential fromhydroxyl radical cleavage patterns of DNA. ACS Chem Biol 6(12):1314–1320.
35. Adams RL (1990) DNA methylation. The effect of minor bases on DNA-protein in-teractions. Biochem J 265(2):309–320.
36. Lister R, et al. (2009) Human DNA methylomes at base resolution show widespreadepigenomic differences. Nature 462(7271):315–322.
37. Fox KR (1986) The effect of HhaI methylation on DNA local structure. BiochemJ 234(1):213–216.
38. Kochanek S, Renz D, Doerfler W (1993) Differences in the accessibility of methylatedand unmethylated DNA to DNase I. Nucleic Acids Res 21(25):5843–5845.
39. N’soukpoé-Kossi CN, Diamantoglou S, Tajmir-Riahi HA (2008) DNase I - DNA in-teraction alters DNA and protein conformations. Biochem Cell Biol 86(3):244–250.
40. Meijsing SH, et al. (2009) DNA binding site sequence directs glucocorticoid receptorstructure and activity. Science 324(5925):407–410.
41. Neph S, et al. (2012) An expansive human regulatory lexicon encoded in transcriptionfactor footprints. Nature 489(7414):83–90.
42. Wang X, et al. (2008) Using RNase sequence specificity to refine the identification ofRNA-protein binding regions. BMC Genomics 9(Suppl 1):S17.
43. Lister R, et al. (2011) Hotspots of aberrant epigenomic reprogramming in humaninduced pluripotent stem cells. Nature 471(7336):68–73.
44. Hansen KD, et al. (2011) Increased methylation variation in epigenetic domains acrosscancer types. Nat Genet 43(8):768–775.
45. Chodavarapu RK, et al. (2010) Relationship between nucleosome positioning andDNA methylation. Nature 466(7304):388–392.
46. Kelly TK, et al. (2012) Genome-wide mapping of nucleosome positioning and DNAmethylation within individual DNA molecules. Genome Res 22(12):2497–2506.
47. West SM, Rohs R, Mann RS, Honig B (2010) Electrostatic interactions between argi-nines and the minor groove in the nucleosome. J Biomol Struct Dyn 27(6):861–866.
Lazarovici et al. PNAS | April 16, 2013 | vol. 110 | no. 16 | 6381
BIOPH
YSICSAND
COMPU
TATIONALBIOLO
GY
Dow
nloa
ded
by g
uest
on
May
22,
202
0


![BMC Plant Biology BioMed Central...pollen donor O. bienni into rice, we did a genomic DNA probing assay [29], i.e., using labeled genomic DNA of O. biennis as a probe and autoclaved](https://static.fdocuments.us/doc/165x107/60ee90385e2bfa517a2963ff/bmc-plant-biology-biomed-central-pollen-donor-o-bienni-into-rice-we-did-a.jpg)