Probability Analysis of Vessel Collisions and Groundings ...docs.trb.org/prp/14-3563.pdf ·...
18
Probability Analysis of Vessel Collisions and Groundings in Southeast Texas Waterways ABSTRACT: The Sabine-Neches Waterway (SNWW) connects the Port of Beaumont, as well as the Ports of Port Arthur and Orange, with the Gulf of Mexico. The SNWW can be divided into three navigation routes, though they share some channels: the first one is the waterway from the Gulf to the Ports of Port Arthur and Beaumont; the second is a part of Gulf Intra-coastal Waterway; and the third one is from the Gulf to the Port of Orange. The SNWW plays an important role in supporting the economic growth of Southeast Texas. The safe navigation in narrow waterway is one of the most important concerns to maritime authorities and researchers. Collisions and groundings are two most common vessel accidents. We employed the grounding and collision analysis toolbox (GRACAT) to analyze the probabilities of collisions and groundings in multiple segments along the SNWW. The impacts of the vessel traffic on the probabilities of collisions or groundings are studied, respectively. Moreover, the waterway segments with high probability of collisions or groundings are identified in the SNWW. Keywords: probability, vessel collisions, vessel groundings, Southeast Texas Waterways Xing Wu, PhD (Corresponding Author) Assistant Professor Department of Civil Engineering Lamar University Email: [email protected] Tel: 409-880-8757 Md Hafizur Rahman Graduate Student Department of Civil Engineering Lamar University Email: [email protected] Victor Zaloom, PhD, P.E. Interim Dean of Graduate Studies, Associate Dean of Engineering Department of Industrial Engineering Lamar University Email: [email protected] TRB 2014 Annual Meeting Paper revised from original submittal.
Transcript of Probability Analysis of Vessel Collisions and Groundings ...docs.trb.org/prp/14-3563.pdf ·...

1
Probability Analysis of Vessel Collisions and Groundings in Southeast Texas Waterways
ABSTRACT: The Sabine-Neches Waterway (SNWW) connects the Port of Beaumont, as well as the Ports of Port Arthur and Orange, with the Gulf of Mexico. The SNWW can be divided into three navigation routes, though they share some channels: the first one is the waterway from the Gulf to the Ports of Port Arthur and Beaumont; the second is a part of Gulf Intra-coastal Waterway; and the third one is from the Gulf to the Port of Orange. The SNWW plays an important role in supporting the economic growth of Southeast Texas. The safe navigation in narrow waterway is one of the most important concerns to maritime authorities and researchers. Collisions and groundings are two most common vessel accidents. We employed the grounding and collision analysis toolbox (GRACAT) to analyze the probabilities of collisions and groundings in multiple segments along the SNWW. The impacts of the vessel traffic on the probabilities of collisions or groundings are studied, respectively. Moreover, the waterway segments with high probability of collisions or groundings are identified in the SNWW.
Keywords: probability, vessel collisions, vessel groundings, Southeast Texas Waterways
Xing Wu, PhD (Corresponding Author)
Assistant Professor Department of Civil Engineering
Lamar University Email: [email protected]
Tel: 409-880-8757
Md Hafizur Rahman Graduate Student
Department of Civil Engineering Lamar University
Email: [email protected]
Victor Zaloom, PhD, P.E. Interim Dean of Graduate Studies, Associate Dean of Engineering
Department of Industrial Engineering Lamar University
Email: [email protected]
TRB 2014 Annual Meeting Paper revised from original submittal.

2
1. Introduction The Southeast Texas region (see Figure 1(a)) saw significant growth in manufacturing and shipping during the last 40 years. The gross regional product and the total of all value added within the region, nearly doubled from $8.7 billion in 1970 to $16.1 billion in 2000 (TX State Gov 2013). Inland water transportation plays an important role in the growth and economic development of Southeast Texas, as there are many inland waterways connected with the Gulf of Mexico, as shown in Figure 1(b). The Port of Beaumont is one of the busiest ports in the United States (World Port Source, 2013). It is also the busiest military port in the U.S. and the second busiest U.S. military port in the world (Macias, 2006)
The Sabine-Neches Waterway (SNWW) connects the Port of Beaumont, as well as the Ports of Port Arthur and Orange, with the Gulf of Mexico. We consider three routes (see Figure 1(b)): Route 1 goes from the Port of Beaumont to the Gulf of Mexico via the Neches River; Route 2 in Figure 1(b) starts from the Port of Orange, east of the northern intersection of the Gulf Intracoastal Waterway (GIWW) with the SNWW and then extends west in the GIWW to the west of the southern intersection of the GIWW with SNWW; and Route 3 is from the Port of Orange to the Gulf of Mexico via two intersections of the GIWW with SNWW, and then turns to south at the southern intersection. The section from the southern intersection of the GIWW with the SNWW to the northern intersection is common to all three routes. The section from the southern intersection to the Gulf is shared by both Routes 1 and 3. A jettied entrance channel (Routes 1 & 3 in Figure 1(b)) from the Gulf is 42 feet deep and 500-800 feet wide (USACE, 2010). Route 1 is the major route, which is 40 ft deep and 400 ft wide, having the capacity for oil tankers and other big vessels.
(a) Map of Southeast Texas (b) Three routes to three ports in Southeast Texas Figure 1 Inland waterways in Southeast Texas (Route 1 is the waterway to the Port of Beaumont via the
Neches River; Route 2 is a segment of the Gulf Intracoastal Waterway (GIWW) and Route 3 is the channel to the Port of Orange via the Sabine River)
Safe navigation in the narrow waterway is one of the most important concerns to maritime authorities and researchers. Accidents of vessels in narrow waterways include: collisions, allisions, groundings, fire and explosions, etc. Note that allisions are similar to collisions, where the former indicates that a vessel strikes a fixed object, and the latter means two vessels running against each other. In the SNWW, a highly concerned allision which could bring serious consequences is a vessel-bridge allision. There are three bridges across the SNWW, as shown in Figure 1b. Therefore, we also study the probabilities of vessel-bridge allisions at these three locations. Currently, the channel from the Gulf to the Port of Beaumont
TRB 2014 Annual Meeting Paper revised from original submittal.

3
only allows one-way traffic. Therefore, the potential probability of vessel collisions is expected to be low in this section of waterway. But in the common channel shared by three routes, such probability is expected to be high.
As to vessel groundings, generally there are two types of groundings: powered groundings and adrift groundings. A powered grounding happens when a vessel fails to make a critical course change; and an adrift grounding takes place when a vessel loses the ability to navigate (Fowler and Sorgard, 2000). Vessel groundings may be resulted from evasive maneuvers and/or unmarked shoaling, respectively. The width of the channel affects the former and the depth impacts the latter. On the other hand, from the prospective of the nature of groundings, a vessel grounding can be also categorized into a soft or hard grounding. A soft grounding occurs when a vessel gets stuck in sand or silt. A hard grounding occurs when a vessel is stuck on another sunken vessel or fixed object or hard rocky underneath. In the SNWW, most vessel groundings are soft because of the geological conditions in the SNWW.
Table 1 reports the frequency of collisions, allisions, grounding in the SNNW from 2006 through 2012. It is seen that there is an average of 2-3 vessel collisions (including allisions) and 1grounding per month. From Table 1, it is also found that the frequency of the vessel accidents in the SNWW drop significantly after 2008. It is because the implementation of the vessel traffic management system.
Table 1 Frequency of vessel accidents in the SNWW during four years (Source: SETWAC, 2013)
Accident Type 2006
(10months) 2007 2008 2009 2010 2011 2012 Total
Collisions 32 30 39 5 11 4 7 128
Allisions 16 22 36 3 16 2 8 103
Collisions+ Allisions 48 52 75 8 27 6 15 231
Groundings 21 24 24 9 8 5 6 97
Misc. 0 0 1 24 9 28 14 76
In spite of their low frequency of occurrence, vessel collisions and/or groundings are important because their consequences may be serious, including the loss of life, injuries, damage of properties-goods, oil spill, disruption of operations, or air, water and long term ecological and environmental impact. Vessel collisions or groundings may have the same consequences, such as oil spill. But collisions in the SNWW are more dangerous than groundings in the SNWW because the groundings in the SNWW are primarily soft. Therefore, the damage of a soft grounding to the vessel is usually not as serious as a collision does to the vessel. Table 2 reports the consequence of vessel accidents in the SNWW in four years. For example, 2008 saw 18 persons killed in the vessel accidents in the SNWW. On the other hand, the SNWW serves four of refineries and many chemical plants located along the waterway. From 2002-2006, the import of crucial oil through this waterway comprises 12% of the U.S and 18% of Western Gulf Coast imports (USACE, 2010). For this reason, the risk of the oil spill and hazardous chemicals leak due to the vessels’ accidents is a major concern to the maritime authorities and local communities. On January 23, 2010, a tanker (TV EAGLE OTOME) allided with two barges, and a merchant vessel (MV GULL ARROW), near the Port of Port Arthur (see Figure 1(b)), and one barge breached the double hull of the tanker, resulting in a report of an 11,000 bbls crude oil spill (SETWAC, 2013). Fortunately, this is the only one oil spill incident occurred from 2006 to 2012.
The occurrence of vessel accidents depends on various factors. Generally speaking, these factors can be categorized to five groups as shown in Table 3 (Trucco et al, 2008, Li et al, 2012).
Recently, a $1.16 billion project which aims to deepen and widen the SNWW from the Port of Beaumont to the Gulf of Mexico has been proposed in order to increase the capacity of the SNWW for
TRB 2014 Annual Meeting Paper revised from original submittal.

4
the increasing demand (USACE, 2010). The plan includes seven phases, including deepening the channel, extending the length of channel and widening some parts of the channel (USACE, 2010). With the increase of the SNWW’s capacity to handle larger vessels, the potential probability of vessel accidents may change. It may increase at some portions of the SNWW. For example, currently only one-way traffic is allowed in the channel to the Port of Beaumont; after the project, if two-way traffic is allowed, the probability of collisions may increase. Meanwhile, with a deeper channel, vessels with larger dead weight tons (DWT) will begin to enter the waterway. Consequently, the consequences of collisions and groundings may increase correspondingly. On the other hand, with a wider channel, the chance of a collision may decrease as it provides more maneuvering room and a deeper channel also help decrease the chance of groundings.
Table 2 Consequence of vessel accidents in the SNWW during four years (Source: SETWAC, 2013)
Type 2006 (10months) 2007 2008 2010(5 months) Total
Sinking 0 9 5 0 14
Loss of Life/ Personal casualty 0 0 18 2 20
Capsize 3 0 3 0 6
Oil spill 0 0 0 1 1
Table 3 Categories of factors causing vessel accidents (Trucco et al, 2008, Li et al, 2012) Factor Note
Geometrical factor Channel depth, width and length, etc.
Traffic factor Traffic volume, vessel speed etc.,
Weather factor Visibility, wind direction, wind speed, etc.
Vessel design parameters & equipment failure Radar failure, engine failure, vessel structure failure, etc.
Human factors Inattention officer of the watch (OOW), lack of communication, etc.
Based on the current traffic and geometric data, this paper aims to estimate quantitatively the probabilities of vessel collisions, vessel-bridge allisions and groundings in various segments of the SNWW, using an existing software package called grounding and collision analysis toolbox (GRACAT) (See Section 2 for details).The three navigation routes are simulated in the GRACAT. Considering that traffic in the SNWW might change with the completion of the capacity improvement project in the SNWW, the probabilities of collisions, vessel-bridge allisions and groundings along three routes are estimated and analyzed under different hypothesized traffic levels. More importantly, through simulation, we can identify those segments of the SNWW, where collisions and/or groundings are highly likely to occur. It is very important for the maritime authority to know the locations of these high-risk zones. These zones should be closely monitored in the daily traffic management, and they also should also be paid specific attention in the channel improvement project, so as to reduce the probabilities of collisions or groundings.
This article is organized as follows. Section 2 reviews the existing models for estimating the probability of vessel collisions and groundings in waterways. Section 3 presents the procedure for implementation of the GRACAT simulation model. Section 4 reports the simulation results and Section 5 concludes this paper.
2. Literature Review The model of determining the probability of collisions and groundings was initially proposed by Fujii and Tanaka (1971) and Macduff (1974). In Fujii and Tanaka (1971), the frequency of collisions or groundings,
TRB 2014 Annual Meeting Paper revised from original submittal.

5
, is determined by the possible geometric number of collisions or groundings , multiplied with the causation factor :
(1)
Macduff (1974), on the other hand, uses the conditional probability and Bayes Theorem to describe the probability of collisions or groundings:
∑ Accident|Scenario Scenario∀ (2)
where is the probability of a ship encountering an accident scenario; | is the conditional probability that an accident occurs under accident scenario ;
and and | are called geometric probability and causation probability, respectively (Macduff, 1974). The geometric probability depends on the geometric parameters of waterway, the traffic volume, the ship size, the ship speed over ground (SOG), the course over ground (COG). The causation probability is dependent on the operational skills of mariners, the maneuverability of vessels under accident scenarios and the actions conducted to prevent the accident (Li et al, 2012). In other words, the causation probability reflects the mariners’ ability to manage under different accident scenarios.
Under a scenario (sometimes it is also called situation), Merrick and van Dorp (2006) proposed to consider triggering incidents that cause the occurrence of an accident. For example, the mechanical failure or mariners’ error, such as bad evaluation of speed of other ships or failure to use the GIS device are examples of incidents. However, the occurrence of an incident does not necessarily results in an accident. In Trucco et al (2008), a trigger event of an accident is defined as “basic event”, and an accident is dubbed as “top event”. In this case, the probability of an accident is defined as Equation (3):
∑ ∑ | (3) where Event | means the occurrence of Incident (e.g., the helmsman’s error) under Scenario (a combination states of contributing factors, such as the vessel route, the visibility, wind direction and speed, etc.), and Event | is the occurrence of an accident (e.g., collision) triggered by Incident under Scenario .
It is easy to see that ∑ in Equation (2) is equivalent to the geometric probability described in Macduff (1974).
The distribution of a scenario’s states is usually estimated by simulation (for example, see van Drop et al 2001, Merrick et al 2003, Merrick et al 2005, Merrick and van Dorp 2006). The difficulty lies on how to evaluate the causation probability effectively, i.e., the probability that an accident (e.g., collision or grounding) is triggered by a certain incident, and the probability that an incident occurs under a certain scenario. A straightforward method is to use historical data to calibrate this probability (Li et al, 2012). Roeleven, et al (1995) proposed a generalized linear model (GLM), which uses real accident data and waterway geometrical data to estimate the number of accidents in Dutch inland waterway. However, given the low frequency of accidents (in the view of calibration), using historical data to estimate the causation probability may bring large bias. For example, there are only averagely 2-3 collisions (including allisions) and 1grounding monthly in the channels of the SNWW from 2006 to 2012, as reported in Table 1.
The fault tree analysis (FTA) is a widely applied method to estimate the causation probability. For example, Fowler and Sorgard (2000) gave two specific examples: one is for the estimation of the probability of collisions in good visibility and another is for that in bad visibility. In a faulty tree, an accident is regarded as a root node. From a root node, all possible causes are listed as branches and further a new tree may be generated from each node as the causes to this node. The probability at each node comes from historical data or experts’ estimation (in most cases). The drawback of the FTA is that the probability at each node has to be estimated directly and t hus subject to large variance.
TRB 2014 Annual Meeting Paper revised from original submittal.

6
Such drawbacks of the FTA method give rise to the Bayesian method (see examples in Friis-Hansen and Simonsen, 2002; Otto et al, 2002; Szwed et al, 2006; Trucco et al, 2008). By using this method, a Bayesian network is built, which is somewhat similar to the fault tree. It is an acyclic network with directed arcs. A node represents a random variable, and a directed arc from a node to another indicates the stochastic dependency between these two nodes. A random variable represents the state of a situational factor.The state space contains discrete states (Friis-Hansen and Simonsen, 2002). For example, the state of a radar system can be “working” or “out of order”, and the knowledge level of crew is defined as “low”, “median” and “high”. Similar to the FTA, the Bayesian method also requires the expert judgment on the stochastic dependency between two random variables. However, experts are not asked to estimate the causation probability directly. Instead, they are asked to estimate the posterior probability of an accident or incident, i.e., | and | ∙ in Merrick and van Dorp (2006)’s model. That is, given the occurrence of an accident or incident , at what degree does an expert believe that this accident/incident occurs under a certain state of situation ? According to Bayes Theorem, we have
| |
4
In Equation (3), | is the posterior probability and is the prior probability. Probabilities can be estimate using a questionnaire. Experts are asked to compare their belief under two scenarios, where only one situational parameter’s state is changed between these two scenarios (Szwed et al, 2006, Trucco et al, 2008). Using this method, the direct estimation of the probability is avoided. Focusing on the paired comparison of experts’ responses, Szwed et al (2006) provided a theoretical framework to estimate the posterior distributions of responses. Therefore, compared with the FTA, the Bayesian method can better capture the experts’ judgment on the cause of accidents’ occurrence.
Recently, the Technical University of Denmark developed a software package called grounding and collision analysis toolbox (GRACAT), to estimate the probability of vessel collisions and groundings (Friis-Hansen and Simonsen, 2002), including the probability estimation and damage evaluation. The user can define their own routes for simulation by integrating the traffic data and vessel data such as vessel types, vessel structure, etc. The probability of collisions and groundings (in terms of frequency of collisions or groundings per year per trip) are estimated using a Bayesian network. Moreover, the GRACAT can also help users to analyze the vessel damage of collisions and grounding, as well as the consequence of the damage. Finally, the GRACAT can provide the remedial measures for the consequence of vessel collisions and groundings (Friis-Hansen and Simonsen, 2002). Friis-Hansen (2000) and Simonsen (2000) validated this software using the data from Danish waterways. This study plans to use this simulation tool to analyze the probabilities of collisions and groundings in the SNWW.
3. Simulation Model The GRACAT simulation model estimates the grounding and collision frequencies based the work of Fujiiand Tanaka (1971) and Macduff (1974). The potential number of ship groundings or ship-ship collisions is determined as if no aversive maneuvers were made. The potential number of ship accidents is based on two assumptions: (1) geometric distribution of the ship traffic over the waterway and (2) the operating vessels being navigated blindly in the studied waterway (Friis-Hansen and Simonsen, 2002). The causation probability is calculated based on the assumption of “blind navigation”. This approach is termed “Scenario Approach” by Gluverand Olsen (1998).
As the first step for conducting a simulation, we need to complete the following four aspects of simulation parameter settings in the GRACAT.
3.1 Navigation Routes In the first section, we have defined three routes, respectively (see Figure 1b). With the help of Google Map, these three routes were defined point by point based on their corresponding latitudes and longitudes.
TRB 2014 Annual Meeting Paper revised from original submittal.

7
These points are called waypoints in the GRACAT model. A total of 113 waypoints were defined and connected according to their real geometric profile.
Meanwhile, in order to study the probability of groundings, we need to identify the potential ground points along each route. Ground points are similar to waypoints. But waypoints are used for simulating routes; while ground points are used to simulate the ground on the two side of the channel or to locate any particular ground on the navigational route, as shown in Figure 2(a)-(b).The study routes are narrow, having many soft ground points. With the help of Google Map, 464 soft grounding points were located through their corresponding latitudes and longitudes along three routes.
Especially, we identified the locations of all three bridges across the SNWW because a vessel-bridge allision would be more series than a soft grounding. We considered the clear distance from pier to pier of three bridges in SNWW. In the GRACAT model, the way points are used to define the route for the simulation of vessel-vessel collisions. Therefore, we have to use ground points to define the locations of bridge piers, and incorporate vessel-bridge allisions into the category of “groundings”. These vessel-bridge allisions are hereafter regarded as “hard groundings” in the GRACAT model.
These 113 waypoints and 464 grounding points were firstly identified in Google Map, as demonstrated in Figure 2(c), and then were imported into the GRACAT model for simulation, as shown in Figure 2(d).
To better describe the operation of a vessel, a route is further divided into many leg segments. A leg is a route segment by connecting two waypoints. In our model, a vessel is assumed to sail with a mean distance of 165 ft (around 50 meters) and a standard deviation of 65 ft (around 20 meters) away from the direct line connected between the waypoints. The maneuvering aspect in each leg is defined. On the other hand, we also defined a series of ground segments by connecting ground points based on the ground type specification. Figure 2 (b) shows an example of ground segments. Table 4 reports the number of leg and ground segments of each route. For example, Route1 has 35 leg segments for the collision analysis and 158 ground segments for the grounding analysis. However, since these three routes have some overlapping segments (see Figure 1), the leg segment for one route may not necessarily be unique.
Note that though ground segments are used for the grounding simulation, the grounding probabilities from the simulation are still associated with each leg segment, because a route is uniquely represented by a series of leg segments. A section of the route, represented by a leg segment, may have multiple ground segments, which are dependent on the geological condition of the channel. The GRACAT model will provide the probabilities of collisions and groundings respectively, in each leg segment of the route (see Section 4).
a)Example of navigation routes, ground points, ground segments (from Google Map)
b) Simulation in the GRACAT model of navigation routes, ground points, ground segments
TRB 2014 Annual Meeting Paper revised from original submittal.

8
c)113 waypoints and 464 ground points for three routes, view from Google Map
d) GRACAT simulation based on 113 waypoints and 464 ground points
Figure 2 Routes shown in Google Map and their simulation in the GRACAT model
Table 4 Number of leg segments and ground segments of each route for the collision and grounding analysis in the Sabine-Neches Waterway (SNWW)
Collision Analysis Grounding Analysis
Route 1 35 158
Route 2 45 178
Route 3 30 125
3.2 Geometric Data From Section 2, we know that the probabilities of vessel collisions and groundings are determined by two categories of factors: one is the category of geometric factors and another is that of causation factors. The former reflects all external factors that impact the navigation, including the geographic information associated with the waterway, the traffic data, etc.; and the later indicates the ability of navigation, which reflects the management level, crew ability, etc.
All the present geographic information associated with the SNWW, such as depths, widths, lengths of channels, grounding locations are from US Army Corps of Engineers (2010).
Different types of vessels have different maneuvering and physical characters and their on-board equipment also varies. Therefore, the probabilities of collisions and groundings of different types of vessels may be quite different. To better estimate the probabilities of collisions and groundings along the waterway, it is necessary to consider the distribution of different types of vessels in the traffic flow. Table 5 gives the average annual number of vessels in different types in the SNWW (USCG, 2013). On the other hand, the traffic distribution in each month during 4 years (2006-2009) in the SNWW is reported in Figure 3, where the data come from USCG, 2013 (only four years’ data are available).
3.3 Causation Factors In the GRACAT model, the causation factor is determined through a Bayesian network (as reviewed in Section 2). Two vessels are assumed to be able to detect each other under the same conditions. As mentioned above, the causation factors are based on the scenario of “blind navigation” and the GRACAT provides a dataset about blind navigation. The vessel collision and groundings analysis can be based on these dataset. A detailed description for selecting causation factors may be found in Friis-Hansen (2000).
TRB 2014 Annual Meeting Paper revised from original submittal.

9
In this paper, we use the default setting from the GRACAT for causation factors if not specified, due to the difficulty of getting the detailed vessel maneuvering data in the SNWW. For analysis of GRACAT model in all segments, the maximum ideal velocity of vessels is set to be 15 knots (7.717 m/s). Some causation factors may be given different values at different segments. For example, a multiplier is used to indicate whether higher vigilance is present along a given leg segment: if vigilance in a specific segment is twice as good as the overall vigilance, defined by the default causation factor, then a multiplier of 0.5 is entered for this segment.
Table 5 Average number of vessels in different types in the Sabine-Neches Waterway (SNWW) per year (Source: USCG, 2013)
Type of vessel Average number of vessel per year Tug/Tow 47,889
Ship 4,895 Other Vessel 1,192
Naval 66 Passenger 6
Total 54,048
Figure 3 Total traffic volume by month during 4 years (2000-2009) in the
Sabine-Neches Waterways (SNWW) (Data Source: USCG, 2013)
3.4 Collision and Grounding Scenario Finally, we need to define the collision and grounding scenarios. In the GRACAT, a collision scenario is based on either a probabilistic or deterministic collision damage analysis. In this study, we applied the probabilistic analysis, because we aim to study the probability of collisions, rather than the vessel damage analysis.
The GRACAT model allows us to define two grounding conditions, soft and hard. As explained in the first section, a soft grounding occurs when a vessel gets stuck in sand or silt; while a hard one takes place when a vessel is stuck on another sunken vessel or fixed object or hard rocky underneath. Here we only consider soft groundings because of the geological condition of the SNWW, except three locations of bridges, where vessel-bridge allisions are regarded as “hard groundings”. Readers are referred to the GRACAT manual for details (Friis-Hansen, 2000).
0
1000
2000
3000
4000
5000
6000
JAN FEB MAR APR MAY JUN JUL AUG SEP OCT NOV DEC
Tra
ffic
Vol
ume
is T
itle
2006 2007 2008 2009
TRB 2014 Annual Meeting Paper revised from original submittal.
10
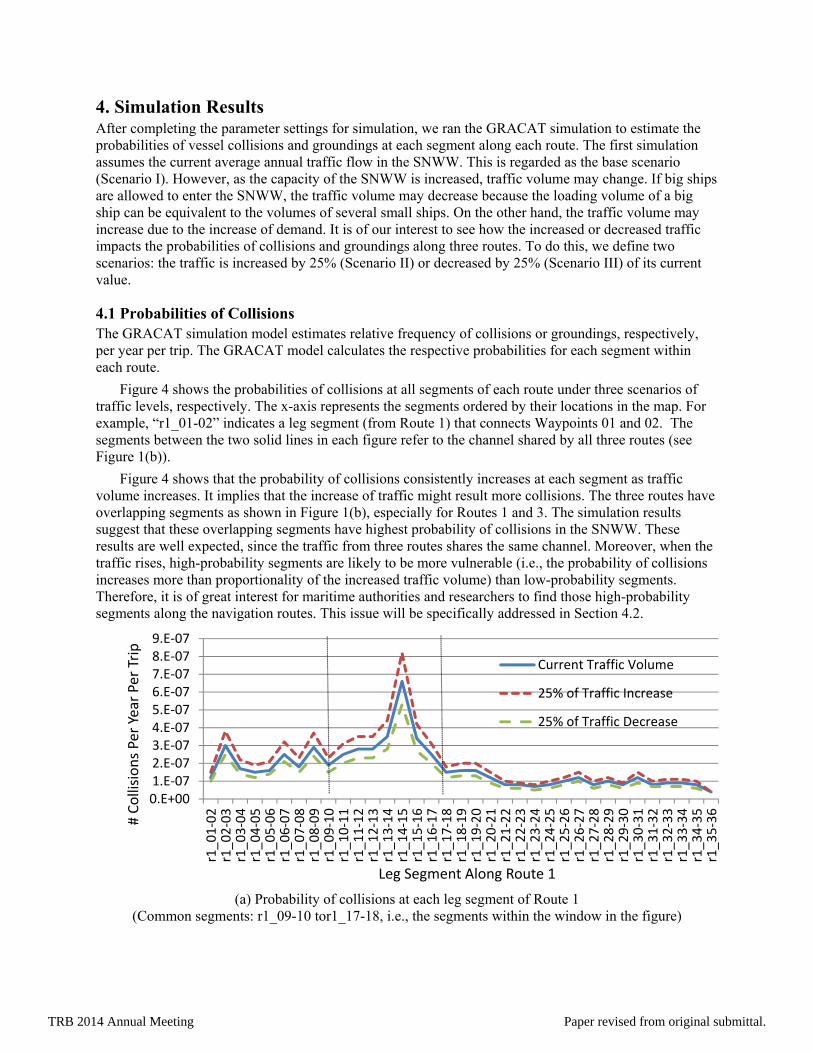
4. Simulation Results After completing the parameter settings for simulation, we ran the GRACAT simulation to estimate the probabilities of vessel collisions and groundings at each segment along each route. The first simulation assumes the current average annual traffic flow in the SNWW. This is regarded as the base scenario (Scenario I). However, as the capacity of the SNWW is increased, traffic volume may change. If big ships are allowed to enter the SNWW, the traffic volume may decrease because the loading volume of a big ship can be equivalent to the volumes of several small ships. On the other hand, the traffic volume may increase due to the increase of demand. It is of our interest to see how the increased or decreased traffic impacts the probabilities of collisions and groundings along three routes. To do this, we define two scenarios: the traffic is increased by 25% (Scenario II) or decreased by 25% (Scenario III) of its current value.
4.1 Probabilities of Collisions The GRACAT simulation model estimates relative frequency of collisions or groundings, respectively, per year per trip. The GRACAT model calculates the respective probabilities for each segment within each route.
Figure 4 shows the probabilities of collisions at all segments of each route under three scenarios of traffic levels, respectively. The x-axis represents the segments ordered by their locations in the map. For example, “r1_01-02” indicates a leg segment (from Route 1) that connects Waypoints 01 and 02. The segments between the two solid lines in each figure refer to the channel shared by all three routes (see Figure 1(b)).
Figure 4 shows that the probability of collisions consistently increases at each segment as traffic volume increases. It implies that the increase of traffic might result more collisions. The three routes have overlapping segments as shown in Figure 1(b), especially for Routes 1 and 3. The simulation results suggest that these overlapping segments have highest probability of collisions in the SNWW. These results are well expected, since the traffic from three routes shares the same channel. Moreover, when the traffic rises, high-probability segments are likely to be more vulnerable (i.e., the probability of collisions increases more than proportionality of the increased traffic volume) than low-probability segments. Therefore, it is of great interest for maritime authorities and researchers to find those high-probability segments along the navigation routes. This issue will be specifically addressed in Section 4.2.
(a) Probability of collisions at each leg segment of Route 1
(Common segments: r1_09-10 tor1_17-18, i.e., the segments within the window in the figure)
0.E+001.E‐072.E‐073.E‐074.E‐075.E‐076.E‐077.E‐078.E‐079.E‐07
r1_01‐02
r1_02‐03
r1_03‐04
r1_04‐05
r1_05‐06
r1_06‐07
r1_07‐08
r1_08‐09
r1_09‐10
r1_10‐11
r1_11‐12
r1_12‐13
r1_13‐14
r1_14‐15
r1_15‐16
r1_16‐17
r1_17‐18
r1_18‐19
r1_19‐20
r1_20‐21
r1_21‐22
r1_22‐23
r1_23‐24
r1_24‐25
r1_25‐26
r1_26‐27
r1_27‐28
r1_28‐29
r1_29‐30
r1_30‐31
r1_31‐32
r1_32‐33
r1_33‐34
r1_34‐35
r1_35‐36
# Collisions Per Year Per Trip
Leg Segment Along Route 1
Current Traffic Volume
25% of Traffic Increase
25% of Traffic Decrease
TRB 2014 Annual Meeting Paper revised from original submittal.

11
(b) Probability of collisions at each leg segment of Route 2 (Common segments: r2_24-25 to r1_32-33, i.e., the segments within the window in the figure)
(c) Probability of collisions at each leg segment of Route 3 (Common segments: r1_09-10 to r1_17-18, i.e., the segments within the window in the figure)
Figure 4 Probability of collisions at each leg segment of three routes under three traffic scenarios (The common segments of three routes is the waterway between the northern and southern intersections
of the GIWW and SNWW)
4.2 Probabilities of Groundings The probability of groundings at each leg segment of three routes was also estimated using the GRACAT simulation. Meanwhile, we also estimated the probability of vessel-bridge allisions (as hard groundings in the GRACAT) at each location of bridges. The probabilities of groundings and vessel-bridge allisions along three routes (based on the current traffic) are reported, respectively, in Figure 5.
By comparing the results in Figure 5 with those in Figure 4, it is easy to see that each segment of the SNWW see much larger probability of groundings than that of collisions. However, since most are soft groundings, the consequence of groundings are thought to be less serious than collisions. On the other hand, it is seen that at the waterway segment near a bridge, vessel-bridge allisions are much more likely to
0.E+001.E‐072.E‐073.E‐074.E‐075.E‐076.E‐077.E‐078.E‐079.E‐07
r2_01‐02
r2_03‐04
r2_05‐06
r2_07‐08
r2_09‐10
r2_11‐12
r2_13‐14
r2_15‐16
r2_17‐18
r2_19‐20
r2_21‐22
r2_23‐24
r2_25‐26
r2_27‐28
r2_29‐30
r2_31‐32
r2_33‐34
r2_35‐36
r2_37‐38
r2_39‐40
r2_41‐42
r2_43‐44
r2_45‐46
# Collisions Per Year Per Trip
Leg Segment Along Route 2
Currentl traffic volume
25% of Traffic Increase
25% of Traffic Decrease
0.E+00
1.E‐07
2.E‐07
3.E‐07
4.E‐07
5.E‐07
6.E‐07
7.E‐07
8.E‐07
9.E‐07
r3_01‐02
r3_02‐03
r3_03‐04
r3_04‐05
r3_05‐06
r3_06‐07
r3_07‐08
r3_08‐09
r3_09‐10
r3_10‐11
r3_11‐12
r3_12‐13
r3_13‐14
r3_14‐15
r3_15‐16
r3_16‐17
r3_17‐18
r3_18‐19
r3_19‐20
r3_20‐21
r3_21‐22
r3_22‐23
r3_23‐24
r3_24‐25
r3_25‐26
r3_26‐27
r3_27‐28
r3_28‐29
r3_29‐30
r3_30‐31
# Collisions Per Year Per Trip
Leg Segment Along Route 3
Current traffic volume
25% of traffic increase
25% of traffic decrease
TRB 2014 Annual Meeting Paper revised from original submittal.

12
occur than vessel groundings, and thus also they are much more likely to happen than vessel collisions. For example, the probabilities of vessel-bridge allisions are 6.33 (Bridge 1), 1.08 (Bridge 2) and 2.69 (Bridge 3) times of the probabilities of groundings at the same locations, respectively. Note that the consequence of a vessel-bridge allision would be similar to vessel collisions. Therefore, vessel-bridge allisions are the most dangerous: it has high probability of occurrence and its consequence would be serious. To this end, the vessels near bridges should be given high priority in managing and monitoring. Among three bridges, Bridge 2 is most vulnerable: the waterway near this bridge is shared by three routes, and the probability of vessel-bridge allisions is the highest.
(a) Probability of groundings and vessel-bridge allisions at each leg segment of Route 1 (Common segments: r1_09-10 to r1_17-18, i.e., the segments within the window in the figure)
(b) Probability of groundings and vessel-bridge allisions at each leg segment of Route 2 (Common segments: r2_24-25 to r2_32-33, i.e., the segments within the window in the figure)
0.0E+00
1.0E‐04
2.0E‐04
3.0E‐04
4.0E‐04
5.0E‐04
# Groundings Per Year Per Trip Grounding
Vessel‐Bridge Allision
0.0E+00
1.0E‐04
2.0E‐04
3.0E‐04
4.0E‐04
5.0E‐04
6.0E‐04
r2_01‐02
r2_03‐04
r2_05‐06
r2_07‐08
r2_09‐10
r2_11‐12
r2_13‐14
r2_15‐16
r2_17‐18
r2_19‐20
r2_21‐22
r2_23‐24
r2_25‐26
r2_27‐28
r2_29‐30
r2_31‐32
r2_33‐34
r2_35‐36
r2_37‐38
r2_39‐40
r2_41‐42
r2_43‐44
r2_45‐46
# Groundings Per Year Per Trip Grounding
Vessel‐Bridge Allision
Bridge 2
Bridge 3
Bridge 2
Bridge 1
TRB 2014 Annual Meeting Paper revised from original submittal.

13
(c) Probability of groundings and vessel-bridge allisions at each leg segment of Route 3 (Common segments: r3_09-10 to r3_17-18, i.e., the segments within the window in the figure)
Figure 5 Probabilities of groundings and vessel-bridge allisions at each segment of three routes (The common segments of three routes is the waterway between the northern and southern intersections
of the GIWW and SNWW)
It is found that the traffic actually has no impact on the probabilities of vessel groundings (including vessel-bridge allisions as “hard groundings” in the GRACAT). By changing the traffic volume, the probability of groundings and vessel-bridge allisions does not change at all at any segment of the channel. This implies that the occurrence of groundings and vessel-bridge allisions may be primarily determined by the geographic characteristics like the channel’s width, depth, shape, grounding points, ground condition etc., and other factors rather than the traffic volume. It may also be due to the fact that the SNWW uses a one-way traffic system which prevents large vessels from passing one another.
4.2 Waterway Segments of Different Risk Levels of Collisions or Groundings It should be noted that the results from the simulation are different from the actual frequencies of collisions and groundings in three routes reported in previous years (see Table 1). The reason is that the simulation assumes “blind navigation” and two vessels are assumed to be able to detect each other under the same conditions. In the real world, however, a vessel is not blindly navigated in most cases unless the visibility is low. However, the simulation provides us some meaningful results – the probability of collisions or groundings are found for each segment of the SNWW. If the probabilities of collisions or groundings are high in some specific segments, then these segments can be regarded as the high-collision/ grounding-probability segments, respectively. Therefore, once such segments with high probability of collisions or groundings are identified, they should be monitored closely in daily traffic management and should be given higher priority in the channel improvement project.
In this paper, the probability of collisions is regarded as low if it is smaller than 1.5E-7; medium if it is 1.5E-7 or larger but less than 2.8E-7; high if it is 2.8E-7 or larger but less than 4.4E-7; very high if it is 4.4E-7or larger.
On the other hand, as to groundings, the probability is regarded to be low if it less than 2.0E-4; medium if it is 2.0E-4 or larger but less than 3.0E-4; high if it is 3.0E-4 or larger but less than 4.0E-4; very high if it is 4.0E-4 or larger.
0.0E+00
5.0E‐05
1.0E‐04
1.5E‐04
2.0E‐04
2.5E‐04
3.0E‐04
3.5E‐04
4.0E‐04
4.5E‐04
r3_01‐02
r3_02‐03
r3_03‐04
r3_04‐05
r3_05‐06
r3_06‐07
r3_07‐08
r3_08‐09
r3_09‐10
r3_10‐11
r3_11‐12
r3_12‐13
r3_13‐14
r3_14‐15
r3_15‐16
r3_16‐17
r3_17‐18
r3_18‐19
r3_19‐20
r3_20‐21
r3_21‐22
r3_22‐23
r3_23‐24
r3_24‐25
r3_25‐26
r3_26‐27
r3_27‐28
r3_28‐29
r3_29‐30
r3_30‐31
# Groundings Per Year Per Trip
Grounding
Vessel‐Bridge Allision
Bridge 2
TRB 2014 Annual Meeting Paper revised from original submittal.

14
Based on such criteria, all segments of three routes are categorized into four groups of collision probability levels, as shown in Figures 6a. Around 20%, 18% and 27% of the segments of Routes 1, 2 and 3 suffers from high or even very high level of collision probabilities.
On the other hand, the grounding probability in the SNWW is even more critical. 37%, 38% and 27% of segments of Routes 1, 2 and 3 see high or very high level of grounding probabilities, respectively (see Figure 6b). Note that the probability of groundings is in a magnitude of 1E-4 while that of collisions are in a magnitude of 1E-7. Therefore, the SNWW is more likely to see vessel groundings than vessel collisions based on the current conditions. However, as most vessel groundings are soft, the consequence of groundings would be less serious than vessel collisions.
As to vessel-bridge allisions, the probability of allision is high at the location of Bridge 2; while they are relatively low at the locations of other two bridges. However, they (in a magnitude of 1E-4) are still much higher than the probabilities of vessel collisions (in a magnitude of 1E-7). Therefore, the waterway segment near bridges, especially Bridge 2, should be especially closely monitored to avoid vessel-bridge allisions, which probability is relatively high and consequence would be much more serious than soft groundings.
The waterway channel shared by all three routes suffers high probabilities of vessel collisions, as expected (see Figure 6a). However, the probabilities of groundings in this part of channel are low except a small segment in this part of channel, as seen in Figure 6b, because of the geographical features in this channel. On the other hand, the segments which have high probabilities of groundings are those close to the ports; while these segments see low probabilities of collisions. The reason is that the segments of Route 1 and 3 near the ports only allow one-way traffic. It is also found that the jettied entrance channel to the Gulf also suffers high probabilities of both collisions and groundings.
(a) Probability levels of vessel collisions
TRB 2014 Annual Meeting Paper revised from original submittal.

15
(b) Probability levels of vessel groundings
Figure 6 Probability levels of collisions/groundings along three routes estimated by the GRACAT model
(a) Locations of vessel collisions
TRB 2014 Annual Meeting Paper revised from original submittal.

16
(b) Locations of vessel groundings
Figure 7 Locations of vessel collisions and groundings that occurred in 2009, 2011 and 2012 (Source: SETWAC, 2013)
From the historical data of vessel accidents in the SNWW in 2009, 2011 and 2012 (SETWAC, 2013) (only three years; data have accident location information available), the locations where the collisions or groundings took place are indicated in the map, as seen in Figure 7, respectively1. It is found that the most vessel collisions and groundings did occur in those segments with high probabilities, as indicated in red and orange segments, as shown in Figure 6. For example, most vessel collisions occurred in the channel shared by all three routes; while most vessel groundings took place near the ports and in the entrance channel to the Gulf. They are well aligned with the results from the simulation.
5. Conclusions This paper evaluates the probabilities of collisions and groundings along the Sabine-Neches Waterway (SNWW) in Southeast Texas, using the grounding and collision analysis toolbox (GRACAT). We defined three routes in the SNWW. The three routes and the associated geometric data are imported into the GRACAT model for simulation of vessel collisions and groundings. Each route is divided into many segments for analyzing the probabilities of collisions and groundings. Findings from this paper are summarized in the following:
The probabilities of collisions increase with the increase of the traffic volume in the channel. Moreover, when the traffic increases, the probability of collision increases disproportionately in the high probability segments.
The change of traffic volume has no impact on the probability of groundings, which implies that the probability of groundings is independent of the traffic volume.
1 In Table 1, we report the accident data during 7 years from 2006 to 2012. However, as to the locations of vessel accidents, only three years’ data are available (2009, 2011 and 2012).
TRB 2014 Annual Meeting Paper revised from original submittal.

17
The vessel groundings are much more likely to occur than vessel collisions in the SNWW based on the current conditions. However, these groundings’ consequences are less serious than collisions, as they are primarily soft groundings due to the geological conditions in the SNWW. In the past, the big vessel accidents which caused serious consequences, such as the oil spill in 2010, were caused by the vessel collisions. Therefore, we should pay more attention to reduce the probability of vessel collisions in the waterway planning and management.
Vessel-bridge allisions are the most dangerous. Their consequences are thought to be similar to vessel collisions, but they are much high likely to happen than vessel collisions. Especially, the waterway segment near Bridge 2 sees a high probability of vessel-bridge allisions. Therefore, the waterway near bridges (especially Bridge 2) should be closely monitored to avoid vessel-bridge allisions.
Waterway segments of high probabilities of collisions or groundings along three routes are identified, respectively. It is much more likely that vessel collisions take place in the channel shared by three routes than other segments, as expected. However, the probabilities of groundings in this part of channel are relatively low. The channel near the ports sees high probabilities of groundings, but low probabilities of collisions. Meanwhile, the jettied entrance channel to the Gulf is another part of channel which has high probabilities of both collisions and groundings. The actual locations of vessel collisions and groundings in past years are consistent with the results obtained from the simulation.
In this paper, we used many default settings of the causation factors in the GRACAT due to the lack of real vessel maneuvering data. Therefore, it may bring some bias to the results, as the GRACAT is designed based on the European waterways. In the future, we should collect more data in the SNWW, especially those related to vessel maneuvering. Meanwhile, it is of our interest to test the data on other simulation models and to compare the results, so that we can better understand the errors from these simulation results. It warrants the investigation in the future.
Acknowledgement This research is partially sponsored by the Texas A&M Transportation Institute. The authors assume
sole responsibilities for the content expressed.
Reference Fujii Y, Tanaka K. (1971) Traffic capacity. Journal of Navigation, vol 24, no. 4, pp.543-552. Friis-Hansen, P. and B. C. Simonsen (2002) GRACAT: software for grounding and collision risk
analysis.Marine Structure, vol. 15, pp. 383-401. Friis-Hansen, P. (2000) Basic modeling principles and validation of software for prediction of
frequencies.ISESO Report No. ID I107/I108.00.02.052.004, Department of Naval Architecture and Offshore Engineering, Technical University of Denmark, May 30, 2000.
Fowler, T. G. and E. Sorgard (2000) Modeling ship transportation risk. Risk Analysis, vol.20, no. 2, pp. 225-244.
Gluver, H. and Olsen, D. (1998) Current practice in risk analysis of ship collisions to bridges. In: Gluver, Olsen, editors. Proceedings of the International Symposium on Advances in Ship Collision Analysis. Copenhagen, Denmark, May, 1998, pp. 85–96.
GuedesSoares, C., A. P. Teixeira (2001) Risk assessment in maritime transportation. Reliability Engineering and Systems Safety, vol.74, no.3, pp.299-309.
Li, S., M. Qiang and X. Qu (2012) An overview of maritime waterway quantitative risk assessment models. Risk Analysis, vol. 32, no. 3, pp. 496-512.
TRB 2014 Annual Meeting Paper revised from original submittal.

18
Macduff, T. (1974) Probability of vessel collisions.Ocean Industry, vol. 9, no.9, pp.144-148. Macias, A. (2006). Millionth ton of military cargo passes through Port of Beaumont, Texas. Beaumont
Enterprise (Beaumont), retrieved March 2nd, 2013. Mathes, S., K. Nielsen, J. Engen, E. Haaland (1997) ATOMOSR II – Final report. Brussels: European
Commission. Merrick, J. R. W., J. R. van Dorp, J. Harrald, T. Mazzuchi, J. Spahn and M. Grabowski (2003) A traffic
density analysis of proposed ferry service expansion in San Francisco Bay using a maritime simulation model. Engineering and Systems Safety, vol.81, no.2, pp.119-132.
Merrick, J. R. W., J. R. van Dorp and V. Dinesh (2005) Assessing uncertainty in simulation based maritime risk assessment. Risk Analysis, vol. 25, no. 3, pp. 731-743.
Merrick, J. R. W. and J. R. van Dorp (2006) Speaking the truth in maritime risk assessment. Risk Analysis, vol. 26, no. 1, pp. 223-237.
Otto, S., P. T. (2002) Pedersen Elements of risk analysis for collision and Grounding of a RoRo passenger ferry. Marine Structures, vol.15, no. 4-5, pp. 461-474.
Roeleven, D., M. Kok, H. L. Stidonk and W. A. de Vries (1995) Inland waterway transport: modeling the probabilities of an accident. Safety Science, vol.19, no.2-3, pp. 191-202.
SETWAC (2013) Southeast Texas Waterways Advisory Council.www.setwac.org, retrieved October 2nd, 2013.
Simonsen B. C. (2000) Validation of software for prediction of grounding damage.ISESO Report No. I107.02.02.052.004, Department of Naval Architecture and Offshore Engineering, Technical University of Denmark, April 2000.
Szwed, P., J. Rene van Dorp, J. R. W. Merrick, T. A. Mazzuchi and A. Singh (2006) A Bayesian paired comparison approach for relative accident probability assessment with covariate information. European Journal of Operational Research, vol.169, pp.157-177.
Transportation Safety Board of Canada (TSB) (1998) Safety study of the operational relationship between ship master/watch-keeping officers and marine pilots, http:www.bst.gc.ca.
Trucco P., E. Cagno, F. Ruggeri and O. Grande (2008) Reliability Engineering and Systems Safety, vol.93, no.6, pp.845-856.
TX State Government (2013) Texas Economic trend and outlook. http://www.window.state.tx.us/ ecodata/regional/southeast/outlook.html, retrieved March 2nd, 2013.
van Drop, J., J. Merrick, J. Harrald, T. Mazzuchi and M. Grabowski (2001) A risk management procedure for the Washington State Ferries. Risk Analysis, vol. 21, no. 1, pp. 127-142.
World Port Source (2013) http://www.worldportsource.com/ports/review/USA_TX_Port_of_ Beaumont_257.php, retrieved March 2, 2013.
U.S. Army Corps of Engineers (USACE) (2010): Sabine-Neches waterway channel improvement project Southeast Texas and Southwest Louisiana, http://www.usace.army.mil/Portals/2/ docs/civilworks/CWRB/sabine/sabine.pdf.
U.S Coastal Guard (USCG) (2013) Vessel Traffic Service Port Arthur.http://www.uscg.mil/d8/vtsportarthur/, last visited in July 28th, 2013
TRB 2014 Annual Meeting Paper revised from original submittal.