Probability analysis of rainfall and crop water ...ndpublisher.in/admin/issues/IJAEBv9n1q.pdf ·...
14
Sharma et al . (2010) reported that India ranks first among the countries that practice rainfed agriculture. Rainfall is a key factor for agriculture Probability analysis of rainfall and crop water requirement using CROPWAT model for crop planning in a canal command of upper Bhima Basin of Maharashtra Shikha Sachan* 1 , V.K. Chandola 1 and A.K. Lohani 2 1 Institute of Agricultural Sciences, Banaras Hindu University, Vanarasi, India 2 National Institute of Hydrology, Roorkee-247667, Uttarakhand, India *Corresponding author: [email protected] Paper No. 421 Received: 25 August 2015 Accepted: 11 February 2016 Abstract Rainfall is the most important climatic parameters influencing agriculture in Pune district of Maharashtra. Rainfall of this region is highly variable with respect to space and time and about 80-90% of precipitation falls in monsoon period from June to October resulting in drought and flood situation in the upper Bhima basin of Maharashtra. Therefore, for efficient water resources management, optimal crop planning and also for beer understanding of rainfall behavior (i.e., distribution and minimum expected amount during crop growing period) probability analysis of rainfall was conducted. Probability analysis (at 50% and 80%) of monthly rainfall data of 13 raingauge stations of the leſt bank canal of upper Bhima basin viz., Urali, Loni Karbol, Kasurdi, Tajuproject, Yewat, Dahitane, Bhigwan, Madanwadi, Pondewadi, Kedgaon, Patas, Pimplegaon and Daund for the period from 1975 to 2002 was conducted. Reference evapotranspiration (ETo) has been calculated using climatic parameters like sun shine hour, wind speed, maximum & minimum temperature and rainfall humidity for the period from years 1993-2005 by CROPWAT model. It was found that ETo is maximum (7.72 mm/day) during April and low in December (3.10 mm/day). Effective rainfall of existing rain gauge stations falling in different sub-basins, BM48, BM49, BM50, BM51 and BM68 have been estimated using the CROPWAT model. Finally net irrigation requirement of crops Kharif Coon, Summer Coon, Sugarcane and Rabi Sorghum have been find out for all the sub-basin. From this study it has been concluded that, the crop planning in the area, represented by Pimplegoan and Urali stations should be done keeping in mind maximum deficit of 187 mm and 113 mm of water respectively during July. Similarly in other stations maximum deficit of water was observed during September which indicate that while selection of crops for the areas represented by these stations the crops requiring less water during September should be selected. Highlights • Deficit rainfall for different months obtained through probability analysis of rainfall data at 50 % and 80 % probability and net irrigation requirement worked out through CROPWAT model. • The monthly rainfall deficit and Net irrigation requirement provided a road map for efficient crop planning. Keywords: rainfall, probability analysis, evaporation, evapotranspiration, CROPWAT model crop planning and related several economic in tropical to dry areas which govern the crop yield and decide the choice of the crops that can be grown due to highly International Journal of Agriculture, Environment and Biotechnology Citation: IJAEB: 9(1): 123-135 February 2016 DOI Number: 10.5958/2230-732X.2016.00019.X ©2016 New Delhi Publishers. All rights reserved AGRICULTURAL ENGINEERING
Transcript of Probability analysis of rainfall and crop water ...ndpublisher.in/admin/issues/IJAEBv9n1q.pdf ·...
Sharma et al. (2010) reported that India ranks first among the countries that practice rainfed agriculture. Rainfall is a key factor for agriculture
Probability analysis of rainfall and crop water requirement using CROPWAT model for crop planning in a canal command of upper Bhima Basin of MaharashtraShikha Sachan*1, V.K. Chandola1 and A.K. Lohani2
1Institute of Agricultural Sciences, Banaras Hindu University, Vanarasi, India2National Institute of Hydrology, Roorkee-247667, Uttarakhand, India
*Corresponding author: [email protected]
Paper No. 421 Received: 25 August 2015 Accepted: 11 February 2016
Abstract
Rainfall is the most important climatic parameters influencing agriculture in Pune district of Maharashtra. Rainfall of this region is highly variable with respect to space and time and about 80-90% of precipitation falls in monsoon period from June to October resulting in drought and flood situation in the upper Bhima basin of Maharashtra. Therefore, for efficient water resources management, optimal crop planning and also for better understanding of rainfall behavior (i.e., distribution and minimum expected amount during crop growing period) probability analysis of rainfall was conducted. Probability analysis (at 50% and 80%) of monthly rainfall data of 13 raingauge stations of the left bank canal of upper Bhima basin viz., Urali, Loni Karbol, Kasurdi, Tajuproject, Yewat, Dahitane, Bhigwan, Madanwadi, Pondewadi, Kedgaon, Patas, Pimplegaon and Daund for the period from 1975 to 2002 was conducted. Reference evapotranspiration (ETo) has been calculated using climatic parameters like sun shine hour, wind speed, maximum & minimum temperature and rainfall humidity for the period from years 1993-2005 by CROPWAT model. It was found that ETo is maximum (7.72 mm/day) during April and low in December (3.10 mm/day). Effective rainfall of existing rain gauge stations falling in different sub-basins, BM48, BM49, BM50, BM51 and BM68 have been estimated using the CROPWAT model. Finally net irrigation requirement of crops Kharif Cotton, Summer Cotton, Sugarcane and Rabi Sorghum have been find out for all the sub-basin. From this study it has been concluded that, the crop planning in the area, represented by Pimplegoan and Urali stations should be done keeping in mind maximum deficit of 187 mm and 113 mm of water respectively during July. Similarly in other stations maximum deficit of water was observed during September which indicate that while selection of crops for the areas represented by these stations the crops requiring less water during September should be selected.
Highlights • Deficit rainfall for different months obtained through probability analysis of rainfall data at 50 %
and 80 % probability and net irrigation requirement worked out through CROPWAT model. • The monthly rainfall deficit and Net irrigation requirement provided a road map for efficient crop
planning.
Keywords: rainfall, probability analysis, evaporation, evapotranspiration, CROPWAT model crop planning
and related several economic in tropical to dry areas which govern the crop yield and decide the choice of the crops that can be grown due to highly
International Journal of Agriculture, Environment and BiotechnologyCitation: IJAEB: 9(1): 123-135 February 2016DOI Number: 10.5958/2230-732X.2016.00019.X
©2016 New Delhi Publishers. All rights reserved
AGRICULTURAL ENGINEERING

Sachan et al.
124
spatial and temporal variation of rainfall over the region (Shinde et al. 2012). To meet the future food demands and growing competition for water among various sectors, a more efficient use of water will be essential. In agriculture, climatic and soil factors are responsible for Crop production. Rain water management and its optimum utilization is a prime issue of present day research for sustainability of rainfed agriculture. Detail knowledge of rainfall distribution can help in deciding the time of different agricultural operations and designing of water harvesting structures to meet out irrigation requirement as suggested by Prakash et al. (1996) and Sharma et al. (1979). Galkate et al. (2012) has carried out water availability study in Kharun river basin of Chhattisgarh state to estimate dependable flow in the river basin at various probability levels at different time periods and to analyze the flow regime under virgin and regulated condition using Mike Basin software and Flow Duration Curve technique. To ensure water availability and dependability to all the farmers can be done by proper utilization and conservation of rain water during rainy season for life saving irrigation as a supplementary especially during peak irrigation demand of crops growing in a region and also for increasing the crop productivity by irrigating more area whole year (Kothari et al. 2007, Das et al. 1988). Productivity of crop is a function of number of input variables, out of which climate is the most important. Rainfall was characterized by its variability and probability distribution and essential for sustainable crop planning studied by some reviewer (Mohanty et al. 2000, Rana et al. 1998). Thimme et al. (2013) determined the crop evapotranspiration using the CROPWAT model developed by the Land and Water Development Division of Food and Agricultural Organization (FAO) to study water requirement of maize (Zea mays L.) under rainfed condition at Dharwad. Singh et al. (2014) evaluated various methods (Penmann-Montieth, Hargreaves, SCS-Blaney-Criddle and Thornthwaite) for estimating the evapotranspiration and compared them for assessing their predictive capability for Bhopal and Indore districts. Generally the crops suffer from both, water-logging and moisture-stress during wet and dry spells, respectively. In rainfed agriculture, where moisture is one of the most limiting factors,
the crop yields are more affected by the rainfall fluctuations at the critical crop growth stages. The monsoon is generally responsible for the major portion of annual rainfall over the Indian subcontinent. Rainfall distribution has been found to have profound effect on crop performance in rainfed agriculture. Therefore, a long-term probability analysis can provide a basis for planning cropping pattern and water management strategy. For planning an irrigation water supply system, the irrigation water requirement during different months of the crop growing period, which is a function of rainfall deficit in those months, needs to be determined. Ali et al. (2005) analyzed that rainfall deficit information (under different probability or risk) for different areas and periods can greatly help in determining optimum water release from a reservoir or source in accordance with demand. Rainfall prediction under different expectation can help farmers in determining best adapted plant species, the optimum time of ploughing and sowing, planning of supplemental irrigation schemes, evaluation of alternative cropping and soil-water management plans, and selection of harvesting time. The long-term variability of monthly total rainfall is also required in many areas of water resource management and engineering design and budgeting of water use for optimum crop yieid, selecting areas for profitable rainfed farming and developing possible means for utilization of excess rain water (e.g. rainwater harvesting) during monsoon season. It may also help in identification of appropriate crops and cropping sequences that can match the water-availability duration to ensure increased and stabilized crop production under rainfed condition.
Material and methods
Study Area
The Krishna river basin is the fifth largest river system in India. The Bhima river is one of two major tributaries of the Krishna. Upper Bhima basin is situated almost (98.4%) within the Maharashtra state, India covering an area of 46066 Km2 (Garg et al. 2011a). The catchment has a highly diverse climate mainly caused by the interaction between the monsoon and the Western Ghat mountain range (Gunnel 1997). In this catchment rainfall decreases
Probability analysis of rainfall and crop water requirement using CROPWAT model for crop planning...
125
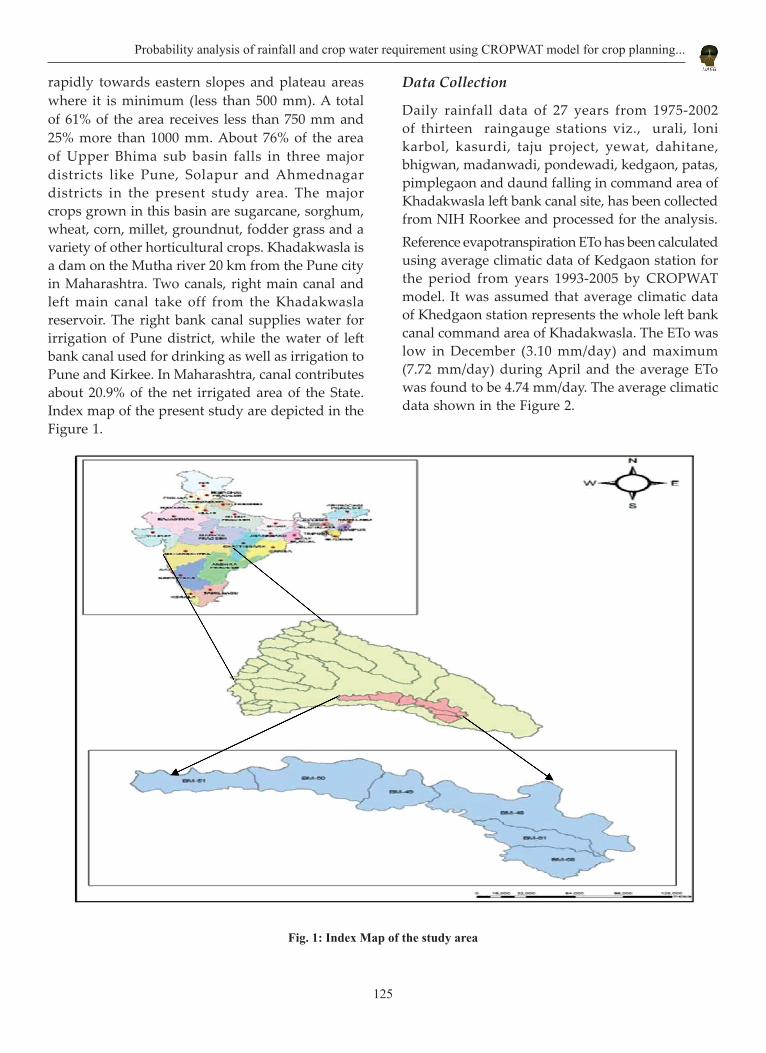
rapidly towards eastern slopes and plateau areas where it is minimum (less than 500 mm). A total of 61% of the area receives less than 750 mm and 25% more than 1000 mm. About 76% of the area of Upper Bhima sub basin falls in three major districts like Pune, Solapur and Ahmednagar districts in the present study area. The major crops grown in this basin are sugarcane, sorghum, wheat, corn, millet, groundnut, fodder grass and a variety of other horticultural crops. Khadakwasla is a dam on the Mutha river 20 km from the Pune city in Maharashtra. Two canals, right main canal and left main canal take off from the Khadakwasla reservoir. The right bank canal supplies water for irrigation of Pune district, while the water of left bank canal used for drinking as well as irrigation to Pune and Kirkee. In Maharashtra, canal contributes about 20.9% of the net irrigated area of the State. Index map of the present study are depicted in the Figure 1.
Data Collection
Daily rainfall data of 27 years from 1975-2002 of thirteen raingauge stations viz., urali, loni karbol, kasurdi, taju project, yewat, dahitane, bhigwan, madanwadi, pondewadi, kedgaon, patas, pimplegaon and daund falling in command area of Khadakwasla left bank canal site, has been collected from NIH Roorkee and processed for the analysis.Reference evapotranspiration ETo has been calculated using average climatic data of Kedgaon station for the period from years 1993-2005 by CROPWAT model. It was assumed that average climatic data of Khedgaon station represents the whole left bank canal command area of Khadakwasla. The ETo was low in December (3.10 mm/day) and maximum (7.72 mm/day) during April and the average ETo was found to be 4.74 mm/day. The average climatic data shown in the Figure 2.
Fig. 1: Index Map of the study area

Sachan et al.
126
Fig. 2: Average climatic data of the study area
Probability Analysis
The probability analysis of annual rainfall is important to predict the relative frequency of occurrence in different group interval of annual rainfall with reasonable accuracy. Rainfall data of normal, wet and dry years are used for the programming of the irrigation water supply and management system. Rainfall at 20, 50 and 80% probability of exceedance represent a wet, normal and dry year respectively. In general, the rainfall at 50% probability provide the average rainfall. The probability of occurrence of 80% of annual rainfall (Pdry) and 50% of annual rainfall (Pavg) has been computed. The average monthly rainfall (Pi avg) for each of the twelve months has also computed to delineate the dry months (Pi,dry) and the irrigation water planning was for the left bank canal of Khadakwasla reservoir . The computation was carried out as described below:
1. Computation of normal/average yearly rainfall at each station for a given time period was conducted:
Normal rainfall: X
X =N
Σ (Eq.1)
2. The annual rainfall data set was arranged in the descending order of rainfall magnitudes.
3. Data were ranked as, m = 1, 2, 3 up to last record.
4. Cumulative Probability (P) was determined at 50%(Pavg) and 80%(Pdry) of annual rainfall:
MP = 100
N +1× (Eq.2)
Where, M = rank number,
N = total number of rainfall records
5. In the similar manner the cumulative probability was also determined at 50% of monthly rainfall (Pi,avg) by following step 2-4.
6. The probabilities thus found were plotted on log-normal probability paper. The logarithmic regression equation was obtained and the points were found to approximate a straight line which indicated in all cases that the distribution is approximately log-normal.
7. Then year values at 20%, 50% and 80% probabilities (P20, P50, P80) were selected. The P20, P50 and P80 represents the wet, average and dry year respectively.
8. Monthly values of rainfall for the dry year were determined according to the following relationship:
Pi, dry = Pi, avg * Pdry
Pavg (Eq.3)
Here,
Pi, avg = Average monthly rainfall for month i, (i = 1, 2, 3, ………….., 12),
Pi, dry = monthly rainfall dry year for month i,
P, dry = yearly rainfall at 80% probability of exceedance,
P, avg = Average yearly rainfall at 50% probability of exceedance
9. The mean monthly rainfall for average (P50) and wet rainfall condition (P20) were calculated in the similar way.
Probability analysis of rainfall and crop water requirement using CROPWAT model for crop planning...
127
Effective rainfallThe rainfall is the basic inputs for determination of crop water requirement. The rainfall contributes to a greater or lesser extent in satisfying crop water requirement, depending on the location. There are so many methods are available to findout the effective rainfall but in CROPWAT model, USDA soil conservation formula used to calculate the effective rainfall.
Net irrigation requirements of cropsThe water requirement may be defined as the quantity of water, regardless of its source, required by a crop or diversified pattern of crops in a given period of time for its normal growth under field conditions at a place. The water applied in the field during irrigation acts as a carrier for nutrients to plants and a major part of applied water lost through transpiration with little uses by plants for building tissues. The crop water requirement includes evapotranspiration, application losses and special needs. Application losses include the loss of water during water application. Special needs include water required for land preparation, transplantation and leaching etc. In the present study, CROPWAT 8.0 software has been used for computation of crop ET and irrigation water requirement.
ETc = Kc * ET0 (Eq. 4)
Where,
ETC = crop evapotranspiration (mm/day)
Kc= crop coefficient and
ETO= reference evapotranspiration (mm/day)
The net irrigation requirement of crop can be estimated from the following equation,
NIR = ETC – ER (Eq. 5)
Where, NIR = Net irrigation requirement in a given
month, mm/month and
ER = Effective rainfall in a given month, mm/month
The NIR for major crops grown in the study area for all sub-basins (BM48, BM49, BM50, BM51 and BM68) in existing canal command area were determined for the dry months from the monthly rainfall series for the year 1975 to 2002 using CROPWAT 8.0 model taking climatic parameters as input. Crop coefficient values of all crops have been taken as per the guidelines of FAO for estimating the net irrigation requirement of crops.
Results and discussion
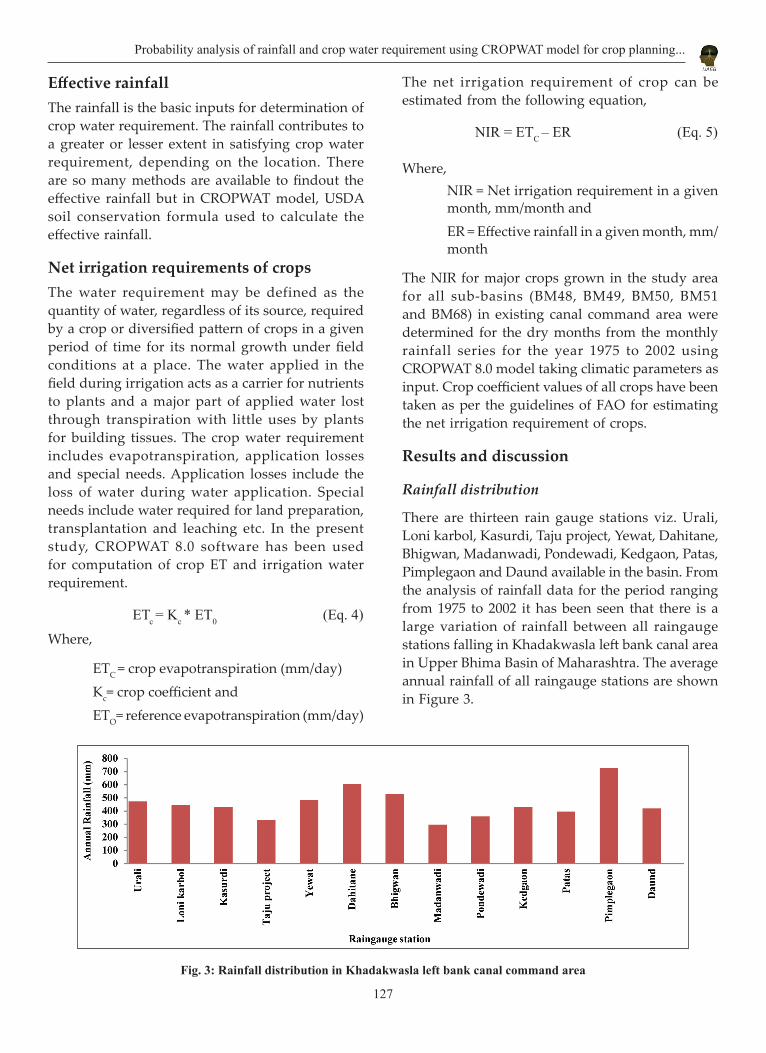
Rainfall distribution
There are thirteen rain gauge stations viz. Urali, Loni karbol, Kasurdi, Taju project, Yewat, Dahitane, Bhigwan, Madanwadi, Pondewadi, Kedgaon, Patas, Pimplegaon and Daund available in the basin. From the analysis of rainfall data for the period ranging from 1975 to 2002 it has been seen that there is a large variation of rainfall between all raingauge stations falling in Khadakwasla left bank canal area in Upper Bhima Basin of Maharashtra. The average annual rainfall of all raingauge stations are shown in Figure 3.
Fig. 3: Rainfall distribution in Khadakwasla left bank canal command area
Sachan et al.
128
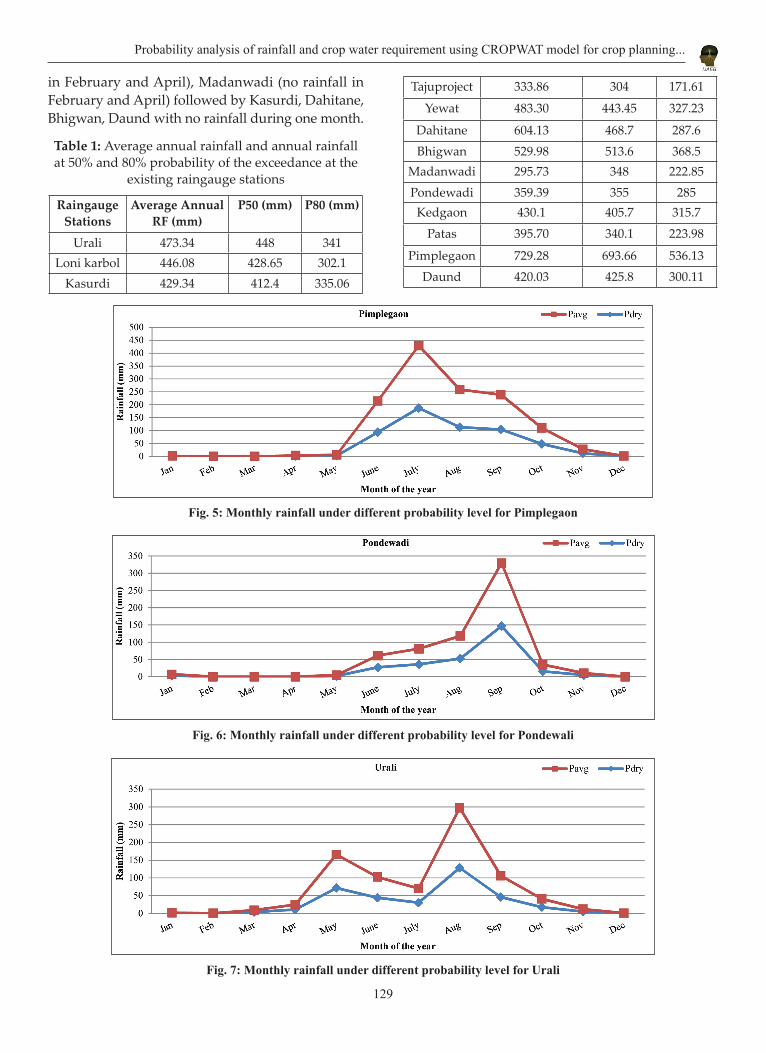
Of these thirteen stations, Pimplegaon recorded the highest average annual rainfall of 729.28 mm and Madanwadi (295.73 mm) recorded the lowest average rainfall. Thus, the rainfall analysis of thirteen rain gauge stations in Upper Bhima Basin showed a wide variation in the mean annual rainfall over the years (1975-2002). The mean annual rainfall for the period (1975-2002) was found to be 456.17 mm. Kumar et al. (2015) also reported that the knowledge of temporal pattern of rainfall trends is a basic and important requirement for agricultural planning and management of water resources.
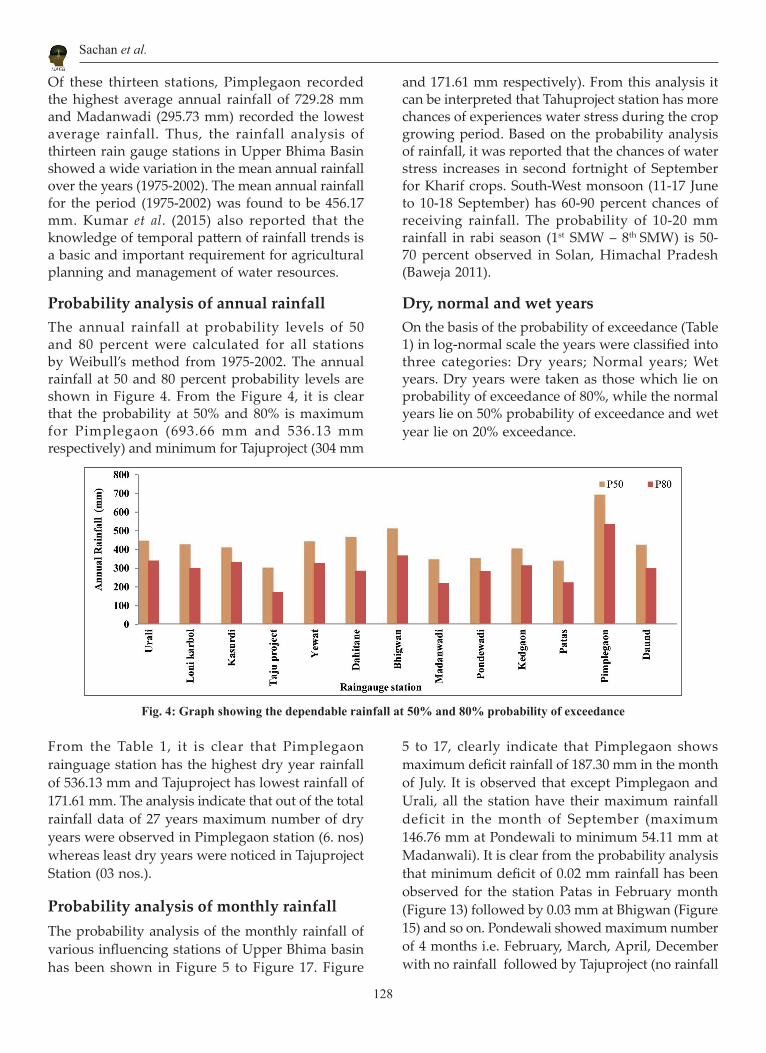
Probability analysis of annual rainfallThe annual rainfall at probability levels of 50 and 80 percent were calculated for all stations by Weibull’s method from 1975-2002. The annual rainfall at 50 and 80 percent probability levels are shown in Figure 4. From the Figure 4, it is clear that the probability at 50% and 80% is maximum for Pimplegaon (693.66 mm and 536.13 mm respectively) and minimum for Tajuproject (304 mm
and 171.61 mm respectively). From this analysis it can be interpreted that Tahuproject station has more chances of experiences water stress during the crop growing period. Based on the probability analysis of rainfall, it was reported that the chances of water stress increases in second fortnight of September for Kharif crops. South-West monsoon (11-17 June to 10-18 September) has 60-90 percent chances of receiving rainfall. The probability of 10-20 mm rainfall in rabi season (1st SMW – 8th SMW) is 50-70 percent observed in Solan, Himachal Pradesh (Baweja 2011).
Dry, normal and wet yearsOn the basis of the probability of exceedance (Table 1) in log-normal scale the years were classified into three categories: Dry years; Normal years; Wet years. Dry years were taken as those which lie on probability of exceedance of 80%, while the normal years lie on 50% probability of exceedance and wet year lie on 20% exceedance.
Fig. 4: Graph showing the dependable rainfall at 50% and 80% probability of exceedance
From the Table 1, it is clear that Pimplegaon rainguage station has the highest dry year rainfall of 536.13 mm and Tajuproject has lowest rainfall of 171.61 mm. The analysis indicate that out of the total rainfall data of 27 years maximum number of dry years were observed in Pimplegaon station (6. nos) whereas least dry years were noticed in Tajuproject Station (03 nos.).
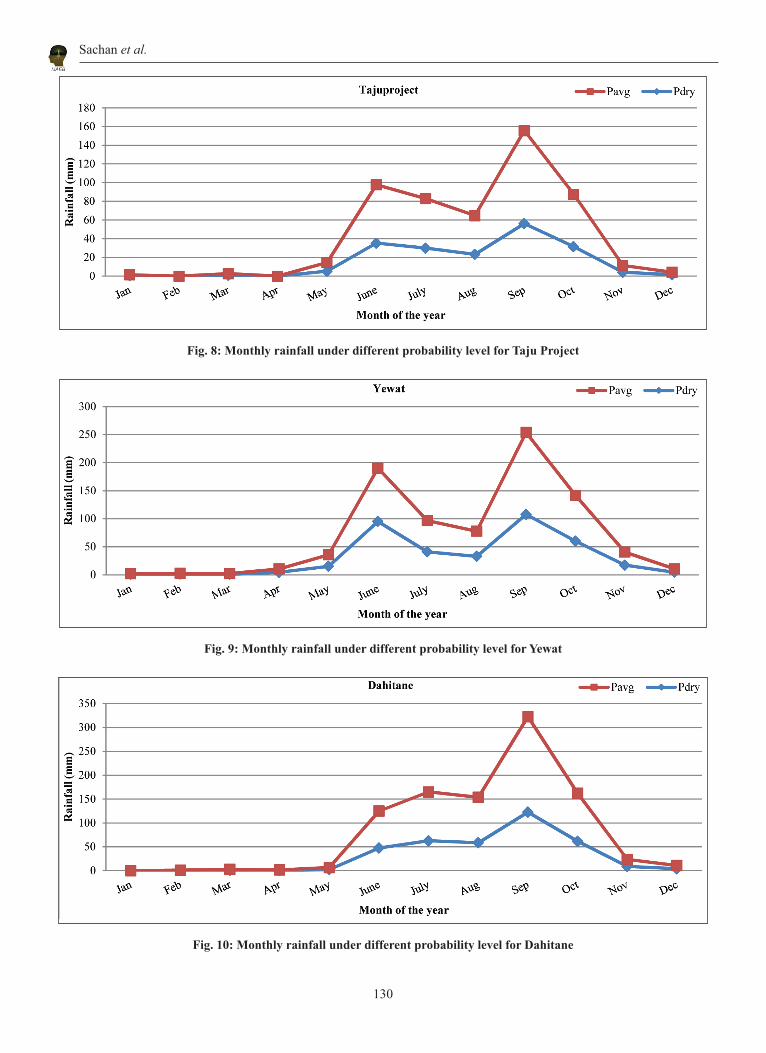
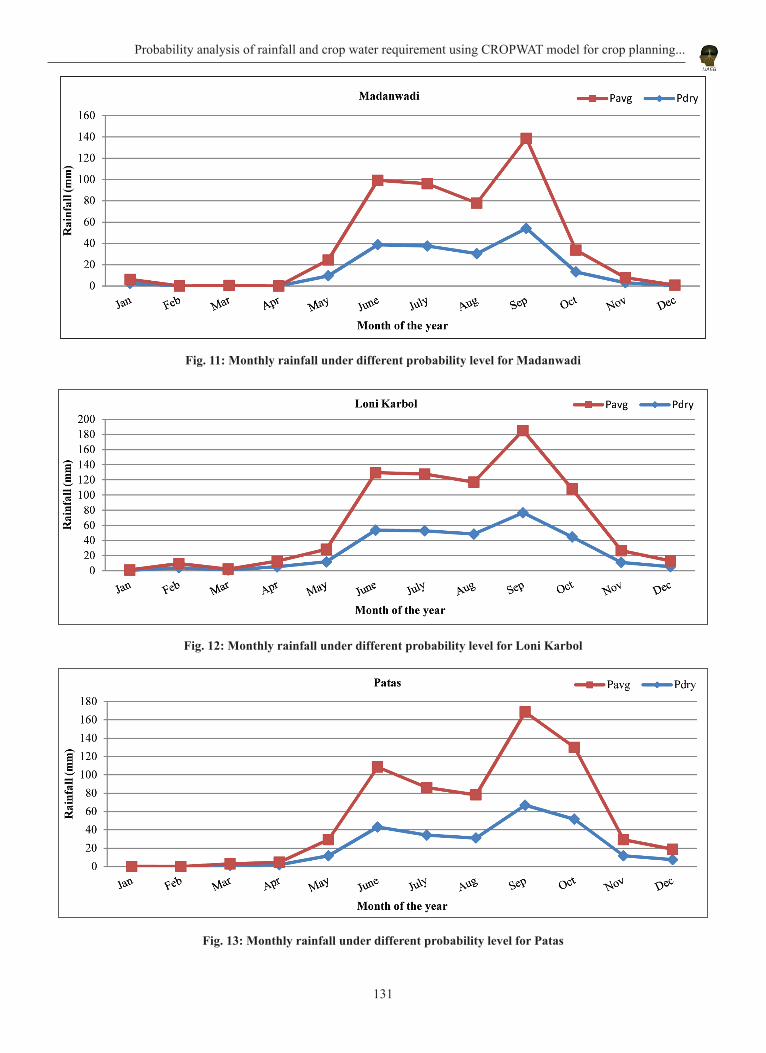
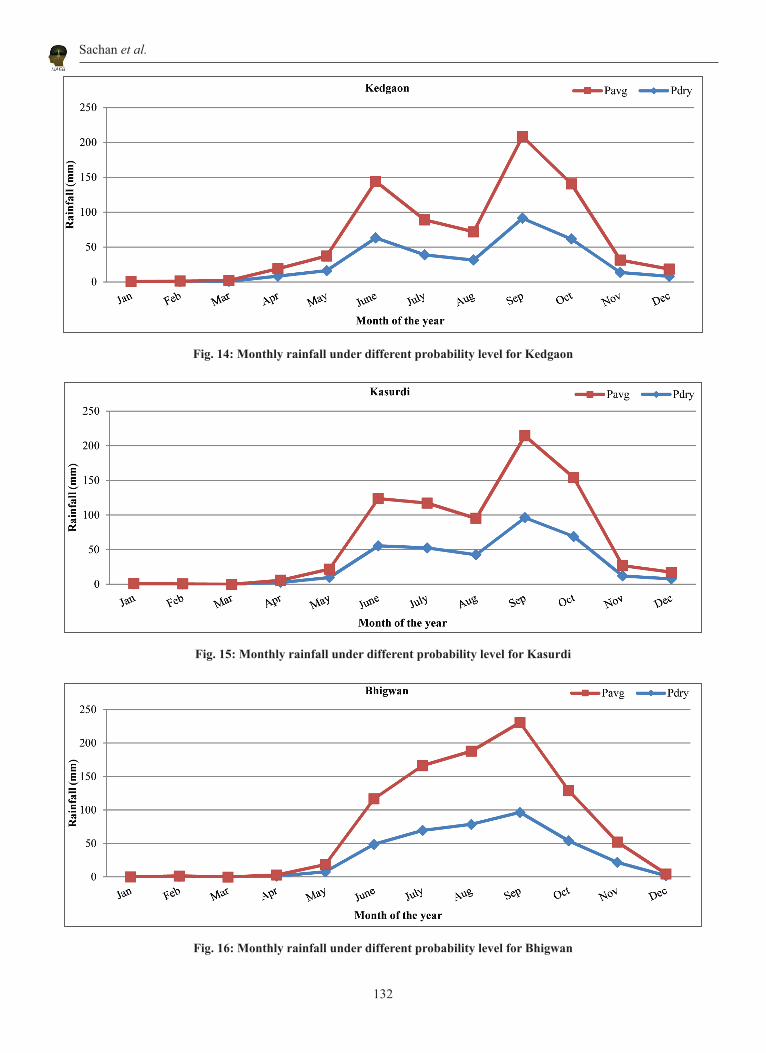
Probability analysis of monthly rainfallThe probability analysis of the monthly rainfall of various influencing stations of Upper Bhima basin has been shown in Figure 5 to Figure 17. Figure
5 to 17, clearly indicate that Pimplegaon shows maximum deficit rainfall of 187.30 mm in the month of July. It is observed that except Pimplegaon and Urali, all the station have their maximum rainfall deficit in the month of September (maximum 146.76 mm at Pondewali to minimum 54.11 mm at Madanwali). It is clear from the probability analysis that minimum deficit of 0.02 mm rainfall has been observed for the station Patas in February month (Figure 13) followed by 0.03 mm at Bhigwan (Figure 15) and so on. Pondewali showed maximum number of 4 months i.e. February, March, April, December with no rainfall followed by Tajuproject (no rainfall
Probability analysis of rainfall and crop water requirement using CROPWAT model for crop planning...
129
in February and April), Madanwadi (no rainfall in February and April) followed by Kasurdi, Dahitane, Bhigwan, Daund with no rainfall during one month.
Table 1: Average annual rainfall and annual rainfall at 50% and 80% probability of the exceedance at the
existing raingauge stations
Raingauge Stations
Average Annual RF (mm)
P50 (mm) P80 (mm)
Urali 473.34 448 341Loni karbol 446.08 428.65 302.1
Kasurdi 429.34 412.4 335.06
Tajuproject 333.86 304 171.61
Yewat 483.30 443.45 327.23
Dahitane 604.13 468.7 287.6Bhigwan 529.98 513.6 368.5
Madanwadi 295.73 348 222.85Pondewadi 359.39 355 285Kedgaon 430.1 405.7 315.7
Patas 395.70 340.1 223.98
Pimplegaon 729.28 693.66 536.13Daund 420.03 425.8 300.11
Fig. 5: Monthly rainfall under different probability level for Pimplegaon
Fig. 6: Monthly rainfall under different probability level for Pondewali
Fig. 7: Monthly rainfall under different probability level for Urali
Sachan et al.
130
Fig. 8: Monthly rainfall under different probability level for Taju Project
Fig. 9: Monthly rainfall under different probability level for Yewat
Fig. 10: Monthly rainfall under different probability level for Dahitane
Probability analysis of rainfall and crop water requirement using CROPWAT model for crop planning...
131
Fig. 11: Monthly rainfall under different probability level for Madanwadi
Fig. 12: Monthly rainfall under different probability level for Loni Karbol
Fig. 13: Monthly rainfall under different probability level for Patas
Sachan et al.
132
Fig. 14: Monthly rainfall under different probability level for Kedgaon
Fig. 15: Monthly rainfall under different probability level for Kasurdi
Fig. 16: Monthly rainfall under different probability level for Bhigwan
Probability analysis of rainfall and crop water requirement using CROPWAT model for crop planning...
133
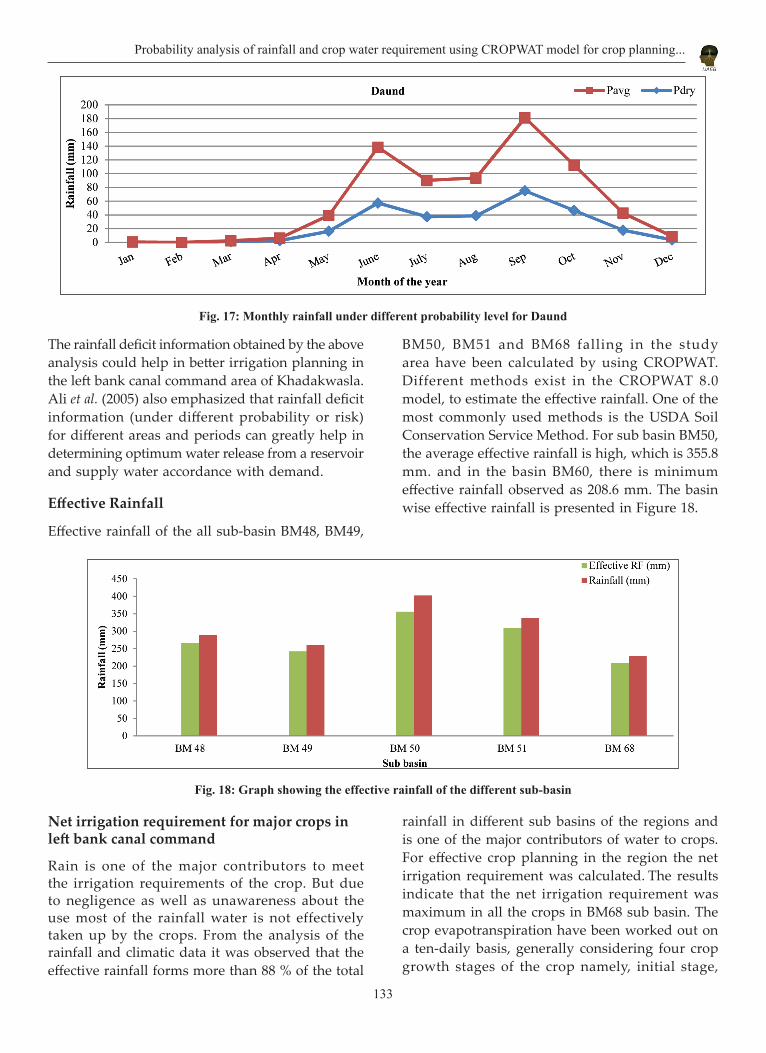
Fig. 17: Monthly rainfall under different probability level for Daund
The rainfall deficit information obtained by the above analysis could help in better irrigation planning in the left bank canal command area of Khadakwasla. Ali et al. (2005) also emphasized that rainfall deficit information (under different probability or risk) for different areas and periods can greatly help in determining optimum water release from a reservoir and supply water accordance with demand.
Effective Rainfall
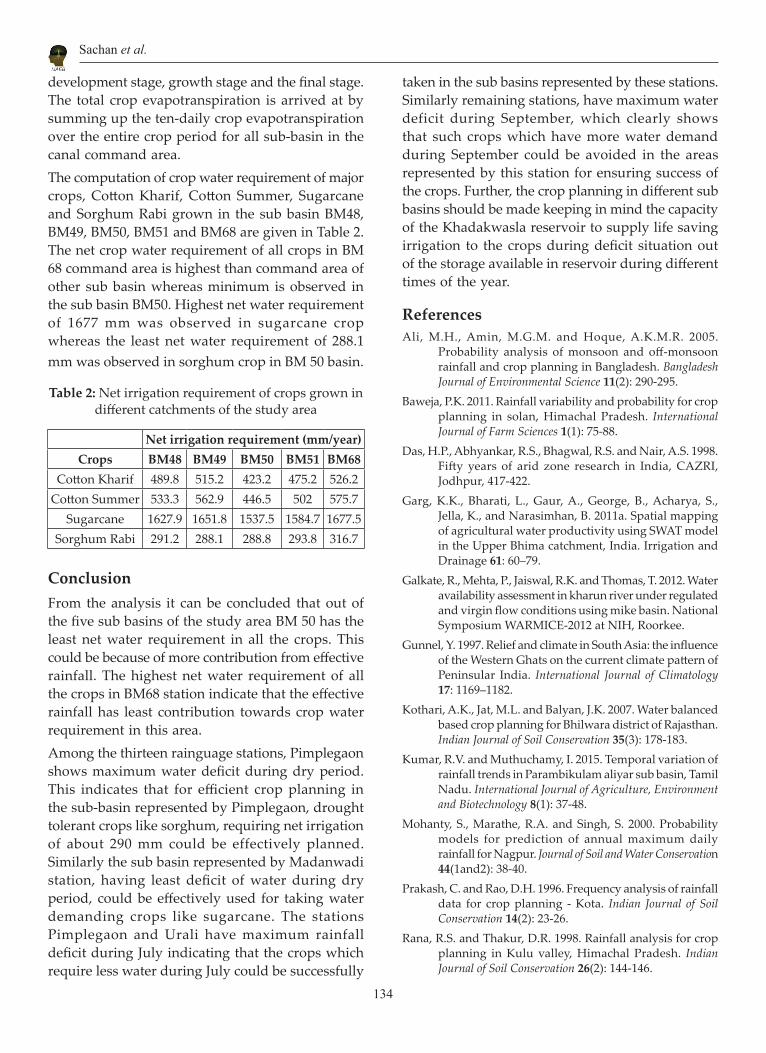
Effective rainfall of the all sub-basin BM48, BM49,
BM50, BM51 and BM68 falling in the study area have been calculated by using CROPWAT. Different methods exist in the CROPWAT 8.0 model, to estimate the effective rainfall. One of the most commonly used methods is the USDA Soil Conservation Service Method. For sub basin BM50, the average effective rainfall is high, which is 355.8 mm. and in the basin BM60, there is minimum effective rainfall observed as 208.6 mm. The basin wise effective rainfall is presented in Figure 18.
Fig. 18: Graph showing the effective rainfall of the different sub-basin
Net irrigation requirement for major crops in left bank canal command
Rain is one of the major contributors to meet the irrigation requirements of the crop. But due to negligence as well as unawareness about the use most of the rainfall water is not effectively taken up by the crops. From the analysis of the rainfall and climatic data it was observed that the effective rainfall forms more than 88 % of the total
rainfall in different sub basins of the regions and is one of the major contributors of water to crops. For effective crop planning in the region the net irrigation requirement was calculated. The results indicate that the net irrigation requirement was maximum in all the crops in BM68 sub basin. The crop evapotranspiration have been worked out on a ten-daily basis, generally considering four crop growth stages of the crop namely, initial stage,
Sachan et al.
134
development stage, growth stage and the final stage. The total crop evapotranspiration is arrived at by summing up the ten-daily crop evapotranspiration over the entire crop period for all sub-basin in the canal command area. The computation of crop water requirement of major crops, Cotton Kharif, Cotton Summer, Sugarcane and Sorghum Rabi grown in the sub basin BM48, BM49, BM50, BM51 and BM68 are given in Table 2. The net crop water requirement of all crops in BM 68 command area is highest than command area of other sub basin whereas minimum is observed in the sub basin BM50. Highest net water requirement of 1677 mm was observed in sugarcane crop whereas the least net water requirement of 288.1 mm was observed in sorghum crop in BM 50 basin.
Table 2: Net irrigation requirement of crops grown in different catchments of the study area
Net irrigation requirement (mm/year)Crops BM48 BM49 BM50 BM51 BM68
Cotton Kharif 489.8 515.2 423.2 475.2 526.2Cotton Summer 533.3 562.9 446.5 502 575.7
Sugarcane 1627.9 1651.8 1537.5 1584.7 1677.5Sorghum Rabi 291.2 288.1 288.8 293.8 316.7
ConclusionFrom the analysis it can be concluded that out of the five sub basins of the study area BM 50 has the least net water requirement in all the crops. This could be because of more contribution from effective rainfall. The highest net water requirement of all the crops in BM68 station indicate that the effective rainfall has least contribution towards crop water requirement in this area. Among the thirteen rainguage stations, Pimplegaon shows maximum water deficit during dry period. This indicates that for efficient crop planning in the sub-basin represented by Pimplegaon, drought tolerant crops like sorghum, requiring net irrigation of about 290 mm could be effectively planned. Similarly the sub basin represented by Madanwadi station, having least deficit of water during dry period, could be effectively used for taking water demanding crops like sugarcane. The stations Pimplegaon and Urali have maximum rainfall deficit during July indicating that the crops which require less water during July could be successfully
taken in the sub basins represented by these stations. Similarly remaining stations, have maximum water deficit during September, which clearly shows that such crops which have more water demand during September could be avoided in the areas represented by this station for ensuring success of the crops. Further, the crop planning in different sub basins should be made keeping in mind the capacity of the Khadakwasla reservoir to supply life saving irrigation to the crops during deficit situation out of the storage available in reservoir during different times of the year.
ReferencesAli, M.H., Amin, M.G.M. and Hoque, A.K.M.R. 2005.
Probability analysis of monsoon and off-monsoon rainfall and crop planning in Bangladesh. Bangladesh Journal of Environmental Science 11(2): 290-295.
Baweja, P.K. 2011. Rainfall variability and probability for crop planning in solan, Himachal Pradesh. International Journal of Farm Sciences 1(1): 75-88.
Das, H.P., Abhyankar, R.S., Bhagwal, R.S. and Nair, A.S. 1998. Fifty years of arid zone research in India, CAZRI, Jodhpur, 417-422.
Garg, K.K., Bharati, L., Gaur, A., George, B., Acharya, S., Jella, K., and Narasimhan, B. 2011a. Spatial mapping of agricultural water productivity using SWAT model in the Upper Bhima catchment, India. Irrigation and Drainage 61: 60–79.
Galkate, R., Mehta, P., Jaiswal, R.K. and Thomas, T. 2012. Water availability assessment in kharun river under regulated and virgin flow conditions using mike basin. National Symposium WARMICE-2012 at NIH, Roorkee.
Gunnel, Y. 1997. Relief and climate in South Asia: the influence of the Western Ghats on the current climate pattern of Peninsular India. International Journal of Climatology 17: 1169–1182.
Kothari, A.K., Jat, M.L. and Balyan, J.K. 2007. Water balanced based crop planning for Bhilwara district of Rajasthan. Indian Journal of Soil Conservation 35(3): 178-183.
Kumar, R.V. and Muthuchamy, I. 2015. Temporal variation of rainfall trends in Parambikulam aliyar sub basin, Tamil Nadu. International Journal of Agriculture, Environment and Biotechnology 8(1): 37-48.
Mohanty, S., Marathe, R.A. and Singh, S. 2000. Probability models for prediction of annual maximum daily rainfall for Nagpur. Journal of Soil and Water Conservation 44(1and2): 38-40.
Prakash, C. and Rao, D.H. 1996. Frequency analysis of rainfall data for crop planning - Kota. Indian Journal of Soil Conservation 14(2): 23-26.
Rana, R.S. and Thakur, D.R. 1998. Rainfall analysis for crop planning in Kulu valley, Himachal Pradesh. Indian Journal of Soil Conservation 26(2): 144-146.

Probability analysis of rainfall and crop water requirement using CROPWAT model for crop planning...
135
Singh, R., Singh, K. and Bhandarkar, D.M. 2014. Estimation of water requirement for soybean (Glycine max) and wheat (Triticum aestivum) under vertisols of Madhya Pradesh. Indian Journal of Agricultural Sciences 84(2): 190–197.
Sharma, B.R., Rao, K.V., Vittal, K.P.R., Ramakrishna, Y.S. and Amarasinghe, U. 2010. Estimating the potential of rainfed agriculture in India: prospects of water productivity improvements. Agricultural Water Management 97(1): 23-30.
Sharma, H.C., Chauhan, H.S. and Ram, S. 1979. Probability analysis of rainfall for crop planning. Journal of Agricultural Engineering 16(3): 87-94.
Shinde, V., Tiwari, K.N. and Singh M. 2012. Assessment of land and water resources of mine affected watershed in India using remote sensing and GIS. International Journal of Agriculture, Environment and Biotechnology 5(4): 333-344.
Thimme, G.P., Manjunaththa, S.B., Yogesh, T.C. and Sunil, A.S. 2013. Study on Water Requirement of Maize (Zea mays L.) using CROPWAT Model in Northern Transitional Zone of Karnataka. Journal of Environmental Science, Computer Science and Engineering & Technology 2(1): 105-113.