Probabilistic Safety Assessment Insights Relating to the ... · Nuclear Safety NEA/CSNI/R(2017)5...
355
Nuclear Safety NEA/CSNI/R(2017)5 September 2017 www.oecd-nea.org P robabilistic Safety Assessment Insights Relating to the Loss of Electrical Sources
Transcript of Probabilistic Safety Assessment Insights Relating to the ... · Nuclear Safety NEA/CSNI/R(2017)5...

Nuclear SafetyNEA/CSNI/R(2017)5September 2017www.oecd-nea.org
Probabilistic Safety Assessment Insights Relating to the Loss of Electrical Sources

Unclassified NEA/CSNI/R(2017)5 Organisation de Coopération et de Développement Économiques Organisation for Economic Co-operation and Development ___________________________________________________________________________________________
English text only NUCLEAR ENERGY AGENCY COMMITTEE ON THE SAFETY OF NUCLEAR INSTALLATIONS
Probabilistic Safety Assessment Insights Relating to the Loss of Electrical Sources Working Group on Risk Assessment (WGRISK)
Complete document available on OLIS in its original format This document, as well as any data and map included herein, are without prejudice to the status of or sovereignty over any territory, to the delimitation of international frontiers and boundaries and to the name of any territory, city or area.
NEA
/CSN
I/R(2017)5
Unclassified
English text only
2
ORGANISATION FOR ECONOMIC CO-OPERATION AND DEVELOPMENT
The OECD is a unique forum where the governments of 35 democracies work together to address the economic, social and environmental challenges of globalisation. The OECD is also at the forefront of efforts to understand and to help governments respond to new developments and concerns, such as corporate governance, the information economy and the challenges of an ageing population. The Organisation provides a setting where governments can compare policy experiences, seek answers to common problems, identify good practice and work to co-ordinate domestic and international policies.
The OECD member countries are: Australia, Austria, Belgium, Canada, Chile, the Czech Republic, Denmark, Estonia, Finland, France, Germany, Greece, Hungary, Iceland, Ireland, Israel, Italy, Japan, Latvia, Luxembourg, Mexico, the Netherlands, New Zealand, Norway, Poland, Portugal, Korea, the Slovak Republic, Slovenia, Spain, Sweden, Switzerland, Turkey, the United Kingdom and the United States. The European Commission takes part in the work of the OECD.
OECD Publishing disseminates widely the results of the Organisation’s statistics gathering and research on economic, social and environmental issues, as well as the conventions, guidelines and standards agreed by its members.
NUCLEAR ENERGY AGENCY
The OECD Nuclear Energy Agency (NEA) was established on 1 February 1958. Current NEA membership consists of 31 countries: Australia, Austria, Belgium, Canada, the Czech Republic, Denmark, Finland, France, Germany, Greece, Hungary, Iceland, Ireland, Italy, Japan, Luxembourg, Mexico, the Netherlands, Norway, Poland, Portugal, Korea, Russia, the Slovak Republic, Slovenia, Spain, Sweden, Switzerland, Turkey, the United Kingdom and the United States. The European Commission and the International Atomic Energy Agency also take part in the work of the Agency.
The mission of the NEA is: – to assist its member countries in maintaining and further developing, through international co-operation, the
scientific, technological and legal bases required for a safe, environmentally sound and economical use of nuclear energy for peaceful purposes;
– to provide authoritative assessments and to forge common understandings on key issues as input to government decisions on nuclear energy policy and to broader OECD analyses in areas such as energy and the sustainable development of low-carbon economies.
Specific areas of competence of the NEA include the safety and regulation of nuclear activities, radioactive waste management, radiological protection, nuclear science, economic and technical analyses of the nuclear fuel cycle, nuclear law and liability and public information. The NEA Data Bank provides nuclear data and computer program services for participating countries.
This document, as well as any statistical data and map included herein, are without prejudice to the status of or sovereignty over any territory, to the delimitation of international frontiers and boundaries and to the name of any territory, city or area. Corrigenda to OECD publications may be found online at: www.oecd.org/publishing/corrigenda. © OECD 2017
You can copy, download or print OECD content for your own use, and you can include excerpts from OECD publications, databases and multimedia products in your own documents, presentations, blogs, websites and teaching materials, provided that suitable acknowledgement of the OECD as source and copyright owner is given. All requests for public or commercial use and translation rights should be submitted to [email protected]. Requests for permission to photocopy portions of this material for public or commercial use shall be addressed directly to the Copyright Clearance Center (CCC) at [email protected] or the Centre français d'exploitation du droit de copie (CFC) [email protected].

NEA/CSNI/R(2017)5
3
COMMITTEE ON THE SAFETY OF NUCLEAR INSTALLATIONS
The Committee on the Safety of Nuclear Installations (CSNI) is responsible for NEA programmes and activities that support maintaining and advancing the scientific and technical knowledge base of the safety of nuclear installations.
The Committee constitutes a forum for the exchange of technical information and for collaboration between organisations, which can contribute, from their respective backgrounds in research, development and engineering, to its activities. It has regard to the exchange of information between member countries and safety R&D programmes of various sizes in order to keep all member countries involved in and abreast of developments in technical safety matters.
The Committee reviews the state of knowledge on important topics of nuclear safety science and techniques and of safety assessments, and ensures that operating experience is appropriately accounted for in its activities. It initiates and conducts programmes identified by these reviews and assessments in order to confirm safety, overcome discrepancies, develop improvements and reach consensus on technical issues of common interest. It promotes the co-ordination of work in different member countries that serve to maintain and enhance competence in nuclear safety matters, including the establishment of joint undertakings (e.g. joint research and data projects), and assists in the feedback of the results to participating organisations. The Committee ensures that valuable end-products of the technical reviews and analyses are provided to members in a timely manner, and made publicly available when appropriate, to support broader nuclear safety.
The Committee focuses primarily on the safety aspects of existing power reactors, other nuclear installations and new power reactors; it also considers the safety implications of scientific and technical developments of future reactor technologies and designs. Further, the scope for the Committee includes human and organisational research activities and technical developments that affect nuclear safety.

4
TABLE OF CONTENTS
EXECUTIVE SUMMARY ............................................................................................................................. 9
1. INTRODUCTION ..................................................................................................................................... 15
2. GENERAL PLANT AND ELECTRICAL SUPPLY INFORMATION ................................................... 19
3. PSA INFORMATION ............................................................................................................................... 21
4. PSA INFORMATION SPECIFIC TO ELECTRICAL SOURCES .......................................................... 24
4.1. Initiating events ................................................................................................................................... 24 4.2. Modelling and data ............................................................................................................................. 30 4.3. Results ................................................................................................................................................. 32
5. SAFETY IMPROVEMENTS ................................................................................................................... 41
5.1. Generalities ......................................................................................................................................... 41 5.2. Hardware ............................................................................................................................................. 42 5.3. Procedures and organisation ............................................................................................................... 44 5.4. Conclusions ......................................................................................................................................... 45
6. PSA CHALLENGES AND UNRESOLVED ISSUES ............................................................................. 45
6.1. Introduction ......................................................................................................................................... 46 6.2. PSA Challenges identified .................................................................................................................. 46
7. CONCLUSIONS AND RECOMMENDATIONS .................................................................................... 49
REFERENCES .............................................................................................................................................. 54
APPENDIX 1 ................................................................................................................................................ 55
APPENDIX 2 ................................................................................................................................................ 58
APPENDIX 3 ................................................................................................................................................ 91
APPENDIX 4 .............................................................................................................................................. 257
APPENDIX 5 .............................................................................................................................................. 262
NEA/CSNI/R(2017)5
5
FOREWORD
This work represents the collective effort of the Working Group on Risk Assessment (WGRISK) Task Group all of whom provided valuable time and considerable knowledge towards its production. In offering its thanks to these experts, the NEA Secretariat wishes to express particular appreciation to:
Raducu Gheorghe (Canada) Chung-Chang Chao (Chinese Taipei) Arren Hsia (Chinese Taipei)
Jaroslav Holy (Czech Republic) Stanislav Hustak (Czech Republic) Milan Patrik (Czech Republic)
Ilkka Niemelä (Finland) Francois Corenwinder (France) Gabriel Georgescu (France)
Jeanne-Marie Lanore (France) (Task Leader)
Marina Röwekamp (Germany) Attila Bareith (Hungary)
Pr P.V.Varde (India) Haruo Fujimoto (Japan) Kwang-Il Ahn (Korea)
Ramon Lopez (Mexico) Hans Brinkman (Netherlands) Mirela Nitoi (Romania)
Jan Husarcek (Slovak Republic) Matjaž Podjavoršek (Slovenia) Teresa Vázquez (Spain)
Per Hellström (Sweden) Gerhard Schoen (Switzerland) Kevin Coyne (USA)
Fernando Ferrante (USA) Michelle Gonzalez (USA) Neil Blundell (NEA)
Andrew White (NEA)
NEA/CSNI/R(2017)5
6
LIST OF ABBREVIATIONS AND ACRONYMS
AC Alternating current
AFW Auxiliary feed water
AM Accident management
APOPs Abnormal plant operating procedures
AST Auxiliary start-up transformers
BWR Boiling water reactor
CAPS CSNI activity proposal sheet
CCDP Conditional core damage probability
CCF Common cause failure
CD Core demage
CDF Core damage frequency
CFF Containment failure frequency
CNSC Canadian Nuclear Safety Commission
CNSNS Commission of Nuclear Safety and Safeguards
CSNI Committee on the Safety of Nuclear Installations
DC Direct current
DEC Design extension conditions
DG Diesel generator
DiD Defence in depth
EDG Emergency diesel generator
ELAP Extended loss of AC power
ENSI Federal Nuclear Safety Inspectorate (Switzerland) EOOS Equipment out of service
EPR Evolutionary powered reactor (initially European Pressurised Reactor)
EPRI Electric Power Research Institute
EPS Emergency power supply
ESF Engineered safety feature
EWS Emergency water supply system
FLEX Diverse and flexible coping strategies
FPCS Fuel pool cooling and cleanup system
FV Fussell-Vesely

NEA/CSNI/R(2017)5
7
GTG Gas-turbine generators
HPP Hydroelectric power plants
HRA Human reliability analysis I&C Instrumentation and control IAEA International Atomic Energy Agency
IE Initiating event
INER Institute of Nuclear Energy Research
INR Institute for Nuclear Research
IRSN Institut de radioprotection et de sûreté nucléaire (France)
JNES Japan Nuclear Energy Safety JSI Jožef Stefan Institute KAERI Korea Atomic Energy Research Institute (Korea)
LER Large early releases
LERF Large early release frequency
LLS Small emergency turbo generator LOCA Loss-of-coolant accident
LOOP Loss of off-site power
LOOPGR LOOP grid related
LOOPPC LOOP plant centred
LOOPSC LOOP switchyard centred
LOOPWR LOOP weather related
LOUHS Loss of ultimate heat sink
LPSD Low power and shutdown state
LRF Large release frequency
LVNPP Laguna Verde Nuclear Power Plant (Mexico)
NB New Brunswick
NEA Nuclear Energy Agency
NEI Nuclear Energy Institute (United States)
NPP Nuclear power plant
NPCIL Nuclear Power Corporation Limited ( India)
NRC Nuclear Regulatory Commission (United States)
NTTF Near term task force
NUPEC Nuclear Power Engineering Corporation
ODD One electrical distribution division
PHTS Primary heat transport system
PHWR Pressurised heavy water reactor
PLGS Point Lepreau Generating Station
POS Plant operational state

NEA/CSNI/R(2017)5
8
PRA Probabilistic risk analysis
PSA Probabilistic safety assessment
PSR Periodic safety review
PWR Pressurised water reactor
RAT Reserve auxiliary transformer
RAW Risk achievement worth
RCIC Reactor core isolation cooling
RCP Reactor coolant pump
RCPP Reactor circulating (coolant) pump
RCS Reactor coolant system
RIR Risk increase ratio
RPV Reactor pressure vessel
RRI Risk reduction interval
RRR Risk reduction ratio
SAM Severe accident management
SAMG Severe accident management guidelines
SBO Station black out
SNN Societatea Nationala Nuclearelectrica (Italy)
SPAR Standardised plant analysis risk
SAT Stand-by auxiliary transformer
SDG Stand-by diesel generators
SG Steam generators
SSC Structures, systems, and components
SST System service transformer
STUK Radiation and Nuclear Safety Authority (Finland)
UAT Unit auxiliary transformer
USNRC United States Nuclear Regulatory Commission
UST Unit service transformer
VENE Vattenfall Europe Nuclear Energy VVER Vodo-Vodianoï Energuetitcheski Reaktor
WGRISK Working Group on Risk Assessment

NEA/CSNI/R(2017)5
9
EXECUTIVE SUMMARY
The loss of electrical power sources1 is generally recognised as an important contributor to the risk related to nuclear power plants. In particular, the importance of external hazards leading to a loss of electrical power sources (external and/or internal to the nuclear plant) has been further underscored by the Fukushima Daiichi accident.
The OECD/NEA Working Group on Risk Assessment (WGRISK) determined that a review of current Probabilistic Safety Assessment (PSA) studies would be a useful method to identify safety insights associated with losses of electrical power sources. More precisely two types of risk and safety insights were sought:
• Insights for plant safety related to results and applications of risk calculations: This includes insights related to the overall risk of losses of power sources relative to other contributions, potential safety weaknesses, the balance between core damage prevention and mitigation, comparison between internal initiating events and hazards, key sources of uncertainty, and safety benefits realised by modifications already implemented or planned (including possible post-Fukushima modifications).
• Insights on PSA methodology: This includes insights related to the identification of good practices, potential methodology gaps and differences in the methodologies used or developed by member countries.
The Task WGRISK(2013)1, “Probabilistic Safety Assessment insights relating to the loss of electrical sources” was approved by the CSNI in June 2013. IRSN (France) was appointed as the Task leader with support from a core group that included representatives from Canada, Chinese Taipei, Czech Republic, Hungary, India, Italy, Mexico, Sweden and the USA.
The main steps of this Task included the following:
• Preparation of a survey questionnaire that was distributed to all the WGRISK members in December 2013.
• Questionnaire answers were received from 19 countries (with answers often including the results from several PSAs). In total, the questionnaire responses covered 38 PSA studies. A writing group analysed the answers and developed a first draft of the report. The questionnaire responses and draft report were discussed during a Task Group meeting held in March 2015. During the Task Group meeting, it was determined that additional information was needed from questionnaire responders to more fully address the task objectives.
• To address the identified gaps in the questionnaire responses, a complementary questionnaire was sent to all the participants.
• After analysing the complementary questionnaire responses, the writing group prepared the final report, which was reviewed and endorsed by the core group and the WGRISK membership.
1. The term “electrical power sources” is equivalent to the term “electrical supplies” as used in IAEA
documents.

NEA/CSNI/R(2017)5
10
Based on the analysis of questionnaire responses, the following insights were identified:
1. With regard to initiating events, the following conclusions can be drawn from PSA information in the questionnaire responses:
• In most cases, various categories of power supply faults were analysed, as opposed to analysing only a single category of failures in electric power supply sources. For example, some responders identified long-or short-term loss of off-site power (LOOP) categories rather than combining all LOOP events into a single category. Distinction between power supply failures is justified if plant responses (including system and operator responses and the associated success criteria) are different for the various categories of failures (which require the delineation of separate accident sequence models in the PSA). In addition to total or partial loss of off-site power, other types of power supply failures such as loss of vital AC or DC buses, loss of transformers, etc. were also analysed.
• The duration of a power supply fault influences accident mitigation features and the corresponding accident sequence frequencies. Accordingly, the duration of a LOOP was taken into consideration in most analyses.
• External hazards as LOOP initiators were considered in most of the analyses addressed in the survey. It appears to be a common practice to model the effects of external hazards on the power supply system as separate initiating events unless LOOP is the only adverse consequence of the hazard.
• The frequency of total or partial losses of off-site power typically falls into the range of 10-3/year to 10-1/year in terms of order of magnitude, although direct comparison is not meaningful due to the differences in plant design, grid layout/connections and in the definition of power failure events (including failure duration).
• Plant-, site-, region- or country-specific data were used to estimate initiating event frequencies in most cases. There are dedicated data collection and analysis programmes in place in a number of member countries to support the estimation.
2. The following conclusions can be drawn from PSA information on modelling and data given in the questionnaire responses:
• Power recovery is important for both the initiating event definition and event sequence development. Recovery was modelled in the majority of the 38 PSAs covered by the survey. Multiple recovery times were usually taken into account.
• Various kinds of recovery models were applied depending on the initiating events, the availability of operational experience, and the analysis approach used.
• Usually, the failure to start and the failure to continue running failure modes of active alternate power supply equipment (mostly diesel generators but also including other power sources, as appropriate) were considered in the accident sequence models.
• Some analyses included a detailed fault tree modelling of diesel generators and other sources of electric power supply.
• Failures of bus bars and batteries are typically modelled.
• Common cause failures of active power supply equipment (mostly diesel generators) were taken into consideration.
• The traditional mission time of 24 hours is predominantly used in the accident sequence models for power supply faults. Some responses point out that 24 hours of mission time is unnecessary for short-term loss of power events (typically of a few hours duration). On the other hand, the automatic use of 24 hours may lead to

NEA/CSNI/R(2017)5
11
underestimation of risk from long-term scenarios, especially if LOOP and additional power supply failures are induced by external events.
• Due to operational stability problems, less than half of the analyses gave credit to plant operation in-house load or island mode following a LOOP event, although most plants have the capability to continue power operation when separated from the electrical grid.
3. The following main conclusions can be drawn concerning PSA results:
• The initiating events considered are site specific and grouped differently. However a global LOOP frequency is in the range of some 10-1/year to 10-3/year for all the responding countries.
• The core damage frequency (CDF) resulting from LOOP events, as provided in the survey, have a wide variability (10-4/year – 10-6/year), with no particular tendency related to the design.
• Two general observations can be made (further work would be required to determine the causes for the differences):
- The BWR plants included in this survey generally have a lower CDF contribution from LOOP than the PWR plants.
- The relative CDF contribution from LOOP for the PWR plants included in this survey tends to have a wider variability than the BWR plants.
• Concerning the importance measures of SSCs, a few key insights from the survey include:
- The relative high reliability of batteries generally results in a lower FV2 importance, but the lack of redundancy for these components results in very high values for RAW3.
- Decay heat removal systems such as reactor core isolation cooling and auxiliary feed water have a relatively low to moderate FV importance, but can have a relatively high RAW value due to limited redundancy for this function.
- The EDGs had a somewhat variable importance, but the risk contribution is dominated by common cause failure. The RAW values reported for the EDGs had significant variability, but for some plants the loss of EDGs could be significant risk contributor.
• Based on the survey results for a BWR plant, the LOOP accident sequences leading to CDF generally would involve combination of failures of reactor protection system, emergency power, safety relief valves, reactor depressurisation, low pressure coolant injection, recovery of off-site power, shutdown cooling or late injection.
• General examples of LOOP accident sequences for a BWR that could lead to core damage include: 1) a LOOP event followed by failure of emergency AC power, failure to recover off-site power or a diesel generator prior to battery depletion, and failure of human actions to extend AC independent decay heat removal beyond battery depletion time; or 2) a LOOP event followed by failure of emergency power, failure of AC
2. For a specified basic event, Fussell-Vesely importance is the relative contribution of a basic event to
the calculated risk. The range for the Fussell-Vesely importance is 0 to 1.0.
3. RAW relates to the increase in risk if a plant feature (e.g. system or component) was assumed to be failed or was assumed to be always unavailable. This increase is expressed as a multiplier by which risk (e.g. CDF) would increase if the component of interest was failed or unavailable. The possible range for RAW is 1 to infinity.

NEA/CSNI/R(2017)5
12
independent decay heat removal, and failure to recover off-site power or a diesel generator within one hour.
• Based on the survey results for a PWR plant, the LOOP accident sequences leading to CDF generally involve combination of failures of the reactor protection system, the emergency power, the auxiliary feed water, a loss of reactor coolant pump seal cooling, high pressure injection, recovery of off-site power, shutdown cooling and containment cooling.
• Examples of specific accident sequences for a PWR that could lead to core damage include: 1) a LOOP event followed by failure of emergency AC power, failure of AC independent decay heat removal, and failure to recover off-site power or a diesel generator within 1 hour; and 2) a LOOP event followed by failure of emergency AC power, failure of reactor coolant pump seals resulting in a small loss of coolant accident, and failure to recover off-site power or a diesel generator in four hours.
4. The following main conclusions can be drawn concerning safety improvements:
• Although PSA is not the only basis for decision making, the questionnaire answers indicate that a large number of safety improvements are related to the mitigation of losses of electrical power sources.
• The main safety improvements relate directly to electrical power sources (addition of complementary equipment), but several modifications relate also to mitigation functions impacted by LOOP events. A strength of PSA is identifying not only the initiating event, but also the functional consequences and the relative contribution from subsequent failures.
• It can be noted that while many improvements are related to electrical power sources (especially diesel generator improvements or addition of electrical power sources), there are less improvements to the electrical distribution system (e.g. the bus bars).
• Many modifications include mobile equipment or other equipment that require operator action. In case of station blackout (SBO), the time available is a very important factor and the safety benefit of a modification is strongly related to the time window for operator action. For example, a mobile device may not be able to be deployed if the time window is too short. As a result, precision in the risk benefit estimation is related to the ability of the PSA to correctly treat the duration of accident sequences.
• The treatment of human interventions requires that human reliability analysis (HRA) model the particular conditions of a LOOP or a SBO.
• Several modifications include equipment shared by several units or interconnections between units. The risk benefit estimation in these cases requires a multi-unit assessment since the multi-units effect could be either positive (mutual back-up) as well as negative (shared equipment needed by another unit in case of common initiating event).
• Although many improvements appear as “initiator neutral”, several improvements protect against specific external hazards (e.g. earthquake, flooding, high winds). A technically adequate PSA analysis of LOOP makes it possible to identify specific strategies for coping with external hazards.
5. Concerning the conclusions for LOOP modelling in PSA, seven important challenges were identified based on the responses to the questionnaire:
• LOOP frequency data analysis related to common cause failure (CCF);
• timing of accident sequence development in LOOP event trees;
NEA/CSNI/R(2017)5
13
• determination of the proper mission time for LOOP initiating event (IE) modelling;
• determination of the specific off-site grid recovery times and probabilities;
• credibility of reactor coolant pump (RCP) seal integrity; • interaction between units in the multi-unit site following LOOP, and • lack of data to quantify CCFs of bus-barsbus bars.
6. The following general conclusions have been drawn:
• This survey shows that challenges related to the plant response to LOOP (i.e. plant recovery from LOOP or from the consequent blackout) can be key contributors in PSA so particular attention needs to be paid to them. Also, the insights related to plant response are more generic and consequently of more interest for exchange of knowledge and exchange of good practices than initiating events frequencies which tend to be very site specific. If using a defence-in-depth (DiD) terminology defined by IAEA, it could be said that the PSA insights for LOOP are more interesting at the level 3 or 4 of DiD than at level 1 or 2.
• The following recommendations for improvement of PSA modelling are proposed based on the survey:
- Reliability data should be collected for plant power supply components, including repair or recovery times and CCF events. The criteria (conditions) for repair/recovery success need to be properly defined.
- The data required to properly characterise the LOOP frequencies and probabilities of external grid recovery failures should be determined and collected. It should include grid specific reliability models and also consider repair or recovery times and CCF events.
- The safe end state for accident sequences should be justified and used to determine the proper mission time (i.e. time to reach safe state).
- The interactions between units in multi-unit site should be properly modelled, including the adequate modelling of the following items:
o The adverse impact from unavailabilities/initiating events occurring in the other units.
o The impact of the common initiating events (including hazards) affecting more than one unit.
o The support from the other units (e.g. utilisation of equipment, cross connections, etc. from the other units).
- The timing of an accident’s development should be considered, including the timing of important breakpoints (loss of RCP seal integrity, battery depletion, etc.).
• The survey indicates the importance of providing means for recovery, including means for repair, and providing back-up equipment (fixed or mobile). It also highlights the practical problems relating to the use of back-up equipment (human capacity, accessibility, strategy and decision making).
• These insights can be used within several NEA activities (CNRA, CSNI) as well as in other international or national activities relating to PSA or more generally to safety of nuclear power plants. These insights will be especially useful for the CSNI/WGELEC and CSNI/WGRISK. For example the WGRISK will use these insights in its programme of work: it can be noted that the study of multi-unit interactions is already in progress with the Task WGRISK(2015)2 “Status of Site-Level PSA (including Multi-unit PSA) Developments”, the HRA problem in extreme conditions is addressed by the Task WGRISK(2015)1 “HRA in External Events PSA – Survey of Methods

NEA/CSNI/R(2017)5
14
and Practices”, and recent PSA and safety improvements (particularly post-Fukushima actions) will be reviewed in the Task WGRISK(2015)4 “Use and Development of Probabilistic Safety Assessment in Member and Non-member Countries”.

NEA/CSNI/R(2017)5
15
1. INTRODUCTION
Background
The main objective of the Working Group on Risk Assessment (WGRISK) is to advance Probabilistic Safety Assessment (PSA) understanding and to enhance its use for improving the safety of nuclear installations, for improving the operation and the design of nuclear installations, and for increasing regulatory effectiveness through risk-informed approaches.
The loss of electrical power sources1 is generally recognised as an important contributor to nuclear plant risk. In particular, the impact of external hazards leading to a loss of electrical sources (external and/or internal to the nuclear plant) has been further underscored by the Fukushima Daiichi accident.
Generally, losses of functional capability can be assessed by design analysis as well as analysis of operating experience. PSA can augment this understanding by providing insights related to the potential consequences of the loss of a safety function and other provisions (defences) that can prevent or mitigate these consequences. These consequences usually include core damage (CD) or large releases of fission products occurring shortly after an initiating event. The use of frequencies and conditional probabilities for these consequences (e.g. core damage frequency, large early release frequency, conditional probabilities of core damage, or large early release given an initiator), can provide insights into the level of defence in depth in the event of loss of a safety function.
WGRISK assumed that the performance of electrical distribution systems in nuclear power reactors is treated in all the existing PSAs to some extent, and so it would be useful to carry out a review of the work already done for taking into account the risk aspect in order to derive insights related to improvements of safety in case of loss of electrical sources.
Objective of the task
The objective of the task is to provide an overview of the insights provided by PSA related to a loss of electrical sources in order to illustrate PSA capabilities in the analysis of the robustness of safety functions. In this manner, the task illustrates PSA capabilities with a meaningful practical example.
Two types of insights were sought:
• Insights for plant safety related to results and applications of risk calculations, including:
- overall risk as well as relative results related to dominant contributions that might identify potential weaknesses;
- balance between core damage prevention and release mitigation; - comparison between internal initiating events and hazards; - key sources of uncertainty (where available); and
1. The term “electrical power sources” is equivalent to the term “electrical supplies” used in IAEA
documents [1].
NEA/CSNI/R(2017)5
16
- safety benefits realised by modifications already implemented or planned (including possible post-Fukushima modifications).
• Insights on PSA methodology, including identification of good practices, potential gaps and differences in the methodologies used or developed by member countries.
The focus of the task is to use existing PSAs, for both operating and future plants, in order to assess the risk conditional on the failure of electrical sources. This activity used a wide definition of loss of electrical sources, including common cause failure of switchboards, loss of battery-backed supplies, electrical disturbances and potential secondary grid effects.
The PSA scope considered includes loss of electrical sources in Level 1, Level 2 and Level 3 PSA; internal and external initiating events; and full power or low power and shutdown (LPSD) operating states.
The insights obtained from this task can be used in the decision making to improve the plant defences against the initiating event and to protect against dependencies among the plant defences and between plant defences and the initiating event. In particular these defences can be protected against external hazards that lead to safety function failures. In addition, PSA could provide a measure of post-Fukushima safety improvements (need and adequacy for modification to the plant and its procedures including severe accident management).
The insights related to the PSA methods will be useful for future PSA developments, in particular PSA for external hazards.
Process
CSNI activity proposal sheet (CAPS):
After discussions within the WGRISK Bureau and the WGRISK, a CSNI Activity Proposal Sheet (CAPS) was prepared and approved by the CSNI in June 2013 (Appendix 1).
Task leader was IRSN (France), the Task Group members included institutions from Canada, Czech Republic, Hungary, India, Italy, Mexico, Sweden, Chinese Taipei and the USA.
Questionnaire:
The core group established a questionnaire distributed to the WGRISK members in December 2013. This questionnaire included already examples of responses provided by Canada, France, Chinese Taipei and the USA (Appendix 2).
Responses were received from 19 countries. Some countries provided several responses (Czech Republic, France, Sweden, USA) and some responses covered several different studies (for example for Finland the response provided by STUK covers the studies related to the VVERs, to the BWRs and to the EPR). In total, the survey covered 38 PSA studies.
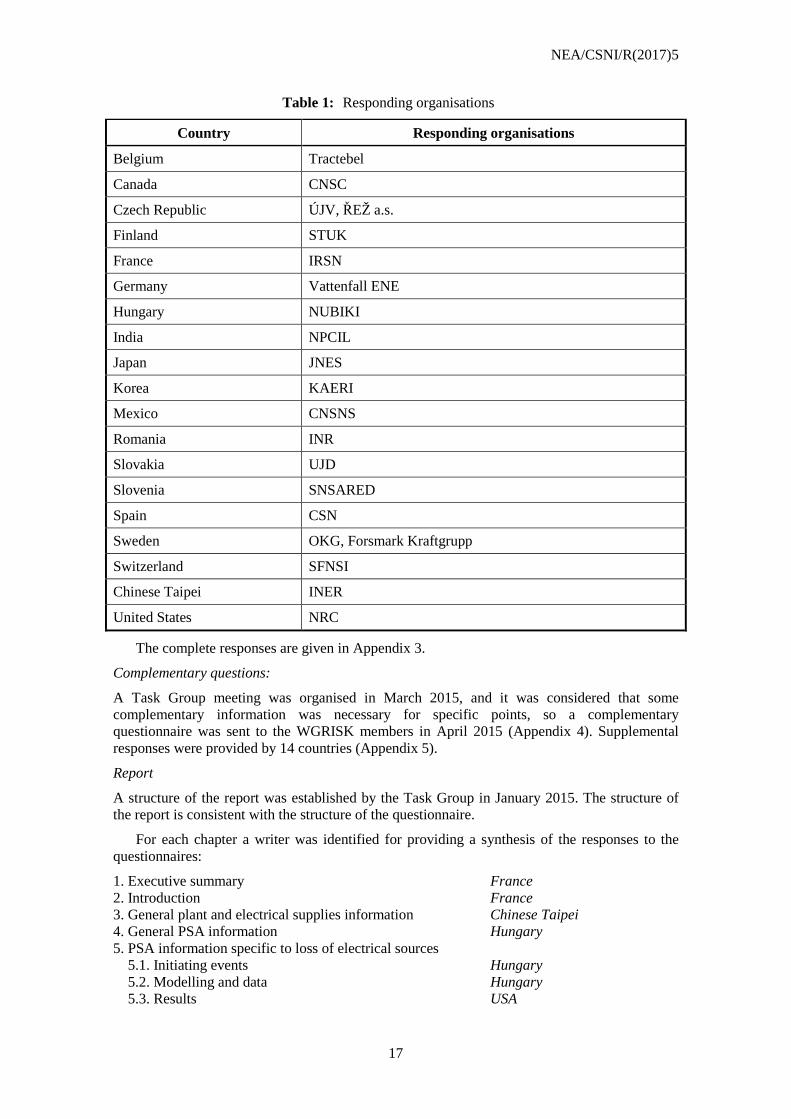
The table below indicates the respondent organisations. A list of the 38 reactors covered by the survey is given in Chapter 3.
NEA/CSNI/R(2017)5
17
Table 1: Responding organisations
Country Responding organisations
Belgium Tractebel
Canada CNSC
Czech Republic ÚJV, ŘEŽ a.s.
Finland STUK
France IRSN
Germany Vattenfall ENE
Hungary NUBIKI
India NPCIL
Japan JNES
Korea KAERI
Mexico CNSNS
Romania INR
Slovakia UJD
Slovenia SNSARED
Spain CSN
Sweden OKG, Forsmark Kraftgrupp
Switzerland SFNSI
Chinese Taipei INER
United States NRC
The complete responses are given in Appendix 3.
Complementary questions:
A Task Group meeting was organised in March 2015, and it was considered that some complementary information was necessary for specific points, so a complementary questionnaire was sent to the WGRISK members in April 2015 (Appendix 4). Supplemental responses were provided by 14 countries (Appendix 5).
Report
A structure of the report was established by the Task Group in January 2015. The structure of the report is consistent with the structure of the questionnaire.
For each chapter a writer was identified for providing a synthesis of the responses to the questionnaires:
1. Executive summary France 2. Introduction France 3. General plant and electrical supplies information Chinese Taipei 4. General PSA information Hungary 5. PSA information specific to loss of electrical sources 5.1. Initiating events Hungary 5.2. Modelling and data Hungary 5.3. Results USA

NEA/CSNI/R(2017)5
18
6. Safety issues France 7. PSA challenges and unresolved issues Czech Republic 8. Conclusions and recommendations All
Each chapter includes some conclusions related to the corresponding topic. These conclusions were grouped to derive some general conclusions and recommendations. It has to be noted that each chapter was reviewed by all the Task Group members with many constructive remarks and additions.
The main report is intended to provide a high level summary of the information obtained during the task. Detailed responses from each survey respondent are provided in Appendices 3 and 5.
NEA/CSNI/R(2017)5
19
2. GENERAL PLANT AND ELECTRICAL SUPPLIES INFORMATION
The availability of alternating current (AC) power supplies is essential for safe operation and accident prevention and mitigation at commercial nuclear power plants. Normally, AC power is supplied by off-site sources via the electrical grid. Loss of off-site power (LOOP) usually refers to the simultaneous loss of external electrical power to all plant safety buses (also referred to as emergency buses, Class 1E buses, and vital buses), requiring emergency power supplies to start and supply power to the safety buses. A LOOP can have a major negative impact on a power plant's ability to achieve and maintain safe shutdown conditions. The non-essential buses may also be de-energised as a result of a LOOP. The severity of the impacts of a LOOP may differ depending on the plant operating status.
If the plant is in power operation and a LOOP occurs, a reactor trip generally occurs, challenging various safety systems designed to bring the plant to a safe shutdown. Most of the safety systems require AC power, so emergency diesel generators (or other emergency ac power sources) must start and run to supply this power until off-site power is restored to the safety buses. If the emergency AC power sources fail, the plant is still designed to shut down safely via portions of safety systems that can function for a limited period of time without ac power (e.g. turbine-driven pumps for coolant injection). Even if the plant is in a shutdown state when a LOOP occurs, emergency AC power must be supplied to the residual heat removal systems for the primary system and the spent fuel pool.
This chapter covers a general description of the reference plant feedback from the survey as well as aggregated data regarding its configuration for AC power and DC (direct current) control sources, including external powers, internal power, particular devices and batteries.
External source
External source means the external grid configuration, which can vary significantly from site to site, including multi-unit aspects. For most countries, there is redundancy and diversity in grid connection characteristics and interconnections with switchyard design (e.g. main and auxiliary lines, UATs (unit auxiliary transformers) and RATs (reserve auxiliary transformers). In addition to this redundancy and diversity, some plants also rely on diverse external resources that are independent of the normal switchyard grid connection, such as hydro power units (e.g. as described in the answers from STUK, Finland and VENE, Germany) or combined gas-steam power station (e.g. answer from JSI, Slovenia).
Internal source
Emergency diesel generators (EDGs) are typically relied upon to ensure the availability of AC power for critical safe shutdown components in the current generation of operating nuclear power plants. The EDGs generally provide electrical power necessary to activate and control reactor cooling and safety systems during a LOOP event, and as a safety barrier against the escalation of the scenario into a Station Black-out (SBO) condition (i.e. loss of all off-site and on-site AC power). Generally, a reactor unit is equipped with redundant EDGs to support independent safety trains. In addition to EDGs, some plants rely on additional external back-up sources, such as on-site gas turbines (e.g. as presented by INER from Chinese Taipei, STUK from Finland, Forsmarks Kraftgrupp AB from Sweden and U.S. NRC). Multi-unit reactor sites may also rely on the capability to cross tie on-site sources of AC power.

NEA/CSNI/R(2017)5
20
Alternate capabilities
During an SBO (station black out), all AC power to essential motor driven pumps would be lost, preventing critical reactor core cooling (e.g. decay heat removal). Only the remaining turbine (steam) driven pumps, if included in the design, may be available depending on the severity of the scenario (e.g. BWR’s RCIC system and PWR’s turbine-driven AFW). Some plants, may also deploy a diesel-driven AFW pump (e.g. STUK from Finland, NPCIL from India, KAERI from Korea, INER from Chinese Taipei) or a safety-related fire water system powered by a standalone DG (e.g. INER from Chinese Taipei). The availability, arrangement and design of these different components are highly unit specific.
Batteries
One extremely important subset of LOOP-initiated scenarios involves SBO conditions, in which the affected plant must achieve and maintain safe shutdown by relying on components that do not require AC power, such as turbine- or diesel-driven pumps. Thus, the reliability of such components, DC battery depletion times and characteristics of off-site power restoration are important for SBO risk. The safety objective of the station batteries is to supply DC power to all normal and emergency loads needed to achieve and maintain safe shutdown. Most plants use two different segments in voltage design (e.g. 125/250 V DC or 125/220 V DC). Each of the two independent safety-related DC systems per unit should be of adequate size to provide control and switching power to safeguard systems and components, DC auxiliaries and DC motor operated valves until AC power supplies are restored. Based on the information provided, the requirements for the capacity of the unit battery banks are country specific (and in some cases site-specific or design-specific) and vary from a few hours up to eight hours. The detailed questionnaire responses provide more information on battery design considerations.
House load operation
In case of a LOOP, most nuclear plants have the capability to continue to operate in-house turbine or island mode (house turbine operation generally refers to operation of the reactor itself supplying power for its own needs, while island mode operation refers to a situation where the plant supplies power also to nearby areas that are disconnected from the national grid). However, due to operational stability problems less than half of the PSA analyses reviewed give credit to plant operation in-house load or island mode following a LOOP event.

NEA/CSNI/R(2017)5
21
3. PSA INFORMATION
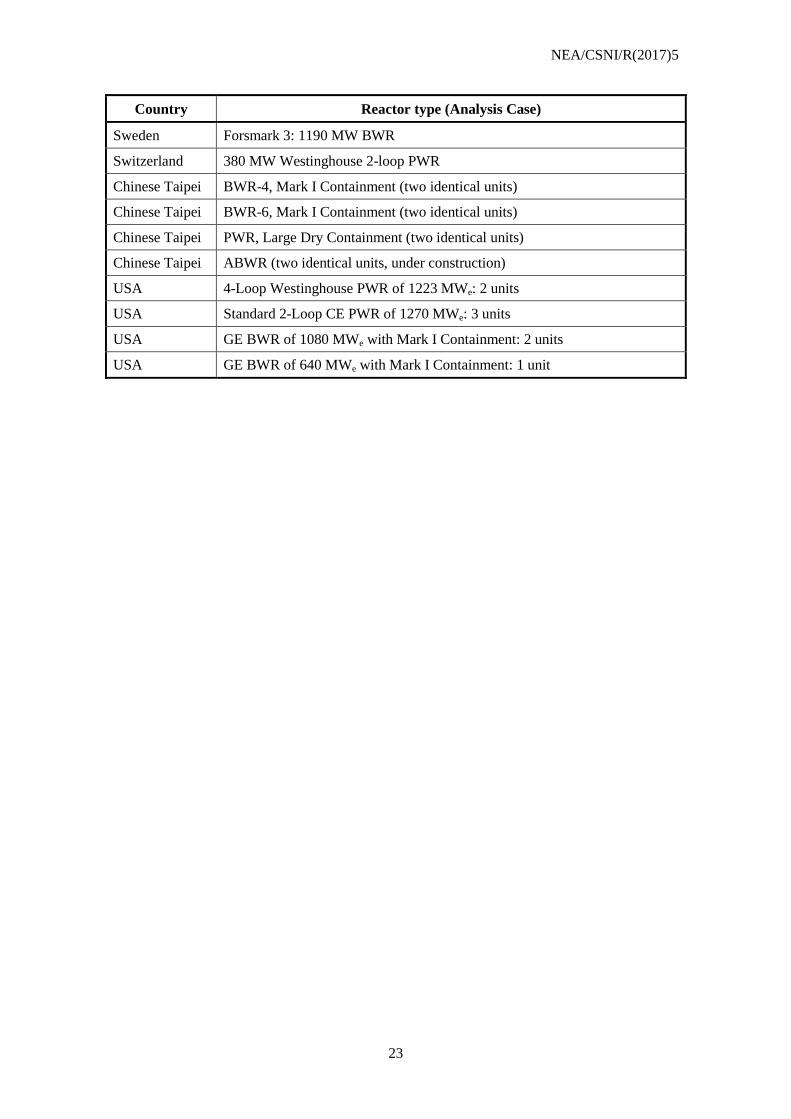
The information given in this chapter, and more generally in the whole report, is based on the responses provided in the survey. As indicated in the introduction, in some cases the responses address several different studies (or analysis cases). Table 2 lists the 38 reactors (or reactor types) covered by the responses. Moreover, the scope of the PSAs depends on the purpose (e.g. licensing, research) of the study presented in the response. The statistics presented in this chapter do not represent an exhaustive worldwide analysis but the specific status of the studies which are the basis of the survey.
PSA is mandatory for a nuclear power plant in the majority of the member countries that responded to this question explicitly in the questionnaire (about 50% of the participants). In most cases, a Level 1 and a Level 2 PSA are required by nuclear safety regulations. The tendency is to make PSA as complete as possible with respect to the potential sources of large releases, the initiating events and hazards, and the plant operational states addressed in the analysis.
Level 1 PSA has been completed for all the nuclear power plants covered in the questionnaire. Typically, the Level 1 PSAs described in the survey include internal initiating events at full power. Internal hazards (fire, flooding, etc.) are analysed for about 80% of the plants, while Level 1 PSA of external events has been performed for about 70% of the plants. Presumably, the external events PSAs vary in scope (i.e. the types of hazards addressed) since some respondents (e.g. Forsmark Kraftgrupp AB from Sweden) indicated that this part of the analysis was not complete yet. Low power and shutdown PSA of Level 1 is available for about 80% of the plants.
Level PSA 2 has been completed for 84% of the plants included in the survey. Similarly to Level 1 analysis, internal hazards are included in about 80% of the Level 2 PSAs. Level 2 PSA of external events is available for roughly 50% of the plants. Level 2 PSA for low power and shutdown conditions was done for approximately 30% of the plants represented in the survey.
Half of the responses indicate a PSA was performed for the spent fuel pool. Typically, these spent fuel pool PSAs were limited to internal events. Spent fuel pool PSA of internal hazards and external hazards is available for 16% of the plants included in the survey responses. Level 2 PSA of the spent fuel pool has been performed for less than 18% of the plants focusing on internal events and, to a lesser extent, on internal hazards. Level 2 PSA for external events of the spent fuel pool is available for a small fraction of 5% of the plants covered by the survey.
Only Japan included an explicit indication of a Level 3 PSA being performed for the nuclear power plants addressed in the questionnaire responses (although the response is based only on the Level 1 results). To this finding it is noted that regulatory requirements do not call for a Level 3 analysis to be performed by the licensees in most member states. For example, the Finnish nuclear safety authority (STUK) clearly indicated in the responses that Level 3 PSA is not required in Finland.
Some of the PSAs described in the survey were initially performed in the early or mid-1980s (e.g. the PSA for BWR-6 plant in Chinese Taipei or for the Forsmark plants in Sweden). Other analyses are more recent developments dating back just to the first decade in the 21st century (e.g. the PSA for the 1630 MWe EPR in France or for the different PWR and BWR designs in the USA developed for regulatory use). However, most PSAs were initially performed in either the late 1980s or in the 1990s. It is a common practice to regularly update
NEA/CSNI/R(2017)5
22
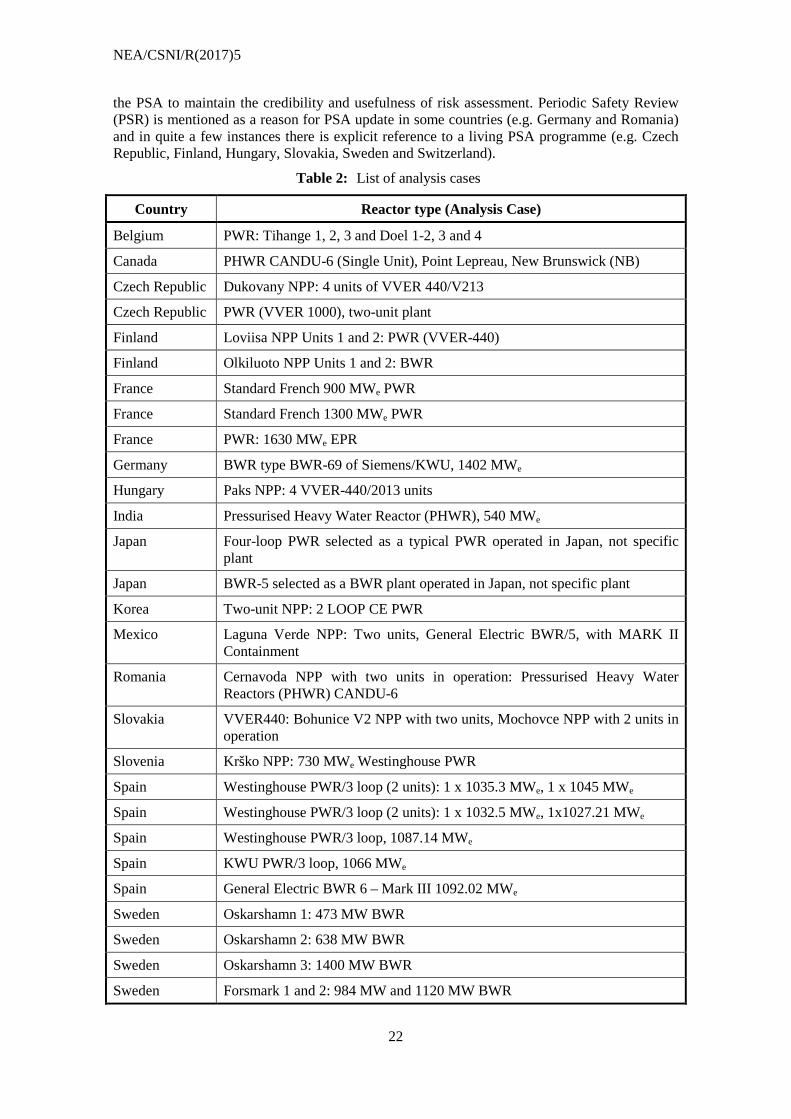
the PSA to maintain the credibility and usefulness of risk assessment. Periodic Safety Review (PSR) is mentioned as a reason for PSA update in some countries (e.g. Germany and Romania) and in quite a few instances there is explicit reference to a living PSA programme (e.g. Czech Republic, Finland, Hungary, Slovakia, Sweden and Switzerland).
Table 2: List of analysis cases
Country Reactor type (Analysis Case)
Belgium PWR: Tihange 1, 2, 3 and Doel 1-2, 3 and 4
Canada PHWR CANDU-6 (Single Unit), Point Lepreau, New Brunswick (NB)
Czech Republic Dukovany NPP: 4 units of VVER 440/V213
Czech Republic PWR (VVER 1000), two-unit plant
Finland Loviisa NPP Units 1 and 2: PWR (VVER-440)
Finland Olkiluoto NPP Units 1 and 2: BWR
France Standard French 900 MWe PWR
France Standard French 1300 MWe PWR
France PWR: 1630 MWe EPR
Germany BWR type BWR-69 of Siemens/KWU, 1402 MWe
Hungary Paks NPP: 4 VVER-440/2013 units
India Pressurised Heavy Water Reactor (PHWR), 540 MWe
Japan Four-loop PWR selected as a typical PWR operated in Japan, not specific plant
Japan BWR-5 selected as a BWR plant operated in Japan, not specific plant
Korea Two-unit NPP: 2 LOOP CE PWR
Mexico Laguna Verde NPP: Two units, General Electric BWR/5, with MARK II Containment
Romania Cernavoda NPP with two units in operation: Pressurised Heavy Water Reactors (PHWR) CANDU-6
Slovakia VVER440: Bohunice V2 NPP with two units, Mochovce NPP with 2 units in operation
Slovenia Krško NPP: 730 MWe Westinghouse PWR
Spain Westinghouse PWR/3 loop (2 units): 1 x 1035.3 MWe, 1 x 1045 MWe
Spain Westinghouse PWR/3 loop (2 units): 1 x 1032.5 MWe, 1x1027.21 MWe
Spain Westinghouse PWR/3 loop, 1087.14 MWe
Spain KWU PWR/3 loop, 1066 MWe
Spain General Electric BWR 6 – Mark III 1092.02 MWe
Sweden Oskarshamn 1: 473 MW BWR
Sweden Oskarshamn 2: 638 MW BWR
Sweden Oskarshamn 3: 1400 MW BWR
Sweden Forsmark 1 and 2: 984 MW and 1120 MW BWR
NEA/CSNI/R(2017)5
23
Country Reactor type (Analysis Case)
Sweden Forsmark 3: 1190 MW BWR
Switzerland 380 MW Westinghouse 2-loop PWR
Chinese Taipei BWR-4, Mark I Containment (two identical units)
Chinese Taipei BWR-6, Mark I Containment (two identical units)
Chinese Taipei PWR, Large Dry Containment (two identical units)
Chinese Taipei ABWR (two identical units, under construction)
USA 4-Loop Westinghouse PWR of 1223 MWe: 2 units
USA Standard 2-Loop CE PWR of 1270 MWe: 3 units
USA GE BWR of 1080 MWe with Mark I Containment: 2 units
USA GE BWR of 640 MWe with Mark I Containment: 1 unit

NEA/CSNI/R(2017)5
24
4. PSA INFORMATION SPECIFIC TO ELECTRICAL SOURCES
4.1. Initiating events
4.1.1. Definition and categorisation of initiating events
4.1.1.1 Overall principles
As depicted from the answers, loss of external AC power supply sources is rarely defined as a single category of initiating events in PSA. It is usually sub-categorised depending on the cause and fault location within the AC power distribution system. A single LOOP category is used by 13 out of the 38 different PSAs. It is not practical to directly compare the number of sub-categories described in the different answers because some respondents reported only total or partial losses of off-site power as sub-categories. This indicates that other, lower level power supply failures (e.g. failures of safety bus bars) had also been looked at in the PSA (e.g. France, Japan, Korea, Mexico, Spain, Sweden, Switzerland and USA), while a few other respondents directly included such lower level failures in the definition of the sub-categories (e.g. ÚJV Řež from Czech Republic and Hungary). The average number of sub-categories reported is three and one respondent (i.e. ÚJV Řež, Czech Republic) included as many as nine sub-categories.
Distinction between the sub-categories of power supply failures is usually justified if plant responses (including system and operator responses and the associated success criteria) or recovery probabilities are different for the different categories, which requires the delineation of separate accident sequence models. On this basis considerations were given in the analyses to the following major factors in the definition of power supply failure sub-categories as different PSA initiating events:
• Power connection and distribution architecture
- Grid failures including grids of different voltage levels, if applicable (e.g. higher voltage grid, typically of 500 kV or lower, lower voltage grid, typically of 230 kV or lower);
- Failures of auxiliary/back-up connections with or without switchyard, as applicable;
- Switchyard failures including multiple switchyards connected to the plant, as applicable;
- On-site power supply system failures other than switchyard failures;
- Distinguishing features of power connection configuration in shutdown conditions including the effects of maintenance;
• Effects of power supply faults on plant operation, (e.g. loss of condenser or not, feasibility of house load or island mode of operations, operating conditions of mitigating systems);
• Duration of power supply faults: short LOOP, long LOOP and other categories;
• Causes: - Intrinsic failures (failures of the electrical system);
- External causes (e.g. severe weather conditions or other external events).

NEA/CSNI/R(2017)5
25
The categorisation is largely dependent on plant design and power distribution architecture. Also, it is noted that the plant design and power distribution architecture have dependencies. For example, the power connection set up and the associated plant protection features (e.g. plant response to a power runback event) greatly determine the effects of power supply faults on plant operation and also the duration of the event has an impact on accident mitigation features (e.g. availability of water inventory in steam generators, capacity of back-up batteries, etc.).
4.1.1.2. Major factors considered in practice
4.1.1.2.1. Fault duration
The duration of a power supply fault influences accident mitigation features and the corresponding accident sequence frequencies. Accordingly, the duration of loss of off-site power was taken into consideration in most analyses. About one third of the responses indicate that short-term LOOP and long-term LOOP were explicitly considered in the definition of initiating events. What is considered short and long and how further categorisation is made is dependent on plant design and on available experience on grid failures and recoveries. The actual definitions of short and long vary as shown by some selected examples:
• Loss of off-site power shorter than 4 hours is not modelled in the Loviisa PSA (Finland) because the large water inventory in the steam generators ensures heat removal for 4 to 5 hours and the capacity of the batteries required for control is 5 hours. So the unit can survive 4 hours without AC power.
• In the PSA for Olkiluoto, Unit 1 and 2 (Finland) five LOOP duration values are used in total covering short and long LOOP events from 0 to 10 minutes to over 8 hours.
• In the PSA for the 1630 MWe EPR (France) a LOOP event is considered short, if it is recovered within 2 hours and long, if it is recovered between 2 and 24 hours.
• LOOP events shorter than 2 hours are considered short in the PSA for the Krümmel NPP (Germany).
• In the PSA for Oskarshamn, Unit 1 and 3 (Sweden) a LOOP event is assumed recovered after 2 hours.
Even in those cases where distinction was not made according to LOOP duration in the definition of initiating events, considerations were usually given to the duration of the loss of power event. Recovery was modelled as a function of time in most cases, out of which 26 responses indicated the use of multiple recovery times and the associated recovery probabilities. Recoveries are typically included in the event sequence models rather than in the definitions of initiating events because the time to recovery impacts on the development of accident sequences (availability of cooling water, capacity of batteries, etc.).
4.1.1.2.2. LOOP categorisation based on location of disturbance1
In some analysis (e.g. USA) the categorisation of LOOP initiating events is related to the location of the disturbance.
• LOOP plant centred (LOOPPC): Plant centred events occur within the plant, up to but not including the auxiliary or station transformers failures. These events usually involve hardware failures, design deficiencies, human error and localised weather induced faults such as lightning. Plant personnel generally perform the actions to restore off-site power to the safety buses.
1. Additional information on the definitions of location related LOOP events can be found in
NUREG/CR-6890, “Reevaluation of Station Blackout Risk at Nuclear Power Plants” [2].

NEA/CSNI/R(2017)5
26
• LOOP weather-related (LOOPWR): Weather-related LOOP events are caused by severe or extreme weather. Weather-related events have the potential to affect areas larger than one site but typically impact a single site. In such events, restoration of off-site power often requires a longer time because of either the extent of the damage caused by the weather or the continuing effects of the weather hampering restoration efforts.
• LOOP grid related (LOOPGR): Grid-related events occur when the LOOP occurs on the interconnected transmission grid. Grid-related LOOP events include those in which the initial failure occurs in the interconnected transmission grid that is outside the direct control of plant personnel. In such cases, restoration of off-site power is performed mainly by transmission grid personnel (with plant personnel restoring power from the switchyard to the safety buses).
• LOOP switchyard centred (LOOPSC): Switchyard centred events occur within the switchyard, up to and including the output bus bar. Plant and switchyard personnel co-ordinate their restoration actions. Equipment or human induced failures of equipment, in the switchyard play the major role in the loss of off-site power.
4.1.1.2.3. External hazards
In addition to intrinsic failures of the power supply system (including internal functional failures and grid instability), some analyses used weather-related events as a separate category of LOOP events (e.g. Slovenia, Chinese Taipei and USA). Other respondents (e.g. France and Hungary) indicated that weather-related causes and other external events were included in the definition of the LOOP event if LOOP was the only consequence of the event on plant operation without any additional failures of safety-related systems, structures and components. If induced failures besides LOOP were also expected due to an external event, then the event was subject to a dedicated analysis within the PSA for external events in the latter cases.
External hazards as LOOP initiators were considered in almost all the analyses addressed in the survey. In some cases (e.g. in the Standardised Plant Analysis Risk (SPAR) models described by the U.S. NRC) weather-related LOOP was included (either separately or within the generic LOOP event) even if a PSA for external events was not performed. It seems to be a common practice to model the effects of external hazards on the power supply system as separate initiating events unless LOOP is the only consequence. In a PSA for external hazards this distinction is made for all the single and combined hazards that are within the scope of the analysis. LOOP as well as other power supply faults are modelled also in combination with other failures in the plant induced by the hazards. The range of the hazards considered in the survey responses is greatly site specific and it can also be limited by the declared scope of the analysis. The specific hazards explicitly mentioned as analysed include:
• seismic motion;
• typhoon/hurricane;
• tornado;
• strong wind (straight);
• thunderstorm;
• downburst;
• lightning;
• heavy snowfall;
• frost/ice formation;
• frazil ice;

NEA/CSNI/R(2017)5
27
• flood;
• extremely low- and extremely high-temperatures;
• aircraft crash.
• Combined hazards (as reported for the Loviisa PSA in Finland), for example:
- wind and algae blockage;
- wind and frazil ice blockage;
- heavy snowfall and wind.
- frazil ice blockage, heavy snowfall and wind.
4.1.1.2.4. Failures in on-site power supply systems
About 80% of the responses indicated that power supply faults other than the total or partial loss of off-site power were also considered as initiating events in the analysis. Some of these are an important contributor to core damage risk. Characteristic examples of such particular initiating events are as follows:
• Loss of a vital AC bus or electric board (failures of bus bars for different voltage levels appear in the responses ranging from 110 V to 6.6 kV.)
• Loss of multiple AC buses
• Loss of vital DC power/buses
• Loss of a transformer
• Loss of component cooling water system.
4.1.2. Initiating event frequencies
Because of the differences in plant design, in grid layout/connections and in the definition of power failure events, it is not appropriate to directly compare the initiating event frequencies used in the PSA for different plants in different countries. As far as the frequency of total or partial losses of off-site power is concerned, the values reported typically fall into the range of 10-3/year to 10-1/year in terms of order of magnitude, where figures of 10-2/year order of magnitude appear most frequently. The results of these initiating events frequency are summarised in the Table 3 and Figure 1 below. Significantly lower values than these are also given in the responses for specific power supply failures (e.g. for total loss of 6.6 kV bus bars in the PSA for the 900 MWe and the 1300 MWe PWRs in France) and also for loss of power events induced by extreme external events where the hazard frequency and the fragility of the power supply system together determine the loss of power event frequency. The data scope for estimating initiating event frequencies varies among the respondents with examples using plant-, site-, region- or country-specific data. There are dedicated data collection and analysis programmes in place in a number of countries to support the estimation (e.g. France, Korea, Nordic countries and USA). Generic data are combined with plant-specific information using Bayesian data update in some countries (e.g. Canada, Mexico, Romania and Chinese Taipei). Besides statistical data analysis, additional methods such as the use of simulation models or grid reliability analysis (e.g. Finland and Sweden) and fault tree analysis (e.g. Hungary) are also applied to determine initiating event frequencies.

NEA/CSNI/R(2017)5
28
1.00E-03
1.00E-02
1.00E-01
1.00E+00
Freq
uenc
y
LOOP Categories
LOOPGR
LOOPPC
LOOPWR
LOOPSC
Long LOOP
Short LOOP
LOOP

NEA/CSNI/R(2017)5
29
Table 3: Reported LOOP events and frequencies
LOOP category
Countries Frequency range [1/year]
Average frequency [1/year]
Standard deviation
LOOP Belgium, Czech Republic, Finland, India, Japan, Korea, Romania, Slovenia, Slovak Republic, Spain, USA
3.9 E-03 – 6.62 E-01 1.00 E-01 1.5 E-01
LOOPPC Chinese Taipei, USA
1.5 E-03 – 4.69 E-03 2.27 E-03 1.10 E-03
LOOPWR Chinese Taipei, USA
2.7 E-03 – 8.8 E-03 4.51 E-03 2.05 E-03
LOOPGR Czech Republic, France, Sweden, Chinese Taipei USA
1.2 E-02 – 8.5 E-02 3.84 E-02 2.66 E-02
LOOPSC Sweden, Chinese Taipei USA
4.6 E-03 – 1.0 E-02 1.89 E-02 1.51 E-02
Total LOOP (LOOPPC +LOOPWR + LOOPGR +LOOPSC) 6.4 E-02
Long LOOP Belgium, France, Germany, Sweden
1.0 E-03 – 1.77 E-03 1.27 E-03 2.99 E-04
Short LOOP France, Germany
2.0 E-02 – 4.2 E-03 1.65 E-02 7.1 E-04
Total LOOP (short LOOP + long LOOP) 1.78 E-02
4.1.3. Conclusions
The following conclusions can be drawn from PSA information on initiating events given in the questionnaire responses:
• Various categories of power supply faults are analysed in most PSAs, as opposed to analysing only loss of off-site power as a single category of failures in electric power supply sources. Distinction between power supply failures is justified if plant responses (including system and operator responses and the associated success criteria) are different for two failures, which requires the delineation of separate accident sequence models in the PSA. In addition to total or partial loss of off-site power, other types of

NEA/CSNI/R(2017)5
30
power supply failures such as loss of vital AC or DC buses, loss of transformers, etc. are also analysed.
• The duration of a power supply fault influences accident mitigation features and the corresponding accident sequence frequencies. Accordingly, the duration of loss of off-site power is taken into consideration in most PSAs.
• External hazards as LOOP initiators are considered in almost all the PSAs addressed in the survey. It appears that it is a common practice to model the effects of external hazards on the power supply system as separate initiating events unless LOOP is the only consequence of the hazard.
• The frequency of total or partial losses of off-site power typically falls into the 10-3/year to 10-1/year range in terms of order of magnitude, although direct comparison is not meaningful due the differences in plant design, grid layout/connections and in the definition of power failure events.
• Plant, site, region or country-specific data are used to estimate initiating event frequencies in most cases. There are dedicated data collection and analysis programmes in place in a number of member countries to support the estimation.
4.2. Modelling and data
In this section, modelling and data issues are covered to the extent addressed in the survey questions and responses. However, a detailed discussion on modelling initiating events and accident sequences for LOOP and other power supply failure events is beyond the scope of this report.
4.2.1. Recovery of power supply
As discussed in par. 4.1.1.2, consideration of recovery is important both for initiating event definition and event sequence development. Recovery is modelled in the majority of the 38 analyses covered by the survey and there are only three explicit indications that recovery is not modelled in PSA (Belgium, Germany and India). Multiple recovery times are usually taken into account. The recovery times used are dependent on the initiating event definitions (types of electric power supply failures and fault duration) and on success criteria in the accident sequences. The answers from ÚJV Řež of Czech Republic also highlights the changes in recovery times in different plant operational states (e.g. the lower residual heat in low power and shutdown states can result in relaxation of the time window for recovery). Various kinds of recovery models are applied depending on the initiating events, the availability of operational experience and the analysis approach used. Representative examples of the modelling methods include the use of probability distribution functions for the time to recovery (mostly lognormal or exponential approximations and Gamma distribution in a few cases), direct estimation of frequency for events recovered within a pre-set time period based on service experience, dedicated human reliability analysis for the recovery tasks, and combined use of grid simulation models and human performance analysis.
In a few instances recovery analysis includes an explicit modelling of on-site recovery actions needed to return power supply to vital safety buses. In the majority of these cases a dedicated human reliability analysis is also performed to determine the reliability of the on-site recovery actions.
4.2.2. Component failure modes
Usually the diesel generators failure modes included in the accident sequence models are failure to start and failure to continue running. Depending on plant design, these failure modes are assumed for emergency and other types of diesel generators (e.g. main and station black-out diesel generators in France, swing diesel generators in Chinese Taipei,). Additionally, there are some explicit indications of considering unavailability due to maintenance (e.g. Czech Republic

NEA/CSNI/R(2017)5
31
and Korea) as well. Loss of support systems or subsystems such as actuation breakers, cooling water, fuel pumps, cooling and exhaust fans, etc. are also explicitly included in the fault tree models for the diesel generators. Reference is made to detailed fault tree modelling (including diesel generators and other sources of electric power supply, as appropriate) in the responses from the Czech Republic, Finland, Hungary, Sweden and Switzerland. Failure modes similar to that of the diesel generators are modelled for the available gas turbines in the PSA for the BWR-4, BWR-6 and PWR plants in Chinese Taipei and in the PSA for Oskarshamn, Units 1 to 3 in Sweden. In addition to the failure of active components, failure of bus bars as a cause to loss of electric power from different sources is referred to as a modelled element in some responses (e.g. Czech Republic, Finland, Germany, Mexico and Slovak Republic).
4.2.3. Common cause failures
Common cause failures (CCFs) for the failure to start as well as for the failure to continue running (or operating) failure modes of active components (particularly diesel generators and gas turbines) are typically included in the PSA model. CCFs are defined for components of the same type (e.g. for the same types of diesel generators). None of the responses refer to the modelling of inter-system CCFs. A number of respondents indicate either the importance of CCFs (e.g. STUK for the Olkiluoto, Unit 1 and 2 PSA) or the necessity to improve CCF modelling and estimation of CCF parameters (e.g. Belgium, Chinese Taipei and Sweden).
4.2.4. Mission time
As witnessed by the questionnaire responses, the traditional mission time of 24 hours is predominantly used in the accident sequence models for power supply faults. However, there are examples of finer distinctions and deviations from the general approach, such as:
• Use of the time period of short-term LOOP as mission time in the PSA models for short-term LOOP in Belgium;
• 72 hours of mission time for the containment systems of the CANDU-6 plants (Canada) where there are alternate means of cooling available;
• Distinction between diesel generator failures within the first 2 hours and between 2 and 24 hours, as well as the use of 72 hours in the spent fuel pool PSA for the Dukovany plant in Czech Republic;
• Use of mission times shorter than 24 hours (e.g. 2 hours, 4 hours and 5 hours) in case of short recovery times to avoid excessive conservatism in the PSA studies reported by IRSN, France;
• Use of mission times shorter than 24 hours in some cases depending on the probability of grid recovery before core damage.
Also, some respondents point out that the automatic use of 24 hours for mission time may lead to underestimation of risk from long-term scenarios, particularly if LOOP and additional power supply failures are induced by extreme external events.
4.2.5. Other modelling features
There are other remarks in the questionnaire responses related to miscellaneous aspects of PSA modelling and data. These remarks can be summarised as follows:
• The capability of the plant to operate in-house or island mode was indicated in 27 cases. Despite this fact credit to plant operation in this mode following a LOOP event was given only in 16 PSAs.
• There appears to be some difficulty in fault tree modelling due to possible power connection configurations for supply to electric boards from diesel generators (Belgium).

NEA/CSNI/R(2017)5
32
• A few responses indicate the importance of considering multi-unit issues in modelling the consequences of electric power supply faults (e.g. Hungary, Korea and Chinese Taipei,).
• In the PSA of the 900 MWe and 1300 MWe PWRs in France a seal LOCA is assumed with two possible leak rates in case of loss of RCP seals cooling. These leak rates, assessed by expert judgement, have an important impact on the PSA results.
• The potential impact of grid disturbances, other than loss of connection to the grid, on the electrical systems of the plant need further specific analyses (Hungary).
• In the USA, issues that have been previously identified related to the loss of electrical sources have been addressed and documented in the draft document “Treatment of the Loss of Off-site Power (LOOP) in Probabilistic Risk Assessment: Technical Basis and Guideline”; Electric Power Research Institute (EPRI), draft report C101060008-7289, October 2007 [3].
• It is not typical to use guidance documents specific to the PSA modelling of electric power supply failures, and the respondents did not emphasise the lack of such guidance. However, in several analyses, the U.S. NRC’s NUREG/CR-6890 report [2] was used in the modelling of off-site power recovery.
4.2.6. Conclusions
The following, conclusions can be drawn from PSA information on modelling and data given in the questionnaire responses:
• Recovery is important both for initiating event definition and event sequence development. Recovery is modelled in the majority of the 38 PSAs covered by the survey. Multiple recovery times are usually taken into account.
• Various kinds of recovery models are applied depending on the initiating events, the availability of operational experience and the analysis approach used.
• Usually the failure to start and the failure to continue running failure modes of active alternate power supply equipment (mostly diesel generators but including other power sources, as appropriate) are considered in the accident sequence models.
• Some analyses include a detailed fault tree modelling of diesel generators and other sources of electric power supply.
• Failures of bus bars and batteries are typically modelled.
• Common cause failures of active power supply equipment (mostly diesel generators) are taken into consideration.
• The traditional mission time of 24 hours is predominantly used in the accident sequence models for power supply faults. Some responses point out that 24 hours of mission time is unnecessary for short-term loss of power events (typically of a few hours duration). On the other hand, the automatic use of 24 hours may lead to underestimation of risk from long-term scenarios, especially if LOOP and additional power supply failures are induced by external events.
• Due to operational stability problems, less than half of the analyses give credit to plant operation in-house load or island mode following a LOOP event, although most plants have the capability to operate in this mode.
4.3. Results
This section will discuss the PRA results obtained from the initial and complementary surveys. Topics that will be discussed include the defence-in-depth concept within the context of

NEA/CSNI/R(2017)5
33
identifying PSA insights, LOOP events and their contribution to core damage frequency (CDF), conditional core damage probability (CCDP) given a LOOP event and importance measures.
4.3.1. Framework for obtaining risk insights from PSA modelling
The intent of this section is to provide a framework for reporting PSA results and identifying risk insights obtained from the responses to the survey. The concept of defence in depth (DiD) provides a useful and practical framework for organising and assessing these results. However, it is necessary to define DiD and its relation to PSA. To make an overall assessment, it is important to understand how DiD is used by the different countries.
One of the challenges in addressing DiD is that there is no common definition of what constitutes DiD. In the U.S., DiD is defined as:
“An approach to designing and operating nuclear facilities that prevents and mitigates accidents that release radiation or hazardous materials. The key is creating multiple independent and redundant layers of defence to compensate for potential human and mechanical failures so that no single layer, no matter how robust, is exclusively relied upon. Defence in depth includes the use of access controls, physical barriers, redundant and diverse key safety functions, and emergency response measures.” [4]
The IAEA [5] defines DiD as:
A hierarchical deployment of different levels of diverse equipment and procedures to prevent the escalation of anticipated operational occurrences and to maintain the effectiveness of physical barriers placed between a radiation source or radioactive material and workers, members of the public or the environment, in operational states and, for some barriers, in accident conditions. The objectives of DiD are:
a) To compensate for potential human and component failures; b) To maintain the effectiveness of the barriers by averting damage to the facility and
to the barriers themselves; and c) To protect workers, members of the public and the environment from harm in
accident conditions in the event that these barriers are not fully effective.
As presented in the IAEA document INSAG-10 [6], and also in a recent report by the Swedish Radiation Safety Authority [7], DiD can also be envisioned as multiple levels. If the first level fails, the second level will come into play and so forth. The levels of DiD described in the report are:
• prevention of abnormal operation and failures;
• control of abnormal operation and failures;
• control of accidents within the design basis;
• control of severe plant conditions, including prevention of accident progression and consequence mitigation.
• mitigation of consequences of significant releases of radioactive substances.

NEA/CSNI/R(2017)5
34
The figure below, from [5], shows an event tree representation of these DiD levels.
Figure 2: Defence-in-depth event tree
While there is no single way to view defence in depth, the above concepts help to identify
key PSA results and insights that are most relevant to the functional diversity and redundancy of electrical distribution systems. For the purpose of this task, the following aspects for DiD were considered in order to identify an appropriate structure for highlighting PSA results:
• The LOOP initiating event frequency is equivalent to an initial level of DiD by indicating the likelihood of challenges to plant mitigation systems.
• The relative importance of components can indicate the amount of diversity and redundancy of key safety functions. For example, a component with a high risk achievement worth (RAW) value can imply a reduced redundancy or diversity for the component. Conversely, lower RAW values may reflect alternate means to accomplish the safety functions provided by the component. For components with relative higher RAW values, maintaining high reliability (through, for example, design and quality factors) may be important. The relative importance of components to core damage risk provides a measure of the ability of the component to mitigate or control initiating events.
• The conditional core damage probability (CCDP) provides a measure of integrated plant capability to mitigate a hazard. High CCDPs could indicate a reduced ability to mitigate a specific hazard and highlight areas that would benefit from greater diversity or redundancy.
• Finally, the relative balance of the contribution of each LOOP hazard category to the plant CDF may provide insights into specific plant vulnerabilities.
General insights related to DiD that were obtained from the survey responses include the use of:
• Diverse means to provide alternate sources AC power. Some of the alternate AC measures reported include: auxiliary transformers, turbine generators, combustion turbines and emergency diesel generators.
• Some countries rely on additional independent grid connections. For example, a Slovenian plant uses a diverse connection to a gas/steam power plant as an AC power back-up.
• Batteries also play an important role in DiD for most of the plants.

NEA/CSNI/R(2017)5
35
4.3.2. LOOP frequency
As described in section 4.1 there are a variety of categorisations for LOOP events identified in this survey. Although direct comparison is not meaningful due the differences in plant design, grid layout/connections and in the definition of power failure events, the frequency of total or partial losses of off-site power typically falls into the 10-3/year to 10-1/year range in terms of order of magnitude.
4.3.3. General insights from the WGRISK(2013)1 survey
This section will cover insights on CDF and CCDP results. The objectives of this section are: to present the CDF definitions obtained from the survey and provide CDF and CCDP results.
4.3.3.1. Core damage definitions
There are various definitions for CD presented in the survey. In general, the definitions provided fall into the following broad categories:
1. Peak clad temperature based – some of the responders defined CDF based on peak clad temperature. In most cases where peak clad temperature was used, core damage was identified as the point when the fuel temperature reaches 1200°C (2200°F). At this point, significant damage to the fuel is expected. The countries that expressed the use of this temperature factor include: Mexico, Slovakia, Czech Republic, Finland and Hungary.
2. Significant radiological release – other responders defined CDF as damage to the core that could result in a significant release and affect public health. Countries that use the radiological release factor as a baseline to define CDF include Mexico, USA and Switzerland.
3. Reactor vessel water level – a couple of responders (Mexico and Switzerland) use water level as a factor to define CDF. For instance, Mexico assumes core damage when the water level remains below 1/3 of the core height for more than 15 minutes. Switzerland defines CD as the uncovery and heat-up of the reactor core that could lead to a significant release of radioactive material from the core (for details see regulatory guideline ENSI-A05 [8]).
4. For the CANDU PSA Working Group (response from Canada) “Core damage is a condition where there is extensive physical damage of the multiple fuel channels due to overheating leading to loss of core structural integrity.”
Although there were some differences in the specific definitions used for core damage, the variability in definitions does not significantly impact the ability to compare results across the various countries.
4.3.3.2. Conditional core damage probability (CCDP)
Conditional core damage probability is the likelihood of core damage given a specific initiating event has occurred (a plant upset causing a demand for shutdown) has occurred. Lower CCDP values may indicate an increased amount of diversity or redundancy for specific safety functions needed to mitigate a specific initiating event.
The survey requested the participants to provide the CCDP results for each of their plants. These results are presented in Table 4.
4.3.3.3. CDF and CCDP results
CDF and CCDP results obtained from the survey are summarised in Table 4.
Figure 3 represents the contribution of LOOP to total CDF for each of the PWR plants presented on the previous table. The data points plotted include only those plants that provided the information for the total CDF and the % contribution.
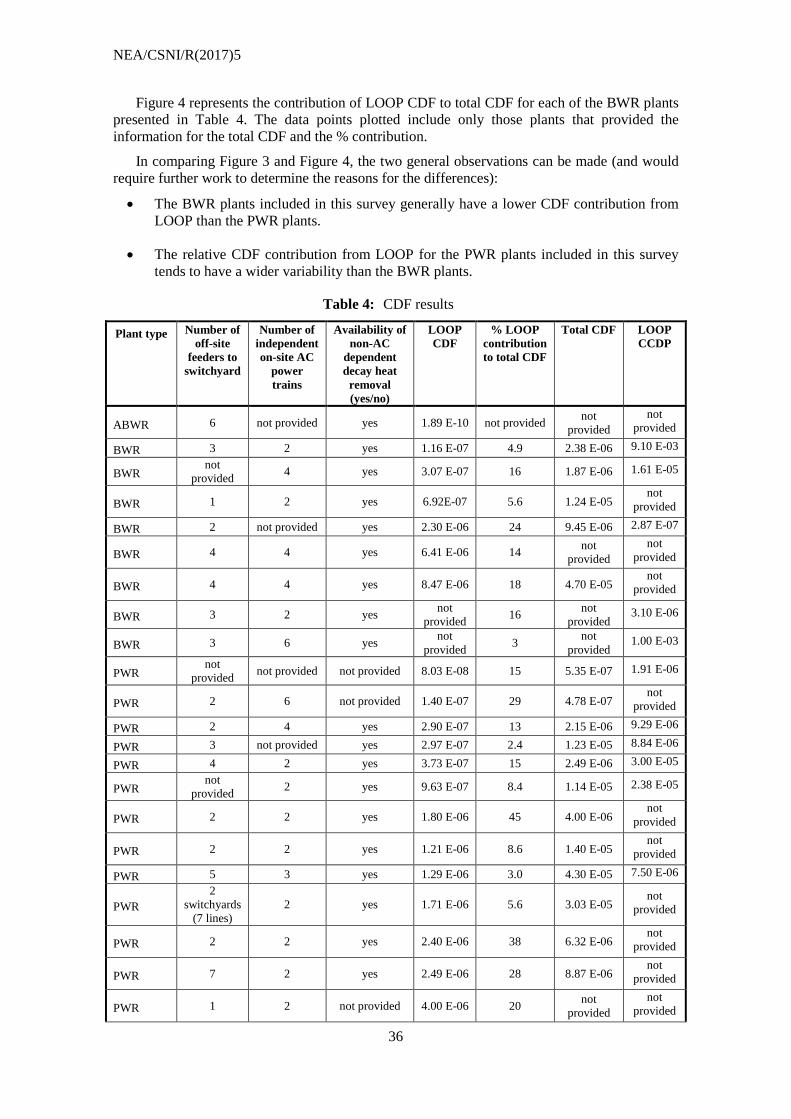
NEA/CSNI/R(2017)5
36
Figure 4 represents the contribution of LOOP CDF to total CDF for each of the BWR plants presented in Table 4. The data points plotted include only those plants that provided the information for the total CDF and the % contribution.
In comparing Figure 3 and Figure 4, the two general observations can be made (and would require further work to determine the reasons for the differences):
• The BWR plants included in this survey generally have a lower CDF contribution from LOOP than the PWR plants.
• The relative CDF contribution from LOOP for the PWR plants included in this survey tends to have a wider variability than the BWR plants.
Table 4: CDF results
Plant type Number of off-site
feeders to switchyard
Number of independent on-site AC
power trains
Availability of non-AC
dependent decay heat
removal (yes/no)
LOOP CDF
% LOOP contribution to total CDF
Total CDF LOOP CCDP
ABWR 6 not provided yes 1.89 E-10 not provided not provided
not provided
BWR 3 2 yes 1.16 E-07 4.9 2.38 E-06 9.10 E-03
BWR not
provided 4 yes 3.07 E-07 16 1.87 E-06 1.61 E-05
BWR 1 2 yes 6.92E-07 5.6 1.24 E-05 not
provided
BWR 2 not provided yes 2.30 E-06 24 9.45 E-06 2.87 E-07
BWR 4 4 yes 6.41 E-06 14 not provided
not provided
BWR 4 4 yes 8.47 E-06 18 4.70 E-05 not
provided
BWR 3 2 yes not provided 16 not
provided 3.10 E-06
BWR 3 6 yes not provided 3 not
provided 1.00 E-03
PWR not
provided not provided not provided 8.03 E-08 15 5.35 E-07 1.91 E-06
PWR 2 6 not provided 1.40 E-07 29 4.78 E-07 not
provided
PWR 2 4 yes 2.90 E-07 13 2.15 E-06 9.29 E-06
PWR 3 not provided yes 2.97 E-07 2.4 1.23 E-05 8.84 E-06
PWR 4 2 yes 3.73 E-07 15 2.49 E-06 3.00 E-05
PWR not
provided 2 yes 9.63 E-07 8.4 1.14 E-05 2.38 E-05
PWR 2 2 yes 1.80 E-06 45 4.00 E-06 not
provided
PWR 2 2 yes 1.21 E-06 8.6 1.40 E-05 not
provided
PWR 5 3 yes 1.29 E-06 3.0 4.30 E-05 7.50 E-06
PWR 2
switchyards (7 lines)
2 yes 1.71 E-06 5.6 3.03 E-05 not
provided
PWR 2 2 yes 2.40 E-06 38 6.32 E-06 not
provided
PWR 7 2 yes 2.49 E-06 28 8.87 E-06 not
provided
PWR 1 2 not provided 4.00 E-06 20 not provided
not provided

NEA/CSNI/R(2017)5
37
Plant type Number of off-site
feeders to switchyard
Number of independent on-site AC
power trains
Availability of non-AC
dependent decay heat
removal (yes/no)
LOOP CDF
% LOOP contribution to total CDF
Total CDF LOOP CCDP
PWR 2 3 not provided not provided 5.14 not
provided 8.60 E-06
PWR 2 2 yes not provided 4 not
provided 9.20 E-07
PHWR 2 2 not provided not provided not provided 3.30 E-05 5.00 E-02
PHWR 3 3 yes not provided 0.84 not
provided 7.78 E-04
VVER1000 5 3 yes 8.77 E-08 25 3.49 E-07 8.50 E-05
VVER440 2 3 not provided 1.15 E-06 28.29 not provided
not provided
VVER440 4 3 not provided 2.26 E-06 20.9 not provided
not provided
Figure 3: Per cent LOOP contribution to CDF vs. total CDF for PWR type reactors
* The triangle data point in this figure represents a VVER plant. Because of lack of information,
no other VVERs or PHWRs were included in this figure.
Figure 4: Per cent LOOP contribution to CDF vs. total CDF for BWR type reactors
0
10
20
30
40
50
60
1.00E-07 1.00E-06 1.00E-05 1.00E-04
% L
OO
P co
ntrib
utio
n to
CDF
Total CDF (PWRs)*
02468
101214161820
1.00E-06 1.00E-05 1.00E-04
%LO
OP
Cont
ribut
ion
to C
DF
Total CDF (BWRs)

NEA/CSNI/R(2017)5
38
4.3.3.4. Importance measures
As defined in the Glossary of Risk-Related Terms in Support of Risk-Informed Decision Making [9]:
“In a PRA, importance measures are used to determine the contribution of the basic events to a number of risk metrics, such as core damage frequency. By using importance measures, the PRA analyst can determine the risk-significance of structures, systems, and components (SSCs) or human actions. Different importance measures provide different perspectives. For example, importance measures can evaluate the risk-reduction potential of improving SSC performance or human action, or they can show the significance of an SSC or human failure event for maintaining the current risk level.”
For this survey, values of risk achievement worth (RAW)2 and Fussell-Vesely (FV)3 importance measures were requested. Lower RAW values may indicate specific components where DiD measures are well established through diversity and/or redundancy. Higher FV importance values indicate components that contribute more to overall risk and therefore may be associated with components that appear in a significant number of cut sets or have a relatively low reliability. Conversely, lower FV importance values may be associated with components that do not appear in a significant number of cut sets, have very high reliability or for which other redundancies may exist. The countries that provided importance measures were limited.
Common importance measures (among different plants) with highest RAW values are presented in Table 5.
Table 5: Importance measures
RAW FV Plant Type
CCF of batteries
6.790 5.37 E-04 PWR 12.200 4.26 E-04 PWR
232.000 2.78 E-02 BWR 13.100 6.58 E-04 BWR 34.900 PWR 438 2.36 E-02 PWR
2.970 1.44 E-03 PWR 5.030 9.50 E-04 PWR
Failure of relief valves 34.000 PWR
EDGs CCF
417 2.60 E-01 PWR 280 4.04 E-01 VVER
5.840 PWR 68.4 2.45 E-03 PWR 3.73 9.33 E-04 PWR 14.6 9.98 E-03 PWR 291 4.06 E-02 PWR
RCIC 1.050 5.07 E-02 BWR
AFW pumps 6.120 1.95 E-04 PWR
5 3.71 E-04 PWR
2. RAW relates to the increase in risk if a plant feature (e.g. system or component) was assumed to be
failed or was assumed to be always unavailable. This increase is expressed as a multiplier by which risk (e.g. CDF) would increase if the component of interest was failed or unavailable. The possible range for RAW is 1 to infinity.
3. For a specified basic event, Fussell-Vesely importance is the relative contribution of a basic event to the calculated risk. The range for the Fussell-Vesely importance is 0 to 1.0.

NEA/CSNI/R(2017)5
39
A few key insights from the above data include:
• The relative high reliability of batteries generally results in a lower FV importance, but the lack of redundancy for these components results in very high values for RAW.
• Decay heat removal systems such as reactor core isolation cooling and auxiliary feed water have a relatively low to moderate FV importance, but can have a relatively high RAW value due to limited redundancy for this function.
• The EDGs had a somewhat variable importance, but the risk contribution is dominated by common cause failure. The RAW values reported for the EDGs had significant variability, but for some plants the loss of EDGs could be significant risk contributor.
4.3.4. LOOP accident sequence insights
Based on the survey responses, some generalisations can be made about the general progression of loss of off-site power accident scenarios. This section presents typical results for PWR and BWR designs.
4.3.4.1. BWR LOOP accident sequences
Based on the survey results for a BWR plant, the LOOP accident sequences leading to CDF generally would involve combination of failures of:
- reactor protection system;
- emergency power;
- safety relief valves;
- reactor depressurisation;
- low pressure coolant injection;
- recovery of off-site power;
- shutdown cooling;
- late injection.
General examples of LOOP accident sequences for a BWR that could lead to core damage include:
- A LOOP event followed by failure of emergency AC power, failure to recover off-site power or a diesel generator prior to battery depletion, and failure of human actions to extend AC independent decay heat removal beyond battery depletion time.
- A LOOP event followed by failure of emergency power, failure of AC independent decay heat removal, and failure to recover off-site power or a diesel generator within one hour.
4.3.4.2. PWR LOOP accident sequences
Based on the survey results for a PWR plant, the LOOP accident sequences leading to CDF would involve combination of failures of:
- reactor protection system;
- emergency power;
- auxiliary feed water;
- loss of reactor coolant pump seal cooling;
- high pressure injection;

NEA/CSNI/R(2017)5
40
- recovery of off-site power;
- shutdown cooling;
- containment cooling.
An example of a specific accident sequences for a PWR that could lead to core damage include:
1. A LOOP event followed by failure of emergency AC power, failure of AC independent decay heat removal, and failure to recover off-site power or a diesel generator within 1 hour.
2. A LOOP event followed by failure of emergency AC power, failure of reactor coolant pump seals resulting in a small loss of coolant accident, and failure to recover off-site power or a diesel generator in four hours.
NEA/CSNI/R(2017)5
41
5. SAFETY IMPROVEMENTS
The importance of loss of electrical sources to nuclear power plant risk was identified in all the questionnaire answers. In order to reduce this contribution, a large number of safety improvements were identified, defined and implemented in the different countries, before and after the Fukushima Daiichi accident. In fact, the LOOP issue was already recognised and the Fukushima Daiichi accident confirmed the importance of the issue, with a particular focus on the external hazards initiators.
This chapter presents a summary of the safety improvements reported in the responses. Although it is certainly not exhaustive, the questionnaire responses give an overview of safety improvements implemented (or decided) for coping with a loss of electrical power1.
It should be noted that PSA results should be used in a risk-informed, integrated decision-making framework, where quantitative risk results are combined with other available information (such as deterministic insights, consideration of safety margins, defence in depth).
5.1. Generalities
The safety improvements described in the survey responses are associated with different levels of risk prevention and limitation:
• Reduction of LOOP frequency;
• Reduction of SBO frequency in case of LOOP;
• Improvement of recovery of sources;
• Accident management.
The safety modifications include hardware, procedural and organisational improvements. The suggested hardware modifications include:
• Improvement of existing equipment, e.g. better reliability;
• Better use of existing equipment, e.g. introduction of supplementary connections;
• Addition of supplementary equipment:
- Fixed for each unit;
- Fixed for a site with possible connections to different units;
- Mobile equipment located on the site or located outside.
Considering the functions to be addressed by safety improvements, the most frequent focus is to improve the availability of an electrical power source, either by reducing the LOOP or SBO frequency or by providing a means of recovery. Other improvements relate to safety functions impacted by a loss of electrical sources, (e.g. water injection in the primary or secondary circuit, integrity of primary pumps seals, residual heat removal, and I&C). More
1. Although general power disturbances and secondary grid effects are also very important, they are
usually not modelled in detail in PSA, so there is a focus on loss of electrical power for which PSA insights are better underlined.

NEA/CSNI/R(2017)5
42
precise examples are given below corresponding to these different categories of safety improvements.
5.2. Hardware
5.2.1. Off-site power supply
Some improvements concerning the electrical sources external to the plant were mentioned in the questionnaire responses:
• Czech Republic (Temelin): power supply recovery from Lipno dam water station.
• Finland: modifications completed in the transformer yard for better protection against fire.
• Hungary: a modification ensures black-start capability for an off-site gas turbine at a remote location.
• Japan: following the Fukushima NPP accidents, utilities in Japan are preparing various alternate measures against SBO, earthquakes and tsunami. With regard to the countermeasures to LOOP, electric equipment mounted on vehicles were staged at each site as interim actions, other type of electric generators such as gas-turbine generators will be placed in the future.
• Romania: For the long-term recovery phase, efforts from the “Transelectrica” National Power-Transport Company will be combined with Societatea Nationala Nuclearelectrica (SNN) efforts in order to restore off-site power supply.
• Chinese Taipei: The small diesel generators designed to provide power to the gas-turbine system are now planned to connect to unit essential 4.16 kV bus.
5.2.2. Diesel generators
The most frequent improvements concerns diesel generators. Some countries present improvements of diesel generators themselves or of their support systems:
• An example of diesel reliability improvement is given by the USA.
• An example of improvement of the diesel fuel transfer is given by Finland with a container able to make fuel transfer between the tanks on-site easier and faster.
• Another example of diesel improvement (also from Finland) is the diversification of the diesel generators cooling system: an alternative, automatically activated air based cooling system will be added to the seawater based cooling system to cope with the loss of sea water situations.
• In France for the EPR project, the PSA highlighted a problem with the starting of the SBO diesels: in some cases of non-simultaneous failure of the main diesels, the starting of the SBO diesels could be prevented leading to batteries depletion, and a modification of the electrical supply of the batteries was decided.
The most frequent improvements are the addition of more diesel generators (which could be fixed on each unit, fixed for a site, mobile on a site or mobile out of the site):
• Belgium (Tihange): Three fixed diesel generators of 6 kV were installed outside of flooding area. A connection will be installed in order to allow these diesels to electrically feed the safety system required in case of an ELAP (extended loss of AC power) scenario.
• Chinese Taipei: The addition of the swing DG for each operating plant provides reliable AC power after loss of off-site power. The estimated risk reduction on CDF is around 30% for BWR-4 plant.

NEA/CSNI/R(2017)5
43
• Czech Republic (Temelin): There has been two remote SBO DGs newly introduced into the design at the Temelin plant (one for each unit). These DGs are designed to provide power in special emergency cases as for plant SBO conditions. Each of the two DG can be manually connected to any of the safety grade buses at both Units of the plant.
• Finland: One extra diesel generator will be implemented for the Finnish BWRs.
• France (EPR project): At the very beginning of the design, only four diesel generators were planned. The preliminary design PSA indicated that the CDF related to the LOOP initiating event was highly dominant. Consequently a design modification was to add two supplementary diesel generators (so-called “SBO diesels”) completely diversified from the four main diesels. The diversification of the diesel generators is a key point, since a CCF between the six diesels would lead to a dominant contribution.
• Hungary: Capabilities are provided to connect any operable diesel generator in any other unit to the 6 kV safety bus bars of the accident plant unit. Additionally, the installation of “Accident Diesel Generators” provides a means for an additional power supply and helps to ensure important safety functions can be maintained. This assists in preventing severe accidents and/or managing an accident in the long term.
• Romania: Two mobile diesel generators 2 x 1.2 MW (to cover entirely the emergency power supply (EPS) loads) have been procured and tested. In order to minimise the time for connecting the mobile diesel generators to the critical loads, the licensee has installed special connection panels.
• Slovenia: The installation of a new, third EDG at Krško NPP with minimisation of the CCF potential with current EDG’s.
5.2.3. Batteries
Generally the PSA considers the depletion time of the batteries as a limit for electrical power recovery, after which core melt is unavoidable. Safety improvements reported for lengthening the depletion time include:
• a longer battery depletion time with load shedding (Chinese Taipei, France, Switzerland);
• the addition of portable means for charging the batteries or to substitute the function of batteries (Czech Republic, Finland, Switzerland);
• additional means for back fitting the I&C (portable diesels in Czech Republic, LLS system (small additional turbo generator) in France).
5.2.4. Other functions
Several countries indicate the addition of means especially for the protection of primary pumps seals and for primary water injection in case of failure of the safety bus bars.
These means could be:
• additional devices as a back-up of the RCP seals cooling by the LLS system (additional small steam driven turbo generator supplying a small injection pump) in France, or alternate sea water pumps in Japan;
• connection with non-safety systems (non-safety bus bars in Hungary and France, fire system in Czech Republic and Japan), and
• connection with other units (Czech Republic).
It is mentioned in the French answer that the risk benefit is significant. The problem of a CCF of the safety bus bars was identified by operating experience, then the safety importance was highlighted by the PSA and led to the safety modification.
NEA/CSNI/R(2017)5
44
Other safety improvements relate to additional means for severe accidents management, for example filtered venting system (Canada, Slovenia) and autocatalytic hydrogen recombiners (Canada).
5.2.5. More global safety improvements
In some countries, a global safety improvement (for coping with LOOP and LUHS and/or external hazards) includes several means relating to different functions (e.g. injection of water in the steam generators, in the primary circuit, in the spent fuel pool, back-up of instrumentation). Examples of global improvements are given by Belgium, Mexico, Romania, Sweden and Switzerland. These large safety improvements include several mobile means (following the FLEX2 approach as mentioned by Belgium and the USA).
5.3. Procedures and organisation
Several improvements concerning procedures and accident management are reported. Some improvements relate specifically to SBO situations for preventing a severe accident, for example:
• Czech Republic: A new procedure for monitoring of important parameters in control room during extended SBO;
• Romania: Two new abnormal plant operating procedures (APOPs) for responding to SBO and abnormal spent fuel bays cooling conditions;
• Japan: In addition to the hardware modifications, software modifications (i.e. amendment of operation manual and training) have also been implemented.
More frequently the improvements relate to procedures and strategies for the management of severe accidents, and several severe accident management guideline (SAMG) measures were implemented:
• Canada: PLGS (Point Lepreau Generating Station) have been implementing Severe Accident Management Guidelines (SAMG) over the past few years to more systematically address response to beyond design basis events (events such as natural events, plant failures and security events more severe than the plant was originally designed to withstand).
• Chinese Taipei: in response to the lesson learnt from Fukushima accident, each plant has developed a specific procedure called ultimate response guideline to maintain the integrity of nuclear fuel by providing long-term alternate core cooling during severe accident.
• Finland: licensees are expected to consider all plant stages in the SAM procedures as well as any implications on them possibly arising from simultaneous multi-unit accidents.
• Hungary: severe accident management measures and guidelines have been implemented at the plant to reduce the likelihood and magnitude of consequences from potential severe accidents. These measures, among others, included provision of dedicated mobile severe accident diesel generators to ensure power supply to systems and equipment important to accident management.
• Slovakia: SAM implemented via depressurisation of RCS, external cooling of RPV, vacuum breaker, SAM DG, recombiners, external water sources for injection to RCS, spraying of containment and injection into the spent fuel pool.
The impact on the PSA results is often considered as important and a precise estimation is given by Romania: the frequency of a large early release (LERF) for full power operation is
2. FLEX: Diverse and Flexible Coping Strategies [10]

NEA/CSNI/R(2017)5
45
5.82 10-7/year; the frequency was 1.47 10-6/year before implementation of the safety measures of SAM.
5.4. Conclusions
Although PSA is not the only basis for decision making, the questionnaire responses indicate that a large number of safety improvements (often important) are related to PSA for loss of electrical sources.
The main safety improvements relate directly to electrical sources (addition of complementary equipment), but several modifications relate also to functions impacted by LOOP. This underscores the capability of PSA to identify not only the initiating event but also the functional consequences and the relative contributions to plant risk.
It can be noted that while many improvements concern the power sources (especially all the diesel generators improvements or addition), there are fewer improvements concerning the electrical distribution (e.g. the bus bars).
Many modifications include mobile equipment or other equipment that require operator action. In case of station blackout (SBO), the time available is a very important factor and the safety benefit of a modification is strongly related to the time window for operator action. For example, a mobile device may not be able to be deployed if the time window is too short. As a result, precision in the risk benefit estimation is related to the ability of the PSA to correctly treat the duration of accident sequences.
Several modifications include equipment shared by several units or interconnections between units: the risk benefit estimation needs to consider multi-unit aspects since the multi-unit effects could be positive (mutual back-up) as well as negative (shared equipment needed by another unit in case of common initiating event).
Although many improvements appear as “initiator neutral”, in some cases equipment is protected against specific external hazards (e.g. earthquake, flooding, high winds). A technically adequate PSA analysis of LOOP makes it possible to identify many safety improvements for coping with external hazards.
NEA/CSNI/R(2017)5
46
6. PSA CHALLENGES AND UNRESOLVED ISSUES
6.1. Introduction
This section collects a summary of challenges presented in the preceding sections and included in the questionnaire responses. A brief discussion regarding the possibilities to address them in future PSA studies is also included. The following possible issues related to LOOP modelling in PSA were specified in the questionnaire to initiate the discussion:
• completeness of accident sequence development for LOOP scenarios;
• specific issues of human reliability analysis related to LOOP scenarios;
• estimation of LOOP frequencies;
• common cause failures and dependencies related to LOOP modelling;
• the role of recovery actions in plant response to the LOOP event and the need to model them;
• the subject and utilisation of supporting calculations for modelling of LOOP scenarios;
• determination of the proper mission times and sequence duration in modelling of accident sequence development for LOOP scenarios;
• adverse effects of grid disturbances on on-site plant power systems;
• analysis of LOOP scenarios for multi-unit plant site;
• consideration of the role of external hazards as potential initiators of LOOP scenarios;
• selection of assumptions/modelling.
Among 23 responders from 18 countries who completed the questionnaire 13 responders presented some insights with respect to the possible challenges/issues in the analysis of LOOP scenarios in PSA. The most frequently discussed issues were LOOP related CCFs, proper definition of mission time and multi-unit aspects of LOOP scenarios.
It has to be noted that some of the identified issues need to be considered in the broader PSA context than just for the purpose of LOOP modelling, since they are applicable for other initiating events as well. So they should be resolved consistently and accordingly for all IEs, not just for LOOP.
6.2. PSA Challenges identified
Seven important challenges for LOOP modelling in PSA were identified based on the responses on the questionnaire. They are:
1. LOOP frequency data analysis related to CCF
2. Timing of accident sequence development in LOOP event trees
3. Determination of the proper mission time for LOOP IE modelling
4. Determination of the specific off-site grid recovery times and probabilities

NEA/CSNI/R(2017)5
47
5. Credibility of RCP seal integrity
6. Interaction between units in the multi-unit site following LOOP
7. Lack of data to quantify CCFs of bus bars
Challenge 1: LOOP frequency data analysis related to CCF
More attention should be paid to CCF events when frequency of grid failure is updated based on the operating experience.
Most nuclear power plants have more than one external grid connection to ensure high reliability of external grid. These lines cannot be always treated as independent. It is therefore necessary to identify and understand the root cause of events from operating experience, especially to determine whether they have a potential for common cause failures and how likely it is (for example, induced by external hazards).
Challenge 2: Timing of accident sequence development in LOOP event trees
Several time windows can be considered for the more realistic modelling of recovery from blackout following LOOP. Example key factors for deciding the time windows are the battery depletion time, time to loss of RCP seal integrity, and increase of room temperature.
The crucial issue is identification of all necessary conditions for the recovery from blackout (availability of plant measurements, availability of lights, sufficient access to the equipment), which is more or less plant specific.
Challenge 3: Determination of the proper sequence durations for LOOP IE modelling (24 hrs, 72 hrs, etc.)
This issue is actually the question on how to define/characterise the “Safe and stable end state” for the success sequences. The definition of the “Safe end state” directly implies the determination of the proper sequence duration to be modelled and the associated mission times. This means that consensus on the principles for how to characterise the safe states is crucial. It is one of the more general issues which are applicable not only for LOOP, but also for other initiating events.
Among others, the following items should be addressed:
• The point when the accident is terminated (e.g. establishment of the closed cooling circuit, a switch to the standard power supply) and how such end states should be defined (e.g. what the “standard” power supply means), then the mission time can be the time to reach such an end state.
• What is the mission time (e.g. 24 hrs, 72 hrs) for open cooling circuit (e.g. long-term cooling using secondary circuit bleed & feed / steam dump to atmosphere) even when a large volume of water is available.
Challenge 4: Determination of the specific external grid recovery times and probabilities
The probability of the external grid recovery failure is typically modelled in PSAs. Development of the detailed reliability models for the external grid in the region can be helpful to obtain realistic recovery times and the associated recovery failure probabilities. This model can be also used to update the loss-of-grid frequencies in case of changes in the grid, or eventually in case of changes in on-site power supply system. Data from the grid operator could also be very helpful.

NEA/CSNI/R(2017)5
48
Challenge 5: Credibility of reactor circulating pump (RCP) seal integrity
The review of RCP seal qualification for black-out conditions should be required as an input to PSA modelling to avoid non-realistic assumptions.
Challenge 6: Interaction between units in a multi-unit site following LOOP
The examples (not exhaustive) of the issues for a multi-unit site are:
• Possibility of the power supply support from the other units located at the same site (cross connection of power supply);
• Proper consideration of availability of equipment from the other units if they can be used to support the recovery from LOOP in the unit analysed;
• Definition of proper success criteria for the systems shared between units (e.g. some equipment needs to be reserved to provide redundancy for fulfilling safety functions in the other units);
• Success criteria for the common water storage tanks (some amount of water needs to be kept available to support the fulfilment of safety functions in the other units).
Interaction between units is an example of a more general issue applicable not only for LOOP, but also to other IEs. A possible solution can be the development of multi-unit PSAs (i.e. PSA models of all units would be modelled in a single integrated PSA model). The models for each unit can be therefore cross-connected via models of equipment which is shared for more units. It would allow taking into an account both the support from the other units and the impact of equipment unavailability (including unavailability caused by the common IEs, such as LOOP) in the other units. More generally, adverse effects of an accident occurring in one unit on the performance of the other units can be correctly addressed in such an integrated model.
Challenge 7: Lack of data to quantify CCFs of bus bars
The collection of the data is necessary to determine whether and to what extent plant power supply bus bars are susceptible to CCF (due to bus bar failures). CCFs are generally very rare events so international co-operation is necessary to obtain the sufficiently long cumulative duration of plant operational history. The role of power supply bus bars in LOOP scenarios is very important so that the quantification of loss of their function can be as realistic as possible.
NEA/CSNI/R(2017)5
49
7. CONCLUSIONS AND RECOMMENDATIONS
The LOOP initiating event is treated by all the PSAs covered by the survey. There is often a significant contribution to core damage risk identified, and for this reason it could lead to various safety and PSA improvements. The insights provided by this survey are in several cases not specific to the LOOP initiating event. It applies more generally to many aspects of PSA and safety (e.g. long-term scenarios, or more generally time dependent scenarios and multi-unit/site-level PSA).
An interesting point identified by the survey is that it provides not only PSA methodological insights but also the practical effect of these issues on PSA results and on safety improvements.
Based on the analysis of questionnaire responses, the following insights were identified:
1. With regard to initiating events, the following conclusions can be drawn from PSA information in the questionnaire responses:
• In most cases, various categories of power supply faults were analysed, as opposed to analysing only a single category of failures in electric power supply sources. For example, some responders identified long- or short-term loss of off-site power (LOOP) categories rather than combining all LOOP events into a single category. Distinction between power supply failures is justified if plant responses (including system and operator responses and the associated success criteria) are different for the various categories of failures (requiring the delineation of separate accident sequence models in the PSA). In addition to total or partial loss of off-site power, other types of power supply failures such as loss of vital AC or DC buses, loss of transformers, etc. were also analysed.
• The duration of a power supply fault influences accident mitigation features and the corresponding accident sequence frequencies. Accordingly, the duration of a LOOP was taken into consideration in most analyses.
• External hazards as LOOP initiators were considered in most of the analyses addressed in the survey. It appears to be a common practice to model the effects of external hazards on the power supply system as separate initiating events unless LOOP is the only adverse consequence of the hazard.
• The frequency of total or partial losses of off-site power typically falls into the 10-3/year to 10-1/year range in terms of order of magnitude, although direct comparison is not meaningful due to the differences in plant design, grid layout/connections and in the definition of power failure events (including failure duration).
• Plant, site, region or country-specific data was used to estimate initiating event frequencies in most cases. There are dedicated data collection and analysis programmes in place in a number of member countries to support the estimation.
2. The following conclusions can be drawn from PSA information on modelling and data given in the questionnaire responses:
• Power recovery is important for both the initiating event definition and event sequence development. Recovery was modelled in the majority of the 38 PSAs covered by the survey. Multiple recovery times were usually taken into account.

NEA/CSNI/R(2017)5
50
• Various kinds of recovery models were applied depending on the initiating events, the availability of operational experience, and the analysis approach used.
• Usually, the failure to start and the failure to continue running failure modes of active alternate power supply equipment (mostly diesel generators but also including other power sources, as appropriate) were considered in the accident sequence models.
• Some analyses included a detailed fault tree modelling of diesel generators and other sources of electric power supply.
• Failures of bus bars and batteries are typically modelled.
• Common cause failures of active power supply equipment (mostly diesel generators) were taken into consideration.
• The traditional mission time of 24 hours is predominantly used in the accident sequence models for power supply faults. Some responses point out that 24 hours of mission time is unnecessary for short-term loss of power events (typically of a few hours duration). On the other hand, the automatic use of 24 hours may lead to underestimation of risk from long-term scenarios, especially if LOOP and additional power supply failures are induced by external events.
• Due to operational stability problems, less than half of the analyses gave credit to plant operation in-house load or island mode following a LOOP event, although most plants have the capability to continue power operation when separated from the electrical grid.
3. The following main conclusions can be drawn concerning PSA results:
• The initiating events considered are site specific and grouped differently. However a global LOOP frequency is in the range of some 10-1/year to 10-3/year for all the responding countries.
• The core damage frequency (CDF) resulting from LOOP events, as provided in the survey, have a wide variability (10-4/year – 10-6/year), with no particular tendency related to the design.
• Two general observations can be made (further work would be required to determine the causes for the differences):
- The BWR plants included in this survey generally have a lower CDF contribution from LOOP than the PWR plants.
- The relative CDF contribution from LOOP for the PWR plants included in this survey tends to have a wider variability than the BWR plants.
• Concerning the importance measures of SSCs, a few key insights from the survey include:
- The relative high reliability of batteries generally results in a lower FV importance, but the lack of redundancy for these components results in very high values for RAW.
- Decay heat removal systems such as reactor core isolation cooling and auxiliary feed water have a relatively low to moderate FV importance, but can have a relatively high RAW value due to limited redundancy for this function.
- The EDGs had a somewhat variable importance, but the risk contribution is dominated by common cause failure. The RAW values reported for the EDGs had significant variability, but for some plants the loss of EDGs could be significant risk contributor.
• Based on the survey results for a BWR plant, the LOOP accident sequences leading to CDF generally would involve combination of failures of:

NEA/CSNI/R(2017)5
51
- reactor protection system;
- emergency power;
- safety relief valves;
- reactor depressurisation;
- low pressure coolant injection;
- recovery of off-site power;
- shutdown cooling;
- late injection.
General examples of LOOP accident sequences for a BWR that could lead to core damage include:
- A LOOP event followed by failure of emergency AC power, failure to recover off-site power or a diesel generator prior to battery depletion, and failure of human actions to extend AC independent decay heat removal beyond battery depletion time.
- A LOOP event followed by failure of emergency power, failure of AC independent decay heat removal, and failure to recover off-site power or a diesel generator within one hour.
• Based on the survey results for a PWR plant, the LOOP accident sequences leading to CDF generally involve combination of failures of:
- reactor protection system;
- emergency power;
- auxiliary feed water;
- loss of reactor coolant pump seal cooling;
- high pressure injection;
- recovery of off-site power;
- shutdown cooling;
- containment cooling
Examples of specific accident sequences for a PWR that could lead to core damage include:
- A LOOP event followed by failure of emergency AC power, failure of AC independent decay heat removal, and failure to recover off-site power or a diesel generator within 1 hour.
- A LOOP event followed by failure of emergency AC power, failure of reactor coolant pump seals resulting in a small loss of coolant accident, and failure to recover off-site power or a diesel generator in four hours.
The following main conclusions can be drawn concerning safety improvements:
• Although PSA is not the only basis for decision making, the questionnaire answers indicate that a large number of safety improvements are related to the mitigation of losses of electrical power sources.
• The main safety improvements relate directly to electrical power sources (addition of complementary equipment), but several modifications relate also to mitigation functions impacted by LOOP events. A strength of PSA is the identifying not only the
NEA/CSNI/R(2017)5
52
initiating event, but also the functional consequences and the relative contribution from subsequent failures.
• It can be noted that while many improvements are related to electrical power sources (especially diesel generator improvements or addition of electrical power sources), there are less improvements to the electrical distribution system (e.g. the bus bars).
• Many modifications include mobile equipment or other equipment that require operator action. In case of station blackout (SBO), the time available is a very important factor and the safety benefit of a modification is strongly related to the time window for operator action. For example, a mobile device may not be able to be deployed if the time window is too short. As a result, precision in the risk benefit estimation is related to the ability of the PSA to correctly treat the duration of accident sequences.
• The treatment of human interventions requires that human reliability analysis (HRA) model the particular conditions of a LOOP or a SBO.
• Several modifications include equipment shared by several units or interconnections between units. The risk benefit estimation in these cases requires a multi-unit assessment since the multi-unit effect could be either positive (mutual back-up) as well as negative (shared equipment needed by another unit in case of common initiating event).
• Although many improvements appear as “initiator neutral,” several improvements are protected against specific external hazards (e.g. earthquake, flooding, high winds). A technically adequate PSA analysis of LOOP makes it possible to identify specific strategies for coping with external hazards.
Concerning the conclusions for LOOP modelling in PSA, seven important challenges were identified based on the responses to the questionnaire:
• LOOP frequency data analysis related to common cause failure (CCF);
• timing of accident sequence development in LOOP event trees;
• determination of the proper mission time for LOOP initiating event (IE) modelling;
• determination of the specific off-site grid recovery times and probabilities;
• credibility of reactor coolant pump (RCP) seal integrity;
• interaction between units in the multi-unit site following LOOP;
lLack of data to quantify CCFs of bus bars
General conclusions:
This survey shows that challenges related to the plant response to LOOP (i.e. plant recovery from LOOP or from the consequent blackout) can be key contributors in PSA so particular attention needs to be paid to them. Also, the insights related to plant response are more generic and consequently of more interest for exchange of knowledge and exchange of good practices than initiating events frequencies which tend to be very site specific. If using a defence-in-depth (DiD) terminology defined by IAEA, it could be said that the PSA insights for LOOP are more interesting at the level 3 or 4 of DiD than at level 1 or 2.
The following recommendations for improvement of PSA modelling are proposed based on the survey:
• Reliability data should be collected for plant power supply components, including repair or recovery times and CCF events. The criteria (conditions) for repair/recovery success need to be properly defined.

NEA/CSNI/R(2017)5
53
• The data required to properly characterise the LOOP frequencies and probabilities of external grid recovery failures should be determined and collected. It should include grid specific reliability models and also consider repair or recovery times and CCF events.
• The safe end state for accident sequences should be justified and used to determine the proper mission time (i.e. time to reach safe state).
• The interactions between units in multi-unit site should be properly modelled, including the adequate modelling of the following items:
o The adverse impact from unavailabilities/initiating events occurring in the other units.
o The impact of the common initiating events (including hazards) affecting more than one unit.
o The support from the other units (e.g. utilisation of equipment, cross connections, etc. from the other units).
• The timing of an accident’s development should be considered, including the timing of important breakpoints (loss of RCP seal integrity, battery depletion, etc.).
The survey indicates the importance of providing means for recovery, including means for repair, and providing back-up equipment (fixed or mobile). It also highlights the practical problems relating to the use of back-up equipment (human capacity, accessibility, strategy and decision making).
These insights can be used within several NEA activities (CNRA, CSNI) as well as in other international or national works relating to PSA or more generally to safety of nuclear power plants. These insights will be especially useful for the CSNI/WGELEC and CSNI/WGRISK. For example, the WGRISK will use these insights in its programme of work: it can be noted that the study of multi-units interactions is already in progress with the Task WGRISK(2015)2 “Status of Site-Level PSA (including Multi-unit PSA) developments”, the HRA problem in extreme conditions is addressed by the Task WGRISK(2015)1 “HRA in External Events PSA – Survey of methods and practices” and recent PSA and safety improvements (especially post-Fukushima actions) will be reviewed in the Task WGRISK(2015)4 “Use and Development of Probabilistic Safety Assessment in Member and Non-member Countries”.

NEA/CSNI/R(2017)5
54
REFERENCES
[1] International Atomic Energy Agency (IAEA), Design of Electrical Power Systems for Nuclear Power Plants, Specific safety Guide, IAEA Safety Standards Series No. SSG-34, STI/PUB/1673 (ISBN:978-92-0-109314-1, Vienna, Austria, 2016, http://www-pub.iaea.org/MTCD/Publications/PDF/Pub1673web-53477409.pdf.
[2] United States Nuclear Regulatory Commission (NRC), Reevaluation of Station Blackout Risk at Nuclear Power Plants Analysis of Loss of Offsite Power Events: 1986-2004, NUREG-6890, Washington, DC, USA, 2005, http://www.nrc.gov/reading-rm/doc-collections/nuregs/contract/cr6890/.
[3] Electric Power Research Institute (EPRI), Treatment of the Loss of Offsite Power (LOOP) in Probabilistic Risk Assessment: Technical Basis and Guideline; draft report C101060008-7289, October 2007.
[4] United States Nuclear Regulatory Commission (NRC), NRC Web: Glossary, http://www.nrc.gov/reading-rm/basic-ref/glossary.html.
[5] International Atomic Energy Agency (IAEA), IAEA Safety Glossary, Terminology Used in Nuclear Safety and Radiation Protection, 2007 Edition, Vienna, Austria, 2007, http://www-pub.iaea.org/mtcd/publications/pdf/pub1290_web.pdf.
[6] International Atomic Energy Agency (IAEA), INSAG-10, Defence-in-Depth in Nuclear Safety, A report of the International Nuclear Safety Advisory Group, Vienna, Austria, June 1996, http://www-pub.iaea.org/MTCD/publications/PDF/Pub1013e_web.pdf.
[7] Hellström, P., DID-PSA Development of a Framework for the Evaluation of Defence-in-Depth with PSA, Research 2015-04, Swedish Radiation Safety Authority (SSM), ISSN 2000:0456, January 2015, https://stralsakerhetsmyndigheten.se/Global/Publikationer/Rapport/Sakerhet-vid-karnkraftverken/2015/SSM-Rapport-2015-04.pdf.
[8] Eidgenössisches Nuklearsicherheitsinspektorat ENSI (Swiss Federal Nuclear Safety Inspectorate): Probabilistic Safety Analysis (PSA): Quality and Scope, Guideline for Swiss Nuclear Installations, ENSI-A05/e, http://static.ensi.ch/1391415729/ensi-a05_e.pdf.
[9] United States Nuclear Regulatory Commission (NRC), Glossary of Risk-Related Terms in Support of Risk-Informed Decision Making, NUREG-2122, Washington, DC, USA, November 2013, http://www.nrc.gov/reading-rm/doc-collections/nuregs/staff/sr2122/.
[10] Nuclear Energy Institute (NEI): Diverse and Flexible Coping Strategies (FLEX) Implementation Guide, NEI 12-06, Washington, DC, USA, August 2012.

NEA/CSNI/R(2017)5
55
APPENDIX 1:
WGRISK (2013)1
Project/Activity title Probabilistic Safety Assessment insights relating to the loss of electrical sources.
Objective
The objective of the task is an overview of the insights provided by Probabilistic Safety
Assessment (PSA) relating to a loss of electrical sources, in order to illustrate PSA
capabilities in the analysis of the robustness of safety functions.
While in the analysis of the robustness of safety functions generally the emphasis is on the
causes of potential failures of the function, especially when using operating experience, PSA
is a particularly interesting tool for providing insights related to the potential consequences
(Core Damage (CD), Large Early Releases (LERF)….) of the loss of a safety function and
relating to the provisions (defences) aiming to avoid consequences of the loss of the safety
function (i.e. prevention and/or mitigation of CD). Use of PSA results, and especially
conditional probabilities (of CD or of LERF after the occurrence of an initiating event…),
could provide a measure of defence in depth in case of loss of a safety function.
The task intends to illustrate the PSA capabilities with an outstanding practical example.
Two types of insights will be gained:
- Insights for plant safety related to results and applications of risk calculations: overall
risk as well as relative results relating to dominant contributions, potentially weak
points in the defences, balance between CD prevention and mitigation, comparison
between internal initiating events and hazards, key sources of uncertainty (where
available), safety benefits brought by modifications already implemented or planned
(including possible post-Fukushima modifications).
- Insights on PSA methodology: identification of good practices, potential gaps,
differences in the methodologies used or developed.
Scope
The principle is to use existing PSAs, relating to operating or future plants, in order to assess
the risk conditional on the failure of electrical sources. The scope will cover a wide
definition of loss of electrical sources, including for example common cause failure of
switchboards, loss of battery-backed supplies, any type of electrical disturbance and
potential secondary effects, etc.
The scope will include results of PSA relating to the loss of electrical sources, including
PSA level 1, level 2 and level 3, internal and external initiating events, full power and LPSD.
When relevant, differences between internal and external initiators; also, if available, the
effect of post-Fukushima measures will be identified. Differences due to plant design and to
PSA methods and assumptions will also be noted.
Two aspects will be considered:
- Results and applications: overall results, conditional probabilities, relative
contributions, importance measures, sensitivity studies and as far as possible real
examples of safety improvements with their related PSA impact.
- PSA methods and assumptions: initiating events considered, LOOP duration, mission
NEA/CSNI/R(2017)5
56
times, treatment of recoveries, of human intervention, of dependencies, of common
cause failures, etc…
Justification
The loss of electrical sources is generally an important contributor to the risk related to
nuclear plants. In particular the External Hazards initiating events lead generally to a loss of
electrical sources. This importance was underscored by the Fukushima accident.
A strength of PSA is that it provides insights not only into the causes of the event but also
into the potential consequences and the provisions aiming to limit these consequences. PSA
could provide a measure of defence in depth in case of loss of a safety function.
These insights can be used to improve the defences, and especially to protect them against
dependencies among the defences and between these and the initiating event. In particular
the defences can be protected against external hazards that lead to safety function failures,
and PSA could provide a measure of post-Fukushima improvements (need and adequacy for
modification to the plant and its procedures including severe accident management).
The insights relating to the PSA methods will be useful for future PSA developments, in
particular PSA for external hazards.
Expected results and deliverables
The expected results are a report presenting the insights from PSA applied to the loss of
electrical sources, and identification of good practices for safety improvements and for PSA
future developments.
Users
The users will be the regulators, designers and operators.
PSA practitioners are also expected to benefit from the insights identified relating to PSA
methodology.
Relation to other projects The conclusions will be complementary to the conclusions of the ROBELSYS task.
Safety significance/ priority (see priority
criteria in Section IV)
The activity corresponds to all the CSNI criteria, especially:
- Criterion 1: Issue of high safety significance and of importance to nuclear regulators
- Criterion 2: Better accomplished by international group
- Criterion 3: Likely to bring results in a reasonable time frame
- Criterion 4: Maintain and preserve strategic safety competence
Technical Goal(s) covered
The task addresses a significant safety issue (2a)
Promotes PSA applications in the operation of nuclear installations and risk-informed
approaches (3g).
Knowledge Management and Transfer
covered Knowledge management and transfer of PSA development and application
Milestones
(deliverables vs. time)
Core group to prepare a questionnaire (J0+6 months).
Questionnaire sent to WGRISK members.
Responses collected (J0+12 months) and analysed (J0+18 months).
Submission of the report to CSNI (J0+24 months).
Lead organisation(s)
and co-ordination
IRSN (France)
Participants (individuals and
organisations)
France, Germany, Hungary, Czech Republic, Canada, India, Italy, Sweden, Mexico, Chinese
Taipei.
Resources
Leader: 6 months.
Core group: 2 months each.
Other countries: 15 days each.

NEA/CSNI/R(2017)5
57
Requested action from PRG/CSNI Endorsement requested
PRG recommendation
CSNI disposition
NEA/CSNI/R(2017)5
58
APPENDIX 2:
Questionnaire related to Task WGRISK 2013(1): Probabilistic Safety Assessment insights relating to the loss of electrical sources
Introduction The aim of this task is to collect good examples of PSA insights related to the issue of the loss of electrical sources. While in the analysis of the robustness of safety functions the emphasis is in general on the causes of potential failures of the function, especially when using operating experience, PSA is a particularly interesting tool for providing insights related to the potential consequences (core damage (CD), large early releases (LER), etc…) of the loss of a safety function and relating to the provisions (defences) aiming to avoid consequences of the loss of the safety function (i.e. prevention and/or mitigation of CD). Use of PSA results, and in particular conditional probabilities (of CD or of LER after the occurrence of an initiating event), could provide a measure of defence in depth in case of loss of a safety function. As indicated in the CAPS (Appendix 2), the principle is to use already existing studies (not to develop complementary work). Although many insights have already been derived from the existing PSAs, it seems indeed that finding complementary useful views is still possible, even if not directly related to a given design or to a specific initiating event, but providing input for more complete safety assessments. The conclusions will be complementary to those of the ROBELSYS (Robustness of Electrical Systems of NPPs in Light of the Fukushima Daiichi Accident) task. In order to clarify the scope of the task, it is proposed to focus on the loss of off-site electrical sources (LOOP). However, if other losses of electrical sources (due to internal failures) are relevant for some PSAs, these can be also included in this framework. The first part of the questionnaire relates to general information:
• On the plant and electrical supplies • On the PSA (content and results)
The second part relates to the insights. As presented in the CAPS, the insights can be grouped into two categories:
• Insights with regard to safety (insights FROM PSA) and • Insights with respect to PSA (insights FOR PSA).
The questionnaire is structured according to this classification: 1. General plant and electrical supplies information 2. PSA information and results A general overview of the PSA results (initiating events considered, CDF, LRF, dominant sequences, conditional probabilities and importance measures if available) will provide insights on the general contribution of the loss of electrical sources within PSA making a simplified comparison (similarities and differences with, as far as possible, the reason of differences (a kind of “a posteriori” benchmark) possible. 3. Insights with regards to safety The insights will be represented by a collection of examples related to PSA applications for safety assessment and improvements (already implemented or planned). What is expected especially is the presentation of safety provisions and improvements (design

NEA/CSNI/R(2017)5
59
and/or operation) with the associated risk-related benefit (CDF or LERF), in order to identify if good practices have been sufficiently known and shared internationally. Absolute risk benefit as well as relative results (relative contribution of component failures, human factor, internal and external hazards, full power/LPSD, etc…) will be of interest. 4. Insights with respect to PSA The insights of this category will be provided by means of a collection of examples of good PSA practices and ways for improving PSA, concerning the PSA scope, methods and data in the specific case of LOOP event.
To be noted:
• The questionnaire aims to collect interesting and useful information related to PSA development and application relating to the loss of electrical sources. However if some questions seem too detailed or without direct link to your PSA, please delete them.
• For the countries with a large number of plants and a wide variation of designs for which it is not possible to answer for every plant, it is suggested to select some representative examples of the different designs, in order to have a picture of the main risk insights.
• Five examples of reply are given in Appendix1 for illustrating what is expected.
NEA/CSNI/R(2017)5
60
QUESTIONNAIRE Identification Please identify your organisation: Name: …………………………………………………………………….……. Country: ………………………………………………………………………….. Address: ………………………………………………………………………….. ………………………………………………………………………….. Contact person: ………………………………………………………………………….. Telephone/e-mail: ………………………………………………………………………….. Are you - A Regulatory Body � - A Supporting Organisation to a Regulatory Body � - A Utility � - A Vendor � - A Consultant � - Other � 1. General plant and electrical supplies information
a) General • Plant type: • Electrical power [MWe]:
b) Electrical supplies • Grid connection
- Number of independent feeders into switchyard (No. and types of grid connections)
- Alternate/independent ac grid sources that might be available (e.g. stand-by gas turbines)
• Designed for house turbine operation, island operation (e.g. the main generator can supply house loads without reliance on or connection to the main switchyard)
• Number of EDGs and/or other internal sources (e.g. gas turbines) and capacity • Capacity for cross ties between trains or units • Brief description of non-ac dependent decay heat removal systems (e.g. turbine-driven
auxiliary feed water, motor driven pumps, natural circulation, etc…)
c) Other information if relevant for PSA: • Transmission system operator and operator requirements • Single or twin turbine/s • Other
2. PSA information and results For each PSA considered please provide the following information (an example is given in appendix)
2.1. PSA characteristics
• Context and PSA framework (regulatory position) • PSA date (initial, revisions), • PSA scope:
Level 1 covering plant internal events � internal hazards � external hazards � for POS: full power � low power and shutdown �

NEA/CSNI/R(2017)5
61
Level 2 covering plant internal events � internal hazards � external hazards � for POS: full power � low power and shutdown � Level 3 covering plant internal events � internal hazards � external hazards � for POS: full power � low power and shutdown � Spent fuel pool � internal hazards � external hazards �
2.2. Initiating event The main initiating event to be considered is a loss of external electrical sources (LOOP).
• Is the LOOP event considered as a single initiating event or are there sub-categories (especially according to the root cause of the event and to the recovery conditions)? Please briefly describe sub-categories if used.
- Categories: short loop, long loop, induced loop by other transients? - How is recovery considered? With one or several recovery times and
laws/rules? (e.g. with fixed given mission times for the systems, or with a recovery law /rule versus time)? Do recovery model and recovery probabilities differentiate according to the causes of the initiating event(s)?
- What are the corresponding frequencies? This question covers several points: . The frequency of each sub-category . And, if relevant for your PSA:
o Conditional probability of a consequential LOOP given a plant transient
o Conditional probability of a transfer of plant electrical buses from a “normal” transformer to a “reserve” transformer
o Conditional probability of house-load operation - Is there consideration of variations in frequencies/probabilities for different
seasons/modes of operation (e.g. during refuelling?) - Are there in the PSA other initiating events (other than LOOP) leading to
similar consequences (for example intrinsic failure of electrical bus bars) with a significant contribution?
- Are the LOOP events consequential to external hazards treated specifically or included in a more generic event? What kinds of external hazards were considered among the hazards that can cause LOOP in the PSA? What are the corresponding frequencies?
• What were the data sources and methods used to estimate initiating event frequencies? • Have you performed a detailed grid reliability analysis? Are the following
points explicitly treated or grouped into a more global LOOP event: different grid connections or sources, (e.g. gas turbines)? House / island mode operation (and then for how long time period)? LOOP consequential to a transient?
• When relevant for your PSA, what are the conditional failure probabilities (e.g. given a transient (IE), the conditional probability of loss-of-grid connection or conditional switchover failure probability? Conditional probabilities for failure of house turbine/island mode operation?)
2.3. Main modelling assumptions
• What are the main modelling features of diesel generators, gas turbines/other possible sources, the electrical bus bars:
- types of failure modes and level of details (i.e. if the detail of modelling enables identification of interesting insights, e.g. dependencies)
- CCF, - mission time,
• Was some guidance used for LOOP introduction/modelling in the PSA?

NEA/CSNI/R(2017)5
62
2.4. Results All the following information, if available, is of interest:
• Risk metrics considered (e.g. Core Damage Frequency (CDF), Large Release Frequency (LRF) along with a definition of the associated metric (i.e. how are CDF and/or LRF defined for your PSA…).
• Risk contributions - total frequency for loss of electrical sources and contribution to overall CDF
and LRF for each radiological sources addressed in PSA - by initiating event (especially if external hazards are treated separately) - by plant operational state (POS)
• Main sequences • Main contributions (importance measures for systems, support systems (i.e. I&C),
component failures, human actions, …) • Main sources of uncertainty and the results of uncertainty analysis, if performed
3. Insights as regard to safety: Safety improvements already implemented or planned (in particular in the post-Fukushima framework) (These insights are considered as particularly interesting for the potential users of the report)
For each example:
• Description and purpose of the safety improvement: design, operation (procedures, Tech Specs), input to SAM guidelines….
• Status of improvement (planned or implemented) • Risk impact • Role of PSA in the decision making.
4. Insights with respect to PSA (methods and data) (Please indicate particular methods and data issues/problems related to the loss of electrical sources and how these issues were addressed (or indicate if these issues are still being evaluated). Specific examples of good practices will be particularly useful)
Possible issues:
• Completeness • HRA • Data on event frequencies • CCFs and dependencies • Recoveries • Support calculations • Sequence duration. Mission time. • Adverse effects of grid disturbances on on-site power systems • Multi-unit events • Selectivity assumptions/modelling
EXAMPLES OF REPLY
• CANADA • FRANCE • INDIA • CHINESE TAIPEI • USA
To be noted: these examples are given as illustrations of the required replies but they are in a draft form and will be finalised with the complete country replies.

NEA/CSNI/R(2017)5
63
CANADA QUESTIONNAIRE Identification Please identify your organisation: Name: Canadian Nuclear Safety Commission Country: Canada Address: 280 Slater Street, Ottawa; P.O. Box 1046, Station B, K1P 5S9 Contact person: Raducu Gheorghe Telephone/e-mail: (613) 947-0517 Are you - A Regulatory Body - A Supporting Organisation to a Regulatory Body � - A Utility � - A Vendor � - A Consultant � - Other � 1. General plant and electrical supplies information
a) General • Plant type: PHWR CANDU-6 (Single Unit), Point Lepreau, New Brunswick (NB) [a
similar plant exists at Gentilly, Quebec; under shutdown, to be decommissioned] • Electrical power [MWe]: Net 635; Gross 680
b) Electrical supplies • Grid connection
- Number of independent feeders into switchyard (No. and types of grid connections) Three 345 kV transmission lines connect the Point Lepreau Generating Station switchyard to the NB Power grid. The generator feeds power to the 345 kV grid through the 26/345 kV, 3-
phase, step-up transformer bank. This transformer bank consists of three single phase 26/345 kV step-up
transformers. Two spare single phase units have been provided. The system service transformer is supplied from the same 345 kV
switchyard. A spare 345/13.8 kV step-down system service transformer has also been provided.
Furthermore, provision has been made to allow this same spare to be used alternatively as a replacement unit service transformer.
- Alternate/independent ac grid sources that might be available (e.g. stand-by gas turbines) the emergency electrical power supplied from the second set of diesel
generators (seismically qualified) known as emergency power supply (EPS) designed to 2x100% redundancy and separation requirements; fuel tank = 7 days supply
• Designed for house turbine operation, island operation Yes. The plant can operate at reduced power levels in the islanding mode. Loss of site power with Class IV available (Islanded operation) is an abnormal operating mode defined as the separation of a part of the transmission network from the rest of the grid.

NEA/CSNI/R(2017)5
64
The separation could be the result of remote transmission lines breaker trips.
• Number of EDGs and/or other internal sources (e.g. gas turbines) and capacity
The CANDU 6 design originally provides for two AUTO Class III SG units; following plant refurbishment in 2008 later a third was added. Also, there are 2x100% manual operated Diesel Generators housed in a seismically qualified building that can provide power supply for shutdown conditions sufficient to place the plant in safe and stable conditions.
• Capacity for cross ties between trains or units
Class IV incoming breakers for both Class III buses and Class III tie breakers, field operator action required.
• Brief description of non-ac dependent decay heat removal systems (e.g. turbine-driven auxiliary feed water, motor driven pumps, natural circulation, etc.)
(We understand this question as only applicable to those heat removal means that are not ac powered supplied) We’ll elaborate the response to this question at the time will respond to the questionnaire. If both class IV and class III power is lost, the steam from the secondary side of steam generators is rejected to the atmosphere through relief valves and the reactor continues to be cooled by natural circulation (thermosyphoning). The make-up water required is added to the steam generators secondary side from the stored inventory or from a system powered by another set of diesel generators, and in the longer term by firewater connections. Thermosyphoning is effective because the steam generators, providing the heat sink, are located at higher elevation than the reactor. Because the turbine is tripped, steam from the steam generators is bypassed to the condenser where it continues to be condensed to be used again on the secondary side of the plant. It is worth noting that the operating single-unit CANDU NPP has steam driven Auxiliary Feed water pump that shows diversity in design. DC battery power is used to operate control valves and monitor reactor safety critical parameters as required.
c) Other information if relevant for PSA: • Transmission system operator and operator requirements • Single or twin turbine/s • Other
Loss of off-site power event (alone) does not pose a major problem for the plant. There are four levels of defence for electrical power supply at the [CANDU] station:
the class IV (13800 V ac 3-phase 60 Hz, 4160 V ac 3-phase 60 Hz, 600/347 V ac 3-phase 4-wire 60 Hz, 208/120 V ac 3-phase 4-wire 60 Hz) electrical power
the class III (4160 V ac 3-phase 60 Hz, 600/347 V ac 3-phase 4-wire 60 Hz, 208/120 V ac 3-phase 4-wire 60 Hz) electrical power supplied from first set of diesel generators with 100% redundancy built in;
the class I (250 V dc 48 V dc) / II (600 V ac 3-phase 4-wire 60 Hz, 120 V ac 1-phase 60 Hz, 208 V ac 3-phase 60 Hz 40 V dc) electrical power supplied from batteries for 8 hours;

NEA/CSNI/R(2017)5
65
the emergency electrical power supplied from the second set of diesel generators (seismically qualified) known as emergency power supply (EPS) designed to 2x100% redundancy and separation requirements;
2. PSA information and results For each PSA considered please provide the following information 2.1. PSA characteristics
• Context and PSA framework (regulatory position) NB Power (and contractor: AECL – now CANDU Energy) produced the PSA to meet CNSC regulatory requirement S-294 (introduced in 2005)
• PSA date (initial, revisions), 2008 (last complete PSA submission to CNSC). As per regulatory requirements, the 2011 update revision is in progress, and some of the updates are under regulatory review.
• PSA scope: Level 1 covering plant internal events internal hazards external hazards for POS: full power low power and shutdown Level 2 covering plant internal events internal hazards external hazards for POS: full power low power and shutdown � Level 3 covering plant internal events � internal hazards � external hazards � for POS: full power � low power and shutdown � Spent fuel pool internal hazards � external hazards �
2.2. Initiating event The main initiating event to be considered is a loss of external electrical sources (LOOP).
• Is the LOOP event considered as a single initiating event or are there sub-categories (especially according to the root cause of the event and to the recovery conditions)?
LOOP is not treated as a distinct explicit Initiating, but a subset of the loss of class IV IE where connection to grid is lost (Refer note in response to final section). In case of failure of islanded operation and also loss of off-site power events, the station experiences a total loss of class IV event (both ODD and EVEN electrical distribution sections are affected). If only one electrical distribution division (ODD or EVEN) is lost, a partial loss of class IV event is to be considered.
• Please briefly describe sub-categories if used.
- Categories: short loop, long loop, induced loop by other transients??? - How is recovery considered? With one or several recovery times and
laws/rules? (e.g. with fixed given mission times for the systems, or with a recovery law /rule versus time)? Do recovery model and recovery probabilities differentiate according to the causes of the initiating event(s)?
- What are the corresponding frequencies?

NEA/CSNI/R(2017)5
66
Initiating event Description Frequency (events/year)
XEL 4.1 Total loss of Class IV Power reactor operating
1.12 E-01
XEL 4.2 Total loss of Class IV Power – reactor shutdown, HTS Cold Depressurised and full
1.03 E-02
XEL 4.3 Total loss of Class IV power – reactor shutdown, HTS cold depressurised and drained to the header level
3.40 E-03
- Is there consideration of variations in frequencies/probabilities for different
seasons/modes of operation (e.g. during refuelling?) - Are there in the PSA other initiating events (other than LOOP) leading to
similar consequences (for example intrinsic failure of electrical bus bars) with a significant contribution?
- Are the LOOP events consequential to external hazards treated specifically or included in a more generic event? What kinds of external hazards were considered among the hazards that can cause LOOP in the PSA? What are the corresponding frequencies? Loss of Class IV event Seismic Induced Class IV event The only initiating event with a HCLPF capacity lower than 0.19g is the seismic induced loss of Class IV power, and so only event trees with Class IV power as an initiating event for both L1 and L2 are quantified (use of PRA: Seismic walk downs were conducted, leading to recommendations to anchor the existing transformers and add missing bolts.)
• What were the data sources and methods used to estimate initiating event frequencies? Different types of initiating event frequency from NUREG/CR-6890 are used as the generic data and then updated by plant operating experiences using technique of Bayesian update.
1. Have you performed a detailed grid reliability analysis? Are the following points explicitly treated or grouped into a more global LOOP event: different grid connections or sources, (e.g. gas turbines)? Not explicitly treated; grouped as part of “more global” IE for Loss of
Class IV 2. House / island mode operation (and then for how long time period)? LOOP
consequential to a transient? The plant can operate at 60% reduced power levels in the islanding mode. The operation is limited in time based on administrative considerations if power is not restored. The plant is manually shut down and cooled down according to operating procedures.
• When relevant for your PSA, what are the conditional failure probabilities (e.g. given a transient (IE), the conditional probability of loss-of-grid connection or conditional switchover failure probability? Conditional probabilities for failure of house turbine/island mode operation?)
2.3. Main modelling assumptions
• What are the main modelling features of diesel generators, gas turbines/other possible sources, the electrical bus bars:
1. types of failure modes and level of details (i.e. if the detail of modelling enables identification of interesting insights, e.g. dependencies) Failure to start, failure to run
2. CCF

NEA/CSNI/R(2017)5
67
3. mission time: 24 hours; 72 hours (for containment systems, where there are alternate means of cooling available)
• Was some guidance used for LOOP introduction/modelling in the PSA? 2.4. Results All the following information, if available, is of interest:
• Risk metrics considered (CDF, LRF…). Please precise the definition. In Canada, three quantitative safety goals are established:
- core damage frequency - small release frequency - large release frequency
A core damage accident results from an initiating event followed by the failure of one or more safety system(s) or safety support system(s). Core damage frequency is a measure of the plant’s accident prevention capabilities. Small release frequency and large release frequency are measures of the plant’s accident mitigation capabilities. They also represent measures of risk to society and to the environment due to the operation of an NPP. Core damage frequency The sum of frequencies of all event sequences that can lead to significant core degradation shall be less than 10-5 per reactor year for new reactors and 10-4 per reactor year for existing reactors. Small release frequency The sum of frequencies of all event sequences that can lead to a release to the environment of more than 1015 Becquerel of iodine-131 shall be less than 10-5 per reactor year and 10-4 per reactor year for existing reactors. A greater release may require temporary evacuation of the local population. Large release frequency The sum of frequencies of all event sequences that can lead to a release to the environment of more than 1014 Becquerel of caesium-137 shall be less than 10-6 per reactor year and 10-5 per reactor year for existing reactors. A greater release may require long-term relocation of the local population
• Risk contributions - total frequency for loss of electrical sources and contribution to overall CDF
and LRF for each radiological sources addressed in PSA Total Frequency for Loss of Electrical Sources : XEL4.3(3.4E-3) +
XEL4.2(1.03E-2) + XEL4.1(1.12E-01) + XEL2.1(2.28 E-05) + XEL1.1(1.35 E-6)
We’ll provide the contribution to overall CDF and LRF at a later date. - by initiating event (especially if external hazards are treated separately) - by plant operational state (POS)
• Main sequences • Main contributions (importance measures for systems, support systems (i.e. I&C),
component failures, human actions, …) • Main sources of uncertainty and the results of uncertainty analysis, if performed
3. Insights with respect to safety: Safety improvements already implemented or planned (in particular in the post-Fukushima framework) (These insights are considered as particularly interesting for the potential users of the report) For each example:
• Description and purpose of the safety improvement: design, operation (procedures, Tech Specs), input to SAM guidelines….
• Status of improvement (planned or implemented) • Risk impact

NEA/CSNI/R(2017)5
68
• Role of PSA in the decision making. Prior to the Fukushima accident, the Point Lepreau station was undergoing refurbishment. The 2008 PRA update from Lepreau partially credit the refurbishment. A complete resubmission is pending. Operation/Emergency: At minimum, one of the three stand-by diesel generators is required. If none of these three generators are available, Lepreau has two seismically qualified emergency diesel generators, of which only one is required to provide the necessary loads. All of these power supplies are located approximately 14 metres above mean sea level, which provides Lepreau with protection against tsunamis or storm surges. In the event that the regular and back-up power supplies listed above are unavailable, Lepreau recently installed additional measures to address the risks associated with Station blackout (i.e. more limiting than a LOOP), including:
- an emergency water line to provide a replenished inventory of water that surrounds the calandria vessel inside the reactor building.
- a containment emergency filtered ventilation system, which relieves the air and steam pressure from containment while highly filtering fission products out of the release into the environment.
- passive autocatalytic hydrogen recombiners in containment to remove hydrogen from the containment atmosphere.
In alignment with the nuclear industry, PLGS has been implementing Severe Accident Management Guidelines (SAMG) over the past few years to more systematically address response to beyond design basis events (events such as natural events, plant failures and security events more severe than the plant was originally designed to withstand). 4. Insights with respect to PSA (methods and data) (Please indicate particular issues/problems related to the loss of electrical sources, which needed (or are still needing) specific attention. Examples of specific developments will be very interesting) Possible issues: For CANDU 6 one does not have an explicit LOOP Initiating Event modelled in the PRA. One approximates LOOP by utilising a Loss of CLASS IV Initiating Event (which includes loss of turbine as well as grid). Class IV is derived from the grid and/or the station’s own generator. During normal operation, power is tapped from the isolated phase bus through the unit service transformer (UST). During a turbine trip, or during an outage, the power may be taken from the electrical system grid through the system service transformer (SST). A loss of class IV power means both UST & SST fail. Sensitivity studies (below) reveal that variation in Loss of Class IV IE frequency is not a major issue for SCDF. Discussion: One can argue, introducing a distinct IE for LOOP is not required.
• Completeness • HRA • Data on event frequencies • CCFs and dependencies • Recoveries • Support calculations • Sequence duration. Mission time.
24 hours; 72 hours (for containment systems, where there are alternative means of cooling)
• Adverse effects of grid disturbances on on-site power systems • Multi-unit events

NEA/CSNI/R(2017)5
69
Not Applicable (Lepreau is a single-unit station) • Selectivity assumptions/modelling
For Total Loss of Class IV IE only: A sensitivity analysis has been performed to estimate the impact of the current IE-CL4 frequency on the SCDF using the Pt. Lepreau Risk Baseline minimal cut sets as the reference model.
- This estimation does not include the Class IV as a mitigating system. Only the impact of the IE “total loss of class IV” has been considered in this analysis.
- In case of normal operation, the frequency of total loss of Class IV power was evaluated to be 2.7 E-1 events/year for Pt. Lepreau.
- The predicted failure frequency of Total Loss of Class IV power is based on-site-specific failure data and is slightly below the target value of 3.0 E-1 occ/year.
The Pt. Lepreau internally set target for IE-CL4 (of 3.0 E-1) is suitable; using a relaxed target for IE-CL4 (of 4.5 E-1) the SCDF_{risk baseline} value will increase insignificantly, by about 1%

NEA/CSNI/R(2017)5
70
CHINESE TAIPEI QUESTIONNAIRE Identification Please identify your organisation: Name: Institute of Nuclear Energy Research Country: Chinese Taipei Address: 1000 Wenhua Road, Jiaan Village, Longtan, Taoyuan, Taiwan 32546 Contact person: Dr Chun-Chang Chao Telephone/e-mail: +886-3-471-1400 ext:6008/[email protected] Are you - A Regulatory Body � - A Supporting Organisation to a Regulatory Body - A Utility � - A Vendor � - A Consultant � - Other � 1. General plant and electrical supplies information
• General - Plant type: BWR-4, Mark I Containment (two identical units)
BWR-6, Mark I Containment (two identical units) PWR, Large Dry Containment (two identical units) ABWR (two identical units, under construction)
- Electrical power [MWe]: 636 MWe per unit (BWR-4) 985 MWe per unit (BWR-6) 951 MWe per unit (PWR) 1350 MWe per unit (ABWR)
• Electrical supplies - Grid connection
Number of independent feeders into switchyard (No. and types of grid connections)
Alternate/independent ac grid sources that might be available (e.g. stand-by gas turbines)
Plant 345 kV 161kV 69kV Gas turbine BWR-4 4 - 4 2 units BWR-6 4 - 2 2 units PWR 4 2 - 2 units
ABWR 4 2 - -
• Designed for house turbine operation, island operation
Only ABWR plant is capable of operating at house load without tripping the reactor.
- Number of EDGs and/or other internal sources (e.g. gas turbines) and capacity P
lant E
DG S
wing DG
Gas Turbine
BWR-4
2 1 2
BWR-6
2 1 2
PWR
2 1 2
ABWR
3 1 -

NEA/CSNI/R(2017)5
71
- Capacity for cross ties between trains or units
Only swing DG is capable of being tied to any division between units.
• Brief description of non-ac dependent decay heat removal systems (e.g. turbine-driven auxiliary feed water, motor driven pumps, natural circulation, etc.)
Plant Turbine-Driven Pump Diesel-Driven Pump BWR-4 1 RCIC, 1 HPCI - BWR-6 1 RCIC - PWR 1 AFW 1 AFW
ABWR 1 RCIC 1 Safety-Related Fire Water
RCIC: Reactor Core Isolation Cooling HPCI: High Pressure Core Injection AFW: Auxiliary Feed water
• Other information if relevant for PSA:
- Transmission system operator and operator requirements - Single or twin turbine/s - Other
After Fukushima accident, each plant has developed its own ultimate response guidelines to deal with severe accidents such as long-term station blackout, long-term loss of plant ultimate heat sink and tsunami attack. A 4.16kV power supply truck, numbers of 480V portable power supply and small pumps are stored in high seismic capacity buildings located at higher elevation. Operating crew is trained to line-up external water source (fire water or raw water from reservoir) within one hour after initiating event per requirements of procedure. Also, the operators in main control room will decrease the reactor pressure to lowest operating limit of turbine-driven pump and get ready for the injection of external water source for AC independent long-term cooling.
2. PSA information and results For each PSA considered please provide the following information (an example is given in appendix) 2.1. PSA characteristics
• Context and PSA framework (regulatory position) Developed by INER in the project from utility
• PSA date (initial, revisions), Plant Initial Latest revision
BWR-4 1991 2012 BWR-6 1985 2012 PWR 1987 2012
ABWR 2007 2012
• PSA scope: Level 1 covering plant internal events internal hazards external hazards for POS: full power low power and shutdown Level 2 covering (Estimation of Large Early Release Frequency, LERF) plant internal events internal hazards external hazards for POS: full power low power and shutdown � Level 3 covering plant internal events � internal hazards � external hazards � for POS: full power � low power and shutdown � Spent fuel pool � internal hazards � external hazards �

NEA/CSNI/R(2017)5
72
2.2. Initiating event The main initiating event to be considered is a loss of external electrical sources (LOOP).
• Is the LOOP event considered as a single initiating event or are there sub-categories (especially according to the root cause of the event and to the recovery conditions)? Please briefly describe sub-categories if used.
1. Categories: short loop, long loop, induced loop by other transients ??? For the operating plant, the LOOP initiating event was split into four sub-categories as the followings per the suggestion of NUREG/CR-6890. LOOP caused from Plant Centred issue LOOP caused from Switchyard Centred issue LOOP caused from Off-site Grid-related issue LOOP caused from Weather issue(excluding typhoon)
For ABWR plant with no operating experience, the LOOP initiating event was simply split into two categories, i.e. recoverable LOOP and non-recoverable LOOP.
2. How is recovery considered? With one or several recovery times and laws/rules? (e.g. with fixed given mission times for the systems, or with a recovery law /rule versus time)? Do recovery model and recovery probabilities differentiate according to the causes of the initiating event(s)? For operating plants, the recovery time of Plant Centred issue was obtained from the operating experiences of 4.16kV power system. And the recovery time of Switchyard Centred was obtained from the records of switchyard maintenance. The recovery time of LOOP caused by the external grid failures and weather hazards was obtained from the grid reliability raw data provided by utility.
3. What are the corresponding frequencies?
Initiating event Initiating Event Frequency (per year)
BWR-4 BWR-6 PWR ABWR*
Plant Centred 1.47E-03 1.55E-03 4.69E-03 -
Switchyard Centred 4.00E-03 4.59E-03 4.58E-03 -
Off-site Grid related 8.45E-02 6.44E-02 1.75E-03 -
Weather 2.68E-03 2.95E-03 8.85E-03 -
Recoverable - - - 1.24E-02
Non-Recoverable - - - 2.35E-02
*No operating experience for ABWR plant. Generic data is used.
4. Is there consideration of variations in frequencies/probabilities for different seasons/modes of operation (e.g. during refuelling?) No special consideration for seasons or operation modes.
5. Are there in the PSA other initiating events (other than LOOP) leading to similar consequences (for example intrinsic failure of electrical bus bars) with a significant contribution? For those initiating events other than LOOP, possibility of loss of off-site power within 24 hours after initiating event was modelled in the off-site power related fault trees.
6. Are the LOOP events consequential to external hazards treated specifically or included in a more generic event? What kinds of external hazards were considered among the hazards that can cause LOOP in the PSA? What are the corresponding frequencies? Typhoon and earthquake were considered as risk significant external hazards for all nuclear power plants in Taiwan. For typhoon event, wind hazard and

NEA/CSNI/R(2017)5
73
fragility of structure, system and components (SSCs) against the wind are used to estimate the plant damage status. Some plant damage status will be treated as a specific LOOP event. For earthquake event, risk is estimated under the condition of LOOP. Similar to typhoon event, seismic hazard and seismic fragility of SSCs are used to define the frequency of LOOP after earthquake.
• What were the data sources and methods used to estimate initiating event frequencies? 1. Have you performed a detailed grid reliability analysis? Are the following
points explicitly treated or grouped into a more global LOOP event: different grid connections or sources, (e.g. gas turbines)? House / island mode operation (and then for how long time period)? LOOP consequential to a transient? Different types of initiating event frequency from NUREG/CR-6890 are used as the generic data and then updated by plant operating experiences using technique of Bayesian update.
• When relevant for your PSA, what are the conditional failure probabilities (e.g. given a transient (IE), the conditional probability of loss-of-grid connection or conditional switchover failure probability? Conditional probabilities for failure of house turbine/island mode operation?) Conditional probability of LOOP given an initiating event other than LOOP is modelled in off-site power related fault trees. For ABWR plant which can be operated at house load, a fault tree was developed to model the necessary actions that will be required to prevent turbine or generator trip while transferring from full power to 5% power of maximum house load.
2.3. Main modelling assumptions
• What are the main modelling features of diesel generators, gas turbines/other possible sources, the electrical bus bars:
1. types of failure modes and level of details (i.e. if the detail of modelling enables identification of interesting insights e.g. dependencies) Failure modes of DG and gas turbine are failure to start and failure to run.
2. CCF, CCF between DGs and gas turbines are considered for both failure modes. No CCF should be considered between the unit EDG and swing DG.
3. mission time, 24 hours
• Was some guidance used for LOOP introduction/modelling in the PSA? Plant general abnormal and emergency operation procedures
2.4. Results All the following information, if available, is of interest:
• Risk metrics considered (CDF, LRF…). Please precise the definition.
POS LOOP Initiating event
Core damage frequency (per year) BWR-4 BWR-6 PWR ABWR
Full Power
Plant Centred 5.60E-09 1.30E-08 4.94E-08 - Switchyard Centred 1.70E-08 4.53E-08 4.49E-08 - Off-site Grid related 4.20E-07 9.43E-07 1.08E-08 -
Weather 9.98E-09 2.47E-08 1.11E-08 - Recoverable - - - 1.89E-10
Non-Recoverable - - - 2.28E-10 Low Power LOOP - - - 7.77E-10 Shutdown LOOP 2.50E-08 Later 1.79E-07 1.59E-09

NEA/CSNI/R(2017)5
74
POS Initiating event Large early release frequency (per year) BWR-4 BWR-6 PWR ABWR
Full Power LOOP 1.38E-08 5.90E-08 5.25E-09 9.67E-09
• Risk contributions - total frequency for loss of electrical sources and contribution to overall CDF
and LRF for each radiological sources addressed in PSA - by initiating event (especially if external hazards are treated separately) - by plant operational state (POS)
(INER is now asking for the utility’s approval to release the information of total CDF and LERF. They will be provided later.)
• Main sequences The most risk significant sequences that lead to core damage will be combinations of the failure of early high pressure injection and failure of early low pressure injection. Early injection means that no pump room cooling will be required when defining the success criteria.
• Main contributions (importance measures for systems, support systems (i.e. I&C), component failures, human actions, …) Main contributors for CDF sequence will be the failure of swing DG, recovery of unit EDG and the human action to line-up the swing DG.
• Main sources of uncertainty and the results of uncertainty analysis, if performed No uncertainty analysis was performed for the LOOP event.
3. Insights as regard to safety: Safety improvements already implemented or planned (in particular in the post-Fukushima framework) (These insights are considered as particularly interesting for the potential users of the report) For each example:
• Description and purpose of the safety improvement: design, operation (procedures, Tech Specs), input to SAM guidelines….
• Status of improvement (planned or implemented) • Risk impact • Role of PSA in the decision making.
- Add the swing DG for each operating plants to provide reliable AC power after loss of off-site power. The estimated risk reduction on CDF is around 30% for BWR-4 plant.
- The small diesel generators designed to provide power to the gas-turbine system are now planned to connect to unit essential 4.16 kV bus. It can provide alternate AC power to unit in case of LOOP caused by the failure of switchyard.
- In response to the lesson learnt from Fukushima accident, each plant has developed a specific procedure called ultimate response guideline to maintain the integrity of nuclear fuel by providing long-term alternate core cooling during severe accident. Numbers of water sources and ways to support the effectiveness of alternate core cooling were identified in the procedure. Utility is now installing the interface between the existing cooling system and the alternate cooling system. INER is now working on modelling the ultimate response guideline to the plant-specific PSA model.
4. Insights with respect to PSA (methods and data) (Please indicate particular issues/problems related to the loss of electrical sources, which needed (or are still needing) specific attention. Examples of specific developments will be very interesting) Possible issues:
• Completeness • HRA • Data on event frequencies

NEA/CSNI/R(2017)5
75
• CCFs and dependencies Most nuclear power plants are designed to have more than one off-site power lines to ensure having high reliability of off-site power system. Some of the off-site power lines cannot be treated as independent when considering the common cause failure. It is recommended that more attention should be taken while updating the frequency of grid failure from operating experiences. There may have more than one type of common cause failure in between the off-site power sources. The failures collected from operating experiences will need more information to clarify if there is any type of common cause failure exists.
• Recoveries • Support calculations • Sequence duration. Mission time. • Adverse effects of grid disturbances on on-site power systems • Multi-unit events
The capacity of swing DG is not capable of providing AC power to both units at the same time during emergency. It is necessary to clarify that under what condition will the other unit have higher priority to have the swing DG. Also, per operating procedure, swing DG can be used to replace any unit EDG which was out of service at-power operation. If it is the case, there will be no swing DG available. Those specific conditions can be properly modelled in the fault trees.
• Selectivity assumptions/modelling
NEA/CSNI/R(2017)5
76
FRANCE QUESTIONNAIRE Identification Please identify your organisation: Name: IRSN…………………………………………………………………….……. Country: FRANCE……………………………………………………………………… Address: ………………………………………………………………………………... ………………………………………………………………………………… Contact person: J.M.Lanore……………………………………………………………… Telephone/e-mail: ………………………………………………………………………….. Are you – A Regulatory Body � - A Supporting Organisation to a Regulatory Body - A Utility � - A Vendor � - A Consultant � - Other � 1. General plant and electrical supplies information
a) General • Plant type: Standard French 900 MWe PWR • Electrical power [MWe]: 900 MWe b) Electrical supplies • Grid connection
- Number of independent feeders into switchyard (No. and types of grid connections)
- Alternate/independent ac grid sources that might be available (e.g. stand-by gas turbines) Main line: 400 kv, Auxiliary line: 225 kv
• Designed for house turbine operation, island operation: House-load operation in case of short loss of main line
• Number of EDGs and/or other internal sources (e.g. gas turbines) and capacity
2 diesel generators/unit + 1 diesel generator/ plant
• Capacity for cross ties between trains or units • Brief description of non-ac dependent decay heat removal systems (e.g. turbine-driven
auxiliary feed water, motor driven pumps, natural circulation, etc.)
1 turbine-driven AFW pump
1 small turbo generator feeding I&C and water injection to primary pumps seals (small test pump)
2. PSA information and results 2.1. PSA characteristics
• PSA framework: developed by IRSN as complementary study aiming to complete and analyse the reference French PSA developed by EDF
• PSA date : initial 1990, last revision: 2010 • PSA scope:
Level 1 covering plant internal events internal hazards � external hazards � for POS: full power low power and shutdown Level 2 � covering

NEA/CSNI/R(2017)5
77
plant internal events � internal hazards � external hazards � for POS: full power � low power and shutdown � Level 3 � covering plant internal events � internal hazards � external hazards � for POS: full power � low power and shutdown �
2.2. Initiating events • The LOOP initiating event is sub-divided into several sub-categories according to the
recovery possibilities and to the functional consequences. • The main sub-categories are the following:
- Loss of main grid (short) - Loss of main grid (long) - Total loss of external power (short) - Total loss of external power (long) - General grid disturbance
• The recoveries are modelled by an exponential function with a mean recovery time. • The LOOP events cover external grid failures (according to events observed from the
operating experience) and external hazards for which functional consequences are only a LOOP. The external hazards with more functional consequences (earthquake, high winds, …) are treated in specific PSAs.
• Other initiating events corresponding to intrinsic failures of electrical components are included in the PSA. The most important contributor is the total failure of 6.6 kV bus bars. Several other initiating events were analysed (diverse partial failures) but with a low contribution.
• Frequency: see table 1 • The source of data is French experience feedback.
2.3. Main modelling assumptions
• What are the main modelling features of diesel generators, gas turbines/other possible sources, the electrical bus bars (level of detail, types of failure modes, CCF, etc.)? Failure modes of diesel generators are: failure to start, failure to run. CCF between diesel generators are considered for both failure modes.
• What mission time was considered in the PSA? 24 hours • Was some guidance used for LOOP introduction/modelling in the PSA?
2.4. Results:
• CDF, LERF - CDF for loss of electrical sources : 2.7 10-06/a corresponding to 38% of the
total CDF (for internal events) - by initiating event : see Table 1 - by POS : see Table 1
• Main sequences: see Table 1 • Main contributions (importance measures for systems, support systems (i.e. I&C),
materials, human actions, … 3. Insights as regard to safety: Safety improvements past, planned (in particular in the
post- Fukushima framework) (These insights are considered as particularly interesting for the potential users of the report) For each example:
• Description of the safety improvement: design, operation (procedures, Tech Specs) • Risk impact • Role of PSA in the decision making

NEA/CSNI/R(2017)5
78
- Addition of the “LLS” system: at the very beginning of the development of probabilistic and reliability assessments, the contribution of the total loss of electrical power appeared as a dominant contribution. A first safety improvement was the addition of a small turbine generator (LLS) able to supply a part of I&C and a testing pump which could provide cooling to the primary pumps seals and avoid a seal LOCA. The risk benefit (delta risk) was not precisely assessed but estimated to about 10-05. The probabilistic aspect was dominant in the decision.
- In case of a total loss of the 2 safety 6.6 kV bus bars (by CCF or by loss of ventilation), and supplementary loss of the LLS generator, the testing pump is electrically supplied by another (non-safety) bus bar. The risk benefit is significant. The problem of a CCF of the bus bars was identified by operating experience, but the safety importance was highlighted by the PSA and led to the safety modification.
4. Insights with respect to PSA (methods and data) (Please indicate particular issues/problems related to the loss of electrical sources which needed (or are still needing) specific attention. Examples of specific developments will be very interesting) Possible issues:
• Completeness • HRA • CCFs and dependencies • Recoveries • Support calculations • Sequence duration • Multi-unit events • Selectivity assumptions/modelling
Account for the timing of the diesel failures: The problem is that, after a LOOP, the procedures require to shut down the plant. After a LOOP the total failure of the internal sources (diesel generators) leads to a station blackout (SBO). The SBO can occur immediately after the LOOP (failure upon demand) but also after some delay (failure to run), and in this last case the plant could be partly or completely shut down, with different functional consequences. For a more realistic modelling, several time windows were considered after the LOOP for the occurrence of a SBO, taking into account the corresponding functional consequences.
Table 1: Initiating event IE frequency [1/a] Core Damage frequency [1/a] Dominant
sequence Loss of main grid (short)
4.3 10-02 P: 4.1 10-02 9.6 10-09 P: 6.7 10-09 S: 2.3 10-02 S: 2.8 10-09
Loss of main grid (long)
6.6 10-02 P: 6.2 10-02 1.4 10-07 P: 1.8 10-08 (1) (2) S: 3.6 10-03 S: 1.2 10-07 (3)
Total loss of external power (short)
3. 10-02 P: 2.2 10-02 9.3 10-08 P: 5.9 10-09 S: 1.6 10-03 S: 8.7 10-08
Total loss of external power (long)
1.2 10-03 P: 1.1 10-03 2.5 10-07 P: 3.6 10-08 (1)(2) S: 6.6 10-04 S: 2.1 10-07 (3)
Total loss of 6.6 kV bus bars by DCC
4.2 10-05 P: 4. 10-05 1.9 10-06 P: 1.5 10-06 (1) (2) S: 2.3 10-06 S: 3.9 10-07 (3)
General grid disturbance
4.2 10-02 P: 4.2 10-05 2.8 10-07 P: 1.4 10-07 S: 2.5 10-03 S: 1.3 10-07
Total CDF
2.7 10-06
P: Reactor at power S: Reactor shutdown Main sequences at power:

NEA/CSNI/R(2017)5
79
Sequence (1): Loss of external power and failure of both diesel generators (or failure of both 6.6 kV bus bars), occurrence of a seal LOCA (60 t/h), failure of water make up by failure of the testing pump, no recovery of an electrical source before core uncovery. Sequence (2): Loss of external power and failure of both diesel generators (or failure of both 6.6 kV bus bars), failure of the auxiliary SG feed water by failure of the turbine-driven pump, no recovery of an electrical source before core uncovery. Main sequence during shutdown: Sequence (3): Loss of external power and failure of both diesel generators (or failure of both 6.6 kV bus bars), failure of the operator to perform a water make up (boiling of the primary water leads to core uncovery).
NEA/CSNI/R(2017)5
80
INDIA QUESTIONNAIRE Identification Please identify your organisation: Name: Nuclear Power Corporation of India Limited (NPCIL) Country: India Address: NUB, Anushaktinagar, Mumbai-400094 Contact person: Dr P.V.Varde / Smt Rajee Guptan Telephone/e-mail: [email protected] / [email protected] Are you – A Regulatory Body � - A Supporting Organisation to a Regulatory Body � - A Utility X - A Vendor � - A Consultant � - Other � 1. General plant and electrical supplies information
a) General • Plant type: Pressurised Heavy Water Reactor • Electrical power [MWe]:540MWe b) Electrical supplies • Grid connection
- Number of independent feeders into switchyard (No. and types of grid connections)
- - Alternate/independent ac grid sources that might be available (e.g. stand-by gas turbines) 400kv and 220 kv
• Designed for house turbine operation, island operation: YES • Number of EDGs and/or other internal sources (e.g. gas turbines) and capacity: Four
50% EDGs • Capacity for cross ties between trains or units Yes-Both • Brief description of non-ac dependent decay heat removal systems (e.g. turbine-driven
auxiliary feed water, motor driven pumps, natural circulation, etc.)
Diesel-Driven Fire Water Pumps to Feed Fire Water to Steam Generator c) Other information if relevant for PSA: • Transmission system operator and operator requirements • Single or twin turbine/s • Other
2. PSA information and results For each PSA considered please provide the following information (an example is given in appendix) 2.1. PS characteristics
• Context and PSA framework (regulatory position) • PSA date (initial, revisions), • PSA scope:
Level1 covering plant internal events X internal hazards X* external hazards X*

NEA/CSNI/R(2017)5
81
for POS: full power � low power and shutdown � Level 2 covering plant internal events X* internal hazards � external hazards � for POS: full power � low power and shutdown � Level 3 covering plant internal events � internal hazards � external hazards � for POS: full power � low power and shutdown � Spent fuel pool � internal hazards � external hazards � X* Performed for some units of NPCIL but not for this twin unit
2.2. Initiating event The main initiating event to be considered is a loss of external electrical sources (LOOP).
• Is the LOOP event considered as a single initiating event or are there sub-categories (especially according to the root cause of the event and to the recovery conditions)? Please briefly describe sub-categories if used.
1. Categories: short loop, long loop, induced loop by other transients ??? Single Initiating Event Category for LOOP associated with Electrical Power failure at Bus level.
2. How is recovery considered? With one or several recovery times and laws/rules? (e.g. with fixed given mission times for the systems, or with a recovery law /rule versus time)? Do recovery model and recovery probabilities differentiate according to the causes of the initiating event(s)? Recovery not modelled in PSA studies deterministic feasibility assessed
3. What are the corresponding frequencies? About 0.2/year for LOOP 4. Is there consideration of variations in frequencies/probabilities for different
seasons/modes of operation (e.g. during refuelling?) no much variations observed
5. Are there in the PSA other initiating events (other than LOOP) leading to similar consequences (for example intrinsic failure of electrical bus bars) with a significant contribution? Included in estimating LOOP Frequency
6. Are the LOOP events consequential to external hazards treated specifically or included in a more generic event? What kinds of external hazards were considered among the hazards that can cause LOOP in the PSA? What are the corresponding frequencies? Treated Separately. Seismic Event is considered as external cause of LOOP
• What were the data sources and methods used to estimate initiating event frequencies? 1. Have you performed a detailed grid reliability analysis? (No). Are the following
points explicitly treated or grouped into a more global LOOP event: different grid connections or sources, (e.g. gas turbines)? House / island mode operation (and then for how long time period)? (No). LOOP consequential to a transient? All the factors are implicitly considered in estimating the LOOP frequency as per observed grid failure events
• When relevant for your PSA, what are the conditional failure probabilities (e.g. given a transient (IE), the conditional probability of loss-of-grid connection or conditional switchover failure probability? Conditional probabilities for failure of house turbine/island mode operation?)
2.3. Main modelling assumptions
• What are the main modelling features of diesel generators, gas turbines/other possible sources, the electrical bus bars:
1. types of failure modes and level of details (i.e. if the detail of modelling enables identification of interesting insights e.g. dependencies)

NEA/CSNI/R(2017)5
82
CCF of Diesel Generator in Start and Running Mode, 2. mission time,
• Was some guidance used for LOOP introduction/modelling in the PSA? No 2.4. Results All the following information, if available, is of interest:
• Risk metrics considered (CDF, LRF…). Please precise the definition. CDF,LERF • Risk contributions
- total frequency for loss of electrical sources and contribution to overall CDF and LRF for each radiological sources addressed in PSA LOOP Frequency 0.2/year (excluding External events) LOOP Contributes to CDF is about 15% Sequence:
- by initiating event (especially if external hazards are treated separately) - by plant operational state (POS)
Main sequences:- LOOP *CCF of EDG sets*Failure in manual injection of Fire Water to Steam Generator
• Main contributions (importance measures for systems, support systems (i.e. I&C), component failures, human actions, …)
• Main sources of uncertainty and the results of uncertainty analysis, if performed 3. Insights with regard to safety: Safety improvements already implemented or planned
(in particular in the post-Fukushima framework) (These insights are considered as particularly interesting for the potential users of the report) For each example:
• Description and purpose of the safety improvement: design, operation (procedures, Tech Specs), input to SAM guidelines….
- Used in design of two train ECCS system for 700 MWe • Status of improvement (planned or implemented) • Risk impact • Role of PSA in the decision making.
4. Insights with respect to PSA (methods and data) (Please indicate particular issues/problems related to the loss of electrical sources, which needed (or are still needing) specific attention. Examples of specific developments will be very interesting) Possible issues:
• Completeness • HRA • Data on event frequencies • CCFs and dependencies • Recoveries • Support calculations • Sequence duration. Mission time. • Adverse effects of grid disturbances on on-site power systems • Multi-unit events • Selectivity assumptions/modelling

NEA/CSNI/R(2017)5
83
USA QUESTIONNAIRE An example of answer is given in Appendix Identification Please identify your organisation: Name: US NRC………………………………………………………………….……. Country: USA ……………………………………………………………………….. Address: ………………………………………………………………………….. ………………………………………………………………………….. Contact person: Michelle Gonzalez …………………………………………………………….. Telephone/e-mail: 301-251-7591/ [email protected]………………………………….. Are you - A Regulatory Body x - A Supporting Organisation to a Regulatory Body � - A Utility � - A Vendor � - A Consultant � - Other � 1. General plant and electrical supplies information
a) General • Plant type: Reference plant is a two-unit nuclear power plant. Each unit is four-Loop
Westinghouse PWR with large dry ambient containment • Electrical power (per unit) [MWe]: 3565MWt
b) Electrical supplies • Grid connection
- Number of independent feeders into switchyard (No. and types of grid connections)
The reference plant has two switchyards – a 230 kV switchyard and a 500 kV switchyard. The Unit 1 main generator connects to the 230 kV switchyard and the Unit 2 main generator connects to the 500 kV switchyard. The 230 kV and 500 kV switchyards are connected by two autotransformers. The 230kV switchyard has five feeder lines and the 500 kV has two feeder lines. System load studies indicate that this arrangement has the capacity and capability to supply the power necessary for the safety loads of one unit while placing the other unit in cold shutdown.
- Alternate/independent ac grid sources that might be available (e.g. stand-by gas turbines)
Normal (preferred) on-site ac power is supplied from the 230-kV switchyard through two independent feeders each of which supplies a reserve auxiliary transformers (RATs) in each unit. The RATs feed non-Class 1E and Class 1E buses; either RAT can be aligned to one or both emergency buses within a unit. On-site ac power may also be supplied from a swing Stand-by Auxiliary Transformer (SAT) which can be connected to the grid or a combustion turbine generating station independent of the main 230 kV and 500kV switchyards. The SAT has limited capacity and is designed to

NEA/CSNI/R(2017)5
84
power only one safety electrical bus at a time (but can be aligned to either safety bus in either unit).
• Designed for house turbine operation, island operation - Unit auxiliary transformers (which are powered form the main generator in each
unit) provide non-safety balance of plant electrical power during normal operation.
- Additionally, non-safety-related balance of plant power can be supplied by either of the two reserve auxiliary transformers (two per unit, four total) powered from the 230-kV switchyard.
- The two stand-by diesel generators (two per unit – 4 total) provide emergency power to the two engineered safety feature electrical buses in each unit.
• Number of EDGs and/or other internal sources (e.g. gas turbines) and capacity- - The reference plant has two electrical safety trains with one EDG per train.
Upon loss of all off-site power, either diesel generator or its associated bus has the capacity to power the equipment required to safely shutdown the reactor and mitigate the consequences of the design bases accidents. Each EDG is rated for 7000kW continuous operation.
• Capacity for cross ties between trains or units – - Cross ties are not credited in the PRA.
• Brief description of non-ac dependent decay heat removal systems (e.g. turbine-driven auxiliary feed water, motor driven pumps, natural circulation, etc.)
- To maintain the electrical and instrumentation components needed for core cooling and decay heat removal following SBO, the station 125-Vdc Class 1E batteries are capable of powering the required loads for the SBO coping duration (assumed to be 4 hours). Adequate battery capacity also exists to provide field flashing to one of the emergency diesel generators and closing of all required breakers in the final minute of the SBO coping duration.
- The DC power system has adequate capacity to provide instrumentation to assess the core reactivity, RCS inventory, core cooling capability and decay heat removal capability, for the SBO coping time (assumed to be 4 hours).
- Each unit has a 100% capacity turbine-driven auxiliary feed water pump to provide makeup water to the steam generators independent of AC power. The turbine-driven pump requires DC power and is supported by the station DC batteries.
c) Other information if relevant for PSA: • Transmission system operator and operator requirements • Single or twin turbine/s • Other
2. PSA information and results For each PSA considered please provide the following information (an example is given in appendix) 2. 1. PSA characteristics
• Context and PSA framework (regulatory position) - Developed by the Idaho National Laboratories to be used in support of NRCs
reactor oversight programmes. • PSA date (initial, revisions),
- Initial PRA – 17 August 2006 - Latest revision – April 2012
• PSA scope: Level 1 covering plant internal events X internal hazards � external hazards �

NEA/CSNI/R(2017)5
85
for POS: full power X low power and shutdown � Level 2 covering plant internal events � internal hazards � external hazards � for POS: full power � low power and shutdown � Level 3 covering plant internal events � internal hazards � external hazards � for POS: full power � low power and shutdown � Spent fuel pool � internal hazards � external hazards �
2.2. Initiating event The main initiating event to be considered is a loss of external electrical sources (LOOP).
• Is the LOOP event considered as a single initiating event or are there sub-categories (especially according to the root cause of the event and to the recovery conditions)? Please briefly describe sub-categories if used.
1. Categories: short loop, long loop, induced loop by other transients The LOOP events are divided into 4 categories:
1. LOOP plant centred (LOOPPC), 2. LOOP Switchyard related (LOOPSC), 3. LOOP weather-related (LOOPWR) and 4. LOOP grid related (LOOPGR).
2. How is recovery considered? With one or several recovery times and laws/rules? (e.g. with fixed given mission times for the systems, or with a recovery law /rule versus time)? Do recovery model and recovery probabilities differentiate according to the causes of the initiating event(s)? The recovery probabilities are modelled by a lognormal distribution. Recovery times take into account battery depletion time or core
uncovery time and the time to uncover the reactor core if no safety systems function
3. What are the corresponding frequencies? LOOPGR – 1.9E-2/year LOOPSC – 1.0E-2/year LOOPPC – 2.1E-3/year LOOPWR – 4.8E-3/year
4. Is there consideration of variations in frequencies/probabilities for different seasons/modes of operation (e.g. during refuelling?) No, the PRA is only modelled for internal events at power.
5. Are there in the PSA other initiating events (other than LOOP) leading to similar consequences (for example intrinsic failure of electrical bus bars) with a significant contribution? Yes, the PRA models the loss of 4160V AC bus and the loss of vital dc
buses 6. Are the LOOP events consequential to external hazards treated specifically or
included in a more generic event? What kinds of external hazards were considered among the hazards that can cause LOOP in the PSA? What are the corresponding frequencies? The PRA model includes a LOOP weather-related (LOOPWR) event.
Although there is not an event for specific external hazards, the LOOPWR take into account severe weather conditions like thunderstorms, ice storms, hurricanes, snow, tornados and others.
• What were the data sources and methods used to estimate initiating event frequencies? The probabilities of non-recovery of off-site power to the first safety bus for various recovery times are derived from Table 4-1 in NUREG/CR-6890. This data was used to generate LOOP non-recovery curve parameters for the SPAR models.
1. Have you performed a detailed grid reliability analysis? Are the following points explicitly treated or grouped into a more global LOOP event: different

NEA/CSNI/R(2017)5
86
grid connections or sources, (e.g. gas turbines)? House / island mode operation (and then for how long time period)? LOOP consequential to a transient? The INL maintains a database for the NRC of LOOP frequencies. This
database is a statistical and engineering analysis of LOOP Frequencies and durations at commercial nuclear reactors and includes data from 1986–2011. This database is updated annually with more recent data.
• When relevant for your PSA, what are the conditional failure probabilities (e.g. given a transient (IE), the conditional probability of loss-of-grid connection or conditional switchover failure probability? Conditional probabilities for failure of house turbine/island mode operation?)
1. Given a transient initiator, the conditional probability of a consequential LOOP is 9.1E-3 (NUREG/CR-6890)
2.3. Main modelling assumptions
• What are the main modelling features of diesel generators, gas turbines/other possible sources, the electrical bus bars:
1. types of failure modes and level of details (i.e. if the detail of modelling enables identification of interesting insights e.g. dependencies) Failure modes modelled for diesel generators are failure to start and
failure to run 2. CCF
Diesel generators are assumed to be susceptible to CCF on failure to start and failure to run/load (http://nrcoe.inl.gov/resultsdb/publicdocs/CCF/ccfparamest2010.pdf)
3. mission time 24 hrs
• Was some guidance used for LOOP introduction/modelling in the PSA? 1. Yes, the frequencies and probabilities used for LOOP modelling are based on
the study presented in NRC’s NUREG/CR-6890.
2.4. Results All the following information, if available, is of interest:
• Risk metrics considered (CDF, LRF…). Please precise the definition. - CDF – Core Damage Frequency – the frequency of damage to a reactor core
sufficient to lead to a release of radioactive material from the core that could affect public health (see NUREG-2122, “Glossary of Risk-Related Terms in Support of Risk-Informed Decision Making”).
• Risk contributions - total frequency for loss of electrical sources and contribution to overall CDF
and LRF for each radiological sources addressed in PSA. Total CDF for each unit of the reference plant is approximately 3.8E-05/year.
Event Frequency CDF Dominant sequences Frequency LOOPGR 1.9E-2 9.53E-7 15
16-3-10 3.32E-7 1.47E-7
LOOPSC 1.0E-2 4.23E-7 15 16-3-10
1.83E-7 5.45E-8
LOOPPC 2.1E-3 7.14E-8 15 3.33E-8 LOOPWR 4.8E-3 5.94E-7 16-3-10
16-06 1.73E-7 1.44E-7
- by initiating event (especially if external hazards are treated separately) N/A - by plant operational state (POS) N/A
• Main sequences – (refer to table above) - Sequence 15 – Failure of auxiliary feed water and failure of feed and bleed
which leads to core damage
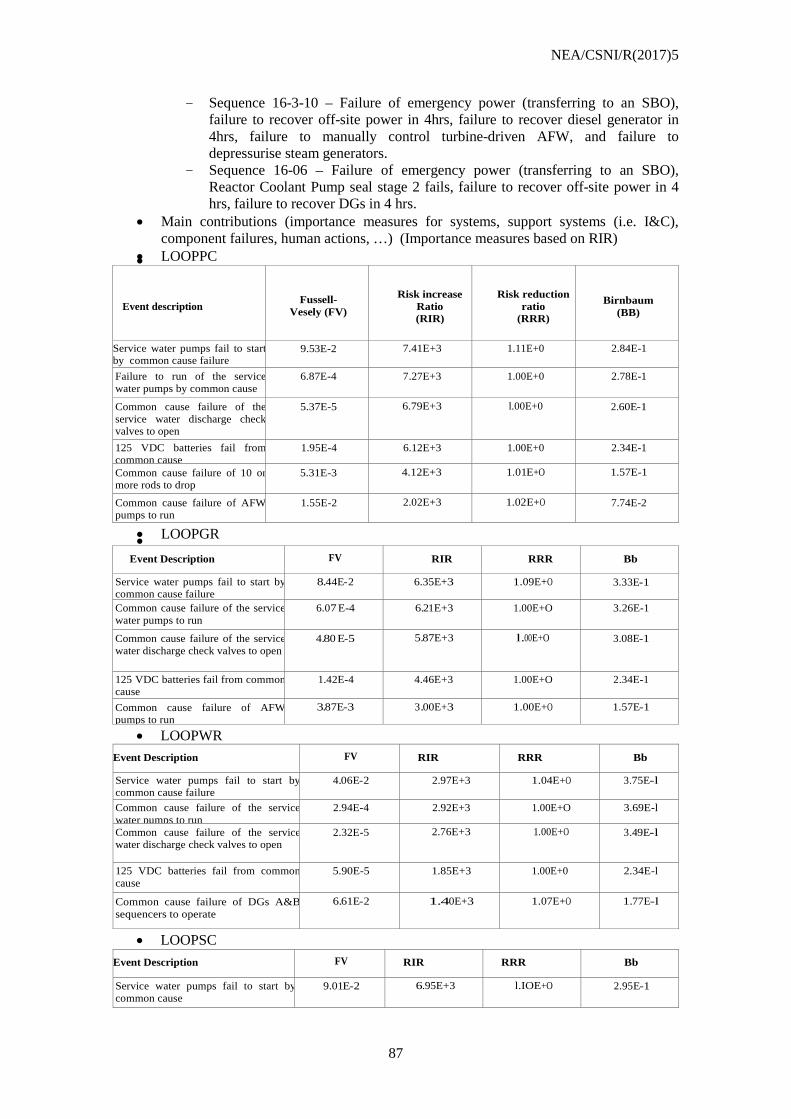
NEA/CSNI/R(2017)5
87
- Sequence 16-3-10 – Failure of emergency power (transferring to an SBO), failure to recover off-site power in 4hrs, failure to recover diesel generator in 4hrs, failure to manually control turbine-driven AFW, and failure to depressurise steam generators.
- Sequence 16-06 – Failure of emergency power (transferring to an SBO), Reactor Coolant Pump seal stage 2 fails, failure to recover off-site power in 4 hrs, failure to recover DGs in 4 hrs.
• Main contributions (importance measures for systems, support systems (i.e. I&C), component failures, human actions, …) (Importance measures based on RIR)
• LOOPPC •
Event description Fussell-
Vesely (FV)
Risk increase
Ratio (RIR)
Risk reduction
ratio (RRR)
Birnbaum
(BB)
Service water pumps fail to start by common cause failure
9.53E-2 7.41E+3 1.11E+0 2.84E-1
Failure to run of the service water pumps by common cause
6.87E-4 7.27E+3 1.00E+0 2.78E-1
Common cause failure of the service water discharge check valves to open
5.37E-5 6.79E+3 l.00E+0 2.60E-1
125 VDC batteries fail from common cause
1.95E-4 6.12E+3 1.00E+0 2.34E-1
Common cause failure of 10 or more rods to drop
5.31E-3 4.12E+3 1.01E+O 1.57E-1
Common cause failure of AFW pumps to run
1.55E-2 2.02E+3 1.02E+O 7.74E-2
• LOOPGR • Event Description FV
RIR
RRR
Bb
Service water pumps fail to start by common cause failure
8.44E-2 6.35E+3 1.09E+O 3.33E-1
Common cause failure of the service water pumps to run
6.07 E-4 6.21E+3 1.00E+O 3.26E-1
Common cause failure of the service water discharge check valves to open
4.80 E-5 5.87E+3 l.00E+O 3.08E-1
125 VDC batteries fail from common cause
1.42E-4 4.46E+3 1.00E+O 2.34E-1
Common cause failure of AFW pumps to run
3.87E-3 3.00E+3 1.00E+O 1.57E-1
• LOOPWR Event Description FV
RIR
RRR
Bb
Service water pumps fail to start by common cause failure
4.06E-2 2.97E+3 1.04E+O 3.75E-l
Common cause failure of the service water pumps to run
2.94E-4 2.92E+3 1.00E+O 3.69E-l
Common cause failure of the service water discharge check valves to open
2.32E-5 2.76E+3 1.00E+O 3.49E-l
125 VDC batteries fail from common cause
5.90E-5 1.85E+3 1.00E+0 2.34E-l
Common cause failure of DGs A&B sequencers to operate
6.61E-2 1.40E+3 1.07E+O 1.77E-l
• LOOPSC Event Description FV RIR RRR Bb
Service water pumps fail to start by common cause
9.01E-2 6.95E+3 l.IOE+O 2.95E-1
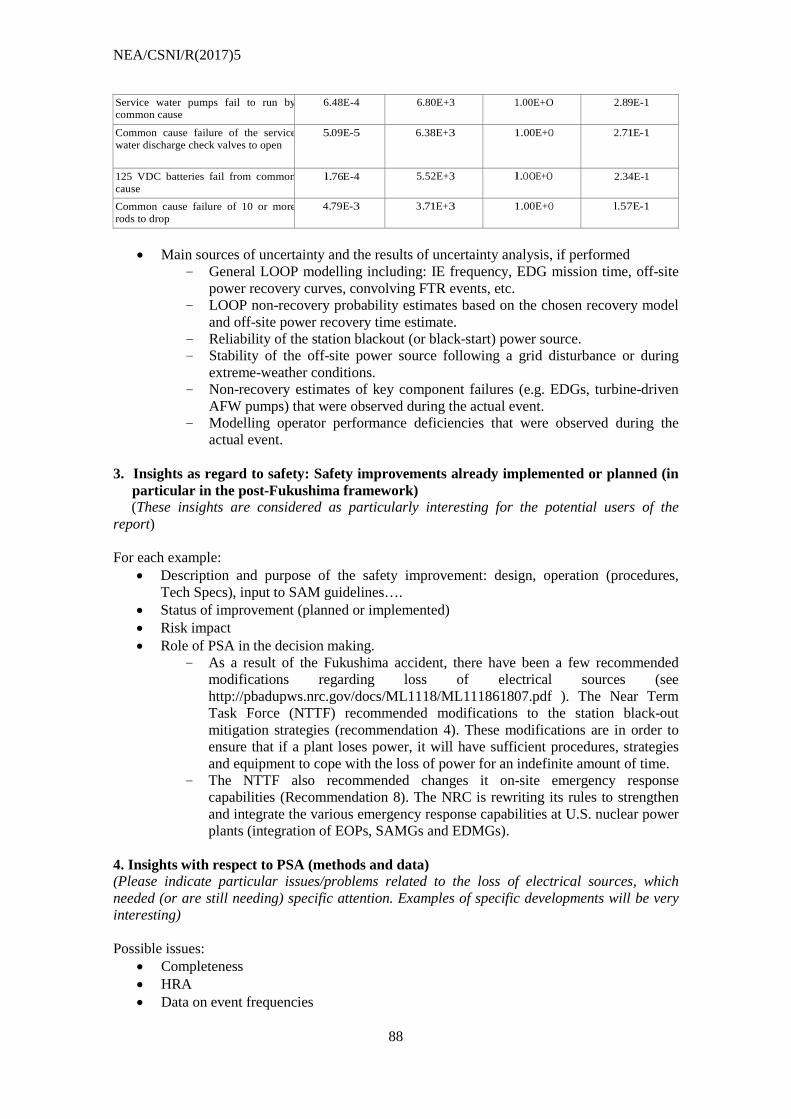
NEA/CSNI/R(2017)5
88
Service water pumps fail to run by common cause
6.48E-4 6.80E+3 1.00E+O 2.89E-1
Common cause failure of the service water discharge check valves to open
5.09E-5 6.38E+3 1.00E+O 2.71E-1
125 VDC batteries fail from common cause
l.76E-4 5.52E+3 l.OOE+O 2.34E-1
Common cause failure of 10 or more rods to drop
4.79E-3 3.71E+3 1.00E+O l.57E-1
• Main sources of uncertainty and the results of uncertainty analysis, if performed
- General LOOP modelling including: IE frequency, EDG mission time, off-site power recovery curves, convolving FTR events, etc.
- LOOP non-recovery probability estimates based on the chosen recovery model and off-site power recovery time estimate.
- Reliability of the station blackout (or black-start) power source. - Stability of the off-site power source following a grid disturbance or during
extreme-weather conditions. - Non-recovery estimates of key component failures (e.g. EDGs, turbine-driven
AFW pumps) that were observed during the actual event. - Modelling operator performance deficiencies that were observed during the
actual event. 3. Insights as regard to safety: Safety improvements already implemented or planned (in
particular in the post-Fukushima framework) (These insights are considered as particularly interesting for the potential users of the report) For each example:
• Description and purpose of the safety improvement: design, operation (procedures, Tech Specs), input to SAM guidelines….
• Status of improvement (planned or implemented) • Risk impact • Role of PSA in the decision making.
- As a result of the Fukushima accident, there have been a few recommended modifications regarding loss of electrical sources (see http://pbadupws.nrc.gov/docs/ML1118/ML111861807.pdf ). The Near Term Task Force (NTTF) recommended modifications to the station black-out mitigation strategies (recommendation 4). These modifications are in order to ensure that if a plant loses power, it will have sufficient procedures, strategies and equipment to cope with the loss of power for an indefinite amount of time.
- The NTTF also recommended changes it on-site emergency response capabilities (Recommendation 8). The NRC is rewriting its rules to strengthen and integrate the various emergency response capabilities at U.S. nuclear power plants (integration of EOPs, SAMGs and EDMGs).
4. Insights with respect to PSA (methods and data) (Please indicate particular issues/problems related to the loss of electrical sources, which needed (or are still needing) specific attention. Examples of specific developments will be very interesting) Possible issues:
• Completeness • HRA • Data on event frequencies

NEA/CSNI/R(2017)5
89
• CCFs and dependencies • Recoveries • Support calculations • Sequence duration. Mission time. • Adverse effects of grid disturbances on on-site power systems • Multi-unit events • Selectivity assumptions/modelling
Several LOOP related issues have been identified in the context of the NRC’s independent PRA models. These issues are summarised in report INL/EXT-10-20739, “Resolution of SPAR Model Technical Issues” (http://pbadupws.nrc.gov/docs/ML1227/ML12276A079.pdf) and include:
• Long-term SBO modelling • Multi-unit considerations • Improved modelling of consequential LOOP • Modelling of extreme-weather LOOP events (with low probability of recovery within
24 hours)
WGRISK (2013)1
Project/Activity title Probabilistic Safety Assessment insights relating to the loss of electrical sources.
Objective
The objective of the task is an overview of the insights provided by Probabilistic Safety Assessment (PSA) relating to a loss of electrical sources, in order to illustrate PSA capabilities in the analysis of the robustness of safety functions. While in the analysis of the robustness of safety functions generally the emphasis is on the causes of potential failures of the function, especially when using operating experience, PSA is a particularly interesting tool for providing insights related to the potential consequences (Core Damage (CD), Large Early Releases (LERF)….) of the loss of a safety function and relating to the provisions (defences) aiming to avoid consequences of the loss of the safety function (i.e. prevention and/or mitigation of CD). Use of PSA results, and especially conditional probabilities (of CD or of LERF after the occurrence of an initiating event…), could provide a measure of defence in depth in case of loss of a safety function. The task intends to illustrate the PSA capabilities with an outstanding practical example. Two types of insights will be gained:
- Insights for plant safety related to results and applications of risk calculations: overall risk as well as relative results relating to dominant contributions, potentially weak points in the defences, balance between CD prevention and mitigation, comparison between internal initiating events and hazards, key sources of uncertainty (where available), safety benefits brought by modifications already implemented or planned (including possible post-Fukushima modifications).
- Insights on PSA methodology: identification of good practices, potential gaps, differences in the methodologies used or developed.
Scope
The principle is to use existing PSAs, relating to operating or future plants, in order to assess the risk conditional on the failure of electrical sources. The scope will cover a wide definition of loss of electrical sources, including for example common cause failure of switchboards, loss of battery-backed supplies, any type of electrical disturbance and potential secondary effects, etc. The scope will include results of PSA relating to the loss of electrical sources, including PSA level 1, level 2 and level 3, internal and external initiating events, full power and LPSD. When relevant, differences between internal and external initiators; also, if available, the effect of post-Fukushima measures will be identified. Differences due to plant design and to PSA methods and assumptions will also be noted. Two aspects will be considered:
- Results and applications: overall results, conditional probabilities, relative contributions, importance measures, sensitivity studies and as far as possible real examples of safety improvements with their related PSA impact.
- PSA methods and assumptions: initiating events considered, LOOP duration, mission times, treatment of recoveries, of human intervention, of dependencies, of common cause failures, etc…
Justification
The loss of electrical sources is generally an important contributor to the risk related to nuclear plants. In particular the External Hazards initiating events lead generally to a loss of electrical sources. This importance was underscored by the Fukushima accident. A strength of PSA is that it provides insights not only into the causes of the event but also into the potential consequences and the provisions aiming to limit these consequences. PSA

NEA/CSNI/R(2017)5
90
could provide a measure of defence in depth in case of loss of a safety function. These insights can be used to improve the defences, and especially to protect them against dependencies among the defences and between these and the initiating event. In particular the defences can be protected against external hazards that lead to safety function failures, and PSA could provide a measure of post-Fukushima improvements (need and adequacy for modification to the plant and its procedures including severe accident management). The insights relating to the PSA methods will be useful for future PSA developments, in particular PSA for external hazards.
Expected results and deliverables The expected results are a report presenting the insights from PSA applied to the loss of electrical sources, and identification of good practices for safety improvements and for PSA future developments.
Users The users will be the regulators, designers and operators. PSA practitioners are also expected to benefit from the insights identified relating to PSA methodology.
Relation to other projects The conclusions will be complementary to the conclusions of the ROBELSYS task.
Safety significance/ priority (see priority criteria in Section IV)
The activity corresponds to all the CSNI criteria, especially:
- Criterion 1: Issue of high safety significance and of importance to nuclear regulators
- Criterion 2: Better accomplished by international group
- Criterion 3: Likely to bring results in a reasonable time frame
- Criterion 4: Maintain and preserve strategic safety competence
Technical Goal(s) covered
The task addresses a significant safety issue (2a) Promotes PSA applications in the operation of nuclear installations and Risk-informed approaches (3g).
Knowledge management and transfer covered Knowledge management and transfer of PSA development and application
Milestones (deliverables vs. time)
Core group to prepare a questionnaire (J0+6 months). Questionnaire sent to WGRISK members. Responses collected (J0+12 months) and analysed (J0+18 months). Submission of the report to CSNI (J0+24 months).
Lead organisation(s) and co-ordination
IRSN (France)
Participants (individuals and organisations)
France, Germany, Hungary, Czech Republic, Canada, India, Italy, Sweden, Mexico, Chinese Taipei.
Resources
Leader: 6 months. Core group: 2 months each. Other countries: 15 days each.
Requested action from PRG/CSNI Endorsement requested
PRG recommendation
CSNI disposition

NEA/CSNI/R(2017)5
91
APPENDIX 3:
Task WGRISK 2013(1):
Probabilistic Safety Assessment insights relating to the loss of electrical sources
Questionnaire answers
Belgium
Canada
Chinese Taipei
Czech Republic
Finland
France
Germany
Hungary
India
Japan
Korea
Mexico
Romania
Slovakia
Slovenia
Spain
Sweden
Switzerland
USA

NEA/CSNI/R(2017)5
92
BELGIUM
QUESTIONNAIRE Identification Please identify your organisation: Name: Tractebel / Electrabel GDF Suez……………………………………….……. Country: Belgium………………………………………………………………………. Address: 7 Avenue Ariane, Woluwe Saint Lambert / 34 Simon Bolivar, Bruxelles….. Contact person: Mitaillé Stanislas / Grondal Corentin / Erik Bourdiaudhy………………….. Telephone/e-mail: [email protected] / [email protected] / [email protected] ……………………………………………………….. Are you - A Utility X - A Consultant X 1. General plant and electrical supplies information
a) General • Plant type:
PWR: Tihange 1, 2, 3 and Doel 1-2, 3 and 4. • Electrical power [MWe]:
Tihange 1: 960 MWe Tihange 2: 985 MWe Tihange 3: 1042 MWe Doel 1-2: 400 MWe and 440MWe Doel 3: 1030 MWe Doel 4: 1039 MWe Remark: as 7 units are presents in Belgium, the information showed below will be general data and not plant specific.
b) Electrical supplies • Grid connection
- Number of independent feeders into switchyard (No. and types of grid connections)
- Alternate/independent ac grid sources that might be available (e.g. stand-by gas turbines)
Main line: 380 kV. A 380 kV station is present outside of each plant site (Tihange and Doel), then for each unit, a connection links the post with the unit. A transformer permits to have 24 kV to the Main Transformers which their aims are to feed the electrical boards with 6.6 kV. Auxiliary line: 150 kV. As for the 380 kV, a 150 kV station is present outside of each plant site and, for each unit an underground connection links the post with the unit. Transformers are also available in order to have the voltage of 6.6 kV for the electrical boards of the plant consumers.
• Designed for house turbine operation, island operation (e.g. the main generator can supply house loads without reliance on or connection to the main switchyard)
House-load operation is possible in case of loss of the 380 kV grid connection. • Number of EDGs and/or other internal sources (e.g. gas turbines) and capacity

NEA/CSNI/R(2017)5
93
For Tihange 2/3 and Doel ¾: three stand-by diesel generators in case of loss of normal power supply for the systems of first level of protection and other three stand-by diesel generators for the systems of second level of protection meant for external hazards. Moreover, one site diesel generator is available in order to replace a failed diesel generator. In Tihange, 3 new diesel generators were installed above flood area as a post-Fukushima action. For Tihange 1: two stand-by diesel generators in case of loss of normal power supply and one turbine-driven turbo-alternator in case of LOOP + loss of the 2 diesel generators. For Doel 1 and Doel 2: 4 stand-by diesels generators (shared by the two units) in case of loss of normal power supply
• Capacity for cross ties between trains or units For one specific unit, it is possible to use one stand-by diesel generator of one train in order to feed the electrical board for another train, but not for the other units of the same site.- Brief description of non-ac dependent decay heat removal systems (e.g. turbine-driven auxiliary feed water, motor driven pumps, natural circulation, etc.)
One turbine-driven AFW pump is available.
c) Other information if relevant for PSA: • Transmission system operator and operator requirements • Single or twin turbine/s: Doel 1-2 is a twin unit.
2. PSA information and results For each PSA considered please provide the following information (an example is given in appendix) 2.1. PSA characteristics
• Context and PSA framework (regulatory position): The PSA is aimed to analyse the risk of Belgian units from a probabilistic point a view and to improve the current situation using PSA results.
• PSA date (initial, revisions): initial in 1994; last revision 2011. • PSA scope:
Level 1 covering plant internal events X for POS: full power X low power and shutdown X Level 2 covering plant internal events X for POS: full power X low power and shutdown X
2.2. Initiating event The main initiating event to be considered is a loss of external electrical sources (LOOP).
• Is the LOOP event considered as a single initiating event or are there sub-categories (especially according to the root cause of the event and to the recovery conditions)? Please briefly describe sub-categories if used.
1. Categories: short loop, long loop, induced loop by other transients? Two categories are present: short-term LOOP and long-term LOOP.
The difference between them depends on the autonomy of the batteries and on the water capacities available without refilling of tanks.
2. How is recovery considered? With one or several recovery times and laws/rules? (e.g. with fixed given mission times for the systems, or with a recovery law /rule versus time)? Do recovery model and recovery probabilities differentiate according to the causes of the initiating event(s)?

NEA/CSNI/R(2017)5
94
The recovery is not modelled. Two initiating events with different frequencies are present (for short and long term). For the LOOP short term, the mission time used for the stand-by diesel generators is equal to the short term period.
Moreover, depending of the short-term or long-term initiating event, the event tree associated is different.
3. What are the corresponding frequencies? This question covers several points: . The frequency of each sub-category . And, if relevant for your PSA: Conditional probability of a consequential LOOP given a plant transient Conditional probability of a transfer of plant electrical buses from a
“normal” transformer to a “reserve” transformer Conditional probability of house-load operation The frequency for the LOOP Initiating Event is equal to 3.00E-02 for
all POS, based on international value and discussions with Regulatory body.
The failure of commutation for one electrical board (from the normal feeding to the auxiliary feeding) is around 1E-02.
Even if house-load operation is possible for the plants, it is not modelled in the PSA model.
4. Is there consideration of variations in frequencies/probabilities for different seasons/modes of operation (e.g. during refuelling?) The LOOP frequency takes into account the time spent in each POS by
the unit, but is not season dependent. 5. Are there in the PSA other initiating events (other than LOOP) leading to
similar consequences (for example intrinsic failure of electrical bus bars) with a significant contribution? Other initiating events corresponding to the loss of electrical board
itself (e.g. 380V, 220V, 110 V loss) or a Common Cause Failure for the 6.6 kV electrical boards is modelled.
6. Are the LOOP events consequential to external hazards treated specifically or included in a more generic event? What kinds of external hazards were considered among the hazards that can cause LOOP in the PSA? What are the corresponding frequencies? The current PSA models concern only the internal events, therefore
such considerations are not taken into account. • What were the data sources and methods used to estimate initiating event frequencies?
1. Have you performed a detailed grid reliability analysis? Are the following points explicitly treated or grouped into a more global LOOP event: different grid connections or sources, (e.g. gas turbines)? House / island mode operation (and then for how long time period)? LOOP consequential to a transient? The LOOP frequency is based on an international value taken from the
literature and discussions with the Regulatory Body. Consequently, no detailed grid analysis has been performed.
• When relevant for your PSA, what are the conditional failure probabilities (e.g. given a transient (IE), the conditional probability of loss-of-grid connection or conditional switchover failure probability? Conditional probabilities for failure of house turbine/island mode operation?)
Even if house-load operation is possible for the plants, this is not modelled in the PSA model.
Given a transient, it was assumed that there is a probability around 4.00E-03 to loss the grid connection.
2.3. Main modelling assumptions

NEA/CSNI/R(2017)5
95
• What are the main modelling features of diesel generators, gas turbines/other possible sources, the electrical bus bars:
1. types of failure modes and level of details (i.e. if the detail of modelling enables identification of interesting insights, e.g. dependencies),
2. CCF, 3. mission time,
Failures modes considered for the diesel generators are: fail to start and fail to run.
CCF between diesel generators is also considered for both failures modes.
Mission time used is : • 24 hours in case of long-term LOOP, • short-term period for the short-term LOOP.
• Was some guidance used for LOOP introduction/modelling in the PSA? 1. The LOOP modelling didn’t follow any specific guidance. Some basic studies
were done in order to see the consequence of this Initiating Event (e.g. Event Tree analysis, fault tree analysis, Failure Mode and Effect Analysis…).
2.4. Results All the following information, if available, is of interest:
• Risk metrics considered (e.g. Core Damage Frequency (CDF), Large Release Frequency (LRF) along with a definition of the associated metric (i.e. how are CDF and/or LRF defined for your PSA…).
- CDF (Core Damage Frequency) and CFF (Containment Failure Frequency)/release categories are the main risk metrics.
• Risk contributions - total frequency for loss of electrical sources and contribution to overall CDF
and LRF for each radiological sources addressed in PSA; - by initiating event (especially if external hazards are treated separately; - by plant operational state (POS); - CDF for loss of electrical sources: 4E-06 for all POS, which represents 20% of
the total CDF (existing only for internal events); - 10% to 20% of the Containment Failure Frequency is coming from the LOOP
event. • Main sequences
- The main contribution comes from the loss of all 6.6kV electrical boards by CCF in POS A (around 3E-06). Two sequences are present for this specific Initiating Event: Loss of the 6.6 kV electrical boards level 1 by CCF with a failure of the
seals of the primary pumps; Loss of the 6.6 kV electrical boards level 1 by CCF with a failure of the
three stand-by diesel generators for the systems of second level of protection (designed for external hazards).
• Main contributions (importance measures for systems, support systems (i.e. I&C), component failures, human actions, …)
- Using the importance analysis (measures), it has been showed that the diesel generators (both first level and second level of protection) are high safety significant equipment.
• Main sources of uncertainty and the results of uncertainty analysis, if performed. 3. Insights as regard to safety: Safety improvements already implemented or planned (in particular in the post-Fukushima framework) (These insights are considered as particularly interesting for the potential users of the report)

NEA/CSNI/R(2017)5
96
For each example: • Description and purpose of the safety improvement: design, operation (procedures,
Tech Specs), input to SAM guidelines… • Status of improvement (planned or implemented). • Risk impact. • Role of PSA in the decision making.
1) In Doel nuclear power plant, some mobile means are implemented in order to
deal with an extended loss of AC power (ELAP). These means were defined following the FLEX approach. Among other, the following mobile means were defined :
a) A pump to inject water in the SG; b) A pump to inject in the ECCS in order to, among others, inject borated
water in the RCS; c) A diesel generator 380V to feed some electrical valve, instrumentation
panels,... 2) In Tihange nuclear power plant, the situation is different due to the risk of
external flooding, the limited space in the site, the use of mobile means was not retained. Three fixed diesel generator of 6kV were installed outside of flooding area. A connection will be installed in order to allow these diesels to electrically feed the safety system required in case of an ELAP scenario.
3) Recommendations about the management of LOOP accident in terms of emergency procedures and mobile equipment means.
4. Insights with respect to PSA (methods and data) (Please indicate particular methods and data issues/problems related to the loss of electrical sources and how these issues were addressed (or indicate if these issues are still being evaluated). Specific examples of good practices will be particularly useful) Possible issues:
• Completeness. • HRA. • Data on event frequencies. • CCFs and dependencies. • Recoveries. • Support calculations. • Sequence duration. Mission time. • Adverse effects of grid disturbances on on-site power systems. • Multi-unit events. • Selectivity assumptions/modelling:
1) For the creation of the Event Tree, one of the first elements to determine is the duration which makes the difference between a LOOP short term and a LOOP long term. This can be determining based one DC battery autonomy information and tank inventory. Then, based on that mission time, two different event trees can be created. One will use a mission time equal to the time determined and the other will use a mission time equal to 24 hours.
2) The fact that a diesel generator which is normally linked to one specific board can supply another board in case of failure of the supply of this board, brings the analyst to complicate situations and FT modelling (e.g. use of NOR Gate,…).
3) Actually, CCF between breakers is not modelled in our model but will be implemented in the future.
4) For the event frequency, the LOOP frequency is based on international value while the other event frequencies come from plant-specific data.

NEA/CSNI/R(2017)5
97
5) Assumptions concerning the “normal electrical situation” which is modelled have to be documented. The assumptions could be, if necessary, discussed at the end of the analysis and some sensitivity study can be made.
6) Concerning the value in our model, the following values are present: a) For a mission time of 24 hours, the probability to loss the power grid
(150 kV and 380 kV) is around 2E-04. b) For a mission time of 24 hours, the probability for losing the
connection to the 380 kV or to the 150 kV is around 1E-03.

NEA/CSNI/R(2017)5
98
CANADA QUESTIONNAIRE Identification Please identify your organisation: Name: Canadian Nuclear Safety Commission Country: Canada Address: 280 Slater Street, Ottawa; P.O. Box 1046, Station B, K1P 5S9 Contact person: Raducu Gheorghe Telephone/e-mail: (613) 947-0517 Are you - A Regulatory Body - A Supporting Organisation to a Regulatory Body � - A Utility � - A Vendor � - A Consultant � - Other � 1. General plant and electrical supplies information
a) General • Plant type: PHWR CANDU-6 (Single Unit), Point Lepreau, New Brunswick (NB) [a
similar plant exists at Gentilly, Quebec; under shutdown, to be decommissioned] • Electrical power [MWe]: Net 635; Gross 680
b) Electrical supplies • Grid connection
- Number of independent feeders into switchyard (No. and types of grid connections) Three 345 kV transmission lines connect the Point Lepreau Generating Station switchyard to the NB Power grid. The generator feeds power to the 345 kV grid through the 26/345 kV,
3-phase, step-up transformer bank. This transformer bank consists of three single phase 26/345 kV step-up
transformers. Two spare single phase units have been provided. The system service transformer is supplied from the same 345 kV
switchyard. A spare 345/13.8 kV step-down system service transformer has also been provided.
Furthermore, provision has been made to allow this same spare to be used alternatively as a replacement unit service transformer.
- Alternate/independent ac grid sources that might be available (e.g. stand-by gas
turbines) the emergency electrical power supplied from the second set of diesel
generators (seismically qualified) known as emergency power supply (EPS) designed to 2x100% redundancy and separation requirements; fuel tank = 7 days supply
• Designed for house turbine operation, island operation Yes. The plant can operate at reduced power levels in the islanding mode. Loss of site power with Class IV available (Islanded operation) is an abnormal operating mode defined as the separation of a part of the transmission network from the rest of the grid. The separation could be the result of remote transmission lines breaker trips.

NEA/CSNI/R(2017)5
99
• Number of EDGs and/or other internal sources (e.g. gas turbines) and capacity: The CANDU 6 design originally provides for two AUTO Class III SG units; following plant refurbishment in 2008 later a third was added. Also, there are 2x100% manual operated Diesel Generators housed in a seismically qualified building that can provide power supply for shutdown conditions sufficient to place the plant in safe and stable conditions.
• Capacity for cross ties between trains or units: Class IV incoming breakers for both Class III buses and Class III tie breakers, field operator action required.
• Brief description of non-ac dependent decay heat removal systems (e.g. turbine-driven auxiliary feed water, motor driven pumps, natural circulation, etc.): If both class IV and class III power is lost, the steam from the secondary side of steam generators is rejected to the atmosphere through relief valves and the reactor continues to be cooled by natural circulation (thermosyphoning). The make-up water required is added to the steam generators secondary side from the stored inventory or from a system powered by another set of diesel generators, and in the longer term by firewater connections. Thermosyphoning is effective because the steam generators, providing the heat sink, are located at higher elevation than the reactor. Because the turbine is tripped, steam from the steam generators is bypassed to the condenser where it continues to be condensed to be used again on the secondary side of the plant. It is worth noting that the operating single-unit CANDU NPP has steam driven Auxiliary Feed water pump that shows diversity in design. DC battery power is used to operate control valves and monitor reactor safety critical parameters as required.
c) Other information if relevant for PSA: • Transmission system operator and operator requirements • Single or twin turbine/s • Other
Loss of off-site power event (alone) does not pose a major problem for the plant. There are four levels of defence for electrical power supply at the [CANDU] station:
- the class IV (13800 V ac 3-phase 60 Hz, 4160 V ac 3-phase 60 Hz, 600/347 V ac 3-phase 4-wire 60 Hz, 208/120 V ac 3-phase 4-wire 60 Hz) electrical power;
- the class III (4160 V ac 3-phase 60 Hz, 600/347 V ac 3-phase 4-wire 60 Hz, 208/120 V ac 3-phase 4-wire 60 Hz) electrical power supplied from first set of diesel generators with 100% redundancy built in;
- the class I (250 V dc 48 V dc) / II (600 V ac 3-phase 4-wire 60 Hz, 120 V ac 1-phase 60 Hz, 208 V ac 3-phase 60 Hz 40 V dc) electrical power supplied from batteries for 8 hours;
- the emergency electrical power supplied from the second set of diesel generators (seismically qualified) known as emergency power supply (EPS) designed to 2x100% redundancy and separation requirements.
2. PSA information and results For each PSA considered please provide the following information 2.1. PSA characteristics
• Context and PSA framework (regulatory position) NB Power (and contractor: AECL – now Candu Energy) produced the PSA to meet CNSC regulatory requirement S-294 (introduced in 2005)
• PSA date (initial, revisions),

NEA/CSNI/R(2017)5
100
2008 (last complete PSA submission to CNSC). As per regulatory requirements, the 2011 update revision is in progress, and some of the updates are under regulatory review.
• PSA scope: 1. Level 1 covering 2. plant internal events internal hazards external hazards 3. for POS: full power low power and shutdown 4. Level 2 covering 5. plant internal events internal hazards external hazards 6. for POS: full power low power and shutdown � 7. Level 3 covering 8. plant internal events � internal hazards � external hazards � 9. for POS: full power � low power and shutdown � 10. Spent fuel pool internal hazards � external hazards �
2.2. Initiating event The main initiating event to be considered is a loss of external electrical sources (LOOP).
• Is the LOOP event considered as a single initiating event or are there sub-categories (especially according to the root cause of the event and to the recovery conditions)? LOOP is not treated as a distinct explicit Initiating, but a subset of the loss of class IV IE where connection to grid is lost (Refer note in response to final section). In case of failure of islanded operation and also loss of off-site power events, the station experiences a total loss of class IV event (both ODD and EVEN electrical distribution sections are affected). If only one electrical distribution division (ODD or EVEN) is lost, a partial loss of class IV event is to be considered.
• Please briefly describe sub-categories if used. 1. Categories: short loop, long loop, induced loop by other transients ??? 2. How is recovery considered? With one or several recovery times and
laws/rules? (e.g. with fixed given mission times for the systems, or with a recovery law /rule versus time)? Do recovery model and recovery probabilities differentiate according to the causes of the initiating event(s)?
3. What are the corresponding frequencies?
11. Initiating event 12. Description 13. Frequency (events/year) 14. XEL 4.1 15. Total loss of Class IV Power reactor
operating 16. 1.12 E-01
17. XEL 4.2 18. Total loss of Class IV Power – reactor shutdown, HTS Cold Depressurised and full
19. 1.03 E-02
20. XEL 4.3 21. Total loss of Class IV power – reactor shutdown, HTS cold depressurised and drained to the header level
22. 3.40 E-03
4. Is there consideration of variations in frequencies/probabilities for different
seasons/modes of operation (e.g. during refuelling) ? 5. Are there in the PSA other initiating events (other than LOOP) leading to
similar consequences (for example intrinsic failure of electrical bus bars) with a significant contribution?
6. Are the LOOP events consequential to external hazards treated specifically or included in a more generic event? What kinds of external hazards were considered among the hazards that can cause LOOP in the PSA? What are the corresponding frequencies? Loss of Class IV event. Seismic Induced Class IV event.

NEA/CSNI/R(2017)5
101
The only initiating event with a HCLPF capacity lower than 0.19g is the seismic induced loss of Class IV power, and so only event trees with Class IV power as an initiating event for both L1 and L2 are quantified (use of PRA: Seismic walk downs were conducted, leading to recommendations to anchor the existing transformers and add missing bolts.).
• What were the data sources and methods used to estimate initiating event frequencies? - Different types of initiating event frequency from NUREG/CR-6890 are used as
the generic data and then updated by plant operating experiences using technique of Bayesian update.
1. Have you performed a detailed grid reliability analysis? Are the following points explicitly treated or grouped into a more global LOOP event: different grid connections or sources, (e.g. gas turbines)? Not explicitly treated; grouped as part of “more global” IE for Loss of
Class IV. 2. House/island mode operation (and then for how long time period)? LOOP
consequential to a transient? The plant can operate at 60% reduced power levels in the islanding mode. The operation is limited in time based on administrative considerations if power is not restored. The plant is manually shut down and cooled down according to operating procedures.
• When relevant for your PSA, what are the conditional failure probabilities (e.g. given a transient (IE), the conditional probability of loss-of-grid connection or conditional switchover failure probability? Conditional probabilities for failure of house turbine/island mode operation?) ?
2.3. Main modelling assumptions
• What are the main modelling features of diesel generators, gas turbines/other possible sources, the electrical bus bars:
1. types of failure modes and level of details (i.e. if the detail of modelling enables identification of interesting insights, e.g. dependencies): Failure to start, failure to run.
2. CCF. 3. mission time: 24 hours; 72 hours (for containment systems, where there are
alternate means of cooling available). • Was some guidance used for LOOP introduction/modelling in the PSA?
2.4. Results All the following information, if available, is of interest:
• Risk metrics considered (CDF, LRF…). Please precise the definition. In Canada, three quantitative safety goals are established:
- core damage frequency; - small release frequency; - large release frequency .
A core damage accident results from an initiating event followed by the failure of one or more safety system(s) or safety support system(s). Core damage frequency is a measure of the plant’s accident prevention capabilities. Small release frequency and large release frequency are measures of the plant’s accident mitigation capabilities. They also represent measures of risk to society and to the environment due to the operation of an NPP. Core damage frequency The sum of frequencies of all event sequences that can lead to significant core degradation shall be less than 10-5 per reactor year for new reactors and 10-4 per reactor year for existing reactors.

NEA/CSNI/R(2017)5
102
Small release frequency The sum of frequencies of all event sequences that can lead to a release to the environment of more than 1015 Becquerel of iodine-131 shall be less than 10-5 per reactor year and 10-4 per reactor year for existing reactors. A greater release may require temporary evacuation of the local population. Large release frequency The sum of frequencies of all event sequences that can lead to a release to the environment of more than 1014 Becquerel of caesium-137 shall be less than 10-6 per reactor year and 10-5 per reactor year for existing reactors. A greater release may require long-term relocation of the local population.
• Risk contributions - total frequency for loss of electrical sources and contribution to overall CDF
and LRF for each radiological sources addressed in PSA 23. Total Frequency for Loss of Electrical Sources: XEL4.3(3.4E-3) + XEL4.2(1.03E-2) + XEL4.1(1.12E-01) + XEL2.1(2.28 E-05) + XEL1.1(1.35 E-6) 24. We’ll provide the contribution to overall CDF and LRF at a later date.
- by initiating event (especially if external hazards are treated separately) - by plant operational state (POS)
• Main sequences • Main contributions (importance measures for systems, support systems (i.e. I&C),
component failures, human actions, …) • Main sources of uncertainty and the results of uncertainty analysis, if performed
3. Insights with respect to safety: Safety improvements already implemented or planned (in particular in the post-Fukushima framework) (These insights are considered as particularly interesting for the potential users of the report) For each example:
• Description and purpose of the safety improvement: design, operation (procedures, Tech Specs), input to SAM guidelines….
• Status of improvement (planned or implemented) • Risk impact • Role of PSA in the decision making.
Prior to the Fukushima accident, the Point Lepreau station was undergoing refurbishment. The 2008 PRA update from Lepreau partially credit the refurbishment. A complete resubmission is pending. Operation/Emergency: At minimum, one of the three stand-by diesel generators is required. If none of these three generators are available, Lepreau has two seismically qualified emergency diesel generators, of which only one is required to provide the necessary loads. All of these power supplies are located approximately 14 metres above mean sea level, which provides Lepreau with protection against tsunamis or storm surges. In the event that the regular and back-up power supplies listed above are unavailable, Lepreau recently installed additional measures to address the risks associated with station blackout (i.e. more limiting than a LOOP), including:
- an emergency water line to provide a replenished inventory of water that surrounds the calandria vessel inside the reactor building.
- a containment emergency filtered ventilation system, which relieves the air and steam pressure from containment while highly filtering fission products out of the release into the environment.
- passive autocatalytic hydrogen recombiners in containment to remove hydrogen from the containment atmosphere.
NEA/CSNI/R(2017)5
103
In alignment with the nuclear industry, PLGS has been implementing Severe Accident Management Guidelines (SAMG) over the past few years to more systematically address response to beyond design basis events (events such as natural events, plant failures and security events more severe than the plant was originally designed to withstand). 4. Insights with respect to PSA (methods and data) (Please indicate particular issues/problems related to the loss of electrical sources, which needed (or are still needing) specific attention. Examples of specific developments will be very interesting) Possible issues: For CANDU 6 one does not have an explicit LOOP Initiating Event modelled in the PRA. One approximates LOOP by utilising a Loss of CLASS IV Initiating Event (which includes loss of turbine as well as grid). Class IV is derived from the grid and/or the station’s own generator. During normal operation, power is tapped from the isolated phase bus through the unit service transformer (UST). During a turbine trip, or during an outage, the power may be taken from the electrical system grid through the system service transformer (SST). A loss of class IV power means both UST & SST fail. Sensitivity studies (below) reveal that variation in Loss of Class IV IE frequency is not a major issue for SCDF. Discussion: One can argue, introducing a distinct IE for LOOP is not required.
• Completeness • HRA • Data on event frequencies • CCFs and dependencies • Recoveries • Support calculations • Sequence duration. Mission time.
25. 24 hours; 72 hours (for containment systems, where there are alternative means of cooling)
• Adverse effects of grid disturbances on on-site power systems • Multi-unit events
26. Not Applicable (Lepreau is a single-unit station) • Selectivity assumptions/modelling
For Total Loss of Class IV IE only: A sensitivity analysis has been performed to estimate the impact of the current IE-CL4 frequency on the SCDF using the Pt. Lepreau Risk Baseline minimal cut sets as the reference model.
- This estimation does not include the Class IV as a mitigating system. Only the impact of the IE “total loss of class IV” has been considered in this analysis.
- In case of normal operation, the frequency of total loss of Class IV power was evaluated to be 2.7 E-1 events/year for Pt. Lepreau.
- The predicted failure frequency of Total Loss of Class IV power is based on-site-specific failure data and is slightly below the target value of 3.0 E-1 occ/year.
The Pt. Lepreau internally set target for IE-CL4 (of 3.0 E-1) is suitable; using a relaxed target for IE-CL4 (of 4.5 E-1) the SCDF_{risk baseline} value will increase insignificantly, by about 1%

NEA/CSNI/R(2017)5
104
CZECH REPUBLIC (1) QUESTIONNAIRE Identification Please identify your organisation: Name: ÚJV Řež, a. s. Country: Czech Republic Address: Hlavní 130, Řež, 250 68 Husinec Contact person: ………………………………………………………………………….. Telephone/e-mail: ………………………………………………………………………….. Are you - A Regulatory Body � - A Supporting Organisation to a Regulatory Body � - A Utility � - A Vendor � - A Consultant � - Other (TSO) 1. General plant and electrical supplies information
a) General • Plant type: Reference plant is Dukovany NPP with 4 almost identical units of WWER
440/V213 located in two twin units. • Electrical power [MWe]: 500 MWe per unit
b) Electrical supplies • Grid connection
- Number of independent feeders into switchyard (No. and types of grid connections)
- 4 main independent 400 kV lines to switchyard Slavětice (1 per unit) - Note: Main switchyard Slavětice operates under N-2 rule (after loss of two grid
connections, the switchyard is still able of transmitting 100% of NPP nominal power).
- Alternate/independent ac grid sources that might be available (e.g. stand-by gas turbines)
Two additional 110 kV auxiliary lines to main switchyard Slavětice Two 110 kV auxiliary lines to switchyard Oslavany Two reactor units (twin unit) share one 110kV line to each switchyard. For the case of SBO conditions nearby hydroelectric power plants were tested as an external AAC source. Hydropower plant Dalešice (4x112.5 MWe) is considered as a main AAC source and directly connected to the same switchyard (Slavětice) as Dukovany NPP. Its start-up sequence can be initiated in small hydropower plant Mohelno (1x1.2 MWe, 1x0.6 MWe). Power generated by small hydropower plant Mohelno is used for restarting of Dalešice hydro generators. Electric power generated by Dalešice is transmitted via 400 kV or 110 kV lines to NPP Dukovany. The secondary source of external AAC is small hydropower plant Vranov nad Dyjí (3x6.3 MWe), which is capable to start during blackout but it is located about 50 km from the NPP. This source is unable to operate in parallel and cannot be used for start of the other hydro generators. Note: The use of both of these AAC power sources are described in EOPs but are not explicitly modelled in PSA.
NEA/CSNI/R(2017)5
105
• Designed for house turbine operation, island operation (e.g. the main generator can supply house loads without reliance on or connection to the main switchyard) All units are capable of house-load operation and island operation.
• Number of EDGs and/or other internal sources (e.g. gas turbines) and capacity 12 EDGs in total (3 per unit), 3500 kVA each
• Capacity for cross ties between trains or units Two redundant cross-tie bus bars between all units at 6kV level rated up to 25MVA (cross-tie connections are establishes also between twin units). Cross connections between non-safety 0.4kV bus bars in each twin unit.
• Brief description of non-ac dependent decay heat removal systems (e.g. turbine-driven auxiliary feed water, motor driven pumps, natural circulation, etc.) Under SBO conditions steam is released to the atmosphere by steam dumps on main steam collector or by SG safety valves. SGs can be fed by gravity from feed water tanks or using fire-fighter’s pumps via special connections (flanges) on emergency FW piping.
c) Other information if relevant for PSA: • Transmission system operator and operator requirements
ČEPS (Transmission System Operator) grid stability requirements or Dukovany NPP: Full power operation in range of 48.5-50.5 Hz. Reduced power short-time operation in range of 47.5-52.5 Hz.
• Single or twin turbine/s Two TGs (250 MWe each) per reactor unit.
• Other 2. PSA information and results For each PSA considered please provide the following information (an example is given in appendix) 2.1. PSA characteristics
• Context and PSA framework (regulatory position) Developed and maintained by ÚJV Řež, a. s.
• PSA date (initial, revisions), Early 90´s, regularly updated in the frame of Living PSA project (usually once a year)
• PSA scope: Level 1 covering plant internal events internal hazards external hazards for POS: full power low power and shutdown Level 2 covering plant internal events internal hazards external hazards � for POS: full power low power and shutdown Level 3 covering plant internal events � internal hazards � external hazards � for POS: full power � low power and shutdown � Spent fuel pool internal hazards external hazards Note: The only external hazards modelled in Level 2 PSA are airplane crashes.
2.2. Initiating event The main initiating event to be considered is a loss of external electrical sources (LOOP).
• Is the LOOP event considered as a single initiating event or are there sub-categories (especially according to the root cause of the event and to the recovery conditions)? Please briefly describe sub-categories if used.

NEA/CSNI/R(2017)5
106
1. Categories: short loop, long loop, induced loop by other transients?
Note: Values are valid at the end of the year 2013. Note: There are additional IEs of the type “LOOP induced by other transients”. Most of external hazards as well as some fires, floods and missiles also lead to black-out scenarios in some (or even all) sequences.
2. How is recovery considered? With one or several recovery times and laws/rules? (e.g. with fixed given mission times for the systems, or with a recovery law /rule versus time)? Do recovery model and recovery probabilities differentiate according to the causes of the initiating event(s)? Off-site power recovery is considered only for IEs T5.1 and T5.2. Cross connections to the remaining Dukovany reactor unit are considered for all remaining IEs of the type “LOOP induced by other transients” depending on the actual availability of the cross-connection lines and power supply of the remaining units. Recovery probabilities depend on time to perform the required mitigation actions, which is specific for each POS. So recovery failures in several time periods are considered.
3. What are the corresponding frequencies? This question covers several points: The frequency of each sub-category See Table above And, if relevant for your PSA: Conditional probability of a consequential LOOP given a plant transient Conditional probability of a transfer of plant electrical buses from a
“normal” transformer to a “reserve” transformer Conditional probability of house-load operation
There are many different scenarios leading to LOOP during the course of transients depending on the IE sub-category, POS and sequence so it is not possible to provide single values. Transfer of plant electrical buses from a “normal” transformer to a “reserve” transformer is performed in each division separately so it is not possible to calculate the “global” value for transfer failure, since failures or electrical components are mixed with the failures of the non-electrical components in the divisions. Note: Failure probability of house-load operation is 1.43E-1.
4. Is there consideration of variations in frequencies/probabilities for different seasons/modes of operation (e.g. during refuelling?) Frequency of each IE sub-category is averaged per calendar year (not specific to POS). This frequency is then multiplied in each POS by the respective POS duration fraction.
Category Sub-category
Description Average frequency [1/year]
LOOP T5.1 Loss of off-site power from main switchyard Slavětice (both 400kV line and one 110kV line failure)
4.76E-2
T5.2 Total LOOP (failure of all switchyards in the region – no line to NPP available) 5.24E-2 LOOP induced by other transients (from internal causes) T5 T5.5 Failure of 400kV line to main switchyard Slavětice (except full power operation) 3.00E-1
T5.51 Failure of 400kV line to main switchyard Slavětice at full power operation – house-load operation available
1.50E-1
T5.52 Failure of 400kV line to main switchyard 400kV at full power operation – house-load operation unavailable
1.50E-1
T5.6 Complete failure of 110kV reserve power supply at twin unit (during shutdown) 1.67E-2 T6 T6.1 Failure of non-safety 6kV bus bar 3.00E-1
T6.2 Failure of safety 6kV bus bar 2.86E-3 T6.3 Failure of safety 0.4kV bus bar 1.72E-2
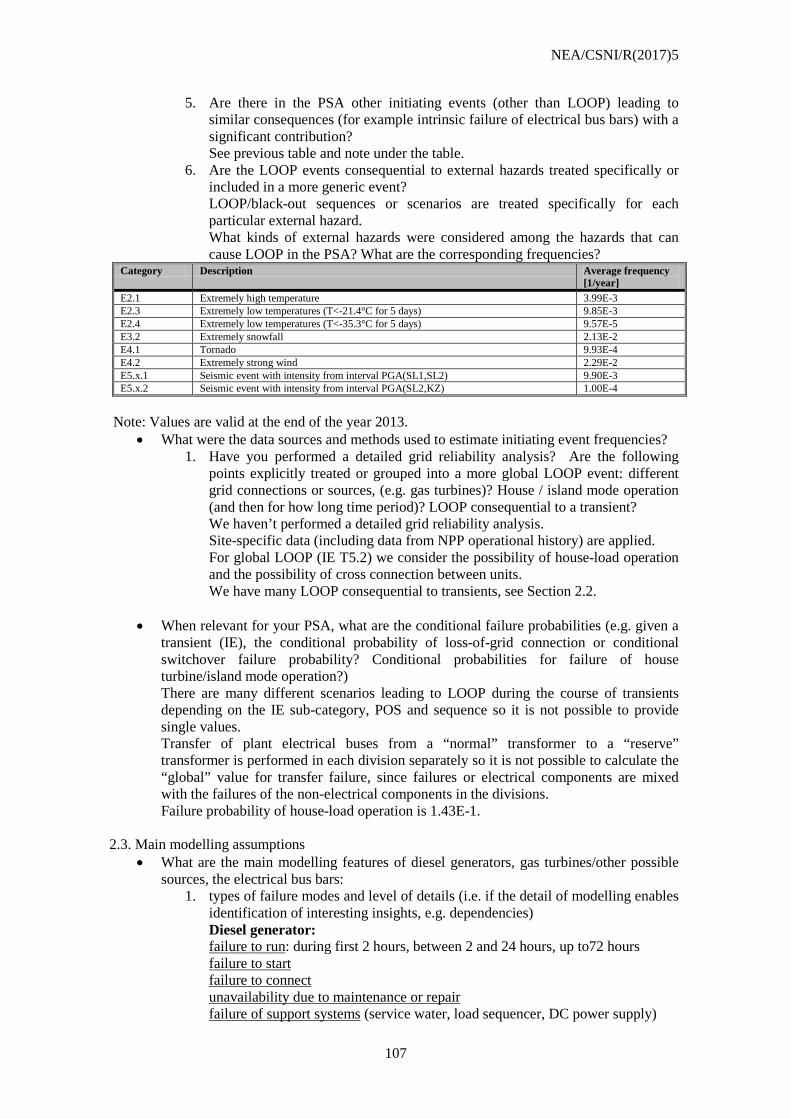
NEA/CSNI/R(2017)5
107
5. Are there in the PSA other initiating events (other than LOOP) leading to similar consequences (for example intrinsic failure of electrical bus bars) with a significant contribution? See previous table and note under the table.
6. Are the LOOP events consequential to external hazards treated specifically or included in a more generic event? LOOP/black-out sequences or scenarios are treated specifically for each particular external hazard. What kinds of external hazards were considered among the hazards that can cause LOOP in the PSA? What are the corresponding frequencies?
Category Description Average frequency [1/year]
E2.1 Extremely high temperature 3.99E-3 E2.3 Extremely low temperatures (T<-21.4°C for 5 days) 9.85E-3 E2.4 Extremely low temperatures (T<-35.3°C for 5 days) 9.57E-5 E3.2 Extremely snowfall 2.13E-2 E4.1 Tornado 9.93E-4 E4.2 Extremely strong wind 2.29E-2 E5.x.1 Seismic event with intensity from interval PGA(SL1,SL2) 9.90E-3 E5.x.2 Seismic event with intensity from interval PGA(SL2,KZ) 1.00E-4
Note: Values are valid at the end of the year 2013.
• What were the data sources and methods used to estimate initiating event frequencies? 1. Have you performed a detailed grid reliability analysis? Are the following
points explicitly treated or grouped into a more global LOOP event: different grid connections or sources, (e.g. gas turbines)? House / island mode operation (and then for how long time period)? LOOP consequential to a transient? We haven’t performed a detailed grid reliability analysis. Site-specific data (including data from NPP operational history) are applied. For global LOOP (IE T5.2) we consider the possibility of house-load operation and the possibility of cross connection between units. We have many LOOP consequential to transients, see Section 2.2.
• When relevant for your PSA, what are the conditional failure probabilities (e.g. given a transient (IE), the conditional probability of loss-of-grid connection or conditional switchover failure probability? Conditional probabilities for failure of house turbine/island mode operation?) There are many different scenarios leading to LOOP during the course of transients depending on the IE sub-category, POS and sequence so it is not possible to provide single values. Transfer of plant electrical buses from a “normal” transformer to a “reserve” transformer is performed in each division separately so it is not possible to calculate the “global” value for transfer failure, since failures or electrical components are mixed with the failures of the non-electrical components in the divisions. Failure probability of house-load operation is 1.43E-1.
2.3. Main modelling assumptions
• What are the main modelling features of diesel generators, gas turbines/other possible sources, the electrical bus bars:
1. types of failure modes and level of details (i.e. if the detail of modelling enables identification of interesting insights, e.g. dependencies) Diesel generator: failure to run: during first 2 hours, between 2 and 24 hours, up to72 hours failure to start failure to connect unavailability due to maintenance or repair failure of support systems (service water, load sequencer, DC power supply)

NEA/CSNI/R(2017)5
108
Bus bars: failure of the bus bar during the given mission time unavailability due to maintenance or repair
2. CCF, CCFs between diesel generators are considered for DG failure modes (except unavailability due to maintenance and repair).
3. mission time, 24 hours (2+22) or 72 hours (only for SFP and certain POSes),
• Was some guidance used for LOOP introduction/modelling in the PSA? General methodologies for FT/ET modelling were used. NUREG/CR-6890, Vol. 1, Reevaluation of Station Blackout Risk at Nuclear Power Plants, Analysis of Loss of Off-site Power Events: 1986-2004, Idaho National Laboratory, 12/2005 was used for off-site power recovery probabilities determination.
2.4. Results All the following information, if available, is of interest:
• Risk metrics considered (e.g. Core Damage Frequency (CDF), Large Release Frequency (LRF) along with a definition of the associated metric (i.e. how are CDF and/or LRF defined for your PSA…). Core damage in reactor (CDF) This top event is in Dukovany NPP Level 1 PSA defined by exceeding core cladding temperature of 1200°C. Core damage in reactor or spent fuel damage in SFP (FDF) This top event is in Dukovany NPP Level 1 PSA defined by exceeding core cladding or fuel cladding temperature of 1200°C. It is a sum of the risk from the reactor core and SFP. Large early release (LERF) Standard criteria for acceptance of this event in level 2 PSA of NPP Dukovany is exceeding of limit values for early release of more than 10% of 131I. The term „early” is perceived as event before reactor vessel bottom head failure and up to 2 hours after it.
• Risk contributions - total frequency for loss of electrical sources and contribution to overall CDF
and LRF for each radiological sources addressed in PSA See the next table.
- by initiating event (especially if external hazards are treated separately) Category Description CDF [1/year] FDF
[1/year] LERF [1/year]
LOOP Loss off off-site power 6,4E-7 6,4E-7 1,7E-7 T5 Loss of 400 kV line or loss of power from 110 kV switchyard 8,7E-8 8,7E-8 2,5E-8 T6 Failure of operational switchyard (non-safety or safety bus bar) 1,49E-6 1,53E-6 1,4E-7 Sum 2,22E-6 2,26E-6 3,35E-7
Category Sub-
category Description Average frequency
[1/year] Contribution to overall CDF FDF LERF
LOOP T5.1 Loss of off-site power from main switchyard Slavětice (both 400kV line and one 110kV line failure)
4,76E-2 6,1% 4,4% 8,6%
T5.2 Total LOOP (failure of all switchyard in the area – no line available)
5,24E-2
T5 T5.5 Failure of 400kV line to main switchyard Slavětice (expect full power operation)
3,00E-1 08% 06% 13%
T5.51 Failure of 400kV line to main switchyard Slavětice at full power operation – house-load operation available
1,50E-1
T5.52 Failure of switchyard 400kV at full power operation – house-load operation unavailable
1,50E-1
T5.6 Failure of 110kV connection at plant 167E-2

NEA/CSNI/R(2017)5
109
Note: All numbers are valid at the end of the year 2013. Note: Frequency of each IE sub-category is averaged per calendar year (it is not specific to POS). This frequency is then multiplied in each POS by the respective POS duration fraction. Note: Results are given for all sequences that lead to core/SFP damage (i.e. they include also non-blackout sequences).
- by plant operational state (POS) Current PSA outputs are not calculated specifically in each POS but we are able to determine IE specific results for LOOP and similar IEs in each POS if necessary.
• Main sequences CDF = 3.10E-7/year LOOP at full power, failure of house-load operation, successful reactor shutdown, blackout, successful short-time cooling by steam dump to atmosphere, failure of off-site power recovery or connection to the remaining units, failure of steam generators makeup by fire-fighters pumps. CDF = 1.47E-7/year LOOP at full power, failure of house-load operation, successful reactor shutdown, blackout, failure of short-time cooling by steam dump to atmosphere resulting in LOCA via MCP seals, failure of off-site power recovery or connection to the remaining units, failure of high pressure emergency pumps during recirculation.
• Main contributions (importance measures for systems, support systems (i.e. I&C), component failures, human actions, …) Importance measures were analysed only for total FDF (all IEs in all POSes). We haven’t performed separate importance analysis only for loss of electrical sources IEs group but we are able to determine them if necessary.
• Main sources of uncertainty and the results of uncertainty analysis, if performed Presumption of 24 hours successful turbine running during house turbine operation for successful (OK) state achievement.
3. Insights as regard to safety: Safety improvements already implemented or planned (in particular in the post-Fukushima framework) (These insights are considered as particularly interesting for the potential users of the report) For each example:
• Description and purpose of the safety improvement: design, operation (procedures, Tech Specs), input to SAM guidelines….
- See below • Status of improvement (planned or implemented)
- Modification related to LOOP: Implemented: New procedure for monitoring of important parameters in
control room during long-term SBO (2013) Specific EOP procedures for SBO both at full power and shutdown states (earlier)
Alternative SG makeup by fire-fighters pumps (earlier) Prepared: Alternative mobile energy sources (transportable DG´s, two for
site, power 300 kW) (up to 2015) New AAC DG´s (one for twin unit) (up to 2015)
• Risk impact
T6 T6.1 Failure of non-safety bus bar 300E-1 14% 10% 71% T6.2 Failure of safety 6kV bus bar 286E-3 T6.3 Failure of safety 0.4kV bus bar 172E-2

NEA/CSNI/R(2017)5
110
Implementation of the new procedure for monitoring of important parameters in control room during long-term SBO led to app. 6% decrease of CDF for internal IEs and to app. 21% decrease of CDF for external IEs. The impact of the proposed modifications is being evaluated this year.
• Role of PSA in the decision making. Recommendation to enhance plant safety (including prevention of black-out scenarios) was proposed in the frame of Living PSA project. PSA for is used for the evaluation of proposed modification to provide feedback.
4. Insights with respect to PSA (methods and data) (Please indicate particular methods and data issues/problems related to the loss of electrical sources and how these issues were addressed (or indicate if these issues are still being evaluated). Specific examples of good practices will be particularly useful) Possible issues:
• Completeness • HRA • Data on event frequencies • CCFs and dependencies • Recoveries • Support calculations • Sequence duration. Mission time.
It is not clear when and how to model accident sequences up to 72 hours. We are going to start to solve this issue in more detail this year.
• Adverse effects of grid disturbances on on-site power systems • Multi-unit events
Selectivity assumptions/modelling

NEA/CSNI/R(2017)5
111
CZECH REPUBLIC (2)
QUESTIONNAIRE Identification Please identify your organisation: Name: ČEZ a.s. Country: Czech Republic Address: Temelin 2/1444 373 05 NPP Temelin, Czech Republic Contact person: Ondrej Mlady Telephone/e-mail: [email protected] Are you - A Regulatory Body � - A Supporting Organisation to a Regulatory Body � - A Utility - A Vendor � - A Consultant � - Other � 1. General plant and electrical supplies information
a) General • Plant type: PWR (VVER 1000), two Units plant • Electrical power [MWe]: 2 × 1050 MWe (following units power uprate)
b) Electrical supplies • Grid connection
- Number of independent feeders into switchyard (No. and types of grid connections)
The Temelin two 1000 MWe Units plant is connected to the Czech electric power distribution grid via two networks: the 400 kV grid and the back-up 110 kV grid. There are separate 440 kV and 110 kV lines for each unit. The 400 kV grid connections is the load for the main generator and the 110 kV grid are used to provide a back-up source of power supply in case of 400 kV grid/switchyard failures and source of startup and shutdown power (400 kV lines/switchyard maintenance). The plant is connected to these grids at the station switchyard Kocin, which is located about 3 km south of the plant site. If the 400 kV transmission line is available, power is supplied either from the main generator (during unit power operation) or from 400 kV line and unit main transformer 1AT to two-unit auxiliary transformers, 1BT1 and 1BT2. Auxiliary transformers convert power from 24 kV to 6.3 kV. Auxiliary transformers supply power to four non-safety grade buses, two of them each through a single circuit breaker. Buses 1BA, 1BB, 1BC and 1BD are the 6.3 kV non-safety buses. When the 400 kV transmission line is not available, power is supplied to the 6.3 kV non-safety grade buses from 110 kV back-up line (through station reserve transformers 7BT1 and 7BT2 at Unit 1 or 8BT1 and 8BT2 at Unit 2. This reserve supplying can be backed up by further 110 kV line and associated transformers serving buses on Temelin Unit 2 and vice versa.
- Alternate/independent ac grid sources that might be available (e.g. stand-by gas
turbines)

NEA/CSNI/R(2017)5
112
There are three sets of emergency diesel generators at the Temelin plant: 3 safety grade EDGs supplying each of three safety grade buses 2 back-up EDGs, common for both units which can be cross-tied to supply each
unit at the site 2 SBO EDGs, each per unit, being capable to supply any of the units and any of
the unit safety grade 6 kV buses. In case of plant SBO each Unit turbine generator can operate at reduced power
levels (at house load), in so-called island mode of operation, supplying house loads of either unit at the site without being connected to the grid.
In case of unit three EDGs failure + two common back-up EDGs failure, there is possibility to supply safety grade buses form other unit EDGs at the site
In case of plant SBO, the grid can be restored and supplied from hydro plant at the Lipno dam which is capable to run up in case of external grid blackout
• Designed for house turbine operation, island operation (e.g. the main generator can supply house loads without reliance on or connection to the main switchyard) Each Unit turbine generator can operate at reduced power levels (at house load), in so-called island mode of operation, supplying house loads of either unit at the site without being connected to the main 400 or back-up 110 kV switchyards. In case of LOOP at both units at the site, one unit can be cross-connected to supply other unit at the site.
• Number of EDGs and/or other internal sources (e.g. gas turbines) and capacity There are two sets of emergency diesel generators at the Temelin plant. The first set consists of three safety grade EDGs/unit that provide emergency power to the three safety grade 6.3 kV AC buses. Each EDG is rated for 6.3 MW continuous operation. Fuel is in the 1000 m3 fuel tank (estimated operation time over 48 hrs) with fuel back-up supply by fuel truck. Two non-safety grade back-up EDGs (6.3 MW) shared between Units 1 and 2 supplying specific RCS and secondary systems required for safe shutdown, cooling down and RHR. Each of them can also be cross-connected to any appropriate safety grade bus to provide their back-up supply. Each back-up EDG is capable to supply any or both of the two Units.
• Capacity for cross ties between trains or units Both units (non-safety buses) can be cross-connected via back-up line (110 kV) of any of the unit at the site. In addition, turbine-generator house load mode of operation supplying one or both units (in case of units cross connection) is possible for limited time. Two back-up EDGs, one per unit can be cross-tied to supply either of the unit or both of them. In case of SBO conditions the power supply can be cross-tied to any of the 6 kV safety grade buses on each unit using one out of two SBO DGs (4 MW). The special/different set of equipment (tanks, pumps, valves) is to be supplied to enable additional (in case of SBO conditions) RCS/Spent Fuel Pool coolant and SG feed water supply. Through the SBO power supply grid, recently introduced into the plant design, it is possible to cross tie safety grade EDGs of one unit to the safety grade buses at the other unit at the site.
• Brief description of non-ac dependent decay heat removal systems (e.g. turbine-driven auxiliary feed water, motor driven pumps, natural circulation, etc.) To maintain the electrical and instrumentation components needed for core cooling and decay heat removal following SBO the Category I is used at the plant. This category includes DC buses supplied by safety grade batteries (230V) during a loss of off-site power and 0.4 kV AC buses powered by inverters from associated DC buses. The design does not include equipment such as turbine-driven auxiliary/emergency feed water pumps, natural circulation, etc.
c) Other information if relevant for PSA:

NEA/CSNI/R(2017)5
113
• Transmission system operator and operator requirements • Single or twin turbine/s • Single 1000 MWe turbine per unit • Other
2. PSA information and results For each PSA considered please provide the following information (an example is given in appendix) 2.1. PSA characteristics
• Context and PSA framework (regulatory position) Developed by NUS (Scientech) utility/plant staff, NRI Řež, Several IAEA IPSART/IPERS review missions since 1996
• PSA date (initial, revisions), 1993-1996, 2001-2003, 2014
• PSA scope: Level 1 covering plant internal events internal hazards external hazards for POS: full power low power and shutdown Level 2 covering plant internal events internal hazards external hazards � for POS: full power low power and shutdown � Level 3 covering plant internal events � internal hazards � external hazards � for POS: full power � low power and shutdown � Spent fuel pool � internal hazards � external hazards �
2.2. Initiating event The main initiating event to be considered is a loss of external electrical sources (LOOP).
• Is the LOOP event considered as a single initiating event or are there sub-categories (especially according to the root cause of the event and to the recovery conditions)? Please briefly describe sub-categories if used.
1. Categories: short loop, long loop, induced loop by other transients? There are two events considered under this LOOP IE group. The loss of both external 400 and back-up 110 kV distribution grid lines and Loss of 400 kV line. While the first leads to a requirement for the reactor power runback and TG runback to the house load, the latter differs compared to LOOP event by availability of back-up operational supply from 110 kV switchyard. There is no differentiation between long-term and short-term LOOP conditions.
2. How is recovery considered? With one or several recovery times and laws/rules? (e.g. with fixed given mission times for the systems, or with a recovery law /rule versus time)? Do recovery model and recovery probabilities differentiate according to the causes of the initiating event(s)? There are several recovery actions in the model as follows: First recovery action is considered before core damage occurs (i.e. within 1 hour following IE), the second recovery action is considered before containment failure occurs (10 hours following initiator). The recovery models do not depend on the cause of initiating event. They are modelled as simple basic events under an event tree heading.
3. What are the corresponding frequencies? This question covers several points: The frequency of each sub-category
Loss of Off-Site Power 4.6E-002/year Loss of 400 kV switchyard 3.0E-001/year
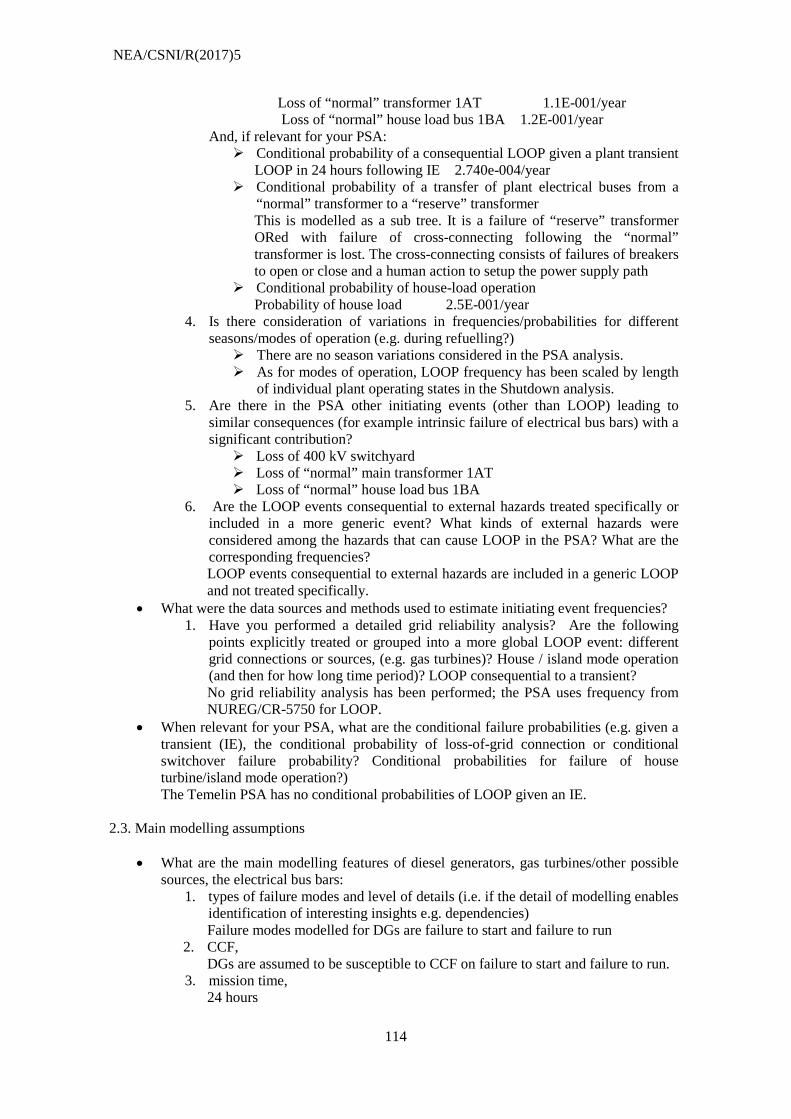
NEA/CSNI/R(2017)5
114
Loss of “normal” transformer 1AT 1.1E-001/year Loss of “normal” house load bus 1BA 1.2E-001/year
And, if relevant for your PSA: Conditional probability of a consequential LOOP given a plant transient
LOOP in 24 hours following IE 2.740e-004/year Conditional probability of a transfer of plant electrical buses from a
“normal” transformer to a “reserve” transformer This is modelled as a sub tree. It is a failure of “reserve” transformer ORed with failure of cross-connecting following the “normal” transformer is lost. The cross-connecting consists of failures of breakers to open or close and a human action to setup the power supply path
Conditional probability of house-load operation Probability of house load 2.5E-001/year
4. Is there consideration of variations in frequencies/probabilities for different seasons/modes of operation (e.g. during refuelling?) There are no season variations considered in the PSA analysis. As for modes of operation, LOOP frequency has been scaled by length
of individual plant operating states in the Shutdown analysis. 5. Are there in the PSA other initiating events (other than LOOP) leading to
similar consequences (for example intrinsic failure of electrical bus bars) with a significant contribution? Loss of 400 kV switchyard Loss of “normal” main transformer 1AT Loss of “normal” house load bus 1BA
6. Are the LOOP events consequential to external hazards treated specifically or included in a more generic event? What kinds of external hazards were considered among the hazards that can cause LOOP in the PSA? What are the corresponding frequencies? LOOP events consequential to external hazards are included in a generic LOOP and not treated specifically.
• What were the data sources and methods used to estimate initiating event frequencies? 1. Have you performed a detailed grid reliability analysis? Are the following
points explicitly treated or grouped into a more global LOOP event: different grid connections or sources, (e.g. gas turbines)? House / island mode operation (and then for how long time period)? LOOP consequential to a transient? No grid reliability analysis has been performed; the PSA uses frequency from NUREG/CR-5750 for LOOP.
• When relevant for your PSA, what are the conditional failure probabilities (e.g. given a transient (IE), the conditional probability of loss-of-grid connection or conditional switchover failure probability? Conditional probabilities for failure of house turbine/island mode operation?) The Temelin PSA has no conditional probabilities of LOOP given an IE.
2.3. Main modelling assumptions
• What are the main modelling features of diesel generators, gas turbines/other possible sources, the electrical bus bars:
1. types of failure modes and level of details (i.e. if the detail of modelling enables identification of interesting insights e.g. dependencies) Failure modes modelled for DGs are failure to start and failure to run
2. CCF, DGs are assumed to be susceptible to CCF on failure to start and failure to run.
3. mission time, 24 hours

NEA/CSNI/R(2017)5
115
• Was some guidance used for LOOP introduction/modelling in the PSA? Plant general abnormal, emergency operating procedures and SAMGs. Site-specific grid reliability analysis
2.4. Results All the following information, if available, is of interest:
• Risk metrics considered (e.g. Core Damage Frequency (CDF), Large Release Frequency (LRF) along with a definition of the associated metric (i.e. how are CDF and/or LRF defined for your PSA…). CDF – Core Damage Frequency – the frequency of damage to a reactor core sufficient to lead to a release of radioactive material from the core that could affect public health. LERF – Large early Release Frequency – LERF is defined as fission product fraction released early (i.e. within several hours after accident initiator have occurred) through large opening in the containment to the environment. The STCs contributing to LERF are defined in the Level 2 PSA analysis.
• Risk contributions - total frequency for loss of electrical sources and contribution to overall CDF
and LRF for each radiological sources addressed in PSA - by initiating event (especially if external hazards are treated separately) - by plant operational state (POS)
• Main sequences • Main contributions (importance measures for systems, support systems (i.e. I&C),
component failures, human actions, …) • Main sources of uncertainty and the results of uncertainty analysis, if performed
3. Insights as regard to safety: Safety improvements already implemented or planned (in particular in the post-Fukushima framework) (These insights are considered as particularly interesting for the potential users of the report) For each example:
• Description and purpose of the safety improvement: design, operation (procedures, Tech Specs), input to SAM guidelines….
There has been two remote SBO DGs newly introduced into the design at the Temelin plant (one for each unit). These DGs are designed to provide power in special emergency cases as for plant SBO conditions. Each of the two DG can be manually connected to any of the safety grade buses at both Units of the plant. The associated SBO plant network enables also cross tie between safety grade buses of individual site units.
• Status of improvement (planned or implemented) • Currently being implemented
2x SBO DG capable to supply any safety grad 6kV bus at any unit at the site Power supply recovery from Lipno dam water station Removable DGs
• Risk impact. It will be known definitely following incorporation of final design/procedure improvements into the model.
• Under development withinregular PSA model update procedure. Yes, ongoing. • Role of PSA in the decision making.

NEA/CSNI/R(2017)5
116
4. Insights with respect to PSA (methods and data) (Please indicate particular methods and data issues/problems related to the loss of electrical sources and how these issues were addressed (or indicate if these issues are still being evaluated). Specific examples of good practices will be particularly useful) Possible issues:
• Completeness • HRA • Data on event frequencies • CCFs and dependencies • Recoveries • Support calculations • Sequence duration. Mission time. • Adverse effects of grid disturbances on on-site power systems • Multi-unit events • Selectivity assumptions/modelling

NEA/CSNI/R(2017)5
117
FINLAND QUESTIONNAIRE Identification Please identify your organisation: Name: Radiation and Nuclear Safety Authority Country: Finland Address: Laippatie 4 FIN-00880 HELSINKI Contact person: Ilkka Niemelä Telephone/e-mail: +358 9 759 88 361 / [email protected] Are you - A Regulatory Body - A Supporting Organisation to a Regulatory Body � - A Utility � - A Vendor � - A Consultant � - Other � 1. General plant and electrical supplies information Lo1/2 and OL1/2
a) General Loviisa NPP Unit 1 and Unit 2
• Plant type: PWR (VVER-440, Sovjet design) • Electrical power [MWe]: 490 MWe (net)
Olkiluoto NPP Unit 1 and Unit 2 • Plant type: BWR (Swedish design) • Electrical power [MWe]: 880 MWe (net)
b) Electrical supplies • Grid connection
Loviisa NPP Unit 1 and Unit 2 - Number of independent feeders into switchyard (No. and types of grid
connections) - Alternate/independent ac grid sources that might be available (e.g. stand-by
gas turbines) Main grid connection:400 kV and 110kV Auxiliary connection to hydro power plant 20 kV line: requires manual
operations and time Olkiluoto NPP Unit 1 and Unit 2
- Main grid connection:400 kV and 110kV - Auxiliary connection to on-site gas turbine - Additional connection to hydro power plant 20 kV line: requires manual
operations and time • Designed for house turbine operation, island operation (e.g. the main generator can
supply house loads without reliance on or connection to the main switchyard) - Loviisa and Olkiluoto NPPs are both capable of house-load operation
• Number of EDGs and/or other internal sources (e.g. gas turbines) and capacity Loviisa NPP Unit 1 and Unit 2
- 4 EDGs per unit and 1 auxiliary DG (not safety classified), total of 9 DGs at the site
Olkiluoto NPP Unit 1 and Unit 2 - 4 EDGs per unit and 1 on-site gas turbine

NEA/CSNI/R(2017)5
118
• Capacity for cross ties between trains or units - Possibility for EDG cross connection between units in Olkiluoto NPP - Possibility for connection from on-site auxiliary DG common to both units
• Brief description of non-ac dependent decay heat removal systems (e.g. turbine-driven auxiliary feed water, motor driven pumps, natural circulation, etc.)
Loviisa NPP Unit 1 and Unit 2 - diesel-driven auxiliary feed water pumping station 2x100% capacity, common
to both units - natural circulation
2. PSA information and results For each PSA considered please provide the following information (an example is given in appendix) 2.1. PSA characteristics
• Context and PSA framework (regulatory position) PSAs developed in-house (by the licensee) in accordance with STUK requirements
• PSA date (initial, revisions), Initial PSAs (internal events) in 1989 for both Loviisa and Olkiluoto NPPs. Since 1989 several updates, latest in 2014.
• PSA scope: Level 1 covering plant internal events internal hazards external hazards for POS: full power low power and shutdown Level 2 covering plant internal events internal hazards external hazards for POS: full power low power and shutdown
2.2.A Initiating event LO 1&2 The main initiating event to be considered is a loss of external electrical sources (LOOP).
• Is the LOOP event considered as a single initiating event or are there sub-categories (especially according to the root cause of the event and to the recovery conditions)? Please briefly describe sub-categories if used.
1. Categories: short loop, long loop, induced loop by other transients? LOOP is defined as loss of 400 kV and 110 kV for more than 4 hours. Shorter breaks are not modelled. Water in the steam generators will do for 4…5 h, which the unit can survive without electricity. If grid is recovered within this time, the plant can be reconnected, since the capacity of the batteries required for control is 5 hours. If feed to plant automation rectifiers cannot be recovered within 5 hours, one gradually begins to lose the I&C of the whole unit. This makes reconnection to grid difficult, but it still remains possible using local controls in electrical cabinets and switchyard.
2. How is recovery considered? With one or several recovery times and laws/rules? (e.g. with fixed given mission times for the systems, or with a recovery law /rule versus time)? Do recovery model and recovery probabilities differentiate according to the causes of the initiating event(s)? Recovery is included in the initiating event frequency. In addition to grid recovery statistics, recovery includes use of gas turbine and switching to 110 kV. These are modelled with fault trees. The following distribution is presented for frequency vs. the length of the LOOP. Now gas turbine has been replaced with diesel, which probably starts faster.

NEA/CSNI/R(2017)5
119
3. What are the corresponding frequencies? This question covers several points: The frequency of each sub-category And, if relevant for your PSA: Conditional probability of a consequential LOOP given a plant transient Conditional probability of a transfer of plant electrical buses from a
“normal” transformer to a “reserve” transformer Conditional probability of house-load operation
The frequencies for LOOPs of different lengths can be obtained from figure above. However, only 4 hours was used (with 110kV and gas turbine as back-up), which corresponds to 1.61E-3 1/a. This figure includes external hazards and plant transients (see below). Loss of 400 kV occurs at frequency of 5•10-2 /a. When 110 kV is counted as back-up, power is restored to the plant within 3 hours with probability greater than 95%. However, in slightly less than 50% of the cases of loss of 400 kV, 110 kV is available and is automatically or manually connected. In automatic case, there is only a short dip in the house voltage. If the LOOP lasts for more than 3 hours, it is probably caused by rare large-scale phenomena. Included and analysed phenomena are strong winds, downbursts and tornados. A part of the storms causes combined hazards together with algae blocking, frazil ice or heavy snowfall. This part of the frequency is removed from LOOP and analysed in context of the hazards. Thus, the total LOOP frequency is 1.61E-3 1/a, and when combined hazards are subtracted, the frequency of LOOP is 1.11E-3 1/a during power operation.
4. Is there consideration of variations in frequencies/probabilities for different seasons/modes of operation (e.g. during refuelling?) Combined hazards are divided according to winter/summer probabilities.
5. Are there in the PSA other initiating events (other than LOOP) leading to similar consequences (for example intrinsic failure of electrical bus bars) with a significant contribution? The following initiating events are based on short circuit of bus bars: Partial loss of power (PLOP) – loss of one bus bar 3.75E-7 1/h (per hour). Total Loss of Power (TLOP) – loss of diesel-backed bus bars; only during shutdown 1.30E–9 1/h (per hour).
6. Are the LOOP events consequential to external hazards treated specifically or included in a more generic event? What kinds of external hazards were

NEA/CSNI/R(2017)5
120
considered among the hazards that can cause LOOP in the PSA? What are the corresponding frequencies? External hazards and combination phenomena are in most case treated specifically. Wind > 28 m/s, LOOP 1–4 h 3.2E-3 Wind > 39 m/s, LOOP > 4h 9.6E–4, including tornados and downbursts 5.7E–5 /a. Lightning – included in normal LOOP Wind > 39 m/s and algae blockage 1.8E-4/a. Wind > 28 m/s, frazil ice blockage and LOOP 1-4 h 1.4E-4/a. Wind > 39 m/s, frazil ice blockage and LOOP > 4 h 1.2E-5/a Heavy snowfall and wind > 28 m/s 9.5E-4/a. Heavy snowfall and wind > 39 m/s 2.7E-4/a. Heavy snowfall and wind > 45 m/s 7E–7/a. Frazil ice blockage, heavy snowfall and wind > 28 m/s 7.2E-5/a. Frazil ice blockage, heavy snowfall and wind > 39 m/s 5.9E-6/a
• What were the data sources and methods used to estimate initiating event frequencies? Have you performed a detailed grid reliability analysis? Are the following points explicitly treated or grouped into a more global LOOP event: different grid connections or sources, (e.g. gas turbines)? House / island mode operation (and then for how long time period)? LOOP consequential to a transient?
The following tables show contributors to different LOOP events: 400 kV connection lost 1/a Bus bar field short circuit 7.45E-3 Inadvertent trip of bus bar protection 1E-2 400 kV connection to Loviisa failure 1.6E-2 Connection from 400 kV yard to house operation failure 1.12E-4 line fault + failure of switchyard protection 1.34E-4 Failure on switchyard + bus bar protection relay failure 4.32E-3 Failure on switchyard + bus bar breaker failure 5.47E-3 Sum 2.42E-2 110 kV connection lost 1/a House-load transformer fails 2E-2 Internal connection failure to 6 kV 9.02E-4 No feed from line 8.16E-2 Transformer switchyard failure 1.26E-2 Line switchyard failure 1.26E-2 Bus bar failure 1E-2 Sum 1.38E-1 400 and 110 kV connection lost 1/a Major grid disturbance 3.33E-2 Storm 1.85E-2 110 and 400 kV no feed 6.93E-6 400 kV fails + switchover fails 3.14E-4 Sum 5.21E-2 400 kV, 110 kV and gas-turbine connection lost 1/a Major grid disturbance + no feed from GT 1.34E-3 Storm 1.85E-2 400 kV no feed, no voltage on 110 kV yard 4.45E-6 400 kV fails + switchover fails 3.14E-4 Sum 2.01E-2

NEA/CSNI/R(2017)5
121
LOOP (Loss of 110 kV) during shutdown 1/a House-load transformer fails 2E-2 Internal connection failure to 6 kV 9.02E-4 Transformer switchyard failure 1.26E-2 Mian bus bar failure 1E-2 Storm 1.85E-2 No voltage to 110 kV switchyard 4.12E-3 Sum 6.6E-2
• When relevant for your PSA, what are the conditional failure probabilities (e.g. given a
transient (IE), the conditional probability of loss-of-grid connection or conditional switchover failure probability? Conditional probabilities for failure of house turbine/island mode operation?)
2.2.B Initiating event OL1&2 The main initiating event to be considered is a loss of external electrical sources (LOOP).
• Is the LOOP event considered as a single initiating event or are there sub-categories (especially according to the root cause of the event and to the recovery conditions)? Please briefly describe sub-categories if used.
1. Categories: short loop, long loop, induced loop by other transients? There are two LOOP initiators: INT-TE, LOOP where condenser remains available 4.67E-2 1/a INT-TT, loss of condenser followed by very short LOOP 1.32E-3 The following fractions for duration of LOOP:
0-10 min 0.436 10-30 min 0.517 30min-2h 0.0396 over 2h 7.65E-3 over 8h given over 2h 0.96
Different durations are modelled with conditional basic events and boundary conditions in event tree sequences.
The following conditional LOOP probabilities are due to other transients: Major grid disturbance due to SCRAM 1.08-3 LOOP during planned shutting down 2.16E-4
2. How is recovery considered? With one or several recovery times and laws/rules? (e.g. with fixed given mission times for the systems, or with a recovery law /rule versus time)? Do recovery model and recovery probabilities differentiate according to the causes of the initiating event(s)? See above. Conditional house events are used to control availability of batteries etc. depending on the duration of the LOOP. Recovery probabilities are obtained by combining grid simulation models and human performance analysis for selected tasks.
3. What are the corresponding frequencies? This question covers several points: The frequency of each sub-category And, if relevant for your PSA: Conditional probability of a consequential LOOP given a plant transient Conditional probability of a transfer of plant electrical buses from a
“normal” transformer to a “reserve” transformer Conditional probability of house-load operation
See above for frequencies. Below are conditional probabilities for some events: o If 400 kV is lost, conditional probability for failure of house-load
operation is 0.089

NEA/CSNI/R(2017)5
122
o If 400 kV is lost and house-load operation fails, transfer to 110 kV fails with conditional probability 2E-3
4. Is there consideration of variations in frequencies/probabilities for different seasons/modes of operation (e.g. during refuelling?) No, except during shutdown 15 CCIs can cause loss of off-site power as follows:
Loss of 110 kV total 5.18E-04 1/a Loss of 400 kV total 5.18E-04 1/a Loss of 400&110kV total 6.46E-04 1/a
5. Are there in the PSA other initiating events (other than LOOP) leading to
similar consequences (for example intrinsic failure of electrical bus bars) with a significant contribution? The following internal hazards, CCI initiators and external hazards are modelled as separate initiating event leading to LOOP:
IE type and number of IEs Frequency 1/a Weather, lightning, LOOP and loss of two diesels, 2x Sum = 2.8E-7 Weather, lightning, LOOP and loss of one diesel, 4x Sum = 1.32E-6 Fire (1 initiator) 1.57E-5 Weather, LOOP and snowstorm, 3x Sum= 5.7E-5 Weather, LOOP and seawater problems, 2x Sum = 1.7E-6 Seismic, LOOP and internal failures, 12x Sum = 1.86E-6 Missile 1E-4
6. Are the LOOP events consequential to external hazards treated specifically or
included in a more generic event? What kinds of external hazards were considered among the hazards that can cause LOOP in the PSA? What are the corresponding frequencies? See above table
• What were the data sources and methods used to estimate initiating event frequencies? 1. Have you performed a detailed grid reliability analysis? Are the following
points explicitly treated or grouped into a more global LOOP event: different grid connections or sources, (e.g. gas turbines)? House / island mode operation (and then for how long time period)? LOOP consequential to a transient? Grid reliability analysis is based on simulation model, which contains data from component failure models and national grid statistics. The model contains, e.g. the following parts:
Component 1/100a Mean repair time (min)
Repair time distribution
400 kV disconnector 0.1 473 Gamma feeder circuit breaker inadvertent opening 0.3 0.5 Uniform 400 kV feed failures, temporary 0.03 0.5 Uniform Main transformer failures 0.39 900 Gamma Bus bar failures, one bus bar 2.4 152 Gamma

NEA/CSNI/R(2017)5
123
Bus bar protection, inadvertent trip 1 0.5 Uniform 400 kV plant feed failures, temporary 0.86 0.5 Uniform 400 kV plant feed failures, permanent 0.05 473 Gamma House-load transformer failures 2.07 900 Gamma Generator bus bar failures 0.57 900 Gamma Major grid disturbance (also loss of 100 kV) 2.7 45 Gamma 400 kV voltage drop 2 0.5 Uniform Storm on switchyard (also 110 kV) 0.04 1096 Gamma
Below is a diagram of the parts of the connection of one unit to the grid.
• When relevant for your PSA, what are the conditional failure probabilities (e.g. given a transient (IE), the conditional probability of loss-of-grid connection or conditional switchover failure probability? Conditional probabilities for failure of house turbine/island mode operation?)
The following conditional LOOP probabilities are due to other transients: Major grid disturbance due to SCRAM 1.08-3 LOOP during planned shutting down 2.16E-4 If 400 kV is lost, conditional probability for failure of house-load operation is 0.089
2.3A. Main modelling assumptions LO1&2
• What are the main modelling features of diesel generators, gas turbines/other possible sources, the electrical bus bars:
1. types of failure modes and level of details (i.e. if the detail of modelling enables identification of interesting insights, e.g. dependencies) Separate detailed fault tree analysis, whose results are included in figures of previous tables for LO.
2. CCF, 3. mission time,
• Was some guidance used for LOOP introduction/modelling in the PSA?
2.3B. Main modelling assumptions OL1&2 • What are the main modelling features of diesel generators, gas turbines/other possible
sources, the electrical bus bars:

NEA/CSNI/R(2017)5
124
1. types of failure modes and level of details (i.e. if the detail of modelling enables identification of interesting insights, e.g. dependencies)
2. CCF, mission time Bais event and CCF combination basic event probability for diesel failure to start and run for 24 hours : 1 diesel 2.60E-2 2 diesels 6.20E-4 3 diesels 5.91E-5 4 diesels 4.72E-5
• Was some guidance used for LOOP introduction/modelling in the PSA?
2.4. Results All the following information, if available, is of interest:
• Risk metrics considered (e.g. Core Damage Frequency (CDF), Large Release Frequency (LRF) along with a definition of the associated metric (i.e. how are CDF and/or LRF defined for your PSA…). Core Damage (damage of tens of fuel bundles)
- Peak cladding temperature of approx. 1200ºC (LOCA), triggers rapid zirconium-water reaction
- Core uncovery to the top of the core or over pressurisation (shutdown PSA)
Large release - 100 TBq of Cs-137 release (Based on Finnish legislation and Regulatory
Guides) - “Early release” not defined
LOVIISA NPP OLKILUOTO NPP CDF (1/a) LRF (1/a) CDF (1/a) LRF (1/a) Power operation 1.44E-05 4.02E-06 9.45E-06 3.38E-06 Low power & Shutdown 1.54E-05 9.66E-06 4.32E-06 1.23E-06 Total 3.0E-05 1.4E-05 1.4E-05 3.5E-06
• Risk contributions
- total frequency for loss of electrical sources and contribution to overall CDF and LRF for each radiological sources addressed in PSA
- by initiating event (especially if external hazards are treated separately) - by plant operational state (POS)
OLKILUOTO 1 and 2 NPP
Initiating event IEF CDF contribution to total CDF
Power States LOOP hazards-LOOP
4.67E-02 *
2.30E-06 7.65E-06
16.4% 5.5%
Low Power & Shutdown IEs (LP&S) LOOP
**
4.51E-09
0.03%
* several internal & external hazard IEs (fires, floods, weather etc.) ** several IEs in various POSs
Main sequences: power states
#1 LOOP - failure to start auxiliary feed water system (high pressure injection) - successful depressurisation of primary circuit (to enable low pressure injection) - failure to start low pressure injection system • failure to restart main feed water system
#2 LOOP - failure to start auxiliary feed water system (high pressure injection) - successful depressurisation of the primary circuit - successful start of low pressure injection system - failure to restart main feed water system in 8 hours - failure of RHR (condensation pool and primary circuit cooling)
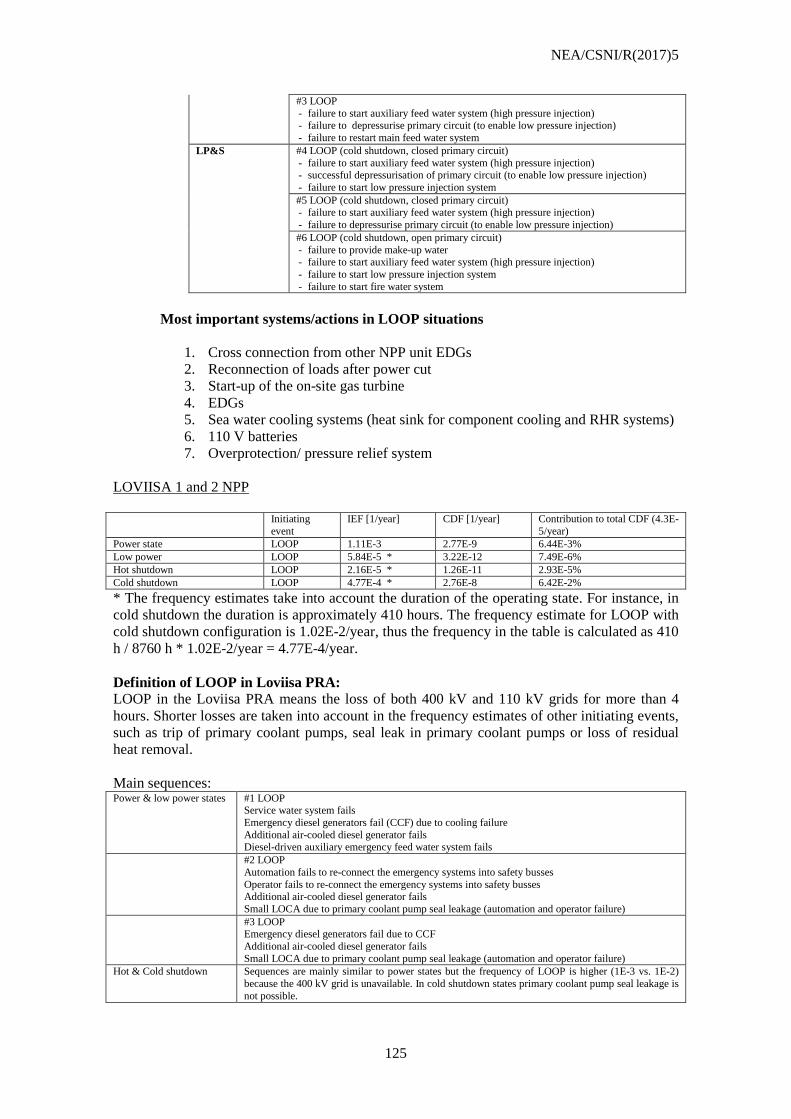
NEA/CSNI/R(2017)5
125
#3 LOOP - failure to start auxiliary feed water system (high pressure injection) - failure to depressurise primary circuit (to enable low pressure injection) - failure to restart main feed water system
LP&S #4 LOOP (cold shutdown, closed primary circuit) - failure to start auxiliary feed water system (high pressure injection) - successful depressurisation of primary circuit (to enable low pressure injection) - failure to start low pressure injection system
#5 LOOP (cold shutdown, closed primary circuit) - failure to start auxiliary feed water system (high pressure injection) - failure to depressurise primary circuit (to enable low pressure injection)
#6 LOOP (cold shutdown, open primary circuit) - failure to provide make-up water - failure to start auxiliary feed water system (high pressure injection) - failure to start low pressure injection system - failure to start fire water system
Most important systems/actions in LOOP situations
1. Cross connection from other NPP unit EDGs 2. Reconnection of loads after power cut 3. Start-up of the on-site gas turbine 4. EDGs 5. Sea water cooling systems (heat sink for component cooling and RHR systems) 6. 110 V batteries 7. Overprotection/ pressure relief system
LOVIISA 1 and 2 NPP Initiating
event IEF [1/year] CDF [1/year] Contribution to total CDF (4.3E-
5/year) Power state LOOP 1.11E-3 2.77E-9 6.44E-3% Low power LOOP 5.84E-5 * 3.22E-12 7.49E-6% Hot shutdown LOOP 2.16E-5 * 1.26E-11 2.93E-5% Cold shutdown LOOP 4.77E-4 * 2.76E-8 6.42E-2% * The frequency estimates take into account the duration of the operating state. For instance, in cold shutdown the duration is approximately 410 hours. The frequency estimate for LOOP with cold shutdown configuration is 1.02E-2/year, thus the frequency in the table is calculated as 410 h / 8760 h * 1.02E-2/year = 4.77E-4/year. Definition of LOOP in Loviisa PRA: LOOP in the Loviisa PRA means the loss of both 400 kV and 110 kV grids for more than 4 hours. Shorter losses are taken into account in the frequency estimates of other initiating events, such as trip of primary coolant pumps, seal leak in primary coolant pumps or loss of residual heat removal. Main sequences: Power & low power states #1 LOOP
Service water system fails Emergency diesel generators fail (CCF) due to cooling failure Additional air-cooled diesel generator fails Diesel-driven auxiliary emergency feed water system fails
#2 LOOP Automation fails to re-connect the emergency systems into safety busses Operator fails to re-connect the emergency systems into safety busses Additional air-cooled diesel generator fails Small LOCA due to primary coolant pump seal leakage (automation and operator failure)
#3 LOOP Emergency diesel generators fail due to CCF Additional air-cooled diesel generator fails Small LOCA due to primary coolant pump seal leakage (automation and operator failure)
Hot & Cold shutdown Sequences are mainly similar to power states but the frequency of LOOP is higher (1E-3 vs. 1E-2) because the 400 kV grid is unavailable. In cold shutdown states primary coolant pump seal leakage is not possible.

NEA/CSNI/R(2017)5
126
Most important systems/actions in LOOP situations (Power operation): 1. Service water system 2. Diesel-driven auxiliary emergency feed water system 3. Additional air-cooled diesel generator 4. Emergency bus reconnection automation 5. Operator action to recover service water valve positions 6. Primary coolant pump seals 7. Emergency diesel generators
3. Insights as regard to safety: Safety improvements already implemented or planned (in particular in the post-Fukushima framework) (These insights are considered as particularly interesting for the potential users of the report) For each example:
• Description and purpose of the safety improvement: design, operation (procedures, Tech Specs), input to SAM guidelines….
• Status of improvement (planned or implemented) • Risk impact • Role of PSA in the decision making. Design issues considering loss of electrical power and loss of ultimate heat sink The systems needed for residual heat removal from the reactor, containment and fuel pools require external power at Finnish NPPs, where the ultimate heat sink is the sea. Depending on the design features of the plant, the time margins to withstand station blackout and loss of ultimate heat sink vary. A reliable supply of electrical power to the systems providing for basic safety functions at the Finnish NPPs is ensured by the defence-in-depth concept. As a result of multiple and diversified electrical power sources at different levels, the probability of loss of all electrical supply systems is considered very low at the Finnish NPPs. However, as a result of the studies made after the TEPCO Fukushima Daiichi accident, further changes are expected to be implemented. Main changes are aimed at decreasing the dependency on plant’s normal electricity supply and distribution systems as well as on the sea water cooled systems for residual heat removal from the reactor, containment and spent fuel pools. Issue 1: Alternate cooling and heat sink Both licensees are investigating their cooling water reserves at site. They should take into account the situations where all plants in same site are in emergency including spent fuel pools. The experiences from the TEPCO Fukushima Daiichi NPP accident were taken into consideration in the renewal of the legislation and Finnish Regulatory Guides (YVL Guides). The new regulatory guides were published in January 2013. They include new requirements concerning defence-in-depth level 3b which aims at managing design extension conditions (DEC). DEC C category includes rare and extreme external hazards. There is a requirement that decay heat removal from the reactor and the containment and sufficient cooling of the fuel in fuel storages shall be possible also in rare and extreme conditions (DEC C) for certain period of time without material replenishment (especially diesel fuel and emergency cooling water reserve) or need to charge batteries. Additionally, decay heat removal shall be possible for 72 hours. The modifications related to residual heat removal systems are reviewed taking into account this requirement on the protected autonomous systems. VVER units:

NEA/CSNI/R(2017)5
127
At the VVER units, the availability of an alternate heat sink depends on the plant state and feed water availability. If primary circuit can be pressurised (i.e. reactor vessel head is in place), atmosphere can be used as an alternate heat sink as long as there is enough water available for dumping steam into atmosphere from the secondary circuit. There is separated diesel-driven auxiliary emergency feed water system with two pumps which feeds water to the steam generators in case of loss of AC power. It is also possible to transfer heat to spent fuel cooling system and hence to intermediate cooling system, giving time for restoring ultimate heat sink. A plant modification will be finished in 2014 to ensure the decay heat removal in case of loss of seawater by implementing an alternative ultimate heat sink. The modification consists of two air-cooled cooling units per plant unit powered by an air-cooled diesel generator. The other cooling unit would remove decay heat from the reactor and the other one ensures the decay heat removal from in-containment spent fuel pool and from the spent fuel storage pools. The cooling unit is connected to the intermediate cooling circuit, and it backs up the seawater cooled heat exchangers. The modifications in consideration would create a possibility to closed-loop operation also in case of loss of ultimate heat sink. In addition, the licensee has evaluated measures needed to secure the availability of the auxiliary emergency feed water system in the case of loss of electrical power, water supply for the diesel-driven auxiliary emergency feed water pumps, and electricity supply for instrumentation needed in accidents. The necessary modifications have been realised, with the exception of improving the instrumentation during the coming years. BWR units: At the BWR units, sea water is the primary ultimate heat sink and an alternative heat sink exists only partially. Both units can evaporate residual heat from the reactor core to atmosphere by conducting the steam produced inside the reactor pressure vessel to the condensation pool through the safety relief valves, by letting the condensation pool to boil, and by venting the steam from the containment to atmosphere through the filtered venting system. However, the systems required to pump water into the reactor pressure vessel are either dependent on the sea water based component cooling systems or on the condensation pool water, which means that the complete loss of sea water as the ultimate heat sink will eventually prevent the supply of water to the reactor pressure vessel. Licensee is planning plant modifications on the current residual heat removal chain to decrease the dependence on the sea water cooling. A modification in the auxiliary feed water system is planned to enable cooling of the components by demineralised water in addition to sea water based cooling chain. By this modification system can remain operational for a significant period of time even during the loss of the primary ultimate heat sink (sea water). In addition, an independent way of pumping water to the reactor pressure vessel is being planned by the licensee in case of loss of AC power. EPR unit: At the EPR unit, the ultimate heat sink is the sea. In case of the total loss of the availability of sea water for cooling, the residual heat from the reactor core would be released to the atmosphere via the steam generators. During refuelling outage the containment filtered venting could be used. The spent fuel pools could be cooled by evaporation. The licensee has assessed possibilities to implement external feed water connections to the steam generator secondary side, connections to external AC power supply and external
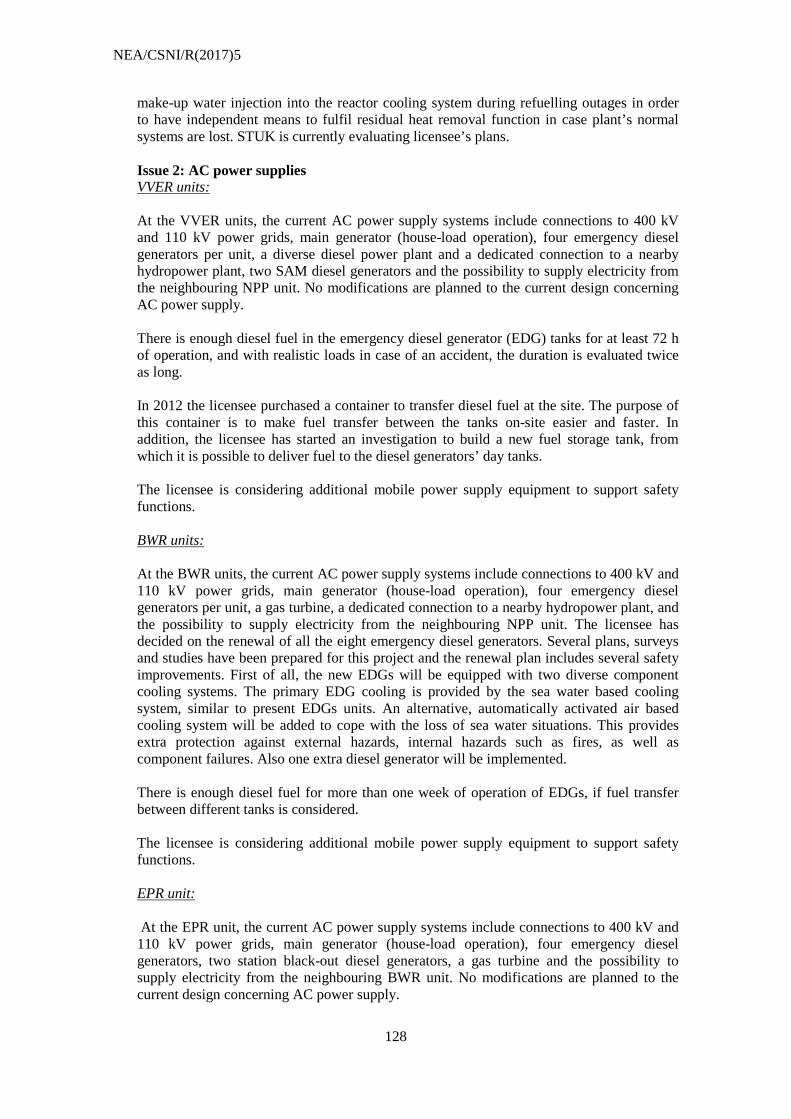
NEA/CSNI/R(2017)5
128
make-up water injection into the reactor cooling system during refuelling outages in order to have independent means to fulfil residual heat removal function in case plant’s normal systems are lost. STUK is currently evaluating licensee’s plans. Issue 2: AC power supplies VVER units: At the VVER units, the current AC power supply systems include connections to 400 kV and 110 kV power grids, main generator (house-load operation), four emergency diesel generators per unit, a diverse diesel power plant and a dedicated connection to a nearby hydropower plant, two SAM diesel generators and the possibility to supply electricity from the neighbouring NPP unit. No modifications are planned to the current design concerning AC power supply. There is enough diesel fuel in the emergency diesel generator (EDG) tanks for at least 72 h of operation, and with realistic loads in case of an accident, the duration is evaluated twice as long. In 2012 the licensee purchased a container to transfer diesel fuel at the site. The purpose of this container is to make fuel transfer between the tanks on-site easier and faster. In addition, the licensee has started an investigation to build a new fuel storage tank, from which it is possible to deliver fuel to the diesel generators’ day tanks. The licensee is considering additional mobile power supply equipment to support safety functions. BWR units: At the BWR units, the current AC power supply systems include connections to 400 kV and 110 kV power grids, main generator (house-load operation), four emergency diesel generators per unit, a gas turbine, a dedicated connection to a nearby hydropower plant, and the possibility to supply electricity from the neighbouring NPP unit. The licensee has decided on the renewal of all the eight emergency diesel generators. Several plans, surveys and studies have been prepared for this project and the renewal plan includes several safety improvements. First of all, the new EDGs will be equipped with two diverse component cooling systems. The primary EDG cooling is provided by the sea water based cooling system, similar to present EDGs units. An alternative, automatically activated air based cooling system will be added to cope with the loss of sea water situations. This provides extra protection against external hazards, internal hazards such as fires, as well as component failures. Also one extra diesel generator will be implemented. There is enough diesel fuel for more than one week of operation of EDGs, if fuel transfer between different tanks is considered. The licensee is considering additional mobile power supply equipment to support safety functions. EPR unit: At the EPR unit, the current AC power supply systems include connections to 400 kV and 110 kV power grids, main generator (house-load operation), four emergency diesel generators, two station black-out diesel generators, a gas turbine and the possibility to supply electricity from the neighbouring BWR unit. No modifications are planned to the current design concerning AC power supply.

NEA/CSNI/R(2017)5
129

NEA/CSNI/R(2017)5
130
Issue 3: DC power supplies VVER units: At the VVER units, some DC batteries depletion times are considered to be rather short and the duration of DC power supply is to be enhanced. There is an ongoing automation renewal project in which the depletion time of the batteries will be lengthened substantially. The licensee installed underground cables from the new diesel power plant to the 6.3 kV diesel bus bar, which enhances battery charging possibilities. BWR units: At the BWR units, the depletion times of DC batteries are well above 10 h, in some cases tens of hours. DC batteries supplying the severe accident monitoring systems can be also charged by mobile generators. The licensee is investigating the possibilities for fixed connection points for recharging of all safety important batteries using transportable power generators. EPR unit: At the EPR unit, there are separate and diversified 2 h and 12 h battery-backed power supply systems. The first set of batteries supplies all electrical equipment which require uninterruptible power in the nuclear island and the second set of batteries supplies loads which are important in case of a severe accident. The licensee evaluated that there is no need for upgrading the battery capacity. Severe Accident Management A comprehensive severe accident management (SAM) strategy has been developed and implemented both at VVER and BWR units. Development of the strategies started after the accident in TMI and Chernobyl accidents. These strategies are based on ensuring the containment integrity which is required in the existing national regulations. STUK has reviewed these strategies and has made inspections in all stages of implementation. Severe accidents have been considered in the original design of EPR unit. STUK has reviewed the overall SAM strategy and the approach has been accepted. No changes to this approach are expected based on current knowledge from the TEPCO Fukushima Daiichi accident. As a result of the studies made after the TEPCO Fukushima Daiichi accident, no major changes at the plants are considered necessary. However, licensees are expected to consider all plant stages in the SAM procedures as well as any implications on them possibly arising from simultaneous multi-unit accidents. Risk Impact & Role of PSA in decision making Overall risk impact of all the above mentioned improvements has not been estimated in an accurate way due to design ongoing. Use of full scope PRA is a fixed part of decision making in Finland. Plant modifications shall be evaluated by PRA to support design of those modifications, which have to be approved by STUK. Examples of previous major modifications considering power supply systems Modifications were done in the transformer yard of the VVER units at 1980’s due to postulated transformer fires affecting grid connections (a severe transformer fire occurred in

NEA/CSNI/R(2017)5
131
Finland, but it did not affect power supply to NPPs’). The stand-by auxiliary transformer, as well as generators’ hydrogen cylinders, was re-located away from the main transformers. The main and auxiliary transformers were equipped with fixed extinguishing systems capable to extinguish strong transformer oil fires and to prevent fire spreading to the neighbouring transformers and buildings. Modifications were done in diesel-backed power supply system of the BWR units based on PRA results. The modifications eliminated occurrence of similar incident, which happened later at Forsmark NPP in 2006 (Forsmark had not changed the design). Modifications were done in power supply system of the BWR units after a severe switchgear fire occurred in 1991 causing LOOP for about 7 hours. For example, the units were equipped with two start-up transformers instead of one, electric arc relay protection systems were installed in switchgears (they were implemented also at VVER units) and new generator breakers were installed (the new generator breakers could be opened at full generator power).
4. Insights with respect to PSA (methods and data) (Please indicate particular methods and data issues/problems related to the loss of electrical sources and how these issues were addressed (or indicate if these issues are still being evaluated). Specific examples of good practices will be particularly useful) Possible issues:
• Completeness • HRA • Data on event frequencies • CCFs and dependencies • Recoveries • Support calculations • Sequence duration. Mission time. • Adverse effects of grid disturbances on on-site power systems • Multi-unit events • Selectivity assumptions/modelling
PRA includes Level 1 and Level 2 (Level 3 analysis is not required in Finland), also for internal and external hazards and their important combinations. CCFs of diesel-backed power supply system’s relays are important contributors in the BWR units’ PRA. Diverse relays (2+2 subsystems) are to be installed during modification of the systems, which is ongoing (good practice). Upgrading diesel generators and their additional (diverse) air cooling is presented in the section above. Human error dominates diesel generator unavailability of the VVER units (wrong position of the test switch, based on applied HRA method). Only the EPR unit includes SBO diesel generators. Simulation model for grid disturbances is used to assess behaviour of the grid and LOOP duration. Grid recovery time distribution is applied in BWR units PPRA (good practice). Mission time of diesel generators is 24 hours, despite of the LOOP duration.

NEA/CSNI/R(2017)5
132
FRANCE (1) QUESTIONNAIRE Identification Please identify your organisation: Name: IRSN……………………………………………………………………. Country: FRANCE……………………………………………………………… Address: ………………………………………………………………………….. Contact person: J.M.Lanore……………………………………………………………… Telephone/e-mail: ………………………………………………………………………….. Are you - A Regulatory Body � - A Supporting Organisation to a Regulatory Body - A Utility � - A Vendor � - A Consultant � - Other � 1. General plant and electrical supplies information
a) General • Plant type: Standard French 900 MWe PWR • Electrical power [MWe]: 900 MWe
b) Electrical supplies • Grid connection
- Number of independent feeders into switchyard (No. and types of grid connections)
- Alternate/independent ac grid sources that might be available (e.g. stand-by gas turbines) Main line: 400 kv, Auxiliary line: 225 kv
• Designed for house turbine operation, island operation: House-load operation in case of short loss of main line
• Number of EDGs and/or other internal sources (e.g. gas turbines) and capacity 2 diesel generators/unit + 1 diesel generator/ plant
• Capacity for cross ties between trains or units • Brief description of non-ac dependent decay heat removal systems (e.g. turbine-driven
auxiliary feed water, motor driven pumps, natural circulation, etc.) 1 turbine-driven AFW pump
1 small turbo generator feeding I&C and water injection to primary pumps seals (small test pump)
2. PSA information and results 2.1. PSA characteristics
• PSA framework: developed by EDF as the 900 MWe reference PSA • PSA date : initial 1990, last revision: 2010 • PSA scope:
Level 1 covering plant internal events internal hazards � external hazards � for POS: full power low power and shutdown Level 2 � covering plant internal events � internal hazards � external hazards � for POS: full power � low power and shutdown � Level 3 � covering

NEA/CSNI/R(2017)5
133
plant internal events � internal hazards � external hazards � for POS: full power � low power and shutdown �
2.2. Initiating events • The LOOP initiating event is sub-divided into several sub-categories according to the
recovery possibilities and to the functional consequences. • The main sub-categories are the following:
- Loss of main grid (short) - Loss of main grid (long) - Total loss of external power (short) - Total loss of external power (long) - General grid disturbance
• The recoveries are modelled by an exponential function with a mean recovery time. • The LOOP events cover external grid failures (according to events observed from the
operating experience) and external hazards for which functional consequences are only a LOOP. The external hazards with more functional consequences (earthquake, high winds, …) are treated in specific PSAs.
• Other initiating events corresponding to intrinsic failures of electrical components are included in the PSA. The most important contributor is the common cause failure of 6.6 kV bus bars initiating event. Several other initiating events were analysed (diverse partial failures) but with a low contribution.
• Frequency: see table 1 • The source of data is French experience feedback.
2.3. Main modelling assumptions
• What are the main modelling features of diesel generators, gas turbines/other possible sources, the electrical bus bars (level of detail, types of failure modes, CCF, etc.)? Failure modes of diesel generators are: failure to start, failure to run. CCF between diesel generators are considered for both failure modes.
• What mission time was considered in the PSA? Generally 24 hours, but in order to avoid excessive conservatism, different system mission times (shorter than the classical 24 hours) were used in case of short recovery times: 2 hours and 5 hours.
• Was some guidance used for LOOP introduction/modelling in the PSA? There was no particular guidance, but it can be noted that an independent PSA was carried out by IRSN and is used as a basis for external review and technical discussions aiming to improve the models.
2.4. Results: • CDF, LERF
- CDF for loss of electrical sources : 2.7 10-06/a corresponding to 38% of the total CDF (for internal events)
- by initiating event : see Table 1 - by POS : see Table 1
• Main sequences: see Table 1 • Main contributions (importance measures for systems, support systems (i.e. I&C),
materials, human actions, …

NEA/CSNI/R(2017)5
134
Table 1:
P: Reactor at power S: Reactor shutdown Main sequences at power: Sequence (1): Loss of external power and failure of both diesel generators (or failure of both 6.6 kV bus bars), occurrence of a seal LOCA (60 t/h for each main pump), failure of water make up by failure of the testing pump, no recovery of an electrical source before core uncovery. Sequence (2): Loss of external power and failure of both diesel generators (or failure of both 6.6 kV bus bars), failure of the auxiliary SG feed water by failure of the turbine-driven pump, no recovery of an electrical source before core uncovery. Main sequence during shutdown: Sequence (3): Loss of external power and failure of both diesel generators (or failure of both 6.6 kV bus bars), failure of the operator to perform a water make up (boiling of the primary water leads to core uncovery).
3. Insights as regard to safety: Safety improvements past, planned (in particular in the post-Fukushima framework) (These insights are considered as particularly interesting for the potential users of the report) For each example:
• Description of the safety improvement: design, operation (procedures, Tech Specs) • Risk impact • Role of PSA in the decision making
- Addition of the “LLS” system: at the very beginning of the development of probabilistic and reliability assessments, the contribution of the total loss of electrical power appeared as a dominant contribution. A first safety improvement was the addition of a small turbine generator (LLS) able to supply a part of I&C and a testing pump which could provide cooling to the primary pumps seals and avoid a seal LOCA. The risk benefit (decrease of risk) was not precisely assessed but estimated to about 10-05. The probabilistic aspect was dominant in the decision.
- In case of a total loss of the 2 safety 6.6 kV bus bars (by CCF or by loss of ventilation), plant modifications were introduced for improving the SG feed water and of the RCP seals injection functions. For example in case of a loss of bus bars and supplementary loss of the LLS generator, the testing pump is electrically supplied by another (non-safety) bus bar. The risk benefit is significant. The problem of a CCF of the bus bars was identified by operating experience, but the safety importance was highlighted by the PSA and led to the safety modification.
Initiating event IE frequency [1/a] Core Damage frequency [1/a] Dominant sequence
Loss of main grid (short)
3.5 10-01 P: 3.5 10-01 6.9 10-08 P: 6.9 10-08 S: S:
Loss of main grid (long)
7.4 10-02 P: 5.7 10-02 2.8 10-8 P: 1.9 10-08 (1) (2) S: 1.7 10-2 S: 8.1 10-09 (3)
Total loss of external power (short)
2.1 10-02 P: 2.1 10-02 1.3 10-08 P: 2.6 10-09 S: 9. 10-5 S: 1.0 10-08
Total loss of external power (long)
1.1 10-03 P: 1.1 10-03 4.7 10-8 P: 3.510-08 (1)(2) S: 1.2 10-5 S: 1.2 10-08 (3)
Total loss of 6.6 kV bus bars by DCC
5.8 10-05 P: 5.4 10-05 2.2 10-06 P: 2.1 10-06 (1) (2) S: 3.2 10-06 S: 9.210-08 (3)
General grid disturbance
4.1 10-02 P: 3.9 10-2 7.6 10-8 P: 2.8 10-08 S: 1.5 10-03 S: 4.8 10-08
Total CDF
2.4 10-06
NEA/CSNI/R(2017)5
135
4. Insights with respect to PSA (methods and data) (Please indicate particular issues/problems related to the loss of electrical sources which needed (or are still needing) specific attention. Examples of specific developments will be very interesting) Possible issues:
• Completeness • HRA • CCFs and dependencies • Recoveries • Support calculations • Sequence duration • Multi-unit events • Selectivity assumptions/modelling
Account for external power recovery In order to avoid excessive conservatism, different system mission times (shorter than the classical 24 hours) were used in case of short recovery times: 2 hours and 5 hours. Moreover, in order to take into account an existing delay t between the loss of systems and core damage with a mean recovery time �, a recovery factor of exp(-t/���was introduced. Account for the timing of the diesel failures: The problem is that, after a LOOP, the procedures require to shut down the plant. After a LOOP the total failure of the internal sources (diesel generators) leads to a station blackout (SBO). The SBO can occur immediately after the LOOP (failure upon demand) but also after some delay (failure to run), and in this last case the plant could be partly or completely shut down, with different functional consequences. For a more realistic modelling, several time windows were considered after the LOOP for the occurrence of a SBO, taking into account the corresponding functional consequences. Seal LOCA: In case of loss of RCP seals cooling the assumption is the occurrence of a seal LOCA with 2 possible leak rates: . 5 t/h for each pump (15 t/h) with a conditional probability of 0.8 . 60 t/h for each pump (180 t/h) with a conditional probability of 0.2. These values, assessed by expert judgement, have an important impact on the PSA results

NEA/CSNI/R(2017)5
136
FRANCE (2) QUESTIONNAIRE Identification Please identify your organisation: Name: IRSN……………………………………………………………………. Country: FRANCE……………………………………………………………….. Address: ………………………………………………………………………….. Contact person: J.M.Lanore……………………………………………………………… Telephone/e-mail: ………………………………………………………………………….. Are you - A Regulatory Body � - A Supporting Organisation to a Regulatory Body - A Utility � - A Vendor � - A Consultant � - Other � 1. General plant and electrical supplies information
a) General • Plant type: Standard French 1300 MWe PWR • Electrical power [MWe]: 1300 MWe
b) Electrical supplies • Grid connection
- Number of independent feeders into switchyard (No. and types of grid connections)
- Alternate/independent ac grid sources that might be available (e.g. stand-by gas turbines) Main line: 400 kv, Auxiliary line: 225 kv
• Designed for house turbine operation, island operation: House-load operation in case of short loss of main line
• Number of EDGs and/or other internal sources (e.g. gas turbines) and capacity 2 diesel generators/unit + 1 gas turbine/ plant
• Capacity for cross ties between trains or units • Brief description of non-ac dependent decay heat removal systems (e.g. turbine-driven
auxiliary feed water, motor driven pumps, natural circulation, etc.) 2 turbine-driven AFW pumps 1 small turbo generator feeding I&C devices and water injection to primary pumps seals (small test pump)
2. PSA information and results 2.1. PSA characteristics
• PSA framework: developed by EDF as the 1300 MWe reference PSA • PSA date : initial 1990, last revision: 2011 • PSA scope:
Level 1 covering plant internal events internal hazards � external hazards � for POS: full power low power and shutdown Level 2 � covering plant internal events � internal hazards � external hazards � for POS: full power � low power and shutdown � Level 3 � covering plant internal events � internal hazards � external hazards �

NEA/CSNI/R(2017)5
137
for POS: full power � low power and shutdown � 2.2. Initiating events
• The LOOP initiating event is sub-divided into several sub-categories according to the recovery possibilities and to the functional consequences.
• The main sub-categories are the following: - Loss of main grid (short) - Loss of main grid (long) - Total loss of external power (short) - Total loss of external power (long) - General grid disturbance
• The recoveries are modelled by an exponential function with a mean recovery time. • The LOOP events cover external grid failures (according to events observed from the
operating experience) and external hazards for which functional consequences are only a LOOP. The external hazards with more functional consequences (earthquake, high winds, …) are treated in specific PSAs.
• Other initiating events corresponding to intrinsic failures of electrical components are included in the PSA. The most important contributor is the common cause failure of 6.6 kV bus bars initiating event. Several other initiating events were analysed (diverse partial failures) with a lower contribution.
• Frequency: see table 1 • The source of data is French experience feedback.
2.3. Main modelling assumptions
• What are the main modelling features of diesel generators, gas turbines/other possible sources, the electrical bus bars (level of detail, types of failure modes, CCF, etc.)? Failure modes of diesel generators are: failure to start, failure to run. CCF between diesel generators are considered for both failure modes.
• What mission time was considered in the PSA? Generally 24 hours, but in order to avoid excessive conservatism, different system mission times (shorter than the classical 24 hours) were used in case of short recovery times: 4 hours for the short LOOP.
• Was some guidance used for LOOP introduction/modelling in the PSA? There was no particular guidance, but it can be noted that an independent PSA was carried out by IRSN and is used as a basis for external review and technical discussions aiming to improve the models.
2.4. Results:
• CDF, LERF - CDF for loss of electrical sources : 1.8 10-06/a corresponding to 45% of the
total CDF (for internal events) - by initiating event : see Table 1 - by POS : see Table 1
• Main sequences: see Table 1 • Main contributions (importance measures for systems, support systems (i.e. I&C),
materials, human actions, …

NEA/CSNI/R(2017)5
138
Table 1: Initiating event IE frequency [1/a] Core Damage frequency [1/a] Dominant
sequences Loss of main grid (short)
6.0 10-02 P: 6.0 10-02 2.2 10-09 P: 2.2 10-09
Loss of main grid (long)
7.8 10-02 P: 7.7 10-02 4.5 10-07 P: 3.2 10-07 (1)(2) S: 7.7 10-04 S: 1.3 10-07 (3)
Total loss of external power (short)
4.3 10-03 P: 4.2 10-03 2.4 10-08 P: 1.4 10-08 S: 4.1 10-05 S: 1.0 10-08
Total loss of external power (long)
1.2 10-03 P: 1.2 10-03 5.7 10-07 P: 4.6 10-07 (1)(2) S: 1.2 10-05 S: 1.1 10-07 (3)
Total loss of 6.6 kV bus bars by DCC
9.2 10-6 P: 8.8 10-06 1.4 10-07 P: 8.4 10-08 (1) (2) S: 3.3 10-07 S: 5.3 10-08 (3)
Loss of one bus bar 9.6 10-3 S: 9.6 10-03 1.8 10-07 S: 1.8 10-07 General grid disturbance
4.3 10-02 P: 4.2 10-02 1.7 10-07 P: 1.1 10-07 S: 5.5 10-04 S: 5.7 10-08
Total CDF
1.8 10-06
P: Reactor at power S: Reactor shutdown Main sequences at power: Sequence (1): Loss of external power and failure of both diesel generators (or failure of both 6.6 kV bus bars), occurrence of a seal LOCA (60 t/h per pump) due to a failure of the LLS system or of the testing pump, no recovery of an electrical source before core uncovery. Sequence (2): Loss of external power and failure of both diesel generators (or failure of both 6.6 kV bus bars), failure of the auxiliary SG feed water by failure of the turbine-driven pumps, no recovery of an electrical source before core uncovery. Main sequence during shutdown: Sequence (3): during plant shutdown (primary circuit partially opened) loss of external power and failure of both diesel generators (or failure of both 6.6 kV bus bars), no recovery of an electrical source before core uncovery. 3. Insights as regard to safety: Safety improvements past, planned (in particular in the post-Fukushima framework) (These insights are considered as particularly interesting for the potential users of the report) For each example:
• Description of the safety improvement: design, operation (procedures, Tech Specs) • Risk impact • Role of PSA in the decision making
1. Addition of the “LLS” system: at the very beginning of the development of probabilistic and reliability assessments, the contribution of the total loss of electrical power appeared as a dominant contribution. A first safety improvement was the addition of a small turbine generator (LLS) able to supply a part of I&C and a testing pump which could provide cooling to the primary pumps seals and avoid a seal LOCA. The risk benefit (risk de crease) was not precisely assessed but estimated to about 10-05. The probabilistic aspect was dominant in the decision.
2. In case of a total loss of the 2 safety 6.6 kV bus bars (by CCF or by loss of ventilation), and supplementary loss of the LLS generator, the testing pump can be electrically supplied by another (non-safety) bus bar. The risk benefit is significant. The problem of a CCF of the bus bars was identified by operating experience, but the safety importance was highlighted by the PSA and led to the safety modification.
3. During the 3rd Periodic Safety Review, in the “internal events” level 1 PSA, the high contribution of the loss of electrical power led to the study of

NEA/CSNI/R(2017)5
139
modifications aiming to improve the tightness of primary pumps seals function and to improve the operation of the steam generators feed water turbine pumps.
4. Insights with respect to PSA (methods and data) (Please indicate particular issues/problems related to the loss of electrical sources which needed (or are still needing) specific attention. Examples of specific developments will be very interesting) Possible issues:
• Completeness • HRA • CCFs and dependencies • Recoveries • Support calculations • Sequence duration • Multi-unit events • Selectivity assumptions/modelling
Account for external power recovery In order to avoid excessive conservatism, different system mission times (shorter than the classical 24 hours) were used in case of short recovery times: 4 hours for the short LOOP. Moreover, in order to take into account an existing delay t between the loss of systems and core damage with a mean recovery time �, a recovery factor of exp(-t/���was introduced. Seal LOCA: In case of loss of RCP seals cooling the assumption is the occurrence of a seal LOCA with 2 possible leak rates: . 5 t/h for each pumps (20 t/h) with a conditional probability of 0.8 . 60 t/h for each pumps (240 t/h) with a conditional probability of 0.2. These values, assessed by expert judgement, have an important impact on the PSA results

NEA/CSNI/R(2017)5
140
FRANCE (3) QUESTIONNAIRE Identification Please identify your organisation: Name: IRSN……………………………………………………………………. Country: FRANCE……………………………………………………………… Address: …………………………………………………………………………. Contact person: J.M. Lanore……………………………………………………………… Telephone/e-mail: ………………………………………………………………………….. Are you - A Regulatory Body � - A Supporting Organisation to a Regulatory Body - A Utility � - A Vendor � - A Consultant � - Other � 1. General plant and electrical supplies information
a) General • Plant type: PWR • Electrical power [MWe]: 1630 MWe
b) Electrical supplies • Grid connection
- Number of independent feeders into switchyard (No. and types of grid connections) The external electrical power supply of the EPR plant is provided by two 400kV electrical grids: main grid designed for the normal operating conditions; auxiliary grid in case of “main grid” failure.
- Alternate/independent ac grid sources that might be available (e.g. stand-by gas turbines)
• Designed for house turbine operation, island operation (e.g. the main generator can supply house loads without reliance on or connection to the main switchyard)
Designed for house-load operation in case of loss of 400kV grid. • Number of EDGs and/or other internal sources (e.g. gas turbines) and capacity
Six diesel generators: four main diesels (EDGs) started in case of total loss of external sources (LOOP) and two emergency diesels (SBOs) started in case of LOOP and loss of the four EDGs.
• Capacity for cross ties between trains or units • Brief description of non-ac dependent decay heat removal systems (e.g. turbine-driven
auxiliary feed water, motor driven pumps, natural circulation, etc.)
c) Other information if relevant for PSA: • Transmission system operator and operator requirements • Single or twin turbine/s • Other
2. PSA information and results For each PSA considered please provide the following information (an example is given in appendix) 2.1. PSA characteristics
• Context and PSA framework (regulatory position)
NEA/CSNI/R(2017)5
141
The PSA is included in the EPR Safety Report (FSAR). • PSA date (initial, revisions),
The FSAR 2010 version of the level 1 PSA internal events is an updating of the PSA version provided by EDF and analysed by IRSN in the frame of the construction licence application in (2006). It considers the conclusions of 2006 instruction and the design evolution until 2009.
• PSA scope: Level 1 covering plant internal events internal hazards external hazards for POS: full power low power and shutdown Level 2 covering plant internal events � internal hazards � external hazards � for POS: full power � low power and shutdown � Level 3 covering plant internal events � internal hazards � external hazards � for POS: full power � low power and shutdown � Spent fuel pool � internal hazards � external hazards �
2.2. Initiating event The main initiating event to be considered is a loss of external electrical sources (LOOP).
• Is the LOOP event considered as a single initiating event or are there sub-categories (especially according to the root cause of the event and to the recovery conditions)? Please briefly describe sub-categories if used.
1. Categories: short loop, long loop, induced loop by other transients? Three main categories of events are considered: Loss of main grid: this initiator is defined as loss of the external main power supply only. The auxiliary grid supply is assumed to be potentially available. If the switchover to house-load operation or to auxiliary grid is successful no safety system is needed to cope with this event. Short-term loss of off-site power: this initiator is defined as the total failure of the main and auxiliary grid for a short term. Long-term loss of off-site power: this initiator is defined as the total failure of the main and auxiliary grid for a longer term.
2. How is recovery considered? With one or several recovery times and laws/rules? (e.g. with fixed given mission times for the systems, or with a recovery law /rule versus time)? Do recovery model and recovery probabilities differentiate according to the causes of the initiating event(s)?
The recovery times considered are: • maximal duration for the long LOOP (24 hours) • mean times for short LOOP (2 h).
3. What are the corresponding frequencies? This question covers several points: The frequency of each sub-category:
Loss of main grid: 0.1/r.y Short LOOP (recovery time <2h): 2.09 10-2 /r.y Long LOOP (recovery time < 24h): 1.77 10-3 /r.y.
And, if relevant for your PSA: Conditional probability of a consequential LOOP given a plant transient Conditional probability of a transfer of plant electrical buses from a
“normal” transformer to a “reserve” transformer Conditional probability of house-load operation
4. Is there consideration of variations in frequencies/probabilities for different seasons/modes of operation (e.g. during refuelling?)

NEA/CSNI/R(2017)5
142
Are there in the PSA other initiating events (other than LOOP) leading to similar consequences (for example intrinsic failure of electrical bus bars) with a significant contribution? Other initiating events (total or partial loss of electrical bus bars) were also considered leading to lower contributions.
5. Are the LOOP events consequential to external hazards treated specifically or included in a more generic event? What kinds of external hazards were considered among the hazards that can cause LOOP in the PSA? What are the corresponding frequencies?
• What were the data sources and methods used to estimate initiating event frequencies? The source of data is French experience feedback. There was no detailed grid reliability analysis; • When relevant for your PSA, what are the conditional failure probabilities (e.g. given a
transient (IE), the conditional probability of loss-of-grid connection or conditional switchover failure probability? Conditional probabilities for failure of house turbine/island mode operation?)
2.3. Main modelling assumptions
• What are the main modelling features of diesel generators, gas turbines/other possible sources, the electrical bus bars:
1. types of failure modes and level of details (i.e. if the detail of modelling enables identification of interesting insights e.g. dependencies)
2. CCF, 3. mission time,
The failure modes of the diesel generators are failure upon demand and failure to run. CCF is considered between the 4 main diesels and between the 2 SBO diesels. There is no CCF between the 2 types of diesels (independence assumption). The mission time is 24 hours, but in order to avoid excessive conservatism a corrective factor was introduced in case of short recovery times.
• Was some guidance used for LOOP introduction/modelling in the PSA? 2.4. Results All the following information, if available, is of interest:
• Risk metrics considered (e.g. Core Damage Frequency (CDF), Large Release Frequency (LRF) along with a definition of the associated metric (i.e. how are CDF and/or LRF defined for your PSA…).
• Risk contributions - total frequency for loss of electrical sources and contribution to overall CDF
and LRF for each radiological sources addressed in PSA - by initiating event (especially if external hazards are treated separately) - by plant operational state (POS)
• Main sequences
Initiating event Short description CDF
Long LOOP at power • Long LOOP at power • Loss of 4 EDG*s (CCF) • Loss of 2 SBO* diesels (CCF)
1.7 10-8
Long LOOP at power • Long LOOP at power
Initiating event CDF (At power) CDF (Shutdown) CDF Risk contribution
Short LOOP 2h 1.9 10-8 1.5 10-8 1.4 10-7
29.3% Long LOOP 24h 9.0 10-8 4.8 10-9
Loss of main grid 1.0 10-8 7.5 10-10

NEA/CSNI/R(2017)5
143
• Loss of 3 EDGs • RCP seal LOCA • Loss of 1 MHSI pump
1.7 10-8
Long LOOP at power • Long LOOP at power • Loss of 4 EDGs • Loss of 1 SBO diesel • Loss of 1 AFW train
1.6 10-8
Long LOOP at power • Long LOOP at power • Loss of 4 EDGs • RCP seal LOCA • Loss of 1 SBO diesel
1.4 10-8
*EDG: Main Emergency Diesel generator *SBO: Ultimate Emergency Diesel generator (in case of SBO)
• Main contributions (importance measures for systems, support systems (i.e. I&C), component failures, human actions, …)
• Main sources of uncertainty and the results of uncertainty analysis, if performed 3. Insights as regard to safety: Safety improvements already implemented or planned (in particular in the post-Fukushima framework) (These insights are considered as particularly interesting for the potential users of the report) For each example:
• Description and purpose of the safety improvement: design, operation (procedures, Tech Specs), input to SAM guidelines….
• Status of improvement (planned or implemented) • Risk impact • Role of PSA in the decision making.
At the very beginning of the design, only four diesel generators were planned. The preliminary design PSA indicated that the CDF related to the LOOP initiating event was highly dominant. Consequently a design modification was necessary. The modification was the addition of two supplementary diesel generators (so-called “SBO diesels”) completely diversified from the four main diesels. The diversification of the diesel generators is a key point, since a CCF between the six diesels would lead to a dominant contribution. More recently the PSA highlighted a problem with the starting signal of the SBO diesels: in some cases of non-simultaneous failure of the main diesels, the starting of the SBO diesels could be impossible, and a modification of the electrical supply of the signal was decided. 4. Insights with respect to PSA (methods and data) (Please indicate particular methods and data issues/problems related to the loss of electrical sources and how these issues were addressed (or indicate if these issues are still being evaluated). Specific examples of good practices will be particularly useful) Possible issues:
• Completeness • HRA • Data on event frequencies • CCFs and dependencies • Recoveries • Support calculations • Sequence duration. Mission time. • Adverse effects of grid disturbances on on-site power systems • Multi-unit events

NEA/CSNI/R(2017)5
144
• Selectivity assumptions/modelling A methodology issue is the treatment of short LOOP recovery times. In order to keep a unique mission time of 24 hours for the diesel generators, a corrective factor was introduced for taking into account the recovery possibility of electrical sources before total loss of diesel generators and before core uncovery.

NEA/CSNI/R(2017)5
145
GERMANY QUESTIONNAIRE Identification Please identify your organisation: Name: Vattenfall Europe Nuclear Energy …………….……. Country: Germany………………………………………………………….. Address: Elbuferstraße 82…………………………………………………………….. 21502 Geesthacht………………………………………………………….. Contact person: Bernd Schubert ………………………………………………………….. Telephone/e-mail: +49 40 15 2618 / [email protected] Are you - A Regulatory Body � - A Supporting Organisation to a Regulatory Body � - A Utility - A Vendor � - A Consultant � - Other � 1. General plant and electrical supplies information
a) General • Plant type: BWR of the ’69 Type built by Siemens/KWU • Electrical power [MWe]: 1402 MW
b) Electrical supplies • Grid connection
- Number of independent feeders into switchyard (No. and types of grid connections) 3 connections to grid are available: main grid connection 400 kV, reserve grid connection 110 kV, emergency grid connection for one redundancy 10 kV In case of LOOP load is automatically switched from 400 kV to 110 kV grid if available.
- Alternate/independent ac grid sources that might be available (e.g. stand-by gas turbines) Emergency grid connection to hydro power station is available in emergency case if no other AC Power is available. This is an emergency procedure.
• Designed for house turbine operation, island operation (e.g. the main generator can supply house loads without reliance on or connection to the main switchyard) Yes, in case of LOOP turbine is automatically switched to house-load mode, but reliability of this mode is low because either the LOOP failure mode or the house-load mode itself strongly influence the success of this mode in the real case.
• Number of EDGs and/or other internal sources (e.g. gas turbines) and capacity 6 EDGs • Capacity for cross ties between trains or units
In principle yes by manual switches (only during outages), but the concept of the electrical supply is a strong separation of each of 6 redundancies, therefore not modelled in PSA.
• Brief description of non-ac dependent decay heat removal systems (e.g. turbine-driven auxiliary feed water, motor driven pumps, natural circulation, etc.) Steam driven (turbine) high pressure injection pump is available. All necessary electrical driven components of this system are supplied by batteries.
NEA/CSNI/R(2017)5
146
c) Other information if relevant for PSA: • Transmission system operator and operator requirements • Single or twin turbine/s
Single turbine • Other
2. PSA information and results For each PSA considered please provide the following information (an example is given in appendix) 2.1. PSA characteristics
• Context and PSA framework (regulatory position) PSA is part of periodic safety review every 10 years
• PSA date (initial, revisions), 2008, no revision since then, next would have been in 2018 but plant is finally shutdown due to atomic law in Germany
• PSA scope: Level 1 covering plant internal events internal hazards external hazards � for POS: full power low power and shutdown Level 2 covering plant internal events internal hazards � external hazards � for POS: full power low power and shutdown � Level 3 covering plant internal events � internal hazards � external hazards � for POS: full power � low power and shutdown � Spent fuel pool � internal hazards � external hazards �
2.2. Initiating event The main initiating event to be considered is a loss of external electrical sources (LOOP).
• Is the LOOP event considered as a single initiating event or are there sub-categories (especially according to the root cause of the event and to the recovery conditions)? Please briefly describe sub-categories if used.
1. Categories: short loop, long loop, induced loop by other transients? Short LOOP < 2 h, Long LOOP > 2h, for other events, there is a conditional probability for LOOP introduced in the PSA.
2. How is recovery considered? With one or several recovery times and laws/rules? (e.g. with fixed given mission times for the systems, or with a recovery law /rule versus time)? Do recovery model and recovery probabilities differentiate according to the causes of the initiating event(s)? No recovery is modelled.
3. What are the corresponding frequencies? This question covers several points: The frequency of each sub-category >2h 0.001 / a <2h 0.02 / a And, if relevant for your PSA: Conditional probability of a consequential LOOP given a plant transient
0.01 for one grid connection 0.001 for total LOOP of all grid connections Conditional probability of a transfer of plant electrical buses from a
“normal” transformer to a “reserve” transformer Conditional probability of house-load operation
NEA/CSNI/R(2017)5
147
4. Is there consideration of variations in frequencies/probabilities for different seasons/modes of operation (e.g. during refuelling?) No
5. Are there in the PSA other initiating events (other than LOOP) leading to similar consequences (for example intrinsic failure of electrical bus bars) with a significant contribution? No
6. Are the LOOP events consequential to external hazards treated specifically or included in a more generic event? What kinds of external hazards were considered among the hazards that can cause LOOP in the PSA? What are the corresponding frequencies? External hazards are not modelled as PSA, Only frequencies are discussed.
• What were the data sources and methods used to estimate initiating event frequencies? 1. Have you performed a detailed grid reliability analysis? Are the following
points explicitly treated or grouped into a more global LOOP event: different grid connections or sources, (e.g. gas turbines)? House / island mode operation (and then for how long time period)? LOOP consequential to a transient? Local and national experience is used for quantification
• When relevant for your PSA, what are the conditional failure probabilities (e.g. given a transient (IE), the conditional probability of loss-of-grid connection or conditional switchover failure probability? Conditional probabilities for failure of house turbine/island mode operation?) 0.01 for loss total grid connection
2.3. Main modelling assumptions
• What are the main modelling features of diesel generators, gas turbines/other possible sources, the electrical bus bars:
1. types of failure modes and level of details (i.e. if the detail of modelling enables identification of interesting insights, e.g. dependencies) fails to start; fails to run
2. CCF, Yes for both failure modes
3. mission time, 24 h in level 1, 48 in level 2
• Was some guidance used for LOOP introduction/modelling in the PSA? No
2.4. Results All the following information, if available, is of interest:
• Risk metrics considered (e.g. Core Damage Frequency (CDF), Large Release Frequency (LRF) along with a definition of the associated metric (i.e. how are CDF and/or LRF defined for your PSA…). CDF, LERF, LRF are used
• Risk contributions - total frequency for loss of electrical sources and contribution to overall CDF
and LRF for each radiological sources addressed in PSA CDF 3% for LOOP,
- by initiating event (especially if external hazards are treated separately) - by plant operational state (POS)
• Main sequences • Main contributions (importance measures for systems, support systems (i.e. I&C),
component failures, human actions, …) • Main sources of uncertainty and the results of uncertainty analysis, if performed

NEA/CSNI/R(2017)5
148
3. Insights as regard to safety: Safety improvements already implemented or planned (in particular in the post-Fukushima framework) (These insights are considered as particularly interesting for the potential users of the report) For each example:
• Description and purpose of the safety improvement: design, operation (procedures, Tech Specs), input to SAM guidelines….
• Status of improvement (planned or implemented) • Risk impact • Role of PSA in the decision making.
4. Insights with respect to PSA (methods and data) (Please indicate particular methods and data issues/problems related to the loss of electrical sources and how these issues were addressed (or indicate if these issues are still being evaluated). Specific examples of good practices will be particularly useful) Possible issues:
• Completeness • HRA • Data on event frequencies • CCFs and dependencies • Recoveries • Support calculations • Sequence duration. Mission time. • Adverse effects of grid disturbances on on-site power systems • Multi-unit events • Selectivity assumptions/modelling

NEA/CSNI/R(2017)5
149
HUNGARY QUESTIONNAIRE Identification Please identify your organisation: Name: NUBIKI Nuclear Safety Research Institute Country: Hungary Address: Konkoly-Thege Miklos ut 29-33 Contact person: Attila Bareith Telephone/e-mail: +36 1 392 2716 / [email protected] Are you - A Regulatory Body � - A Supporting Organisation to a Regulatory Body - A Utility � - A Vendor � - A Consultant - Other � 1. General plant and electrical supplies information
a) General • Plant type: Four VVER-440 units of subtype 213 on a common site • Electrical power [MWe]: 500 MWe (after power uprate from the 400 MWe design
power level)
b) Electrical supplies • Grid connection
- Number of independent feeders into switchyard (No. and types of grid connections)
There are two types of power connections to the grid according to the voltage level: Five 400kV power lines connect the grid and the switchyard (substation). Seven 120kV power lines connect the grid and the switchyard
(substation). - Alternate/independent ac grid sources that might be available (e.g. stand-by gas
turbines) Two gas turbines in remote locations (40 km and 85 km away from site, respectively), one of which can be connected to the plant through the existing 120 kV power transmission lines, the other one can be connected through the existing 400 kV power transmission lines.
• Designed for house turbine operation, island operation (e.g. the main generator can supply house loads without reliance on or connection to the main switchyard)
Yes, the Paks power plant units are designed to operate in an island mode with house load.
• Number of EDGs and/or other internal sources (e.g. gas turbines) and capacity There are three independent EDGs for each of the four units of NPP Paks, i.e. there are 12 EDGs available in total for the plant. Built-in capacity is 1.6 MWe each for units 1 and 2, and 2.1 MWe each for units 3 and 4.
• Capacity for cross ties between trains or units 13.5 MW
• Brief description of non-ac dependent decay heat removal systems (e.g. turbine-driven auxiliary feed water, motor driven pumps, natural circulation, etc.)
NEA/CSNI/R(2017)5
150
Decay heat removal requires AC power sources at NPP Paks. Decay heat can be temporarily removed without AC power sources, e.g. natural circulation in the primary circuit and steam blow-down through steam generator safety relief valves but this operating mode cannot ensure long-term stable cooling conditions. Turbine-driven feed water pumps are not available.
c) Other information if relevant for PSA: • Transmission system operator and operator requirements
The transmission system has an independent operator. Its interventions are important for recovery from power failure events and for ensuring cross connections between plant units.
• Single or twin turbine/s Twin turbines that have a role in ensuring plant operation in island mode.
• Other 2. PSA information and results For each PSA considered please provide the following information (an example is given in appendix) 2.1. PSA characteristics
• Context and PSA framework (regulatory position) Plant-specific PSA has been performed for each unit of the Paks NPP to meet regulatory requirements which declare that full scope level 1 and level 2 PSA is mandatory for a nuclear power plant in Hungary.
• PSA date (initial, revisions), Initial date: 1994 for Unit 3, 1997 for Units 1 and 2, 1999 for Unit 4 Revisions/update: Regular (annual) update within a living PSA programme. Also, PSA scope has been gradually broadened since the initial analysis.
• PSA scope: Level 1 covering plant internal events internal hazards external hazards for POS: full power low power and shutdown Level 2 covering plant internal events internal hazards external hazards for POS: full power low power and shutdown Level 3 covering plant internal events � internal hazards � external hazards � for POS: full power � low power and shutdown � Spent fuel pool � internal hazards � external hazards �
2.2. Initiating event The main initiating event to be considered is a loss of external electrical sources (LOOP).
• Is the LOOP event considered as a single initiating event or are there sub-categories (especially according to the root cause of the event and to the recovery conditions)? Please briefly describe sub-categories if used.
1. Categories: short loop, long loop, induced loop by other transients? Two major categories of electric power supply failure events are distinguished and considered explicitly as initiating events by taking into account the root causes: 1. Loss of normal power supply to the 6 kV safety bus bars due to on-site
causes. (Event denoted by K1_B in the PSA model for the Paks NPP.) 2. Loss of normal power supply to the 6 kV safety bus bars due to loss of off-
site power. (Event denoted by K1_K in the PSA model for the Paks NPP.) The second category, i.e. event K1_K is generally designated as a LOOP event.

NEA/CSNI/R(2017)5
151
Power supply failures induced by other transients are taken into account in the accident sequence model of the transient causing power supply fault. This is typically assumed for external hazards.
2. How is recovery considered? With one or several recovery times and laws/rules? (e.g. with fixed given mission times for the systems, or with a recovery law /rule versus time)? Do recovery model and recovery probabilities differentiate according to the causes of the initiating event(s)? In case of the K1_B event recovery is assumed successful if power supply to safety bus bars is ensured from the twin units through establishing cross connection that requires operator intervention. Recovery probability is assessed in human reliability analysis by taking into account important performance conditions including crew experience, time available and complexity of manual operations in the first place. The influence of these factors on recovery probability is evaluated using a decision tree based HRA model. In case of the K1_K event, which is the classical LOOP event, time to recovery is assumed to follow a lognormal distribution based on US experience and data analysis (NUREG/CR-6890). The parameter values for the underlying lognormal distribution are also taken from US data and recovery probability is thus assessed as a function of time available for recovery.
3. What are the corresponding frequencies? This question covers several points: The frequency of each sub-category The frequency of the K1_B event somewhat varies according to plant operational states, because of the differences in on-site power connection configuration. The frequency of this event is assessed to be 4.6E-01/yr at power and it is between 2.2E-01/yr and 4.6E-01/yr in low power and shutdown states. The frequency of the K1_K event is 3.3E-02/yr based on operating experience. And, if relevant for your PSA: Conditional probability of a consequential LOOP given a plant transient
LOOP caused by a plant transient is generally not assumed in the Paks PSA. The only exception is the loss of essential DC bus bar initiating event (so-called K3 initiating event) that can, in the longer run, lead to similar consequences as a K1_B event due to operator responses to K3. The conditional probability of K1_B given K3 is 2.48E-03. Conditional probability of a transfer of plant electrical buses from a
“normal” transformer to a “reserve” transformer A loss of power event is assumed if power supply is lost from both the normal transformer and from the reserve transformer. The conditional probability for the transfer of power supply is not represented explicitly in the model. Conditional probability of house-load operation
The house-load operation of the individual units in the Paks NPP is not modelled in the plant PSA because such an operating mode cannot be maintained stable for an individual unit. However, house-load operation of the four units together is taken into consideration if the operators ensure appropriate power connections and distribution among the units. The conditional probability of this complex event is assessed to be 0.9, i.e. the failure probability is 0.1.
4. Is there consideration of variations in frequencies/probabilities for different seasons/modes of operation (e.g. during refuelling?) As indicated above, some distinction is made in the assessment of the frequency of the K1_B event according to plant operational states and the associated on-site power connection configuration. Seasonal or other variations are not considered in the frequency of the K1_K event.
5. Are there in the PSA other initiating events (other than LOOP) leading to similar consequences (for example intrinsic failure of electrical bus bars) with a significant contribution?

NEA/CSNI/R(2017)5
152
No. 6. Are the LOOP events consequential to external hazards treated specifically or
included in a more generic event? What kinds of external hazards were considered among the hazards that can cause LOOP in the PSA? What are the corresponding frequencies? Power supply failures (including on-site and off-site power supply faults) induced by external hazards are treated explicitly in the accident sequence models (event trees) for external hazards, unless power supply failure is the only consequence of an external event. Among those hazards that can cause power failure events the following hazards have been considered in quantitative risk assessment up to know: seismic events, extreme wind (straight), extreme snow, frost. The impact of extreme high and extreme low temperatures is currently subject to evaluation. The conditional probability of power supply failure given an external hazard was determined by assessing the fragility of the most vulnerably components of the power supply system (e.g. transmission towers, equipment in substation, ceramic insulation, etc.). Therefore frequencies of power supply failures were not determined as single point values but could be obtained by convoluting the hazard curves for a given external hazard with the fragility curves of the power supply system for that hazard. (Such calculations were not made specifically for power supply faults, only for core damage by processing the complete PSA model.)
• What were the data sources and methods used to estimate initiating event frequencies? 1. Have you performed a detailed grid reliability analysis? Are the following
points explicitly treated or grouped into a more global LOOP event: different grid connections or sources, (e.g. gas turbines)? House / island mode operation (and then for how long time period)? LOOP consequential to a transient? The frequency of the K1_B event was determined by fault tree analysis taking into account the reliability of on-site electrical equipment. The frequency of the K1_K event was assessed on the basis of limited statistical evidence (1 event in 30 years). No additional grid reliability analysis was done. No consideration was given to different grid connection sources. As given above, house-load operation of an individual unit in the Paks NPP is not modelled in the plant PSA because such an operating mode cannot be maintained stable for an individual unit. However, house-load operation of the four units together is taken into consideration if the operators ensure appropriate power connections and distribution among the units.
• When relevant for your PSA, what are the conditional failure probabilities (e.g. given a transient (IE), the conditional probability of loss-of-grid connection or conditional switchover failure probability? Conditional probabilities for failure of house turbine/island mode operation?) Loss-of-grid connection due to plant transients is not assumed. In case of the K1_B event recovery is assumed successful if power supply to safety bus bars is ensured from the twin unit through establishing cross connection (switchover) that requires operator intervention. Conditional switchover failure probability by operator interventions varies between 1.1E-03 and 1.0E-01 in the model. The conditional probability for failure of island mode for the four units together given K1_K is 0.1.
2.3. Main modelling assumptions
• What are the main modelling features of diesel generators, gas turbines/other possible sources, the electrical bus bars:
1. types of failure modes and level of details (i.e. if the detail of modelling enables identification of interesting insights, e.g. dependencies)

NEA/CSNI/R(2017)5
153
Diesel generators are modelled as a basic event, although detailed fault tree models are also available for the purposes of system reliability analysis. Failure modes modelled are: failure to start, failure to continue running. Stand-by failure rates are assessed on the basis of plant-specific failure data, while running failure rates are estimated using generic data due to lack of plant-specific experience. Dependencies in failures of the three redundant diesel generators are considered using a parametric CCF model. (Dependencies due to area events (internal hazards and external hazards) are modelled explicitly in the PSA for those events.) Gas turbines are not available. Bas-bars are modelled as basic events without lower level decomposition. Bus-bar CCFs are also considered.
2. CCF, Generic data are used for CCFs of diesel generators and bus bars. Meaningful plant-specific data are not available.
3. mission time, Generally a mission time of 24 hours is used.
• Was some guidance used for LOOP introduction/modelling in the PSA? No specific guidance was used for LOOP modelling. Recovery from off-site power supply failure was assessed on the basis of generic data from US experience because of the lack of sufficient plant and country-specific experience in Hungary.
2.4. Results All the following information, if available, is of interest:
• Risk metrics considered (e.g. Core Damage Frequency (CDF), Large Release Frequency (LRF) along with a definition of the associated metric (i.e. how are CDF and/or LRF defined for your PSA…).Core damage frequency is used as a measure of risk in the level 1 PSA for the reactor. Core damage is postulated if fuel clad temperature reaches 1204 °C or effective cooling cannot be ensured due to distortion of core geometry. Fuel damage frequency is used as a measure of risk in the level 1 PSA for the spent fuel pool. Fuel damage criteria are the same as that of core damage. Large release frequency is used as a measure of risk in the level 2 PSA for NPP Paks. It means that the calculated cumulative releases to the environment are significantly higher than the criteria for limited impact (EUR criteria3). (The EUR 4 criteria for Limited Impact are:
- no emergency protection action necessary beyond 800 m from the damaged plant during the first 24 hours (some lighter actions like iodine tablets ingestion or shielding are not taken into account),
- no delayed action necessary at any time beyond about 3 km of the reactor, - no long-term action necessary beyond 800 m from the reactor - and it causes very limited economic impact out of the plant
Limited Impact is defined as linear combinations of the releases in each of the reference isotopic groups (133Xe, 131I, 137Cs, 131mTe, 90Sr, 103Ru, 140La, 141Ce, 140Ba). The releases are combined and compared with one criterion according to the following formula:
� 𝑅𝑖𝑔9
𝑖=1𝐶𝑖𝑔 + � 𝑅𝑗𝑔
9
𝑗=1𝐶𝑗𝑔 < 𝑐𝑟𝑖𝑡𝑒𝑟𝑖𝑜𝑛
where: Rig and Rjg are the total releases (at ground and elevated level) of the nine reference isotopes in TBq
Cig and Cjg are the coefficients related to environmental effects of unitary releases)
3. European Utility Requirements for LWR Nuclear Power Plants, Volume 2: Generic Nuclear Island
Requirements Chapter 1:Safety Requirements Revision C April 2001

NEA/CSNI/R(2017)5
154
The release rate is calculated for each representative reference sequence (2-3 for each containment state) applying realistic and best-estimate assumptions. The MAAP4/VVER computer code is used for source term quantification. (The code is validated against experimental data.) Generally it can be said that the release is large if the containment fails, either the leakage rate is increased or the containment is broken, when significant core damage occurs.
• Risk contributions - total frequency for loss of electrical sources and contribution to overall CDF
and LRF for each radiological sources addressed in PSA - by initiating event (especially if external hazards are treated separately) - by plant operational state (POS)
Level 1 PSA results Internal events The frequency and the contribution of power supply failures to the core damage risk from internal events in different plant operational states (POSs) is summarised as follows, were CDP is defined as CDF x POS duration:
POS K1_B K1_K f(IE) CDP % of total
CDP f(IE) CDP % of total
CDP Full power 0.47 5.22E-08 1.07% 3.30E-02 9.92E-07 20.25% Low power operation with one turbine 0.47 6.15E-12 0.95% 3.30E-02 1.17E-10 18.07% Boron addition to primary coolant to reach reactor subcriticality 0.47 6.00E-11 0.18% 3.30E-02 1.14E-09 3.36%
Steam-water cool down until disconnection of core flooding system 0.47 8.70E-11 0.05% 3.30E-02 1.65E-09 0.91%
Steam-water cool down to 150 °C 0.47 9.55E-11 0.03% 3.30E-02 1.81E-09 0.56% Water-water cool down to 60 °C 0.47 5.75E-10 0.05% 3.30E-02 1.09E-08 0.94% Introduction of natural circulation 0.47 4.96E-11 0.54% 3.30E-02 9.41E-10 10.22% Natural circulation in 2 loops 0.47 1.36E-10 0.06% 3.30E-02 2.58E-09 1.18% Opening of reactor vessel 0.47 6.25E-09 1.98% 3.30E-02 1.19E-07 37.64% Reactor open for refuelling, water level low 0.18 7.35E-09 1.64% 3.30E-02 1.40E-07 31.12%
Refuelling, natural circulation in 1 loop 0.27 0.00E+00 0.00% 3.30E-02 0.00E+00 0.00% Reloading, natural circulation in 1 loop 0.27 0.00E+00 0.00% 3.30E-02 0.00E+00 0.00% Reactor vessel open after refuelling, water level low 0.22 2.22E-09 0.74% 3.30E-02 4.22E-08 14.00%
Closing of the reactor vessel 0.22 9.90E-09 2.53% 3.30E-02 1.88E-07 48.02% Pressurisation of primary circuit 0.22 3.87E-09 4.54% 3.30E-02 7.35E-08 86.17% Primary pressure 25 bar, natural circulation 0.18 9.95E-10 2.37% 3.30E-02 1.89E-08 44.96%
Leak tight test of containment 0.47 7.90E-10 4.50% 3.30E-02 1.50E-08 85.44% Primary circuit pressure 25 bar after leak tight test of containment 0.47 7.20E-10 4.50% 3.30E-02 1.37E-08 85.52%
Heat-up to 120 °C, 5 RCPs in operation 0.47 9.65E-10 0.15% 3.30E-02 1.83E-08 2.76% 132/164 bar leak tight test of primary circuit 0.47 1.60E-10 0.10% 3.30E-02 3.03E-09 1.82%
Heat-up to 150 °C 0.47 5.90E-10 0.26% 3.30E-02 1.12E-08 5.02% Heat-up till until reconnection of core flooding system 0.47 1.36E-10 0.49% 3.30E-02 2.58E-09 9.26%
Reaching reactor criticality 0.47 2.46E-10 0.79% 3.30E-02 4.66E-09 15.02% Reactor power increase 0.47 2.34E-10 0.95% 3.30E-02 4.45E-09 17.99% Total 8.77E-08 0.90% 1.67E-06 17.09%
In the spent fuel PSA loss of electric power supply was not treated as a separate initiating event but a contributor to the loss of cooling event. Therefore the contribution of LOOP and other power supply faults cannot be directly derived from the PSA results. However, it is noted that loss of cooling (i.e. failure of the cooling system to the spent fuel pool) has a dominant contribution to the total fuel damage frequency from internal events and internal hazards. External events Loss of off-site power is assumed for all the seismic ground motion levels included in the seismic PSA for NPP Paks. Therefore the risk contribution of seismic events involving induced LOOP is 100%. The average CDF from seismic events is 4.31E-

NEA/CSNI/R(2017)5
155
05/yr at power and 4.70E-06/yr in low power and shutdown states. The fractional contribution of electric power supply failures (as induced events) to the core damage risk from other external events can be summarised as:
CDF K1_B K1_K
Wind 1.24E-05 13.00% 28.00%
Snow 5.20E-06 26.00% 0.00%
Frost 2.78E-06 100.00% 0.00% Seismic PSA for the spent fuel pool is ongoing. Similarly to the reactor PSA the risk contribution of seismic events involving induced LOOP is expected to be 100% for the spent fuel pool too. The fractional contribution of electric power supply failures (as induced events) to the frequency of fuel damage in the pool (FDF) from other external events can be summarised as:
FDF K1_B K1_K
Wind 2.04E-05 7.00% 58.00%
Snow 7.63E-06 5.00% 0.00%
Frost 6.69E-06 100.00% 0.00% Level 2 PSA results The contribution of power supply failures to large release frequency is not straightforward to determine based on the existing level 2 PSA results because the level 1 and the level 2 models are decoupled, and extensive additional calculations would be needed to obtain a correct assessment. In addition, update of the level 2 PSA is currently ongoing for the Paks plant. It is noted however that the frequency of large releases is dominated by seismic sequences just as the CDF is dominated by seismic risk. Other external events are also important contributors. Since LOOP is assumed in all the seismic induced accident sequences, and the likelihood of off-site power failure is high for other external events as well, it can be stated with high confidence that severe accident processes involving LOOP induced by external events are governing contributors to large release frequency too.
• Main sequences The results are generally presented in terms of minimal cut sets in the Paks PSA. The numerical results and the associated cut sets vary according to plant operational states. From the internal events PSA the most important CDF cut sets from power supply failures at power are as follows:
Total CDF due to power failures at power, Unit 1, Paks: 1.17E-06
No Frequency % Minimal Cut Set Description 1 9.80E-08 8.3 LOOP (K1_K)
Failure to provide power supply to 6 kV safety bus bars given power to supply to 400 kV bus bars ensured
EDGs fail to start due to CCF
Failure to provide SG cooling from aux. emergency feed water system of twin unit (failure of operator interaction in control room)
2 6.05E-08 5.2 LOOP (K1_K)
Failure to provide power supply to 6 kV safety bus bars given power to supply to 400 kV bus bars ensured
EDGs fail to run due to CCF
Failure to provide SG cooling from aux. emergency feed water system of twin unit (failure of operator interaction in control room)
3 5.71E-08 4.9 LOOP (K1_K)
Failure to provide power supply to 6 kV safety bus bars given power to supply to 400 kV bus bars ensured
EDGs fail to start due to CCF
Failure to provide SG cooling from aux. emergency feed water system of twin unit (diagnosis error)
4 5.14E-08 4.4 LOOP (K1_K) Failure to provide power supply to 6 kV safety bus bars given power to supply to 400 kV bus bars

NEA/CSNI/R(2017)5
156
ensured
EDGs fail to start due to CCF
Failure to provide SG cooling from aux. emergency feed water system of twin unit (error in taking a specific EOP step)
5 4.74E-08 4.0 LOOP (K1_K)
Failure to provide power supply to 6 kV safety bus bars given power to supply to 400 kV bus bars ensured
EDGs fail to start due to CCF
SG cooling from aux. emergency feed water system of twin unit fails due to scheduled maintenance in twin unit
6 3.53E-08 3.0 LOOP (K1_K)
Failure to provide power supply to 6 kV safety bus bars given power to supply to 400 kV bus bars ensured
EDGs fail to run due to CCF
Failure to provide SG cooling from aux. emergency feed water system of twin unit (diagnosis error)
• Main contributions (importance measures for systems, support systems (i.e. I&C), component failures, human actions, …) Example of importance measures for basic events with respect to CDF from power supply failure at power from the internal events PSA:
No. Description Nom. value
FV RDF FC RIF Sens. high Sens. low Sens. high/low
1 LOOP (K1_K) 3.30E-02 9.49E-01 19.64 9.49E-01 INFINIT 1.12E-05 1.71E-07 65.43
2
Failure to provide power supply to 6 kV safety bus bars given power to supply to 400 kV bus bars ensured
1.00E-01 9.13E-01 11.54 9.13E-01 9.22 1.08E-05 2.09E-07 51.81
3 EDGs fail to start due to CCF 2.25E-03 3.98E-01 1.66 3.98E-01 177.60 5.38E-06 7.54E-07 7.14
4
Failure to provide SG cooling from aux. emergency feed water system of twin unit (failure of operator interaction in control room)
1.20E-01 2.80E-01 1.39 2.80E-01 3.06 3.59E-06 8.78E-07 4.09
5 EDGs fail to run due to CCF 1.39E-03 2.46E-01 1.33 2.46E-01 177.70 3.77E-06 9.15E-07 4.13
6 Recovery of power supply to 400 kV bus bars from grid in 6.4 hours
7.18E-02 2.08E-01 1.26 2.08E-01 3.69 3.37E-06 9.55E-07 3.53
7 Recovery of power supply to 400 kV bus bars from grid in 10.4 hours
3.83E-01 2.08E-01 1.26 2.08E-01 1.34 1.57E-06 9.55E-07 1.64
8 EDG of safety system X fails to run 6.81E-02 1.89E-01 1.23 1.89E-01 3.58 3.17E-06 9.75E-07 3.25
9 EDG of safety system W fails to run 6.81E-02 1.87E-01 1.23 1.87E-01 3.56 3.15E-06 9.77E-07 3.23
10 EDG of safety system Y fails to run 6.81E-02 1.86E-01 1.23 1.86E-01 3.55 3.14E-06 9.78E-07 3.21
• Main sources of uncertainty and the results of uncertainty analysis, if performed Example of results from quantitative uncertainty analysis with respect to CDF from power supply failure at power is as follows from the internal events PSA:
Mean: 1.23E-06
Median: 8.24E-07
5%: 1.90E-07
95%: 3.57E-06
EF: 4.33
Additional sources of uncertainty (not quantified) are discussed in Section 4 below.
3. Insights as regard to safety: Safety improvements already implemented or planned (in particular in the post-Fukushima framework) (These insights are considered as particularly interesting for the potential users of the report)

NEA/CSNI/R(2017)5
157
For each example: • Description and purpose of the safety improvement: design, operation (procedures,
Tech Specs), input to SAM guidelines…. • Status of improvement (planned or implemented) • Risk impact • Role of PSA in the decision making.
Major plant modifications were made to the Paks NPP within a large-scale safety improvement programme between 1996 and 2002. The programme included improvements to design, operation/maintenance as well as procedures. The purpose was to improve the accident prevention capability of the plant. Some improvements were related to enhancing the reliability of power supply to safety systems, e.g. automatic switchover of safety system bus bars to EDGs (in case of an accident requiring ECCS operation) was terminated so that safety bus bars can be fed by normal power supply, if available. Most recently, severe accident management measures and guidelines have been implemented at the plant to reduce the likelihood and magnitude of consequences from potential severe accidents. These measures, among others, included provision of dedicated mobile severe accident diesel generators to ensure power supply to systems and equipment important to accident management. As a result of targeted safety assessment performed in view of the Fukushima accident 18 corrective actions have been defined. Three of these actions belong to “provision of existing and alternative electric power supplies”, namely:
• Installation of “accident diesel generators” to provide a means for additional power supply for ensuring important safety functions with a role in preventing severe accidents and/or managing an accident in the long term.
• Ensuring black-start capability for an off-site gas turbine at a remote location so that external electric power to NPP Paks can be provided via a dedicated power transmission line if the national grid collapses.
• Provision of means and implementation of measures necessary to ensure power supply to the 6 kV safety bus bars of a plant unit from any operable emergency diesel generators in any other units.
As to the role of PSA in safety improvement and safety management, it is noted that several modifications made in the safety improvement programme for NPP Paks were supported by PSA (including identification, design, as well as implementation of necessary modifications). The severe accident management strategy and the corresponding accident management measures were defined on the basis of the level 2 PSA results in the first place. In the targeted safety assessment following the Fukushima accident PSA was used to characterise the vulnerability of heat removal to the ultimate heat sink and the power supply (including grid and EDGs) to external events and to determine the safety margin of these functions beyond the design basis. 4. Insights with respect to PSA (methods and data) (Please indicate particular methods and data issues/problems related to the loss of electrical sources and how these issues were addressed (or indicate if these issues are still being evaluated). Specific examples of good practices will be particularly useful) Possible issues:
• Completeness o Some of the external hazards that can induce LOOP have not been analysed in
PSA yet. Analysis is still ongoing. The potential impact of grid disturbances (other than loss of connection to the grid) on plant electrical systems/equipment has not yet been subject to risk assessment.
• HRA o Lack of plant-specific information to assess recovery of off-site power is a
limitation. Also, there are open issues on how to ensure stable operating

NEA/CSNI/R(2017)5
158
conditions in-house load mode with considerations to the specifics of a multi-unit site (cross connection between units). These issues relate to both potential electrical stability problems and the role of the operators. The concrete stability problems are difficult to identify (experience is limited, simulations are not available on a large scale), which also impact on our capability to describe the role of the operators (actual tasks/interactions and the associated failure likelihood).
• Data on event frequencies o Pant specific data on LOOP may be obsolete in the case of the Paks NPP.
LOOP frequency is based on event records from the last 30 years. However, improvements have been made to increase the reliability of grid connection. On the other hand, the vulnerability of the grid to load disturbances and to the impacts from external events is not fully understood.
• CCFs and dependencies • Lack of data to describe CCFs of bus bars. Mechanisms of potential multiple failures
due to electrical disturbances (adverse effects) is not addressed in detail. External events can simultaneously impact on the grid and on the plant, which has to be addressed explicitly in PSA.
• Recoveries • See HRA above. • Support calculations
o Lack of grid reliability models, limited calculations for the consequences of grid disturbances on-site electrical systems and equipment including potential adverse effects.
• Sequence duration. Mission time. o This is considered an open issue that needs further attention and analysis. For
example mechanistic use of 24 hours for mission time may well lead to underestimation of risk from long-term scenarios, e.g. the risk from external events that may lead to a prolonged loss of off-site power coupled with severe on-site consequences.
• Adverse effects of grid disturbances on on-site power systems o See CCFs and support calculations above.
• Multi-unit events o Important issues in need of further analysis in view of the PSA for the Paks
NPP with 4 units: plant response to LOOP with considerations to impact on multiple units and the associated post-LOOP plant configuration, the whole area of external event PSA for multi-unit sites (LOOP combined with other adverse effects of an external event on multiple units), management of LOOP events (human responses) including co-ordination with the substation and the grid operator.
• Selectivity assumptions/modelling

NEA/CSNI/R(2017)5
159
INDIA QUESTIONNAIRE Identification Please identify your organisation: Name: Nuclear Power Corporation of India Limited (NPCIL) Country: India Address: NUB, Anushaktinagar, Mumbai-400094 Contact person: Dr P.V.Varde / Smt Rajee Guptan Telephone/e-mail: [email protected] / [email protected] Are you - A Regulatory Body � - A Supporting Organisation to a Regulatory Body � - A Utility X - A Vendor � - A Consultant � - Other � 1. General plant and electrical supplies information
a) General • Plant type: Pressurised Heavy Water Reactor • Electrical power [MWe]:540MWe
b) Electrical supplies • Grid connection
- Number of independent feeders into switchyard (No. and types of grid connections)
- Alternate/independent ac grid sources that might be available (e.g. stand-by gas turbines) 400kv and 220 kv
• Designed for house turbine operation, island operation: YES • Number of EDGs and/or other internal sources (e.g. gas turbines) and capacity: Four
50% EDGs • Capacity for cross ties between trains or units Yes-Both • Brief description of non-ac dependent decay heat removal systems (e.g. turbine-driven
auxiliary feed water, motor driven pumps, natural circulation, etc.) Diesel Driven Fire Water Pumps to Feed Fire Water to Steam Generator
c) Other information if relevant for PSA: • Transmission system operator and operator requirements • Single or twin turbine/s • Other
2. PSA information and results For each PSA considered please provide the following information (an example is given in appendix) 2.1. PSA characteristics
• Context and PSA framework (regulatory position) • PSA date (initial, revisions), • PSA scope:
Level1 covering plant internal events X internal hazards X* external hazards X*

NEA/CSNI/R(2017)5
160
for POS: full power � low power and shutdown � Level 2 covering plant internal events X* internal hazards � external hazards � for POS: full power � low power and shutdown � Level 3 covering plant internal events � internal hazards � external hazards � for POS: full power � low power and shutdown � Spent fuel pool � internal hazards � external hazards � X* Performed for some units of NPCIL but not for this twin unit
2.2. Initiating event The main initiating event to be considered is a loss of external electrical sources (LOOP).
• Is the LOOP event considered as a single initiating event or are there sub-categories (especially according to the root cause of the event and to the recovery conditions)? Please briefly describe sub-categories if used.
1. Categories: short loop, long loop, induced loop by other transients ??? Single Initiating Event Category for LOOP associated with Electrical Power failure at Bus level.
2. How is recovery considered? With one or several recovery times and laws/rules? (e.g. with fixed given mission times for the systems, or with a recovery law /rule versus time)? Do recovery model and recovery probabilities differentiate according to the causes of the initiating event(s)? Recovery not modelled in PSA studies deterministic feasibility assessed
3. What are the corresponding frequencies? About 0.2/year for LOOP 4. Is there consideration of variations in frequencies/probabilities for different
seasons/modes of operation (e.g. during refuelling?) no much variations observed
5. Are there in the PSA other initiating events (other than LOOP) leading to similar consequences (for example intrinsic failure of electrical bus bars) with a significant contribution? Included in estimating LOOP Frequency
6. Are the LOOP events consequential to external hazards treated specifically or included in a more generic event? What kinds of external hazards were considered among the hazards that can cause LOOP in the PSA? What are the corresponding frequencies? Treated Separately. Seismic Event is considered as external cause of LOOP
• What were the data sources and methods used to estimate initiating event frequencies? 1. Have you performed a detailed grid reliability analysis? (No). Are the following
points explicitly treated or grouped into a more global LOOP event: different grid connections or sources, (e.g. gas turbines)? House / island mode operation (and then for how long time period)? (No). LOOP consequential to a transient? All the factors are implicitly considered in estimating the LOOP frequency as per observed grid failure events
• When relevant for your PSA, what are the conditional failure probabilities (e.g. given a transient (IE), the conditional probability of loss-of-grid connection or conditional switchover failure probability? Conditional probabilities for failure of house turbine/island mode operation?)
2.3. Main modelling assumptions
• What are the main modelling features of diesel generators, gas turbines/other possible sources, the electrical bus bars:
1. types of failure modes and level of details (i.e. if the detail of modelling enables identification of interesting insights e.g. dependencies)

NEA/CSNI/R(2017)5
161
CCF of Diesel Generator in Start and Running Mode, 2. mission time,
• Was some guidance used for LOOP introduction/modelling in the PSA? No 2.4. Results All the following information, if available, is of interest:
• Risk metrics considered (CDF, LRF…). Please precise the definition. CDF,LERF • Risk contributions
- total frequency for loss of electrical sources and contribution to overall CDF and LRF for each radiological sources addressed in PSA LOOP Frequency 0.2/year (excluding External events) LOOP Contributes to CDF is about 15% Sequence:
- by initiating event (especially if external hazards are treated separately) - by plant operational state (POS)
Main sequences:- LOOP *CCF of EDG sets*Failure in manual injection of Fire Water to Steam Generator
• Main contributions (importance measures for systems, support systems (i.e. I&C), component failures, human actions, …)
• Main sources of uncertainty and the results of uncertainty analysis, if performed 3. Insights with regard to safety: Safety improvements already implemented or planned (in particular in the post-Fukushima framework) (These insights are considered as particularly interesting for the potential users of the report) For each example:
• Description and purpose of the safety improvement: design, operation (procedures, Tech Specs), input to SAM guidelines….
Used in design of two train ECCS system for 700 MWe • Status of improvement (planned or implemented) • Risk impact • Role of PSA in the decision making.
4. Insights with respect to PSA (methods and data) (Please indicate particular issues/problems related to the loss of electrical sources, which needed (or are still needing) specific attention. Examples of specific developments will be very interesting) Possible issues:
• Completeness • HRA • Data on event frequencies • CCFs and dependencies • Recoveries • Support calculations • Sequence duration. Mission time. • Adverse effects of grid disturbances on on-site power systems • Multi-unit events • Selectivity assumptions/modelling
NEA/CSNI/R(2017)5
162
JAPAN QUESTIONNAIRE Identification Please identify your organisation: Name: Nuclear Regulation Authority (NRA) Country: Japan Address: Roppongi-First Bldg., 1-9-9 Roppongi, Minato-ku, Tokyo, JAPAN, 106-8450 Contact person: Haruo Fujimoto Telephone/e-mail: +81-3-5114-2224/ [email protected] Are you - A Regulatory Body x - A Supporting Organisation to a Regulatory Body � - A Utility � - A Vendor � - A Consultant � - Other � Note 1: The assessment described here was made by Japan Nuclear Energy Safety Organisation (JNES) and Nuclear Power Engineering Corporation (NUPEC), the predecessor organisation of JNES. JNES was abolished on March 1, 2014 and integrated into NRA. 1. General plant and electrical supplies information
a) General • Plant type:
Four-loop PWR and BWR-5 (selected as a typical PWR plant and a BWR plant operated in Japan, not specific plant)
• Electrical power [MWe]: Electric power output Four-loop PWR 1100 MWe BWR-5 1100 MWe
b) Electrical supplies • Grid connection
- Number of independent feeders into switchyard (No. and types of grid connections)
- Alternate/independent ac grid sources that might be available (e.g. stand-by gas turbines)
Main line Auxiliary line Four-loop PWR 500 kV, two lines 500 kV, two lines BWR-5 500 kV, two lines 66 kV, two lines
• Designed for house turbine operation, island operation (e.g. the main generator can supply house loads without reliance on or connection to the main switchyard)
Island operation Four-loop PWR Yes BWR-5 Yes
• Number of EDGs and/or other internal sources (e.g. gas turbines) and capacity No. of EDGs Four-loop PWR 2 BWR-5 3
• Capacity for cross ties between trains or units

NEA/CSNI/R(2017)5
163
Cross ties between trains Cross ties between units Four-loop PWR Yes (credit is not taken in PRA) Yes (credit is taken in PRA). Procedure of power supply from adjacent unit
was established AM implementation before Fukushima NPP accident. BWR-5 Yes (credit is not taken in PRA) Yes (credit is taken in PRA). Procedure of power supply from adjacent unit
was established AM implementation before Fukushima NPP accident.
• Brief description of non-ac dependent decay heat removal systems (e.g. turbine-driven auxiliary feed water, motor driven pumps, natural circulation, etc.)
Non-ac dependent heat removal measures Four-loop PWR A turbine-driven auxiliary feed water pump
Natural circulation Gravity injection (only applicable to some shutdown POSs)
BWR-5 RCIC (only applicable at-power operation)
c) Other information if relevant for PSA: • Transmission system operator and operator requirements • Single or twin turbine/s • Other
2. PSA information and results For each PSA considered please provide the following information (an example is given in appendix) 2.1. PSA characteristics
• Context and PSA framework (regulatory position) • PSA date (initial, revisions) :
Last update in 2000 (PRA at-power operation both for PWR and BWR) and 1997 (PRA at shutdown condition)
• PSA scope: Level 1 covering plant internal events x internal hazards � external hazards � for POS: full power x low power and shutdown x Level 2 covering plant internal events � internal hazards � external hazards � for POS: full power � low power and shutdown � Level 3 covering plant internal events � internal hazards � external hazards � for POS: full power � low power and shutdown � Spent fuel pool � internal hazards � external hazards �
Note 2: Level 1, 2, 3, shutdown PRA and external event PRA were conducted separately and integrated assessment has not been done. The insights obtained from level 1 PRA at-power operation and shutdown condition are presented here. 2.2. Initiating event The main initiating event to be considered is a loss of external electrical sources (LOOP).
• Is the LOOP event considered as a single initiating event or are there sub-categories (especially according to the root cause of the event and to the recovery conditions)? LOOP is postulated as a single event both for four-Loop PWR and BWR-5. Please briefly describe sub-categories if used
1. Categories: short loop, long loop, induced loop by other transients? 2. How is recovery considered? With one or several recovery times and
laws/rules? (e.g. with fixed given mission times for the systems, or with a recovery law /rule versus time)? Do recovery model and recovery probabilities differentiate according to the causes of the initiating event(s)? LOOP recovery is considered as a function of time based on the operating history of grids.
3. What are the corresponding frequencies?

NEA/CSNI/R(2017)5
164
At-power operation At shutdown condition (Sum of LOOP frequencies at relevant POSs)
Four-loop PWR 3.9x10⁻³ 7.2x10⁻⁴ BWR-5 3.9x10⁻³ 5.2x10⁻⁴
This question covers several points: The frequency of each sub-category And, if relevant for your PSA: Conditional probability of a consequential LOOP given a plant transient Conditional probability of a transfer of plant electrical buses from a
“normal” transformer to a “reserve” transformer Conditional probability of house-load operation
4. Is there consideration of variations in frequencies/probabilities for different seasons/modes of operation (e.g. during refuelling?)None.
5. Are there in the PSA other initiating events (other than LOOP) leading to similar consequences (for example intrinsic failure of electrical bus bars) with a significant contribution? Loss of CCWS gives similar consequence as LOOP for PWR. RCP seal LOCA is the dominant contributor for both.
6. Are the LOOP events consequential to external hazards treated specifically or included in a more generic event? What kinds of external hazards were considered among the hazards that can cause LOOP in the PSA? What are the corresponding frequencies? Treated separately in seismic PRA and Tsunami PRA.
• What were the data sources and methods used to estimate initiating event frequencies? 1. Have you performed a detailed grid reliability analysis? Are the following
points explicitly treated or grouped into a more global LOOP event: different grid connections or sources, (e.g. gas turbines)? House / island mode operation (and then for how long time period)? LOOP consequential to a transient? The occurrence frequency of LOOP is obtained from the operating history of all nuclear power plants in Japan. The factors above are included implicitly.
• When relevant for your PSA, what are the conditional failure probabilities (e.g. given a transient (IE), the conditional probability of loss-of-grid connection or conditional switchover failure probability? Conditional probabilities for failure of house turbine/island mode operation?)
2.3. Main modelling assumptions
• What are the main modelling features of diesel generators, gas turbines/other possible sources, the electrical bus bars:
1. types of failure modes and level of details (i.e. if the detail of modelling enables identification of interesting insights, e.g. dependencies). An emergency DG is modelled as a component accompanied with the failure modes of failure to start and failure to run. The necessary support systems, such as sea water system and actuation signals, are modelled separately in order to account dependency with other frontline systems.
2. CCF, CCFs of EDG are modelled as failure to start and failure to run.
3. mission time, Twenty four hours are used as a typical assumption in PRAs. • Was some guidance used for LOOP introduction/modelling in the PSA? No.
2.4. Results All the following information, if available, is of interest:
• Risk metrics considered (e.g. Core Damage Frequency (CDF), Large Release Frequency (LRF) along with a definition of the associated metric (i.e. how are CDF and/or LRF defined for your PSA…). CDF (refer Note 2, previously mentioned)
• Risk contributions

NEA/CSNI/R(2017)5
165
- total frequency for loss of electrical sources and contribution to overall CDF and LRF for each radiological sources addressed in PSA
LOOP contribution to the total CDF of power operation (Note 3)
LOOP contribution to the total CDF of shutdown condition (Note 3)
Four-loop PWR 4% 1% BWR-5 16% 9%
Note 3: LOOP contribution to each CDF at-power operation and at shutdown condition. - by initiating event (especially if external hazards are treated separately) - by plant operational state (POS)
• Main sequences Four-loop PWR Dominant sequences at-power operation
1. LOOP + Failure of EDG + Failure of off-site power recovery in a short time + RCP seal LOCA + Failure of off-site power recovery in a long time
2. LOOP + Failure of EDG + Failure of off-site power recovery in short time + RCP seal LOCA + Failure of power supply from the adjacent unit + Failure of off-site power recovery in a long time (NOTE 4).
Dominant sequences at shutdown condition 1. LOOP + Failure of EDG + Failure of gravity injection (in the applicable POSs)
BWR-5 Dominant sequences at power operation
1. LOOP + Failure of EDG + Failure of off-site power recovery + Failure of power supply from the adjacent unit
2. LOOP + Failure of EDG + Failure of off-site power recovery + Failure of RHR (under condition with success of power supply from the adjacent unit)
3. LOOP + Failure of off-site power recovery + Failure of RHR (suppression pool cooling) + Failure of vent Dominant sequences at shutdown condition
1. LOOP + Failure of EDG + Failure of RHR + Failure of injection or cooling by alternate systems (NOTE5) (under condition with success of off-site power recovery)
2. LOOP + Failure of RHR + Failure of injection or cooling by alternate systems (under condition with success of EDG and off-site power recovery)
NOTE 4: Allowed time to recover off-site power depends on success of power supply from the adjacent unit. NOTE 5: LPCS, LPCI, CUWS (Reactor Water Cleanup System), MUWC (Makeup Water System Condensated) and FPCS (Fuel Pool Cooling and Cleanup System) can be used as the alternate injection or cooling measures in case of failure of RHR.
• Main contributions (importance measures for systems, support systems (i.e. I&C), component failures, human actions, …)
• Main sources of uncertainty and the results of uncertainty analysis, if performed 3. Insights as regard to safety: Safety improvements already implemented or planned (in particular in the post-Fukushima framework) (These insights are considered as particularly interesting for the potential users of the report) For each example:
• Description and purpose of the safety improvement: design, operation (procedures, Tech Specs), input to SAM guidelines….
• Status of improvement (planned or implemented) • Risk impact • Role of PSA in the decision making.
After Fukushima NPP accident, utilities are preparing various alternate measures against SBO, earthquakes and Tsunami. With regards to the countermeasures to LOOP, electric vehicles were equipped at each site as a short-term actions and other type electric generators such as gas-turbine generators are planned to be placed in future. Fire pumps, alternate sea water pumps and alternate feed water pumps are other countermeasures for SBO. In addition to the hardware modifications, software modifications, i.e. amendment of operation manual and training, have also been implemented. Updating PRA models to incorporate these countermeasures is now in progress.

NEA/CSNI/R(2017)5
166
New regulatory framework was established in 2013, in which provision for severe accidents are mandatory by law. In this new framework, utilities are requested to prepare severe accident measures and to perform PRA in order to consolidate accident sequence groups which should be evaluated to illustrate effectiveness of these countermeasures. 4. Insights with respect to PSA (methods and data) (Please indicate particular methods and data issues/problems related to the loss of electrical sources and how these issues were addressed (or indicate if these issues are still being evaluated). Specific examples of good practices will be particularly useful) Possible issues:
• Completeness • HRA • Data on event frequencies • CCFs and dependencies • Recoveries • Support calculations • Sequence duration. Mission time. • Adverse effects of grid disturbances on on-site power systems • Multi-unit events • Selectivity assumptions/modelling

NEA/CSNI/R(2017)5
167
KOREA QUESTIONNAIRE Identification Please identify your organisation: Name: Korea Atomic Energy Research Institute (KAERI) Country: Korea (Republic of) Address: (150-1 Deokjin-Dong), 1045 Daedeokdaero, Yuseong, Daejeon, 305-353 Contact person: Jin-Hee Park ([email protected]) / Kwang-Il Ahn ( [email protected]) Telephone/e-mail: Are you - A Regulatory Body � - A Supporting Organisation to a Regulatory Body � - A Utility � - A Vendor � - A Consultant � - Other (Research Institute) ■ 1. General plant and electrical supplies information
a) General • Reference Plant: a two-unit NPP (2 LOOP CE PWR), CE: Combustion Engineering • Electrical power [MWe]:1000MWe
b) Electrical supplies • Grid connection
- Number of independent feeders into switchyard (No. and types of grid connections)
- The reference plant has one switchyard (345 kV). The main generator of each unit is connected to the switchyard with four feeder lines.
- Alternate/independent ac grid sources that might be available (e.g. stand-by gas turbines)
- Normal (preferred) on-site AC power is supplied from the main output transformer through two independent feeders, each of which supplies Unit Auxiliary Transformers (UATs) in each unit. Under abnormal operation, on-site AC power is also supplied from the switchyard with generator circuit breaker open. The UATs feed non-Class 1E and Class 1E buses; either UAT can be aligned to only one emergency bus within a unit. On-site ac power may also be supplied from two Stand-by Auxiliary Transformer (SAT) which can be connected to a main 345 kV switchyard. The SAT can also feed non-Class 1E and Class 1E buses.
• Designed for house turbine operation, island operation (e.g. the main generator can supply house loads without reliance on or connection to the main switchyard)
- Unit Auxiliary Transformers (which are powered form the main generator in each unit) provide non-safety balance of plant electrical power during normal operation.
- The two stand-by diesel generators (two per unit – 4 for plant) provide emergency power to the two engineered safety feature (ESF) electrical buses in each unit. One Alternative AC(AAC) diesel generator is installed per each site.
• Number of EDGs and/or other internal sources (e.g. gas turbines) and capacity - The reference plant has two electrical safety trains with one EDG per train.
Upon loss of all off-site power, either diesel generator or its associated bus has the capacity to power the equipment required to safely shutdown the reactor and
NEA/CSNI/R(2017)5
168
mitigate the consequences of the design bases accidents. Each EDG is rated for 6000kW continuous operation. One Alternative AC(AAC) diesel generator is installed per each site.
• Capacity for cross ties between trains or units - Cross ties are not applied in the reference plant.
• Brief description of non-ac dependent decay heat removal systems (e.g. turbine-driven auxiliary feed water, motor driven pumps, natural circulation, etc.)
- For decay heat removal following SBO, the station 125-Vdc Class 1E batteries are capable of powering the required loads for the SBO coping duration (assumed to be 4 hours).
- The DC power system has adequate capacity to provide instrumentation to assess the core reactivity, RCS inventory, core cooling capability and decay heat removal capability, and for the SBO coping time (assumed to be 4 hours).
- Each unit has two 100% capacity turbine-driven auxiliary feed water (one plant has diesel-driven) pumps to provide makeup water to the steam generators independent of AC power. The turbine-driven pump requires DC power and is supported by the station DC batteries.
c) Other information if relevant for PSA: • Transmission system operator and operator requirements • Single or twin turbine/s • Other
2. PSA information and results For each PSA considered please provide the following information (an example is given in appendix) 2.1. PSA characteristics
• Context and PSA framework (regulatory position) • PSA date (initial, revisions),
- Initial PRA – 1997 - Latest revision – 2014
• PSA scope: Level 1 covering plant internal events ■ internal hazards ■ external hazards ■ for POS: full power � low power and shutdown � Level 2 covering plant internal events ■ internal hazards ■ external hazards ■ for POS: full power � low power and shutdown � Level 3 covering plant internal events � internal hazards � external hazards � for POS: full power � low power and shutdown � Spent fuel pool � internal hazards � external hazards �
2.2. Initiating event The main initiating event to be considered is a loss of external electrical sources (LOOP).
• Is the LOOP event considered as a single initiating event or are there sub-categories (especially according to the root cause of the event and to the recovery conditions)? Please briefly describe sub-categories if used.
1. Categories: short loop, long loop, induced loop by other transients? One LOOP is considered (each categories are included)
2. How is recovery considered? With one or several recovery times and laws/rules? (e.g. with fixed given mission times for the systems, or with a

NEA/CSNI/R(2017)5
169
recovery law /rule versus time)? Do recovery model and recovery probabilities differentiate according to the causes of the initiating event(s)? The recovery probabilities are modelled based on generic data base due
to lack of domestic experiences.(Now, new recovery probabilities are being developed based on domestic experiences)
Recovery times take into account battery depletion time or core damage time and the time to uncover the reactor core if no safety systems function.
3. What are the corresponding frequencies? This question covers several points: The frequency of each sub-category LOOP – 2.2E-2/year
And, if relevant for your PSA: Conditional probability of a consequential LOOP given a plant transient Conditional probability of a transfer of plant electrical buses from a
“normal” transformer to a “reserve” transformer Conditional probability of house-load operation
4. Is there consideration of variations in frequencies/probabilities for different seasons/modes of operation (e.g. during refuelling?) No, we did not consider different seasons/modes of operation.
5. Are there in the PSA other initiating events (other than LOOP) leading to similar consequences (for example intrinsic failure of electrical bus bars) with a significant contribution? Yes, our PSA models the loss of 4.16kV AC bus and the loss of vital
DC buses 6. Are the LOOP events consequential to external hazards treated specifically or
included in a more generic event? What kinds of external hazards were considered among the hazards that can cause LOOP in the PSA? What are the corresponding frequencies? One LOOP is considered (each categories are included)
• What were the data sources and methods used to estimate initiating event frequencies? 1. Have you performed a detailed grid reliability analysis? Are the following
points explicitly treated or grouped into a more global LOOP event: different grid connections or sources, (e.g. gas turbines)? House / island mode operation (and then for how long time period)? LOOP consequential to a transient? The KAERI/KHNP maintains a database for plant transient IE
frequencies (including LOOP). KHNP: Korea Hydro and Nuclear Power Company
• When relevant for your PSA, what are the conditional failure probabilities (e.g. given a transient (IE), the conditional probability of loss-of-grid connection or conditional switchover failure probability? Conditional probabilities for failure of house turbine/island mode operation?)
1. Given a transient initiator, the generic conditional probability of a consequential LOOP would be updated based on NUREG/CR-6890.
2.3. Main modelling assumptions
• What are the main modelling features of diesel generators, gas turbines/other possible sources, the electrical bus bars:
1. types of failure modes and level of details (i.e. if the detail of modelling enables identification of interesting insights, e.g. dependencies) Three failure modes (fail to start & run and due to maintenance) for
diesel generators are considered 2. CCF,
Failure to start and failure to run are applied 3. mission time,

NEA/CSNI/R(2017)5
170
24 hrs • Was some guidance used for LOOP introduction/modelling in the PSA?
Domestic frequency and recovery probabilities are applied in our PSA.
2.4. Results All the following information, if available, is of interest:
• Risk metrics considered (e.g. Core Damage Frequency (CDF), Large Release Frequency (LRF) along with a definition of the associated metric (i.e. how are CDF and/or LRF defined for your PSA…).
• Risk contributions - total frequency for loss of electrical sources and contribution to overall CDF
and LRF for each radiological sources addressed in PSA LOOP Frequency: 2.2/year CDF for LOOP: 3.73E-7/year for internal events
- by initiating event (especially if external hazards are treated separately) - by plant operational state (POS)
• Main sequences - LOOP * AFWS failure * Feed & Bleed
• Main contributions (importance measures for systems, support systems (i.e. I&C), component failures, human actions, …)
• Main sources of uncertainty and the results of uncertainty analysis, if performed 3. Insights as regard to safety: Safety improvements already implemented or planned (in particular in the post-Fukushima framework) (These insights are considered as particularly interesting for the potential users of the report) For each example:
• Description and purpose of the safety improvement: design, operation (procedures, Tech Specs), input to SAM guidelines….
• Status of improvement (planned or implemented) • Risk impact • Role of PSA in the decision making.
4. Insights with respect to PSA (methods and data) (Please indicate particular methods and data issues/problems related to the loss of electrical sources and how these issues were addressed (or indicate if these issues are still being evaluated). Specific examples of good practices will be particularly useful) Possible issues:
• Completeness • HRA • Data on event frequencies • CCFs and dependencies • Recoveries • Support calculations: We have plan to update success criteria in the Level 1 ETs using
the best-estimate T/H codes • Sequence duration. Mission time. • Adverse effects of grid disturbances on on-site power systems • Multi-unit events: We are going to take into account this issue for the reference plant. • Selectivity assumptions/modelling

NEA/CSNI/R(2017)5
171
MEXICO QUESTIONNAIRE Identification Please identify your organisation: Name: Comision Nacional de Seguridad Nuclear y Salvaguardias …….……. Country: Mexico ………………………………………………………………………….. Address: Dr Barragan 779, Col. Narvarte, Delegacion Benito Juarez, CP. 03020, Mexico, DF. Contact person: Ramon Lopez Morones Telephone/e-mail: (52-55) 50953245 / [email protected] Are you - A Regulatory Body - A Supporting Organisation to a Regulatory Body � - A Utility � - A Vendor � - A Consultant � - Other � 1. General plant and electrical supplies information
a) General • Plant type: Two units, General Electric BWR/5, with MARK II Containment • Electrical power [MWe]: generating capacity ≈ 805 MWe.
b) Electrical supplies • Grid connection
- Number of independent feeders into switchyard (No. and types of grid connections)
The Laguna Verde Nuclear Power Plant (LVNPP) has the following external electrical energy distribution:
5 transmission lines of 400 Kv 3 transmission lines of 230 Kv Substation of 420 Kv Substation of 230 kv
Electrical energy distribution of the plant - The Buses 1 and 2 of 400 KV are interconnected by means of eight
arrangements of double switch (bays). - There are connected five transmission lines of 400 KV to 5 different
destinations - Also they are connected:
Principal transformer T1 of the Unit I. Principal Transformer T2 of the Unit II. The autotransformer AT3 of 400/230/34.5 KV.
- The Buses 11 and 12 of 230 KV are interconnected by 2 arrangements of switches, known as switch and a half.
- From the switches there are connected two transmission lines of 230 KV. - Also they are connected:
The derivation of 230 KV of the autotransformer AT3 of 400/230/34.5 KV.
The Transformer T4 of 230/34.5 KV (TBS) - The Bus 31 of 34.5 KV is fed by the derivation of the autotransformer AT3 of
400/230/34.5KV and its principal loads are: Reserve Transformer (T23) of U2.
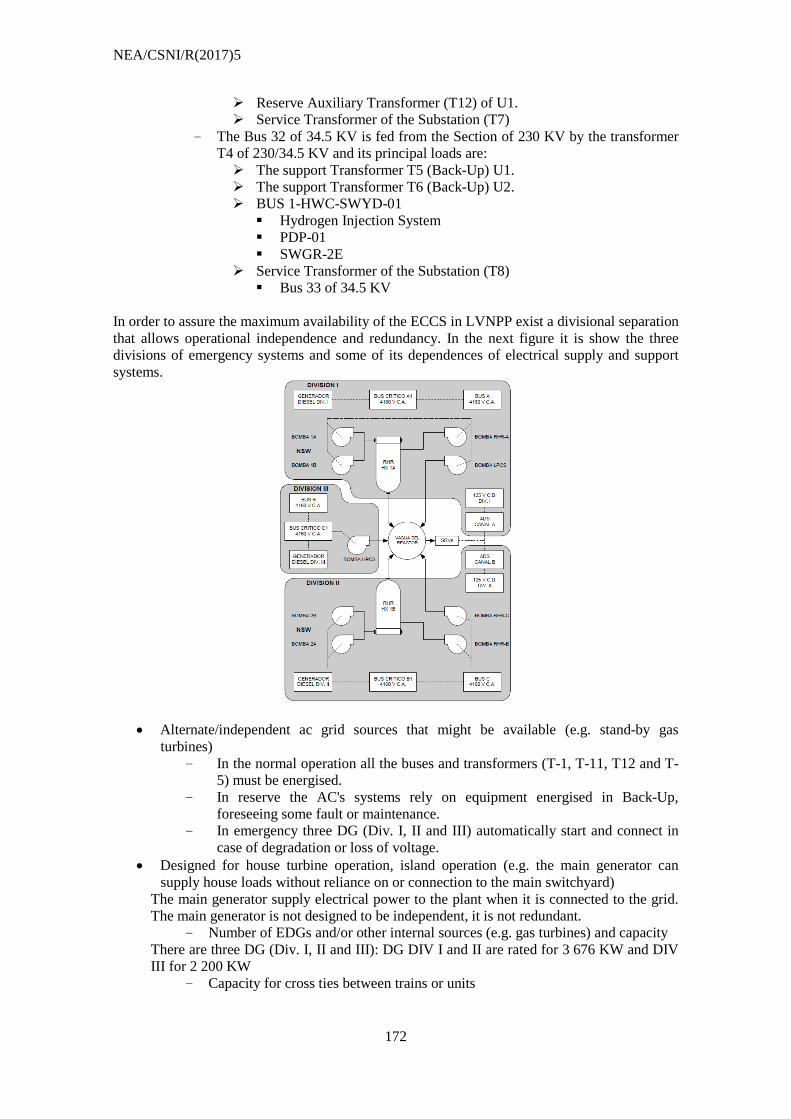
NEA/CSNI/R(2017)5
172
Reserve Auxiliary Transformer (T12) of U1. Service Transformer of the Substation (T7)
- The Bus 32 of 34.5 KV is fed from the Section of 230 KV by the transformer T4 of 230/34.5 KV and its principal loads are: The support Transformer T5 (Back-Up) U1. The support Transformer T6 (Back-Up) U2. BUS 1-HWC-SWYD-01 Hydrogen Injection System PDP-01 SWGR-2E
Service Transformer of the Substation (T8) Bus 33 of 34.5 KV
In order to assure the maximum availability of the ECCS in LVNPP exist a divisional separation that allows operational independence and redundancy. In the next figure it is show the three divisions of emergency systems and some of its dependences of electrical supply and support systems.
• Alternate/independent ac grid sources that might be available (e.g. stand-by gas turbines)
- In the normal operation all the buses and transformers (T-1, T-11, T12 and T-5) must be energised.
- In reserve the AC's systems rely on equipment energised in Back-Up, foreseeing some fault or maintenance.
- In emergency three DG (Div. I, II and III) automatically start and connect in case of degradation or loss of voltage.
• Designed for house turbine operation, island operation (e.g. the main generator can supply house loads without reliance on or connection to the main switchyard)
The main generator supply electrical power to the plant when it is connected to the grid. The main generator is not designed to be independent, it is not redundant.
- Number of EDGs and/or other internal sources (e.g. gas turbines) and capacity There are three DG (Div. I, II and III): DG DIV I and II are rated for 3 676 KW and DIV III for 2 200 KW
- Capacity for cross ties between trains or units

NEA/CSNI/R(2017)5
173
- The capacity to cross ties between units is already built but there is not a formal procedure to operate, therefore is not credited in the PRA
• Brief description of non-ac dependent decay heat removal systems (e.g. turbine-driven auxiliary feed water, motor driven pumps, natural circulation, etc.)
In case of the combination of total loss of external power with the failure of the three diesel generators (or by the fault of the divisions I and II combined with the unavailability of the HPCS) is called total loss of AC power (in English, Station Blackout). In this case, the only system capable to inject water to the core is the RCIC, since it can run when are available the batteries banks 1A125 and 1A250; the time while the RCIC may remain in operation will depend on the batteries duration, the effects of warming the suppression pool and cooling pump, as well as the heating of the area of RCIC.
c) Other information if relevant for PSA:
2. PSA information and results For each PSA considered please provide the following information (an example is given in appendix) 2.1. PSA characteristics
• Context and PSA framework (regulatory position) - The first model was developed in co-operation with Utility, regulatory authority
and research institutes (CFE, CNSNS, ININ and IIE). • PSA date (initial, revisions),
- In July, 1986 the Federal Commission of Electricity (CFE), the National Commission of Nuclear Safety and Safeguards (CNSNS), the National Institute of Nuclear Research (ININ), and the Electrical Research Institute (IIE), they agreed to develop together an PSA for Laguna Verde Nuclear Power Plant.
- The PSA for of LVNPP Review 0 was concluded and delivered for internal review of the CFE in September, 1988.
- Latest revision – February 2013 • PSA scope:
Level 1 covering plant internal events internal hazards external hazards � for POS: full power low power and shutdown � Level 2 covering plant internal events internal hazards external hazards � for POS: full power low power and shutdown � Level 3 covering plant internal events � internal hazards � external hazards � for POS: full power � low power and shutdown � Spent fuel pool � internal hazards � external hazards �
2.2. Initiating event The main initiating event to be considered is a loss of external electrical sources (LOOP).
• Is the LOOP event considered as a single initiating event or are there sub-categories (especially according to the root cause of the event and to the recovery conditions)? Please briefly describe sub-categories if used.
1. Categories: short loop, long loop, induced loop by other transients? Grouping of initiating events. The losses of power supplies (AC) that
can happen in LVNPP include short and long loop and following: 1. Total loss of external power by grid and substation failure. 2. Total loss of external power by substation failure. 3. Total loss of auxiliary power by substation failure.

NEA/CSNI/R(2017)5
174
The effect of the faults listed about the plant operation and mitigation systems can vary from a simple unavailability of back-up systems to a total loss of AC supply in combination with other equipment failures. The next Table summarises the effects of these failures and given treatment within the PSA to each of them. Supply Effects Treatment Total loss of external power by grid failure
Isolation and BOP loss. Loss of external power supply to the three critical buses. Loss of components fed by the other unit.
Modelled with the initiating event of total loss of external power (IE-LOOP-EXT).
Loss of external power by substation failure
Isolation and loss of all BOP systems. Loss of external power supply to the three critical buses. Loss of components fed by the other unit.
Modelled with the initiating event of total loss of external power (IE-LOOP-EXT). The substation failure affected the normal and back-up supply; so it is assumed that there is loss of both substations (230 and 400 kV). This situation avoids the use of back-up transformer and components fed by the other unit.
Total loss of auxiliary power Isolation and loss of all BOP systems. Loss of external power supply to the three critical buses, recoverable with back-up transformer. Availability of components fed by the other unit.
Modelled with simplified fault tree of auxiliary power systems based on operational experience. The use of back-up transformer is considered as a recovery power form to critical buses included in the failure recovery model.
4160 volts AC Critical buses It leads to manual shut down of the plant by heating of the recirculation pumps to lose its cooling. Loss of systems divisions corresponding to the missing bus.
Divisions I and II not modelled in the PSA. They are involved by loss of external power with a DG failure, they are considered to have less probability and consequences. The division III is not an initiating event, so it is modelled as unavailability of HPCS system in its fault tree.
2. How is recovery considered? With one or several recovery times and
laws/rules? (e.g. with fixed given mission times for the systems, or with a recovery law /rule versus time)? Do recovery model and recovery probabilities differentiate according to the causes of the initiating event(s)?
Management of recovery and phases of time Due to the importance of this transient’s variant with shutdown in the risk profile, it is justifiable to accredit more realistically possible recovery of external power or Diesel generators, since external operational experience has shown that a significant fraction of these faults is recovered in comparable times with the evolution of sequences. To achieve this purpose, it is necessary to define the time periods available to carry out the recovery of critical equipment for accident progression. Accident sequences in the event trees inherently contain two periods of time: Short-term sequences: time to meet the criterion of irreversible core damage without injection to the vessel. Long-term sequences: time to meet the pressure of primary containment venting. In the loss of power sequences, total or partial, add an intermediate period of time corresponding to the time of exhaustion of 125 V.C.D. batteries, which are without power supply AC for its chargers.
The external power recovery probabilities are used in the event trees to distinguish between the different phases of length modelled. The recovery probability depends not only of the time available to do so, but also the origin of the fault, distinguishing for this purpose between loss of auxiliary systems, and external loss (including substations, transmission grid and natural phenomena that affect them).
3. What are the corresponding frequencies? This question covers several points: The frequency of each sub-category

NEA/CSNI/R(2017)5
175
And, if relevant for your PSA: Conditional probability of a consequential LOOP given a plant
transient Conditional probability of a transfer of plant electrical buses from a
“normal” transformer to a “reserve” transformer Conditional probability of house-load operation
IE-LOOP: Loss of external or auxiliary power: 5.56E-02/year IE-LOOP-EXT: loss of external power (substation or grid): 1.43E-02/year IE-LOOP-INT: loss of auxiliary power: 2.94E-02/year
4. Is there consideration of variations in frequencies/probabilities for different seasons/modes of operation (e.g. during refuelling?) No, the PRA is only modelled for internal events at power.
5. Are there in the PSA other initiating events (other than LOOP) leading to similar consequences (for example intrinsic failure of electrical bus bars) with a significant contribution? Yes, the PRA models the loss of 4160V AC bus and the loss of vital dc buses
6. Are the LOOP events consequential to external hazards treated specifically or included in a more generic event? What kinds of external hazards were considered among the hazards that can cause LOOP in the PSA? What are the corresponding frequencies?
The LOOP events consequential to internal or external hazards are treated in a single generic event. • What were the data sources and methods used to estimate initiating event frequencies?
1. Have you performed a detailed grid reliability analysis? Are the following points explicitly treated or grouped into a more global LOOP event: different grid connections or sources, (e.g. gas turbines)? House / island mode operation (and then for how long time period)? LOOP consequential to a transient?
The initiating event frequencies are another likely update Bayesian probabilistic parameter. These frequencies a priori distributions were obtained from NUREG/CR-6928, which corresponds to the effort promoted by the NRC for frequency of initiating events that take into account the recent operational experience. The frequencies of initiators are failure rates based on the time, and therefore correspond to the Poisson process, so your Bayesian update follows the same method used for failure rates per hour. In this case the operational experience comes from initiators that have occurred and events registered as event reports of the Central (RECs); selected time window are the ten most recent years on both units of the LVNPP, but this can be extended up to the beginning of its commercial operation for very rare events. From the PSA 3.01 Revision used for equipment failure rates and frequencies of the initiating events were obtained taking into account the recent operational experience of the LVNPP, combined this specific plant information with generic data using Bayesian methods.
IE-LOOP the specific frequency of external and auxiliary power loss of the LVNPP initiating event IE-LOOP-EXT represents the frequency not modelled. Due to the model characteristics of external power loss, defining the event IE-LOOP-EXT consider simultaneously effects on recovery actions. In this setting you must watch that doesn´t alter the balance between the event categories observed in the external operational experience, which in turn determine the chances of recovery, as son: the proportion of events at local (plant or substation) or the external grid (collapse or extreme weather); for sites with multiple units, the ratio of loss into a single unit or loss in all units.
• When relevant for your PSA, what are the conditional failure probabilities (e.g. given a transient (IE), the conditional probability of loss-of-grid connection or conditional switchover failure probability? Conditional probabilities for failure of house turbine/island mode operation?)

NEA/CSNI/R(2017)5
176
2.3. Main modelling assumptions
• What are the main modelling features of diesel generators, gas turbines/other possible sources, the electrical bus bars:
1. types of failure modes and level of details (i.e. if the detail of modelling enables identification of interesting insights, e.g. dependencies)
The main assumptions of the common fault trees to all systems are presented below. Based on the scope of the study, the development of fault trees excludes faults caused by external events, such as earthquakes, floods, fire, weather events, sabotage, etc. Failures by breakage of pipes are explicitly excluded from the models, except those related to the coolant loss of the vessel inside or outside containment. Leaks through drains, vent and relief valves when its section is less than a tenth of the main pipeline, except those that can empty a tank if are not detected promptly. The system failures caused by deficiencies not identified in the design, manufacture or construction are considered outside of the State of the art of PSA methodology, although these are contained in implicit data of failure, both for individual components and common cause failures. In accordance to ASME standard, the contributors to the failure rate or unavailability of the system can be excluded from model if they meet the following filtering criteria: (a) For a component, if total probability of its failure modes is at least two orders of magnitude lower than the component most likely caused the same effect on the operation of the system or train. (b) for one multiple component failure modes, if its contribution to the overall failure rate is less than 1%, when recorded failure modes have the same effect on the operation of the system.
2. CCF, An alternative method for development of common cause failure data is the multiple Greek letters model or MGL. DG CCF was considered. 3. mission time,
Mission time is used in the equipment models that can fail its operation once that successfully start after a request. The basic mission time used on the PSA of LVNPP was 24 hours, which considers that during that time recover the fault easier to reset, including the initiator event that originated and which affected the feature redundant equipment. The 24 hours value has been used traditionally since the first PSA, and continues to be widely currently used. • Was some guidance used for LOOP introduction/modelling in the PSA?
2.4. Results All the following information, if available, is of interest:
• Risk metrics considered (e.g. Core Damage Frequency (CDF), Large Release Frequency (LRF) along with a definition of the associated metric (i.e. how are CDF and/or LRF defined for your PSA…).
In a consistent manner with the standard ASME RA/S, core damage is defined as the uncover and heating of the reactor core to a degree that lead oxidation sustained of cladding, severe damage to the fuel involving a large core fraction. It should be noted that core damage defined thus, necessarily involves melt down of the fuel. So in the LVNPP PSA, the terms core damage and core melt down are used interchangeably, by which should be considered as synonyms. The physical parameters selected to determine if an accident scenario exceeds the definition of core damage are the follows:
Maximum temperature of cladding more than 1200° C (2200° F) Alternatively, it is assumed that the maximum core temperature will exceed with certainty if the collapsed level in the reactor core remains below 1/3 of the elevation of the active fuel for more than 15 minutes. This alternative approach is intended to avoid the need for simulations for sequences with total loss of refrigerant to the vessel injection.
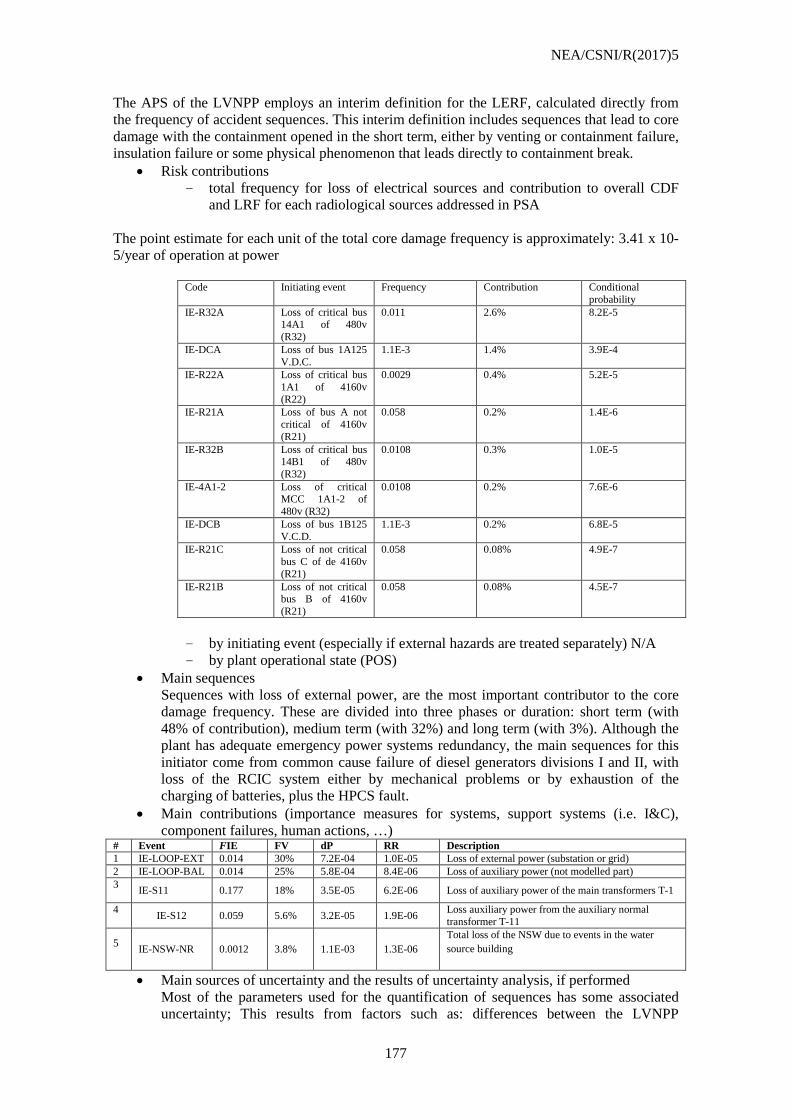
NEA/CSNI/R(2017)5
177
The APS of the LVNPP employs an interim definition for the LERF, calculated directly from the frequency of accident sequences. This interim definition includes sequences that lead to core damage with the containment opened in the short term, either by venting or containment failure, insulation failure or some physical phenomenon that leads directly to containment break.
• Risk contributions - total frequency for loss of electrical sources and contribution to overall CDF
and LRF for each radiological sources addressed in PSA
The point estimate for each unit of the total core damage frequency is approximately: 3.41 x 10⁻⁵/year of operation at power
Code Initiating event Frequency Contribution Conditional
probability IE-R32A Loss of critical bus
14A1 of 480v (R32)
0.011 2.6% 8.2E-5
IE-DCA Loss of bus 1A125 V.D.C.
1.1E-3 1.4% 3.9E-4
IE-R22A Loss of critical bus 1A1 of 4160v (R22)
0.0029 0.4% 5.2E-5
IE-R21A Loss of bus A not critical of 4160v (R21)
0.058 0.2% 1.4E-6
IE-R32B Loss of critical bus 14B1 of 480v (R32)
0.0108 0.3% 1.0E-5
IE-4A1-2 Loss of critical MCC 1A1-2 of 480v (R32)
0.0108 0.2% 7.6E-6
IE-DCB Loss of bus 1B125 V.C.D.
1.1E-3 0.2% 6.8E-5
IE-R21C Loss of not critical bus C of de 4160v (R21)
0.058 0.08% 4.9E-7
IE-R21B Loss of not critical bus B of 4160v (R21)
0.058 0.08% 4.5E-7
- by initiating event (especially if external hazards are treated separately) N/A - by plant operational state (POS)
• Main sequences Sequences with loss of external power, are the most important contributor to the core damage frequency. These are divided into three phases or duration: short term (with 48% of contribution), medium term (with 32%) and long term (with 3%). Although the plant has adequate emergency power systems redundancy, the main sequences for this initiator come from common cause failure of diesel generators divisions I and II, with loss of the RCIC system either by mechanical problems or by exhaustion of the charging of batteries, plus the HPCS fault.
• Main contributions (importance measures for systems, support systems (i.e. I&C), component failures, human actions, …)
# Event FIE FV dP RR Description 1 IE-LOOP-EXT 0.014 30% 7.2E-04 1.0E-05 Loss of external power (substation or grid) 2 IE-LOOP-BAL 0.014 25% 5.8E-04 8.4E-06 Loss of auxiliary power (not modelled part) 3 IE-S11 0.177 18% 3.5E-05 6.2E-06 Loss of auxiliary power of the main transformers T-1
4 IE-S12 0.059 5.6% 3.2E-05 1.9E-06 Loss auxiliary power from the auxiliary normal
transformer T-11
5 IE-NSW-NR 0.0012 3.8% 1.1E-03 1.3E-06
Total loss of the NSW due to events in the water source building
• Main sources of uncertainty and the results of uncertainty analysis, if performed Most of the parameters used for the quantification of sequences has some associated uncertainty; This results from factors such as: differences between the LVNPP

NEA/CSNI/R(2017)5
178
environment and the generic data sources used, the variability between the type of components, variability between equipment manufacturers, variability between organisations and individuals (operators and maintenance personnel) in the case of human actions, assumptions in the modelling of the sequences and other random factors. Uncertainty in the parameters used in the quantification necessarily is transmitted to the calculated values of the sequences, so these also have a band of associated uncertainty.
3. Insights as regard to safety: Safety improvements already implemented or planned (in particular in the post-Fukushima framework) (These insights are considered as particularly interesting for the potential users of the report) For each example:
• Description and purpose of the safety improvement: design, operation (procedures, Tech Specs), input to SAM guidelines….
- SAMs were required as part of the stress test - Status of improvement (planned or implemented) - SAMs will be implemented no later than 2016
• Risk impact • Role of PSA in the decision making.
CNSNS REQUIREMENTS FOR EXTENDED SBO Information Notice 2011-05 “Thooku – Taiheiyou-Oki earthquake effects on Japanese Nuclear Power Plants” ; 10 CFR 50.54 “Conditions of licences” section "hh“; Both documents were issued by the United States Nuclear Regulatory Commission (USNRC), and Carry out of “Resistance Tests“ was also required. Some of the preliminary mitigation strategies that the CFE has proposed to cope with an extended SBO, are the following:
- Analyse the increase of the minimum coping time to cope with an extended SBO, from 4 to 8 hours.
- Diversification of alternative inventory replenishment to the Spent Fuel Pool (internal and external).
- Manual operation of Reactor Core Isolation Cooling (RCIC). - DC power supply to depressurise the Reactor Pressure Vessel (RPV) and portable
injection pump. - Manually opening the venting valves. - Injection of water into the primary containment.
All extended SBO mitigation strategies are in process of implementation by the Federal Electricity Commission (CFE). 4. Insights with respect to PSA (methods and data) (Please indicate particular methods and data issues/problems related to the loss of electrical sources and how these issues were addressed (or indicate if these issues are still being evaluated). Specific examples of good practices will be particularly useful) Possible issues:
• Completeness • HRA • Data on event frequencies • CCFs and dependencies • Recoveries • Support calculations • Sequence duration. Mission time. • For some initiating events, especially those that may be associated with natural
phenomena, 24 hours of mission time may be insufficient. The most representative

NEA/CSNI/R(2017)5
179
example of this is the loss of external power caused by hurricanes, earthquakes or tornados, where observed events with longer than three days. Therefore, equipment to mitigate these initiating events will be assign a mission time of 72 hours, as average duration of the initiating event. This equipment includes diesel generators, NSW pump, diesel fire fighting system pumps, and RCIC.
• Adverse effects of grid disturbances on on-site power systems • Multi-unit events • Selectivity assumptions/modelling

NEA/CSNI/R(2017)5
180
ROMANIA QUESTIONNAIRE Identification Please identify your organisation: Name: Institute for Nuclear Research Pitesti …………………………………………….……. Country: Romania………………………………………………………….…………………….. Address: Str. Campului nr.1, Mioveni, Jud. Arges, 115400 …………………………………….. Contact person: Dr Mirela NITOI ………………………..……………………………….. Telephone/e-mail: +40248213400 ext.151/ [email protected] ……………..……….. Are you - A Regulatory Body � - A Supporting Organisation to a Regulatory Body � - A Utility � - A Vendor � - A Consultant � - Other 1. General plant and electrical supplies information
a) General • Plant type: Pressurised Heavy Water Reactors PHWR CANDU-6
Cernavoda NPP has two units in operation. • Electrical power [MWe]: Gross 706.5
b) Electrical supplies • Grid connection
- Number of independent feeders into switchyard (No. and types of grid connections)
The power supply sources for Cernavoda NPP Units are as follows: Redundant off-site sources, which provide electrical power required
during startup and shutdown of the unit and can also supply power during normal operating conditions;
On-site stand-by sources which provide the electrical power required in case of loss of the normal power supply: Class III Stand-by Diesel Generators (SDG), batteries, Emergency Diesel–generators (EPS, Emergency Power Supply).
The external grid has 2 sections, one of 400kV and the other of 110kV. The 400kV external grid is connected to the step-up voltage transformers 24/400kV. The 110kV external grid is connected to service transformers. The electric power system Class IV of Cernavoda plant comprises of the main power output transformer, unit and service transformers and a switchyard. This system steps-up the generator output to match the electric utility’s grid requirements for transmission to the load centres and it also supplies the power needed to the station services. The electrical power supply system Class IV is divided into two subsystems, ODD and EVEN, each one sized for 100% load capacity, completely physically separated. The system is supplied either through the unit or the service transformers from the external grid and the 24kV turbine generator (on-site), which provides electrical power required during normal operation. During normal station operation the station services power is supplied by both the unit transformers and the system service transformers. In the event of a failure of one supply, the other can provide the power for the total service load (using fast transfer schemes). System service transformers supply half of the plant services power requirements under normal operating conditions and are able to provide the total service load when necessary. These

NEA/CSNI/R(2017)5
181
transformers are fed from the switchyard and supplies all plant loads during the start-up of the plant, or when the turbine generator is unavailable. Both the unit service and station service transformers are designed to automatically maintain voltage in the station services.
- Alternate/independent ac grid sources that might be available (e.g. stand-by gas turbines)
Normal supply of Class III distribution system is from service transformers and is backed up by the stand-by diesel generators with 100% redundancy. Stand-by electrical diesel can provide power to essential loads (around 7 MW for each Unit) to ensure an orderly shutdown. Class III is the charging source to the Class I batteries and back-up supply to Class II loads.. The Emergency Power System (EPS) system is comprised of two 1000 kV Diesel Generators supplying an “ODD/EVEN” distribution system located in the Secondary Control Building, housed in separate fire resistant rooms, which are self-contained and completely independent of the station normal services. Only one EPS DG is required to be operational at any time, the other one acting as a back-up. The plant design ensures at least 30 minutes until the manual start of the EPS Diesel generators is credited. Under SBO conditions, EPS continuous operation is ensured for at least 5 days for each unit, from the point of view of the fuel oil reserve. Mobile Diesel generators: following the Fukushima Daiichi NPP accident, Cernavoda NPP procured two mobile diesel generators (one for each unit), to provide power if the EPS is not available. The capacity of each mobile Diesel Generator is almost equivalent to that provided by the design non-mobile EPS diesel generators. The mobile diesel generators have autonomy of 6 hours at full load without external support.
• Designed for house turbine operation, island operation (e.g. the main generator can supply house loads without reliance on or connection to the main switchyard)
Islanded operation is an abnormal operating mode defined as the separation of a part of the station 400 kV transmission network from the rest of the grid. The separation could be the result of remote transmission lines breaker trips. The main breaker of the plant generator remains connected to the internal services and plant output transformers. The resulting island could operate almost normally (however, with reduced power supply reliability) if the islanded power generating unit(s) can rapidly adjust the power output to match the loads remained in the island. Otherwise, the unbalance between the power produced and power consumed could lead to the local grid collapse: possible power generating units remaining isolated (supply only their internal electrical services) or even units tripping (the risk of LOOP is increased during this regime). The loss of line event represents the sudden unit disconnection from the 400 kV output switchyard caused by a protective trip of the 400 kV grid interconnection breakers (two breakers for each unit at Cernavoda NPP), with the unit remaining at high power – isolated on their own internal services supply. If the loss of line event is caused by a progressive or sudden transmission grid failure (rather than a local / single-unit output system malfunction), and if the regional 110 kV distribution grid – that provides the back-up for internal services supply – also fails, the units will experience a LOOP event. The plant can operate at reduced power levels in the islanded mode.
• Number of EDGs and/or other internal sources (e.g. gas turbines) and capacity The EPS DGs are 100% redundant, Design Basis Earthquake (BDE) seismically qualified to maintain integrity and functionality. The EPS diesel generators fuel tanks are seismically qualified (DBE) and capable to ensure the necessary fuel for more than 72 hours for EPS Diesel generators (at least 6 days). Specific arrangements are in place to have the necessary fuel oil on-site after the depletion of the fuel reserves. Stand-by Diesel generators, electrical connections and fuel reserves cannot be affected by a flooding event. Mobile Diesel generators: following the Fukushima Daiichi NPP accident, Cernavoda NPP procured two mobile diesel generators (for both units), to provide power if the EPS is not available. The capacity of each mobile diesel generator is almost equivalent to that provided by the design non-mobile EPS diesel generators. The mobile diesel generators have autonomy of 6 hours at full load without external support. The available fuels oil on-site will ensure more than

NEA/CSNI/R(2017)5
182
5 days of operation without external support, considering only the fuel oil stored in the seismically qualified EPS storage tanks.
• Capacity for cross ties between trains or units During normal station operation the station services power is supplied by both the unit transformers and the system service transformers. In the event of a failure of one supply, the other can provide the power for the total service load (Class IV incoming breakers are provided with fast and slow transfer schemes). There are tie breakers provided for Class III buses, field operator action being required for the connection.
• Brief description of non-ac dependent decay heat removal systems (e.g. turbine-driven auxiliary feed water, motor driven pumps, natural circulation, etc.)
The Emergency Water Supply System (EWS) system ensures that an adequate heat sink for decay heat removal is available following a loss of the normal heat removal systems. Facilities are provided for a separate water supply to the steam generators (SG), emergency core cooling (ECCS) heat exchangers and primary heat transport system (PHTS). Examples of the accident modes that could lead to the loss of normal heat removal systems include loss of boiler feed water (FWS), loss of service water (RSW), loss of Class IV and Class III power, as well as common mode failures such as earthquakes or fires. If SDCS pumps and auxiliary feed water pump (AFW) are not available, SGs can be used as heat sinks by depressurisation and addition of water from the dousing tank (by Boiler Make-up Water System – passive make up) and Emergency Water System (electrically supplied by EPS). If both class IV and class III power is lost, the steam from the secondary side of steam generators is rejected to the atmosphere through relief valves and the reactor continues to be cooled by natural circulation (thermosyphoning) in the heat transfer loops with the SGs as the heat sink. Thermosyphoning is effective because the steam generators are located at high elevation.
c) Other information if relevant for PSA: • Transmission system operator and operator requirements • Single or twin turbine/s • Other
Loss of off-site power event (without other events) is not a major threat for the plant. The robustness of the Cernavoda NPP is ensured by four additional levels of defence in depth for electrical power supply, apart from the off-site power:
- the Class III electrical power supplied by the first set of diesel generators with 100% redundancy built in;
- the Class I / II electrical power supplied from batteries; the batteries can provide power supply for 8 hours;
- the emergency electrical power supply provided by the second set of diesel generators (seismically qualified) (EPS) (designed with 100% redundancy and separation requirements);
- the mobile diesel generators (the new set of mobile diesel generators provides 100% redundancy to the EPS; the mobile diesel generators can be connected within 2.5-3 hours).
Except for the Class I / II batteries, the other electrical power sources ensure at least 5 days of continuous power supply without any external support. 2. PSA information and results For each PSA considered please provide the following information (an example is given in appendix) 2.1. PSA characteristics
• Context and PSA framework (regulatory position)

NEA/CSNI/R(2017)5
183
Following Romanian Regulatory Body (CNCAN) requirements, a PSA level 1 for the design was prepared and reviewed by IAEA through an IPERS mission (1995) and subsequently after implementation of the mission recommendations. New regulations, “Nuclear Safety Requirements on Sitting of Nuclear Power Plants” and “Nuclear Safety Requirements on Design and Construction of Nuclear Power Plants”, have entered into force at the end of 2010. The requirements on Probabilistic Safety Assessment for nuclear power plants (2006) have incorporated the WENRA Reactor Safety Reference Levels.
• PSA date (initial, revisions), 27. Part of the Cernavoda NPP PSA Programme, the development of Cernavoda NPP Level 1 PSA was completed in June 2007, for Unit 1, respectively in March 2008, for Unit 2. 28. The core damage frequency calculated as part of Level 1 PSA study for Cernavoda includes contributions from Internal Events, Internal Fires, Internal Floods and Seismic Events, for plant full power operation and shutdown states. In the period 2000-2005, several IAEA IPSART Missions for Cernavoda PSA Project Stage I and Stage II confirmed the validity of methods used and the results obtained and provided recommendations to refine some hypotheses in the frame of future use of the model for risk monitoring and other PSA applications. Level 2 PSA has started in 2012, and will cover the Internal Events (including internal fires, high energy line breaks and internal floods) and Seismic Events. Full power, shutdown and transition states will be covered at the same resolution level as in the Level 1 PSA study. 29. PSR Phase 1 of Cernavoda NPP Unit 1 was completed in 2007, and second phase has been undertaken between 1 May 2008 and 30 June 2012. Based on PSR results and on U1& U2 FSARs, in May 2013 CNCAN granted new licences for Unit 1 for 10 years and for Unit 2 for 7 years.
• PSA scope: Level 1 covering plant internal events internal hazards external hazards for POS: full power low power and shutdown Level 2 covering plant internal events internal hazards external hazards � for POS: full power low power and shutdown Level 3 covering plant internal events � internal hazards � external hazards � for POS: full power � low power and shutdown � Spent fuel pool � internal hazards � external hazards �
2.2. Initiating event The main initiating event to be considered is a loss of external electrical sources (LOOP).
• Is the LOOP event considered as a single initiating event or are there sub-categories (especially according to the root cause of the event and to the recovery conditions)? Please briefly describe sub-categories if used.
Loss of off-site power (LOOP) is a design basis event. Depending upon the detail of the scenario there are a number of possible outcomes including islanded operation. Loss of the off-site power to one or both units of Cernavoda NPP may lead either to the operation of the unit in the island mode or to the loss of Class IV power, depending on the specific conditions. In case of failure of islanded operation and also loss of off-site power events, the station experiences a total loss of class IV event (both ODD and EVEN electrical distribution sections are affected). If only one electrical distribution division (ODD or EVEN) is lost, a partial loss of class IV event is considered.
1. Categories: short loop, long loop, induced loop by other transients? 2. How is recovery considered? With one or several recovery times and
laws/rules? (e.g. with fixed given mission times for the systems, or with a

NEA/CSNI/R(2017)5
184
recovery law/rule versus time)? Do recovery model and recovery probabilities differentiate according to the causes of the initiating event(s)?
3. What are the corresponding frequencies? This question covers several points: The frequency of each sub-category And, if relevant for your PSA: Conditional probability of a consequential LOOP given a plant transient Conditional probability of a transfer of plant electrical buses from a
“normal” transformer to a “reserve” transformer Conditional probability of house-load operation
4. Is there consideration of variations in frequencies/probabilities for different seasons/modes of operation (e.g. during refuelling?)
5. Are there in the PSA other initiating events (other than LOOP) leading to similar consequences (for example intrinsic failure of electrical bus bars) with a significant contribution?
6. Are the LOOP events consequential to external hazards treated specifically or included in a more generic event? What kinds of external hazards were considered among the hazards that can cause LOOP in the PSA? What are the corresponding frequencies?
Loss of off-site power is a design basis event which does not pose any threat for the plant. The plant can operate at reduced power levels in the islanding mode. In the case of reactor or turbine generator trip after loss of off-site power, the electrical loads will not be supplied from the plant generator anymore. This event is called loss of Class IV electrical power and is part of the design basis. The reactor shutdown is ensured by any of the two redundant shutdown systems, and the cooldown is ensured by the primary or the alternate ultimate heat sinks. SBO has been considered to be loss of off-site power, loss of ordinary back-up AC power and loss of permanently installed diverse back-up AC power sources. This is considered a beyond design basis event and assumes loss of external grid, stand-by DGs and the EPS DGs. It is assumed that the batteries remain available The plant shutdown is ensured automatically either by SDS1 or SDS2 on the process trip parameters, and the cooling of the reactor will be ensured by thermosyphoning in the primary coolant system. The heat will be transferred to steam generators and discharged to atmosphere via steam discharge valves. The necessary water to the steam generators will be gravitationally fed from the dousing tank inventory through the boiler make-up water. Seismic induced loss of all electrical power supply (all AC and DC sources) considered the unavailability of the batteries also, besides the SBO.
• What were the data sources and methods used to estimate initiating event frequencies? Initiating event frequency specific to CANDU reactors are used as generic data and then updated by plant operating experiences using Bayesian updating.
1. Have you performed a detailed grid reliability analysis? Are the following points explicitly treated or grouped into a more global LOOP event: different grid connections or sources, (e.g. gas turbines)?
The frequency of loss-of-grid is a significant contributor for loss of ClassIV power supply. A 2.E-2 ev/year value was considered, as part of calculation for Loss of Class IV IE for Cernavoda.
2. House / island mode operation (and then for how long time period)? LOOP consequential to a transient?
The plant can operate at 60% reduced power levels in the islanded mode. The resulting island could operate almost normally (however, with reduced power supply reliability) if the islanded power generating unit(s) can rapidly adjust the power output to match the loads remained in the island. Otherwise, the unbalance between the power produced and power consumed could lead to the local grid collapse: possible power generating units remaining isolated (supply only their internal electrical services) or even units tripping (the risk of LOOP is increased during this regime). The operation is limited in time based on administrative considerations if power is not restored.

NEA/CSNI/R(2017)5
185
• When relevant for your PSA, what are the conditional failure probabilities (e.g. given a transient (IE), the conditional probability of loss-of-grid connection or conditional switchover failure probability? Conditional probabilities for failure of house turbine/island mode operation?)
The probability for external grid loss following a reactor/turbine/generator trip depends on the size of the grid and the unit size. For Cernavoda it was considered a 5.E-2 value.
2.3. Main modelling assumptions
• What are the main modelling features of diesel generators, gas turbines/other possible sources, the electrical bus bars:
1. types of failure modes and level of details (i.e. if the detail of modelling enables identification of interesting insights, e.g. dependencies)
30. DG Failure to start, DG failure to run 2. CCF,
31. CCF have been considered between the following groups of components: DGs, CBs 3. mission time,
32. 24 hours 33.
• Was some guidance used for LOOP introduction/modelling in the PSA? LOOP event was not explicitly modelled in PSA. 2.4. Results All the following information, if available, is of interest:
• Risk metrics considered (e.g. Core Damage Frequency (CDF), Large Release Frequency (LRF) along with a definition of the associated metric (i.e. how are CDF and/or LRF defined for your PSA…).
Quantitative safety goals: - core damage frequency - large release frequency
A core damage accident results from an initiating event followed by the failure of one or more safety systems or safety support systems. Core damage frequency is a measure of the plant’s accident prevention capabilities. Small release frequency and large release frequency are measures of the plant’s accident mitigation capabilities. They also represent measures of risk to society and to the environment due to the operation of an NPP. Level 1 probabilistic analysis has been performed for both Cernavoda NPP Units. Level 1 PSA study includes contributions from Internal Events (including Fires and Floods) and Seismic Events, for plant full power operation and shutdown states. The results show a core damage frequency of 3.3E-5 events/year for Unit 1 and 3E-5 events/year for Unit 2, values that are three times less than the internationally accepted target of 1E-4 event/years (IAEA 75-INSAG-3) for operating plants. The large off-site release frequencies calculated per calendar year represent about 17.9% (Unit 1), respectively 20.1% (Unit 2) of the safety goal limit for internal and external events as recommended by IAEA 75-INSAG-3, namely 1E-05/ events/ year (one order of magnitude lower than that of core damage frequency). A risk monitoring programme was developed based on the existing PSA model and Equipment out of Service (EOOS) software. For Unit 1, the risk monitor application was implemented in 2006 for full power operation, respectively in 2008 for low power and shutdown states. For Unit 2, the EOOS Risk Monitor application was developed and implemented in 2008 for full power operation, respectively in 2009 for low power and shutdown states. For both units, risk monitoring results show that medium of Annual Cumulative Recorded CDF, calculated based on the calendar year CDF, is lower than the Average PSA Level 1 CDF.
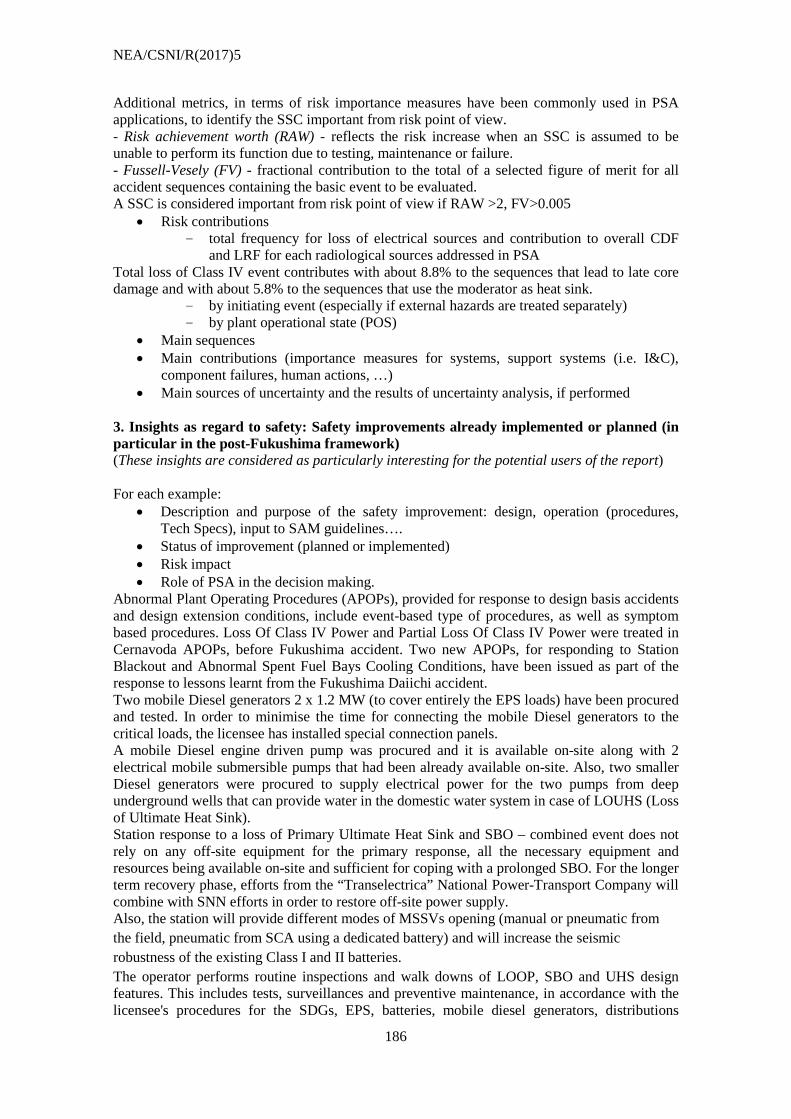
NEA/CSNI/R(2017)5
186
Additional metrics, in terms of risk importance measures have been commonly used in PSA applications, to identify the SSC important from risk point of view. - Risk achievement worth (RAW) - reflects the risk increase when an SSC is assumed to be unable to perform its function due to testing, maintenance or failure. - Fussell-Vesely (FV) - fractional contribution to the total of a selected figure of merit for all accident sequences containing the basic event to be evaluated. A SSC is considered important from risk point of view if RAW >2, FV>0.005
• Risk contributions - total frequency for loss of electrical sources and contribution to overall CDF
and LRF for each radiological sources addressed in PSA Total loss of Class IV event contributes with about 8.8% to the sequences that lead to late core damage and with about 5.8% to the sequences that use the moderator as heat sink.
- by initiating event (especially if external hazards are treated separately) - by plant operational state (POS)
• Main sequences • Main contributions (importance measures for systems, support systems (i.e. I&C),
component failures, human actions, …) • Main sources of uncertainty and the results of uncertainty analysis, if performed
3. Insights as regard to safety: Safety improvements already implemented or planned (in particular in the post-Fukushima framework) (These insights are considered as particularly interesting for the potential users of the report) For each example:
• Description and purpose of the safety improvement: design, operation (procedures, Tech Specs), input to SAM guidelines….
• Status of improvement (planned or implemented) • Risk impact • Role of PSA in the decision making.
Abnormal Plant Operating Procedures (APOPs), provided for response to design basis accidents and design extension conditions, include event-based type of procedures, as well as symptom based procedures. Loss Of Class IV Power and Partial Loss Of Class IV Power were treated in Cernavoda APOPs, before Fukushima accident. Two new APOPs, for responding to Station Blackout and Abnormal Spent Fuel Bays Cooling Conditions, have been issued as part of the response to lessons learnt from the Fukushima Daiichi accident. Two mobile Diesel generators 2 x 1.2 MW (to cover entirely the EPS loads) have been procured and tested. In order to minimise the time for connecting the mobile Diesel generators to the critical loads, the licensee has installed special connection panels. A mobile Diesel engine driven pump was procured and it is available on-site along with 2 electrical mobile submersible pumps that had been already available on-site. Also, two smaller Diesel generators were procured to supply electrical power for the two pumps from deep underground wells that can provide water in the domestic water system in case of LOUHS (Loss of Ultimate Heat Sink). Station response to a loss of Primary Ultimate Heat Sink and SBO – combined event does not rely on any off-site equipment for the primary response, all the necessary equipment and resources being available on-site and sufficient for coping with a prolonged SBO. For the longer term recovery phase, efforts from the “Transelectrica” National Power-Transport Company will combine with SNN efforts in order to restore off-site power supply. Also, the station will provide different modes of MSSVs opening (manual or pneumatic from the field, pneumatic from SCA using a dedicated battery) and will increase the seismic robustness of the existing Class I and II batteries. The operator performs routine inspections and walk downs of LOOP, SBO and UHS design features. This includes tests, surveillances and preventive maintenance, in accordance with the licensee's procedures for the SDGs, EPS, batteries, mobile diesel generators, distributions

NEA/CSNI/R(2017)5
187
systems and UHS design features. Additional inspections have been identified for equipment required by the new SBO APOP. 4. Insights with respect to PSA (methods and data) (Please indicate particular methods and data issues/problems related to the loss of electrical sources and how these issues were addressed (or indicate if these issues are still being evaluated). Specific examples of good practices will be particularly useful) Possible issues:
• Completeness • For CANDU 6, an explicit LOOP Initiating Event is not modelled in the PRA. The
LOOP event was considered in the modelling of Loss of CLASS IV Initiating Event. • HRA • There were not considered events associated with commission human errors. • Data on event frequencies • Data used for event frequencies are generic, updated with plant-specific data. • CCFs and dependencies • Generic values were used for CCF parameters. • Recoveries • Support calculations • Sequence duration. Mission time.
24 hours • Adverse effects of grid disturbances on on-site power systems
Multi-unit events • No multi-unit PSA has been developed. PSA for Cernavoda Unit 2 was developed using
the model developed for Unit 1, with specific modifications. • Selectivity assumptions/modelling
The events with occurring frequency lower than 1.E-7 ev/year were not taken into consideration.

NEA/CSNI/R(2017)5
188
SLOVAKIA QUESTIONNAIRE Identification Please identify your organisation: Name: UJD SR, RELKO Country: SLOVAK REPUBLIC Address: UJD SR, Bajkalska 27, P.O.BOX 24, 82007 Bratislava, Slovak Republic RELKO Ltd, Racianska 75, P.O.BOX 95, 83008 Bratislava, Slovak republic Contact person: Jan Husarcek, UJD SR, Zoltan Kovacs, RELKO Telephone/e-mail: [email protected], +421 918343011, [email protected] +421 905253435 Are you - A Regulatory Body �yes - A Supporting Organisation to a Regulatory Body �yes - A Utility � - A Vendor � - A Consultant � - Other � 1. General plant and electrical supplies information
a) General • Plant type: WWER440, Bohunice V2 has two units in operation, Mochovce plant has 2
units in operation • Electrical power [MWe]: 470 MW/ reactor
b) Electrical supplies • Grid connection
- Number of independent feeders into switchyard (No. and types of grid connections)
- Each unit has a 400 kV line to export to the grid and one reserve line (110kV or 220kV line). After reactor trip the generator breakers will open and the 400 kV line is used to supply the self consumption. After loss of 400 kV lines the self consumption is transferred to the reserve line. The reserve lines of both units can be interconnected. Given loss of 400 kV line and the reserve line the emergency DGs are started.
- Alternate/independent ac grid sources that might be available (e.g. stand-by gas turbines). Yes, in case of the Bohunice V2 station the third grid is available from the water station. In addition SAM mobil DG can be used.
• Designed for house turbine operation, island operation (e.g. the main generator can supply house loads without reliance on or connection to the main switchyard). The power of TGs can be reduced to the level of self consumption, however, after LOOP there is reactor trip
• Number of EDGs and/or other internal sources (e.g. gas turbines) and capacity 3 EDGs per unit and one SAM DG
• Capacity for cross ties between trains or units The interconnection is possible on the level of reserve lines and on the level of the third grid in case of Bohunice V2 station
• Brief description of non-ac dependent decay heat removal systems (e.g. turbine-driven auxiliary feed water, motor driven pumps, natural circulation, etc.) Each RHR system is dependent on AC power

NEA/CSNI/R(2017)5
189
c) Other information if relevant for PSA: • Transmission system operator and operator requirements, there is no requirement for
transmission operator. The operator has to perform recovery of off-site power after LOOP. The time available to recovery action is more than 3 h (the recovery before SG dryout, given the EDGs unavailable ). There is significant difference here in comparison with western PWR where the SGs will dry out within 30 minutes after loss of feed water supply and primary feed and bleed is needed.
• Single or twin turbine/s there are two TGs per reactor • Other
2. PSA information and results For each PSA considered please provide the following information (an example is given in appendix) 2.1. PSA characteristics
• Context and PSA framework (regulatory position): level 1 and 2 full power and shutdown PSA is required by the regulatory authority
• PSA date (initial, revisions), living PSA, PSA updating is needed after significant changes in the plant
• PSA scope: Level 1 covering plant internal events � yes internal hazards � yes external hazards � yes for POS: full power � yes low power and shutdown � yes Level 2 covering plant internal events � yes internal hazards � yes external hazards � yes for POS: full power � yes low power and shutdown � yes Level 3 covering plant internal events � internal hazards � external hazards � for POS: full power � low power and shutdown � Spent fuel pool � internal hazards � external hazards �
2.2. Initiating event The main initiating event to be considered is a loss of external electrical sources (LOOP).
• Is the LOOP event considered as a single initiating event or are there sub-categories (especially according to the root cause of the event and to the recovery conditions)? Please briefly describe sub-categories if used. IE as simultaneous loss of 400 kV and reserve line,
1. Categories: short loop, long loop, induced loop by other transients? Fire induced LOOP and Seismic induced LOOP is considered
2. How is recovery considered? With one or several recovery times and laws/rules? (e.g. with fixed given mission times for the systems, or with a recovery law /rule versus time)? Do recovery model and recovery probabilities differentiate according to the causes of the initiating event(s)? The recovery must be done before SG dry out (3 h are consider the time window for recovery of the grid). No differentiate according to the causes.
3. What are the corresponding frequencies? This question covers several points: The frequency of each sub-category LOOP frequency (400kV and reserve line)5.61E-2 And, if relevant for your PSA: Conditional probability of a consequential LOOP given a plant transient Conditional probability of a transfer of plant electrical buses from a
“normal” transformer to a “reserve” transformer. Probability of failure to transfer to reserve line 0.071
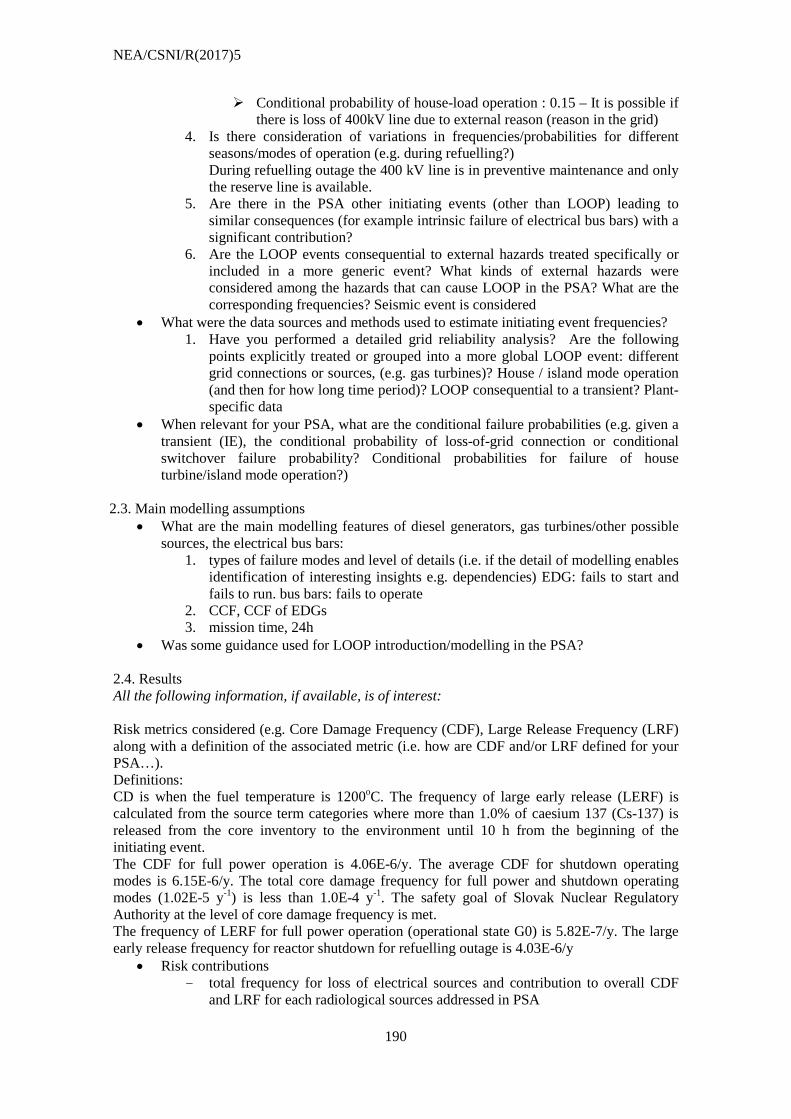
NEA/CSNI/R(2017)5
190
Conditional probability of house-load operation : 0.15 – It is possible if there is loss of 400kV line due to external reason (reason in the grid)
4. Is there consideration of variations in frequencies/probabilities for different seasons/modes of operation (e.g. during refuelling?) During refuelling outage the 400 kV line is in preventive maintenance and only the reserve line is available.
5. Are there in the PSA other initiating events (other than LOOP) leading to similar consequences (for example intrinsic failure of electrical bus bars) with a significant contribution?
6. Are the LOOP events consequential to external hazards treated specifically or included in a more generic event? What kinds of external hazards were considered among the hazards that can cause LOOP in the PSA? What are the corresponding frequencies? Seismic event is considered
• What were the data sources and methods used to estimate initiating event frequencies? 1. Have you performed a detailed grid reliability analysis? Are the following
points explicitly treated or grouped into a more global LOOP event: different grid connections or sources, (e.g. gas turbines)? House / island mode operation (and then for how long time period)? LOOP consequential to a transient? Plant-specific data
• When relevant for your PSA, what are the conditional failure probabilities (e.g. given a transient (IE), the conditional probability of loss-of-grid connection or conditional switchover failure probability? Conditional probabilities for failure of house turbine/island mode operation?)
2.3. Main modelling assumptions
• What are the main modelling features of diesel generators, gas turbines/other possible sources, the electrical bus bars:
1. types of failure modes and level of details (i.e. if the detail of modelling enables identification of interesting insights e.g. dependencies) EDG: fails to start and fails to run. bus bars: fails to operate
2. CCF, CCF of EDGs 3. mission time, 24h
• Was some guidance used for LOOP introduction/modelling in the PSA? 2.4. Results All the following information, if available, is of interest: Risk metrics considered (e.g. Core Damage Frequency (CDF), Large Release Frequency (LRF) along with a definition of the associated metric (i.e. how are CDF and/or LRF defined for your PSA…). Definitions: CD is when the fuel temperature is 1200oC. The frequency of large early release (LERF) is calculated from the source term categories where more than 1.0% of caesium 137 (Cs-137) is released from the core inventory to the environment until 10 h from the beginning of the initiating event. The CDF for full power operation is 4.06E-6/y. The average CDF for shutdown operating modes is 6.15E-6/y. The total core damage frequency for full power and shutdown operating modes (1.02E-5 y-1) is less than 1.0E-4 y-1. The safety goal of Slovak Nuclear Regulatory Authority at the level of core damage frequency is met. The frequency of LERF for full power operation (operational state G0) is 5.82E-7/y. The large early release frequency for reactor shutdown for refuelling outage is 4.03E-6/y
• Risk contributions - total frequency for loss of electrical sources and contribution to overall CDF
and LRF for each radiological sources addressed in PSA

NEA/CSNI/R(2017)5
191
L1 PSA Full power operation Initiating event (IE)
Description Frequency IE [y-1]
Conditional core damage probability
Core damage frequency [y-1]
% of the total core damage frequency
LOOP Loss of off-site power 6.62E-01 1.74E-06 1.15E-06 28.29
L1 PSA Shutdown operating mode No. Initiating
Event Description CDF
[1/y] mean value
Contribution to total CDF (%)
1 L(MI) Man-induced small LOCA 1.72E-06 27.39 2 LOP Loss of off-site power 1.55E-06 24.76
L2 PSA Full power operation – 9% contribution from LOOP L2 Shutdown operating modes – 15.1% contribution from LOOP
- by initiating event (especially if external hazards are treated separately) - by plant operational state (POS) – POS4.6 open reactor vessel low water level
• Main sequences • Main contributions (importance measures for systems, support systems (i.e. I&C),
component failures, human actions, …) • Main sources of uncertainty and the results of uncertainty analysis, if performed
3. Insights as regard to safety: Safety improvements already implemented or planned (in particular in the post-Fukushima framework) (These insights are considered as particularly interesting for the potential users of the report) For each example:
• Description and purpose of the safety improvement: design, operation (procedures, Tech Specs), input to SAM guidelines….
SAM implemented: depressurisation of RCS, external cooling of RPV, vacuum breaker, SAM DG, recombiners, external water sources for injection to RCS, spraying of containment and injection into the spent fuel pool.
SAMG implemented • Status of improvement (planned or implemented) Implemented in the Bohunice V2 NPP
and Mochovce NPP • Risk impact
Significant impact in the area of LERF. The frequency of LERF for full power operation is 5.82E-7/y. The frequency before implementation of the safety measures of SAM was 1.47E-6/y. Systems and guidelines for the severe accident management significantly contributed to risk reduction for full power operation. For original state of the plant there was only 8.81% probability that the confinement remains intact and prevents the uncontrolled release of fission products. After the implementation of SAM systems and SAMG the confinement functionality for full power operation is significantly increased. Given core melting, the probability that the confinement remains intact and prevents the uncontrolled release of fission products raised from 8.81% to 82%. The results can be summarised as follows:
- confinement remains intact – 82%, - confinement bypass – 1.5%, - confinement failure – 16.5%.
• Role of PSA in the decision making. 4. Insights with respect to PSA (methods and data) (Please indicate particular methods and data issues/problems related to the loss of electrical sources and how these issues were addressed (or indicate if these issues are still being evaluated). Specific examples of good practices will be particularly useful)

NEA/CSNI/R(2017)5
192
Possible issues: • Completeness • HRA • Data on event frequencies • CCFs and dependencies • Recoveries • Support calculations • Sequence duration. Mission time. • Adverse effects of grid disturbances on on-site power systems • Multi-unit events • Selectivity assumptions/modelling

NEA/CSNI/R(2017)5
193
SLOVENIA QUESTIONNAIRE Identification Please identify your organisation: Name: Slovenian Nuclear Safety Administration and Reactor Engineering Division, Jožef Stefan Institute Country: Slovenia Address: Republic of Slovenia, Ministry of agriculture and the environment, Slovenian Nuclear Safety Administration Litostrojska cesta 54, 1000 Ljubljana Contact person: Matjaž Podjavoršek Telephone/e-mail: 386 1 472 11 16 / [email protected] Are you - A Regulatory Body - A Supporting Organisation to a Regulatory Body - A Utility � - A Vendor � - A Consultant � - Other � 1. General plant and electrical supplies information
a) General • Plant type: NPP Krško is a single-unit two loop Westinghouse PWR with large dry
ambient containment • Electrical power [MWe]: 730MWe
b) Electrical supplies • Grid connection
- Number of independent feeders into switchyard (No. and types of grid connections) The NPP Krško has two switchyards – a 110 kV switchyard and a 400 kV switchyard. The generator is connected to the two 400 kV switchyard busses via generator load breaker, two step-up transformers 21 kV/400 kV and substation breaker. The 400 kV and 110 kV switchyards are connected via 300MVA transformer. The 400 kV switchyard includes five transmission circuit terminals, two double 400 kV circuits and one single 400 kV circuit. The plant is connected with separate 110 kV transmission line with the combined gas-steam power plant at Brestanica.
- Alternate/independent ac grid sources that might be available (e.g. stand-by gas turbines) 34. The plant has 110 kV transmission line to the combined gas-steam power plant at Brestanica that serves as the alternate preferred source. The Brestanica gas-turbine power plant is interconnected into the 110 kV transmission network of Slovenia where a chain of 8 hydropower stations on the Drava River, at a distance of approximately 90 km from Brestanica, provides a reliable source of power. Independently, in the event of a breakdown of the 110 kV systems, Brestanica power plant can cut-of all loads and continue to operate for NPP Krško. Brestanica is equipped with three gas powered units of 23 MVA (23 MW) capable of black start in the event of a breakdown of the 110 kV system and to provide electrical power to Krško NPP station auxiliary transformer in 20 minutes.
• Designed for house turbine operation, island operation

NEA/CSNI/R(2017)5
194
- Yes. If the 400 kV switchyard bus protection system is activated, the substation breaker will open, the turbine function Load Drop Anticipator will be activated and plant will be powered from generator through closed generator load breaker.
• Number of EDGs and/or other internal sources (e.g. gas turbines) and capacity - Two tandem diesel engine driven, 6300 volt, 0.8 power factor lagging, 50 Hz,
3500 kW net (continuous) generators (EDG1 and EDG2) and a 4000 kW net (continues) generator (DG3). Each unit DG1 and DG2 have a short time (30 minute) rating of 4178 kW and a 2000 hour rating of 3893 kW. DG3 unit has a 2000 hour rating of 4440 kW.
• Capacity for cross ties between trains or units - The third DG3 diesel generator can serve as either an alternate AC (AAC)
source to the plant in case of a total loss of on-site and off-site power or as a “swing” substitute to either of the train diesel generators (EDGs).
• Brief description of non-ac dependent decay heat removal systems (e.g. turbine-driven auxiliary feed water, motor driven pumps, natural circulation, etc.)
- Unit has a 100% capacity turbine-driven auxiliary feed water pump to provide makeup water to the steam generators independent of AC power. Operation of the turbine-driven pump requires DC power and is supported by the station DC batteries. It also allows manual operation (if DC power is unavailable).
- Four separate and independent DC battery systems are provided for the unit, three 125 V DC and one 220 V DC. Upon loss of station AC power, the entire DC load is supplied by the battery. The important instrumentation and control is powered from 118 V distribution which is powered through inverters powered from DC system.
- The batteries have sufficient capacity to cope with a 4 hour station blackout (loss of all AC power), to provide safe shutdown of the unit.
c) Other information if relevant for PSA: • Transmission system operator and operator requirements
- In the case of a total breakdown of transmission system operator is obligated to establish electrical power to the Krško NPP as priority per written agreement. The request for the black start of two or of three gas turbines in Brestanica power plant is issued in accordance with instructions.
• Single or twin turbine/s - The Krško NPP have single turbine
• Other 2. PSA information and results For each PSA considered please provide the following information (an example is given in appendix) 2. 1. PSA characteristics
• Context and PSA framework (regulatory position) - Developed by the Westinghouse in 1994 within Individual Plant Examination
of Krško Nuclear Power Plant to meet requirements from SNSA decree 318-64/90-1238/ML from 14. 6. 1991.
• PSA date (initial, revisions), - Initial PSA – January 1994 - Latest revision – NEKC27 – September 2013
• PSA scope: 35. Level 1 covering 36. plant internal events internal hazards external hazards 37. for POS: full power low power and shutdown
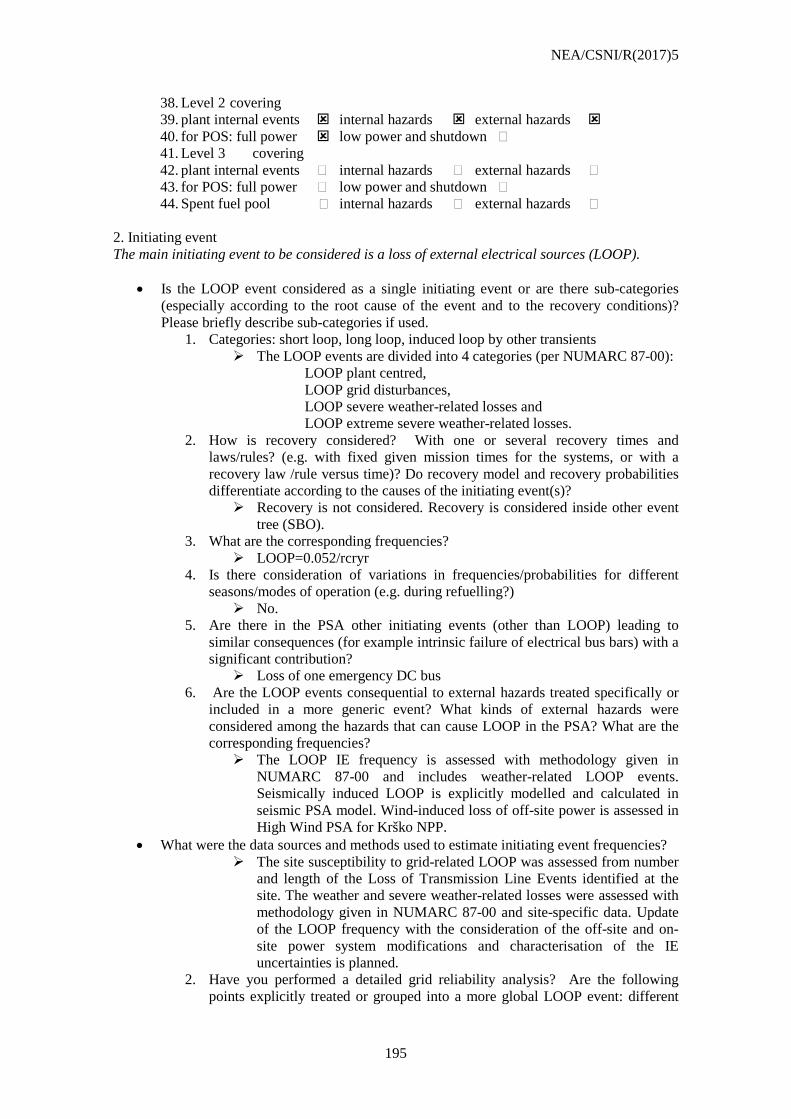
NEA/CSNI/R(2017)5
195
38. Level 2 covering 39. plant internal events internal hazards external hazards 40. for POS: full power low power and shutdown � 41. Level 3 covering 42. plant internal events � internal hazards � external hazards � 43. for POS: full power � low power and shutdown � 44. Spent fuel pool � internal hazards � external hazards �
2. Initiating event The main initiating event to be considered is a loss of external electrical sources (LOOP).
• Is the LOOP event considered as a single initiating event or are there sub-categories (especially according to the root cause of the event and to the recovery conditions)? Please briefly describe sub-categories if used.
1. Categories: short loop, long loop, induced loop by other transients The LOOP events are divided into 4 categories (per NUMARC 87-00):
LOOP plant centred, LOOP grid disturbances, LOOP severe weather-related losses and LOOP extreme severe weather-related losses.
2. How is recovery considered? With one or several recovery times and laws/rules? (e.g. with fixed given mission times for the systems, or with a recovery law /rule versus time)? Do recovery model and recovery probabilities differentiate according to the causes of the initiating event(s)? Recovery is not considered. Recovery is considered inside other event
tree (SBO). 3. What are the corresponding frequencies?
LOOP=0.052/rcryr 4. Is there consideration of variations in frequencies/probabilities for different
seasons/modes of operation (e.g. during refuelling?) No.
5. Are there in the PSA other initiating events (other than LOOP) leading to similar consequences (for example intrinsic failure of electrical bus bars) with a significant contribution? Loss of one emergency DC bus
6. Are the LOOP events consequential to external hazards treated specifically or included in a more generic event? What kinds of external hazards were considered among the hazards that can cause LOOP in the PSA? What are the corresponding frequencies? The LOOP IE frequency is assessed with methodology given in
NUMARC 87-00 and includes weather-related LOOP events. Seismically induced LOOP is explicitly modelled and calculated in seismic PSA model. Wind-induced loss of off-site power is assessed in High Wind PSA for Krško NPP.
• What were the data sources and methods used to estimate initiating event frequencies? The site susceptibility to grid-related LOOP was assessed from number
and length of the Loss of Transmission Line Events identified at the site. The weather and severe weather-related losses were assessed with methodology given in NUMARC 87-00 and site-specific data. Update of the LOOP frequency with the consideration of the off-site and on-site power system modifications and characterisation of the IE uncertainties is planned.
2. Have you performed a detailed grid reliability analysis? Are the following points explicitly treated or grouped into a more global LOOP event: different

NEA/CSNI/R(2017)5
196
grid connections or sources, (e.g. gas turbines)? House / island mode operation (and then for how long time period)? LOOP consequential to a transient? The LOOP frequency was adapted with consideration of the preventive
maintenance unavailability of the 110 kB line, which came as a part of the NPP Krško Online Maintenance programme.
• When relevant for your PSA, what are the conditional failure probabilities (e.g. given a transient (IE), the conditional probability of loss-of-grid connection or conditional switchover failure probability? Conditional probabilities for failure of house turbine/island mode operation?)
2.3. Main modelling assumptions
• What are the main modelling features of diesel generators, gas turbines/other possible sources, the electrical bus bars:
1. types of failure modes and level of details (i.e. if the detail of modelling enables identification of interesting insights e.g. dependencies) Failure modes modelled for diesel generators are failure to start and
failure to run 2. CCF
Diesel generators are assumed to be susceptible to CCF on failure to start and failure to run/load
3. mission time 24 hrs
• Was some guidance used for LOOP introduction/modelling in the PSA? 1. The NSAC-182 provided a generic value for plant and grid disturbances used in
Krško IPE PSA study. Origin of LOOP is NUREG 3862. 2.4. Results All the following information, if available, is of interest:
• Risk metrics considered (CDF, LRF…). Please precise the definition. - CDF – Core Damage Frequency – the frequency of damage to a reactor core
sufficient to lead to a release of radioactive material from the core that could affect public health (see NUREG-2122, “Glossary of Risk-Related Terms in Support of Risk-Informed Decision Making”). Plant-specific definition for CD: The core damage occurs if: The maximum fuel/cladding temperature reaches 923 K but does not exceed 1348K, and the time while above 923K exceeds 30 minutes, the fuel is considered to be significantly oxidised; the maximum fuel/cladding temperature exceeds 1348K, the core is considered to be severely damaged.
- LERF – Large Early release frequency – Plant-specific definition for LER: LER are all radioactive releases (scrubbed or unscrubbed) from the containment in the first 4 hours of the accident, resulting from bypass or isolation failure or containment failure itself.
• Risk contributions - total frequency for loss of electrical sources and contribution to overall CDF
and LRF for each radiological sources addressed in PSA. - by initiating event (especially if external hazards are treated separately) - by plant operational state (POS)
45. Total CDF of the Krško NPP is approximately 4.9E-05/rcryr and CDF for internal initiating events is 1.4E-05. The IIE PSA in NEK Baseline PSA Model contains 16 internal initiating events categories. The contributions of particular initiator categories to IIE CDF are given in bellow table.

NEA/CSNI/R(2017)5
197
Initiating events IE Coding IIE Frequency (/rcryr)
IIE CDF Contribution (/rcryr)
% of IIE CDF
Station Blackout SBO 1.94E-06 2.42E-07 1.2% Loss of Off-site Power LSP 5.17E-02 8.68E-07 4.3% Loss of Vital DC Bus LDC 2.79E-03 9.95E-08 0.5%
• Main sequences
Dominant sequence represents failure of secondary heat sink and failure of primary feed and bleed following reactor trip caused by loss of off-site power.
• Main contributions (importance measures for systems, support systems (i.e. I&C), component failures, human actions, …) (Importance measures based on RIR)
• Main sources of uncertainty and the results of uncertainty analysis, if performed - The uncertainty analysis for initiating events is one of the tasks
foreseen/required after the periodic safety review of PSA safety factor. 46. 3. Insights as regard to safety: Safety improvements already implemented or planned (in particular in the post-Fukushima framework) (These insights are considered as particularly interesting for the potential users of the report) For each example:
• Description and purpose of the safety improvement: design, operation (procedures, Tech Specs), input to SAM guidelines….
• Status of improvement (planned or implemented) • Risk impact • Role of PSA in the decision making.
- Installation of new, third EDG at Krško NPP with minimisation of the CCF potential with current EDG’s. Installation of the filtered containment venting. Additional modifications proposed and approved after the stress tests.
4. Insights with respect to PSA (methods and data) (Please indicate particular issues/problems related to the loss of electrical sources, which needed (or are still needing) specific attention. Examples of specific developments will be very interesting) Possible issues:
• Data on event frequencies • CCFs and dependencies • Recoveries • Support calculations • Power grid reliability analysis • Sequence duration. Mission time. • Adverse effects of grid disturbances on on-site power systems • Selectivity assumptions/modelling
- Data uncertainties characterisation and consideration in PSA models - Update of the LOOP frequency with the consideration of changes in
off-site and on-site power system - Data uncertainties characterisation and consideration in the PSA models - Recovery times assessment and characterisation - Power grid reliability analyses and other support calculations - Long-term SBO modelling

NEA/CSNI/R(2017)5
198
SPAIN QUESTIONNAIRE. Identification Please identify your organisation: Name: Nuclear Safety Council. (Consejo de Seguridad Nuclear – CSN). Country: Spain. Address: C/ Pedro Justo Dorado Dellmans, 11 28040 – Madrid. Contact person: Vázquez, M. Teresa. Telephone/e-mail: + 34 91 346 0260 / [email protected] Are you - A Regulatory Body x - A Supporting Organisation to a Regulatory Body � - A Utility � - A Vendor � - A Consultant � - Other � 1. General plant and electrical supplies information
a) General • Plant type: • Electrical power [MWe]:
NPP Type (in a site) Electrical power (MWe) Westinghouse PWR/3 loop (2 units) 1 x 1035.3 MWe, 1 x 1045 MWe Westinghouse PWR/3 loop (2 units) 1 x 1032.5 MWe, 1x1027.21 MWe Westinghouse PWR/3 loop 1087.14 MWe KWU PWR/3 loop 1066 MWe General Electric BWR 6 – Mark III 1092.02 MWe
b) Electrical supplies • Grid connection
- Number of independent feeders into switchyard (No. and types of grid connections)
- Alternate/independent ac grid sources that might be available (e.g. stand-by gas turbines)
• Designed for house turbine operation, island operation (e.g. the main generator can supply house loads without reliance on or connection to the main switchyard)
• Number of EDGs and/or other internal sources (e.g. gas turbines) and capacity • Capacity for cross ties between trains or units • Brief description of non-ac dependent decay heat removal systems (e.g. turbine-driven
auxiliary feed water, motor driven pumps, natural circulation, etc.)
c) Other information if relevant for PSA: • Transmission system operator and operator requirements • Single or twin turbine/s • Other

NEA/CSNI/R(2017)5
199
NPP type (in a site)
General plant and electrical supplies information Non-Ac dependent decay heat removal systems
Westinghouse PWR/3 loop (2 units) (Case 1)
The electricity supply for start-up and for emergency situations is taken from the 220 kV switchyard, which is interconnected with the 220 kV off-site grid by means of two lines. An autotransformer links the 220 kV switchyard to the site 400 kV switchyard, to which 8 off-site lines connect. The 220 kV has a “ring” configuration and if a defect occurs in any of these circuits it is possible to isolate the affected line without this affecting the power supply to the start-up transformers. In the event of a loss of off-site power (LOOP) in one of the groups, the 2 safeguards busses are fed via the respective Emergency Diesel Generator (5.5 KVA). In addition, several lines are available that allow power to be supplied from four hydroelectric stations. In the event of a complete loss of alternating current (SBO: Station Blackout), i.e. loss of both the off-site sources and the 4 aforementioned diesel generators, there is a fifth generator (7.5KVA) which may be connected manually to replace any of the other four. All the services of this generator are standalone, including the air cooling and batteries, and have the same capacity, design requirements and qualification as the rest of the emergency diesel generators.
The Auxiliary Feed water System is designed to inject water into the Steam Generators in response to any event causing the reactor to scram, allowing sensible and residual heat to be removed from the reactor core. The system is equipped with a steam turbine-driven pump non-ac depending. The turbine-driven pump is capable by itself of providing the steam generators with the flow required to remove the residual heat from the reactor core. The preferred source of water for the system is the Feed water Tank. Once this is depleted, the Condensate Tank or the essential services water system may be aligned manually.
Westinghouse PWR/3 loop (2 units) (Case 2)
The electricity required for start-up and for emergency loads is taken from the 110 kV switchyard, which is connected to the 220 kV external grid and, by means of a 200 MVA transformer, to the 400 kV switchyard. Off-site supply for the safeguards systems is taken from the 110 kV grid via the 62 MVA Auxiliary Start-up Transformers (AST), of which there are 2 for each group. In the event of a loss of off-site power (LOOP) to one of the groups, the 2 safeguards busses are fed by the respective 5 625 KVA Emergency Diesel Generator. In the event of complete loss of alternating current (SBO: Station Blackout), that is to say the loss of both the off-site sources and the aforementioned Diesel Generators, there is a third 2600 KVA diesel (shared by the two groups) that may be connected manually to one of the safeguards busses of each of the nuclear groups. In addition, the 220 kV line coming from a dedicated hydroelectric plant with auto start capability would allow feed to be provided to safeguards busses (“island configuration”).
The Auxiliary Feed water System is designed to inject water into the Steam Generators in response to any event causing the reactor to scram, allowing sensible and residual heat to be removed from the core. The system is equipped with a steam turbine-driven pump non-ac depending. The turbine-driven pump is capable by itself of providing the steam generators with the flow required to remove the residual heat from the reactor core. The preferential source of water for the system is the Condensate Tank (908 m3). As an alternative, there is the possibility to draw water from the cooling tower make-up storage pool with a capacity of 29 774 m3.
Westinghouse PWR/3 loop
The plant is equipped with 3 independent off-site sources of electricity on three lines supplying power at 400 kV, 220 kV and 110 kV. The 400 kV feed is the preferential source for the auxiliary services of the Plant during normal operation and outages via the Group Transformer (TAU), which feeds all the class 1E and non-class 1E 6.25 kV busses by way of the grouped phase busses, to which the other 2 off-site sources are also connected. The 220 kV grid feeds the Auxiliary Transformer (TAE), which in turn supplies the class 1E and non-class 1E 6.25 kV busses. The 110 kV source is used in the event of unavailability of the 400 kV or 220 kV networks, fundamentally during refuelling outages. In the event of a loss of off-site power (LOOP), the safeguards busses are fed from the respective 7200 KVA Emergency Diesel Generator. In addition, the 220 kV line coming from a dedicated, hydroelectric plant with auto start capability would allow feed to be provided to the normal and safeguards busses (“island configuration”). In the event of Station Blackout (SBO), i.e. loss of off-site sources and of the aforementioned Diesel Generators, use will be made of a third 2814 KVA Diesel Generator, which is capable of feeding the battery chargers and Hydrostatic Test Pump in order to maintain injection to the RCP seals or make up of inventory to the reactor coolant system.
The Auxiliary Feed water System is designed to inject water into the Steam Generators in response to any event causing the reactor to scram, allowing sensible and residual heat to be removed from the core. The system is equipped with a steam turbine-driven pump non-ac depending. The turbine-driven pump is capable by itself of providing the steam generators with the flow required to remove the residual heat from the reactor core. The preferential source of water for the system is the Condensate Tank (1 850 m3). As an alternative, there is the auxiliary feed water back-up tank with a capacity of 4 540 m3.
KWU PWR/3 loop For internal plant consumption, NPP has the following supplies: the main 400 kV grid, which continues to be available following generator trip the “generation breaker” opens, the main generator for in-house consumption (“island” mode of operation) and feed from the 220 kV back-up grid in the event of failure of the two previous sources. In addition to the above, there is another source for the safeguards and emergency networks from a third 132 kV off-site grid, independent from the 400 kV and 220 kV feeds and
The plant has an Emergency Feed water System with 4 trains, each equipped with a diesel generator and a diesel-driven pump, which allow water to be injected into the Steam Generators and provide electrical supply for all the associated loads. The system has independent sources of water.

NEA/CSNI/R(2017)5
200
NPP type (in a site)
General plant and electrical supplies information Non-Ac dependent decay heat removal systems
capable of driving and maintaining the plant in safe conditions. In the event of loss of off-site power (LOOP), the supply for the internal safeguards and emergency networks is provided by the automatic start-up of the four (4) Safeguards Diesel Generators. There are also procedures contemplating the start-up of three hydroelectric stations. In the event of complete loss of alternating current (SBO: Station Blackout), i.e. the loss of both the off-site sources and the aforementioned Diesel Generators, there are four (4) Emergency Diesel Generators to maintain electrical supply for the safety-related equipment if necessary.
General Electric BWR 6 – Mark III
The plant is equipped with 2 independent off-site electrical sources via various lines supplying power at 400 kV and 138 kV and constituting the preferred source for plant start-up and shutdown, as well as for feed for the normal 6.3 kV busses (A1, A2, A3 and A4) and safeguards busses (EA1 and EA2) during plant outages. There is a “generation breaker” (52G) that allows the generator to be isolated from the rest of the grid, thus making it possible to provide feed for the plant electrical services from the 400 kV switchyard in the event of tripping of the group, via the main transformer (T1) and the auxiliary transformers (T-A1 and T-A2). In the event of a loss of off-site power (LOOP), the safeguards busses are fed by the respective 5 509 KVA Emergency Diesel Generator. In addition, preferential feed from four hydroelectric stations is contemplated in the procedures, all of these having an autonomous start-up capacity. In the event of a complete loss of alternating current (SBO: Station Blackout), i.e. loss of the off-site sources and of the aforementioned diesel generators, there is a third 3 000 KVA diesel generator that provides feed for the HPCS pump and its auxiliary equipment, thus allowing the inventory of the reactor cooling system to be maintained.
Furthermore, the plant has a system, the Reactor Core Reactor Core Isolated Cooling (RCIC), which is equipped with a turbine-driven pump that takes suction from the Condensate Tank (and alternatively from the Pressure Suppression Pool) and that also allows reactor inventory to be maintained.
2. PSA information and results For each PSA considered please provide the following information (an example is given in appendix) 2.1. PSA characteristics
• Context and PSA framework (regulatory position): PSA is a regulatory requirement for Spanish NPPs. PSAs have been developed by licensees who update them regularly. PSAs are reported to CSN. CSN makes use of them for Regulatory activities.
• PSA date (initial, revisions), Work on PSA started in the early nineties. Licensees are requested to update their PSA data analysis after each refuelling outage, and a more extensive update is made if there are significant plant changes. Depending on the scope of PSA the date of the revisions is different between 2010 and 2013.
• PSA scope: Level 1 covering plant internal events x internal hazards x external hazards � for POS: full power x low power and shutdown x Level 2 covering plant internal events x internal hazards x external hazards � for POS: full power x low power and shutdown � Level 3 covering plant internal events � internal hazards � external hazards � for POS: full power � low power and shutdown � Spent fuel pool x internal hazards x external hazards �

NEA/CSNI/R(2017)5
201
2.2. Initiating event The main initiating event to be considered is a loss of external electrical sources (LOOP).
• Is the LOOP event considered as a single initiating event or are there sub-categories (especially according to the root cause of the event and to the recovery conditions)? Please briefly describe sub-categories if used.
1. Categories: short loop, long loop, induced loop by other transients? Spanish PSAs consider a unique type of LOOP as initiator, which comprises plant centred and external events. For other PSA initiators, a probability of a loss of external power is assumed to occur during the mitigation sequence (24hours). 2. How is recovery considered? With one or several recovery times and
laws/rules? (e.g. with fixed given mission times for the systems, or with a recovery law /rule versus time)? Do recovery model and recovery probabilities differentiate according to the causes of the initiating event(s)?
PSAs consider different recovering times in case of Diesel generators failure to supply power to the emergency buses. For each NPP, several points in the sequences are set. In general terms, those are: a short term (in the first half hour), battery depletion time and long term before core damage. In 2012, after an analysis requested by CSN about how Spanish PSA considered LOOP, an agreement was reached between CSN and licensees to consider a non-recovery probability curve obtained from the operating experience that parametrically considers the LOOP origin: (plant centred or grid+atmospheric causes) 3. What are the corresponding frequencies? This question covers several points:
The frequency of each sub-category And, if relevant for your PSA: Conditional probability of a consequential LOOP given a plant transient Conditional probability of a transfer of plant electrical buses from a
“normal” transformer to a “reserve” transformer Conditional probability of house-load operation
NPP type (in a site) Frequency (IE-LOOP) Non-recovery Probability* LOOP given transient Method Results Method Results
Westinghouse PWR/3 loop (2 units) (Case 1) Rev. 2012
Own experience at the site: (x=N/T) Gamma function
3.12E-2 /y Own experience in the site: Lognormal:(time – probability) 15 min are added for human actions
30´– 2.0E-1 60´– 2.0E-2 2 h – 1.0E-3 4 h – 1.0E-4
Own experience at the site
Westinghouse PWR/3 loop (2 units) (Case 2) Rev. 2012
Own experience at the site: (x=N/T) Gamma function
3.38E-2/y Own experience in the site: Lognormal:(time – probability) Recovery probability depend on LOOP: Plant centred Grid centred (atmospheric+grid)
55´- 3.64E-3 1 h – 3.41E-3 6.2 h – 8.72E-4
Own experience at the site 1.01E-4
Westinghouse PWR/3 loop Rev. 2013
Own experience at the site: Own experience in the site. Bayes. Gamma function (x = (2N+1)/2T)
1.78 E-2 /y Own experience in the site: Lognormal:(time – probability) Recovery probability depend on LOOP: Plant centred Grid centred (atmospheric+grid)
0.64 h – 5.13E-3 2.1 h – 2.01E-3 4.4h – 1.15E-3
Own experience at the site 5.62E-5
KWU PWR/3 loop (Rev. 2013)
Own experience. Several configurations based on island configuration
4.19·E-2/y (400KW) Failure Probability island conf= 0.1
Own experience in the site: Lognormal:(time – probability) Recovery probability depend on LOOP: Plant centred Grid centred
0.75 h- 1.57E-1 3 h-6.40 E-2
Own experience at the site (400Kv)1.15E-4 (220KV) 5.47E-7

NEA/CSNI/R(2017)5
202
NPP type (in a site) Frequency (IE-LOOP) Non-recovery Probability* LOOP given transient Method Results Method Results
(atmospheric+grid) General Electric BWR 6 – Mark III (Rev. 2012)
Own experience at the site. Bayes. Gamma function (x = (2N+1)/2T)
1.87 E-2/y 0.55 h NUREG-1032 data for plant centred events For 4h/9h: Recovery curve
0.55h – 3.00E-2 4h – 1.00E-4 9h – 1.00E-5
Own experience at the site 2.24E-6 (400Kv)1.04E-4 (138Kv) 1.04E-4
* Recoveries are estimated as power from external grid to plant transformers. Afterwards, human actions are necessary to have power at the plant’s safety bus bars.
4. Is there consideration of variations in frequencies/probabilities for different
seasons/modes of operation (e.g. during refuelling?). No differences in frequencies by season, but NPPs assess the operating experience in order to verify the applicability for an event depending on the configuration in a different operation mode. 5. Are there in the PSA other initiating events (other than LOOP) leading to
similar consequences (for example intrinsic failure of electrical bus bars) with a significant contribution?
All PSAs consider individual loss of different (safety/non-safety; AC/DC) busses. The impact depends on the plant. 6. Are the LOOP events consequential to external hazards treated specifically or
included in a more generic event? What kinds of external hazards were considered among the hazards that can cause LOOP in the PSA? What are the corresponding frequencies?
External hazards are considered separately. Extreme natural hazards (earthquake, strong winds, etc.) have been assessed using IPEEE methodologies. Atmospheric problems which have caused a LOOP have been used to quantify initiating event frequencies.
• What were the data sources and methods used to estimate initiating event frequencies? 1. Have you performed a detailed grid reliability analysis? Are the following
points explicitly treated or grouped into a more global LOOP event: different grid connections or sources, (e.g. gas turbines)? House/island mode operation (and then for how long time period)? LOOP consequential to a transient?
The data sources for the analysis are obtained from historical losses at NPP sites. Licensees have not performed a detailed grid analysis for obtaining LOOP frequencies. A more detailed analysis has been done for obtaining the probability of non-recovery as a function of time. NPPs have procedures in place to get power supply from several hydraulic stations. After Fukushima, these configurations and possibilities have been strengthened and tested. They are taken into account for recovery analysis in the last PSA L1 revision. In addition PSAs’analyse and quantify the human actions needed to recover power to the emergency buses once power is available from the grid.
• When relevant for your PSA, what are the conditional failure probabilities (e.g. given a transient (IE), the conditional probability of loss-of-grid connection or conditional switchover failure probability? Conditional probabilities for failure of house turbine/island mode operation?). (see previous table)
2.3. Main modelling assumptions
• What are the main modelling features of diesel generators, gas turbines/other possible sources, the electrical bus bars:
1. types of failure modes and level of details (i.e. if the detail of modelling enables identification of interesting insights, e.g. dependencies).
Models consider failure to start and failure to run for emergency diesels, test and maintenance (where applicable), failure of the start signals (logic), spurious

NEA/CSNI/R(2017)5
203
actuation of protections and fuel supply. In addition, models consider cooling support system dependencies and failure caused by non-switching off loads 2. CCF, Models consider the emergency diesel common cause failure for failure to start and failure to run. 3. Mission time. As a general rule, 24h is considered. In some cases, a shorter
mission time is used depending on the probability of grid recovery before core damage.
• Was some guidance used for LOOP introduction/modelling in the PSA? 2.4. Results All the following information, if available, is of interest: (For this questionnaire, only at power level 1 results are given)
• Risk metrics considered (e.g. Core Damage Frequency (CDF), Large Release Frequency (LRF) along with a definition of the associated metric (i.e. how are CDF and/or LRF defined for your PSA…). CDF: The frequency of damage to a reactor core as the sum of frequencies of sequences of accidents that might lead to damage to the reactor core and changes in its structural geometry.
• Risk contributions - total frequency for loss of electrical sources and contribution to overall CDF
and LRF for each radiological sources addressed in PSA - by initiating event (especially if external hazards are treated separately) - by plant operational state (POS)
• Main sequences • Main contributions (importance measures for systems, support systems (i.e. I&C),
component failures, human actions, …) • Main sources of uncertainty and the results of uncertainty analysis, if performed
NPP type (in a site)
IE-LOOP CDF (IE-LOOP)
Dominant sequences Dominant components in the sequences
Westinghouse PWR/3 loop (2 units) (Case 1) Rev. 2012
3.12E-2 /y 2.9E-7 /y (13.47% CDF)
S3 – Failure to recover electrical supply (long term). S11 – Failure of auxiliary feed water and failure to recover electrical supply on 4840 sec.
S3 – CCF diesel generator/ Human failure to recover after SBO/ Fifth diesel generator supply other unit /CCF switches/ CCF to start SW pumps S11 – CCF diesel generator/ CCF 125 VDC batteries. Human failure to start components after recovering/ CCF to start SW pumps/ CCF switches
Westinghouse PWR/3 loop (2 units) (Case 2) Rev. 2012
3.38E-2/y 9.634E-7 /y (8.42% CDF)
T1-7: Successful short-term recovery with auxiliary feed water (motor driver pump) but loss primary integrity and failure of high pressure injection. T1-18: Failure of auxiliary feed water and operator is successful in recovering external grid before 50min and feeding SGTR with motor pumps but failure of high pressure injection occurs. (loss primary integrity)
T1-7. Hydrostatic pump fails (power coming from fifth diesel)/CCF service water pumps or support system (Diesel and high pressures pumps) T1-18. AFWS Valve control failure / CCF service water pumps or support system (Diesel and high pressure injection pumps)
Westinghouse PWR/3 loop Rev. 2013
1.64 E-1 /y 2.97E-7 /y (2.41% FDN)
T1-01-T3: Feed control to SGTR fails and Primary Feed & Bleed fails T1-06-S2: SBO sequence and recovery equipment fails after power recovery.
T1-01-T3: Human errors to control the feed to SGTR/Human errors to Primary Feed & Bleed. T1-06-S2: diesel failure and diesel start failure (LOOP signal failure)/human error to recover

NEA/CSNI/R(2017)5
204
3. Insights as regard to safety: Safety improvements already implemented or planned (in particular in the post-Fukushima framework) (These insights are considered as particularly interesting for the potential users of the report) For each example:
• Description and purpose of the safety improvement: design, operation (procedures, Tech Specs), input to SAM guidelines….
• Status of improvement (planned or implemented) • Risk impact • Role of PSA in the decision making.
As a result of the Fukushima Accident all Spanish NPPs have implemented several measures in order to improve the capacity of the Spanish NPPs to cope with a prolonged SBO event. Some of these measures are:
• Implementation of the appropriate protocols (including periodic testing) to try to guarantee a quick recovery of electric feeding from nearby hydroelectric stations.
• New equipment (fixed or mobile) for: - Additional sources of makeup water to the RCS - Power supply equipment and instrumentation - Increasing the availability of communications and lighting systems
• Demonstrate the feasibility of the manual (local) actions required in a situation of total loss of electric supply, including batteries and considering the environmental conditions present on place.
• Demonstrate the capacity of fully closing the containment in case it is not completely established at the start of the event.
• All Spanish NPP (except the KWU design) had previously developed plant-specific SAMG. New developments have been required including analysis of the instrumentation critical for accident management (Identification; Operability in case of prolonged SBO or severe accident conditions) and during shut down modes (Also for the KWU design).
These measures have to be implemented before December 2016 and they have not been assessed from a risk point of view.
equipment
KWU PWR/3 loop (Rev. 2014)
4.19·E-2/y (400KW) Failure Probability island conf= 0.1
8.03 E-8 /y (10% FDN)
S9: Power supply and DC power fail and long-term secondary cooling fails S13: Power supply and DC power fail and BRR seals failure.
S9: 4 CCF safeguard diesel or diesel failure together with other support systems failure S13: CCF batteries or 4 CCF safeguard diesel or diesel failure together with other support systems failure and valves failure in return way to BRR sails
General Electric BWR 6 – Mark III (Rev. 2012)
1.89 E-2/y 3.067E-7 /y (SBO 16.44% FDN)
S12: HPCS cooling reactor – Power supply is not recover before battery depletion. Containment venting is necessary but water supply to suppression pool with diesel fire protection pump is not possible. S:29: HPCS/RCIC fail to cool reactor, depressurisation is possible but Fire Protection System pump fails to supply water to the reactor.
Diesel failure/fire pump fails to run/Power to emergency bus bars is not recovered before batteries deplete. Diesel failure/HPCS Cooling support system failure/turbine driver pump fails to run/ fire pump fails to run

NEA/CSNI/R(2017)5
205
4. Insights with respect to PSA (methods and data) (Please indicate particular methods and data issues/problems related to the loss of electrical sources and how these issues were addressed (or indicate if these issues are still being evaluated). Specific examples of good practices will be particularly useful) Possible issues:
• Completeness • HRA • Data on event frequencies • CCFs and dependencies • Recoveries • Support calculations • Sequence duration. Mission time. • Adverse effects of grid disturbances on on-site power systems • Multi-unit events • Selectivity assumptions/modelling
The last revisions of Spanish PSA have included the same model for external power recovery, based on a study requested by the CSN and performed by an engineering company on behalf of the Spanish NPPs. As a conclusion of this study all NPP calculate the probability of non-recovery of external power using the same mathematical expression, which is a curve dependent on time since the initiating event. It also depends on the cause of the power loss, in the following sense. If the cause is not within the NPP or the plant’s grid, the curve considers the capacity of the plant to recover from an external, pre-selected, nearby hydraulic source. LOOPs originating from external events (earthquake, external flooding, etc.) are currently out of scope of level 1 PSA in Spain.

NEA/CSNI/R(2017)5
206
SWEDEN (1) QUESTIONNAIRE Identification Please identify your organisation: Name: OKG Country: Sweden Address: 572 83 Figeholm, Sweden Contact person: Henrik Dubik, Lovisa Nordlöf Telephone/e-mail: [email protected], [email protected] Are you - A Regulatory Body � - A Supporting Organisation to a Regulatory Body � - A Utility X - A Vendor � - A Consultant � - Other � 1. General plant and electrical supplies information
a) General • Plant type:
BWR • Electrical power [MWe]:
Oskarshamn 1 492 MWe (brutto) 473MWe (netto) Oskarshamn 2 661 MWe (brutto) 638 MWe (Netto) Oskarshamn 3 1450 MWe (Brutto) 1400 MWe (netto)
b) Electrical supplies • Grid connection
- Number of independent feeders into switchyard (No. and types of grid connections)
- Alternate/independent ac grid sources that might be available (e.g. stand-by gas turbines) Oskarshamn plant main substation is connected to the national grid through four 400 kV lines and four 130 kV lines. 130 kV and 400 kV switchgear are interconnected by a transformer. O1s main transformer is connected to 130 kV, while the main transformers for O2 and O3 are connected to 400 kV. For 130 kV switchyard also the two gas turbines belonging to O2 are connected. The external grid has therefore high availability and flexibility also for the supply of power to work with malfunctions.
• Designed for house turbine operation, island operation (e.g. the main generator can supply house loads without reliance on or connection to the main switchyard) O1, O2 and O3 are designed for house-load operation (island operation) and this is modelled in PSA for O2 and O3. No house turbine operation is credited in the PSA for O1
• Number of EDGs and/or other internal sources (e.g. gas turbines) and capacity O1: 4 DG 2 GT (Same as O2) O2: 4 DG 2 GT O3: 4 DG can connect manually to 2 GT (Same as O2)
• Capacity for cross ties between trains or units Yes, GT can be used by O1, O2 and O3 at the same time

NEA/CSNI/R(2017)5
207
• Brief description of non-ac dependent decay heat removal systems (e.g. turbine-driven auxiliary feed water, motor driven pumps, natural circulation, etc.) O1 315 Auxiliary condenser
c) Other information if relevant for PSA: • Transmission system operator and operator requirements • Single or twin turbine/s • Single • Other
2. PSA information and results For each PSA considered please provide the following information (an example is given in appendix) 2.1. PSA characteristics
• Context and PSA framework (regulatory position) SSMFS 2008:1
• PSA date (initial, revisions), All units has LPSA-models. O1 currently after outage 2012 O2 The plant has an ongoing modernisation (called project Plex), therefore no further specific plant data and results are given O3 currently after outage after project Puls (Power Uprate with Licenced Safety) ended 2010
• PSA scope: Level 1 covering plant internal events X internal hazards X external hazards X for POS: full power X low power and shutdown Level 2 covering plant internal events X internal hazards X external hazards X for POS: full power X low power and shutdown X Level 3 covering plant internal events � internal hazards � external hazards � for POS: full power � low power and shutdown � Spent fuel pool � internal hazards � external hazards �
2.2 Initiating event The main initiating event to be considered is a loss of external electrical sources (LOOP).
• Is the LOOP event considered as a single initiating event or are there sub-categories (especially according to the root cause of the event and to the recovery conditions)? Please briefly describe sub-categories if used. The initiating event LOOP is called TE in OKG:s studies. Also loss of individual grids in the plant is analysed, if they leads to reactor shutdown. In the event “loss of a specific grid” also loss of transformers, breakers, fuses and rectifiers is included The sequence is that reactor shutdown is activated through RPS (516) and it leads to loss of feed water and maincondensor. Loss of the 400kV-net (via 02) is treated with an increased probability Data For O1 TE =2.86E-01 Initiating event frequency for loss of 130kV Data for O3 TE=1.02E-1 Initiating event frequency for loss of 400kV
- Categories: short loop, long loop, induced loop by other transients?
LOOP is assumed to return after 2 h

NEA/CSNI/R(2017)5
208
- How is recovery considered? With one or several recovery times and laws/rules? (e.g. with fixed given mission times for the systems, or with a recovery law /rule versus time)? Do recovery model and recovery probabilities differentiate according to the causes of the initiating event(s)? Return of off-site power is credited 2 hours after the initiating event TE. In the model there is a possibility that the off-site power will return during the 2 h (UTEÅK130KV within 2 h, q=0.0183 for O1, UTEBL-ÅTER within 2h q=0.33 for O3) However, if the external grid isn’t recovered, emergency diesel operation is modelled for the complete sequence, with unintentional sop as a failure mode.
- What are the corresponding frequencies? This question covers several points:
The frequency of each sub-category And, if relevant for your PSA:
Conditional probability of a consequential LOOP given a plant transient O1 UTE-130KV q=4.9E-3 Loss of 130KV-network given a transient
Conditional probability of a transfer of plant electrical buses from a “normal” transformer to a “reserve” transformer O1 UTE-130KV-OB q=7.08E-4 Loss of 130kV-network independent to O1 O1 UTEÅK130/400 q=0.033 Case of no return of the 130kV network given the return of the 400 kV network O3 UTEBL-130KV q=1 Loss of 130kV-net given loss of 400kV O3 UTEBL-400kV q=0.01 Loss of 400Kv, secondary event O3 UTEBL-400kV q=2.51E-4 Loss of 400kV
Conditional probability of house-load operation - Is there consideration of variations in frequencies/probabilities for
different seasons/modes of operation (e.g. during refuelling?) The frequency is divided in modes of operation
- Are there in the PSA other initiating events (other than LOOP) leading to similar consequences (for example intrinsic failure of electrical bus bars) with a significant contribution? CCI for failure of single electrical grids is included, but has no significant contribution to the CDF
- Are the LOOP events consequential to external hazards treated specifically or included in a more generic event? What kinds of external hazards were considered among the hazards that can cause LOOP in the PSA? What are the corresponding frequencies?
External hazards are included implicit, the consequence of external hazards are LOOP or clogging of the cooling water intake The Swedish design basis occurrence frequency for external hazards is 1E-5/yr
• What were the data sources and methods used to estimate initiating event frequencies? Initiating event TE is calculated through a sliding ten year window Initiating events CCI-6XX (CCI for the electrical grids)is calculated with data from T-book – The frequencies for relevant failure modes for the analysed grid is collected and summarised, and then multiplied with 8088 for full power (One year of operation is in PSA supposed to be 8088 h)
- Have you performed a detailed grid reliability analysis?
NEA/CSNI/R(2017)5
209
Yes, in a full scale simulator to find out the consequence if a grid falls out.
- Are the following points explicitly treated or grouped into a more global LOOP event: different grid connections or sources, (e.g. gas turbines)? House/island mode operation (and then for how long time period)? LOOP consequential to a transient? LOOP is defined as a transient.
• When relevant for your PSA, what are the conditional failure probabilities (e.g. given a transient (IE), the conditional probability of loss-of-grid connection or conditional switchover failure probability? Conditional probabilities for failure of house turbine/island mode operation?) O1 House turbine operation is not credited in the model, it always fails O3 The possibility for failed house turbine operation is 2.5E-1
2.3. Main modelling assumptions
• What are the main modelling features of diesel generators, gas turbines/other possible sources, the electrical bus bars:
- types of failure modes and level of details (i.e. if the detail of modelling enables identification of interesting insights e.g. dependencies) For both GT and DG – Failure to start and unwarranted stop
- CCF Yes between DG of the same type in a plant and between the GT
- mission time 20 hours
• Was some guidance used for LOOP introduction/modelling in the PSA? Normal operating instructions for the plant
2.4. Results All the following information, if available, is of interest:
• Risk metrics considered (e.g. Core Damage Frequency (CDF), Large Release Frequency (LRF) along with a definition of the associated metric (i.e. how are CDF and/or LRF defined for your PSA…).
CDF HS1 Failure of reactor shutdown HS2 Loss of make-up feed
HS3 Loss of residual heat removal EAU O1 Not Acceptable release >=0.13% of core inventory for volatile
nuclides EAU O3 Not Acceptable release >=0.05% of core inventory for volatile
nuclides • Risk contributions
Results below are given for internal events, full power operation - total frequency for loss of electrical sources and contribution to overall
CDF and LRF for each radiological sources addressed in PSA O1 O3
HS1 38% of total HS1 60.4% of total HS1 HS2 54% of total HS2 67.5% of total HS2 HS3 86% of total HS3 4.33% of total HS3 HS 57% of total HS 44%of total HS EAU O1 TE 33% of total frequency for EAU EAU O3 TE 3% of total frequency for EAU
- by initiating event (especially if external hazards are treated separately) See above
- by plant operational state (POS)

NEA/CSNI/R(2017)5
210
Negligible contribution to the outage period and during shutdown and startup
• Main sequences • Main contributions (importance measures for systems, support systems (i.e.
I&C), component failures, human actions, …) CCF in batteries, UPS-protection and RPS dominates the results for TE for O1 For O3 CCF in batteries is important, also CCF in DG is important
• Main sources of uncertainty and the results of uncertainty analysis, if performed No uncertainty analysis has been done
3. Insights as regard to safety: Safety improvements already implemented or planned (in particular in the post-Fukushima framework)
(These insights are considered as particularly interesting for the potential users of the report) For each example:
• Description and purpose of the safety improvement: design, operation (procedures, Tech Specs), input to SAM guidelines….
• Status of improvement (planned or implemented) • Risk impact • Role of PSA in the decision making.
OKG is running a post-Fukushima analysis project called Kent. No PSA-specific issues have come out of it yet
4. Insights with respect to PSA (methods and data)
(Please indicate particular methods and data issues/problems related to the loss of electrical sources and how these issues were addressed (or indicate if these issues are still being evaluated). Specific examples of good practices will be particularly useful) Possible issues:
• Completeness • HRA • Data on event frequencies • CCFs and dependencies • Recoveries • Support calculations • Sequence duration. Mission time. • Adverse effects of grid disturbances on on-site power systems • Multi-unit events • Selectivity assumptions/modelling
OKG is running a post-Fukushima analysis project called Kent. No PSA-specific issues have come out of it yet.

NEA/CSNI/R(2017)5
211
SWEDEN (2) QUESTIONNAIRE Our answers are marked with green text. This is what we could give you on short notice. Please come back with follow-up questions if you think something is missing, unclear or incorrect. Identification Please identify your organisation: Name: Forsmarks Kraftgrupp AB Country: Sweden Address: Forsmarks Kraftgrupp AB 742 03 Östhammar Contact person: Anders Karlsson Telephone/e-mail: +46-173-828 46/[email protected] Are you - A Regulatory Body � - A Supporting Organisation to a Regulatory Body � - A Utility X - A Vendor � - A Consultant � - Other � 1. General plant and electrical supplies information
a) General • Plant type: BWRs (Forsmark 1 and 2 – Asea-Atom BWR 69, Forsmark 3 – Asea-Atom
BWR 75) • Electrical power [MWe]: Forsmark 1 – 984 MW (net), Forsmark 2 – 1120 MW (net),
Forsmark 3 – 1190 MW (net)
b) Electrical supplies • Grid connection
- Number of independent feeders into switchyard (No. and types of grid connections) Three 400 kV lines and one 70 kV line
- Alternate/independent ac grid sources that might be available (e.g. stand-by gas turbines) A gas turbine is connected to the 70 kV line.
• Designed for house turbine operation, island operation (e.g. the main generator can supply house loads without reliance on or connection to the main switchyard)
Yes • Number of EDGs and/or other internal sources (e.g. gas turbines) and capacity
Four diesel generators at each unit (each diesel generator has full capacity for each train’s safety equipment) and one gas turbine for the whole site (full capacity for the safety equipment for all three units)
• Capacity for cross ties between trains or units It is possible to switch between the 400 kV lines (manual actions needed)
• Brief description of non-ac dependent decay heat removal systems (e.g. turbine-driven auxiliary feed water, motor driven pumps, natural circulation, etc.) It is possible to remove heat through the filtered depressurisation system (FRISK) even before an accident (before core melt). This sequence is possible by feeding the containment with water by motor driven fire water pumps.
c) Other information if relevant for PSA:

NEA/CSNI/R(2017)5
212
• Transmission system operator and operator requirements • Single or twin turbine/s
Forsmark 1 and 2 have twin turbines (i.e. four turbines in total), while Forsmark 3 has a single turbine.
• Other 2. PSA information and results For each PSA considered please provide the following information (an example is given in appendix) 2.1. PSA characteristics
• Context and PSA framework (regulatory position) • PSA date (initial, revisions), • The first PSAs for Forsmark were developed in the mid-1980s. Today the PSA studies
(one PSA study for Forsmark 1 and 2 and one PSA study for Forsmark 3) are fully updated every two years and partly updated the year in between (interim updates).
• PSA scope: Level 1 covering plant internal events yes internal hazards yes external hazards partly for POS: full power low power and shutdown yes Level 2 covering plant internal events yes internal hazards yes external hazards partly for POS: full power low power and shutdown under development Level 3 covering plant internal events no internal hazards no external hazards no for POS: full power low power and shutdown no Spent fuel pool yes internal hazards yes external hazards no
2.2. Initiating event The main initiating event to be considered is a loss of external electrical sources (LOOP).
• Is the LOOP event considered as a single initiating event or are there sub-categories (especially according to the root cause of the event and to the recovery conditions)? Please briefly describe sub-categories if used.
• We have three different LOOP events: TE1 (total loss of all external grid – both 400 kV and 70 kV), TE2 (loss of switch yard – 400 kV), TE3 (loss of external grid – 400 kV) and also several other external event IEs that cause LOOP.
1. Categories: short loop, long loop, induced loop by other transients? 2. Both short and long LOOP. Conditional/secondary LOOP is also considered for
all other IEs. 3. How is recovery considered? With one or several recovery times and
laws/rules? (e.g. with fixed given mission times for the systems, or with a recovery law /rule versus time)? Do recovery model and recovery probabilities differentiate according to the causes of the initiating event(s)?
4. It is dependent on IE. 5. What are the corresponding frequencies? This question covers several points:
The frequency of each sub-category Power operation TE1 4.94E-02/year (F1/F2), 5.27E-02/year (F3) TE2 3.10E-02/year (F1/F2), 3.61E-02/year (F3) TE3 2.70E-01/year (F1/F2), - (F3)

NEA/CSNI/R(2017)5
213
Cold shutdown F1/F2 TE1 long outage 2.79E-02/ year TE1 short outage 7.97E-03/ year TE2 long outage 1.75E-02/ year TE2 short outage 5.01E-03/ year TE3 long outage 1.53E-01/ year TE3 short outage 4.36E-02/ year F3 TE1 long outage 2.97E-02/ year TE1 short outage 8.51E-02/ year TE2 long outage 2.04E-02/ year TE2 short outage 5.84E-03/ year Shutting down TE1 3.66E-05/shutting down (F1/F2), 3.91E-05/shutting
down (F3) TE2 2.30E-05/shutting down (F1/F2), 2.68E-05/shutting
down (F3) TE3 2.00E-04/shutting down (F1/F2), - (F3) Start-up TE1 1.22E-04/start-up (F1/F2), 1.17E-04/start-up (F3) TE2 7.67E-05/ start-up (F1/F2), 8.04E-05/start-up (F3) TE3 6.68E-04/ start-up (F1/F2), - (F3) In addition there are several other external event IEs that cause LOOP. There are also external event IEs that increases the conditional probability of a consequential LOOP.
And, if relevant for your PSA: Conditional probability of a consequential LOOP given a plant
transient 2.10E-02 (F1/F2), 1.98E-02/demand (F3)
Conditional probability of a transfer of plant electrical buses from a “normal” transformer to a “reserve” transformer Breakers and transfer logic is modelled in fault trees and the conditional probability id dependent on IE. Breakers and transfer logic is modelled in fault trees, but the conditional failure probabilities are not dependent on IE.
Conditional probability of house-load operation Failure probability for house-load operation is currently being revised.
6. Is there consideration of variations in frequencies/probabilities for different seasons/modes of operation (e.g. during refuelling?) No
7. Are there in the PSA other initiating events (other than LOOP) leading to similar consequences (for example intrinsic failure of electrical bus bars) with a significant contribution? Yes (fire, flooding, CCIs)
8. Are the LOOP events consequential to external hazards treated specifically or included in a more generic event? What kinds of external hazards were considered among the hazards that can cause LOOP in the PSA? What are the corresponding frequencies? See above
• What were the data sources and methods used to estimate initiating event frequencies?

NEA/CSNI/R(2017)5
214
1. Have you performed a detailed grid reliability analysis? Are the following points explicitly treated or grouped into a more global LOOP event: different grid connections or sources, (e.g. gas turbines)? House / island mode operation (and then for how long time period)? LOOP consequential to a transient? Different methods have been used for different IEs
• When relevant for your PSA, what are the conditional failure probabilities (e.g. given a transient (IE), the conditional probability of loss-of-grid connection or conditional switchover failure probability? Conditional probabilities for failure of house turbine/island mode operation?)
- See above 2.3. Main modelling assumptions
• What are the main modelling features of diesel generators, gas turbines/other possible sources, the electrical bus bars:
1. types of failure modes and level of details (i.e. if the detail of modelling enables identification of interesting insights e.g. dependencies) In detail with full functional dependencies (electrical, area and cooling)
2. CCF, Yes
3. mission time, Yes
• Was some guidance used for LOOP introduction/modelling in the PSA? - No
2.4. Results All the following information, if available, is of interest:
• Risk metrics considered (e.g. Core Damage Frequency (CDF), Large Release Frequency (LRF) along with a definition of the associated metric (i.e. how are CDF and/or LRF defined for your PSA…).
- Both CDF (1 204 ºC), LRF (10% of airborne fission products) and also non-acceptable release (circa 0.05-0.06% of airborne fission products)
• Risk contributions - total frequency for loss of electrical sources and contribution to overall CDF
and LRF for each radiological sources addressed in PSA F1/F2
o Power operation and cold shutdown (CDF – PSA level 1) TE1, TE2 and TE3: 8.47E-06 = 18% of CDF for power operation and cold shutdown (4.70E-05)
o Power operation (LRF – PSA level 2) TE1, TE2 and TE3: 1.37E-08 = 31% of LRF for power operation (4.39E-08)
F3 o Power operation and cold shutdown (CDF – PSA level 1)
TE1 and TE2: 6.41E-06 = 14% of CDF for power operation and cold shutdown (4.60E-05)
o Power operation (LRF – PSA level 2) TE1 and TE2: 9.76E-09 = 12% of LRF for power operation (7.95E-08)
- by initiating event (especially if external hazards are treated separately) F1/F2
o Power operation and cold shutdown by IE (CDF – PSA level 1)
NEA/CSNI/R(2017)5
215
TE1: 6.08E-06 = 13% of CDF for power operation and cold shutdown (4.70E-05) TE2: 2.46E-07 = 0.52% of CDF for power operation and cold shutdown (4.70E-05) TE3: 2.15E-06 = 4.6% of CDF for power operation and cold shutdown (4.70E-05)
o Power operation by IE (LRF – PSA level 2) TE1: 1.20E-08 = 27% of LRF for power operation (4.39E-08) TE2: 1.64E-10 = 0.37% of LRF for power operation (4.39E-08) TE3: 1.57E-09 = 3.6% of LRF for power operation (4.39E-08)
F3 o Power operation and cold shutdown by IE (CDF – PSA level 1)
TE1: 5.89E-06 = 13% of CDF for power operation and cold shutdown (4.60E-05) TE2: 5.16E-07 = 1.1% of CDF for power operation and cold shutdown (4.60E-05)
o Power operation by IE (LRF – PSA level 2) TE1: 9.49E-09 = 12% of total LRF (7.95E-08) TE2: 2.68E-10 = 0.34% of total LRF (7.95E-08)
- by plant operational state (POS) F1/F2
o CDF – PSA level 1 Power operation
TE1, TE2 and TE3: 8.33E-06 = 40% of CDF for power operation (2.10E-05)
Cold shutdown TE1, TE2 and TE3: 1.38E-07 = 0.53% of CDF for cold shutdown (2.60E-05)
Shutting down LOOP not possible to identify separately for shutting down.
Start-up LOOP not possible to identify separately for start-up.
o LRF – PSA level 2 Power operation
TE1, TE2 and TE3: 1.37E-08 = 31% of LRF for power operation (4.39E-08)
Cold shutdown Not included for level 2 in the approved PSA study
Shutting down LOOP not possible to identify separately for shutting down.
Start-up LOOP not possible to identify separately for start-up.
F3 o CDF – PSA level 1
Power operation
NEA/CSNI/R(2017)5
216
TE1 and TE2: 6.40E-06 = 24% of CDF for power operation (2.70E-05)
Cold shutdown TE1 and TE2: 8.90E-09 = 0.05% of CDF for cold shutdown (1.90E-05)
Shutting down LOOP not possible to identify separately for shutting down.
Start-up LOOP not possible to identify separately for start-up.
o LRF – PSA level 2 Power operation
TE1 and TE2: 9.76E-09 = 12% of LRF for power operation (7.95E-08)
Cold shutdown Not included for level 2 in approved PSA study
Shutting down Not included for level 2 in approved PSA study
Start-up Not included for level 2 in approved PSA study
• Main sequences - LOOP, CCF on diesel generators and failed gas turbine - LOOP, failed logic for diesel bus bars - Sequences with other external events in combination with LOOP
• Main contributions (importance measures for systems, support systems (i.e. I&C), component failures, human actions, …)
- We have no time to produce that kind of answer to this questionnaire. • Main sources of uncertainty and the results of uncertainty analysis, if performed
- Mainly uncertainties regarding failure data for diesel generators, logic and IEs (especially for external events leading to LOOP).
3. Insights as regard to safety: Safety improvements already implemented or planned (in particular in the post-Fukushima framework) (These insights are considered as particularly interesting for the potential users of the report) For each example:
• Description and purpose of the safety improvement: design, operation (procedures, Tech Specs), input to SAM guidelines….
- New independent core cooling system, new mobile diesel generators, new connection points, updated EOPs…
• Status of improvement (planned or implemented) - Both implemented and planned
• Risk impact - Large (especially the new independent core cooling system)
• Role of PSA in the decision making. - Partly used for decision making
NEA/CSNI/R(2017)5
217
4. Insights with respect to PSA (methods and data) (Please indicate particular methods and data issues/problems related to the loss of electrical sources and how these issues were addressed (or indicate if these issues are still being evaluated). Specific examples of good practices will be particularly useful) Possible issues:
• Completeness - No problem in general, but achieving completeness for external events is
always difficult. • HRA
- No problem in general, but HRA for external events is not performed in detail. • Data on event frequencies
- No problem in general, but obtaining reliable data for external events is always difficult.
• CCFs and dependencies - As in PSA in general there is no analysis of CCF on a sub-component level.
There is in other words a risk of missing potential dependencies between systems.
• Recoveries - No problems
• Support calculations - It depends on which area that is analysed. There are many different kinds of
support calculations. • Sequence duration. Mission time.
- 24 hours is normally used for PSA level 1 and 48 hours is normally used for PSA level 2.
• Adverse effects of grid disturbances on on-site power systems - These kinds of events have happened in Forsmark and have been analysed in
detail afterwards. After plant modifications Forsmark can handle identified grid disturbance profiles.
• Multi-unit events - Partly analysed, not a large issue in our PSAs.
• Selectivity assumptions/modelling - We assume selectivity.

NEA/CSNI/R(2017)5
218
SWEDEN (3) Supplement
b) Electrical supplies
• Grid connection - Number of independent feeders into switchyard (No. and types of grid
connections) Three 400 kV lines and one 70 kV line
- Alternate/independent ac grid sources that might be available (e.g. stand-by gas turbines) A gas turbine is connected to the 70 kV line.
• Designed for house turbine operation, island operation (e.g. the main generator can supply house loads without reliance on or connection to the main switchyard)
Yes
• Number of EDGs and/or other internal sources (e.g. gas turbines) and capacity
Four diesel generators at each unit (each diesel generator has full capacity for each train’s safety equipment) and one gas turbine for the whole site (full capacity for the safety equipment for all three units) => The gas turbine energise the start transformers for each unit, i.e. ON (regular grid). ON in turn feeds the underlying DN (diesel secured grid). The new 70 kV switchyard (ÄT66) works in a way that the start sequences of the units will be performed sequentially (the units are started one after the other through the ON sequence in case of an SBO), in order not to get too much load on ÄT66 and the gas turbine (the gas turbine supports ÄT66).
• Capacity for cross ties between trains or units
It is possible to switch between the 400 kV lines (Switchgears) (manual actions needed)
• Brief description of non-ac dependent decay heat removal systems (e.g. turbine-driven auxiliary feed water, motor driven pumps, natural circulation, etc.)
It is possible to remove heat through the filtered depressurisation system (FRISK) even before an accident (before core melt). This sequence is possible by feeding the containment with water by motor driven fire water pumps.
c) Other information if relevant for PSA: • Transmission system operator and operator requirements • Single or twin turbine/s
Forsmark 1 and 2 have twin turbines (i.e. four turbines in total), while Forsmark 3 has a single turbine.
• Other

NEA/CSNI/R(2017)5
219
SWITZERLAND QUESTIONNAIRE Identification Please identify your organisation: Name: Swiss Federal Nuclear Safety Inspectorate Country: Switzerland Address: Industriestrasse 19 CH-5200 Brugg Contact person: Telephone/e-mail: Are you - A Regulatory Body �� - A Supporting Organisation to a Regulatory Body - A Utility - A Vendor - A Consultant - Other 1. General plant and electrical supplies information
a) General • Plant type: Westinghouse 2-loop PWR • Electrical power [MWe]: 380
b) Electrical supplies • Grid connection • Number of independent feeders into switchyard (No. and types of grid connections) • Alternate/independent ac grid sources that might be available (e.g. stand-by gas
turbines) • Designed for house turbine operation, island operation (e.g. the main generator can
supply house loads without reliance on or connection to the main switchyard) • Number of EDGs and/or other internal sources (e.g. gas turbines) and capacity
The protective measures implemented in the Swiss nuclear power plants to ensure the power supply, which comply with the "Defence-in-depth" principle and have several levels of protection, are designated in this section as "safety layers" of the electrical energy supply. The following safety layers are in place: 1st Safety Layer: External main grid the generator feeds into 2nd Safety Layer: House-load operation in island mode in case of failure of the main grid 3rd Safety Layer: External reserve grid (third-party grid) in case of failure of the external main grid and failure of house-load operation 4th Safety Layer: Emergency electrical power supply from two flood diesel generators or hydroelectric power plants (HPP) in case of failure of the first three safety layers for the supply of conventional safety systems. Note: In 2015, the hydro power supply and the two flood diesel generators will be replaced by two bunkered and locally separated emergency diesel generators. 5th Safety Layer: Special emergency electrical power supply from a bunkered special emergency diesel generator for the supply of the special emergency systems 6th Safety Layer: Local accident management (AM) equipment such as for instance mobile emergency power units and possible connections to nearby hydroelectric power plants

NEA/CSNI/R(2017)5
220
7th Safety Layer: Accident management equipment stored at the central Reitnau storage facility and other off-site locations (mobile emergency power units)
• Capacity for cross ties between trains or units The special emergency diesel generator of the 5th Layer can be substituted by their counterpart in the other unit via manual cross tie. The power when running from a single 5th Layer diesel generator will suffice for most of the safety equipment at both units. The new EDG’s of the 4th layer to be installed in 2015 can be substituted by their counterpart in the other unit via manual cross tie. The capacity is sufficient to supply the safety-related equipment in both units.
• Brief description of non-ac dependent decay heat removal systems (e.g. turbine-driven auxiliary feed water, motor driven pumps, natural circulation, etc.) mobile pumps, generators and compressors for SG feed, control air supply etc.
c) Other information if relevant for PSA:
2. PSA information and results For each PSA considered please provide the following information (an example is given in appendix) 2.1. PSA characteristics
• Context and PSA framework (regulatory position): The Nuclear Energy Ordinance (NEO, SR 732.11) requires the completion of a plant-specific Level 1 and Level 2 PSA and regulates the involvement of PSA in the licensing and regulatory process for nuclear installations. Requirements regarding the development and application of PSAs are described more specifically in two guidelines: Guideline ENSI-A05 (Probabilistic Safety Analysis (PSA): Quality and Scope) Guideline ENSI-A06 (Probabilistic Safety Analysis (PSA): Applications)
• PSA date (initial, revisions): The PSAs are regularly updated. A corresponding living PSA process has been installed for all plants.
• PSA scope: Level 1 covering plant internal events ��internal hazards ��external hazards �� for POS: full power ��low power and shutdown �� Level 2 covering plant internal events ��internal hazards ��external hazards �� for POS: full power ��low power and shutdown �� Level 3 covering plant internal events internal hazards external hazards for POS: full power low power and shutdown Spent fuel pool ��internal hazards ��external hazards ��
2.2. Initiating event The main initiating event to be considered is a loss of external electrical sources (LOOP).
• Is the LOOP event considered as a single initiating event or are there sub-categories (especially according to the root cause of the event and to the recovery conditions)? Please briefly describe sub-categories if used.
- Categories: short loop, long loop, induced loop by other transients? As an initiating event, both loss of only the 220 kV grid and both the 220 kV- and the 50 kV grid are considered, the former both permanent and with recovery, the latter permanent or with recovery of either only 220 kV, only 50 kV or both sources. Failure of the 50 kV grid only does not represent an

NEA/CSNI/R(2017)5
221
initiating event as all equipment for power operation is supplied via the 220 kV connection. The capability to quickly reduce thermal power in response to load changes (runback) is credited for a single turbine trip or loss of 220 kV connection at a single generator. This leads to two types of runback failure events, their frequency obtained by multiplying an experience-based runback failure probability with the frequency of single turbine trip or single 220 kV connection loss.
- How is recovery considered? With one or several recovery times and laws/rules? (e.g. with fixed given mission times for the systems, or with a recovery law /rule versus time)? Do recovery model and recovery probabilities differentiate according to the causes of the initiating event(s)? Recovery is credited in the form of separate initiators for LOOPs with recovery for the fraction of grid interruptions that could historically be repaired within 25 minutes. It enables crediting batteries for uninterrupted DC supply and restart of various components. LOOPs caused by external events are always considered unrecovered.
- Is there consideration of variations in frequencies/probabilities for different seasons/modes of operation (e.g. during refuelling?) The IE frequencies of LOOPs were adopted to the duration of the refuelling, however there are additional initiators for “Loss of Switchyard”-type events due to shut down specific activities which were screened out from the generic database for power events. Also the loss of certain emergency power buses during shutdown represents a direct initiating event instead of just a reason for administrative shutdown as they power the RHR pumps.
- Are there in the PSA other initiating events (other than LOOP) leading to similar consequences (for example intrinsic failure of electrical bus bars) with a significant contribution? Core damage contribution from loss of a 6 kV bus is about a hundred times lower than that of total loss of off-site power, even though the former IE is more frequent.
- Are the LOOP events consequential to external hazards treated specifically or included in a more generic event? What kinds of external hazards were considered among the hazards that can cause LOOP in the PSA? What are the corresponding frequencies? LOOPs can be caused by high winds, tornados, floods, earthquakes or aircraft crash. They are always explicitly entailed by the initiating event, for high winds, tornados and earthquakes in form of fragility.
• What were the data sources and methods used to estimate initiating event frequencies? - Have you performed a detailed grid reliability analysis? Are the following
points explicitly treated or grouped into a more global LOOP event: different grid connections or sources, (e.g. gas turbines)? House / island mode operation (and then for how long time period)? LOOP consequential to a transient? The frequencies for the different types of LOOP are developed using a Bayesian Update of US experience with the high voltage line outage experience of the utility operating the plant. Power interruptions (recovered LOOPs) necessitate restart of some normally running mechanical support systems, leading to additional sources of failures.
• When relevant for your PSA, what are the conditional failure probabilities (e.g. given a transient (IE), the conditional probability of loss-of-grid connection or conditional switchover failure probability? Conditional probabilities for failure of house turbine/island mode operation?)

NEA/CSNI/R(2017)5
222
2.3. Main modelling assumptions
• What are the main modelling features of diesel generators, gas turbines/other possible sources, the electrical bus bars:
- types of failure modes and level of details (i.e. if the detail of modelling enables identification of interesting insights e.g. dependencies)
- CCF, mission time, The diesel generators are modelled with distinct breakers, fuel pumps, start sequencers, room cooling fans, exhaust fans and components of the cooling water systems which may fail the respective diesel generator. The engines, their fuel pumps and the fans have CCFs according to the Multiple Greek Letter method for both fail to start and fail to run modes, and so have the various actuations of the breakers. Mission time is 24 h as is for the entire Level-1 PSA.
• Was some guidance used for LOOP introduction/modelling in the PSA? Consideration of LOOP for external events is guided by regulatory guideline ENSI-A05, but no dedicated methodologies for LOOP modelling were employed.
2.4. Results All the following information, if available, is of interest:
• Risk metrics considered (e.g. Core Damage Frequency (CDF), Large Release Frequency (LRF) along with a definition of the associated metric (i.e. how are CDF and/or LRF defined for your PSA…).
• Risk contributions - total frequency for loss of electrical sources and contribution to overall CDF
and LRF for each radiological sources addressed in PSA - by initiating event (especially if external hazards are treated separately) - by plant operational state (POS)
• Main sequences • Main contributions (importance measures for systems, support systems (i.e. I&C),
component failures, human actions, …) • Main sources of uncertainty and the results of uncertainty analysis, if performed
CDF, FDF (fuel damage for shutdown), LERF (early release) and LRF are defined in the regulatory guide ENSI-A05. Unrecovered total loss of off-site power is the most important contributor to full power CDF among the loss-of-support-system type events, however less than a 0.1% of the total CDF, which is strongly dominated by external events, especially earthquakes. The other LOOP events are more than a factor 10 smaller in CDF, even though most of them appear more frequently. The dominating sequence involves failure of AC power from the diesel generators to the emergency buses. The vast majority of core damages caused by a LOOP leads to releases that contribute neither to LERF nor to LRF since this initiator leaves the containment and the mitigation systems unharmed. Emergency DGs are the highest ranking components in terms of Fussel-Vesely Importance, with the bunkered DG of the 5th Layer especially important for external events, whereas off-site power equipment ranks high in terms of risk achievement worth.
3. Insights as regard to safety: Safety improvements already implemented or planned (in particular in the post-Fukushima framework) (These insights are considered as particularly interesting for the potential users of the report) For each example:

NEA/CSNI/R(2017)5
223
• Description and purpose of the safety improvement: design, operation (procedures, Tech Specs), input to SAM guidelines….
• Status of improvement (planned or implemented) • Risk impact • Role of PSA in the decision making.
In a series of Post-Fukushima improvements, recovery of AC power at least to the bunkered systems of the 5th Layer using mobile generators was validated. However, the main focus of these measures was on management of SBO with mobile pumps, improvised water supplies etc..

NEA/CSNI/R(2017)5
224
CHINESE TAIPEI QUESTIONNAIRE Identification Please identify your organisation: Name: Institute of Nuclear Energy Research Country: Chinese Taipei Address: 1000 Wenhua Road, Jiaan Village, Longtan, Taoyuan, Taiwan 32546 Contact person: Dr Chun-Chang Chao Telephone/e-mail: +886-3-471-1400 ext:6008/[email protected] Are you - A Regulatory Body � - A Supporting Organisation to a Regulatory Body - A Utility � - A Vendor � - A Consultant � - Other � 1. General plant and electrical supplies information
• General • Plant type: BWR-4, Mark I Containment (two identical units)
BWR-6, Mark I Containment (two identical units) PWR, Large Dry Containment (two identical units) ABWR (two identical units, under construction)
• Electrical power [MWe]: 636 MWe per unit (BWR-4) 985 MWe per unit (BWR-6) 951 MWe per unit (PWR) 1350 MWe per unit (ABWR)
• Electrical supplies
• Grid connection - Number of independent feeders into switchyard (No. and types of grid
connections) - Alternate/independent ac grid sources that might be available (e.g. stand-by
gas turbines) Plant 345 kV 161kV 69kV Gas turbine BWR-4 4 - 4 2 units BWR-6 4 - 2 2 units PWR 4 2 - 2 units ABWR 4 2 - -
• Designed for house turbine operation, island operation
Only ABWR plant is capable of operating at house load without tripping the reactor. • Number of EDGs and/or other internal sources (e.g. gas turbines) and capacity
Plant EDG Swing DG Gas turbine BWR-4 2 1 2 BWR-6 2 1 2 PWR 2 1 2 ABWR 3 1 -
• Capacity for cross ties between trains or units
Only swing DG is capable of being tied to any division between units. • Brief description of non-ac dependent decay heat removal systems (e.g. turbine-driven
auxiliary feed water, motor driven pumps, natural circulation, etc.)

NEA/CSNI/R(2017)5
225
Plant Turbine-Driven Pump Diesel-Driven Pump BWR-4 1 RCIC, 1 HPCI - BWR-6 1 RCIC - PWR 1 AFW 1 AFW ABWR 1 RCIC 1 Safety-Related Fire Water
RCIC: Reactor Core Isolation Cooling HPCI: High Pressure Core Injection AFW: Auxiliary Feed water
• Other information if relevant for PSA: • Transmission system operator and operator requirements • Single or twin turbine/s • Other
After Fukushima accident, each plant has developed its own ultimate response guidelines to deal with severe accidents such as long-term station blackout, long-term loss of plant ultimate heat sink and tsunami attack. A 4.16kV power supply truck, numbers of 480V portable power supply and small pumps are stored in high seismic capacity buildings located at higher elevation. Operating crew is trained to line-up external water source (fire water or raw water from reservoir) within one hour after initiating event per requirements of procedure. Also, the operators in main control room will decrease the reactor pressure to lowest operating limit of turbine-driven pump and get ready for the injection of external water source for AC independent long-term cooling.
2. PSA information and results For each PSA considered please provide the following information (an example is given in appendix) 2.1. PSA characteristics
• Context and PSA framework (regulatory position) Developed by INER in the project from utility
• PSA date (initial, revisions), Plant Initial Latest revision BWR-4 1991 2012 BWR-6 1985 2012 PWR 1987 2012 ABWR 2007 2012
• PSA scope:
Level 1 covering plant internal events internal hazards external hazards for POS: full power low power and shutdown Level 2 covering (Estimation of Large Early Release Frequency, LERF) plant internal events internal hazards external hazards for POS: full power low power and shutdown � Level 3 covering plant internal events � internal hazards � external hazards � for POS: full power � low power and shutdown � Spent fuel pool � internal hazards � external hazards �
2.2. Initiating event The main initiating event to be considered is a loss of external electrical sources (LOOP).
• Is the LOOP event considered as a single initiating event or are there sub-categories (especially according to the root cause of the event and to the recovery conditions)? Please briefly describe sub-categories if used.
1. Categories: short loop, long loop, induced loop by other transients ???

NEA/CSNI/R(2017)5
226
For the operating plant, the LOOP initiating event was split into four sub-categories as the followings per the suggestion of NUREG/CR-6890. LOOP caused from Plant Centred issue LOOP caused from Switchyard Centred issue LOOP caused from Off-site Grid related issue LOOP caused from Weather issue(excluding typhoon)
For ABWR plant with no operating experience, the LOOP initiating event was simply split into two categories, i.e. recoverable LOOP and non-recoverable LOOP.
2. How is recovery considered? With one or several recovery times and laws/rules? (e.g. with fixed given mission times for the systems, or with a recovery law /rule versus time)? Do recovery model and recovery probabilities differentiate according to the causes of the initiating event(s)? For operating plants, the recovery time of Plant Centred issue was obtained from the operating experiences of 4.16kV power system. And the recovery time of Switchyard Centred was obtained from the records of switchyard maintenance. The recovery time of LOOP caused by the external grid failures and weather hazards was obtained from the grid reliability raw data provided by utility.
3. What are the corresponding frequencies? Initiating event Initiating event frequency (per year)
BWR-4 BWR-6 PWR ABWR* Plant Centred 1.47E-03 1.55E-03 4.69E-03 -
Switchyard Centred 4.00E-03 4.59E-03 4.58E-03 - Off-site Grid related 8.45E-02 6.44E-02 1.75E-03 -
Weather 2.68E-03 2.95E-03 8.85E-03 - Recoverable - - - 1.24E-02
Non-Recoverable - - - 2.35E-02 *No operating experience for ABWR plant. Generic data is used.
4. Is there consideration of variations in frequencies/probabilities for different seasons/modes of operation (e.g. during refuelling?) No special consideration for seasons or operation modes.
5. Are there in the PSA other initiating events (other than LOOP) leading to similar consequences (for example intrinsic failure of electrical bus bars) with a significant contribution? For those initiating events other than LOOP, possibility of loss of off-site power within 24 hours after initiating event was modelled in the off-site power related fault trees.
6. Are the LOOP events consequential to external hazards treated specifically or included in a more generic event? What kinds of external hazards were considered among the hazards that can cause LOOP in the PSA? What are the corresponding frequencies? Typhoon and earthquake were considered as risk significant external hazards for all nuclear power plants in Taiwan. For typhoon event, wind hazard and fragility of structure, system and components (SSCs) against the wind are used to estimate the plant damage status. Some plant damage status will be treated as a specific LOOP event. For earthquake event, risk is estimated under the condition of LOOP. Similar to typhoon event, seismic hazard and seismic fragility of SSCs are used to define the frequency of LOOP after earthquake.
• What were the data sources and methods used to estimate initiating event frequencies? 1. Have you performed a detailed grid reliability analysis? Are the following
points explicitly treated or grouped into a more global LOOP event: different grid connections or sources, (e.g. gas turbines)? House / island mode operation (and then for how long time period)? LOOP consequential to a transient?

NEA/CSNI/R(2017)5
227
Different types of initiating event frequency from NUREG/CR-6890 are used as the generic data and then updated by plant operating experiences using technique of Bayesian update.
• When relevant for your PSA, what are the conditional failure probabilities (e.g. given a transient (IE), the conditional probability of loss-of-grid connection or conditional switchover failure probability? Conditional probabilities for failure of house turbine/island mode operation?) Conditional probability of LOOP given an initiating event other than LOOP is modelled in off-site power related fault trees. For ABWR plant which can be operated at house load, a fault tree was developed to model the necessary actions that will be required to prevent turbine or generator trip while transferring from full power to 5% power of maximum house load.
2.3. Main modelling assumptions • What are the main modelling features of diesel generators, gas turbines/other possible
sources, the electrical bus bars: 1. types of failure modes and level of details (i.e. if the detail of modelling enables
identification of interesting insights e.g. dependencies) Failure modes of DG and gas turbine are failure to start and failure to run.
2. CCF, CCF between DGs and gas turbines are considered for both failure modes. No CCF should be considered between the unit EDG and swing DG.
3. mission time, 24 hours
• Was some guidance used for LOOP introduction/modelling in the PSA? Plant general abnormal and emergency operation procedures
2.4. Results All the following information, if available, is of interest:
• Risk metrics considered (CDF, LRF…). Please precise the definition. POS LOOP
Initiating event Core damage frequency (per year) BWR-4 BWR-6 PWR ABWR
Full Power
Plant Centred 5.60E-09 1.30E-08 4.94E-08 - Switchyard Centred 1.70E-08 4.53E-08 4.49E-08 - Off-site Grid related 4.20E-07 9.43E-07 1.08E-08 - Weather 9.98E-09 2.47E-08 1.11E-08 - Recoverable - - - 1.89E-10 Non-Recoverable - - - 2.28E-10
Low Power LOOP - - - 7.77E-10 Shutdown LOOP 2.50E-08 Later 1.79E-07 1.59E-09
POS Initiating event Large early release frequency (per year)
BWR-4 BWR-6 PWR ABWR Full Power LOOP 1.38E-08 5.90E-08 5.25E-09 9.67E-09
• Risk contributions
- total frequency for loss of electrical sources and contribution to overall CDF and LRF for each radiological sources addressed in PSA
- by initiating event (especially if external hazards are treated separately) - by plant operational state (POS)
(INER is now asking for the utility’s approval to release the information of total CDF and LERF. They will be provided later.)
• Main sequences The most risk significant sequences that lead to core damage will be combinations of the failure of early high pressure injection and failure of early low pressure injection.

NEA/CSNI/R(2017)5
228
Early injection means that no pump room cooling will be required when defining the success criteria.
• Main contributions (importance measures for systems, support systems (i.e. I&C), component failures, human actions, …) Main contributors for CDF sequence will be the failure of swing DG, recovery of unit EDG and the human action to line-up the swing DG.
• Main sources of uncertainty and the results of uncertainty analysis, if performed No uncertainty analysis was performed for the LOOP event.
3. Insights as regard to safety: Safety improvements already implemented or planned (in particular in the post-Fukushima framework) (These insights are considered as particularly interesting for the potential users of the report) For each example:
• Description and purpose of the safety improvement: design, operation (procedures, Tech Specs), input to SAM guidelines….
• Status of improvement (planned or implemented) • Risk impact • Role of PSA in the decision making.
1. Add the swing DG for each operating plants to provide reliable AC power after loss of off-site power. The estimated risk reduction on CDF is around 30% for BWR-4 plant.
2. The small diesel generators designed to provide power to the gas-turbine system are now planned to connect to unit essential 4.16 kV bus. It can provide alternate AC power to unit in case of LOOP caused by the failure of switchyard.
3. In response to the lesson learnt from Fukushima accident, each plant has developed a specific procedure called ultimate response guideline to maintain the integrity of nuclear fuel by providing long-term alternate core cooling during severe accident. Numbers of water sources and ways to support the effectiveness of alternate core cooling were identified in the procedure. Utility is now installing the interface between the existing cooling system and the alternate cooling system. INER is now working on modelling the ultimate response guideline to the plant-specific PSA model.
4. Insights with respect to PSA (methods and data) (Please indicate particular issues/problems related to the loss of electrical sources, which needed (or are still needing) specific attention. Examples of specific developments will be very interesting) Possible issues:
• Completeness • HRA • Data on event frequencies • CCFs and dependencies
Most nuclear power plants are designed to have more than one off-site power lines to ensure having high reliability of off-site power system. Some of the off-site power lines cannot be treated as independent when considering the common cause failure. It is recommended that more attention should be taken while updating the frequency of grid failure from operating experiences. There may have more than one type of common cause failure in between the off-site power sources. The failures collected from operating experiences will need more information to clarify if there is any type of common cause failure exists.
• Recoveries

NEA/CSNI/R(2017)5
229
• Support calculations • Sequence duration. Mission time. • Adverse effects of grid disturbances on on-site power systems • Multi-unit events
The capacity of swing DG is not capable of providing AC power to both units at the same time during emergency. It is necessary to clarify that under what condition will the other unit have higher priority to have the swing DG. Also, per operating procedure, swing DG can be used to replace any unit EDG which was out of service at-power operation. If it is the case, there will be no swing DG available. Those specific conditions can be properly modelled in the fault trees. Selectivity assumptions/modelling

NEA/CSNI/R(2017)5
230
UNITED STATES QUESTIONNAIRE An example of answer is given in Appendix Identification Information Please identify your organisation: Name: US Nuclear Regulatory Commission……………………………….……. Country: USA…………………………………………………………………….. Address: U.S. Nuclear Regulatory Commission Washington, DC 20555-0001 Mailstop: CSB-4A07M Contact person: Michelle Gonzalez Telephone/e-mail: 301-251-7591/ [email protected]………………………………….. Are you - A Regulatory Body x - A Supporting Organisation to a Regulatory Body � - A Utility � - A Vendor � - A Consultant � - Other � QUESTIONNAIRE 1 (W 4 Loop PWR, Large Dry Containment) 1. General plant and electrical supplies information
a) General • Plant type: Four-Loop Westinghouse PWR with large dry ambient containment • Number of Units On-site: 2 • Electrical power [MWe]: 1223 MWe for each unit.
b) Electrical supplies • Grid connection
- Number of independent feeders into switchyard (No. and types of grid connections) There are two switchyards on-site (a 230-kV and a 500-kV yard) fed by
seven grid connections. Five off-site lines feed the 230 k V switchyard and two lines feed the 500 kV switchyard. One of the 230 kV lines connects to the switchyard of a nearby combustion turbine electric generating facility (and this nearby switchyard can supply power to a limited capacity alternate off-site feeder that is independent of the 230 kV and 500 kV switchyard power supplies). There are two 230-kV and 500-kV autotransformers that connect the 230-kV and 500-kV switchyards.
The Unit 1 generator is connected to the 230-kV switchyard and the Unit 2 generator is connected to the 500-kV switchyard via step-up transformers.
System load studies indicate that this arrangement has the capacity and capability to supply the power necessary for the safety loads of one unit while placing the other unit in cold shutdown.
- Alternate/independent ac grid sources that might be available (e.g. stand-by gas turbines) On-site ac power for each unit is supplied from the 230-kV switchyard
through two reserve auxiliary transformers (RATs) or from the main

NEA/CSNI/R(2017)5
231
generator via two-unit auxiliary transformers (UATs). The non-Class 1E4 and Class 1E buses can be fed from either the UAT or the RAT with automatic fast bus transfer of the non-Class 1E busses from the UAT to the RAT provided. The Class 1E buses are supplied from the RATs.
Alternate on-site ac power may also be supplied to the Class 1E buses from the stand-by auxiliary transformer (SAT), which receives its power from the nearby combustion turbine electric generating facility switchyard. The SAT can be aligned to any one of the four Class 1E buses (two per plant), but has a limited capacity.
• Designed for house turbine operation, island operation The main turbine-generator supplies normal non-Class 1E auxiliary
loads during plant operation via the UATs. These auxiliary loads can also be powered from the RATs during startup or when the UAT is unavailable.
For each unit, the two reserve auxiliary transformers supply the two Class 1E safety buses from the 230-kV switchyard. Because the RATs are powered from the 230 kV switchyard, the switchyard must be powered to fully power all Class 1E buses.
Each Class 1E train can be powered by a dedicated stand-by diesel generator.
• Number of EDGs and/or other internal sources (e.g. gas turbines) and capacity – Each unit has two Class 1E trains with one EDG per train (for a total of
2 EDGs per unit). Upon loss of all off-site power, either diesel generator or its associated bus has the capacity to power the equipment required to safely shutdown the reactor and mitigate the consequences of the design bases accidents.
An alternate ac power feeder is also available from a switchyard of a nearby combustion turbine electric generating facility. The alternate ac power feeder can be powered via the off-site grid connection from this nearby switchyard or from the combustion turbine generators.
• Capacity for cross ties between trains or units – - There is no capacity for electrical cross ties.
• Brief description of non-ac dependent decay heat removal systems (e.g. turbine-driven auxiliary feed water, motor driven pumps, natural circulation, etc.)
- To maintain the electrical and instrumentation components needed for core cooling and decay heat removal following a station blackout (SBO), the station 125-Vdc Class 1E batteries are capable of powering the required loads for the SBO coping duration. Adequate battery capacity also exists to provide field flashing to one of the emergency diesel generators and closing of all required breakers in the final minute of the SBO coping duration.
- Adequate instrumentation is provided to assess the core reactivity, RCS inventory, core cooling capability, decay heat removal capability and availability of Class 1E 125-Vdc and vital 120-Vac systems. Non-AC dependent decay heat removal systems include one turbine-driven AFW feed pump.
c) Other information if relevant for PSA: • Transmission system operator and operator requirements • Single or twin turbine/s • Other
4. The Class 1E designation is used for safety-related portions of the power distribution system

NEA/CSNI/R(2017)5
232
2. Insights with regard to safety 2.1 Overall results For each PSA considered please provide the following information (an example is given in appendix) 2.1.1. PSA characteristics
• Context and PSA framework (regulatory position) - Developed by the Idaho National Laboratories to be used in support of NRCs
inspection and oversight programmes. • PSA date (initial, revisions),
- Initial PRA – 8/17/06 - Latest revision – 4/12
• PSA scope: Level 1 covering plant internal events X internal hazards � external hazards � for POS: full power X low power and shutdown � Level 2 covering plant internal events � internal hazards � external hazards � for POS: full power � low power and shutdown � Level 3 covering plant internal events � internal hazards � external hazards � for POS: full power � low power and shutdown � Spent fuel pool � internal hazards � external hazards �
2.1.2. Initiating event The main initiating event to be considered is a loss of external electrical sources (LOOP).
• Is the LOOP event considered as a single initiating event or are there sub-categories (especially according to the root cause of the event and to the recovery conditions)? Please briefly describe sub-categories if used.
1. Categories: short loop, long loop, induced loop by other transients The LOOP events are divided into 4 categories: LOOP plant centred
(LOOPPC), LOOP Switchyard related (LOOPSC), LOOP weather-related (LOOPWR) and LOOP grid related (LOOPGR).
2. How is recovery considered? With one or several recovery times and laws/rules? (e.g. with fixed given mission times for the systems, or with a recovery law /rule versus time)? Do recovery model and recovery probabilities differentiate according to the causes of the initiating event(s)? The recovery probabilities are modelled by a lognormal distribution. Recovery times take into account battery depletion time or core
uncovery time and the time to uncover the reactor core if no safety systems function
3. What are the corresponding frequencies? LOOPGR – 1.9E-2/yr LOOPSC – 1.0E-2/yr LOOPPC – 2.1E-3/yr LOOPWR – 4.8E-3/yr
4. Is there consideration of variations in frequencies/probabilities for different seasons/modes of operation (e.g. during refuelling?) No, the PRA is only modelled for internal events at power and seasonal
variations are not considered. 5. Are there in the PSA other initiating events (other than LOOP) leading to
similar consequences (for example intrinsic failure of electrical bus bars) with a significant contribution?
NEA/CSNI/R(2017)5
233
Yes, the PRA models the loss of vital Class 1E 4160V AC buses and the loss of vital DC buses.
6. Are the LOOP events consequential to external hazards treated specifically or included in a more generic event? What kinds of external hazards were considered among the hazards that can cause LOOP in the PSA? What are the corresponding frequencies? The PRA model includes a LOOP weather-related (LOOPWR) event.
Although there is not an event for specific external hazards, the LOOPWR take into account severe weather conditions like thunderstorms, ice storms, hurricanes, snow, tornados and others.
• What were the data sources and methods used to estimate initiating event frequencies? The probabilities of non-recovery of off-site power to the first safety bus for
various recovery times are derived from Table 4-1 in NUREG/CR-6890, “Reevaluation of Station Blackout Risk at Nuclear Power Plants” (http://www.nrc.gov/reading-rm/doc-collections/nuregs/contract/cr6890/ ). This data was used to generate LOOP non-recovery curve parameters for the SPAR models.
2. Have you performed a detailed grid reliability analysis? Are the following points explicitly treated or grouped into a more global LOOP event: different grid connections or sources, (e.g. gas turbines)? House / island mode operation (and then for how long time period)? LOOP consequential to a transient? A transient stability analysis has been conducted by the licensee to
ensure that the stability of the plant under postulated reactive loading conditions or power factor conditions. In addition to the transient stability study described above, the stability of the grid is also assessed whenever a major electrical element in the vicinity of the plant is temporarily out of service.
The INL maintains a database for the NRC of LOOP frequencies. This database is a statistical and engineering analysis of LOOP Frequencies and durations at commercial nuclear reactors and includes data from 1986–2011. This database is updated annually with more recent data (see https://nrcoe.inel.gov/resultsdb/LOSP/ ).
• When relevant for your PSA, what are the conditional failure probabilities (e.g. given a transient (IE), the conditional probability of loss-of-grid connection or conditional switchover failure probability? Conditional probabilities for failure of house turbine/island mode operation?)
1. Given a transient initiator, the conditional probability of a consequential LOOP is 9.1E-3/yr (NUREG/CR-6890, “Reevaluation of Station Blackout Risk at Nuclear Power Plants”, U.S Nuclear Regulatory Commission, 2005)
2.1.3. Main modelling assumptions
• What are the main modelling features of diesel generators, gas turbines/other possible sources, the electrical bus bars:
1. types of failure modes and level of details (i.e. if the detail of modelling enables identification of interesting insights e.g. dependencies) Failure modes modelled for diesel generators are failure to start and
failure to run. 2. CCF
Diesel generators are susceptible to CCF on both failure modes. CCF data is collected using the U.S Nuclear Regulatory Commission’s document titled “CCF Parameter Estimations 2012”.
3. mission time 24 hrs
• Was some guidance used for LOOP introduction/modelling in the PSA?

NEA/CSNI/R(2017)5
234
1. Yes, the frequencies and probabilities used for LOOP modelling are based on the study presented in NRC’s NUREG/CR-6890.
2.1.4. Results All the following information, if available, is of interest:
• Risk metrics considered (CDF, LRF…). Please precise the definition. - The PRA model considers Core Damage Frequency (CDF) as the risk metric.
CDF is defined as the sum of the accident sequence frequencies of those accident sequences whose end state is core damage. (NUREG-2122, “Glossary of Risk-Related Terms in Support of Risk-Informed Decision Making”, U.S Nuclear Regulatory Commission, 2014)
• Risk contributions - total frequency for loss of electrical sources and contribution to overall CDF
and LRF for each radiological sources addressed in PSA Total Internal events CDF (at power) = 3.03E-05/yr
LOOP events contribution (internal events) Event Frequency CDF % contribution Dominant sequences Frequency LOOPGR 1.2E-2 7.3E-7 2.4% 15
16-3-10 3.32E-7 1.47E-7
LOOPSC 1.0E-2 2.1E-7 0.7% 15 16-3-10
1.83E-7 5.45E-8
LOOPPC 1.9E-3 3.4E-8 0.11% 15 3.33E-8 LOOPWR 3.9E-3 7.4E-7 2.44% 16-3-10
16-06 1.73E-7 1.44E-7
- by initiating event (especially if external hazards are treated separately) N/A - by plant operational state (POS) N/A
• Main sequences – (refer to table above) - Sequence 15 – safe reactor shutdown, successful emergency power, failure of
auxiliary feed water and failure of feed and bleed which leads to CD - Sequence 16-3-10 – reactor shutdown, failure of emergency power
(transferring to an SBO), auxiliary feed water, PORVs close, rapid secondary depressurisation, RCP seal stage 1, RCP seal stage 2, failure of off-site to recover in 4hrs, failure of diesel generator to recover in 4hrs, failure to manually control AFW and failure to depressurise steam generators.
- Sequence 16-06 – reactor shuts down, failure of emergency power (transferring to an SBO), AFW, PORVs close, rapid secondary depressurisation, RCP seal stage 1 integrity, RCP seal stage 2 fails, failure to recover off-site power in 4 hrs, failure to recover DGs in 4 hrs.
• Main contributions (importance measures for systems, support systems (i.e. I&C), component failures, human actions, …) The following importance measures are provided:
− Fussell-Vesely (FV)- relative contribution of a basic event to the calculated risk. This relative of fractional contribution is obtained by determining the reduction of the risk if the probability of the basic event is zero (FV=(F(x)-F(0))/F(x)).
− Risk Increase Ratio (RIR)- or risk achievement worth (RAW) – The increase in risk if a plant feature (e.g. system or component) was assumed to be failed or was assumed to be always unavailable (RIR=F(1)/F(x)).
− Risk Reduction Ratio (RRR)- the decrease in risk if a plant feature were assumed to be optimised or were assumed to be made perfectly reliable (RRR=F(x)/F(0)).
− Birnbaum (Bb) – An indication of the sensitivity of the accident sequence frequency to a particular basic event. Birnbaum measures the change in total

NEA/CSNI/R(2017)5
235
risk as a result of changes to the probability of an individual basic event (B=F(1)-F(0)).
− Risk Increase Interval (RII) - An indication of how much the minimal cut set upper bound would increase if the basic event probability were increased (to a probability of 1.0) (RII=F(1)-F(x)).
− Risk Reduction Interval (RRI) - An indication of how much the minimal cut set upper bound would decrease if the basic event probability were reduced (to a probability of 0.0. [i.e. never failed]) (RRI=F(x)-F(0)).
The following importance measure results are sorted by RIR.
• Plant Centred LOOP (LOOPPC) Event Description
FV RIR
RRR
Bb
Rll
RRI
Service water pumps fail to start by common cause failure
9.53E-2 7.41E+3 1.11E+0 2.84E-1 2.84E-1 3.65E-6
Failure to run of the service water pumps by common cause
6.87E-4 7.27E+3 1.00E+0 2.78E-1 2.78E-1 2.63E-8
Common cause failure of the service water discharge check valves to open
5.37E-5 6.79E+3 l.00E+0 2.60E-1 2.60E-1 2.06E-9
125 VDC batteries fail from common cause
1.95E-4 6.12E+3 1.00E+0 2.34E-1 2.34E-1 7.45E-9
Common cause failure of 10 or more rods to drop
5.31E-3 4.12E+3 1.01E+O 1.57E-1 1.57E-1 2.03E-7
Common cause failure of AFW pumps to run
1.55E-2 2.02E+3 1.02E+O 7.74E-2 7.74E-2 5.95E-7
• Grid-related LOOP (LOOPGR)
Event Description
FV RIR
RRR
Bb
Rll
RRI
Service water pumps fail to start by common cause failure 8.44E-2 6.35E+3 1.09E+0 3.33E-1 3.33E-1 4 .44E-6
Common cause failure of the service water pumps to run 6.07E-4 6.21E+3 1.00E+0 3.26E-1 3.26E-1 3.19E-8
Common cause failure of the service water discharge check valves to open
4.80E-5 5.87E+3 1.00E+0 3.08E-1 3.08E-1 2 .52E-2
125 VDC batteries fail from common cause 1.42E-4 4.46E+3 1.00E+0 2.34E-1 2.34E-1 7.45E-9
Common cause failure of AFW pumps to run 3.87E-3 3.00E+3 1.00E+0 1.57E-1 1.57E-1 2 .03E-7

NEA/CSNI/R(2017)5
236
• Weather-related LOOP (LOOPWR) Event description
FV RIR
RRR
Bb
Rll
RRI
Service water pumps fail to start by common cause failure
4.06E-2 2.97E+3 1.00E+0 3.75E-1 3.75E-1 5.14E-6
Common cause failure of the service water pumps to run
2.94E-4 2.92E+3 1.00E+0 3.69E-1 3.69E-1 3.72E-8
Common cause failure of the service water discharge check valves to open
2.32E-5 2.76E+3 1.00E+O 3.49E-1 3.49E-1 2.93E-9
125 VDC batteries fail from common cause
5.90E-5 1.85E+3 1.00E+0 2.34E-1 2.34E-1 7 .45E-9
Common cause failure of DGs A&B sequencers to operate
6.61E-2 1.4E+3 1.07E+0 1.77E-1 1.77E-1 8.36E-6
• Switchyard centred LOOP (LOOPSC)
Event description FV RIR RRR Bb Rll RRI
Service water pumps fail to start by common cause
9.01E-2 6.95E+3 1.10E+0 2.95E-1 2.95E-1 3.82E-6
Service water pumps fail to run by common cause
6.48E-4 6.80E+3 1.00E+0 2.89E-1 2.89E-1 2 .75E-8
Common cause failure of the service water discharge check valves to open
5.09E-5 6.38E+3 1.00E+0 2.71E-1 2.71E-1 2 .16E-9
125 VDC batteries fail from common cause
1.76E-4 5.52E+3 1.00E+0 2.34E-1 2.34E-1 7.45E-9
Common cause failure of 10 or more rods to drop
4.79E-3 3.71E+3 1.00E+0 1.57E-1 1.57E-1 2 .03E-7
Note:
1. These importance measures were calculated by setting the initiating event (i.e. LOOPWR, LOOPPC, LOOPGR, and LOOPSC) to TRUE and quantifying the PRA model.
• Main sources of uncertainty and the results of uncertainty analysis, if performed
- General LOOP modelling including: IE frequency, EDG mission time, off-site power recovery curves, convolving FTR events, etc.
- LOOP non-recovery probability estimates based on the chosen recovery model and off-site power recovery time estimate.
- Reliability of the station blackout (or black-start) power source. - Stability of the off-site power source following a grid disturbance or during
extreme-weather conditions. - Non-recovery estimates of key component failures (e.g. EDGs, turbine-driven
AFW pumps) that were observed during the actual event. - Modelling operator performance deficiencies that were observed during the
actual event.

NEA/CSNI/R(2017)5
237
2.2. Use of PSA results: Safety improvements already implemented or planned (in particular in the post-Fukushima framework) (These insights are considered as particularly interesting for the potential users of the report) For each example:
• Description and purpose of the safety improvement: design, operation (procedures, Tech Specs), input to SAM guidelines….
• Status of improvement (planned or implemented) • Risk impact • Role of PSA in the decision making.
- As a result of the Fukushima accident, there have been a few recommended modifications regarding loss of electrical sources. The Near Term Task Force (NTTF) recommended modifications to the Station Blackout mitigation strategies (recommendation 4). These modifications are in order to ensure that if a plant loses power, it will have sufficient procedures, strategies and equipment to cope with the loss of power for an indefinite amount of time.
- The NTTF also recommended changes it on-site emergency response capabilities (Recommendation 8). The NRC is rewriting its rules to strengthen and integrate the various emergency response capabilities at U.S. nuclear power plants (integration of EOPs, SAMGs and EDMGs).
3. Insights with respect to PSA (methods and data) (Please indicate particular issues/problems related to the loss of electrical sources, which needed (or are still needing) specific attention. Examples of specific developments will be very interesting) Possible issues:
• Completeness • HRA • Data on event frequencies • CCFs and dependencies • Recoveries • Support calculations • Sequence duration. Mission time. • Adverse effects of grid disturbances on on-site power systems • Multi-unit events • Selectivity assumptions/modelling
Issues that have been previously identified related to the loss of electrical sources have been addressed and documented in the draft document “Treatment of the Loss of Off-site Power (LOOP) in Probabilistic Risk Assessment: Technical Basis and Guideline”; Electric Power Institute, draft report C101060008-7289, October 2007 (D.E True). QUESTIONNAIRE 2 (CE PWR, Large Dry Containment) 1. General plant and electrical supplies information
a) General • Plant type: PWR CE standard 2 loop design with Large Dry Atmospheric Containment • Number of Units On-site: 3 • Electrical power [MWe]: 1 270 MWe per unit b) Electrical supplies • Grid connection
- Number of independent feeders into switchyard (No. and types of grid connections)
NEA/CSNI/R(2017)5
238
There is a single 525kV switchyard that serves all three units. There are a total of seven 525kV off-site lines that feed the switchyard. The switchyard uses a “breaker and a half design” (in which three breakers are provided for every two terminations).
- Alternate/independent ac grid sources that might be available (e.g. stand-by gas turbines): An alternate AC (AAC) power source is available to provide the power
necessary to cope with a SBO for a minimum of four hours. This non-safety-related AAC power source consists of two 100% capacity, black-start gas-turbine generators (GTGs). One GTG is analysed to supply all required station blackout loads for a single unit.
• Designed for house turbine operation, island operation (e.g. the main generator can supply house loads without reliance on or connection to the main switchyard):
- Three start-up transformers connected to the 525 kV switchyard are shared between the three units. Each start-up transformer is capable of supplying 100% of the startup or normally operating loads of one unit simultaneously with the engineered safety feature (ESF) loads associated with two load groups of another unit. Each start-up transformer provides the preferred source of power to one Class 1 E 5 safety bus in two units. The non-Class 1E ac buses normally are supplied from the associated unit main generator through the unit auxiliary transformer, and the Class 1E buses normally are supplied through the startup transformers. In the event of loss of supply from the unit auxiliary transformer (except for overcurrent trip), an automatic fast transfer of the non-Class 1E buses to the start-up transformers is initiated to provide power to the auxiliary loads.
- Because the preferred source of power for the Class1E buses is obtained from the start-up transformers which are powered from the 525 kV switchyard, house turbine/island operation is not possible without the switchyard.
• Number of EDGs and/or other internal sources (e.g. gas turbines) and capacity: - Two 4160V EDGs per unit (6 EDGs total) plus two station black-out (SBO)
generators on-site. • Capacity for cross ties between trains or units:
- There are provisions for manually connecting both Class 1E emergency safeguard buses to a single stand-by power source during emergency conditions. Additionally, power can be supplied to a single ESF bus of one unit from a stand-by power source of another unit. Restrictions and instructions governing the use of these two abnormal electrical line-ups are provided in operating procedures.
- However, no capacity for cross ties between trains or units is credited in the PRA on the normal EDGs.
• Brief description of non-ac dependent decay heat removal systems (e.g. turbine-driven auxiliary feed water, motor driven pumps, natural circulation, etc.)
- Batteries are sized for a minimum of two hours of operation without support of a battery charger. This site also has a turbine-driven AFW pump, motor driven pumps (both AFW and Charging/SI/RHR), and can utilise natural circulation to cool the core.
- Non-AC dependent systems include one turbine-driven AFW pump per unit.
c) Other information if relevant for PSA: • Transmission system operator and operator requirements • Single or twin turbine/s • Other
5. The Class 1E designation is used for safety-related portions of the power distribution system

NEA/CSNI/R(2017)5
239
2. PSA information and results For each PSA considered please provide the following information (an example is given in appendix) 2.1. PSA characteristics
• Context and PSA framework (regulatory position) - Developed by the Idaho National Laboratories to be used in support of NRCs
inspection programmes. • PSA date (initial, revisions),
- Initial PRA – 5/07 - Latest revision – 4/12
• PSA scope: Level 1 covering plant internal events X internal hazards � external hazards � for POS: full power X low power and shutdown � Level 2 covering plant internal events � internal hazards � external hazards � for POS: full power � low power and shutdown � Level 3 covering plant internal events � internal hazards � external hazards � for POS: full power � low power and shutdown � Spent fuel pool � internal hazards � external hazards �
2.2. Initiating event The main initiating event to be considered is a loss of external electrical sources (LOOP).
• Is the LOOP event considered as a single initiating event or are there sub-categories (especially according to the root cause of the event and to the recovery conditions)? Please briefly describe sub-categories if used.
1. Categories: short loop, long loop, induced loop by other transients? General LOOP is the only LOOP event considered
2. How is recovery considered? With one or several recovery times and laws/rules? (e.g. with fixed given mission times for the systems, or with a recovery law /rule versus time)? Do recovery model and recovery probabilities differentiate according to the causes of the initiating event(s)? The recovery probabilities are modelled by a lognormal distribution. Recovery times take into account battery depletion time or core
uncovery time and the time to uncover the reactor core if no safety systems function
3. What are the corresponding frequencies? LOOP: 2.49E-6/yr
4. Is there consideration of variations in frequencies/probabilities for different seasons/modes of operation (e.g. during refuelling?) No, the PRA is only modelled for internal events at power and seasonal
variations are not considered. 5. Are there in the PSA other initiating events (other than LOOP) leading to
similar consequences (for example intrinsic failure of electrical bus bars) with a significant contribution? Yes, the PRA models the loss of the 4160V AC train A and train B, as
well as loss of vital DC busses. 6. Are the LOOP events consequential to external hazards treated specifically or
included in a more generic event? What kinds of external hazards were considered among the hazards that can cause LOOP in the PSA? What are the corresponding frequencies?

NEA/CSNI/R(2017)5
240
The external hazard related LOOP is not explicitly and separately considered in the PRA. The external hazards related LOOP events are included in the generic LOOP event.
• What were the data sources and methods used to estimate initiating event frequencies? The probabilities of non-recovery of off-site power to the first safety
bus for various recovery times are derived from Table 4-1 in NUREG/CR-6890, “Reevaluation of Station Blackout Risk at Nuclear Power Plants” (http://www.nrc.gov/reading-rm/doc-collections/nuregs/contract/cr6890/ ). This data was used to generate LOOP non-recovery curve parameters for the SPAR models.
• Have you performed a detailed grid reliability analysis? Are the following points explicitly treated or grouped into a more global LOOP event: different grid connections or sources, (e.g. gas turbines)? House / island mode operation (and then for how long time period)? LOOP consequential to a transient?
Dynamic stability studies have established safe power generation levels for the plant generating units to ensure that the system can withstand a postulated disturbance without loss of system stability or loss of load. Furthermore, a transmission system operating procedure controls the level of power generation in the associated service area to ensure that the safe operating levels are not exceeded.
The INL maintains a database for the NRC of LOOP frequencies. This database is a statistical and engineering analysis of LOOP Frequencies and durations at commercial nuclear reactors and includes data from 1986–2011. This database is updated annually with more recent data (see https://nrcoe.inel.gov/resultsdb/LOSP/ ).
• When relevant for your PSA, what are the conditional failure probabilities (e.g. given a transient (IE), the conditional probability of loss-of-grid connection or conditional switchover failure probability? Conditional probabilities for failure of house turbine/island mode operation?)
1. Given a transient initiator, the conditional probability of a consequential LOOP is 9.1E-3 (NUREG/CR-6890, “Reevaluation of Station Blackout Risk at Nuclear Power Plants”, U.S Nuclear Regulatory Commission, 2005).
2.3. Main modelling assumptions
• What are the main modelling features of diesel generators, gas turbines/other possible sources, the electrical bus bars:
1. types of failure modes and level of details (i.e. if the detail of modelling enables identification of interesting insights, e.g. dependencies) Failure modes modelled for diesel generators are failure to start and
failure to run, as well as loss of cooling water. 2. CCF
Diesel generators are susceptible to CCF for both fail to run and fail to start. CCF data is collected using the U.S Nuclear Regulatory Commission’s document titled “CCF Parameter Estimations 2012”.
3. mission time 24 hrs
• Was some guidance used for LOOP introduction/modelling in the PSA? 1. Yes, the frequencies and probabilities used for LOOP modelling are based on
the study presented in NRC’s NUREG/CR-6890 (“Reevaluation of Station Blackout Risk at Nuclear Power Plants”, U.S Nuclear Regulatory Commission, 2005).
2.4. Results. All the following information, if available, is of interest:

NEA/CSNI/R(2017)5
241
• Risk metrics considered (e.g. Core Damage Frequency (CDF), Large Release Frequency (LRF) along with a definition of the associated metric (i.e. how are CDF and/or LRF defined for your PSA…).
• The PRA model considers Core Damage Frequency (CDF) as the risk metric. Core damage frequency is defined as the sum of the accident sequence frequencies of those accident sequences whose end state is core damage. (NURE2122, “Glossary of Risk-Related Terms in Support of Risk-Informed Decision Making”, U.S Nuclear Regulatory Commission, 2014)Risk contributions
- total frequency for loss of electrical sources and contribution to overall CDF and LRF for each radiological sources addressed in PSA • Total Internal events CDF= 8.87E-6/yr
LOOP events (internal events) Event Frequency CDF % contribution Dominant sequences Frequency LOOP 2.84E-2 2.49E-6 28% 14
15-30 2.05E-6 2.51E-7
- by initiating event (especially if external hazards are treated separately) N/A - by plant operational state (POS) N/A
• Main sequences - Sequence 14 – Reactor trips, emergency power is successful, auxiliary feed
water fails. - Sequence 15-30 – Reactor trips, emergency power is unsuccessful, auxiliary
feed water fails, off-site power is not recovered within 2 hours, diesel generators are not recovered within 2 hours.
• Main contributions (importance measures for systems, support systems (i.e. I&C), component failures, human actions, …) The following importance measures are provided:
− Fussell-Vesely (FV) – relative contribution of a basic event to the calculated risk. This relative of fractional contribution is obtained by determining the reduction of the risk if the probability of the basic event is zero (FV=(F(x)-F(0))/F(x)).
− Risk Increase Ratio (RIR)- or risk achievement worth (RAW) – The increase in risk if a plant feature (e.g. system or component) was assumed to be failed or was assumed to be always unavailable (RIR=F(1)/F(x)).
− Risk Reduction Ratio (RRR)- the decrease in risk if a plant feature were assumed to be optimised or were assumed to be made perfectly reliable (RRR=F(x)/F(0)).
− Birnbaum (Bb) – An indication of the sensitivity of the accident sequence frequency to a particular basic event. Birnbaum measures the change in total risk as a result of changes to the probability of an individual basic event (B=F(1)-F(0)).
− Risk Increase Interval (RII) - An indication of how much the minimal cut set upper bound would increase if the basic event probability were increased (to a probability of 1.0) (RII=F(1)-F(x)).
− Risk Reduction Interval (RRI)- An indication of how much the minimal cut set upper bound would decrease if the basic event probability were reduced (to a probability of 0.0 (RRI=F(x)-F(0)).
− The following importance measure results are sorted by RIR.

NEA/CSNI/R(2017)5
242
Event FV RIR RRR Bb Rll RRI
Common cause failure of train N check valves
5.80E-4 1.22E+4 1.00E+O 1.00E+O 1.00E+O 4.76E-8
Common cause failure of 125 VDC batteries
4.26E-4 1.22E+4 1.00E+O 1.00E+O 1.00E+O 3.50E-8
CCF of unit 1 125VDC batteries 1.51E-4 1.47E+3 1.00E+0 1.20E-1 1.20E-1 1.24E-8
Condensate storage tank catastrophic failure
5.38E-4 1.23E+3 1.00E+0 1.01E-1 1.01E-1 4.42E-8
Common cause failure of AFW MDPs 3.44E-2 7.12E+2 1.04E+0 5.84E- 2 5.84E-2 2.82E-6
Note:
1. These importance measures were calculated by setting the initiating event (i.e. LOOPWR, LOOPPC, LOOPGR, LOOPSC) to TRUE and quantifying the PRA model.
• Main sources of uncertainty and the results of uncertainty analysis, if performed
- General LOOP modelling including: IE frequency, EDG mission time, off-site power recovery curves, convolving FTR events, etc.
- LOOP non-recovery probability estimates based on the chosen recovery model and off-site power recovery time estimate.
- Reliability of the station blackout (or black-start) power source. - Stability of the off-site power source following a grid disturbance or during
extreme-weather conditions. - Non-recovery estimates of key component failures (e.g. EDGs, turbine-driven
AFW pumps) that were observed during the actual event. - Modelling operator performance deficiencies that were observed during the
actual event.
3. Insights as regard to safety: Safety improvements already implemented or planned (in particular in the post-Fukushima framework) (These insights are considered as particularly interesting for the potential users of the report) For each example:
• Description and purpose of the safety improvement: design, operation (procedures, Tech Specs), input to SAM guidelines….
• Status of improvement (planned or implemented) • Risk impact • Role of PSA in the decision making.
- As a result of the Fukushima accident, there have been a few recommended modifications regarding loss of electrical sources. The Near Term Task Force (NTTF) recommended modifications to the Station Blackout mitigation strategies (recommendation 4). These modifications are in order to ensure that if a plant loses power, it will have sufficient procedures, strategies and equipment to cope with the loss of power for an indefinite amount of time.
- The NTTF also recommended changes it on-site emergency response capabilities (Recommendation 8). The NRC is rewriting its rules to strengthen and integrate the various emergency response capabilities at U.S. nuclear power plants (integration of EOPs, SAMGs and EDMGs).

NEA/CSNI/R(2017)5
243
4. Insights with respect to PSA (methods and data) (Please indicate particular methods and data issues/problems related to the loss of electrical sources and how these issues were addressed (or indicate if these issues are still being evaluated). Specific examples of good practices will be particularly useful) Possible issues:
• Completeness • HRA • Data on event frequencies • CCFs and dependencies • Recoveries • Support calculations • Sequence duration. Mission time. • Adverse effects of grid disturbances on on-site power systems • Multi-unit events • Selectivity assumptions/modelling
Issues that have been previously identified related to the loss of electrical sources have been addressed and documented in the draft document “Treatment of Loss of Off-site Power (LOOP) in Probabilistic Risk Assessments: Technical Basis and “Guidelines”, Electric Power Research Institute draft report C101060008-7289, October 2007 (D.E True). QUESTIONNAIRE 3 (GE BWR, Mark I Containment – with external hazards) 1. General plant and electrical supplies information
a) General • Plant type: BWR GE Mark I Containment • Number of Units On-site: 2 • Electrical power [MWe]: 1080 MWe (each unit)
b) Electrical supplies • Grid connection • Number of independent feeders into switchyard (No. and types of grid connections)
- There is one single 500 kV switchyard on-site fed by three grid connections. One 230 kV line feeds the 230/13 kV regulating transformer; the second, a 13 kV from feeds the 13/13 transformer; and the third one, which is also a 13 kV that connects to the 13 kV switchgear.
- Each generator (one for each unit) is connected by an isolated phase bus to a transformer to step up the 22 kV generator voltage to 500 kV.
• Alternate/independent ac grid sources that might be available (e.g. stand-by gas
turbines) - An alternate AC (ACC) source is available in the event of a station blackout
condition, when off-site power sources and emergency diesel generator power is not available to bring Units 2 & 3 to a safe shutdown condition and maintain that status. There is a 34.5 kV connection from the 33 kV bus, with a transformer stepping down voltage to 13.8 kV that is available for to maintain units 2 and 3 in shutdown status.
- This alternate AC (AAC) source is powered from a nearby substation and is dedicated to this plant through a series of manual breaker and switch manipulations performed at both sites.
• Designed for house turbine operation, island operation • Number of EDGs and/or other internal sources (e.g. gas turbines) and capacity –
- The stand-by AC power supply consists of four diesel generators (2 per unit). • Capacity for cross ties between trains or units –

NEA/CSNI/R(2017)5
244
- Emergency power cross ties are credited on the PRA. The objective of these cross ties is to provide unit to unit emergency power. Cross tie implies the operators can maintain battery charging, injection and decay heat removal with an operating diesel generator.
• Brief description of non-ac dependent decay heat removal systems (e.g. turbine-driven auxiliary feed water, motor driven pumps, natural circulation, etc.)
- The safety objective of the station batteries is to supply all normal and emergency loads for 125 V and 250 VDC power.
- Each of the two independent safety-related 125/250 VDC systems per unit are of adequate size to provide control and switching power to safeguard systems and apparatus, DC auxiliaries and motor operated valves until AC power sources are restored.
- The safety-related 125/250 VDC power supplies are designed so that no single component failure prevents power from being provided to a sufficient number of vital loads for safe shutdown.
- The safety-related 125/250 VDC power supplies are provided in accordance with the intent of "Proposed IEEE Criteria for Class 1E Electrical Systems for Nuclear Power Generating Stations," dated June, 1969.
- Non-AC dependent decay heat removal systems for each unit include One RCIC turbine-driven pump One HPCI turbine-driven pump
c) Other information if relevant for PSA: • Transmission system operator and operator requirements • Single or twin turbine/s • Other
2. Insights with regard to safety 2.1 Overall results For each PSA considered please provide the following information (an example is given in appendix) 2.1.1. PSA characteristics
• Context and PSA framework (regulatory position) - Developed by the Idaho National Laboratories to be used in support of NRCs
inspection programmes. • PSA date (initial, revisions),
- Initial PRA – 8/06 - Latest revision – 5/12
• PSA scope: Level 1 covering plant internal events X internal hazards X external hazards X for POS: full power X low power and shutdown Level 2 covering plant internal events X internal hazards � external hazards � for POS: full power � low power and shutdown � Level 3 covering plant internal events � internal hazards � external hazards � for POS: full power � low power and shutdown � Spent fuel pool � internal hazards � external hazards �
2.1.2. Initiating event The main initiating event to be considered is a loss of external electrical sources (LOOP).

NEA/CSNI/R(2017)5
245
• Is the LOOP event considered as a single initiating event or are there sub-categories (especially according to the root cause of the event and to the recovery conditions)? Please briefly describe sub-categories if used.
1. Categories: short loop, long loop, induced loop by other transients The LOOP events are divided into 4 categories: LOOP plant centred
(LOOPPC), LOOP Switchyard related (LOOPSC), LOOP weather-related (LOOPWR), and LOOP grid related (LOOPGR).
2. How is recovery considered? With one or several recovery times and laws/rules? (e.g. with fixed given mission times for the systems, or with a recovery law/rule versus time)? Do recovery model and recovery probabilities differentiate according to the causes of the initiating event(s)? The recovery probabilities are modelled by a lognormal distribution. Recovery times take into account battery depletion time or core
uncovery time and the time to uncover the reactor core if no safety systems function.
3. What are the corresponding frequencies? LOOPGR – 1.2E-2/yr LOOPSC – 1.0E-2/yr LOOPPC – 1.9E-3/yr LOOPWR – 3.9E-3/yr
4. Is there consideration of variations in frequencies/probabilities for different seasons/modes of operation (e.g. during refuelling?) No, the PRA is only modelled for internal and external events at power
and seasonal variations are not considered. 5. Are there in the PSA other initiating events (other than LOOP) leading to
similar consequences (for example intrinsic failure of electrical bus bars) with a significant contribution? Yes, the PRA models the loss of 4160V AC bus (which contributes a
53% to CDF) and the loss of vital 125 VDC (0.02% contribution to CDF).
6. Are the LOOP events consequential to external hazards treated specifically or included in a more generic event? What kinds of external hazards were considered among the hazards that can cause LOOP in the PSA? What are the corresponding frequencies? The PRA model includes a LOOP weather-related (LOOPWR) event.
Although there is not an event for specific external hazards, the LOOPWR take into account severe weather conditions like thunderstorms, ice storms, hurricanes, snow, tornados and others.
• What were the data sources and methods used to estimate initiating event frequencies? The probabilities of non-recovery of off-site power to the first safety
bus for various recovery times are derived from Table 4-1 in NUREG/CR-6890, “Reevaluation of Station Blackout Risk at Nuclear Power Plants” (http://www.nrc.gov/reading-rm/doc-collections/nuregs/contract/cr6890/ ). This data was used to generate LOOP non-recovery curve parameters for the SPAR models.
2. Have you performed a detailed grid reliability analysis? Are the following points explicitly treated or grouped into a more global LOOP event: different grid connections or sources, (e.g. gas turbines)? House / island mode operation (and then for how long time period)? LOOP consequential to a transient? Transient stability conditions were studied by the licensee using digital
computer programs to simulate the system characteristics. These computer studies are updated as deemed necessary taking into account any changes in the transmission system. The results of the computer runs show that the transmission system is stable and there should be no cascading transmission outages.

NEA/CSNI/R(2017)5
246
The INL maintains a database for the NRC of LOOP frequencies. This database is a statistical and engineering analysis of LOOP Frequencies and durations at commercial nuclear reactors and includes data from 1986–2011. This database is updated annually with more recent data.
• When relevant for your PSA, what are the conditional failure probabilities (e.g. given a transient (IE), the conditional probability of loss-of-grid connection or conditional switchover failure probability? Conditional probabilities for failure of house turbine/island mode operation?)
1. Given a transient initiator, the conditional probability of a consequential LOOP is 9.1E-3 (NUREG/CR-6890, “Reevaluation of Station Blackout Risk at Nuclear Power Plants”, U.S Nuclear Regulatory Commission, 2005))
2.1.3. Main modelling assumptions
• What are the main modelling features of diesel generators, gas turbines/other possible sources, the electrical bus bars:
1. types of failure modes and level of details (i.e. if the detail of modelling enables identification of interesting insights, e.g. dependencies) Failure modes modelled for diesel generators are failure to start and
failure to run. 2. CCF
Diesel generators are susceptible to CCF on both failure modes. CCF data is collected using the U.S Nuclear Regulatory Commission’s document titled “CCF Parameter Estimations 2012”.
3. mission time, 24 hrs
• Was some guidance used for LOOP introduction/modelling in the PSA? 1. Yes, the frequencies and probabilities used for LOOP modelling are based on
the study presented in NRC’s NUREG/CR-6890. 2.1.4. Results All the following information, if available, is of interest:
• Risk metrics considered (CDF, LRF…). Please precise the definition. - The PRA model considers Core Damage Frequency (CDF) as the risk metric.
CDF is defined as the sum of the accident sequence frequencies of those accident sequences whose end state is core damage. (NUREG-2122, “Glossary of Risk-Related Terms in Support of Risk-Informed Decision Making”, U.S Nuclear Regulatory Commission, 2014)
• Risk contributions - total frequency for loss of electrical sources and contribution to overall CDF
and LRF for each radiological sources addressed in PSA Total Internal events CDF=2.38E-6/yr
LOOP events (Internal events)
Event Frequency CDF % contribution Dominant sequences Frequency LOOPGR 1.2E-2 5.0E-8 2.1% 35-01
39-58-7-3-01 3.1E-8 1.2E-8
LOOPSC 1.0E-2 4.1E-8 1.72% 35-01 39-58-7-3-01
2.6E-8 1.0E-8
LOOPPC 1.9E-3 6.8E-9 0.28% 35-01 39-30-1-01
4.8E-9 1.8E-9
LOOPWR 3.9E-3 1.8E-8 0.77% 35-01 39-30-1-01
9.8E-9 3.6E-9
- by initiating event (especially if external hazards are treated separately) N/A - by plant operational state (POS) N/A
• Main sequences – (refer to table above)

NEA/CSNI/R(2017)5
247
- Sequence 35-01 – successful reactor shutdown, successful emergency power, safety SRVs open successfully, SRVs close successfully, failure of high pressure injection, failure of manual reactor depressurisation.
- Sequence 39-58-7-3-01 – successful reactor shutdown, failure of emergency power, SRVs open successfully, SRVs close successfully, failure of recirculation pump integrity, failure of high pressure injection, failure OPR before reactor vessel failure, OPR before containment failure.
- Sequence 39-30-1-01 – safety reactor shutdown, failure of emergency power, SRVs open successfully, SRVs close successfully, successful pump seal integrity, successful RCIC provide sufficient flow to reactor vessel, failure action to extend RCIC operation, failure manual depressurisation, failure to recover off-site power, failure of diesel generator recovery, failure to tie line set up
Risk Contribution for external hazards:
• The PRA model for this plant includes a flooding and fire PRA analysis. - Internal Fire
There are 10 sequences that may lead to CDF. Out of these 10 sequences, one ends up as a LOOP event. The contribution to CDF of this fire event = 2.4E-7/yr
- Internal Flooding – internal flooding events for this specific plant do not lead to any LOOP events.
• Main contributions (importance measures for systems, support systems (i.e. I&C), component failures, human actions, …) The following importance measures are provided (as defined in NUREG-2122):
− Fussell-Vesely (FV) – relative contribution of a basic event to the calculated risk. This relative of fractional contribution is obtained by determining the reduction of the risk if the probability of the basic event is zero (FV=(F(x)-F(0))/F(x)).
− Risk Increase Ratio (RIR)- or risk achievement worth (RAW) – The increase in risk if a plant feature (e.g. system or component) was assumed to be failed or was assumed to be always unavailable (RIR=F(1)/F(x)).
− Risk Reduction Ratio (RRR) – the decrease in risk if a plant feature were assumed to be optimised or were assumed to be made perfectly reliable (RRR=F(x)/F(0)).
− Birnbaum (Bb) – An indication of the sensitivity of the accident sequence frequency to a particular basic event. Birnbaum measures the change in total risk as a result of changes to the probability of an individual basic event (B=F(1)-F(0)).
− Risk Increase Interval (RII) – An indication of how much the minimal cut set upper bound would increase if the basic event probability were increased (to a probability of 1.0) (RII=F(1)-F(x)).
− Risk Reduction Interval (RRI) – An indication of how much the minimal cut set upper bound would decrease if the basic event probability were reduced (to a probability of 0) (RRI=F(x)-F(0)). The following importance measure results presented are ranked by RIR.
• Plant centred LOOP (LOOPPC)
Description FV RIR RRR Bb Rll RRI Common cause failure of Div. 1-4 batteries
2.78E-2 2.32E+5 1.03E+0 l.00E+0 l.00E+0 1.20E-7
HCU Scram pilot SOVs fail 6.17E-3 3.61E+3 l.0IE+0 1.56E – 2 1.56E-2 2.66E-8

NEA/CSNI/R(2017)5
248
Trip system relays fail 1.36E-3 3.55E+3 l.00E+0 1.53E – 2 1.53E-2 5.87E-9
Control rod mechanical failure 8.91E-4 3.54E+3 l.00E+0 1.53E – 2 1.53E-2 3.85E-9
HCU components fail 3.83E-4 3.46E+3 l.00E+0 1.49E- 2 1.49E-2 1.65E-9
Battery chargers fail from common cause 7.83E-4 2.60E+3 l.00E+0 1.12E- 2 1.12E-2 3 .38E-9
• Grid-related LOOP (LOOPGR)
Description FV RIR RRR Bb Rll RRI Common cause failure of div. 1-4 batteries
2.42E-2 2.21E+5 1.02E+0 1.00E+0 1.00E+0 1.09E-7
HCU Scram pilot SOVs fail 5.88E-3 3.44E+3 1.01E+0 1.56E-2 1.56E-2 2.66E-8
Trip system relays fail 1.30E-3 3.39E+3 1.00E+0 1.53E-2 1.53E-2 5.87E-9
Control rod mechanical failure 8.49E-4 3.38E+3 1.00E+0 1.53E-2 1.53E-2 3.85E-9
HCU components fail 3.65E-4 3.29E+3 1.00E+0 1.49E-2 1.49E-2 1.65E-9
Battery chargers fail from common cause
7.46E-4 2.47E+3 1.00E+0 1.12E-2 1.12E-2 3.38E-9
• Weather-related LOOP (LOOPWR)
Description FV RIR RRR Bb Rll RRI
Common cause failure of Div. 1-4 batteries
1.99E-2 1.83E+5 1.02E+0 1.00E+0 1.00E+0 1.09E-7
HCU scram pilot SOVs fail 4.88E-3 2.85E+3 1.00E+0 1.56E-2 1.56E-2 2.66E-8
Trip system relays fail 1.07E-3 2.81E+3 1.00E+0 1.53E- 2 1.53E-2 5.87E-9
Control rod mechanical failure 7.04E-4 2.80E+3 1.00E+0 1.53E- 2 1.53E-2 3.85E-9
HCU components fail 3.02E-4 2.73E+3 1.00E+0 1.49E-2 1.49E-2 1.65E-9
Battery chargers fail from common cause
6.19E-4 2.05E+3 1.00E+0 1.12E-2 1.12E-2 3.38E-9
• Switchyard-centred LOOP (LOOPSC)
Description FV RIR RRR Bb Rll RRI
Common cause failure of Div. 1-4 batteries
2.69E-2 2.29E+5 1.03E+0 1.00E+0 1.00E+0 1.18E-7
HCU scram pilot SOVs fail 6.09E-3 3.56E+3 1.01E+0 1.56E-2 1.56E-2 2.66E-8
Trip system relays fail 1.34E-3 3.51E+3 1.00E+0 1.53E – 2 1.53E-2 5.87E-9
Control rod mechanical failure 8.79E-4 3.49E+3 1.00E+0 1.53E – 2 1.53E-2 3.85E-9
Note: 1. These importance measures were calculated by setting the initiating event (i.e.
LOOPWR, LOOPPC, LOOPGR, LOOPSC) to TRUE and quantifying the PRA model.

NEA/CSNI/R(2017)5
249
• Main sources of uncertainty and the results of uncertainty analysis, if performed - General LOOP modelling including: IE frequency, EDG mission time, off-site
power recovery curves, convolving FTR events, etc. - LOOP non-recovery probability estimates based on the chosen recovery model
and off-site power recovery time estimate. - Reliability of the station blackout (or black-start) power source. - Stability of the off-site power source following a grid disturbance or during
extreme-weather conditions. - Non-recovery estimates of key component failures (e.g. EDGs, turbine-driven
AFW pumps) that were observed during the actual event. - Modelling operator performance deficiencies that were observed during the
actual event. 2.2. Use of PSA results: Safety improvements already implemented or planned (in particular in the post-Fukushima framework) (These insights are considered as particularly interesting for the potential users of the report) For each example:
• Description and purpose of the safety improvement: design, operation (procedures, Tech Specs), input to SAM guidelines….
• Status of improvement (planned or implemented) • Risk impact • Role of PSA in the decision making.
- As a result of the Fukushima accident, there have been a few recommended modifications regarding loss of electrical sources. The Near Term Task Force (NTTF) recommended modifications to the Station Blackout mitigation strategies (recommendation 4). These modifications are in order to ensure that if a plant loses power, it will have sufficient procedures, strategies and equipment to cope with the loss of power for an indefinite amount of time.
- The NTTF also recommended changes it on-site emergency response capabilities (Recommendation 8). The NRC is rewriting its rules to strengthen and integrate the various emergency response capabilities at U.S. nuclear power plants (integration of EOPs, SAMGs and EDMGs).
4. Insights with respect to PSA (methods and data) (Please indicate particular issues/problems related to the loss of electrical sources, which needed (or are still needing) specific attention. Examples of specific developments will be very interesting) Possible issues:
• Completeness • HRA • Data on event frequencies • CCFs and dependencies • Recoveries • Support calculations • Sequence duration. Mission time. • Adverse effects of grid disturbances on on-site power systems • Multi-unit events • Selectivity assumptions/modelling
Issues that have been previously identified related to the loss of electrical sources have been addressed and documented in the draft document “Treatment of Loss of Off-site Power (LOOP)

NEA/CSNI/R(2017)5
250
in Probabilistic Risk Assessments: Technical Basis and Guidelines”, Electric Power Research Institute draft report C101060008-7289, October 2007 (D.E True). QUESTIONNAIRE 4 (GE BWR, Mark I Containment with Isolation condenser) 1. General plant and electrical supplies information
a) General • Plant type: BWR GE Mark I Containment (single unit) with isolation condenser • Number of Units On-site: 1 • Electrical power [MWe]: 640 MWe
b) Electrical supplies • Grid connection
- Number of independent feeders into switchyard (No. and types of grid connections) There is only one switchyard on-site. The unit output power is connected to the grid by a 230 kV connection located on station property. This plant has two sources of off-site power connected to the switchyard provided by two separate start-up transformers fed from a 34.5 kV connection. Power is supplied to the 34.5kV line from a 34.5kV and a 230kV lines. The 230 kV lines receives power form the unit itself and the 230kV transmission system.
- Alternate/independent ac grid sources that might be available (e.g. stand-by gas turbines) The on-site power system consists of a non-Class 1E system and two
redundant Class 1E (safety-related) systems. These systems are fed from the turbine generators, which feeds the station auxiliary transformer trough the generator isolated phase bus. The On-site Power System consists of an ac power distribution system (4.16 kV, 480/277V, 120/208V), a vital distribution system (120 V ac uninterruptible), and a 125 V dc power distribution system.
In the event of an SBO, a dedicated combustion turbine is available to supply power to one of the two safety-related buses.
• Designed for house turbine operation, island operation - The main turbine-generator supplies normal non-Class 1E and Class 1E systems
auxiliary loads during plant operation. - Two reserve auxiliary transformers supply the two safety feature buses from the
230-kV switchyard. • Number of EDGs and/or other internal sources (e.g. gas turbines) and capacity –
Two separate and independent EDGs are provided as the redundant on-site stand-by power supplies for safety-related equipment.
• Capacity for cross ties between trains or units – The 4160 kV buses can be cross-tied when in cold shutdown.
Brief description of non-ac dependent decay heat removal systems (e.g. turbine-driven auxiliary feed water, motor driven pumps, natural circulation, etc.)
- There are three complete 125 VDC distribution systems that make up the DC power system. The function of the DC power system is to provide a continuous source of 125 VDC power. Safety loads are supplied from DC distribution systems B and C, with DC distribution system B supplying Division B safety-related loads and DC distribution system C supplying Division A safety-related loads. DC distribution system A is used to supply non-safety loads.
- Non-AC dependent decay heat removal systems include isolation condensers. o Diesel-driven fire pumps that can be connected to provide water to core
spray after vessel is depressurised. o

NEA/CSNI/R(2017)5
251
c) Other information if relevant for PSA: • Transmission system operator and operator requirements • Single or twin turbine/s • Other
2. Insights with regard to safety 2.1 Overall results For each PSA considered please provide the following information (an example is given in appendix) 2.1.1. PSA characteristics
• Context and PSA framework (regulatory position) - Developed by the Idaho National Laboratories to be used in support of NRCs
inspection programmes. • PSA date (initial, revisions),
- Initial PRA – 9/06 - Latest revision – 6/12
• PSA scope: Level 1 covering plant internal events X internal hazards external hazards for POS: full power X low power and shutdown Level 2 covering plant internal events internal hazards � external hazards � for POS: full power � low power and shutdown � Level 3 covering plant internal events � internal hazards � external hazards � for POS: full power � low power and shutdown � Spent fuel pool � internal hazards � external hazards � 2.1.2. Initiating event The main initiating event to be considered is a loss of external electrical sources (LOOP).
• Is the LOOP event considered as a single initiating event or are there sub-categories (especially according to the root cause of the event and to the recovery conditions)? Please briefly describe sub-categories if used.
1. Categories: short loop, long loop, induced loop by other transients The LOOP events are divided into 4 categories: LOOP plant centred
(LOOPPC), LOOP Switchyard related (LOOPSC), LOOP weather-related (LOOPWR), and LOOP grid related (LOOPGR).
2. How is recovery considered? With one or several recovery times and laws/rules? (e.g. with fixed given mission times for the systems, or with a recovery law/rule versus time)? Do recovery model and recovery probabilities differentiate according to the causes of the initiating event(s)? The recovery probabilities are modelled by a lognormal distribution. Recovery times take into account battery depletion time or core
uncovery time and the time to uncover the reactor core if no safety systems function
3. What are the corresponding frequencies? LOOPGR – 1.2E-2/yr LOOPSC – 1.0E-2/yr LOOPPC – 1.9E-3/yr LOOPWR – 3.9E-3/yr
4. Is there consideration of variations in frequencies/probabilities for different seasons/modes of operation (e.g. during refuelling?)

NEA/CSNI/R(2017)5
252
No, the PRA is only modelled for internal events at power and seasonal variations are not considered.
5. Are there in the PSA other initiating events (other than LOOP) leading to similar consequences (for example intrinsic failure of electrical bus bars) with a significant contribution? Yes, the PRA models the loss of vital AC buses, with a CDF
contribution of 8%. 6. Are the LOOP events consequential to external hazards treated specifically or
included in a more generic event? What kinds of external hazards were considered among the hazards that can cause LOOP in the PSA? What are the corresponding frequencies? The PRA model includes a LOOP weather-related (LOOPWR) event.
Although there is not an event for specific external hazards, the LOOPWR take into account severe weather conditions like thunderstorms, ice storms, hurricanes, snow, tornados and others.
• What were the data sources and methods used to estimate initiating event frequencies? The probabilities of non-recovery of off-site power to the first safety
bus for various recovery times are derived from Table 4-1 in NUREG/CR-6890, “Reevaluation of Station Blackout Risk at Nuclear Power Plants” (http://www.nrc.gov/reading-rm/doc-collections/nuregs/contract/cr6890/ ). This data was used to generate LOOP non-recovery curve parameters for the SPAR models.
2. Have you performed a detailed grid reliability analysis? Are the following points explicitly treated or grouped into a more global LOOP event: different grid connections or sources, (e.g. gas turbines)? House / island mode operation (and then for how long time period)? LOOP consequential to a transient? Transient stability tests have been performed by the licensee to
determine the performance of the unit. The tests included contingencies involving the 230 kV transmission and 34.5 kV sub transmission systems. The tests consisted of extensive transient stability studies that simulated loss of units three phase faults with primary and delayed relay clearing, and single phase to ground faults with delayed clearing.
The INL maintains a database for the NRC of LOOP frequencies. This database is a statistical and engineering analysis of LOOP Frequencies and durations at commercial nuclear reactors and includes data from 1986–2011. This database is updated annually with more recent data.
• When relevant for your PSA, what are the conditional failure probabilities (e.g. given a transient (IE), the conditional probability of loss-of-grid connection or conditional switchover failure probability? Conditional probabilities for failure of house turbine/island mode operation?)
1. Given a transient initiator, the conditional probability of a consequential LOOP is 9.1E-3/yr (NUREG/CR-6890, “Reevaluation of Station Blackout Risk at Nuclear Power Plants”, U.S Nuclear Regulatory Commission, 2005).
2.1.3. Main modelling assumptions
• What are the main modelling features of diesel generators, gas turbines/other possible sources, the electrical bus bars:
1. types of failure modes and level of details (i.e. if the detail of modelling enables identification of interesting insights e.g. dependencies) Failure modes modelled for diesel generators are failure to start and
failure to run 2. CCF,

NEA/CSNI/R(2017)5
253
Diesel generators are susceptible to CCF on both failure modes. CCF data is collected using the U.S Nuclear Regulatory Commission’s document titled “CCF Parameter Estimations 2012”.
3. mission time, 24 hrs
• Was some guidance used for LOOP introduction/modelling in the PSA? 1. Yes, the frequencies and probabilities used for LOOP modelling are based on
the study presented in NRC’s NUREG/CR-6890. 2.1.4. Results All the following information, if available, is of interest:
• Risk metrics considered (CDF, LRF…). Please precise the definition. - The PRA model considers Core Damage Frequency (CDF) as the risk metric.
CDF is defined as the sum of the accident sequence frequencies of those accident sequences whose end state is core damage. (NUREG-2122, “Glossary of Risk-Related Terms in Support of Risk-Informed Decision Making”, U.S Nuclear Regulatory Commission, 2014)
• Risk contributions - total frequency for loss of electrical sources and contribution to overall CDF
and LRF for each radiological sources addressed in PSA Total Internal events CDF (at power)= 1.24E-5/yr
LOOP events contribution (internal events)
Event Frequency CDF % contribution Dominant sequences Frequency LOOPGR 1.2E-2 2.4E-7 1.92% 29-19
29-37 1.2E-7 6.4 E-8
LOOPSC 1.0E-2 1.5E-7 1.21% 29-19 29-37
6.9E-8 3.6E-8
LOOPPC 1.9E-3 2.2E-8 0.17% 29-19 29-37
8.9E-9 5.0E-9
LOOPWR 3.9E-3 2.8E-7 2.28% 29-19 29-37 29-44
2.1E-7 3.8E-8 1.6E-8
- by initiating event (especially if external hazards are treated separately) N/A - by plant operational state (POS) N/A
• Main sequences – (refer to table above) - Sequence 29-19 – Reactor protection system successful, emergency power
fails, SRVs close, isolation condenser successful, forked river combustion turbines fail, recirculation pump seals survive, actions to extend ECCS operation fail, manual reactor depressurisation success, fire water injection failed, failure of operator to shed DC loads, failure to recover off-site power (4hr), failure to recover diesel generators (4hrs)
- Sequence 29-37 – Reactor protection system successful, emergency power fails, SRVs close, isolation condenser successful, forked river combustion turbines fail, recirculation pump seals failed, , manual reactor depressurisation successful, fire water injection failed, failure to recover off-site power (30 min), failure to recover diesel generators (30 min)
- Sequence 29-44 – Reactor protection system successful, emergency power fails, SRVs close, isolation condenser failed, forked river combustion turbines failed, recirculation pump seals successful, failure to recover off-site power (1hr), failure to recover diesel generators (1hr).
• Main contributions (importance measures for systems, support systems (i.e. I&C), component failures, human actions, …) The following importance measures are provided:
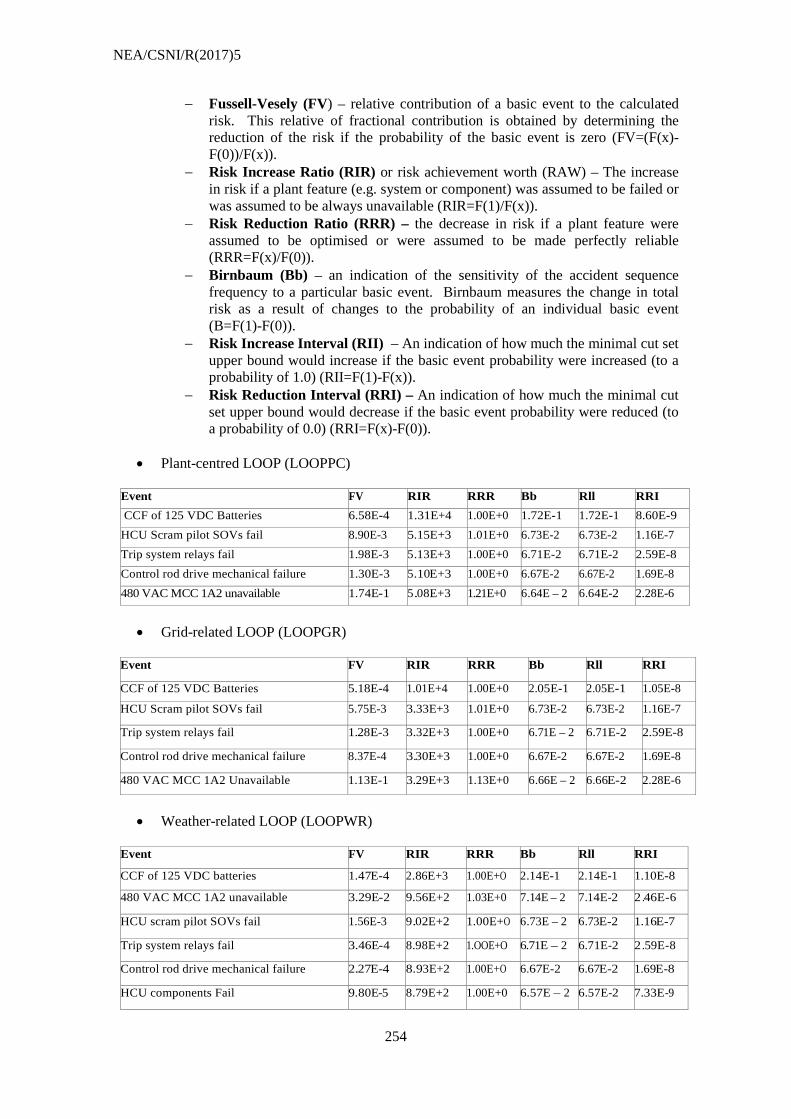
NEA/CSNI/R(2017)5
254
− Fussell-Vesely (FV) – relative contribution of a basic event to the calculated risk. This relative of fractional contribution is obtained by determining the reduction of the risk if the probability of the basic event is zero (FV=(F(x)-F(0))/F(x)).
− Risk Increase Ratio (RIR) or risk achievement worth (RAW) – The increase in risk if a plant feature (e.g. system or component) was assumed to be failed or was assumed to be always unavailable (RIR=F(1)/F(x)).
− Risk Reduction Ratio (RRR) – the decrease in risk if a plant feature were assumed to be optimised or were assumed to be made perfectly reliable (RRR=F(x)/F(0)).
− Birnbaum (Bb) – an indication of the sensitivity of the accident sequence frequency to a particular basic event. Birnbaum measures the change in total risk as a result of changes to the probability of an individual basic event (B=F(1)-F(0)).
− Risk Increase Interval (RII) – An indication of how much the minimal cut set upper bound would increase if the basic event probability were increased (to a probability of 1.0) (RII=F(1)-F(x)).
− Risk Reduction Interval (RRI) – An indication of how much the minimal cut set upper bound would decrease if the basic event probability were reduced (to a probability of 0.0) (RRI=F(x)-F(0)).
• Plant-centred LOOP (LOOPPC)
Event FV RIR RRR Bb Rll RRI CCF of 125 VDC Batteries 6.58E-4 1.31E+4 1.00E+0 1.72E-1 1.72E-1 8.60E-9 HCU Scram pilot SOVs fail 8.90E-3 5.15E+3 1.01E+0 6.73E-2 6.73E-2 1.16E-7 Trip system relays fail 1.98E-3 5.13E+3 1.00E+0 6.71E-2 6.71E-2 2.59E-8 Control rod drive mechanical failure 1.30E-3 5.10E+3 1.00E+0 6.67E-2 6.67E-2 1.69E-8 480 VAC MCC 1A2 unavailable 1.74E-1 5.08E+3 1.21E+0 6.64E – 2 6.64E-2 2.28E-6
• Grid-related LOOP (LOOPGR)
Event FV RIR RRR Bb Rll RRI
CCF of 125 VDC Batteries
5.18E-4 1.01E+4 1.00E+0 2.05E-1 2.05E-1 1.05E-8
HCU Scram pilot SOVs fail 5.75E-3 3.33E+3 1.01E+0 6.73E-2 6.73E-2 1.16E-7
Trip system relays fail 1.28E-3 3.32E+3 1.00E+0 6.71E – 2 6.71E-2 2.59E-8
Control rod drive mechanical failure 8.37E-4 3.30E+3 1.00E+0 6.67E-2 6.67E-2 1.69E-8
480 VAC MCC 1A2 Unavailable 1.13E-1 3.29E+3 1.13E+0 6.66E – 2 6.66E-2 2.28E-6
• Weather-related LOOP (LOOPWR)
Event FV RIR RRR Bb Rll RRI
CCF of 125 VDC batteries
1.47E-4 2.86E+3 1.00E+O 2.14E-1 2.14E-1 1.10E-8
480 VAC MCC 1A2 unavailable 3.29E-2 9.56E+2 1.03E+0 7.14E – 2 7.14E-2 2 .46E-6
HCU scram pilot SOVs fail 1.56E-3 9.02E+2 1.00E+O 6.73E – 2 6.73E-2 1.16E-7
Trip system relays fail 3.46E-4 8.98E+2 1.OOE+O 6.71E – 2 6.71E-2 2 .59E-8
Control rod drive mechanical failure 2.27E-4 8.93E+2 1.00E+O 6.67E-2 6.67E-2 1.69E-8
HCU components Fail 9.80E-5 8.79E+2 1.00E+0 6.57E – 2 6.57E-2 7.33E-9

NEA/CSNI/R(2017)5
255
• Switchyard-related LOOP (LOOPSC)
Event FV RIR RRR Bb Rll RRI
CCF of 125 VDC Batteries
5.88E-4 1.17E+4 1.00E+0 1.79E-1 1.79E-1 9.01E-9 HCU Scram pilot SOVs fail 7.59E-3 4.40E+3 1.01E+0 6.73E – 2 6.73E-2 1.16E-7
Trip system relays fail l.69E-3 4.38E+3 1.00E+0 6.71E- 2 6.71E-2 2 .59E-8
Control rod drive mechanical failure 1.11E-3 4.36E+3 1.00E+O 6.67E- 2 6.67E-2 1.69E-8
480 VAC MCC 1A2 Unavailable 1.49E-1 4.34E+3 1.18E+0 6.66E-2 6.65E-2 2.28E-6
HCU components Fail 4.78E-4 4.29E+3 1.00E+0 6.57E- 2 6.57E-2 7.33E-9
Note:
1. These importance measures were calculated by setting the initiating event (i.e. LOOPWR, LOOPPC, LOOPGR, LOOPSC) to TRUE and quantifying the PRA model.
• Main sources of uncertainty and the results of uncertainty analysis, if performed - General LOOP modelling including: IE frequency, EDG mission time, off-site
power recovery curves, convolving FTR events, etc. - LOOP non-recovery probability estimates based on the chosen recovery model
and off-site power recovery time estimate. - Reliability of the station blackout (or black-start) power source. - Stability of the off-site power source following a grid disturbance or during
extreme-weather conditions. - Non-recovery estimates of key component failures (e.g. EDGs, turbine-driven
AFW pumps) that were observed during the actual event. - Modelling operator performance deficiencies that were observed during the
actual event. 2.2. Use of PSA results: Safety improvements already implemented or planned (in particular in the post-Fukushima framework) (These insights are considered as particularly interesting for the potential users of the report). For each example:
• Description and purpose of the safety improvement: design, operation (procedures, Tech Specs), input to SAM guidelines….
• Status of improvement (planned or implemented) • Risk impact • Role of PSA in the decision making.
- As a result of the Fukushima accident, there have been a few recommended modifications regarding loss of electrical sources. The Near Term Task Force (NTTF) recommended modifications to the Station Blackout mitigation strategies (recommendation 4). These modifications are in order to ensure that if a plant loses power, it will have sufficient procedures, strategies and equipment to cope with the loss of power for an indefinite amount of time.
- The NTTF also recommended changes it on-site emergency response capabilities (Recommendation 8). The NRC is rewriting its rules to strengthen and integrate the various emergency response capabilities at U.S. nuclear power plants (integration of EOPs, SAMGs and EDMGs).

NEA/CSNI/R(2017)5
256
4. Insights with respect to PSA (methods and data) (Please indicate particular issues/problems related to the loss of electrical sources, which needed (or are still needing) specific attention. Examples of specific developments will be very interesting) Possible issues:
• Completeness • HRA • Data on event frequencies • CCFs and dependencies • Recoveries • Support calculations • Sequence duration. Mission time. • Adverse effects of grid disturbances on on-site power systems • Multi-unit events • Selectivity assumptions/modelling
Issues that have been previously identified related to the loss of electrical sources have been addressed and documented in the draft document “Treatment of Loss of Off-site Power (LOOP) in Probabilistic Risk Assessments: Technical Basis and Guidelines”, Electric Power Research Institute draft report C101060008-7289, October 2007 (D.E True). Summary of key insights Table 1: Comparison of LOOP frequencies CDF and specific features by plant type
Reactor type Westinghouse four-loop PWR
PWR CE 2 Loop BWR GE Mark I containment with HPCI/RCIC
BWR GE Mark 1 containment with isolation condenser
Event Freq. CDF Freq. CDF Freq. CDF Freq. CDF
LOOPGR 1.9 E-2 9.53E-7 2.42E-2 2.49E-6 1.2E-2 5.0E-8 1.2E-2 2.4E-7 LOOPWR 4.8E-3 5.94E-7 N/A N/A 3.9E-3 1.8E-8 3.9E-3 2.8E-7 LOOPSC 1.0E-2 4.23E-7 N/A N/A 1.0E-2 4.1E-8 1.0E-2 1.5E-7 LOOPPC 2.1E-3 7.14E-8 N/A N/A 1.9E-3 6.8E-9 1.9E-3 2.2E-8 Alternate sources of AC Power
• Stand-by Auxiliary Transformer powered from a nearby combustion turbine electric generating facility
• 2 Gas-turbine generators
• Dedicated connection to a nearby substation through a series of manual breaker and switch manipulation is available during a station blackout.
• Combustion turbine
Non-AC Power Dependent Means of Decay Heat Removal
• One turbine-Driven Pump
• One turbine-driven AFW pump per unit
• One HPCI turbine-driven pump
• One RCIC turbine-driven pump
• One isolation condenser

NEA/CSNI/R(2017)5
257
APPENDIX 4:
Task WGRISK 2013(1):
Probabilistic Safety Assessment insights relating to the loss of electrical sources
Complementary questions
1 Questions to all countries
1.1 PSA information
Please use the shaded drop-down lists in the following table to amend the information on spent fuel pool PSA. Internal events Internal hazards External hazards Spent fuel pool PSA
Level 1 YesYesYes YesYesYes YesYesYes Level 2 YesYesYes YesYesYes YesYesYes
1.2 Initiating event / Modelling and data
The recovery of off-site power may require switch and breaker manipulations at the site depending on several factors, i.e. design features, on-site consequences of the initiating event, plant operating mode, as well as power supply configuration (e.g. bus bars out of service during maintenance) during the occurrence of LOOP.
Have you modelled recovery actions at the site explicitly in PSA? If yes, what was the approach used to model and quantify the required actions?
1.3 Safety improvements/mobile equipment
Several countries indicate the use of mobile/portable equipment (diesels, pumps). Have you modelled explicitly this equipment in PSA? What is the approach for modelling and quantification (do you consider a human action, a delay for this action)?
1.4 Safety improvements/batteries
Please indicate if some safety improvements were performed for the batteries (longer depletion time, additional charging possibilities) and how it is modelled and quantified in the PSA.
1.5 PSA results
For the plants described in your initial survey response, please provide:
1. Conditional core damage probability (CCDP) for loss of off-site power initiators. 2. The relative contribution of loss of off-site power initiating events to overall core damage frequency (i.e. per cent of cdf represented by loss of off-site power events). 3. PSA importance measures (risk achievement worth (RAW) and Fussel-Vessely (FV)) for significant components/operator actions related to losses of off-site power. This would include the importance of
NEA/CSNI/R(2017)5
258
alternate AC power supplies (e.g. EDG's), non-AC dependent decay heat removal equipment (e.g. steam driven makeup pumps or auxiliary feed water), human actions or other factors deemed to be significant.
1.5 PSA modelling/ shared equipment
In case of use of shared equipment with other units, is the multi-units aspect modelled in the PSA? For example is there explicitly an unavailability of shared systems for a unit if used by another unit? Did you perform sensitivity studies as regards to benefits and drawbacks of interconnections between units?
2 Country-specific questions
2.1 Questions to Czech Republic (2) – Temelin NPP
The answers witness that the recovery failures are modelled as basic events in the LOOP event trees. Please briefly describe the method and data used to model and quantify recovery.
It is given in the answers that “LOOP in 24 hours following IE 2.740e-004/year”. Is it really a frequency type event, not a conditional probability? If it is frequency, then what is the meaning of 24 hours?
It is given in the answers that “Probability of house load 2.5E-001/year”. Is it really a frequency type event, not a conditional probability of house load given LOOP? If it is a frequency type event, has it then been accounted for in the PSA?
2.2 Questions to Finland – Loviisa NPP, Units 1 and 2
Please indicate in the drop-own list whether credit was given to plant operation in-house load in the PSA model for the LOOP event: YesYesYes
Please indicate whether generic or plant / site-specific data, or both types of data were used to estimate LOOP frequencies. What was the data analysis methodology used?
Concerning equipment failure modes the following is given in the answers: “Separate detailed fault tree analysis, whose results are included in figures of tables for LO”. In order to ensure consistency and enable comparison with responses from other countries, please specify the failure modes modelled for diesel generators (and any other active power supply equipment, as applicable) and for bus bars.
2.3 Questions to Finland – Olkiluoto NPP Units 1 and 2
In the answers related to initiating event categories 5 ranges of LOOP duration are given ranging from 0-10 min to over 8 h. Please describe the technical basis (reason) of this categorisation.
Please indicate in the drop-own list whether credit was given to plant operation in-house load in the PSA model for the LOOP event: YesYesYes 2.4 Questions to France (1) and France (2) – French 900 MWe PWR, French 1300 MWe PWR
Please specify the time durations that make the distinction between the short and the long loss of main grid initiating events as well as between the short and the long total loss of external power initiating events.
Please indicate in the drop-own list whether credit was given to plant operation in-house load in the PSA model for the LOOP event: YesYesYes
Different initiating event frequencies are given in Table 1 for at power and shutdown conditions. What factors were considered in making this distinction.

NEA/CSNI/R(2017)5
259
2.5 Question to France (3) – 1630 MWe EPR
Please indicate in the drop-own list whether credit was given to plant operation in-house load in the PSA model for the LOOP event: YesYesYes 2.6 Questions to Japan
Level 1 PSA for internal events at power and in low power and shutdown conditions are given in the answers for the PSA scope with a note that “Level 1, 2, 3, shutdown PRA and external event PRA were conducted separately and integrated assessment has not been done”. Since the intent of the question on PSA scope was to understand what PSA studies are available for a given plant, please indicate in the shaded drop-down list below the types of PSA that has been performed for the typical PWR and BWR plants. (It is well understood that the subsequent responses focus on level 1 PSA only.)
Internal events Internal hazards External hazards
Reactor PSA for PWR plant
Level 1 YesYesYes YesYesYes YesYesYes Level 2 YesYesYes YesYesYes YesYesYes Level 3 YesYesYes YesYesYes YesYesYes
Internal events Internal hazards External hazards
Reactor PSA for BWR plant
Level 1 YesYesYes YesYesYes YesYesYes Level 2 YesYesYes YesYesYes YesYesYes Level 3 YesYesYes YesYesYes YesYesYes
It is indicated in the answers that recovery was “considered as a function of time based on operating
history of the grids”. What are the recovery time windows that were actually used in the PSA? What was the technical basis to define these time windows?
Has recovery been modelled explicitly? If yes, what was the quantification model derived from the operating history to determine recovery probabilities?
Please indicate in the drop-own list whether credit was given to plant operation in island mode in the PSA model for the LOOP event: YesYesYes 2.7 Questions to Korea
It is indicated in the answers that “recovery probabilities are modelled based on generic data base due to lack of domestic experiences”. Please specify the generic data source and the modelling approach used to estimate the probability of recovery.
It is given in the answers that “KAERI/KHNP maintains a database for plant transient IE frequencies (including LOOP)”. Please indicate whether data for LOOP are plant specific, generic or a combination of these two sources in the database.
Please clarify whether the plant can operate in-house load mode (or island mode) or not: YesYesYes. If yes, then please indicate in the drop-own list whether credit was given to this kind of plant operation in the PSA model for the LOOP event: YesYesYes
The following answer is given in relation to LOOP induced by external hazards: “One LOOP is considered (each categories are included)”. Please clarify what is meant by the categories referred to in the answer. Are there external events treated explicitly in PSA? If yes, what are these external events? Has a consequential LOOP been considered in the PSA model for these external events?

NEA/CSNI/R(2017)5
260
2.8 Questions to Mexico
In relation to the treatment recoveries and time phases it is indicated in the answers that “accident sequences in the event trees inherently contain two periods of time”. Please give some typical examples in hours for short and long time durations. Also, please briefly describe the methods and data used to model and quantify recovery.
General features of the fault trees are discussed in the answers. In order to ensure consistency and enable comparison with responses from other countries, please specify the failure modes modelled for diesel generators (and any other active power supply equipment, as applicable) and for bus bars.
2.9 Questions to Romania
Please indicate in the drop-own list whether plant operation in-house load was modelled in the PSA for the Loss of Class IV Power Supply event: YesYesYes
Mobile diesel generators introduced following the Fukushima Daiichi accident are referred to in the description of alternate power supply sources. Please briefly describe to what extent and how these mobile diesel generators are modelled in PSA (including equipment and human failures).
2.10 Questions to Slovenia
Please indicate in the drop-own list whether credit was given to plant operation in-house load in the PSA model for the LOOP event: YesYesYes
In the description of power supply architecture and back-up power supply sources it is given that the Krško “plant has 110 kV transmission line to the combined gas-steam power plant at Brestanica that serves as the alternate preferred source”. Please indicate whether this alternate source is modelled in the LOOP event sequences or not. If yes, how is it taken into account?
2.11 Questions to Sweden (1) – OKG studies
In the answers describing the initiating events defined and analysed in the OKG studies it is indicated that “The initiating event LOOP is called TE in OKG’s studies. Also loss of individual grids in the plant is analysed, if they leads to reactor shutdown.” Further in the answers initiating event frequencies are given as follows: frequency of Loss of 130kV for O1, frequency of Loss of 400kV for O3. Please clarify what is the actual number of power failure events treated separately as initiating events in the OKG studies for the different units and what are the corresponding definitions of these initiating events.
It is indicated in the answers that “External hazards are included implicit”. To avoid double counting what was the modelling method used in the PSA for those external hazards that cause not only LOOP but failures of other safety-related SSCs?
What are the types of external hazards considered in the external event PSA that can cause LOOP?
2.12 Questions to Sweden (2) – Forsmark NPP
Concerning the modelling of recovery the following answer is given: “It is dependent on IE.” Please provide further details including the actual recovery times as well as the methods and data used to model and quantify recovery.
The following answer is given concerning the estimation of initiating frequencies “Different methods have been used for different IEs.” Please briefly describe the methods and data used for the estimation.
It is indicated in the answers that “There are several other external event IEs that cause LOOP”. What are these external events?

NEA/CSNI/R(2017)5
261
Concerning equipment failure modes the following is given in the answers: “In detail with full functional dependencies (electrical, area and cooling)”. In order to ensure consistency and enable comparison with responses from other countries, please specify the failure modes modelled for diesel generators (and any other active power supply equipment, as applicable) and for bus bars.
In the description of power supply architecture and back-up power supply sources it is given that “A gas turbine is connected to the 70 kV line”. Please indicate whether this alternate source is modelled in the detailed modelling of power supply failures referred to in the answers. If yes, how is it taken into account?
A “Yes” answer is given for mission time. Please indicate the actual values of mission time in hours as used in the LOOP PSA model.
2.13 Questions to Switzerland
Among others, permanent loss of the 220 kV grid and permanent loss of both the 220 kV and the 50 kV grids are considered as initiating events. Also, it is indicated in the answers that LOOPs caused by external events are always considered unrecovered. Are there other causes than external events that are considered in the analysis as causes that lead to a permanent LOOP event?
Please indicate in the drop-own list whether credit was given to plant operation in-house load in the PSA model for the LOOP event: YesYesYes
Reference is made to an experience-based runback failure probability in the answers. Please provide this probability, if possible.
In the general description of the plant several layers of protection as “safety layers” are listed. Please briefly describe to what extent and how these safety layers are modelled in PSA.
2.14 Question to USA – CE PWR, Large Dry Containment
The LOOP frequency is as low as 2.49E-6/yr. What was the technical basis for estimating LOOP frequency?
2.15 Question to USA – GE BWR, Mark I Containment with external hazards
An alternate AC (AAC) of back-up power supply source is described in the answers with a note that “This source is powered from a nearby substation and is dedicated to this plant through a series of manual breaker and switch manipulations performed at both sites”. Please briefly describe to what extent and how the use of this alternate source is modelled in the LOOP sequences.

NEA/CSNI/R(2017)5
262
APPENDIX 5:
Task WGRISK 2013(1):
Probabilistic Safety Assessment insights relating to the loss of electrical sources
Complementary questions
Answers from: Canada Czech Republic Finland France Hungary Japan Korea Mexico Romania Slovenia Spain Switzerland Chinese Taipei USA

NEA/CSNI/R(2017)5
263
CANADA
Task WGRISK 2013(1): Probabilistic Safety Assessment insights relating to the loss of electrical sources
Complementary questions CNSC Response
1. Questions to all countries Examples in the main questionnaire are applicable only to single-unit CANDU. However, in the response of these complementary questions, we have provided additional inputs from multi-units as appropriate. 1.1 PSA information
Please use the shaded drop-down lists in the following table to amend the information on spent fuel pool PSA.
There is no specific stand-alone spent fuel pool PSA for Canadian NPPs (single or multi-unit sites). For the single unit used in the example provided in the main questionnaire, the following fuel storage
accidents are included in level 1 and level 2 PSAs for internal events: • Spent Fuel Transfer System Failures • Mechanical Damage to Fuel During Storage • Mechanical Damage to Fuel During Transfer to Spent Fuel Bay • Loss of Spent Fuel Bay Heat Sink • Partial Loss of Storage Bay Inventory
Internal events Internal hazards External hazards Spent fuel pool (included in PSA for internal events)
Level 1 YesYesYes No No
Level 2 Yes No No
1.2 Initiating event / Modelling and data
• The recovery of off-site power may require switch and breaker manipulations at the site depending on several factors, i.e. design features, on-site consequences of the initiating event, plant operating mode, as well as power supply configuration (e.g. bus bars out of service during maintenance) during the occurrence of LOOP.
• Have you modelled recovery actions at the site explicitly in PSA?
Recovery is included as time only – grid recovered in 30 min – not as equipment to be aligned Multi-Unit sites: Yes.
• If yes, what was the approach used to model and quantify the required actions? During the occurrence of LOOP, CANDU reactors power level is automatically reduced to certain
level (for example: 60% of full power) and maintain an island operation mode. For multi-unit CANDU plants, any survived reactor can provide sufficient power to the whole plant. However, it does need operator action to put the reactor in Poison Prevent model.
The model usually includes the operator recover action for the recovery of switchyard with the help of the grid operator. Complex human interactions are used in the analysis.

NEA/CSNI/R(2017)5
264
1.3 Safety improvements/mobile equipment
• Several countries indicate the use of mobile/portable equipment (diesels, pumps). Have you modelled explicitly this equipment in PSA? What is the approach for modelling and quantification (do you consider a human action, a delay for this action)?
The mobile equipment is explicitly modelled in the PSA developed for multi-unit sites. There are two approaches for modelling and quantification of human actions. First approach: In the first approach, the recovery actions are put directly to the baseline PSA results (sequences) by
taking the consideration of human failures and equipment failures, giving the environmental concerns due to initiating events and accident scenarios.
In the second approach: The mobile equipment functions are directly built in the model, taking considerations of human errors
and equipment failures. 1.4 Safety improvements/batteries
• Please indicate if some safety improvements were performed for the batteries (longer depletion time, additional charging possibilities) and how it is modelled and quantified in the PSA.
Not applicable 1.5 PSA results For the plants described in your initial survey response, please provide:
1. Conditional core damage probability (CCDP) for loss of off-site power initiators. The following definition on LOOP was provided in the initial survey (main questionnaire) for single-
unit: LOOP is not treated as a distinct explicit Initiating, but a subset of the loss of class IV IE where
connection to grid is lost. In case of failure of islanded operation and also loss of off-site power events, the station experiences a
total loss of class IV event (both ODD and EVEN electrical distribution sections are affected). If only one electrical distribution division (ODD or EVEN) is lost, a partial loss of class IV event is to
be considered.
Initiating event Description CCDP XEL 4.1 Total loss of Class IV Power
reactor operating 7.78 E-04
XEL 4.2 Total loss of Class IV Power – reactor shutdown, HTS Cold Depressurised and full
1.82 E-06
XEL 4.3 Total loss of Class IV power – reactor shutdown, HTS cold depressurised and drained to the header level
3.27 E-03
2. The relative contribution of loss of off-site power initiating events to overall core damage
frequency (i.e. per cent of cdf represented by loss of off-site power events).
IE Pre-recovery % (contribution to CDF) Post-recovery % (contribution to CDF) XEL4-1 0.84 0.15

NEA/CSNI/R(2017)5
265
3. PSA importance measures (risk achievement worth (RAW) and Fussel-Vessely (FV)) for significant components/operator actions related to losses of off-site power. This would include the importance of alternate AC power supplies (e.g. EDG's), non-AC dependent decay heat removal equipment (e.g. steam driven makeup pumps or auxiliary feed water), human actions or other factors deemed to be significant.
Not available 1.6 PSA modelling/ shared equipment In case of use of shared equipment with other units, is the multi-units aspect modelled in the PSA? For example is there explicitly an unavailability of shared systems for a unit if used by another unit? Did you perform sensitivity studies as regards to benefits and drawbacks of interconnections between units?
Yes, the multi-unit aspects are modelled.
The shared systems are modelled in different ways:
1. The initiating event caused by the failure of a shared system. For example, failure of the switchyard, the failure of the fore bay.
2. The initiating event caused by one unit has impact on other units. For example, steam line break from one unit may cause the loss of normal and back-up power supplies.
3. The shared mitigating systems and support systems (Emergency Coolant Injection System, Emergency Water System, Instrument Air, Inter-unit feed water tie) are explicitly modelled.
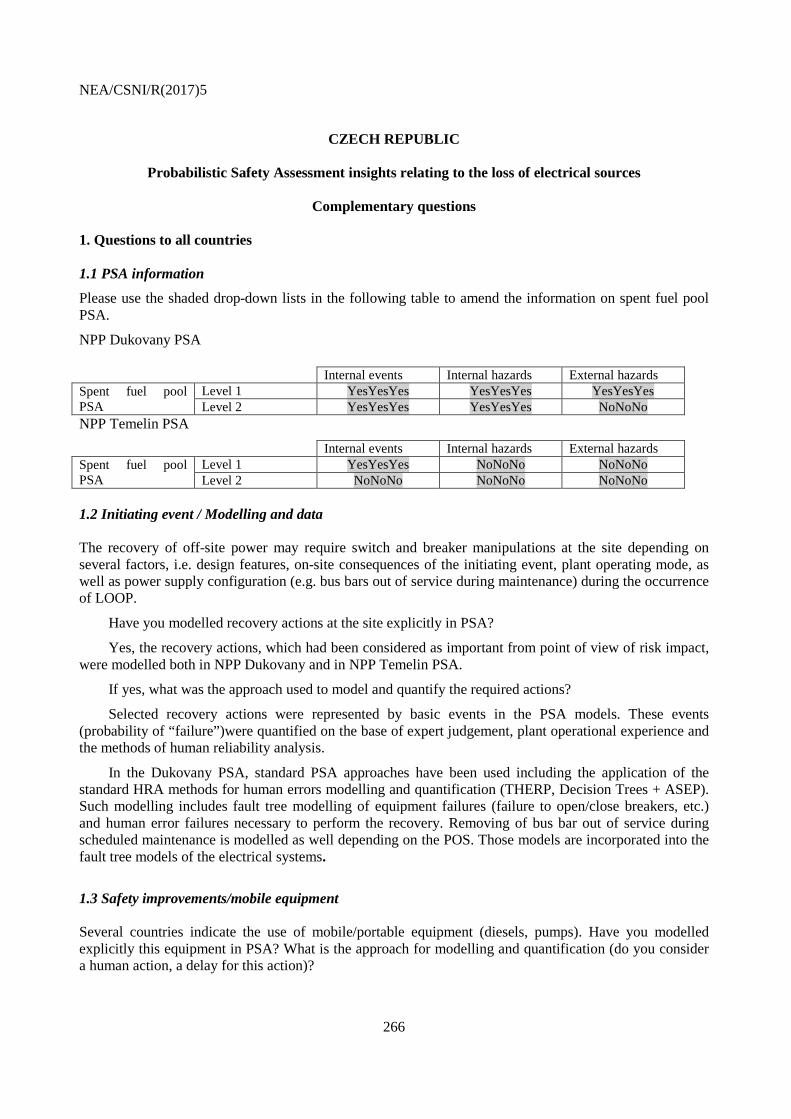
NEA/CSNI/R(2017)5
266
CZECH REPUBLIC
Probabilistic Safety Assessment insights relating to the loss of electrical sources
Complementary questions 1. Questions to all countries 1.1 PSA information
Please use the shaded drop-down lists in the following table to amend the information on spent fuel pool PSA.
NPP Dukovany PSA
Internal events Internal hazards External hazards Spent fuel pool PSA
Level 1 YesYesYes YesYesYes YesYesYes Level 2 YesYesYes YesYesYes NoNoNo
NPP Temelin PSA Internal events Internal hazards External hazards Spent fuel pool PSA
Level 1 YesYesYes NoNoNo NoNoNo Level 2 NoNoNo NoNoNo NoNoNo
1.2 Initiating event / Modelling and data The recovery of off-site power may require switch and breaker manipulations at the site depending on several factors, i.e. design features, on-site consequences of the initiating event, plant operating mode, as well as power supply configuration (e.g. bus bars out of service during maintenance) during the occurrence of LOOP.
Have you modelled recovery actions at the site explicitly in PSA?
Yes, the recovery actions, which had been considered as important from point of view of risk impact, were modelled both in NPP Dukovany and in NPP Temelin PSA.
If yes, what was the approach used to model and quantify the required actions?
Selected recovery actions were represented by basic events in the PSA models. These events (probability of “failure”)were quantified on the base of expert judgement, plant operational experience and the methods of human reliability analysis.
In the Dukovany PSA, standard PSA approaches have been used including the application of the standard HRA methods for human errors modelling and quantification (THERP, Decision Trees + ASEP). Such modelling includes fault tree modelling of equipment failures (failure to open/close breakers, etc.) and human error failures necessary to perform the recovery. Removing of bus bar out of service during scheduled maintenance is modelled as well depending on the POS. Those models are incorporated into the fault tree models of the electrical systems.
1.3 Safety improvements/mobile equipment Several countries indicate the use of mobile/portable equipment (diesels, pumps). Have you modelled explicitly this equipment in PSA? What is the approach for modelling and quantification (do you consider a human action, a delay for this action)?

NEA/CSNI/R(2017)5
267
The use of mobile/portable equipment is a part of modifications proposed as a result of stress tests for both plants. These modifications are planned to be addressed in plant PSA models as soon as they are carried out at plant.
An important part of modelling of these modifications will definitely be analysis of related human actions by HRA methods. It is supposed that (as a part of installation of these equipment) these actions will be processed, what will impact the corresponding HRA and the results of it (lowering human error probability). As a part of the analysis, time windows expected to be available for the actions and time windows expected to be necessary for the actions will be compared and addressed in the risk analysis.
1.4 Safety improvements/batteries
Please indicate if some safety improvements were performed for the batteries (longer depletion time, additional charging possibilities) and how it is modelled and quantified in the PSA.
The following safety measures and tests have been performed very recently at Dukovany NPP: • Discharge battery test with the connected actual loads used in the plant response to blackout. It
reveals much longer time (7-8 hrs) to depletion than expected for design basis (2 hrs). • Portable UPS and portable diesel generators to temporary recover indications in control room
(supported by procedures to find what indication of parameters should be recovered and how) after loss of power to I&C.
Standard PSA approaches have been used including the application of the standard HRA methods for human errors modelling and quantification (THERP, Decision Trees + ASEP). Such modelling includes fault tree modelling of equipment failures (failure to start/run of mobile DGs, etc.) and human error failures necessary to perform the recovery. Those models are incorporated into the fault tree models of the power supply from batteries or into models of control room indications.
1.5 PSA results For the plants described in your initial survey response, please provide:
1. Conditional core damage probability (CCDP) for loss of off-site power initiators. 2. The relative contribution of loss of off-site power initiating events to overall core damage frequency (i.e. per cent of cdf represented by loss of off-site power events).
The results for NPP Dukovany PSA can be found below.
IE Description CCDP %CDF T5.1 Partial loss of the external grid (one of the reserve 110 kV lines to each twin unit is
available, TG operation on self consumption is available at-power operation) 1.3 × 10⁻⁸ 0.01
T5.2 Total loss of the external grid 7.2 × 10⁻⁶ 4.71 T5.5 Loss of the single-unit 400 kV connection to grid (400 kV connections to the
remaining units are available, all reserve 110 kV lines are available, the possibility of TG operation on self consumption is significantly reduced at-power operation)
8.4 × 10⁻⁸ 0.24
T5.6 Loss of all reserve 110 kV lines to one of the twin units during shutdown 1.3 × 10⁻⁶ 0.18 Note: The average CCDP over all applicable POSes, which includes also POS durations (CCDP in each POS is weighted by the POS duration), is presented. The contribution to the overall CDF for internal events/hazards (all POSes including at-power operation) is presented. Values are valid for the 1st unit at the end of 2014 (i.e. after the regular PSA data update). Most of the safety measures from Post-Fukushima National Action Plan (e.g. SBO DG or mobile DGs) have not been included in this model yet.
The NPP Temelin PSA is under comprehensive complete revision right now. The results will be published as soon as the revision of the relevant part of this PSA is ready.
3. PSA importance measures (risk achievement worth (RAW) and Fussel-Vessely (FV)) for significant components/operator actions related to losses of off-site power. This would include the

NEA/CSNI/R(2017)5
268
importance of alternate AC power supplies (e.g. EDG's), non-AC dependent decay heat removal equipment (e.g. steam driven makeup pumps or auxiliary feed water), human actions or other factors deemed to be significant.
The results of NPP Dukovany PSA can be found below. Importance values for LOOP type initiating events:
Component Description F-V RAW DG All failure modes altogether (including CCF) affecting the DG with the
highest F-V value 0.645
An independent failure mode with the highest F-V or RAW value among all DGs (failure mode can be different for F-V and for RAW)
0.179 5.85
A CCF failure mode with the highest F-V or RAW value (failure mode can be different for F-V and for RAW)
0.260 417
External grid External grid recovery up to 2 hours 0.619 2.12 TG CCF of both TGs (the only TG failure mode modelled) in the analysed unit 0.596 4.57
CCF of both TGs (the only TG failure mode modelled) in the other units 0.294 2.76
Human errors typical to recover from blackout scenarios F-V RAW Failure to provide temporary indication of the selected plant parameters using portable UPS/portable diesel generators after battery depletion
0.,313 2.32
Failure to connect power supply from the other units 0.287 17.6 Failure to open the doors to provide I&C cooling during blackout 0.156 5.56 Failure to perform FW supply to SGs from fire brigade pumps 6.67 × 10⁻² 4.6
Notes: 1: Importance values for overall CDF for LOOP type IEs altogether (i.e. T5.1 + T5.2 + T5.5 + T5.6 in all POSes including at-power operation) are presented. Values are valid for the 1st unit at the end of 2014 (i.e. after the regular PSA data update). Most of the recent safety measures from Post-Fukushima National Action Plan (e.g. SBO DG or mobile DGs) have not been included in this model yet. 2. Due to asymmetrical components in the secondary circuit and due to the arbitrary selection of one division to be under maintenance during cold shutdown the importance values for individual DGs in different divisions are not the same.
The NPP Temelin PSA is under comprehensive complete revision right now. The results will be published as soon as the revision of the relevant part of this PSA is ready.

NEA/CSNI/R(2017)5
269
1.5 PSA modelling/ shared equipment In case of use of shared equipment with other units, is the multi-units aspect modelled in the PSA?
Yes, the multi-unit aspects are modelled explicitly in Czech NPPs PSAs. This aspect is much more
important in case of NPP Dukovany PSA for the plant site with four units. In case of NPP Temelin PSA, the aspect is not that important (site with two units).
For example is there explicitly an unavailability of shared systems for a unit if used by another unit? Yes, it is. Did you perform sensitivity studies as regards to benefits and drawbacks of interconnections between
units? No, such analysis has not been performed yet.
2. Country-specific questions 2.1 Questions to Czech Republic (2) – Temelin NPP The answers witness that the recovery failures are modelled as basic events in the LOOP event trees. Please briefly describe the method and data used to model and quantify recovery.
Basic event. “Failure to recover the off-site power within 45 min” is used in the PSA model for those
cases, where off-site power (400 kV or 110 kV grid) is recovered prior feed water in Steam Generator boiling off (45 – 60 minutes). Thus, even in the case of all emergency power supply sources failure (3 DGs/unit and 2 back-up DGs common for both Temelin units) under LOSP conditions, there will be still chance to avoid core damage state in case of power supply recovery within 45 minutes. Data used for recovery action are based upon the results of PSA data analysis task and they are generic, basically. However, new data analysis will be performed soon for the LOSP scenarios as a part of large update of NPP Temelin PSA, which is going to be carried out during next two years and which will cover also the LOSP scenarios.
It is given in the answers that “LOOP in 24 hours following IE 2.740e-004/year”. Is it really a frequency type event, not a conditional probability? If it is frequency, then what is the meaning of 24 hours?
This basic event was included in the model based upon one of PSA model reviews recommendation.
This BE shall reflect a potential for conditional LOOP occurrence following an initiating event other than LOOP. As PSA model considers mission time 24 hours following IE occurrence, the base for deriving the numerical value of such basic event is simply to divide frequency of LOOP used in the analysis by 365. This is therefore not conditional probability. In the next regular PSA model update this BE will be removed and replaced by the BE for 400 kV and 110 kV lines failure.
It is given in the answers that “Probability of house load 2.5E-001/year”. Is it really a frequency type
event, not a conditional probability of house load given LOOP? If it is a frequency type event, has it then been accounted for in the PSA?
This BE should represent conditional probability of turbine runback failure to the house load
following LOSP conditions. Basically, it is a probability of turbine runback failure in case of loss of off-

NEA/CSNI/R(2017)5
270
site power. This BE will be removed from the model during next regular PSA model update, primarily because of crediting just limited time for the turbine run in island operational mode following successful house load achievement. It is believed, based upon limited time test of turbine operation at house load, that such mode of operation is time restricted (in range of hour-hours) – for that time the unit can survive without power supply anyway (see response to question 1). 2.2 Questions to Finland – Loviisa NPP, Units 1 and 2 Please indicate in the drop-own list whether credit was given to plant operation in-house load in the PSA model for the LOOP event: YesYesYes
Please indicate whether generic or plant / site-specific data, or both types of data were used to
estimate LOOP frequencies. What was the data analysis methodology used? Concerning equipment failure modes the following is given in the answers: “Separate detailed fault
tree analysis, whose results are included in figures of tables for LO”. In order to ensure consistency and enable comparison with responses from other countries, please specify the failure modes modelled for diesel generators (and any other active power supply equipment, as applicable) and for bus bars. 2.3 Questions to Finland – Olkiluoto NPP Units 1 and 2 In the answers related to initiating event categories 5 ranges of LOOP duration are given ranging from 0-10 min to over 8 h. Please describe the technical basis (reason) of this categorisation.
Please indicate in the drop-own list whether credit was given to plant operation in-house load in the
PSA model for the LOOP event: YesYesYes 2.4 Questions to France (1) and France (2) – French 900 MWe PWR, French 1300 MWe PWR Please specify the time durations that make the distinction between the short and the long loss of main grid initiating events as well as between the short and the long total loss of external power initiating events.
Please indicate in the drop-own list whether credit was given to plant operation in-house load in the
PSA model for the LOOP event: YesYesYes Different initiating event frequencies are given in Table 1 for at power and shutdown conditions.
What factors were considered in making this distinction? 2.5 Question to France (3) – 1630 MWe EPR Please indicate in the drop-own list whether credit was given to plant operation in-house load in the PSA model for the LOOP event: YesYesYes
2.6 Questions to Japan Level 1 PSA for internal events at power and in low power and shutdown conditions are given in the answers for the PSA scope with a note that “Level 1, 2, 3, shutdown PRA and external event PRA were conducted separately and integrated assessment has not been done”. Since the intent of the question on PSA scope was to understand what PSA studies are available for a given plant, please indicate in the shaded drop-down list below the types of PSA that has been performed for the typical PWR and BWR plants. (It is well understood that the subsequent responses focus on level 1 PSA only.)

NEA/CSNI/R(2017)5
271
Internal events Internal hazards External hazards
Reactor PSA for PWR plant
Level 1 YesYesYes YesYesYes YesYesYes Level 2 YesYesYes YesYesYes YesYesYes Level 3 YesYesYes YesYesYes YesYesYes
Internal events Internal hazards External hazards
Reactor PSA for BWR plant
Level 1 YesYesYes YesYesYes YesYesYes Level 2 YesYesYes YesYesYes YesYesYes Level 3 YesYesYes YesYesYes YesYesYes
It is indicated in the answers that recovery was “considered as a function of time based on operating
history of the grids”. What are the recovery time windows that were actually used in the PSA? What was the technical basis to define these time windows?
Has recovery been modelled explicitly? If yes, what was the quantification model derived from the
operating history to determine recovery probabilities? Please indicate in the drop-own list whether credit was given to plant operation in island mode in the
PSA model for the LOOP event: YesYesYes 2.7 Questions to Korea It is indicated in the answers that “recovery probabilities are modelled based on generic data base due to lack of domestic experiences”. Please specify the generic data source and the modelling approach used to estimate the probability of recovery.
It is given in the answers that “KAERI/KHNP maintains a database for plant transient IE frequencies
(including LOOP)”. Please indicate whether data for LOOP are plant specific, generic or a combination of these two sources in the database.
Please clarify whether the plant can operate in-house load mode (or island mode) or not: YesYesYes.
If yes, then please indicate in the drop-own list whether credit was given to this kind of plant operation in the PSA model for the LOOP event: YesYesYes
The following answer is given in relation to LOOP induced by external hazards: “One LOOP is
considered (each categories are included)”. Please clarify what is meant by the categories referred to in the answer. Are there external events treated explicitly in PSA? If yes, what are these external events? Has a consequential LOOP been considered in the PSA model for these external events?
2.8 Questions to Mexico In relation to the treatment recoveries and time phases it is indicated in the answers that “accident sequences in the event trees inherently contain two periods of time”. Please give some typical examples in hours for short and long time durations. Also, please briefly describe the methods and data used to model and quantify recovery.
General features of the fault trees are discussed in the answers. In order to ensure consistency and
enable comparison with responses from other countries, please specify the failure modes modelled for diesel generators (and any other active power supply equipment, as applicable) and for bus bars.

NEA/CSNI/R(2017)5
272
2.9 Questions to Romania Please indicate in the drop-own list whether plant operation in-house load was modelled in the PSA for the Loss of Class IV Power Supply event: YesYesYes
Mobile diesel generators introduced following the Fukushima Daiichi accident are referred to in the
description of alternate power supply sources. Please briefly describe to what extent and how these mobile diesel generators are modelled in PSA (including equipment and human failures). 2.10 Questions to Slovenia Please indicate in the drop-own list whether credit was given to plant operation in-house load in the PSA model for the LOOP event: YesYesYes
In the description of power supply architecture and back-up power supply sources it is given that the
Krško “plant has 110 kV transmission line to the combined gas-steam power plant at Brestanica that serves as the alternate preferred source”. Please indicate whether this alternate source is modelled in the LOOP event sequences or not. If yes, how is it taken into account? 2.11 Questions to Sweden (1) – OKG studies In the answers describing the initiating events defined and analysed in the OKG studies it is indicated that ”The initiating event LOOP is called TE in OKG:s studies. Also loss of individual grids in the plant is analysed, if they leads to reactor shutdown.” Further in the answers initiating event frequencies are given as follows: frequency of Loss of 130kV for O1, frequency of Loss of 400kV for O3. Please clarify what is the actual number of power failure events treated separately as initiating events in the OKG studies for the different units and what are the corresponding definitions of these initiating events.
It is indicated in the answers that “External hazards are included implicit”. To avoid double counting
what was the modelling method used in the PSA for those external hazards that cause not only LOOP but failures of other safety-related SSCs?
What are the types of external hazards considered in the external event PSA that can cause LOOP?
2.12 Questions to Sweden (2) – Forsmark NPP Concerning the modelling of recovery the following answer is given: “It is dependent on IE.” Please provide further details including the actual recovery times as well as the methods and data used to model and quantify recovery.
The following answer is given concerning the estimation of initiating frequencies “Different methods
have been used for different IEs.” Please briefly describe the methods and data used for the estimation. It is indicated in the answers that “There are several other external event IEs that cause LOOP”. What
are these external events? Concerning equipment failure modes the following is given in the answers: “In detail with full
functional dependencies (electrical, area and cooling)”. In order to ensure consistency and enable comparison with responses from other countries, please specify the failure modes modelled for diesel generators (and any other active power supply equipment, as applicable) and for bus bars.

NEA/CSNI/R(2017)5
273
In the description of power supply architecture and back-up power supply sources it is given that “A gas turbine is connected to the 70 kV line”. Please indicate whether this alternate source is modelled in the detailed modelling of power supply failures referred to in the answers. If yes, how is it taken into account?
A “Yes” answer is given for mission time. Please indicate the actual values of mission time in hours
as used in the LOOP PSA model. 2.13 Questions to Switzerland Among others, permanent loss of the 220 kV grid and permanent loss of both the 220 kV and the 50 kV grids are considered as initiating events. Also, it is indicated in the answers that LOOPs caused by external events are always considered unrecovered. Are there other causes than external events that are considered in the analysis as causes that lead to a permanent LOOP event?
Please indicate in the drop-own list whether credit was given to plant operation in-house load in the
PSA model for the LOOP event: YesYesYes Reference is made to an experience-based runback failure probability in the answers. Please provide
this probability, if possible. In the general description of the plant several layers of protection as “safety layers” are listed. Please
briefly describe to what extent and how these safety layers are modelled in PSA. 2.14 Question to USA – CE PWR, large dry containment
The LOOP frequency is as low as 2.49E-6/yr. What was the technical basis for estimating LOOP frequency?
2.15 Question to USA – GE BWR, Mark I Containment with external hazards An alternate AC (AAC) of back-up power supply source is described in the answers with a note that “This source is powered from a nearby substation and is dedicated to this plant through a series of manual breaker and switch manipulations performed at both sites”. Please briefly describe to what extent and how the use of this alternate source is modelled in the LOOP sequences.

NEA/CSNI/R(2017)5
274
FINLAND
Probabilistic Safety Assessment insights relating to the loss of electrical sources
Complementary questions 1 Questions to all countries 1.1 PSA information Please use the shaded drop-down lists in the following table to amend the information on spent fuel pool PSA. Loviisa Internal events Internal hazards External hazards Spent fuel pool PSA
Level 1 NoNoNo NoNoNo NoNoNo Level 2 NoNoNo NoNoNo NoNoNo
Olkiluoto Internal events Internal hazards External hazards Spent fuel pool PSA
Level 1 YesYesYes YesYesYes YesYesYes Level 2 YesYesYes YesYesYes YesYesYes
1.2 Initiating event / Modelling and data The recovery of off-site power may require switch and breaker manipulations at the site depending on several factors, i.e. design features, on-site consequences of the initiating event, plant operating mode, as well as power supply configuration (e.g. bus bars out of service during maintenance) during the occurrence of LOOP.
Have you modelled recovery actions at the site explicitly in PSA? Yes If yes, what was the approach used to model and quantify the required actions? Fault tree analysis of switchover systems; Recovery time distribution; manual operations for starting
of diesels etc. 1.3 Safety improvements/mobile equipment Several countries indicate the use of mobile/portable equipment (diesels, pumps). Have you modelled explicitly this equipment in PSA? What is the approach for modelling and quantification (do you consider a human action, a delay for this action)? No
1.4 Safety improvements/batteries Please indicate if some safety improvements were performed for the batteries (longer depletion time, additional charging possibilities) and how it is modelled and quantified in the PSA.
Olkiluoto: Diversification based on age: half-life-time difference for batteries in trains AC and BD; Earthquake-resistant support frames for batteries

NEA/CSNI/R(2017)5
275
1.5 PSA results For the plants described in your initial survey response, please provide:
1. Conditional core damage probability (CCDP) for loss of off-site power initiators. Power operation: Olkiluoto: Loop due to internal events: 2.87E-7 Loop due to external events: roughly 0.5 (several initiators) Loviisa: 7.5E-6 (LOOP longer than 4h) 2. The relative contribution of loss of off-site power initiating events to overall core damage
frequency (i.e. per cent of cdf represented by loss of off-site power events). Olkiluoto Loop internal: 16%; Loop external 8% Loviisa: 0.3% 3. PSA importance measures (risk achievement worth (RAW) and Fussel-Vessely (FV)) for
significant components/operator actions related to losses of off-site power. This would include the importance of alternate AC power supplies (e.g. EDG's), non-AC dependent decay heat removal equipment (e.g. steam driven makeup pumps or auxiliary feed water), human actions or other factors deemed to be significant.
Importance measures computed for cut sets including LOOP only. Olkiluoto, LOOP internal, FV 6.55E-01 Manual operation: cross connection of other NPP unit EDG fails 6.52E-01 Manual operation: Failure to start on-site gas turbine 2.80E-01 Failure of 4 on-site EDGs, all combinations 1.74E-01 Failure of automatic EDG bus control (reconnection of loads) 5.13E-02 4x CCF 110 V Batteries 4.92E-02 4x CCF to start seawater pumps (cooling of EDGs etc.) 4.44E-02 2...9 pressure relief valves remain open Olkiluoto, LOOP internal, RAW 3.49E+04 4x CCF RPV level measurement; erroneous high level 3.49E+04 4x CCF 110 V batteries 3.49E+04 Failure of automatic EDG bus control (reconnection of loads) 3.48E+04 Failure of overpressure relief valves to open (14/14) 1.02E+04 4x CCF 24 V (+/-) batteries 5.84E+03 4x CCF on-site EDGs
1.5 PSA modelling/ shared equipment In case of use of shared equipment with other units, is the multi-units aspect modelled in the PSA? For example is there explicitly an unavailability of shared systems for a unit if used by another unit? Did you perform sensitivity studies as regards to benefits and drawbacks of interconnections between units? Unavailability of shared systems not modelled. Sensitivity studies not performed.
2 Country-specific questions 2.1 Questions to Czech Republic (2) – Temelin NPP The answers witness that the recovery failures are modelled as basic events in the LOOP event trees. Please briefly describe the method and data used to model and quantify recovery.

NEA/CSNI/R(2017)5
276
It is given in the answers that “LOOP in 24 hours following IE 2.740e-004/year”. Is it really a frequency type event, not a conditional probability? If it is frequency, then what is the meaning of 24 hours?
It is given in the answers that “Probability of house load 2.5E-001/year”. Is it really a frequency type
event, not a conditional probability of house load given LOOP? If it is a frequency type event, has it then been accounted for in the PSA? 2.2 Questions to Finland – Loviisa NPP, Units 1 and 2 Please indicate in the drop-own list whether credit was given to plant operation in-house load in the PSA model for the LOOP event: YesYesYes
Please indicate whether generic or plant / site-specific data, or both types of data were used to
estimate LOOP frequencies. What was the data analysis methodology used? Plant-specific site operating experience; Simulation model based on Fingrid (national grid company)
statistics; Fault tree model of HV distribution lines in connection with severe weather events. Severe weather data provided by meteorological institute.
Concerning equipment failure modes the following is given in the answers: “Separate detailed fault
tree analysis, whose results are included in figures of tables for LO”. In order to ensure consistency and enable comparison with responses from other countries, please specify the failure modes modelled for diesel generators (and any other active power supply equipment, as applicable) and for bus bars.
Diesels: failure to start, failure to run for 24 hours; EDG automation fails; Bus bars: Circuit breaker fails to open/close; circuit breaker spurious operation; bus switchover
automatics fails 2.3 Questions to Finland – Olkiluoto NPP Units 1 and 2 In the answers related to initiating event categories 5 ranges of LOOP duration are given ranging from 0-10 min to over 8 h. Please describe the technical basis (reason) of this categorisation.
Categories are used, for example, to classify operator timings, modelling of batteries (depletion after 2 or 4 hours) in fault trees, Gas turbine modelling (credited only after 10 minutes with operator error probability of 0.6 and after 1 hour with error probability of 7E-2),
Please indicate in the drop-own list whether credit was given to plant operation in-house load in the PSA model for the LOOP event: YesYesYes
2.4 Questions to France (1) and France (2) – French 900 MWe PWR, French 1300 MWe PWR Please specify the time durations that make the distinction between the short and the long loss of main grid initiating events as well as between the short and the long total loss of external power initiating events.
Please indicate in the drop-own list whether credit was given to plant operation in-house load in the
PSA model for the LOOP event: YesYesYes Different initiating event frequencies are given in Table 1 for at power and shutdown conditions.
What factors were considered in making this distinction?

NEA/CSNI/R(2017)5
277
2.5 Question to France (3) – 1630 MWe EPR Please indicate in the drop-own list whether credit was given to plant operation in-house load in the PSA model for the LOOP event: YesYesYes
2.6 Questions to Japan Level 1 PSA for internal events at power and in low power and shutdown conditions are given in the answers for the PSA scope with a note that “Level 1, 2, 3, shutdown PRA and external event PRA were conducted separately and integrated assessment has not been done”. Since the intent of the question on PSA scope was to understand what PSA studies are available for a given plant, please indicate in the shaded drop-down list below the types of PSA that has been performed for the typical PWR and BWR plants. (It is well understood that the subsequent responses focus on level 1 PSA only.)
Internal events Internal hazards External hazards
Reactor PSA for PWR plant
Level 1 YesYesYes YesYesYes YesYesYes Level 2 YesYesYes YesYesYes YesYesYes Level 3 YesYesYes YesYesYes YesYesYes
Internal events Internal hazards External hazards
Reactor PSA for BWR plant
Level 1 YesYesYes YesYesYes YesYesYes Level 2 YesYesYes YesYesYes YesYesYes Level 3 YesYesYes YesYesYes YesYesYes
It is indicated in the answers that recovery was “considered as a function of time based on operating
history of the grids”. What are the recovery time windows that were actually used in the PSA? What was the technical basis to define these time windows?
Has recovery been modelled explicitly? If yes, what was the quantification model derived from the
operating history to determine recovery probabilities? Please indicate in the drop-own list whether credit was given to plant operation in island mode in the
PSA model for the LOOP event: YesYesYes 2.7 Questions to Korea It is indicated in the answers that “recovery probabilities are modelled based on generic data base due to lack of domestic experiences”. Please specify the generic data source and the modelling approach used to estimate the probability of recovery.
It is given in the answers that “KAERI/KHNP maintains a database for plant transient IE frequencies
(including LOOP)”. Please indicate whether data for LOOP are plant specific, generic or a combination of these two sources in the database.
Please clarify whether the plant can operate in-house load mode (or island mode) or not: YesYesYes.
If yes, then please indicate in the drop-own list whether credit was given to this kind of plant operation in the PSA model for the LOOP event: YesYesYes
The following answer is given in relation to LOOP induced by external hazards: “One LOOP is
considered (each categories are included)”. Please clarify what is meant by the categories referred to in the
NEA/CSNI/R(2017)5
278
answer. Are there external events treated explicitly in PSA? If yes, what are these external events? Has a consequential LOOP been considered in the PSA model for these external events? 2.8 Questions to Mexico In relation to the treatment recoveries and time phases it is indicated in the answers that “accident sequences in the event trees inherently contain two periods of time”. Please give some typical examples in hours for short and long time durations. Also, please briefly describe the methods and data used to model and quantify recovery.
General features of the fault trees are discussed in the answers. In order to ensure consistency and
enable comparison with responses from other countries, please specify the failure modes modelled for diesel generators (and any other active power supply equipment, as applicable) and for bus bars. 2.9 Questions to Romania
Please indicate in the drop-own list whether plant operation in-house load was modelled in the PSA for the Loss of Class IV Power Supply event: YesYesYes
Mobile diesel generators introduced following the Fukushima Daiichi accident are referred to in the
description of alternate power supply sources. Please briefly describe to what extent and how these mobile diesel generators are modelled in PSA (including equipment and human failures). 2.10 Questions to Slovenia Please indicate in the drop-own list whether credit was given to plant operation in-house load in the PSA model for the LOOP event: YesYesYes
In the description of power supply architecture and back-up power supply sources it is given that the
Krško “plant has 110 kV transmission line to the combined gas-steam power plant at Brestanica that serves as the alternate preferred source”. Please indicate whether this alternate source is modelled in the LOOP event sequences or not. If yes, how is it taken into account? 2.11 Questions to Sweden (1) – OKG studies In the answers describing the initiating events defined and analysed in the OKG studies it is indicated that.” The initiating event LOOP is called TE in OKG:s studies. Also loss of individual grids in the plant is analysed, if they leads to reactor shutdown.” Further in the answers initiating event frequencies are given as follows: frequency of Loss of 130kV for O1, frequency of Loss of 400kV for O3. Please clarify what is the actual number of power failure events treated separately as initiating events in the OKG studies for the different units and what are the corresponding definitions of these initiating events.
It is indicated in the answers that “External hazards are included implicit”. To avoid double counting
what was the modelling method used in the PSA for those external hazards that cause not only LOOP but failures of other safety-related SSCs?
What are the types of external hazards considered in the external event PSA that can cause LOOP?
NEA/CSNI/R(2017)5
279
2.12 Questions to Sweden (2) – Forsmark NPP Concerning the modelling of recovery the following answer is given: “It is dependent on IE.” Please provide further details including the actual recovery times as well as the methods and data used to model and quantify recovery.
The following answer is given concerning the estimation of initiating frequencies “Different methods
have been used for different IEs.” Please briefly describe the methods and data used for the estimation. It is indicated in the answers that “There are several other external event IEs that cause LOOP.” What
are these external events? Concerning equipment failure modes the following is given in the answers: “In detail with full
functional dependencies (electrical, area and cooling)”. In order to ensure consistency and enable comparison with responses from other countries, please specify the failure modes modelled for diesel generators (and any other active power supply equipment, as applicable) and for bus bars.
In the description of power supply architecture and back-up power supply sources it is given that “A
gas turbine is connected to the 70 kV line”. Please indicate whether this alternate source is modelled in the detailed modelling of power supply failures referred to in the answers. If yes, how is it taken into account?
A “Yes” answer is given for mission time. Please indicate the actual values of mission time in hours
as used in the LOOP PSA model. 2.13 Questions to Switzerland Among others, permanent loss of the 220 kV grid and permanent loss of both the 220 kV and the 50 kV grids are considered as initiating events. Also, it is indicated in the answers that LOOPs caused by external events are always considered unrecovered. Are there other causes than external events that are considered in the analysis as causes that lead to a permanent LOOP event?
Please indicate in the drop-own list whether credit was given to plant operation in-house load in the
PSA model for the LOOP event: YesYesYes Reference is made to an experience-based runback failure probability in the answers. Please provide
this probability, if possible. In the general description of the plant several layers of protection as “safety layers” are listed. Please
briefly describe to what extent and how these safety layers are modelled in PSA. 2.14 Question to USA – CE PWR, large dry containment The LOOP frequency is as low as 2.49E-6/yr. What was the technical basis for estimating LOOP frequency?
2.15 Question to USA – GE BWR, Mark I Containment with external hazards An alternate AC (AAC) of back-up power supply source is described in the answers with a note that “This source is powered from a nearby substation and is dedicated to this plant through a series of manual breaker and switch manipulations performed at both sites”. Please briefly describe to what extent and how the use of this alternate source is modelled in the LOOP sequences.

NEA/CSNI/R(2017)5
280
FRANCE
Probabilistic Safety Assessment insights relating to the loss of electrical sources
Complementary questions 1 Questions to all countries 1.1 PSA information Please use the shaded drop-down lists in the following table to amend the information on spent fuel pool PSA. Internal events Internal hazards External hazards Spent fuel pool PSA
Level 1 YesYesYes NoNoNo NoNoNo Level 2 NoNoNo NoNoNo NoNoNo
1.2 Initiating event / Modelling and data The recovery of off-site power may require switch and breaker manipulations at the site depending on several factors, i.e. design features, on-site consequences of the initiating event, plant operating mode, as well as power supply configuration (e.g. bus bars out of service during maintenance) during the occurrence of LOOP.
Have you modelled recovery actions at the site explicitly in PSA? Not explicitly modelled If yes, what was the approach used to model and quantify the required actions?
1.3 Safety improvements/mobile equipment Several countries indicate the use of mobile/portable equipment (diesels, pumps). Have you modelled explicitly this equipment in PSA? What is the approach for modelling and quantification (do you consider a human action, a delay for this action)?
In case of SBO during shutdown state a water make up can be achieved by operators using a gravity make up and then a small moto-pump: these actions are modelled considering the delay available (1 hour for the gravity make up and in case of success 2 hours for the mobile pump connexion).
In the framework of the post-Fukushima future safety improvements (hardened safety core) mobile equipment is planned and will be modelled in the PSA.
1.4 Safety improvements/batteries Please indicate if some safety improvements were performed for the batteries (longer depletion time, additional charging possibilities) and how it is modelled and quantified in the PSA.
In case of SBO a minimum part of I&C, notably for the turbine-driven AFWS pump operation, can be supplied by the LLS system (additional small turbo generator) and/or by the economy of a battery. This operator action is modelled in the PSA with a global failure probability of 10-2 assessed by expert judgement.

NEA/CSNI/R(2017)5
281
1.5 PSA results For the plants described in your initial survey response, please provide:
1. Conditional core damage probability (CCDP) for loss of off-site power initiators.
2. The relative contribution of loss of off-site power initiating events to overall core damage frequency (i.e. per cent of cdf represented by loss of off-site power events).
900 MWe Initiating event Core Damage Frequency (1/y) % Overall CDF Loss of main grid (short) 6.9 10-8 1.4% Loss of main grid (long) 2.8 10-8 <1% Total loss of external power (short) 1.3 10-8 <1% Total loss of external power (long) 4.7 10-8 1% Loss of 6.6 Kv bus bars by DCC 2.2 10-6 45% General grid disturbance 7.6 10-8 1.6% Total 2.4 10-6 49% 1300 MWe Initiating event Core Damage Frequency (1/y) % Overall CDF Loss of main grid (short) 2.2 10-9 <1% Loss of main grid (long) 4.5 10-7 12% Total loss of external power (short) 2.4 10-8 <1% Total loss of external power (long) 5.7 10-7 14% Loss of 6.6 Kv bus bars by DCC 1.4 10-7 3.5% Loss of one bus bar 1.8 10-7 4.5% General grid disturbance 1.7 10-7 4.2% Total 1.8 10-6 45% Note: these values correspond to the last versions of the PSAs, but the studies are not updated at the same date and the 900 MWe study is older (explaining some differences). EPR Initiating event Core Damage Frequency (1/y) % Overall CDF Short LOOP (2h) 3.4 10-8 7% Long LOOP (24h) 9.5 10-8 20% Loss of main grid 1.1 10-8 2.3% Total 1.4 10-7 29.3%
3. PSA importance measures (risk achievement worth (RAW) and Fussel-Vessely (FV)) for significant components/operator actions related to losses of off-site power. This would include the importance of alternate AC power supplies (e.g. EDG's), non-AC dependent decay heat removal equipment (e.g. steam driven makeup pumps or auxiliary feed water), human actions or other factors deemed to be significant.
Not available explicitly. The dominant sequences are described in the answers to the first questionnaire.

NEA/CSNI/R(2017)5
282
1.5 PSA modelling/ shared equipment In case of use of shared equipment with other units, is the multi-units aspect modelled in the PSA? For example is there explicitly an unavailability of shared systems for a unit if used by another unit? Did you perform sensitivity studies as regards to benefits and drawbacks of interconnections between units?
Yes some shared systems and back-up by the twin unit are considered in the PSA. The unavailability of these measures takes implicitly into account the multi-unit problem in a simplified way.
2 Country-specific questions 2.1 Questions to Czech Republic (2) – Temelin NPP The answers witness that the recovery failures are modelled as basic events in the LOOP event trees. Please briefly describe the method and data used to model and quantify recovery.
It is given in the answers that “LOOP in 24 hours following IE 2.740e-004/year”. Is it really a
frequency type event, not a conditional probability? If it is frequency, then what is the meaning of 24 hours?
It is given in the answers that “Probability of house load 2.5E-001/year”. Is it really a frequency type
event, not a conditional probability of house load given LOOP? If it is a frequency type event, has it then been accounted for in the PSA? 2.2 Questions to Finland – Loviisa NPP, Units 1 and 2 Please indicate in the drop-own list whether credit was given to plant operation in-house load in the PSA model for the LOOP event: YesYesYes
Please indicate whether generic or plant / site-specific data, or both types of data were used to
estimate LOOP frequencies. What was the data analysis methodology used? Concerning equipment failure modes the following is given in the answers: “Separate detailed fault
tree analysis, whose results are included in figures of tables for LO”. In order to ensure consistency and enable comparison with responses from other countries, please specify the failure modes modelled for diesel generators (and any other active power supply equipment, as applicable) and for bus bars. 2.3 Questions to Finland – Olkiluoto NPP Units 1 and 2 In the answers related to initiating event categories 5 ranges of LOOP duration are given ranging from 0-10 min to over 8 h. Please describe the technical basis (reason) of this categorisation.
Please indicate in the drop-own list whether credit was given to plant operation in-house load in the
PSA model for the LOOP event: YesYesYes 2.4 Questions to France (1) and France (2) – French 900 MWe PWR, French 1300 MWe PWR Please specify the time durations that make the distinction between the short and the long loss of main grid initiating events as well as between the short and the long total loss of external power initiating events.
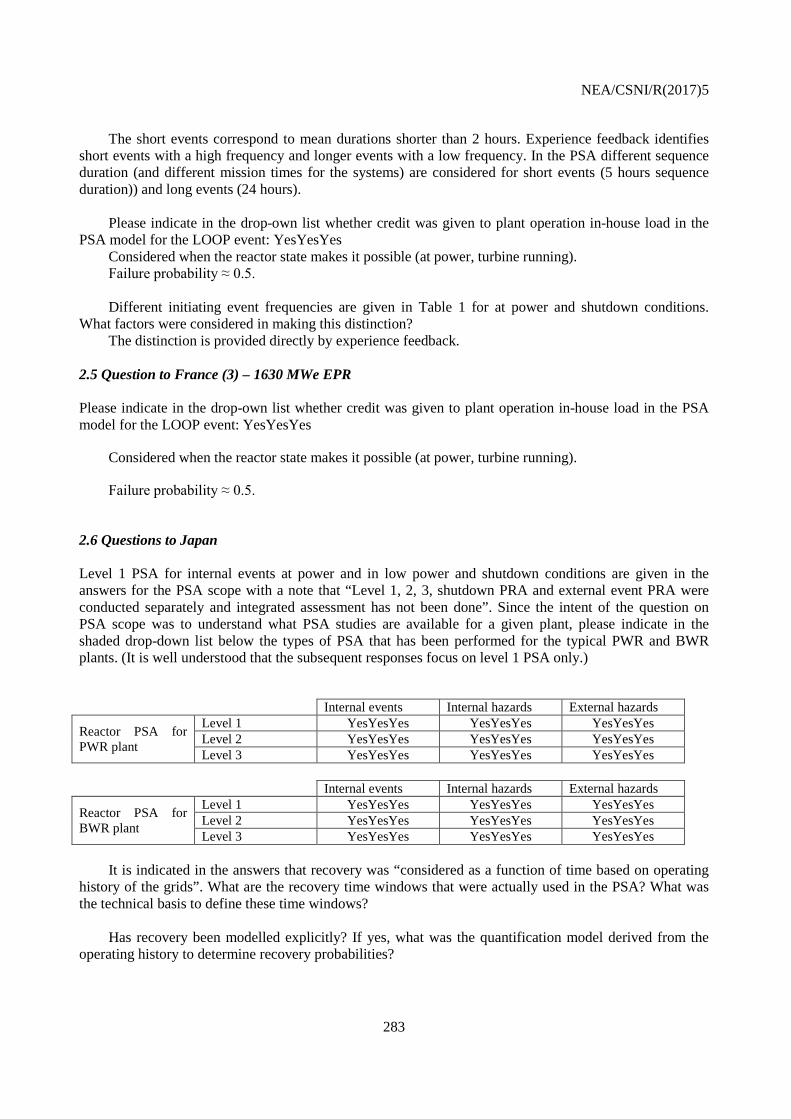
NEA/CSNI/R(2017)5
283
The short events correspond to mean durations shorter than 2 hours. Experience feedback identifies short events with a high frequency and longer events with a low frequency. In the PSA different sequence duration (and different mission times for the systems) are considered for short events (5 hours sequence duration)) and long events (24 hours).
Please indicate in the drop-own list whether credit was given to plant operation in-house load in the
PSA model for the LOOP event: YesYesYes Considered when the reactor state makes it possible (at power, turbine running). Failure probability ≈ 0.5.
Different initiating event frequencies are given in Table 1 for at power and shutdown conditions.
What factors were considered in making this distinction? The distinction is provided directly by experience feedback.
2.5 Question to France (3) – 1630 MWe EPR Please indicate in the drop-own list whether credit was given to plant operation in-house load in the PSA model for the LOOP event: YesYesYes
Considered when the reactor state makes it possible (at power, turbine running).
Failure probability ≈ 0.5.
2.6 Questions to Japan Level 1 PSA for internal events at power and in low power and shutdown conditions are given in the answers for the PSA scope with a note that “Level 1, 2, 3, shutdown PRA and external event PRA were conducted separately and integrated assessment has not been done”. Since the intent of the question on PSA scope was to understand what PSA studies are available for a given plant, please indicate in the shaded drop-down list below the types of PSA that has been performed for the typical PWR and BWR plants. (It is well understood that the subsequent responses focus on level 1 PSA only.)
Internal events Internal hazards External hazards
Reactor PSA for PWR plant
Level 1 YesYesYes YesYesYes YesYesYes Level 2 YesYesYes YesYesYes YesYesYes Level 3 YesYesYes YesYesYes YesYesYes
Internal events Internal hazards External hazards
Reactor PSA for BWR plant
Level 1 YesYesYes YesYesYes YesYesYes Level 2 YesYesYes YesYesYes YesYesYes Level 3 YesYesYes YesYesYes YesYesYes
It is indicated in the answers that recovery was “considered as a function of time based on operating
history of the grids”. What are the recovery time windows that were actually used in the PSA? What was the technical basis to define these time windows?
Has recovery been modelled explicitly? If yes, what was the quantification model derived from the
operating history to determine recovery probabilities?

NEA/CSNI/R(2017)5
284
Please indicate in the drop-own list whether credit was given to plant operation in island mode in the PSA model for the LOOP event: YesYesYes 2.7 Questions to Korea It is indicated in the answers that “recovery probabilities are modelled based on generic data base due to lack of domestic experiences”. Please specify the generic data source and the modelling approach used to estimate the probability of recovery.
It is given in the answers that “KAERI/KHNP maintains a database for plant transient IE frequencies
(including LOOP)”. Please indicate whether data for LOOP are plant specific, generic or a combination of these two sources in the database.
Please clarify whether the plant can operate in-house load mode (or island mode) or not: YesYesYes.
If yes, then please indicate in the drop-own list whether credit was given to this kind of plant operation in the PSA model for the LOOP event: YesYesYes
The following answer is given in relation to LOOP induced by external hazards: “One LOOP is
considered (each categories are included)”. Please clarify what is meant by the categories referred to in the answer. Are there external events treated explicitly in PSA? If yes, what are these external events? Has a consequential LOOP been considered in the PSA model for these external events? 2.8 Questions to Mexico In relation to the treatment recoveries and time phases it is indicated in the answers that “accident sequences in the event trees inherently contain two periods of time”. Please give some typical examples in hours for short and long time durations. Also, please briefly describe the methods and data used to model and quantify recovery.
General features of the fault trees are discussed in the answers. In order to ensure consistency and
enable comparison with responses from other countries, please specify the failure modes modelled for diesel generators (and any other active power supply equipment, as applicable) and for bus bars. 2.9 Questions to Romania Please indicate in the drop-own list whether plant operation in-house load was modelled in the PSA for the Loss of Class IV Power Supply event: YesYesYes
Mobile diesel generators introduced following the Fukushima Daiichi accident are referred to in the
description of alternate power supply sources. Please briefly describe to what extent and how these mobile diesel generators are modelled in PSA (including equipment and human failures). 2.10 Questions to Slovenia
Please indicate in the drop-own list whether credit was given to plant operation in-house load in the PSA model for the LOOP event: YesYesYes
In the description of power supply architecture and back-up power supply sources it is given that the
Krško “plant has 110 kV transmission line to the combined gas-steam power plant at Brestanica that serves as the alternate preferred source”. Please indicate whether this alternate source is modelled in the LOOP event sequences or not. If yes, how is it taken into account?

NEA/CSNI/R(2017)5
285

NEA/CSNI/R(2017)5
286
2.11 Questions to Sweden (1) – OKG studies In the answers describing the initiating events defined and analysed in the OKG studies it is indicated that”. The initiating event LOOP is called TE in OKG’s studies. Also loss of individual grids in the plant is analysed, if they leads to reactor shutdown.” Further in the answers initiating event frequencies are given as follows: frequency of Loss of 130kV for O1, frequency of Loss of 400kV for O3. Please clarify what is the actual number of power failure events treated separately as initiating events in the OKG studies for the different units and what are the corresponding definitions of these initiating events.
It is indicated in the answers that “External hazards are included implicit”. To avoid double counting
what was the modelling method used in the PSA for those external hazards that cause not only LOOP but failures of other safety-related SSCs?
What are the types of external hazards considered in the external event PSA that can cause LOOP?
2.12 Questions to Sweden (2) – Forsmark NPP Concerning the modelling of recovery the following answer is given: “It is dependent on IE.” Please provide further details including the actual recovery times as well as the methods and data used to model and quantify recovery.
The following answer is given concerning the estimation of initiating frequencies “Different methods
have been used for different IEs.” Please briefly describe the methods and data used for the estimation. It is indicated in the answers that “There are several other external event IEs that cause LOOP”. What
are these external events? Concerning equipment failure modes the following is given in the answers: “In detail with full
functional dependencies (electrical, area and cooling)”. In order to ensure consistency and enable comparison with responses from other countries, please specify the failure modes modelled for diesel generators (and any other active power supply equipment, as applicable) and for bus bars.
In the description of power supply architecture and back-up power supply sources it is given that “A
gas turbine is connected to the 70 kV line”. Please indicate whether this alternate source is modelled in the detailed modelling of power supply failures referred to in the answers. If yes, how is it taken into account?
A “Yes” answer is given for mission time. Please indicate the actual values of mission time in hours
as used in the LOOP PSA model. 2.13 Questions to Switzerland Among others, permanent loss of the 220 kV grid and permanent loss of both the 220 kV and the 50 kV grids are considered as initiating events. Also, it is indicated in the answers that LOOPs caused by external events are always considered unrecovered. Are there other causes than external events that are considered in the analysis as causes that lead to a permanent LOOP event?
Please indicate in the drop-own list whether credit was given to plant operation in-house load in the
PSA model for the LOOP event: YesYesYes

NEA/CSNI/R(2017)5
287
Reference is made to an experience-based runback failure probability in the answers. Please provide this probability, if possible.
In the general description of the plant several layers of protection as “safety layers” are listed. Please briefly describe to what extent and how these safety layers are modelled in PSA.
2.14 Question to USA – CE PWR, large dry containment The LOOP frequency is as low as 2.49E-6/yr. What was the technical basis for estimating LOOP frequency?
2.15 Question to USA – GE BWR, Mark I Containment with external hazards An alternate AC (AAC) of back-up power supply source is described in the answers with a note that “This source is powered from a nearby substation and is dedicated to this plant through a series of manual breaker and switch manipulations performed at both sites”. Please briefly describe to what extent and how the use of this alternate source is modelled in the LOOP sequences.

NEA/CSNI/R(2017)5
288
HUNGARY
Probabilistic Safety Assessment insights relating to the loss of electrical sources
Complementary questions 1. Questions to all countries 1.1 PSA information Please use the shaded drop-down lists in the following table to amend the information on spent fuel pool PSA. Internal events Internal hazards External hazards Spent fuel pool PSA
Level 1 YesYesYes YesYesYes YesYesYes Level 2 YesYesYes YesYesYes NoNoNo
1.2 Initiating event / Modelling and data The recovery of off-site power may require switch and breaker manipulations at the site depending on several factors, i.e. design features, on-site consequences of the initiating event, plant operating mode, as well as power supply configuration (e.g. bus bars out of service during maintenance) during the occurrence of LOOP.
Have you modelled recovery actions at the site explicitly in PSA? Two types of actions have been taken into account in recovery from a LOOP event (which is the
K1_K event): 1) recovery of the 400 kV grid and 2) on-site recovery actions (following grid recovery) needed to ensure power supply to the 6 kV bus bars. These actions have been modelled as two separate basic events. Failure of grid recovery has been quantified using a time reliability curve based on data in NUREG/CR-6890, while failure of on-site manipulations has been assessed by the use of a holistic decision tree. No detailed task analysis or HRA has been performed for the on-site manipulations.
For the loss of normal power supply to the 6 kV safety bus bars due to on-site causes (which is the K1_B event) successful recovery means establishing cross connection with the twin unit. The actual manual interventions needed to ensure cross connection are dependent on the failure causes (initiators) to the K1_B event. These manipulations have not been modelled explicitly in the PSA but the following major performance influences have been considered at a more general level to assess the probability of successful recovery: crew experience, time available and complexity of manual operations.
If yes, what was the approach used to model and quantify the required actions? See the answer to the previous question.
1.3 Safety improvements/mobile equipment Several countries indicate the use of mobile/portable equipment (diesels, pumps). Have you modelled explicitly this equipment in PSA? What is the approach for modelling and quantification (do you consider a human action, a delay for this action)?
Use of mobile equipment has not been considered in the level 1 PSA for the Paks NPP. Use of the on-site mobile severe accident diesel generators SAM diesels) dedicated to ensure power supply to selected equipment for severe accident management (has been considered in level 2 PSA. No credit was given to the use of SAM diesels following a very strong earthquake (over 0.3 g PGA) due to blockage of transport

NEA/CSNI/R(2017)5
289
routes on-site. For internal events the failure to use the SAM diesels was implicitly included in the decision errors of the control room crew and the technical support centre. No detailed HRA was performed for the specific actions needed to put the SAM diesels into operation.
1.4 Safety improvements/batteries Please indicate if some safety improvements were performed for the batteries (longer depletion time, additional charging possibilities) and how it is modelled and quantified in the PSA.
Such improvements have not been implemented. 1.5 PSA results
For the plants described in your initial survey response, please provide: 1. Conditional core damage probability (CCDP) for loss of off-site power initiators. CCDP for LOOP (K1_K event) in the full power PSA is 8.05E-05. CCDP for LOOP (K1_K event) in the low power and shutdown PSA varies between 1.0E-05 and 6.9E-04 depending on the plant operational state. (There are 24 low power and shutdown states considered in the Paks PSA.) 2. The relative contribution of loss of off-site power initiating events to overall core damage frequency (i.e. per cent of cdf represented by loss of off-site power events). The relative contribution of LOOP (K1_K event) to CDF from internal events in the full power PSA is 13.94% The relative contribution of LOOP (K1_K event) to CDF from internal events in the low power and
shutdown PSA varies from practically negligible to 17.82% depending on the plant operational state. The relative contribution of LOOP (K1_K event) to CDF from internal events considering both full
power and low power and shutdown states is 11.78%. 3. PSA importance measures (risk achievement worth (RAW) and Fussel-Vessely (FV)) for significant components/operator actions related to losses of off-site power. This would include the importance of alternate AC power supplies (e.g. EDG's), non-AC dependent decay heat removal equipment (e.g. steam driven makeup pumps or auxiliary feed water), human actions or other factors deemed to be significant. Importance measures for significant LOOP related basic events in the full power PSA for internal
events are as follows:
Name Description FV RAW
RECK1-UTVONAL2-EO Operator fails to ensure power supply to 6kV bus bars in 2 hours 9.67E-01 9.70E+00
20QD0$-FS--ALL CCF of emergency diesel generators to start 4.04E-01 1.80E+02 20QD0$-FR-ALL CCF of emergency diesel generators to run 2.50E-01 1.80E+02 RECOVERYK1-EO6.4 Failure to recover grid in 6.4 hours 2.17E-01 3.80E+00 RECOVERYK1-EO+4 Failure to recover grid in 10.4 hours 2.17E-01 1.35E+00 20QD02-FR Diesel generator 20QD02 fails to run 1.91E-01 3.61E+00 20QD03-FR Diesel generator 20QD03 fails to run 1.89E-01 3.59E+00 20QD01-FR Diesel generator 20QD01 fails to run 1.86E-01 3.55E+00 20QD02-FS Diesel generator 20QD02 fails to start 1.51E-01 3.64E+00 20QD03-FS Diesel generator 20QD03 fails to start 1.49E-01 3.62E+00 20QD01-FS Diesel generators 20QD01 fails to start 1.47E-01 3.58E+00 2_BL_SZIGET Island mode unsuccessful in Unit 2 1.58E-02 1.06E+00 1_BL_SZIGET Island mode unsuccessful in Unit 1 1.31E-02 1.05E+00

NEA/CSNI/R(2017)5
290
4_BL_SZIGET Island mode unsuccessful in Unit 4 1.30E-02 1.05E+00 3_BL_SZIGET Island mode unsuccessful in Unit 3 1.30E-02 1.05E+00 1_BLOKK_KARBAN Twin unit is on maintenance 4.77E-03 1.04E+00
FR-H.1_BELEPES Operator fails enter EOP FR-H.1 when monitoring critical safety functions 4.10E-03 1.40E+00
00EQ10-2BK-N Failure of electric breaker 0ESA63 3.93E-03 6.99E+01 1.6 PSA modelling/ shared equipment In case of use of shared equipment with other units, is the multi-units aspect modelled in the PSA? For example is there explicitly an unavailability of shared systems for a unit if used by another unit? Did you perform sensitivity studies as regards to benefits and drawbacks of interconnections between units?
Separate unit-specific PSA models have been developed in the PSA for the Paks NPP. It is assumed in each unit specific analysis that the other three units are either in operation or shut down for refuelling and maintenance when an initiating event occurs at the given unit. Unavailability of shared equipment with other units is considered depending on the operating state of the other units:
• random failures are taken into account if the other units (and the given equipment) are not under maintenance,
• planned unavailability of the equipment is taken into account if the other units are under maintenance (online maintenance is not allowed at NPP Paks).
Generally, the unit specific analyses do not cover considerations to unavailability of shared equipment
because the equipment is used by another unit. A pilot study on multi-unit PSA has recently been initiated to eliminate this shortcoming.
2 Country-specific questions 2.1 Questions to Czech Republic (2) – Temelin NPP The answers witness that the recovery failures are modelled as basic events in the LOOP event trees. Please briefly describe the method and data used to model and quantify recovery.
It is given in the answers that “LOOP in 24 hours following IE 2.740e-004/year”. Is it really a
frequency type event, not a conditional probability? If it is frequency, then what is the meaning of 24 hours?
It is given in the answers that “Probability of house load 2.5E-001/year”. Is it really a frequency type
event, not a conditional probability of house load given LOOP? If it is a frequency type event, has it then been accounted for in the PSA? 2.2 Questions to Finland – Loviisa NPP, Units 1 and 2 Please indicate in the drop-own list whether credit was given to plant operation in-house load in the PSA model for the LOOP event: YesYesYes
Please indicate whether generic or plant / site-specific data, or both types of data were used to
estimate LOOP frequencies. What was the data analysis methodology used? Concerning equipment failure modes the following is given in the answers: “Separate detailed fault
tree analysis, whose results are included in figures of tables for LO”. In order to ensure consistency and

NEA/CSNI/R(2017)5
291
enable comparison with responses from other countries, please specify the failure modes modelled for diesel generators (and any other active power supply equipment, as applicable) and for bus bars. 2.3 Questions to Finland – Olkiluoto NPP Units 1 and 2 In the answers related to initiating event categories 5 ranges of LOOP duration are given ranging from 0-10 min to over 8 h. Please describe the technical basis (reason) of this categorisation.
Please indicate in the drop-own list whether credit was given to plant operation in-house load in the
PSA model for the LOOP event: YesYesYes 2.4 Questions to France (1) and France (2) – French 900 MWe PWR, French 1300 MWe PWR Please specify the time durations that make the distinction between the short and the long loss of main grid initiating events as well as between the short and the long total loss of external power initiating events.
Please indicate in the drop-own list whether credit was given to plant operation in-house load in the
PSA model for the LOOP event: YesYesYes Different initiating event frequencies are given in Table 1 for at power and shutdown conditions.
What factors were considered in making this distinction? 2.5 Question to France (3) – 1630 MWe EPR Please indicate in the drop-own list whether credit was given to plant operation in-house load in the PSA model for the LOOP event: YesYesYes
2.6 Questions to Japan Level 1 PSA for internal events at power and in low power and shutdown conditions are given in the answers for the PSA scope with a note that “Level 1, 2, 3, shutdown PRA and external event PRA were conducted separately and integrated assessment has not been done”. Since the intent of the question on PSA scope was to understand what PSA studies are available for a given plant, please indicate in the shaded drop-down list below the types of PSA that has been performed for the typical PWR and BWR plants. (It is well understood that the subsequent responses focus on level 1 PSA only.)
Internal events Internal hazards External hazards
Reactor PSA for PWR plant
Level 1 YesYesYes YesYesYes YesYesYes Level 2 YesYesYes YesYesYes YesYesYes Level 3 YesYesYes YesYesYes YesYesYes
Internal events Internal hazards External hazards
Reactor PSA for BWR plant
Level 1 YesYesYes YesYesYes YesYesYes Level 2 YesYesYes YesYesYes YesYesYes Level 3 YesYesYes YesYesYes YesYesYes
It is indicated in the answers that recovery was “considered as a function of time based on operating
history of the grids”. What are the recovery time windows that were actually used in the PSA? What was the technical basis to define these time windows?
Has recovery been modelled explicitly? If yes, what was the quantification model derived from the operating history to determine recovery probabilities?

NEA/CSNI/R(2017)5
292
Please indicate in the drop-own list whether credit was given to plant operation in island mode in the
PSA model for the LOOP event: YesYesYes
2.7 Questions to Korea It is indicated in the answers that “recovery probabilities are modelled based on generic data base due to lack of domestic experiences”. Please specify the generic data source and the modelling approach used to estimate the probability of recovery.
It is given in the answers that “KAERI/KHNP maintains a database for plant transient IE frequencies
(including LOOP)”. Please indicate whether data for LOOP are plant specific, generic or a combination of these two sources in the database.
Please clarify whether the plant can operate in-house load mode (or island mode) or not: YesYesYes.
If yes, then please indicate in the drop-own list whether credit was given to this kind of plant operation in the PSA model for the LOOP event: YesYesYes
The following answer is given in relation to LOOP induced by external hazards: “One LOOP is
considered (each categories are included)”. Please clarify what is meant by the categories referred to in the answer. Are there external events treated explicitly in PSA? If yes, what are these external events? Has a consequential LOOP been considered in the PSA model for these external events? 2.8 Questions to Mexico In relation to the treatment recoveries and time phases it is indicated in the answers that “accident sequences in the event trees inherently contain two periods of time”. Please give some typical examples in hours for short and long time durations. Also, please briefly describe the methods and data used to model and quantify recovery.
General features of the fault trees are discussed in the answers. In order to ensure consistency and
enable comparison with responses from other countries, please specify the failure modes modelled for diesel generators (and any other active power supply equipment, as applicable) and for bus bars. 2.9 Questions to Romania Please indicate in the drop-own list whether plant operation in-house load was modelled in the PSA for the Loss of Class IV Power Supply event: YesYesYes
Mobile diesel generators introduced following the Fukushima Daiichi accident are referred to in the
description of alternate power supply sources. Please briefly describe to what extent and how these mobile diesel generators are modelled in PSA (including equipment and human failures). 2.10 Questions to Slovenia Please indicate in the drop-own list whether credit was given to plant operation in-house load in the PSA model for the LOOP event: YesYesYes
In the description of power supply architecture and back-up power supply sources it is given that the Krško “plant has 110 kV transmission line to the combined gas-steam power plant at Brestanica that serves
NEA/CSNI/R(2017)5
293
as the alternate preferred source”. Please indicate whether this alternate source is modelled in the LOOP event sequences or not. If yes, how is it taken into account?
2.11 Questions to Sweden (1) – OKG studies In the answers describing the initiating events defined and analysed in the OKG studies it is indicated that ”The initiating event LOOP is called TE in OKG:s studies. Also loss of individual grids in the plant is analysed, if they leads to reactor shutdown.” Further in the answers initiating event frequencies are given as follows: frequency of Loss of 130kV for O1, frequency of Loss of 400kV for O3. Please clarify what is the actual number of power failure events treated separately as initiating events in the OKG studies for the different units and what are the corresponding definitions of these initiating events.
It is indicated in the answers that “External hazards are included implicit”. To avoid double counting
what was the modelling method used in the PSA for those external hazards that cause not only LOOP but failures of other safety-related SSCs?
What are the types of external hazards considered in the external event PSA that can cause LOOP?
2.12 Questions to Sweden (2) – Forsmark NPP Concerning the modelling of recovery the following answer is given: “It is dependent on IE.” Please provide further details including the actual recovery times as well as the methods and data used to model and quantify recovery.
The following answer is given concerning the estimation of initiating frequencies “Different methods
have been used for different IEs.” Please briefly describe the methods and data used for the estimation. It is indicated in the answers that “There are several other external event IEs that cause LOOP”. What
are these external events? Concerning equipment failure modes the following is given in the answers: “In detail with full
functional dependencies (electrical, area and cooling)”. In order to ensure consistency and enable comparison with responses from other countries, please specify the failure modes modelled for diesel generators (and any other active power supply equipment, as applicable) and for bus bars.
In the description of power supply architecture and back-up power supply sources it is given that “A
gas turbine is connected to the 70 kV line”. Please indicate whether this alternate source is modelled in the detailed modelling of power supply failures referred to in the answers. If yes, how is it taken into account?
A “Yes” answer is given for mission time. Please indicate the actual values of mission time in hours
as used in the LOOP PSA model. 2.13 Questions to Switzerland Among others, permanent loss of the 220 kV grid and permanent loss of both the 220 kV and the 50 kV grids are considered as initiating events. Also, it is indicated in the answers that LOOPs caused by external events are always considered unrecovered. Are there other causes than external events that are considered in the analysis as causes that lead to a permanent LOOP event?
Please indicate in the drop-own list whether credit was given to plant operation in-house load in the
PSA model for the LOOP event: YesYesYes

NEA/CSNI/R(2017)5
294
Reference is made to an experience-based runback failure probability in the answers. Please provide this probability, if possible.
In the general description of the plant several layers of protection as “safety layers” are listed. Please briefly describe to what extent and how these safety layers are modelled in PSA.
2.14 Question to USA – CE PWR, large dry containment The LOOP frequency is as low as 2.49E-6/yr. What was the technical basis for estimating LOOP frequency?
2.15 Question to USA – GE BWR, Mark I Containment with external hazards An alternate AC (AAC) of back-up power supply source is described in the answers with a note that “This source is powered from a nearby substation and is dedicated to this plant through a series of manual breaker and switch manipulations performed at both sites”. Please briefly describe to what extent and how the use of this alternate source is modelled in the LOOP sequences.

NEA/CSNI/R(2017)5
295
JAPAN
Probabilistic Safety Assessment insights relating to the loss of electrical sources
Complementary questions 1 Questions to all countries 1.1 PSA information Please use the shaded drop-down lists in the following table to amend the information on spent fuel pool PSA. Internal events Internal hazards External hazards Spent fuel pool PSA
Level 1 YesYesYes NoNoNo YesYesYes Level 2 NoNoNo NoNoNo NoNoNo
1.2 Initiating event / Modelling and data The recovery of off-site power may require switch and breaker manipulations at the site depending on several factors, i.e. design features, on-site consequences of the initiating event, plant operating mode, as well as power supply configuration (e.g. bus bars out of service during maintenance) during the occurrence of LOOP.
Have you modelled recovery actions at the site explicitly in PSA? No. If yes, what was the approach used to model and quantify the required actions? N/A
1.3 Safety improvements/mobile equipment Several countries indicate the use of mobile/portable equipment (diesels, pumps). Have you modelled explicitly this equipment in PSA? What is the approach for modelling and quantification (do you consider a human action, a delay for this action)?
No. But now making models of them considering human actions.
1.4 Safety improvements/batteries Please indicate if some safety improvements were performed for the batteries (longer depletion time, additional charging possibilities) and how it is modelled and quantified in the PSA. No.
1.5 PSA results For the plants described in your initial survey response, please provide:
1. Conditional core damage probability (CCDP) for loss of off-site power initiators.
Power operation Shutdown condition Four-loop PWR 9.2x10⁻⁷ 1.5x10⁻⁶ BWR-5 3.1x10⁻⁶ 8.3x10⁻⁶

NEA/CSNI/R(2017)5
296
2. The relative contribution of loss of off-site power initiating events to overall core damage frequency (i.e. per cent of cdf represented by loss of off-site power events).
LOOP contribution to the total CDF of power operation (Note)
LOOP contribution to the total CDF of shutdown condition (Note)
Four-loop PWR 4% 1% BWR-5 16% 9%
Note: LOOP contribution to each CDF at-power operation and at shutdown condition. 3. PSA importance measures (risk achievement worth (RAW) and Fussel-Vessely (FV)) for
significant components/operator actions related to losses of off-site power. This would include the importance of alternate AC power supplies (e.g. EDG's), non-AC dependent decay heat removal equipment (e.g. steam driven makeup pumps or auxiliary feed water), human actions or other factors deemed to be significant.
Not reported 1.5 PSA modelling/ shared equipment In case of use of shared equipment with other units, is the multi-units aspect modelled in the PSA? For example is there explicitly an unavailability of shared systems for a unit if used by another unit? Did you perform sensitivity studies as regards to benefits and drawbacks of interconnections between units?
There is no shared equipment with other units.
2 Country-specific questions 2.1 Questions to Czech Republic (2) – Temelin NPP The answers witness that the recovery failures are modelled as basic events in the LOOP event trees. Please briefly describe the method and data used to model and quantify recovery.
It is given in the answers that “LOOP in 24 hours following IE 2.740e-004/year”. Is it really a
frequency type event, not a conditional probability? If it is frequency, then what is the meaning of 24 hours?
It is given in the answers that “Probability of house load 2.5E-001/year”. Is it really a frequency type
event, not a conditional probability of house load given LOOP? If it is a frequency type event, has it then been accounted for in the PSA? 2.2 Questions to Finland – Loviisa NPP, Units 1 and 2 Please indicate in the drop-own list whether credit was given to plant operation in-house load in the PSA model for the LOOP event: YesYesYes
Please indicate whether generic or plant / site-specific data, or both types of data were used to
estimate LOOP frequencies. What was the data analysis methodology used? Concerning equipment failure modes the following is given in the answers: “Separate detailed fault
tree analysis, whose results are included in figures of tables for LO”. In order to ensure consistency and

NEA/CSNI/R(2017)5
297
enable comparison with responses from other countries, please specify the failure modes modelled for diesel generators (and any other active power supply equipment, as applicable) and for bus bars. 2.3 Questions to Finland – Olkiluoto NPP Units 1 and 2 In the answers related to initiating event categories 5 ranges of LOOP duration are given ranging from 0-10 min to over 8 h. Please describe the technical basis (reason) of this categorisation.
Please indicate in the drop-own list whether credit was given to plant operation in-house load in the
PSA model for the LOOP event: YesYesYes 2.4 Questions to France (1) and France (2) – French 900 MWe PWR, French 1300 MWe PWR Please specify the time durations that make the distinction between the short and the long loss of main grid initiating events as well as between the short and the long total loss of external power initiating events.
Please indicate in the drop-own list whether credit was given to plant operation in-house load in the
PSA model for the LOOP event: YesYesYes Different initiating event frequencies are given in Table 1 for at power and shutdown conditions.
What factors were considered in making this distinction? 2.5 Question to France (3) – 1630 MWe EPR Please indicate in the drop-own list whether credit was given to plant operation in-house load in the PSA model for the LOOP event: YesYesYes
2.6 Questions to Japan Level 1 PSA for internal events at power and in low power and shutdown conditions are given in the answers for the PSA scope with a note that “Level 1, 2, 3, shutdown PRA and external event PRA were conducted separately and integrated assessment has not been done”. Since the intent of the question on PSA scope was to understand what PSA studies are available for a given plant, please indicate in the shaded drop-down list below the types of PSA that has been performed for the typical PWR and BWR plants. (It is well understood that the subsequent responses focus on level 1 PSA only.)
Internal events Internal hazards External hazards
Reactor PSA for PWR plant
Level 1 YesYesYes NoNoNo YesYesYes Level 2 YesYesYes NoNoNo YesYesYes Level 3 YesYesYes NoNoNo YesYesYes
Internal events Internal hazards External hazards
Reactor PSA for BWR plant
Level 1 YesYesYes NoNoNo YesYesYes Level 2 YesYesYes NoNoNo YesYesYes Level 3 YesYesYes NoNoNo YesYesYes
It is indicated in the answers that recovery was “considered as a function of time based on operating
history of the grids”. What are the recovery time windows that were actually used in the PSA? What was the technical basis to define these time windows?
0 to 24 hrs corresponding to the mission time.

NEA/CSNI/R(2017)5
298
Has recovery been modelled explicitly? If yes, what was the quantification model derived from the operating history to determine recovery probabilities?
AC power recoveries are modelled in various ways, i.e. explicitly as headings of event trees or
implicitly as waiting factors in the integration. The failure probabilities itself are obtained in the following steps;
1) To define, for example, allowed time to recover mitigation systems required in the specified accident sequences.
2) To obtain failure probability of AC power recovery using the figure attached and the allowed time defined.
3) To quantify the frequencies of relevant accident sequences using the failure probabilities obtained. Please indicate in the drop-own list whether credit was given to plant operation in island mode in the
PSA model for the LOOP event: NoNoNo 2.7 Questions to Korea It is indicated in the answers that “recovery probabilities are modelled based on generic data base due to lack of domestic experiences”. Please specify the generic data source and the modelling approach used to estimate the probability of recovery.
It is given in the answers that “KAERI/KHNP maintains a database for plant transient IE frequencies
(including LOOP)”. Please indicate whether data for LOOP are plant specific, generic or a combination of these two sources in the database.
Please clarify whether the plant can operate in-house load mode (or island mode) or not: YesYesYes.
If yes, then please indicate in the drop-own list whether credit was given to this kind of plant operation in the PSA model for the LOOP event: YesYesYes
The following answer is given in relation to LOOP induced by external hazards: “One LOOP is
considered (each categories are included)”. Please clarify what is meant by the categories referred to in the answer. Are there external events treated explicitly in PSA? If yes, what are these external events? Has a consequential LOOP been considered in the PSA model for these external events? 2.8 Questions to Mexico In relation to the treatment recoveries and time phases it is indicated in the answers that “accident sequences in the event trees inherently contain two periods of time”. Please give some typical examples in hours for short and long time durations. Also, please briefly describe the methods and data used to model and quantify recovery.
General features of the fault trees are discussed in the answers. In order to ensure consistency and
enable comparison with responses from other countries, please specify the failure modes modelled for diesel generators (and any other active power supply equipment, as applicable) and for bus bars. 2.9 Questions to Romania Please indicate in the drop-own list whether plant operation in-house load was modelled in the PSA for the Loss of Class IV Power Supply event: YesYesYes

NEA/CSNI/R(2017)5
299
Mobile diesel generators introduced following the Fukushima Daiichi accident are referred to in the description of alternate power supply sources. Please briefly describe to what extent and how these mobile diesel generators are modelled in PSA (including equipment and human failures).
2.10 Questions to Slovenia Please indicate in the drop-own list whether credit was given to plant operation in-house load in the PSA model for the LOOP event: YesYesYes
In the description of power supply architecture and back-up power supply sources it is given that the
Krško “plant has 110 kV transmission line to the combined gas-steam power plant at Brestanica that serves as the alternate preferred source”. Please indicate whether this alternate source is modelled in the LOOP event sequences or not. If yes, how is it taken into account? 2.11 Questions to Sweden (1) – OKG studies In the answers describing the initiating events defined and analysed in the OKG studies it is indicated that”. The initiating event LOOP is called TE in OKG:s studies. Also loss of individual grids in the plant is analysed, if they leads to reactor shutdown.” Further in the answers initiating event frequencies are given as follows: frequency of Loss of 130kV for O1, frequency of Loss of 400kV for O3. Please clarify what is the actual number of power failure events treated separately as initiating events in the OKG studies for the different units and what are the corresponding definitions of these initiating events.
It is indicated in the answers that “External hazards are included implicit”. To avoid double counting
what was the modelling method used in the PSA for those external hazards that cause not only LOOP but failures of other safety-related SSCs?
What are the types of external hazards considered in the external event PSA that can cause LOOP?
2.12 Questions to Sweden (2) – Forsmark NPP Concerning the modelling of recovery the following answer is given. “It is dependent on IE.” Please provide further details including the actual recovery times as well as the methods and data used to model and quantify recovery.
The following answer is given concerning the estimation of initiating frequencies “Different methods
have been used for different IEs.” Please briefly describe the methods and data used for the estimation. It is indicated in the answers that “There are several other external event IEs that cause LOOP”. What
are these external events? Concerning equipment failure modes the following is given in the answers: “In detail with full
functional dependencies (electrical, area and cooling)”. In order to ensure consistency and enable comparison with responses from other countries, please specify the failure modes modelled for diesel generators (and any other active power supply equipment, as applicable) and for bus bars.
In the description of power supply architecture and back-up power supply sources it is given that “A
gas turbine is connected to the 70 kV line”. Please indicate whether this alternate source is modelled in the detailed modelling of power supply failures referred to in the answers. If yes, how is it taken into account?

NEA/CSNI/R(2017)5
300
A “Yes” answer is given for mission time. Please indicate the actual values of mission time in hours as used in the LOOP PSA model.
2.13 Questions to Switzerland Among others, permanent loss of the 220 kV grid and permanent loss of both the 220 kV and the 50 kV grids are considered as initiating events. Also, it is indicated in the answers that LOOPs caused by external events are always considered unrecovered. Are there other causes than external events that are considered in the analysis as causes that lead to a permanent LOOP event?
Please indicate in the drop-own list whether credit was given to plant operation in-house load in the
PSA model for the LOOP event: YesYesYes Reference is made to an experience-based runback failure probability in the answers. Please provide
this probability, if possible. In the general description of the plant several layers of protection as “safety layers” are listed. Please
briefly describe to what extent and how these safety layers are modelled in PSA. 2.14 Question to USA – CE PWR, large dry containment The LOOP frequency is as low as 2.49E-6/yr. What was the technical basis for estimating LOOP frequency?
2.15 Question to USA – GE BWR, Mark I Containment with external hazards An alternate AC (AAC) of back-up power supply source is described in the answers with a note that “This source is powered from a nearby substation and is dedicated to this plant through a series of manual breaker and switch manipulations performed at both sites”. Please briefly describe to what extent and how the use of this alternate source is modelled in the LOOP sequences.

NEA/CSNI/R(2017)5
301
KOREA
Probabilistic Safety Assessment insights relating to the loss of electrical sources
Complementary questions 1 Questions to all countries 1.1 PSA information Please use the shaded drop-down lists in the following table to amend the information on spent fuel pool PSA. Internal events Internal hazards External hazards Spent fuel pool PSA
Level 1 Yes No No Level 2 No No No
1.2 Initiating event/Modelling and data The recovery of off-site power may require switch and breaker manipulations at the site depending on several factors, i.e. design features, on-site consequences of the initiating event, plant operating mode, as well as power supply configuration (e.g. bus bars out of service during maintenance) during the occurrence of LOOP.
Have you modelled recovery actions at the site explicitly in PSA? Yes.
If yes, what was the approach used to model and quantify the required actions? Off-site power recovery actions are modelled in the event tree for SBO (Station Blackout: LOOP
+ Failures of two emergency D/G) which is transferred from the event tree for LOOP IE. Concerning the non-recovery probabilities, please see the answer to the first question to Korea (Section 2.7).
1.3 Safety improvements/mobile equipment Several countries indicate the use of mobile/portable equipment (diesels, pumps). Have you modelled explicitly this equipment in PSA? What is the approach for modelling and quantification (do you consider a human action, a delay for this action)?
No. 1.4 Safety improvements/batteries Please indicate if some safety improvements were performed for the batteries (longer depletion time, additional charging possibilities) and how it is modelled and quantified in the PSA.
By now, safety improvements are performing for batteries, but it is not considered in PSA.

NEA/CSNI/R(2017)5
302
1.5 PSA results For the plants described in your initial survey response, please provide:
1. Conditional core damage probability (CCDP) for loss of off-site power initiators. 3.0E-5/ry (not final result)
2. The relative contribution of loss of off-site power initiating events to overall core damage
frequency (i.e. per cent of cdf represented by loss of off-site power events). 15.0% (not final result)
3. PSA importance measures (risk achievement worth (RAW) and Fussel-Vessely (FV)) for
significant components/operator actions related to losses of off-site power. This would include the importance of alternate AC power supplies (e.g. EDG's), non-AC dependent decay heat removal equipment (e.g. steam driven makeup pumps or auxiliary feed water), human actions or other factors deemed to be significant.
The major results of an importance analysis for LOOP (including SBO) are shown in the table below. Operators’ failures of off-site power recovery and CCFs of two EDGs and one back-up D/G were revealed as significant factors.
Event description F-V RAW
Operator fail to recover OFF-SITE POWER 0.547 8.0 RUNNING CCF of EDG A & B & Back-up DG 0.347 3149.1 DEMAND CCF of EDG A & B & Back-up DG 0.255 7186.7 DIESEL GENERATOR 01B FAILS TO RUN 0.162 8.8 DIESEL GENERATOR 01B FAILS TO START 0.113 12.5 Back-up DG UNAVAILABLE DUE TO MAINTENANCE 0.104 5.6
1.5 PSA modelling/shared equipment
In case of use of shared equipment with other units, is the multi-units aspect modelled in the PSA? For example is there explicitly an unavailability of shared systems for a unit if used by another unit? Did you perform sensitivity studies as regards to benefits and drawbacks of interconnections between units?
In the reference site, four units share one Back-up D/G which is needed in case of failures of both EDGs. However, the current PSA model for each unit does not consider the unavailability of the Back-up D/G caused by its use in one of the other units. The sensitivity studies have also not been performed with regard to the shared equipment.
2 Country-specific questions 2.1 Questions to Czech Republic (2) – Temelin NPP The answers witness that the recovery failures are modelled as basic events in the LOOP event trees. Please briefly describe the method and data used to model and quantify recovery.
It is given in the answers that “LOOP in 24 hours following IE 2.740e-004/year”. Is it really a
frequency type event, not a conditional probability? If it is frequency, then what is the meaning of 24 hours?

NEA/CSNI/R(2017)5
303
It is given in the answers that “Probability of house load 2.5E-001/year”. Is it really a frequency type event, not a conditional probability of house load given LOOP? If it is a frequency type event, has it then been accounted for in the PSA? 2.2 Questions to Finland – Loviisa NPP, Units 1 and 2 Please indicate in the drop-own list whether credit was given to plant operation in-house load in the PSA model for the LOOP event: Yes
Please indicate whether generic or plant / site-specific data, or both types of data were used to
estimate LOOP frequencies. What was the data analysis methodology used? Concerning equipment failure modes the following is given in the answers: “Separate detailed fault
tree analysis, whose results are included in figures of tables for LO”. In order to ensure consistency and enable comparison with responses from other countries, please specify the failure modes modelled for diesel generators (and any other active power supply equipment, as applicable) and for bus bars. 2.3 Questions to Finland – Olkiluoto NPP Units 1 and 2
In the answers related to initiating event categories 5 ranges of LOOP duration are given ranging from 0-10 min to over 8 h. Please describe the technical basis (reason) of this categorisation.
Please indicate in the drop-own list whether credit was given to plant operation in-house load in the
PSA model for the LOOP event: Yes 2.4 Questions to France (1) and France (2) – French 900 MWe PWR, French 1300 MWe PWR Please specify the time durations that make the distinction between the short and the long loss of main grid initiating events as well as between the short and the long total loss of external power initiating events.
Please indicate in the drop-own list whether credit was given to plant operation in-house load in the
PSA model for the LOOP event: Yes Different initiating event frequencies are given in Table 1 for at power and shutdown conditions.
What factors were considered in making this distinction? 2.5 Question to France (3) – 1630 MWe EPR Please indicate in the drop-own list whether credit was given to plant operation in-house load in the PSA model for the LOOP event: Yes
2.6 Questions to Japan Level 1 PSA for internal events at power and in low power and shutdown conditions are given in the answers for the PSA scope with a note that “Level 1, 2, 3, shutdown PRA and external event PRA were conducted separately and integrated assessment has not been done”. Since the intent of the question on PSA scope was to understand what PSA studies are available for a given plant, please indicate in the shaded drop-down list below the types of PSA that has been performed for the typical PWR and BWR plants. (It is well understood that the subsequent responses focus on level 1 PSA only.)

NEA/CSNI/R(2017)5
304
Internal events Internal hazards External hazards
Reactor PSA for PWR plant
Level 1 Yes Yes Yes Level 2 Yes Yes Yes Level 3 Yes Yes Yes
Internal events Internal hazards External hazards
Reactor PSA for BWR plant
Level 1 Yes Yes Yes Level 2 Yes Yes Yes Level 3 Yes Yes Yes
It is indicated in the answers that recovery was “considered as a function of time based on operating
history of the grids”. What are the recovery time windows that were actually used in the PSA? What was the technical basis to define these time windows?
Has recovery been modelled explicitly? If yes, what was the quantification model derived from the
operating history to determine recovery probabilities? Please indicate in the drop-own list whether credit was given to plant operation in island mode in the
PSA model for the LOOP event: Yes 2.7 Questions to Korea It is indicated in the answers that “recovery probabilities are modelled based on generic data base due to lack of domestic experiences”. Please specify the generic data source and the modelling approach used to estimate the probability of recovery.
In the latest revision of PSAs for Korean operating NPPs, the LOOP recovery probabilities were estimated based on Korean generic data from 20 operating NPPs. A total of 15 LOOP events occurred in Korea until the end of 2012. Probability of exceedance versus duration curves was generated for the 15 events.
It is given in the answers that “KAERI/KHNP maintains a database for plant transient IE frequencies
(including LOOP)”. Please indicate whether data for LOOP are plant specific, generic or a combination of these two sources in the database.
At the present time, the LOOP data comes from Korean generic data. Due to the lack of LOOP events, plant-specific LOOP frequencies are not considered.
Please clarify whether the plant can operate in-house load mode (or island mode) or not: Yes. If yes, then please indicate in the drop-own list whether credit was given to this kind of plant
operation in the PSA model for the LOOP event: No The following answer is given in relation to LOOP induced by external hazards: “One LOOP is
considered (each category is included)”. Please clarify what is meant by the categories referred to in the answer. Are there external events treated? If yes, what are these external events? Has a consequential LOOP been considered in the PSA model for these external events?
As of the end of 2012, a half of the total 15 LOOP events in Korea were caused by external hazards such as typhoon and heavy snowfall. But, we do not consider external LOOP events explicitly in PSA model.

NEA/CSNI/R(2017)5
305
2.8 Questions to Mexico In relation to the treatment recoveries and time phases it is indicated in the answers that “accident sequences in the event trees inherently contain two periods of time”. Please give some typical examples in hours for short and long time durations. Also, please briefly describe the methods and data used to model and quantify recovery.
General features of the fault trees are discussed in the answers. In order to ensure consistency and
enable comparison with responses from other countries, please specify the failure modes modelled for diesel generators (and any other active power supply equipment, as applicable) and for bus bars. 2.9 Questions to Romania
Please indicate in the drop-own list whether plant operation in-house load was modelled in the PSA for the Loss of Class IV Power Supply event: Yes
Mobile diesel generators introduced following the Fukushima Daiichi accident are referred to in the
description of alternate power supply sources. Please briefly describe to what extent and how these mobile diesel generators are modelled in PSA (including equipment and human failures). 2.10 Questions to Slovenia Please indicate in the drop-own list whether credit was given to plant operation in-house load in the PSA model for the LOOP event: Yes
In the description of power supply architecture and back-up power supply sources it is given that the
Krško “plant has 110 kV transmission line to the combined gas-steam power plant at Brestanica that serves as the alternate preferred source”. Please indicate whether this alternate source is modelled in the LOOP event sequences or not. If yes, how is it taken into account? 2.11 Questions to Sweden (1) – OKG studies
In the answers describing the initiating events defined and analysed in the OKG studies it is indicated that ”The initiating event LOOP is called TE in OKG:s studies. Also loss of individual grids in the plant is analysed, if they leads to reactor shutdown.” Further in the answers initiating event frequencies are given as follows: frequency of Loss of 130kV for O1, frequency of Loss of 400kV for O3. Please clarify what is the actual number of power failure events treated separately as initiating events in the OKG studies for the different units and what are the corresponding definitions of these initiating events.
It is indicated in the answers that “External hazards are included implicit”. To avoid double counting
what was the modelling method used in the PSA for those external hazards that cause not only LOOP but failures of other safety-related SSCs?
What are the types of external hazards considered in the external event PSA that can cause LOOP?
2.12 Questions to Sweden (2) – Forsmark NPP Concerning the modelling of recovery the following answer is given: ”It is dependent on IE." Please provide further details including the actual recovery times as well as the methods and data used to model and quantify recovery.
NEA/CSNI/R(2017)5
306
The following answer is given concerning the estimation of initiating frequencies “Different methods have been used for different IEs.” Please briefly describe the methods and data used for the estimation.
It is indicated in the answers that “There are several other external event IEs that cause LOOP”. What
are these external events? Concerning equipment failure modes the following is given in the answers: “In detail with full
functional dependencies (electrical, area and cooling)”. In order to ensure consistency and enable comparison with responses from other countries, please specify the failure modes modelled for diesel generators (and any other active power supply equipment, as applicable) and for bus bars.
In the description of power supply architecture and back-up power supply sources it is given that “A
gas turbine is connected to the 70 kV line”. Please indicate whether this alternate source is modelled in the detailed modelling of power supply failures referred to in the answers. If yes, how is it taken into account?
A “Yes” answer is given for mission time. Please indicate the actual values of mission time in hours
as used in the LOOP PSA model. 2.13 Questions to Switzerland Among others, permanent loss of the 220 kV grid and permanent loss of both the 220 kV and the 50 kV grids are considered as initiating events. Also, it is indicated in the answers that LOOPs caused by external events are always considered unrecovered. Are there other causes than external events that are considered in the analysis as causes that lead to a permanent LOOP event?
Please indicate in the drop-own list whether credit was given to plant operation in-house load in the
PSA model for the LOOP event: Yes Reference is made to an experience-based runback failure probability in the answers. Please provide
this probability, if possible. In the general description of the plant several layers of protection as “safety layers” are listed. Please
briefly describe to what extent and how these safety layers are modelled in PSA. 2.14 Question to USA – CE PWR, large dry containment The LOOP frequency is as low as 2.49E-6/yr. What was the technical basis for estimating LOOP frequency?
2.15 Question to USA – GE BWR, Mark I Containment with external hazards An alternate AC (AAC) of back-up power supply source is described in the answers with a note that “This source is powered from a nearby substation and is dedicated to this plant through a series of manual breaker and switch manipulations performed at both sites”. Please briefly describe to what extent and how the use of this alternate source is modelled in the LOOP sequences.

NEA/CSNI/R(2017)5
307
MEXICO
Task WGRISK 2013(1):
Probabilistic Safety Assessment insights relating to the loss of electrical sources
Complementary questions 1 Questions to all countries 1.1 PSA information Please use the shaded drop-down lists in the following table to amend the information on spent fuel pool PSA. Internal events Internal hazards External hazards Spent fuel pool PSA
Level 1 NoNoNo NoNoNo NoNoNo Level 2 NoNoNo NoNoNo NoNoNo
1.2 Initiating event/Modelling and data The recovery of off-site power may require switch and breaker manipulations at the site depending on several factors, i.e. design features, on-site consequences of the initiating event, plant operating mode, as well as power supply configuration (e.g. bus bars out of service during maintenance) during the occurrence of LOOP.
Have you modelled recovery actions at the site explicitly in PSA? No If yes, what was the approach used to model and quantify the required actions?
1.3 Safety improvements/mobile equipment Several countries indicate the use of mobile/portable equipment (diesels, pumps). Have you modelled explicitly this equipment in PSA? What is the approach for modelling and quantification (do you consider a human action, a delay for this action)?
Use of portable equipment are considered as part of the extended SBO mitigation strategies post
Fukushima, however, they are not modelled in PSA that because they are in analysis and implementation process in the LVNPP, this process requires develop explicit procedures. As soon as the above mentioned strategies are approved and implemented, they will have to be reflected in the PSA models, doing emphasis in the human actions needed for its application. 1.4 Safety improvements/batteries Please indicate if some safety improvements were performed for the batteries (longer depletion time, additional charging possibilities) and how it is modelled and quantified in the PSA.
No
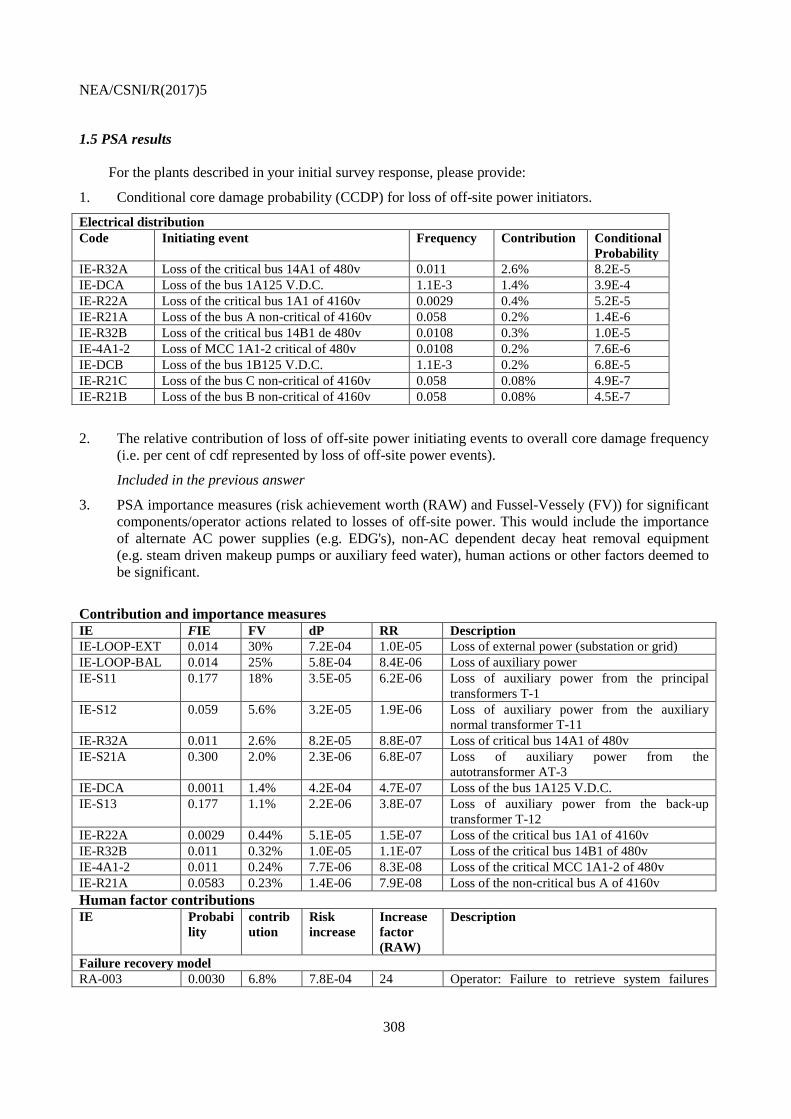
NEA/CSNI/R(2017)5
308
1.5 PSA results
For the plants described in your initial survey response, please provide:
1. Conditional core damage probability (CCDP) for loss of off-site power initiators.
Electrical distribution Code Initiating event Frequency Contribution Conditional
Probability IE-R32A Loss of the critical bus 14A1 of 480v 0.011 2.6% 8.2E-5 IE-DCA Loss of the bus 1A125 V.D.C. 1.1E-3 1.4% 3.9E-4 IE-R22A Loss of the critical bus 1A1 of 4160v 0.0029 0.4% 5.2E-5 IE-R21A Loss of the bus A non-critical of 4160v 0.058 0.2% 1.4E-6 IE-R32B Loss of the critical bus 14B1 de 480v 0.0108 0.3% 1.0E-5 IE-4A1-2 Loss of MCC 1A1-2 critical of 480v 0.0108 0.2% 7.6E-6 IE-DCB Loss of the bus 1B125 V.D.C. 1.1E-3 0.2% 6.8E-5 IE-R21C Loss of the bus C non-critical of 4160v 0.058 0.08% 4.9E-7 IE-R21B Loss of the bus B non-critical of 4160v 0.058 0.08% 4.5E-7
2. The relative contribution of loss of off-site power initiating events to overall core damage frequency (i.e. per cent of cdf represented by loss of off-site power events).
Included in the previous answer
3. PSA importance measures (risk achievement worth (RAW) and Fussel-Vessely (FV)) for significant components/operator actions related to losses of off-site power. This would include the importance of alternate AC power supplies (e.g. EDG's), non-AC dependent decay heat removal equipment (e.g. steam driven makeup pumps or auxiliary feed water), human actions or other factors deemed to be significant.
Contribution and importance measures IE FIE FV dP RR Description IE-LOOP-EXT 0.014 30% 7.2E-04 1.0E-05 Loss of external power (substation or grid) IE-LOOP-BAL 0.014 25% 5.8E-04 8.4E-06 Loss of auxiliary power IE-S11 0.177 18% 3.5E-05 6.2E-06 Loss of auxiliary power from the principal
transformers T-1 IE-S12 0.059 5.6% 3.2E-05 1.9E-06 Loss of auxiliary power from the auxiliary
normal transformer T-11 IE-R32A 0.011 2.6% 8.2E-05 8.8E-07 Loss of critical bus 14A1 of 480v IE-S21A 0.300 2.0% 2.3E-06 6.8E-07 Loss of auxiliary power from the
autotransformer AT-3 IE-DCA 0.0011 1.4% 4.2E-04 4.7E-07 Loss of the bus 1A125 V.D.C. IE-S13 0.177 1.1% 2.2E-06 3.8E-07 Loss of auxiliary power from the back-up
transformer T-12 IE-R22A 0.0029 0.44% 5.1E-05 1.5E-07 Loss of the critical bus 1A1 of 4160v IE-R32B 0.011 0.32% 1.0E-05 1.1E-07 Loss of the critical bus 14B1 of 480v IE-4A1-2 0.011 0.24% 7.7E-06 8.3E-08 Loss of the critical MCC 1A1-2 of 480v IE-R21A 0.0583 0.23% 1.4E-06 7.9E-08 Loss of the non-critical bus A of 4160v Human factor contributions IE Probabi
lity contribution
Risk increase
Increase factor (RAW)
Description
Failure recovery model RA-003 0.0030 6.8% 7.8E-04 24 Operator: Failure to retrieve system failures

NEA/CSNI/R(2017)5
309
(PNR=0.003) RA-01 0.0100 2.0% 6.9E-05 3.0 Operator: Failure to retrieve system failures
(PNR=0.01) RA-05 0.050 21% 1.4E-04 5.2 Operator: Failure to retrieve system failures
(PNR=0.05) RA-137 0.14 0.50% 1.1E-06 1.04 Operator: Failure to retrieve system failures
(PNR=0.137) RA-2 0.20 18% 2.5E-05 1.9 Operator: Failure to retrieve system failures
(PNR=0.2) RA-NO 1.00 1.2% 0.0E+00 1.012 Operator: Failure to retrieve system failures
(non-recoverable) Recovery of LOOP and EDG
RA-F1-AUX 0.50 6.9% 2.3E-06 1.14 Recovery auxiliary power in phase I RA-F1-AUX-CM
0.47 9.6% 3.7E-06 1.20 Recovery auxiliary power or EDG CCF in phase I
RA-F1-AUX-HW
0.48 10% 3.7E-06 1.21 Recovery auxiliary power or EDG in phase I
RA-F1-DC-CM 0.94 0.00005% 9.5E-13 1.0000005
Recovery DC. or EDG CCF in phase I
RA-F1-DC-HW 0.96 0.0059% 9.4E-11 1.00006 Recovery DC. or EDG in phase I RA-F1-EXT 0.76 2.9% 3.2E-07 1.04 Recovery LOOP in phase I RA-F1-EXT-CM 0.71 6.2% 8.5E-07 1.09 Recovery LOOP or EDG CCF in phase I RA-F1-EXT-HW 0.72 6.1% 8.0E-07 1.08 Recovery LOOP or EDG in phase I RA-F1S-AUX 0.63 0.14% 2.8E-08 1.0022 Recovery auxiliary power in phase I with
SORV RA-F1S-AUX-CM
0.61 0.14% 3.0E-08 1.0022 Recovery auxiliary power or EDG CCF in phase I with SORV
RA-F1S-AUX-HW
0.61 0.17% 3.7E-08 1.003 Recovery auxiliary power or EDG in phase I with SORV
RA-F1S-EXT 0.85 0.055% 3.3E-09 1.0006 Recovery LOOP in phase I with SORV RA-F1S-EXT-CM
0.82 0.13% 9.8E-09 1.0016 Recovery LOOP or EDG CCF in phase I with SORV
RA-F1S-EXT-HW
0.83 0.097% 6.9E-09 1.0012 Recovery LOOP or EDG in phase I with SORV
RA-F2-AUX 1.00 2.6% 0.0E+00
1.03 Recovery auxiliary power in phase II
RA-F2-AUX-CM
0.62 7.6% 1.6E-06 1.12 Recovery auxiliary power or EDG CCF in phase II
RA-F2-AUX-HW
0.71 7.9% 1.1E-06 1.11 Recovery auxiliary power or EDG in phase II
RA-F2-EXT 0.16 0.64% 1.2E-06 1.04 Recovery LOOP in phase II RA-F2-EXT-CM 0.097 4.2% 1.3E-05 1.4 Recovery LOOP or EDG CCF in phase II RA-F2-EXT-HW 0.11 3.9% 1.1E-05 1.3 Recovery LOOP or EDG CCF in phase II RA-F3-AUX 0.46 0.91% 3.7E-07 1.020 Recovery auxiliary power in phase II with Div.
III RA-F3-AUX-CM
0.21 2.8% 3.6E-06 1.13 Recovery auxiliary power or EDG CCF in phase II with Div. III
RA-F3-AUX-HW
0.26 2.5% 2.4E-06 1.10 Recovery auxiliary power or EDG in phase II with Div. III
RA-F3-DC-CM 0.56 0.00011% 2.9E-11 1.0000020
Recovery DC. or EDG CCF in phase II with Div. III
RA-F3-DC-HW 0.66 0.0044% 7.5E-10 1.00007 Recovery DC. or EDG in phase II with Div. III RA-F3-EXT 0.091 0.42% 1.4E-06 1.05 Recovery LOOP in phase II with Div. III RA-F3-EXT-CM 0.042 2.6% 2.0E-05 1.6 Recovery LOOP or EDG CCF in phase II with
Div. III

NEA/CSNI/R(2017)5
310
RA-F3-EXT-HW 0.053 1.8% 1.1E-05 1.3 Recovery LOOP or EDG in phase II with Div. III
RA-F5-AUX 0.76 0.90% 9.6E-08 1.012 Recovery auxiliary power in phase III RA-F5-AUX-CM
0.091 0.084% 2.9E-07 1.009 Recovery auxiliary power or EDG CCF in phase III
RA-F5-AUX-HW
0.31 1.2% 9.0E-07 1.04 Recovery auxiliary power or EDG in phase III
RA-F5-EXT 0.027 0.22% 2.6E-06 1.08 Recovery LOOP in phase III RA-F5-EXT-CM 0.0033 0.067% 6.9E-06 1.20 Recovery LOOP or EDG CCF in phase III RA-F5-EXT-HW 0.011 0.78% 2.3E-05 1.7 Recovery LOOP or EDG in phase III 1.5 PSA modelling/shared equipment In case of use of shared equipment with other units, is the multi-units aspect modelled in the PSA? For example is there explicitly an unavailability of shared systems for a unit if used by another unit? Did you perform sensitivity studies as regards to benefits and drawbacks of interconnections between units? The PSA consider each unit as independent, i.e. The multi-units aspects are not modelled in the PSA. 2 Country-specific questions 2.1 Questions to Czech Republic (2) – Temelin NPP The answers witness that the recovery failures are modelled as basic events in the LOOP event trees. Please briefly describe the method and data used to model and quantify recovery.
It is given in the answers that “LOOP in 24 hours following IE 2.740e-004/year”. Is it really a
frequency type event, not a conditional probability? If it is frequency, then what is the meaning of 24 hours?
It is given in the answers that “Probability of house load 2.5E-001/year”. Is it really a frequency type
event, not a conditional probability of house load given LOOP? If it is a frequency type event, has it then been accounted for in the PSA? 2.2 Questions to Finland – Loviisa NPP, Units 1 and 2 Please indicate in the drop-own list whether credit was given to plant operation in-house load in the PSA model for the LOOP event: YesYesYes
Please indicate whether generic or plant/site-specific data, or both types of data were used to estimate
LOOP frequencies. What was the data analysis methodology used? Concerning equipment failure modes the following is given in the answers: “Separate detailed fault
tree analysis, whose results are included in figures of tables for LO”. In order to ensure consistency and enable comparison with responses from other countries, please specify the failure modes modelled for diesel generators (and any other active power supply equipment, as applicable) and for bus bars. 2.3 Questions to Finland – Olkiluoto NPP Units 1 and 2 In the answers related to initiating event categories 5 ranges of LOOP duration are given ranging from 0-10 min to over 8 h. Please describe the technical basis (reason) of this categorisation.

NEA/CSNI/R(2017)5
311
Please indicate in the drop-own list whether credit was given to plant operation in-house load in the PSA model for the LOOP event: YesYesYes

NEA/CSNI/R(2017)5
312
2.4 Questions to France (1) and France (2) – French 900 MWe PWR, French 1300 MWe PWR
Please specify the time durations that make the distinction between the short and the long loss of main grid initiating events as well as between the short and the long total loss of external power initiating events.
Please indicate in the drop-own list whether credit was given to plant operation in-house load in the
PSA model for the LOOP event: YesYesYes Different initiating event frequencies are given in Table 1 for at power and shutdown conditions.
What factors were considered in making this distinction? 2.5 Question to France (3) – 1630 MWe EPR Please indicate in the drop-own list whether credit was given to plant operation in-house load in the PSA model for the LOOP event: YesYesYes
2.6 Questions to Japan Level 1 PSA for internal events at power and in low power and shutdown conditions are given in the answers for the PSA scope with a note that “Level 1, 2, 3, shutdown PRA and external event PRA were conducted separately and integrated assessment has not been done”. Since the intent of the question on PSA scope was to understand what PSA studies are available for a given plant, please indicate in the shaded drop-down list below the types of PSA that has been performed for the typical PWR and BWR plants. (It is well understood that the subsequent responses focus on level 1 PSA only.)
Internal events Internal hazards External hazards
Reactor PSA for PWR plant
Level 1 YesYesYes YesYesYes YesYesYes Level 2 YesYesYes YesYesYes YesYesYes Level 3 YesYesYes YesYesYes YesYesYes
Internal events Internal hazards External hazards
Reactor PSA for BWR plant
Level 1 YesYesYes YesYesYes YesYesYes Level 2 YesYesYes YesYesYes YesYesYes Level 3 YesYesYes YesYesYes YesYesYes
It is indicated in the answers that recovery was “considered as a function of time based on operating
history of the grids”. What are the recovery time windows that were actually used in the PSA? What was the technical basis to define these time windows?
Has recovery been modelled explicitly? If yes, what was the quantification model derived from the
operating history to determine recovery probabilities? Please indicate in the drop-own list whether credit was given to plant operation in island mode in the
PSA model for the LOOP event: YesYesYes 2.7 Questions to Korea It is indicated in the answers that “recovery probabilities are modelled based on generic data base due to lack of domestic experiences”. Please specify the generic data source and the modelling approach used to estimate the probability of recovery.

NEA/CSNI/R(2017)5
313
It is given in the answers that “KAERI/KHNP maintains a database for plant transient IE frequencies (including LOOP)”. Please indicate whether data for LOOP are plant specific, generic or a combination of these two sources in the database.
Please clarify whether the plant can operate in-house load mode (or island mode) or not: YesYesYes.
If yes, then please indicate in the drop-own list whether credit was given to this kind of plant operation in the PSA model for the LOOP event: YesYesYes
The following answer is given in relation to LOOP induced by external hazards: “One LOOP is
considered (each categories are included)”. Please clarify what is meant by the categories referred to in the answer. Are there external events treated explicitly in PSA? If yes, what are these external events? Has a consequential LOOP been considered in the PSA model for these external events? 2.8 Questions to Mexico In relation to the treatment recoveries and time phases it is indicated in the answers that “accident sequences in the event trees inherently contain two periods of time”. Please give some typical examples in hours for short and long time durations. Also, please briefly describe the methods and data used to model and quantify recovery.
The accident sequences of the event trees contain, inherently, two period of time: Short term: Time to reach the criterion of irreversible damage without injection to the vessel. Long term: Time to reach the pressure to vent the primary containment. In the sequences of loss of alternating current (AC), total or partial, is added an intermediate term, corresponding to the time of the exhausting batteries of 125 V. DC., which stay without supply of alternating current for its loaders. So, the phases of time in these stages are defined as follow: Phase I: Short term: Time to reach the criterion of irreversible damage without injection to the vessel. Phase II: Medium term: Time to exhausting batteries, and to reach the criterion of irreversible damage on having lost the injection to the vessel. Phase III: Long term: Time to reach the pressure to vent the primary containment. The times estimated for these phases are: 38 minutes for short term (without injection), 6 hours for medium term, and 23 hours for long term.
The way to include the possible recoveries in these periods consists of "labelling" the conditions in which these periods are given. The branches of the models of electrical systems for initiating events to incorporate these labels are the follow: Loss of power supply to the not critical buses of 4160 V AC. GEA0 Loss of supply of auxiliary power to the not critical bus 1A (1B o 1C). GEB0 GEC0 Recovery branch: RAT-LOOP Lack of supply from the diesel generators to the critical buses of 4160v AC. GEA1_D There aren´t supply from DG1A (1B or 1C) to bus 1A1 (1B1 or 1C1). Include possible common cause failure of 2 or 3 Diesel Generators. GEB1_D GEC1_D Recovery branch: RAT-DGHW, RAT-DGCM Lack of supply from the support transformer to the critical buses of 4160v AC. GEA1_R Ther are not supply from transformer T5 to the bus 1A1 (1B1).

NEA/CSNI/R(2017)5
314
GEB1_R recovery label: RAT--S14 Loss of power from 480v AC., to the battery chargers of 125 V. DC. GEDA1_B Insufficient potential from the battery bank 1A125 (1B125 or 1C125) GEDB1_B GEDC1_B Recovery labels: RAT-BATT, RAT-BAT3
The method to model recoveries consists of realising in outline a search in the dominant cut sets of those that contain basic events capable of being recovered. given that the recovery involves human actions after the initiating event, the recovery probability of two basic simultaneous events will be highly dependent for its proximity in the time, the need of a simultaneous diagnosis, and the level of emotional tension, by what it is considered to be suitable to assign only one possibility of recovery for cut set, independently of the number of basic recoverable events that it contains.
In general terms, working with the appropriate non-recovery probabilities for the sequence that is
being considered, it is identified for each cut set the event with the lower non-recovery probability, giving only this probability to the cut set. Within these recovery possibilities include human actions to support the automatic systems initiation. The assignment of the lower non-recovery probability is done considering a total dependence between the different recovery actions for every cut set.
General features of the fault trees are discussed in the answers. In order to ensure consistency and enable comparison with responses from other countries, please specify the failure modes modelled for diesel generators (and any other active power supply equipment, as applicable) and for bus bars.
DIESEL GENERATORS FAILURE DESCRIPTIOS CCFDGARRANCAR COMMON CAUSE FAILURE OF THE THREE DIESEL
GENERATORS TO START CCFDGAYBARRANCAR COMMON CAUSE FAILURE OF THE DIESEL GENERATORS A&B
TO START CCFDGAYBOPERAR COMMON CAUSE FAILURE OF THE DIESEL GENERATORS A&B
TO OPERATE CCFDGAYCARRANCAR COMMON CAUSE FAILURE OF THE DIESEL GENERATORS A&C
TO START CCFDGAYCOPERAR COMMON CAUSE FAILURE OF THE DIESEL GENERATORS A&C
TO OPERATE CCFDGBYCARRANCAR COMMON CAUSE FAILURE OF THE DIESEL GENERATORS B&C
TO START CCFDGBYCOPERAR COMMON CAUSE FAILURE OF THE DIESEL GENERATORS II&III
TO OPERATE CCFDGOPERAR COMMON CAUSE FAILURE OF THE THREE DIESEL
GENERATORS TO OPERATE DG DIESEL GENERATORS DIVISIONS I&II DGAOPERAR FAILURE OF THE DG-1A GIVEN THE FAILURE OF THE DG-1B &
DG-1C DGBOPERAR FAILURE OF THE DG-1B GIVEN THE FAILURE OF THE DG-1A &
DG-1C DGCOPERAR Failure to operate of DG-1C given the failure of the DG-1A and DG-1B DGCOPERAR-FALLA-AB
FAILURE OF THE DG-01C given the failure of DG-01A and DG-01B
DG-NOFALLA Flag to simulate Pr(DG=0) EDG1AVTM COOLER OF DIESEL 1A UNAVAILABLE FOR MAINTENANCE

NEA/CSNI/R(2017)5
315
BUSES FAILURE DESCRIPTIONS EBU4C1CC AC Bus-144 short circuit EBU4C1MI Maintenance: AC BUS-14C1 unavailable. MBU01AFR NON-CRITICAL BUS 01A FAILS TO OPERATE MBU1A1FR BUS 1A1 of 4160 VAC FAILS OPERATE MBU4A1FR BUS 14A1 FAILS TO OPERATE MMC1BAFR BUS 480/120 VAC TESTED DAILY FAILS OPERATE MMCA11FR BUS A11 FAILS TO OPERATE MMCA12FR BUS A12 FAILS TO OPERATE MMCA14FR BUS A14 FAILS TO OPERATE MMCA1AFR BUS A1A FAILS TO OPERATE MMCA1BFR BUS 480/120 VAC TESTED DAILY FAILS OPERATE MMCA1CFR BUS A1C FAILS TO OPERATE MPDC50FR BUS 125 VCD PDP C50-S1 FAILS OPERATE NBU110FR BUS 110 FAILS TO OPERATE NBUB31FR BUS B31 FAILS TO OPERATE NBUB32FR BUS B32 FAILS TO OPERATE NMC125FR BUS 125 FAILS TO OPERATE PBU01CFR NON-CRITICAL BUS 01C FAILS TO OPERATE PBU01EFR NON-CRITICAL BUS 01E FAILS TO OPERATE PBU1B1FR CRITICAL BUS 1B1 FAILS TO OPERATE PBU4B1FR 480/120 BUS FAILS OPERATE PCB1B1TM INTERRUPTION OF THE CRITICAL BUS 1B1 UNAVAILABLE FOR
MAINTENANCE PMCB11FR BUS B11 FAILS TO OPERATE PMCB12FR BUS B12 FAILS TO OPERATE
EDG1BVTM COOLER OF DIESEL 1B UNAVAILABLE FOR MAINTENANCE EDG1CVTM DIESEL GENERATOR 1CV UNAVAILABLE DUE TO
MAINTENANCE INDISP-DG Flag to simulate the unavailability of the DG MCBG1AFC CIRCUIT BREAKER DG1A FAILS TO CLOSE MCBG1ASF CIRCUIT BREAKER DG1A DOES NOT RECEIVE SIGNAL MCBG1ASS CIRCUIT BREAKER DG1A SPURIOUS SIGNAL SHOT MDG01AFR DIESEL GENERATOR 01A FAILS TO OPERATE MDG01AFS DIESEL GENERATOR 01A FAILS TO START MDG01ASF DIESEL GENERATOR 01A DOES NOT RECEIVE SIGNAL MDG01ATM DIESEL GENERATOR 01A UNAVAILABLE FOR MAINTENANCE MDGOPERA OPERATOR FAILS TO START THE DIESEL GENERATOR I PDG01BFR DIESEL GENERATOR 01B FAILS TO OPERATE PDG01BFS DIESEL GENERATOR 01B FAILS TO START PDG01BSF DIESEL GENERATOR 01B DOES NOT RECEIVE SIGNAL PDG01BTM DIESEL GENERATOR 01B UNAVAILABLE FOR MAINTENANCE PDGOPERA OPERATOR FAILS TO INITIALIZE THE DIESEL GENERATOR II REC-DG-CORTOPLAZO FAILURE TO RETRIEVE DG BY INDEPENDENT FAILURE RECUP-DG-CCF FAILURE TO RETRIEVE DG FAILED BY COMMON CAUSE SDG01CFM HUMAN ERROR TO RESTORED DIESEL GEN 1C AFTER
MAINTENANCE SDG01CFR DIESEL GENERATOR 01C FAILS TO OPERATE SDG01CFS DIESEL GENERATOR 01C FAILS TO START SDG01CSF DIESEL GENERATOR 01C DOES NOT RECEIVE SIGNAL SDG01CTM DIESEL GENERATOR 01C UNAVAILABLE FOR MAINTENANCE SDGOPERA OPERATOR FAILS TO INITIALIZE THE DIESEL GENERATOR III
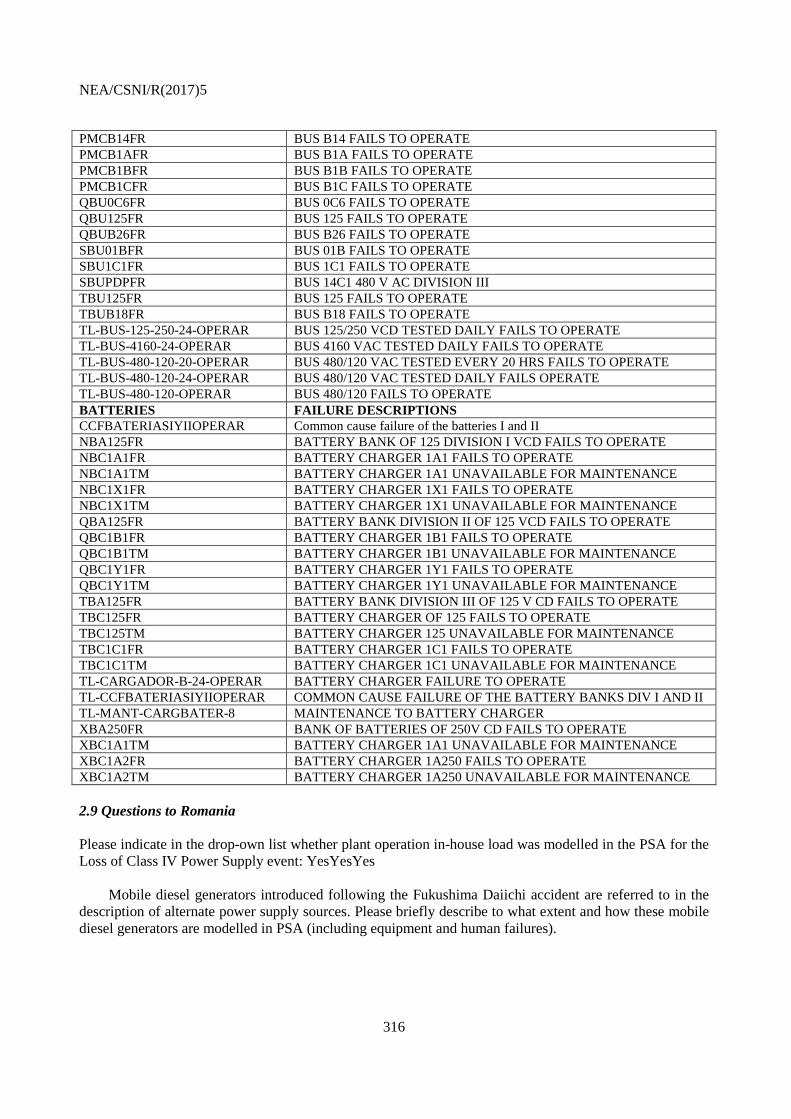
NEA/CSNI/R(2017)5
316
PMCB14FR BUS B14 FAILS TO OPERATE PMCB1AFR BUS B1A FAILS TO OPERATE PMCB1BFR BUS B1B FAILS TO OPERATE PMCB1CFR BUS B1C FAILS TO OPERATE QBU0C6FR BUS 0C6 FAILS TO OPERATE QBU125FR BUS 125 FAILS TO OPERATE QBUB26FR BUS B26 FAILS TO OPERATE SBU01BFR BUS 01B FAILS TO OPERATE SBU1C1FR BUS 1C1 FAILS TO OPERATE SBUPDPFR BUS 14C1 480 V AC DIVISION III TBU125FR BUS 125 FAILS TO OPERATE TBUB18FR BUS B18 FAILS TO OPERATE TL-BUS-125-250-24-OPERAR BUS 125/250 VCD TESTED DAILY FAILS TO OPERATE TL-BUS-4160-24-OPERAR BUS 4160 VAC TESTED DAILY FAILS TO OPERATE TL-BUS-480-120-20-OPERAR BUS 480/120 VAC TESTED EVERY 20 HRS FAILS TO OPERATE TL-BUS-480-120-24-OPERAR BUS 480/120 VAC TESTED DAILY FAILS OPERATE TL-BUS-480-120-OPERAR BUS 480/120 FAILS TO OPERATE BATTERIES FAILURE DESCRIPTIONS CCFBATERIASIYIIOPERAR Common cause failure of the batteries I and II NBA125FR BATTERY BANK OF 125 DIVISION I VCD FAILS TO OPERATE NBC1A1FR BATTERY CHARGER 1A1 FAILS TO OPERATE NBC1A1TM BATTERY CHARGER 1A1 UNAVAILABLE FOR MAINTENANCE NBC1X1FR BATTERY CHARGER 1X1 FAILS TO OPERATE NBC1X1TM BATTERY CHARGER 1X1 UNAVAILABLE FOR MAINTENANCE QBA125FR BATTERY BANK DIVISION II OF 125 VCD FAILS TO OPERATE QBC1B1FR BATTERY CHARGER 1B1 FAILS TO OPERATE QBC1B1TM BATTERY CHARGER 1B1 UNAVAILABLE FOR MAINTENANCE QBC1Y1FR BATTERY CHARGER 1Y1 FAILS TO OPERATE QBC1Y1TM BATTERY CHARGER 1Y1 UNAVAILABLE FOR MAINTENANCE TBA125FR BATTERY BANK DIVISION III OF 125 V CD FAILS TO OPERATE TBC125FR BATTERY CHARGER OF 125 FAILS TO OPERATE TBC125TM BATTERY CHARGER 125 UNAVAILABLE FOR MAINTENANCE TBC1C1FR BATTERY CHARGER 1C1 FAILS TO OPERATE TBC1C1TM BATTERY CHARGER 1C1 UNAVAILABLE FOR MAINTENANCE TL-CARGADOR-B-24-OPERAR BATTERY CHARGER FAILURE TO OPERATE TL-CCFBATERIASIYIIOPERAR COMMON CAUSE FAILURE OF THE BATTERY BANKS DIV I AND II TL-MANT-CARGBATER-8 MAINTENANCE TO BATTERY CHARGER XBA250FR BANK OF BATTERIES OF 250V CD FAILS TO OPERATE XBC1A1TM BATTERY CHARGER 1A1 UNAVAILABLE FOR MAINTENANCE XBC1A2FR BATTERY CHARGER 1A250 FAILS TO OPERATE XBC1A2TM BATTERY CHARGER 1A250 UNAVAILABLE FOR MAINTENANCE 2.9 Questions to Romania Please indicate in the drop-own list whether plant operation in-house load was modelled in the PSA for the Loss of Class IV Power Supply event: YesYesYes
Mobile diesel generators introduced following the Fukushima Daiichi accident are referred to in the
description of alternate power supply sources. Please briefly describe to what extent and how these mobile diesel generators are modelled in PSA (including equipment and human failures).

NEA/CSNI/R(2017)5
317
2.10 Questions to Slovenia
Please indicate in the drop-own list whether credit was given to plant operation in-house load in the PSA model for the LOOP event: YesYesYes
In the description of power supply architecture and back-up power supply sources it is given that the
Krško “plant has 110 kV transmission line to the combined gas-steam power plant at Brestanica that serves as the alternate preferred source”. Please indicate whether this alternate source is modelled in the LOOP event sequences or not. If yes, how is it taken into account?
2.11 Questions to Sweden (1) – OKG studies In the answers describing the initiating events defined and analysed in the OKG studies it is indicated that”. The initiating event LOOP is called TE in OKG’s studies. Also loss of individual grids in the plant is analysed, if they leads to reactor shutdown.” Further in the answers initiating event frequencies are given as follows: frequency of Loss of 130kV for O1, frequency of Loss of 400kV for O3. Please clarify what is the actual number of power failure events treated separately as initiating events in the OKG studies for the different units and what are the corresponding definitions of these initiating events.
It is indicated in the answers that “External hazards are included implicit”. To avoid double counting
what was the modelling method used in the PSA for those external hazards that cause not only LOOP but failures of other safety-related SSCs?
What are the types of external hazards considered in the external event PSA that can cause LOOP?
2.12 Questions to Sweden (2) – Forsmark NPP Concerning the modelling of recovery the following answer is given: “It is dependent on IE”. Please provide further details including the actual recovery times as well as the methods and data used to model and quantify recovery.
The following answer is given concerning the estimation of initiating frequencies “Different methods
have been used for different IE”. Please briefly describe the methods and data used for the estimation. It is indicated in the answers that “There are several other external event IEs that cause LOOP”. What
are these external events? Concerning equipment failure modes the following is given in the answers: “In detail with full
functional dependencies (electrical, area and cooling)”. In order to ensure consistency and enable comparison with responses from other countries, please specify the failure modes modelled for diesel generators (and any other active power supply equipment, as applicable) and for bus bars.
In the description of power supply architecture and back-up power supply sources it is given that “A
gas turbine is connected to the 70 kV line”. Please indicate whether this alternate source is modelled in the detailed modelling of power supply failures referred to in the answers. If yes, how is it taken into account?
A “Yes” answer is given for mission time. Please indicate the actual values of mission time in hours
as used in the LOOP PSA model.

NEA/CSNI/R(2017)5
318
2.13 Questions to Switzerland Among others, permanent loss of the 220 kV grid and permanent loss of both the 220 kV and the 50 kV grids are considered as initiating events. Also, it is indicated in the answers that LOOPs caused by external events are always considered unrecovered. Are there other causes than external events that are considered in the analysis as causes that lead to a permanent LOOP event?
Please indicate in the drop-own list whether credit was given to plant operation in-house load in the
PSA model for the LOOP event: YesYesYes Reference is made to an experience-based runback failure probability in the answers. Please provide
this probability, if possible. In the general description of the plant several layers of protection as “safety layers” are listed. Please
briefly describe to what extent and how these safety layers are modelled in PSA. 2.14 Question to USA – CE PWR, large dry containment The LOOP frequency is as low as 2.49E-6/yr. What was the technical basis for estimating LOOP frequency?
2.15 Question to USA – GE BWR, Mark I Containment with external hazards An alternate AC (AAC) of back-up power supply source is described in the answers with a note that “This source is powered from a nearby substation and is dedicated to this plant through a series of manual breaker and switch manipulations performed at both sites”. Please briefly describe to what extent and how the use of this alternate source is modelled in the LOOP sequences.

NEA/CSNI/R(2017)5
319
ROMANIA
Task WGRISK 2013(1):
Probabilistic Safety Assessment insights relating to the loss of electrical sources
Complementary questions 1 Questions to all countries 1.1 PSA information Please use the shaded drop-down lists in the following table to amend the information on spent fuel pool PSA. Internal events Internal hazards External hazards Spent fuel pool PSA
Level 1 NoNoNo NoNoNo NoNoNo Level 2 NoNoNo NoNoNo NoNoNo
In response to the Fukushima accident, based on WANO SOER 2011-2 recommendations, an
emergency operating procedure “APOP G04 – Spent Fuel Bay cooling abnormal conditions“ was developed and validated, with the objective to address prolonged/ extended loss of Spent Fuel Bay cooling capability. The main goal of the procedure is to prevent fuel bundles damage and H2 generation, due to overheating (calculations has proven that the slow progression of an accident involving loss of cooling to the SFB allows sufficient time to establish a source of water make-up into the spent fuel bay to keep the spent fuel bundles submerged).
1.2 Initiating event/Modelling and data The recovery of off-site power may require switch and breaker manipulations at the site depending on several factors, i.e. design features, on-site consequences of the initiating event, plant operating mode, as well as power supply configuration (e.g. bus bars out of service during maintenance) during the occurrence of LOOP.
Have you modelled recovery actions at the site explicitly in PSA? Yes.
If yes, what was the approach used to model and quantify the required actions?
The external grid has two sections, redundant off-site sources, one of 400kV and the other of 110kV, which provide electrical power required during startup and shutdown of the unit and can also supply power during normal operating conditions. The Class IV electrical power supply system can obtain the energy from both sources or only from one of them, each service transformer and unit transformer being sized for the total load of system. Transfer schemes are provided for a continuous supply of the loads which have safety functions (fast transfer or parallel transfer – the last one requires the operator action). The recovery actions are considered in the fault trees developed for switchover systems, closing the circuit breakers to supply electrical power to buses and reconnecting the electrical loads to these buses are modelled in PSA.

NEA/CSNI/R(2017)5
320
1.3 Safety improvements/mobile equipment Several countries indicate the use of mobile/portable equipment (diesels, pumps). Have you modelled explicitly this equipment in PSA? What is the approach for modelling and quantification (do you consider a human action, a delay for this action)?
The mobile diesel generators are available on-site since January 2012 and they provide 100% redundancy to the EPS; they can be connected within 2.5 – 3 hours. However, they are not yet modelled in PSA.
1.4 Safety improvements/batteries Please indicate if some safety improvements were performed for the batteries (longer depletion time, additional charging possibilities) and how it is modelled and quantified in the PSA.
The seismic robustness of batteries for DBE will be increased.
The option of charging the batteries or the installation of a supplementary uninterruptible power supply for the SCA is being taken under consideration as a potential improvement.
1.5 PSA results For the plants described in your initial survey response, please provide:
1. Conditional core damage probability (CCDP) for loss of off-site power initiators.
2. The relative contribution of loss of off-site power initiating events to overall core damage frequency (i.e. per cent of cdf represented by loss of off-site power events).
3. PSA importance measures (risk achievement worth (RAW) and Fussel-Vessely (FV)) for significant components/operator actions related to losses of off-site power. This would include the importance of alternate AC power supplies (e.g. EDG's), non-AC dependent decay heat removal equipment (e.g. steam driven makeup pumps or auxiliary feed water), human actions or other factors deemed to be significant.
1.5 PSA modelling/shared equipment In case of use of shared equipment with other units, is the multi-units aspect modelled in the PSA? For example is there explicitly an unavailability of shared systems for a unit if used by another unit? Did you perform sensitivity studies as regards to benefits and drawbacks of interconnections between units?
The PSA model for Cernavoda Unit 2 has been developed based on the PSA model for Cernavoda Unit 1, with specific modifications. Multi-unit issues have not been yet considered in a detailed risk analysis.
2 Country-specific questions 2.1 Questions to Czech Republic (2) – Temelin NPP The answers witness that the recovery failures are modelled as basic events in the LOOP event trees. Please briefly describe the method and data used to model and quantify recovery.

NEA/CSNI/R(2017)5
321
It is given in the answers that “LOOP in 24 hours following IE 2.740e-004/year”. Is it really a frequency type event, not a conditional probability? If it is frequency, then what is the meaning of 24 hours?
It is given in the answers that “Probability of house load 2.5E-001/year”. Is it really a frequency type event, not a conditional probability of house load given LOOP? If it is a frequency type event, has it then been accounted for in the PSA? 2.2 Questions to Finland – Loviisa NPP, Units 1 and 2 Please indicate in the drop-own list whether credit was given to plant operation in-house load in the PSA model for the LOOP event: YesYesYes
Please indicate whether generic or plant / site-specific data, or both types of data were used to
estimate LOOP frequencies. What was the data analysis methodology used? Concerning equipment failure modes the following is given in the answers: “Separate detailed fault
tree analysis, whose results are included in figures of tables for LO”. In order to ensure consistency and enable comparison with responses from other countries, please specify the failure modes modelled for diesel generators (and any other active power supply equipment, as applicable) and for bus bars. 2.3 Questions to Finland – Olkiluoto NPP Units 1 and 2 In the answers related to initiating event categories 5 ranges of LOOP duration are given ranging from 0-10 min to over 8 h. Please describe the technical basis (reason) of this categorisation.
Please indicate in the drop-own list whether credit was given to plant operation in-house load in the
PSA model for the LOOP event: YesYesYes 2.4 Questions to France (1) and France (2) – French 900 MWe PWR, French 1300 MWe PWR Please specify the time durations that make the distinction between the short and the long loss of main grid initiating events as well as between the short and the long total loss of external power initiating events.
Please indicate in the drop-own list whether credit was given to plant operation in-house load in the
PSA model for the LOOP event: YesYesYes Different initiating event frequencies are given in Table 1 for at power and shutdown conditions.
What factors were considered in making this distinction? 2.5 Question to France (3) – 1630 MWe EPR Please indicate in the drop-own list whether credit was given to plant operation in-house load in the PSA model for the LOOP event: YesYesYes
2.6 Questions to Japan Level 1 PSA for internal events at power and in low power and shutdown conditions are given in the answers for the PSA scope with a note that “Level 1, 2, 3, shutdown PRA and external event PRA were conducted separately and integrated assessment has not been done”. Since the intent of the question on PSA scope was to understand what PSA studies are available for a given plant, please indicate in the

NEA/CSNI/R(2017)5
322
shaded drop-down list below the types of PSA that has been performed for the typical PWR and BWR plants. (It is well understood that the subsequent responses focus on level 1 PSA only.)
Internal events Internal hazards External hazards
Reactor PSA for PWR plant
Level 1 YesYesYes YesYesYes YesYesYes Level 2 YesYesYes YesYesYes YesYesYes Level 3 YesYesYes YesYesYes YesYesYes
Internal events Internal hazards External hazards
Reactor PSA for BWR plant
Level 1 YesYesYes YesYesYes YesYesYes Level 2 YesYesYes YesYesYes YesYesYes Level 3 YesYesYes YesYesYes YesYesYes
It is indicated in the answers that recovery was “considered as a function of time based on operating
history of the grids”. What are the recovery time windows that were actually used in the PSA? What was the technical basis to define these time windows?
Has recovery been modelled explicitly? If yes, what was the quantification model derived from the
operating history to determine recovery probabilities? Please indicate in the drop-own list whether credit was given to plant operation in island mode in the
PSA model for the LOOP event: YesYesYes 2.7 Questions to Korea It is indicated in the answers that “recovery probabilities are modelled based on generic data base due to lack of domestic experiences”. Please specify the generic data source and the modelling approach used to estimate the probability of recovery.
It is given in the answers that “KAERI/KHNP maintains a database for plant transient IE frequencies
(including LOOP)”. Please indicate whether data for LOOP are plant specific, generic or a combination of these two sources in the database.
Please clarify whether the plant can operate in-house load mode (or island mode) or not: YesYesYes.
If yes, then, please, indicate in the drop-own list whether credit was given to this kind of plant operation in the PSA model for the LOOP event: YesYesYes
The following answer is given in relation to LOOP induced by external hazards: “One LOOP is
considered (each categories are included)”. Please clarify what is meant by the categories referred to in the answer. Are there external events treated explicitly in PSA? If yes, what are these external events? Has a consequential LOOP been considered in the PSA model for these external events? 2.8 Questions to Mexico In relation to the treatment recoveries and time phases it is indicated in the answers that “accident sequences in the event trees inherently contain two periods of time”. Please give some typical examples in hours for short and long time durations. Also, please briefly describe the methods and data used to model and quantify recovery.

NEA/CSNI/R(2017)5
323
General features of the fault trees are discussed in the answers. In order to ensure consistency and enable comparison with responses from other countries, please specify the failure modes modelled for diesel generators (and any other active power supply equipment, as applicable) and for bus bars.

NEA/CSNI/R(2017)5
324
2.9 Questions to Romania Please indicate in the drop-own list whether plant operation in-house load was modelled in the PSA for the Loss of Class IV Power Supply event: YesYesYes
Mobile diesel generators introduced following the Fukushima Daiichi accident are referred to in the
description of alternate power supply sources. Please briefly describe to what extent and how these mobile diesel generators are modelled in PSA (including equipment and human failures).
The mobile diesel generators are available on-site since January 2012 and are providing 100% redundancy to the EPS; they can be connected within 2.5- 3 hours.
Their modelling will involve both equipment failures and connections human errors, but they are not yet modelled into PSA. 2.10 Questions to Slovenia Please indicate in the drop-own list whether credit was given to plant operation in-house load in the PSA model for the LOOP event: YesYesYes
In the description of power supply architecture and back-up power supply sources it is given that the
Krško “plant has 110 kV transmission line to the combined gas-steam power plant at Brestanica that serves as the alternate preferred source”. Please indicate whether this alternate source is modelled in the LOOP event sequences or not. If yes, how is it taken into account? 2.11 Questions to Sweden (1) – OKG studies
In the answers describing the initiating events defined and analysed in the OKG studies it is indicated that”. The initiating event LOOP is called TE in OKG:s studies. Also loss of individual grids in the plant is analysed, if they leads to reactor shutdown.” Further in the answers initiating event frequencies are given as follows: frequency of Loss of 130kV for O1, frequency of Loss of 400kV for O3. Please clarify what is the actual number of power failure events treated separately as initiating events in the OKG studies for the different units and what are the corresponding definitions of these initiating events.
It is indicated in the answers that “External hazards are included implicit”. To avoid double counting
what was the modelling method used in the PSA for those external hazards that cause not only LOOP but failures of other safety-related SSCs?
What are the types of external hazards considered in the external event PSA that can cause LOOP?
2.12 Questions to Sweden (2) – Forsmark NPP Concerning the modelling of recovery the following answer is given: “It is dependent on IE”. Please provide further details including the actual recovery times as well as the methods and data used to model and quantify recovery.
The following answer is given concerning the estimation of initiating frequencies “Different methods
have been used for different IEs”. Please briefly describe the methods and data used for the estimation. It is indicated in the answers that “There are several other external event IEs that cause LOOP”. What
are these external events?

NEA/CSNI/R(2017)5
325
Concerning equipment failure modes the following is given in the answers: “In detail with full functional dependencies (electrical, area and cooling)”. In order to ensure consistency and enable comparison with responses from other countries, please specify the failure modes modelled for diesel generators (and any other active power supply equipment, as applicable) and for bus bars.
In the description of power supply architecture and back-up power supply sources it is given that “A
gas turbine is connected to the 70 kV line”. Please indicate whether this alternate source is modelled in the detailed modelling of power supply failures referred to in the answers. If yes, how is it taken into account?
A “Yes” answer is given for mission time. Please indicate the actual values of mission time in hours
as used in the LOOP PSA model. 2.13 Questions to Switzerland Among others, permanent loss of the 220 kV grid and permanent loss of both the 220 kV and the 50 kV grids are considered as initiating events. Also, it is indicated in the answers that LOOPs caused by external events are always considered unrecovered. Are there other causes than external events that are considered in the analysis as causes that lead to a permanent LOOP event?
Please indicate in the drop-own list whether credit was given to plant operation in-house load in the
PSA model for the LOOP event: YesYesYes Reference is made to an experience-based runback failure probability in the answers. Please provide
this probability, if possible. In the general description of the plant several layers of protection as “safety layers” are listed. Please
briefly describe to what extent and how these safety layers are modelled in PSA. 2.14 Question to USA – CE PWR, large dry containment The LOOP frequency is as low as 2.49E-6/yr. What was the technical basis for estimating LOOP frequency?
2.15 Question to USA – GE BWR, Mark I Containment with external hazards An alternate AC (AAC) of back-up power supply source is described in the answers with a note that “This source is powered from a nearby substation and is dedicated to this plant through a series of manual breaker and switch manipulations performed at both sites”. Please briefly describe to what extent and how the use of this alternate source is modelled in the LOOP sequences.

NEA/CSNI/R(2017)5
326
SLOVENIA
Task WGRISK 2013(1):
Probabilistic Safety Assessment insights relating to the loss of electrical sources
Complementary questions 1 Questions to all countries 1.1 PSA information Please use the shaded drop-down lists in the following table to amend the information on spent fuel pool PSA. Internal events Internal hazards External hazards Spent fuel pool PSA
Level 1 No No No Level 2 No No No
1.2 Initiating event/Modelling and data The recovery of off-site power may require switch and breaker manipulations at the site depending on several factors, i.e. design features, on-site consequences of the initiating event, plant operating mode, as well as power supply configuration (e.g. bus bars out of service during maintenance) during the occurrence of LOOP.
Have you modelled recovery actions at the site explicitly in PSA? Yes If yes, what was the approach used to model and quantify the required actions? Recovery actions are modelled as top event with probability that particular function is restored within
certain time which depends on scenario. For different scenario, different time is considered. Human actions are taken into account. 1.3 Safety improvements/mobile equipment Several countries indicate the use of mobile/portable equipment (diesels, pumps). Have you modelled explicitly this equipment in PSA? What is the approach for modelling and quantification (do you consider a human action, a delay for this action)?
In general mobile/portable equipment is not modelled in PSA model. If human actions for handling of
this equipment under stress circumstances is considered, then such equipment have no influence on CDF. This is main reason that we not model the mobile/portable equipment.
Anyway in two cases we consider also mobile equipment. During seismic events when AF (auxiliary feed water) pump will fail, we consider mobile pump (mobile will survive more severe seismic events).
The second case is combination of seismic event with drought. If seismic event will occur during minimal river flow then the upstream river dam will fail. NPP will build improvised barrier on river with mobile equipment (excavators…) and use mobile pump for pumping water.

NEA/CSNI/R(2017)5
327
1.4 Safety improvements/batteries
Please indicate if some safety improvements were performed for the batteries (longer depletion time, additional charging possibilities) and how it is modelled and quantified in the PSA.
This is not considered in the PSA. In PSA model design characteristic of batteries are taken into
account. 1.5 PSA results For the plants described in your initial survey response, please provide:
1. Conditional core damage probability (CCDP) for loss of off-site power initiators.
CCDP = 8.32E-06
2. The relative contribution of loss of off-site power initiating events to overall core damage frequency (i.e. per cent of cdf represented by loss of off-site power events).
LOSS OF OFF-SITE POWER (LSP)
Internal Initiation Events CDF Contribution [/y] = 4.22E-07
% of Internal Initiation Events CDF = 3.11%
3. PSA importance measures (risk achievement worth (RAW) and Fussel-Vessely (FV)) for significant components/operator actions related to losses of off-site power. This would include the importance of alternate AC power supplies (e.g. EDG's), non-AC dependent decay heat removal equipment (e.g. steam driven makeup pumps or auxiliary feed water), human actions or other factors deemed to be significant.
1.5 PSA modelling/shared equipment In case of use of shared equipment with other units, is the multi-units aspect modelled in the PSA? For example is there explicitly an unavailability of shared systems for a unit if used by another unit? Did you perform sensitivity studies as regards to benefits and drawbacks of interconnections between units? NPP Krško have only one unit.
2 Country-specific questions 2.1 Questions to Czech Republic (2) – Temelin NPP The answers witness that the recovery failures are modelled as basic events in the LOOP event trees. Please briefly describe the method and data used to model and quantify recovery.
It is given in the answers that “LOOP in 24 hours following IE 2.740e-004/year”. Is it really a
frequency type event, not a conditional probability? If it is frequency, then what is the meaning of 24 hours?
It is given in the answers that “Probability of house load 2.5E-001/year”. Is it really a frequency type
event, not a conditional probability of house load given LOOP? If it is a frequency type event, has it then been accounted for in the PSA? 2.2 Questions to Finland – Loviisa NPP, Units 1 and 2

NEA/CSNI/R(2017)5
328
Please indicate in the drop-own list whether credit was given to plant operation in-house load in the PSA model for the LOOP event: Yes
Please indicate whether generic or plant / site-specific data, or both types of data were used to
estimate LOOP frequencies. What was the data analysis methodology used? Concerning equipment failure modes the following is given in the answers: “Separate detailed fault
tree analysis, whose results are included in figures of tables for LO”. In order to ensure consistency and enable comparison with responses from other countries, please specify the failure modes modelled for diesel generators (and any other active power supply equipment, as applicable) and for bus bars. 2.3 Questions to Finland – Olkiluoto NPP Units 1 and 2
In the answers related to initiating event categories 5 ranges of LOOP duration are given ranging from 0-10 min to over 8 h. Please describe the technical basis (reason) of this categorisation.
Please indicate in the drop-own list whether credit was given to plant operation in-house load in the
PSA model for the LOOP event: Yes
2.4 Questions to France (1) and France (2) – French 900 MWe PWR, French 1300 MWe PWR
Please specify the time durations that make the distinction between the short and the long loss of main grid initiating events as well as between the short and the long total loss of external power initiating events.
Please indicate in the drop-own list whether credit was given to plant operation in-house load in the
PSA model for the LOOP event: Yes Different initiating event frequencies are given in Table 1 for at power and shutdown conditions.
What factors were considered in making this distinction? 2.5 Question to France (3) – 1630 MWe EPR
Please indicate in the drop-own list whether credit was given to plant operation in-house load in the PSA model for the LOOP event: Yes
2.6 Questions to Japan Level 1 PSA for internal events at power and in low power and shutdown conditions are given in the answers for the PSA scope with a note that “Level 1, 2, 3, shutdown PRA and external event PRA were conducted separately and integrated assessment has not been done”. Since the intent of the question on PSA scope was to understand what PSA studies are available for a given plant, please indicate in the shaded drop-down list below the types of PSA that has been performed for the typical PWR and BWR plants. (It is well understood that the subsequent responses focus on level 1 PSA only.)
Internal events Internal hazards External hazards
Reactor PSA for PWR plant
Level 1 Yes Yes Yes Level 2 Yes Yes Yes Level 3 Yes Yes Yes
Internal events Internal hazards External hazards

NEA/CSNI/R(2017)5
329
Reactor PSA for BWR plant
Level 1 Yes Yes Yes Level 2 Yes Yes Yes Level 3 Yes Yes Yes
It is indicated in the answers that recovery was “considered as a function of time based on operating
history of the grids”. What are the recovery time windows that were actually used in the PSA? What was the technical basis to define these time windows?
Has recovery been modelled explicitly? If yes, what was the quantification model derived from the
operating history to determine recovery probabilities? Please indicate in the drop-own list whether credit was given to plant operation in island mode in the
PSA model for the LOOP event: Yes 2.7 Questions to Korea It is indicated in the answers that “recovery probabilities are modelled based on generic data base due to lack of domestic experiences”. Please specify the generic data source and the modelling approach used to estimate the probability of recovery.
It is given in the answers that “KAERI/KHNP maintains a database for plant transient IE frequencies
(including LOOP)”. Please indicate whether data for LOOP are plant specific, generic or a combination of these two sources in the database.
Please clarify whether the plant can operate in-house load mode (or island mode) or not: Yes. If yes,
then please indicate in the drop-own list whether credit was given to this kind of plant operation in the PSA model for the LOOP event: Yes
The following answer is given in relation to LOOP induced by external hazards: “One LOOP is
considered (each categories are included)”. Please clarify what is meant by the categories referred to in the answer. Are there external events treated explicitly in PSA? If yes, what are these external events? Has a consequential LOOP been considered in the PSA model for these external events? 2.8 Questions to Mexico In relation to the treatment recoveries and time phases it is indicated in the answers that “accident sequences in the event trees inherently contain two periods of time”. Please give some typical examples in hours for short and long time durations. Also, please briefly describe the methods and data used to model and quantify recovery.
General features of the fault trees are discussed in the answers. In order to ensure consistency and
enable comparison with responses from other countries, please specify the failure modes modelled for diesel generators (and any other active power supply equipment, as applicable) and for bus bars.
2.9 Questions to Romania
Please indicate in the drop-own list whether plant operation in-house load was modelled in the PSA for the Loss of Class IV Power Supply event: Yes

NEA/CSNI/R(2017)5
330
Mobile diesel generators introduced following the Fukushima Daiichi accident are referred to in the description of alternate power supply sources. Please briefly describe to what extent and how these mobile diesel generators are modelled in PSA (including equipment and human failures).

NEA/CSNI/R(2017)5
331
2.10 Questions to Slovenia Please indicate in the drop-own list whether credit was given to plant operation in-house load in the PSA model for the LOOP event: No
In the description of power supply architecture and back-up power supply sources it is given that the
Krško “plant has 110 kV transmission line to the combined gas-steam power plant at Brestanica that serves as the alternate preferred source”. Please indicate whether this alternate source is modelled in the LOOP event sequences or not. If yes, how is it taken into account?
Power plant Brestanica is part of off-site recovery actions. Off-site recovery actions are modelled like
top event with probability that power (Power plant Brestanica or all grid) is restored within Y hours. Time Y depends on AFW availability and if depressurisation succeeds or fails. 2.11 Questions to Sweden (1) – OKG studies In the answers describing the initiating events defined and analysed in the OKG studies it is indicated that”. The initiating event LOOP is called TE in OKG’s studies. Also loss of individual grids in the plant is analysed, if they leads to reactor shutdown”. Further in the answers initiating event frequencies are given as follows: frequency of Loss of 130kV for O1, frequency of Loss of 400kV for O3. Please clarify what is the actual number of power failure events treated separately as initiating events in the OKG studies for the different units and what are the corresponding definitions of these initiating events.
It is indicated in the answers that “External hazards are included implicit”. To avoid double counting
what was the modelling method used in the PSA for those external hazards that cause not only LOOP but failures of other safety-related SSCs?
What are the types of external hazards considered in the external event PSA that can cause LOOP?
2.12 Questions to Sweden (2) – Forsmark NPP Concerning the modelling of recovery the following answer is given: “It is dependent on IE”. Please provide further details including the actual recovery times as well as the methods and data used to model and quantify recovery.
The following answer is given concerning the estimation of initiating frequencies “Different methods
have been used for different IEs”. Please briefly describe the methods and data used for the estimation. It is indicated in the answers that “There are several other external event IEs that cause LOOP”. What
are these external events? Concerning equipment failure modes the following is given in the answers: “In detail with full
functional dependencies (electrical, area and cooling)”. In order to ensure consistency and enable comparison with responses from other countries, please specify the failure modes modelled for diesel generators (and any other active power supply equipment, as applicable) and for bus bars.
In the description of power supply architecture and back-up power supply sources it is given that “A
gas turbine is connected to the 70 kV line”. Please indicate whether this alternate source is modelled in the detailed modelling of power supply failures referred to in the answers. If yes, how is it taken into account?

NEA/CSNI/R(2017)5
332
A “Yes” answer is given for mission time. Please indicate the actual values of mission time in hours as used in the LOOP PSA model.
2.13 Questions to Switzerland Among others, permanent loss of the 220 kV grid and permanent loss of both the 220 kV and the 50 kV grids are considered as initiating events. Also, it is indicated in the answers that LOOPs caused by external events are always considered unrecovered. Are there other causes than external events that are considered in the analysis as causes that lead to a permanent LOOP event?
Please indicate in the drop-own list whether credit was given to plant operation in-house load in the
PSA model for the LOOP event: Yes Reference is made to an experience-based runback failure probability in the answers. Please provide
this probability, if possible. In the general description of the plant several layers of protection as “safety layers” are listed. Please
briefly describe to what extent and how these safety layers are modelled in PSA. 2.14 Question to USA – CE PWR, large dry containment The LOOP frequency is as low as 2.49E-6/yr. What was the technical basis for estimating LOOP frequency?
2.15 Question to USA – GE BWR, Mark I Containment with external hazards An alternate AC (AAC) of back-up power supply source is described in the answers with a note that “This source is powered from a nearby substation and is dedicated to this plant through a series of manual breaker and switch manipulations performed at both sites”. Please briefly describe to what extent and how the use of this alternate source is modelled in the LOOP sequences.

NEA/CSNI/R(2017)5
333
SPAIN
Probabilistic Safety Assessment insights relating to the loss of electrical sources
Complementary questions 1 Questions to all countries 1.1 PSA information Please use the shaded drop-down lists in the following table to amend the information on spent fuel pool PSA. Internal events Internal hazards External hazards Spent fuel pool PSA
Level 1 YesYesYes NoNoNo NoNoNo Level 2 NoNoNo NoNoNo NoNoNo
1.2 Initiating event / Modelling and data The recovery of off-site power may require switch and breaker manipulations at the site depending on several factors, i.e. design features, on-site consequences of the initiating event, plant operating mode, as well as power supply configuration (e.g. bus bars out of service during maintenance) during the occurrence of LOOP.
Have you modelled recovery actions at the site explicitly in PSA? YES If yes, what was the approach used to model and quantify the required actions? Close of circuit breakers to supply electrical power to emergency bars and reconnection of electrical
loads to these bars are the human actions modelled in PSA. The model for these actions has a manual part and a time dependent part. Taking into account the
estimated available time for the human actions to be effective for sequences success, the time dependent part is calculated based on a convolution integral applied to the product of two time dependent functions: the probability of power recovery in the external grid and the probability of those human actions failure considering the remaining available time. 1.3 Safety improvements/mobile equipment Several countries indicate the use of mobile/portable equipment (diesels, pumps). Have you modelled explicitly this equipment in PSA? NO
What is the approach for modelling and quantification (do you consider a human action, a delay for this action)? 1.4 Safety improvements/batteries Please indicate if some safety improvements were performed for the batteries (longer depletion time, additional charging possibilities) and how it is modelled and quantified in the PSA. NO

NEA/CSNI/R(2017)5
334
1.5 PSA results For the plants described in your initial survey response, please provide:
1. Conditional core damage probability (CCDP) for loss of off-site power initiators.
2. The relative contribution of loss of off-site power initiating events to overall core damage frequency (i.e. per cent of cdf represented by loss of off-site power events).
NPP type (in a site)
CCDP (IE-LOOP)
Relative contribution LOOP / FDN
Westinghouse PWR/3 loop (2 units) (Case 1) Rev. 2012
9.2910-6 13.47%
Westinghouse PWR/3 loop (2 units) (Case 2) Rev. 2012
2.38 10-5 8.42%
Westinghouse PWR/3 loop * Rev. 2013
8.84 10-6 2.41%
KWU PWR/3 loop (Rev. 2013)
1.91 10-6 15%
General Electric BWR 6 – Mark III (Rev. 2012)
1.61 10-5 16.44%
* There was a mistake in the answer to the first questionary for this NPP The IE-LOOP frequency is 1.8910-2 /y instead 1.64 10-1. FDN is 1.67 10-7/y instead 2.97 10 – 7 /y
3. PSA importance measures (risk achievement worth (RAW) and Fussel-Vessely (FV)) for significant components/operator actions related to losses of off-site power. This would include the importance of alternate AC power supplies (e.g. EDG's), non-AC dependent decay heat removal equipment (e.g. steam driven makeup pumps or auxiliary feed water), human actions or other factors deemed to be significant.
NPP type (in a
site) COMPONENT/FAILURE RAW
FV
Westinghouse PWR/3 loop (2
units) (Case 1)
Rev. 2012
EDG Common cause (3EDG) 68.35 2.45E-3
Batteries CC 438 2.46E-2
Turbo-pump AFW (1ª hour)
15.84 4.19E-2
Loads reconnection Human error (short term) 12.56 4.2E-2
Loads reconnection Human error (long term) 1.08 1.7E-2

NEA/CSNI/R(2017)5
335
NPP type (in a site)
COMPONENT/FAILURE RAW
FV
Westinghouse PWR/3 loop (2
units) (Case 2)
Rev. 2012
EDG Common cause (2EDG) 3.73 9.33E-4
Batteries CC 2.97E+3 1.44E-3 Turbo-pump AFW (start) 5 3.71E-4
Loads reconnection Human error
0 8.71E-5
AFW control HE 4.74 E+3 3.26 E-1 Westinghouse PWR/3 loop Rev. 2013
EDG Common cause (2EDG)
14.6 9.98 E-3
AFW control HE 1.7 3.67E-3 KWU PWR/3
loop (Rev. 2013)
CCF safeguard diesel (4EDG)
290.8 4.06E-2
HE – AC Recovery (bars) 1.48 3.29E-2 CCF Batteries 5028.13 9.5E-4
General Electric BWR 6
– Mark III (Rev. 2012)
EDG Common cause (2EDG)
97.46 1.19E-2
Trubopump RCIC 1.053 5.07E-2 HE – AC Recovery (bars) 8.99 1.4E-01
1.5 PSA modelling/shared equipment In case of use of shared equipment with other units, is the multi-units aspect modelled in the PSA? For example is there explicitly an unavailability of shared systems for a unit if used by another unit? Did you perform sensitivity studies as regards to benefits and drawbacks of interconnections between units?
There are not considered a CDF or LERF for the two units together: The CDF and LERF are calculated for each unit separately but both values take account if one unit
can use equipment from the other unit and at the same time that this equipment can be being used by the other. 2 Country-specific questions 2.1 Questions to Czech Republic (2) – Temelin NPP The answers witness that the recovery failures are modelled as basic events in the LOOP event trees. Please briefly describe the method and data used to model and quantify recovery.
It is given in the answers that “LOOP in 24 hours following IE 2.740e-004/year”. Is it really a
frequency type event, not a conditional probability? If it is frequency, then what is the meaning of 24 hours?
It is given in the answers that “Probability of house load 2.5E-001/year”. Is it really a frequency type
event, not a conditional probability of house load given LOOP? If it is a frequency type event, has it then been accounted for in the PSA?
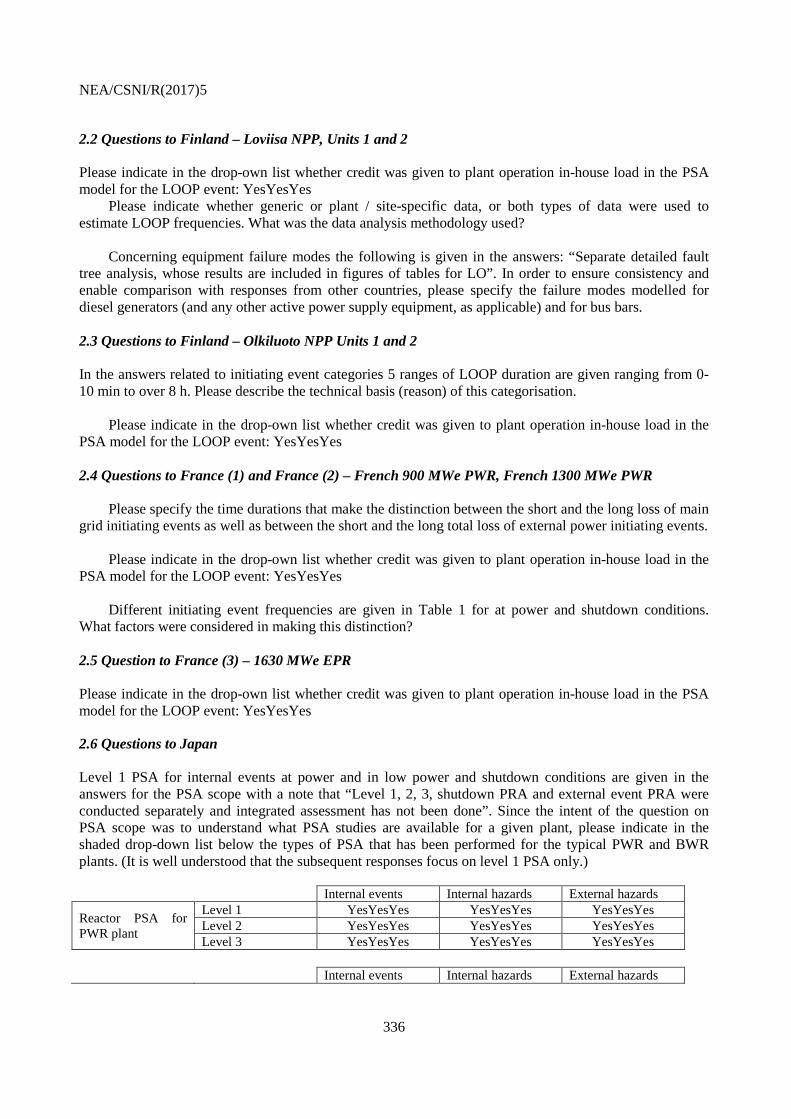
NEA/CSNI/R(2017)5
336
2.2 Questions to Finland – Loviisa NPP, Units 1 and 2 Please indicate in the drop-own list whether credit was given to plant operation in-house load in the PSA model for the LOOP event: YesYesYes
Please indicate whether generic or plant / site-specific data, or both types of data were used to estimate LOOP frequencies. What was the data analysis methodology used?
Concerning equipment failure modes the following is given in the answers: “Separate detailed fault
tree analysis, whose results are included in figures of tables for LO”. In order to ensure consistency and enable comparison with responses from other countries, please specify the failure modes modelled for diesel generators (and any other active power supply equipment, as applicable) and for bus bars. 2.3 Questions to Finland – Olkiluoto NPP Units 1 and 2 In the answers related to initiating event categories 5 ranges of LOOP duration are given ranging from 0-10 min to over 8 h. Please describe the technical basis (reason) of this categorisation.
Please indicate in the drop-own list whether credit was given to plant operation in-house load in the
PSA model for the LOOP event: YesYesYes 2.4 Questions to France (1) and France (2) – French 900 MWe PWR, French 1300 MWe PWR
Please specify the time durations that make the distinction between the short and the long loss of main grid initiating events as well as between the short and the long total loss of external power initiating events.
Please indicate in the drop-own list whether credit was given to plant operation in-house load in the
PSA model for the LOOP event: YesYesYes Different initiating event frequencies are given in Table 1 for at power and shutdown conditions.
What factors were considered in making this distinction? 2.5 Question to France (3) – 1630 MWe EPR Please indicate in the drop-own list whether credit was given to plant operation in-house load in the PSA model for the LOOP event: YesYesYes
2.6 Questions to Japan Level 1 PSA for internal events at power and in low power and shutdown conditions are given in the answers for the PSA scope with a note that “Level 1, 2, 3, shutdown PRA and external event PRA were conducted separately and integrated assessment has not been done”. Since the intent of the question on PSA scope was to understand what PSA studies are available for a given plant, please indicate in the shaded drop-down list below the types of PSA that has been performed for the typical PWR and BWR plants. (It is well understood that the subsequent responses focus on level 1 PSA only.)
Internal events Internal hazards External hazards
Reactor PSA for PWR plant
Level 1 YesYesYes YesYesYes YesYesYes Level 2 YesYesYes YesYesYes YesYesYes Level 3 YesYesYes YesYesYes YesYesYes
Internal events Internal hazards External hazards

NEA/CSNI/R(2017)5
337
Reactor PSA for BWR plant
Level 1 YesYesYes YesYesYes YesYesYes Level 2 YesYesYes YesYesYes YesYesYes Level 3 YesYesYes YesYesYes YesYesYes
It is indicated in the answers that recovery was “considered as a function of time based on operating
history of the grids”. What are the recovery time windows that were actually used in the PSA? What was the technical basis to define these time windows?
Has recovery been modelled explicitly? If yes, what was the quantification model derived from the
operating history to determine recovery probabilities? Please indicate in the drop-own list whether credit was given to plant operation in island mode in the
PSA model for the LOOP event: YesYesYes 2.7 Questions to Korea It is indicated in the answers that “recovery probabilities are modelled based on generic data base due to lack of domestic experiences”. Please specify the generic data source and the modelling approach used to estimate the probability of recovery.
It is given in the answers that “KAERI/KHNP maintains a database for plant transient IE frequencies
(including LOOP)”. Please indicate whether data for LOOP are plant specific, generic or a combination of these two sources in the database.
Please clarify whether the plant can operate in-house load mode (or island mode) or not: YesYesYes.
If yes, then please indicate in the drop-own list whether credit was given to this kind of plant operation in the PSA model for the LOOP event: YesYesYes
The following answer is given in relation to LOOP induced by external hazards: “One LOOP is
considered (each categories are included)”. Please clarify what is meant by the categories referred to in the answer. Are there external events treated explicitly in PSA? If yes, what are these external events? Has a consequential LOOP been considered in the PSA model for these external events? 2.8 Questions to Mexico In relation to the treatment recoveries and time phases it is indicated in the answers that “accident sequences in the event trees inherently contain two periods of time”. Please give some typical examples in hours for short and long time durations. Also, please briefly describe the methods and data used to model and quantify recovery.
General features of the fault trees are discussed in the answers. In order to ensure consistency and
enable comparison with responses from other countries, please specify the failure modes modelled for diesel generators (and any other active power supply equipment, as applicable) and for bus bars. 2.9 Questions to Romania Please indicate in the drop-own list whether plant operation in-house load was modelled in the PSA for the Loss of Class IV Power Supply event: YesYesYes

NEA/CSNI/R(2017)5
338
Mobile diesel generators introduced following the Fukushima Daiichi accident are referred to in the description of alternate power supply sources. Please briefly describe to what extent and how these mobile diesel generators are modelled in PSA (including equipment and human failures).

NEA/CSNI/R(2017)5
339
2.10 Questions to Slovenia Please indicate in the drop-own list whether credit was given to plant operation in-house load in the PSA model for the LOOP event: YesYesYes
In the description of power supply architecture and back-up power supply sources it is given that the
Krško “plant has 110 kV transmission line to the combined gas-steam power plant at Brestanica that serves as the alternate preferred source”. Please indicate whether this alternate source is modelled in the LOOP event sequences or not. If yes, how is it taken into account? 2.11 Questions to Sweden (1) – OKG studies In the answers describing the initiating events defined and analysed in the OKG studies it is indicated that ”The initiating event LOOP is called TE in OKG:s studies. Also loss of individual grids in the plant is analysed, if they leads to reactor shutdown.” Further in the answers initiating event frequencies are given as follows: frequency of Loss of 130kV for O1, frequency of Loss of 400kV for O3. Please clarify what is the actual number of power failure events treated separately as initiating events in the OKG studies for the different units and what are the corresponding definitions of these initiating events.
It is indicated in the answers that “External hazards are included implicit”. To avoid double counting
what was the modelling method used in the PSA for those external hazards that cause not only LOOP but failures of other safety-related SSCs?
What are the types of external hazards considered in the external event PSA that can cause LOOP?
2.12 Questions to Sweden (2) – Forsmark NPP Concerning the modelling of recovery the following answer is given: “It is dependent on IE”. Please provide further details including the actual recovery times as well as the methods and data used to model and quantify recovery.
The following answer is given concerning the estimation of initiating frequencies “Different methods
have been used for different IEs”. Please briefly describe the methods and data used for the estimation. It is indicated in the answers that “There are several other external event IEs that cause LOOP”. What
are these external events? Concerning equipment failure modes the following is given in the answers: “In detail with full
functional dependencies (electrical, area and cooling)”. In order to ensure consistency and enable comparison with responses from other countries, please specify the failure modes modelled for diesel generators (and any other active power supply equipment, as applicable) and for bus bars.
In the description of power supply architecture and back-up power supply sources it is given that “A
gas turbine is connected to the 70 kV line”. Please indicate whether this alternate source is modelled in the detailed modelling of power supply failures referred to in the answers. If yes, how is it taken into account?
A “Yes” answer is given for mission time. Please indicate the actual values of mission time in hours
as used in the LOOP PSA model.

NEA/CSNI/R(2017)5
340
2.13 Questions to Switzerland Among others, permanent loss of the 220 kV grid and permanent loss of both the 220 kV and the 50 kV grids are considered as initiating events. Also, it is indicated in the answers that LOOPs caused by external events are always considered unrecovered. Are there other causes than external events that are considered in the analysis as causes that lead to a permanent LOOP event?
Please indicate in the drop-own list whether credit was given to plant operation in-house load in the
PSA model for the LOOP event: YesYesYes Reference is made to an experience-based runback failure probability in the answers. Please provide
this probability, if possible. In the general description of the plant several layers of protection as “safety layers” are listed. Please
briefly describe to what extent and how these safety layers are modelled in PSA. 2.14 Question to USA – CE PWR, large dry containment The LOOP frequency is as low as 2.49E-6/yr. What was the technical basis for estimating LOOP frequency?
2.15 Question to USA – GE BWR, Mark I Containment with external hazards An alternate AC (AAC) of back-up power supply source is described in the answers with a note that “This source is powered from a nearby substation and is dedicated to this plant through a series of manual breaker and switch manipulations performed at both sites”. Please briefly describe to what extent and how the use of this alternate source is modelled in the LOOP sequences.

NEA/CSNI/R(2017)5
341
SWITZERLAND
Task WGRISK 2013(1):
Probabilistic Safety Assessment insights relating to the loss of electrical sources
Complementary questions 1 Questions to all countries 1.1 PSA information Please use the shaded drop-down lists in the following table to amend the information on spent fuel pool PSA.
Internal events Internal hazards External hazards Spent fuel pool PSA
Level 1 YesYesYes YesYesYes YesYesYes Level 2 YesYesYes YesYesYes YesYesYes
The Swiss PSA models consider all relevant internal and external events. Modelling of the spent fuel
pool is mandatory for the assessment of the shutdown state. For full power operation, the modelling of the spent fuel pool depends on the risk contribution (for details, see regulatory guideline ENSI-A05, Section 4.1 b).
1.2 Initiating event/Modelling and data The recovery of off-site power may require switch and breaker manipulations at the site depending on several factors, i.e. design features, on-site consequences of the initiating event, plant operating mode, as well as power supply configuration (e.g. bus bars out of service during maintenance) during the occurrence of LOOP.
Have you modelled recovery actions at the site explicitly in PSA? Recovery of the electrical grid is modelled using statistical data, i.e. a conditional probability to
recover the grid after a LOOP in the first 30 minutes (for instance), derived from American or Swiss statistics, is included either in the initiating event frequency itself or as a separate basic event.
If yes, what was the approach used to model and quantify the required actions?
1.3 Safety improvements/mobile equipment
Several countries indicate the use of mobile/portable equipment (diesels, pumps). Have you modelled explicitly this equipment in PSA? What is the approach for modelling and quantification (do you consider a human action, a delay for this action)?
In general, mobile and portable equipment are modelled in the PSA. Failure rates of human actions and components are considered. The available and needed time is considered in the assessment of the operator reliability evaluation.
1.4 Safety improvements/batteries Please indicate if some safety improvements were performed for the batteries (longer depletion time, additional charging possibilities) and how it is modelled and quantified in the PSA.

NEA/CSNI/R(2017)5
342
Yes, in particular for one plant which performed tests on the batteries and was able to show a longer depletion time. Again for this plant, procedures were updated by highlighting essential components, so that operators could choose to disconnect non-essential components in order to extend the battery availability. Another plant considers back fitting additional batteries.
1.5 PSA results
For the plants described in your initial survey response, please provide:
1. Conditional core damage probability (CCDP) for loss of off-site power initiators. The CCDPs for total loss of off-site power in Switzerland range between approximately 1E-08 and
7E-05. The wide range can be explained by the different designs and by a different treatment of the recovery (sometimes, the recovery factors are included in the initiating event frequency, sometimes, they are part of the event tree).
2. The relative contribution of loss of off-site power initiating events to overall core damage
frequency (i.e. per cent of CDF represented by loss of off-site power events). The relative contribution of the total loss of off-site power initiating event is less than 1%. The
contribution of a total loss of off-site power within external events such as earthquakes, wind, tornado, etc. is not included in this contribution.
3. PSA importance measures (risk achievement worth (RAW) and Fussel-Vessely (FV)) for significant components/operator actions related to losses of off-site power. This would include the importance of alternate AC power supplies (e.g. EDG's), non-AC dependent decay heat removal equipment (e.g. steam driven makeup pumps or auxiliary feed water), human actions or other factors deemed to be significant.
These importance measures are in general only available for the whole CDF calculations, not for specific scenarios. 1.5 PSA modelling/shared equipment In case of use of shared equipment with other units, is the multi-units aspect modelled in the PSA? For example is there explicitly an unavailability of shared systems for a unit if used by another unit? Did you perform sensitivity studies as regards to benefits and drawbacks of interconnections between units?
In Switzerland, only one plant consists of two units. The three others are single units. The multi-units aspect is considered in the PSA.
2 Country-specific questions 2.1 Questions to Czech Republic (2) – Temelin NPP The answers witness that the recovery failures are modelled as basic events in the LOOP event trees. Please briefly describe the method and data used to model and quantify recovery.
It is given in the answers that “LOOP in 24 hours following IE 2.740e-004/year”. Is it really a
frequency type event, not a conditional probability? If it is frequency, then what is the meaning of 24 hours?
It is given in the answers that “Probability of house load 2.5E-001/year”. Is it really a frequency type
event, not a conditional probability of house load given LOOP? If it is a frequency type event, has it then been accounted for in the PSA?

NEA/CSNI/R(2017)5
343
2.2 Questions to Finland – Loviisa NPP, Units 1 and 2 Please indicate in the drop-own list whether credit was given to plant operation in-house load in the PSA model for the LOOP event: YesYesYes
Please indicate whether generic or plant / site-specific data, or both types of data were used to
estimate LOOP frequencies. What was the data analysis methodology used? Concerning equipment failure modes the following is given in the answers: “Separate detailed fault
tree analysis, whose results are included in figures of tables for LO”. In order to ensure consistency and enable comparison with responses from other countries, please specify the failure modes modelled for diesel generators (and any other active power supply equipment, as applicable) and for bus bars. 2.3 Questions to Finland – Olkiluoto NPP Units 1 and 2 In the answers related to initiating event categories 5 ranges of LOOP duration are given ranging from 0-10 min to over 8 h. Please describe the technical basis (reason) of this categorisation.
Please indicate in the drop-own list whether credit was given to plant operation in-house load in the
PSA model for the LOOP event: YesYesYes 2.4 Questions to France (1) and France (2) – French 900 MWe PWR, French 1300 MWe PWR Please specify the time durations that make the distinction between the short and the long loss of main grid initiating events as well as between the short and the long total loss of external power initiating events.
Please indicate in the drop-own list whether credit was given to plant operation in-house load in the
PSA model for the LOOP event: YesYesYes Different initiating event frequencies are given in Table 1 for at power and shutdown conditions.
What factors were considered in making this distinction? 2.5 Question to France (3) – 1630 MWe EPR Please indicate in the drop-own list whether credit was given to plant operation in-house load in the PSA model for the LOOP event: YesYesYes
2.6 Questions to Japan Level 1 PSA for internal events at power and in low power and shutdown conditions are given in the answers for the PSA scope with a note that “Level 1, 2, 3, shutdown PRA and external event PRA were conducted separately and integrated assessment has not been done”. Since the intent of the question on PSA scope was to understand what PSA studies are available for a given plant, please indicate in the shaded drop-down list below the types of PSA that has been performed for the typical PWR and BWR plants. (It is well understood that the subsequent responses focus on level 1 PSA only.)
Internal events Internal hazards External hazards Reactor PSA for PWR plant
Level 1 YesYesYes YesYesYes YesYesYes Level 2 YesYesYes YesYesYes YesYesYes

NEA/CSNI/R(2017)5
344
Level 3 YesYesYes YesYesYes YesYesYes Internal events Internal hazards External hazards
Reactor PSA for BWR plant
Level 1 YesYesYes YesYesYes YesYesYes Level 2 YesYesYes YesYesYes YesYesYes Level 3 YesYesYes YesYesYes YesYesYes
It is indicated in the answers that recovery was “considered as a function of time based on operating
history of the grids”. What are the recovery time windows that were actually used in the PSA? What was the technical basis to define these time windows?
Has recovery been modelled explicitly? If yes, what was the quantification model derived from the
operating history to determine recovery probabilities? Please indicate in the drop-own list whether credit was given to plant operation in island mode in the
PSA model for the LOOP event: YesYesYes 2.7 Questions to Korea It is indicated in the answers that “recovery probabilities are modelled based on generic data base due to lack of domestic experiences”. Please specify the generic data source and the modelling approach used to estimate the probability of recovery.
It is given in the answers that “KAERI/KHNP maintains a database for plant transient IE frequencies
(including LOOP)”. Please indicate whether data for LOOP are plant specific, generic or a combination of these two sources in the database.
Please clarify whether the plant can operate in-house load mode (or island mode) or not: YesYesYes.
If yes, then please indicate in the drop-own list whether credit was given to this kind of plant operation in the PSA model for the LOOP event: YesYesYes
The following answer is given in relation to LOOP induced by external hazards: “One LOOP is
considered (each categories are included)”. Please clarify what is meant by the categories referred to in the answer. Are there external events treated explicitly in PSA? If yes, what are these external events? Has a consequential LOOP been considered in the PSA model for these external events? 2.8 Questions to Mexico In relation to the treatment recoveries and time phases it is indicated in the answers that “accident sequences in the event trees inherently contain two periods of time”. Please give some typical examples in hours for short and long time durations. Also, please briefly describe the methods and data used to model and quantify recovery.
General features of the fault trees are discussed in the answers. In order to ensure consistency and
enable comparison with responses from other countries, please specify the failure modes modelled for diesel generators (and any other active power supply equipment, as applicable) and for bus bars. 2.9 Questions to Romania Please indicate in the drop-own list whether plant operation in-house load was modelled in the PSA for the Loss of Class IV Power Supply event: YesYesYes

NEA/CSNI/R(2017)5
345
Mobile diesel generators introduced following the Fukushima Daiichi accident are referred to in the description of alternate power supply sources. Please briefly describe to what extent and how these mobile diesel generators are modelled in PSA (including equipment and human failures).
2.10 Questions to Slovenia Please indicate in the drop-own list whether credit was given to plant operation in-house load in the PSA model for the LOOP event: YesYesYes
In the description of power supply architecture and back-up power supply sources it is given that the
Krško “plant has 110 kV transmission line to the combined gas-steam power plant at Brestanica that serves as the alternate preferred source”. Please indicate whether this alternate source is modelled in the LOOP event sequences or not. If yes, how is it taken into account? 2.11 Questions to Sweden (1) – OKG studies In the answers describing the initiating events defined and analysed in the OKG studies it is indicated that ”The initiating event LOOP is called TE in OKG:s studies. Also loss of individual grids in the plant is analysed, if they leads to reactor shutdown.” Further in the answers initiating event frequencies are given as follows: frequency of Loss of 130kV for O1, frequency of Loss of 400kV for O3. Please clarify what is the actual number of power failure events treated separately as initiating events in the OKG studies for the different units and what are the corresponding definitions of these initiating events.
It is indicated in the answers that “External hazards are included implicit”. To avoid double counting
what was the modelling method used in the PSA for those external hazards that cause not only LOOP but failures of other safety-related SSCs?
What are the types of external hazards considered in the external event PSA that can cause LOOP?
2.12 Questions to Sweden (2) – Forsmark NPP Concerning the modelling of recovery the following answer is give. “It is dependent on IE”. Please provide further details including the actual recovery times as well as the methods and data used to model and quantify recovery.
The following answer is given concerning the estimation of initiating frequencies “Different methods
have been used for different IEs.” Please briefly describe the methods and data used for the estimation. It is indicated in the answers that “There are several other external event IEs that cause LOOP”. What
are these external events? Concerning equipment failure modes the following is given in the answers: “In detail with full
functional dependencies (electrical, area and cooling)”. In order to ensure consistency and enable comparison with responses from other countries, please specify the failure modes modelled for diesel generators (and any other active power supply equipment, as applicable) and for bus bars.
In the description of power supply architecture and back-up power supply sources it is given that “A
gas turbine is connected to the 70 kV line”. Please indicate whether this alternate source is modelled in the detailed modelling of power supply failures referred to in the answers. If yes, how is it taken into account?

NEA/CSNI/R(2017)5
346
A “Yes” answer is given for mission time. Please indicate the actual values of mission time in hours
as used in the LOOP PSA model.
2.13 Questions to Switzerland Among others, permanent loss of the 220 kV grid and permanent loss of both the 220 kV and the 50 kV grids are considered as initiating events. Also, it is indicated in the answers that LOOPs caused by external events are always considered unrecovered. Are there other causes than external events that are considered in the analysis as causes that lead to a permanent LOOP event?
Your description above reflects all causes for a permanent LOOP considered in the Swiss PSAs. Please indicate in the drop-own list whether credit was given to plant operation in-house load in the
PSA model for the LOOP event: YesYesYes In general, yes the operation of the plant in-house load is credited, but not every plant considers it. Reference is made to an experience-based runback failure probability in the answers. Please provide
this probability, if possible. In the general description of the plant several layers of protection as “safety layers” are listed. Please
briefly describe to what extent and how these safety layers are modelled in PSA. Please note that the safety layers are a deterministic representation of a safety concept and not a
modelling concept. All relevant aspects of the electrical power support are modelled in the Swiss PSAs. 2.14 Question to USA – CE PWR, Large Dry Containment The LOOP frequency is as low as 2.49E-6/yr. What was the technical basis for estimating LOOP frequency?
2.15 Question to USA – GE BWR, Mark I Containment with external hazards An alternate AC (AAC) of back-up power supply source is described in the answers with a note that “This source is powered from a nearby substation and is dedicated to this plant through a series of manual breaker and switch manipulations performed at both sites”. Please briefly describe to what extent and how the use of this alternate source is modelled in the LOOP sequences.

NEA/CSNI/R(2017)5
347
CHINESE TAIPEI
Probabilistic Safety Assessment insights relating to the loss of electrical sources
Complementary questions 1 Questions to all countries 1.1 PSA information Please use the shaded drop-down lists in the following table to amend the information on spent fuel pool PSA.
Internal events Internal hazards External hazards Spent fuel pool PSA
Level 1 NoNoNo NoNoNo NoNoNo Level 2 NoNoNo NoNoNo NoNoNo
1.2 Initiating event/Modelling and data The recovery of off-site power may require switch and breaker manipulations at the site depending on several factors, i.e. design features, on-site consequences of the initiating event, plant operating mode, as well as power supply configuration (e.g. bus bars out of service during maintenance) during the occurrence of LOOP.
Have you modelled recovery actions at the site explicitly in PSA? Yes. If yes, what was the approach used to model and quantify the required actions? There is a basic event in the off-site power fault tree for off-site power recovery. The probability of
off-site power recovery should be a function of available time which was a part of success criteria when developing event tree. For each required time window from event tree analysis, the probability of off-site power was obtained by statistical analysis of plant-specific data of past operating history. 1.3 Safety improvements/mobile equipment Several countries indicate the use of mobile/portable equipment (diesels, pumps). Have you modelled explicitly this equipment in PSA? What is the approach for modelling and quantification (do you consider a human action, a delay for this action)?
After Fukushima accident, various types of portable equipment have been installed in site and specific operating procedure was developed when facing extreme event. For the time being, the portable equipment is not modelled in PSA. It will be modelled explicitly in the next PSA revision. 1.4 Safety improvements/batteries Please indicate if some safety improvements were performed for the batteries (longer depletion time, additional charging possibilities) and how it is modelled and quantified in the PSA.
To extend the depletion time form 8 hours to 24 hours after accident, improvement for safety-related DC batteries was made by removing unnecessary loads. Also, the load configuration for each battery was redesigned to meet the requirement. To reflect the new configuration, new success criteria for DC batteries was used in event trees analyses. And related fault trees were revised by current load configuration.
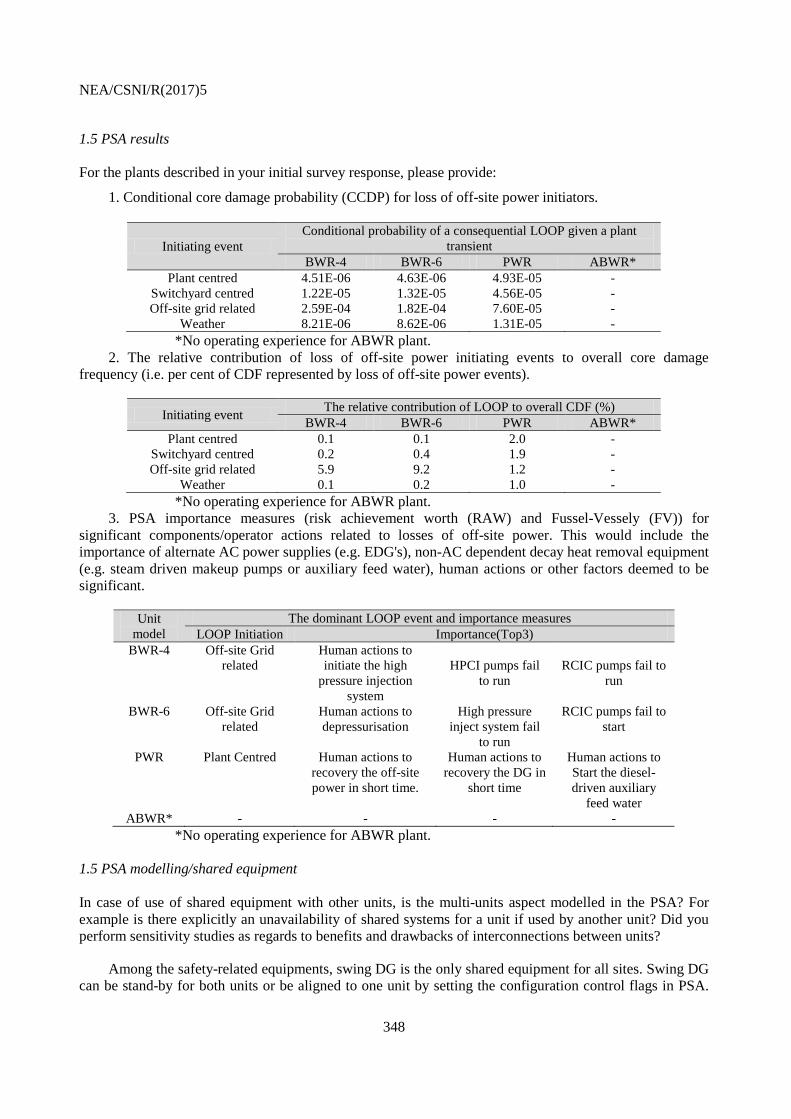
NEA/CSNI/R(2017)5
348
1.5 PSA results For the plants described in your initial survey response, please provide:
1. Conditional core damage probability (CCDP) for loss of off-site power initiators.
Initiating event Conditional probability of a consequential LOOP given a plant
transient BWR-4 BWR-6 PWR ABWR*
Plant centred 4.51E-06 4.63E-06 4.93E-05 - Switchyard centred 1.22E-05 1.32E-05 4.56E-05 - Off-site grid related 2.59E-04 1.82E-04 7.60E-05 -
Weather 8.21E-06 8.62E-06 1.31E-05 - *No operating experience for ABWR plant.
2. The relative contribution of loss of off-site power initiating events to overall core damage frequency (i.e. per cent of CDF represented by loss of off-site power events).
Initiating event The relative contribution of LOOP to overall CDF (%) BWR-4 BWR-6 PWR ABWR*
Plant centred 0.1 0.1 2.0 - Switchyard centred 0.2 0.4 1.9 - Off-site grid related 5.9 9.2 1.2 -
Weather 0.1 0.2 1.0 - *No operating experience for ABWR plant.
3. PSA importance measures (risk achievement worth (RAW) and Fussel-Vessely (FV)) for significant components/operator actions related to losses of off-site power. This would include the importance of alternate AC power supplies (e.g. EDG's), non-AC dependent decay heat removal equipment (e.g. steam driven makeup pumps or auxiliary feed water), human actions or other factors deemed to be significant.
Unit model
The dominant LOOP event and importance measures LOOP Initiation Importance(Top3)
BWR-4 Off-site Grid related
Human actions to initiate the high
pressure injection system
HPCI pumps fail to run
RCIC pumps fail to run
BWR-6 Off-site Grid related
Human actions to depressurisation
High pressure inject system fail
to run
RCIC pumps fail to start
PWR Plant Centred Human actions to recovery the off-site power in short time.
Human actions to recovery the DG in
short time
Human actions to Start the diesel-driven auxiliary
feed water ABWR* - - - -
*No operating experience for ABWR plant. 1.5 PSA modelling/shared equipment In case of use of shared equipment with other units, is the multi-units aspect modelled in the PSA? For example is there explicitly an unavailability of shared systems for a unit if used by another unit? Did you perform sensitivity studies as regards to benefits and drawbacks of interconnections between units?
Among the safety-related equipments, swing DG is the only shared equipment for all sites. Swing DG can be stand-by for both units or be aligned to one unit by setting the configuration control flags in PSA.

NEA/CSNI/R(2017)5
349
For current configuration, swing DG can obviously reduced the risk from LOOP event. It also gives more operational flexibility when any emergency DG is in outage.
2 Country-specific questions 2.1 Questions to Czech Republic (2) – Temelin NPP The answers witness that the recovery failures are modelled as basic events in the LOOP event trees. Please briefly describe the method and data used to model and quantify recovery.
It is given in the answers that “LOOP in 24 hours following IE 2.740e-004/year”. Is it really a
frequency type event, not a conditional probability? If it is frequency, then what is the meaning of 24 hours?
It is given in the answers that “Probability of house load 2.5E-001/year”. Is it really a frequency type
event, not a conditional probability of house load given LOOP? If it is a frequency type event, has it then been accounted for in the PSA? 2.2 Questions to Finland – Loviisa NPP, Units 1 and 2 Please indicate in the drop-own list whether credit was given to plant operation in-house load in the PSA model for the LOOP event: YesYesYes
Please indicate whether generic or plant / site-specific data, or both types of data were used to
estimate LOOP frequencies. What was the data analysis methodology used? Concerning equipment failure modes the following is given in the answers: “Separate detailed fault
tree analysis, whose results are included in figures of tables for LO”. In order to ensure consistency and enable comparison with responses from other countries, please specify the failure modes modelled for diesel generators (and any other active power supply equipment, as applicable) and for bus bars. 2.3 Questions to Finland – Olkiluoto NPP Units 1 and 2 In the answers related to initiating event categories 5 ranges of LOOP duration are given ranging from 0-10 min to over 8 h. Please describe the technical basis (reason) of this categorisation.
Please indicate in the drop-own list whether credit was given to plant operation in-house load in the
PSA model for the LOOP event: YesYesYes
2.4 Questions to France (1) and France (2) – French 900 MWe PWR, French 1300 MWe PWR
Please specify the time durations that make the distinction between the short and the long loss of main grid initiating events as well as between the short and the long total loss of external power initiating events.
Please indicate in the drop-own list whether credit was given to plant operation in-house load in the PSA model for the LOOP event: YesYesYes
Different initiating event frequencies are given in Table 1 for at power and shutdown conditions. What factors were considered in making this distinction?
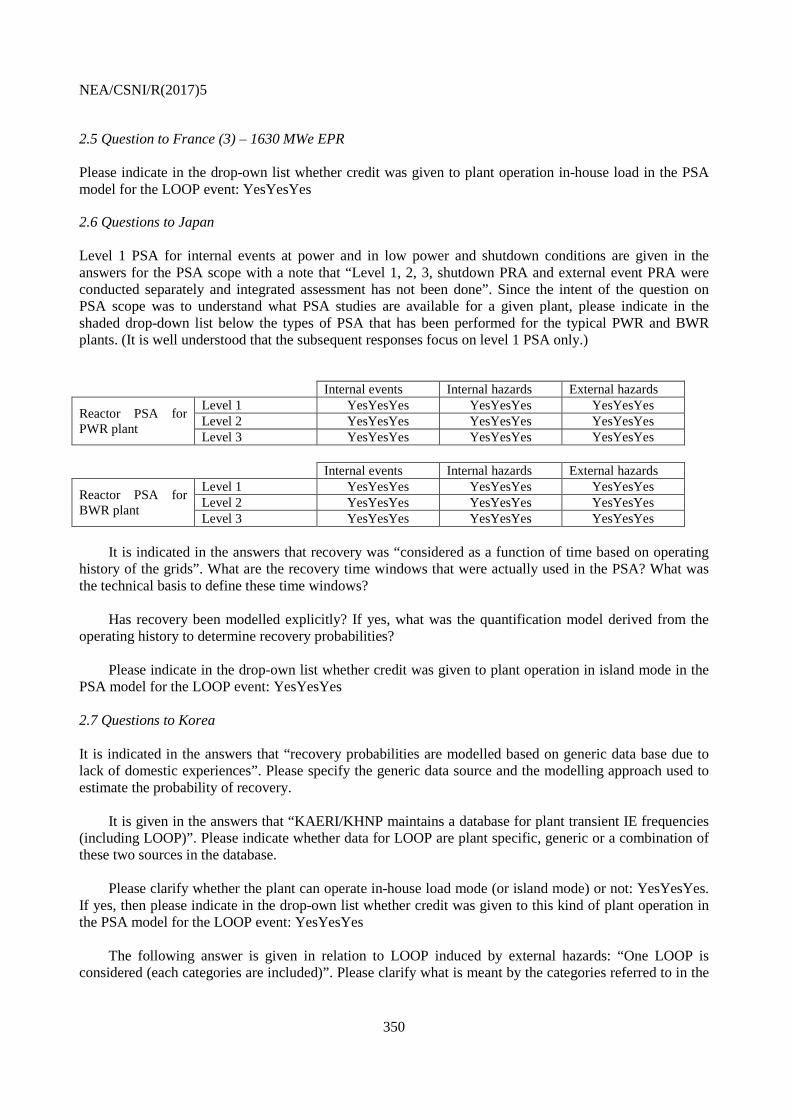
NEA/CSNI/R(2017)5
350
2.5 Question to France (3) – 1630 MWe EPR Please indicate in the drop-own list whether credit was given to plant operation in-house load in the PSA model for the LOOP event: YesYesYes
2.6 Questions to Japan Level 1 PSA for internal events at power and in low power and shutdown conditions are given in the answers for the PSA scope with a note that “Level 1, 2, 3, shutdown PRA and external event PRA were conducted separately and integrated assessment has not been done”. Since the intent of the question on PSA scope was to understand what PSA studies are available for a given plant, please indicate in the shaded drop-down list below the types of PSA that has been performed for the typical PWR and BWR plants. (It is well understood that the subsequent responses focus on level 1 PSA only.)
Internal events Internal hazards External hazards
Reactor PSA for PWR plant
Level 1 YesYesYes YesYesYes YesYesYes Level 2 YesYesYes YesYesYes YesYesYes Level 3 YesYesYes YesYesYes YesYesYes
Internal events Internal hazards External hazards
Reactor PSA for BWR plant
Level 1 YesYesYes YesYesYes YesYesYes Level 2 YesYesYes YesYesYes YesYesYes Level 3 YesYesYes YesYesYes YesYesYes
It is indicated in the answers that recovery was “considered as a function of time based on operating
history of the grids”. What are the recovery time windows that were actually used in the PSA? What was the technical basis to define these time windows?
Has recovery been modelled explicitly? If yes, what was the quantification model derived from the
operating history to determine recovery probabilities? Please indicate in the drop-own list whether credit was given to plant operation in island mode in the
PSA model for the LOOP event: YesYesYes 2.7 Questions to Korea It is indicated in the answers that “recovery probabilities are modelled based on generic data base due to lack of domestic experiences”. Please specify the generic data source and the modelling approach used to estimate the probability of recovery.
It is given in the answers that “KAERI/KHNP maintains a database for plant transient IE frequencies
(including LOOP)”. Please indicate whether data for LOOP are plant specific, generic or a combination of these two sources in the database.
Please clarify whether the plant can operate in-house load mode (or island mode) or not: YesYesYes.
If yes, then please indicate in the drop-own list whether credit was given to this kind of plant operation in the PSA model for the LOOP event: YesYesYes
The following answer is given in relation to LOOP induced by external hazards: “One LOOP is
considered (each categories are included)”. Please clarify what is meant by the categories referred to in the

NEA/CSNI/R(2017)5
351
answer. Are there external events treated explicitly in PSA? If yes, what are these external events? Has a consequential LOOP been considered in the PSA model for these external events? 2.8 Questions to Mexico In relation to the treatment recoveries and time phases it is indicated in the answers that “accident sequences in the event trees inherently contain two periods of time”. Please give some typical examples in hours for short and long time durations. Also, please briefly describe the methods and data used to model and quantify recovery.
General features of the fault trees are discussed in the answers. In order to ensure consistency and
enable comparison with responses from other countries, please specify the failure modes modelled for diesel generators (and any other active power supply equipment, as applicable) and for bus bars. 2.9 Questions to Romania Please indicate in the drop-own list whether plant operation in-house load was modelled in the PSA for the Loss of Class IV Power Supply event: YesYesYes
Mobile diesel generators introduced following the Fukushima Daiichi accident are referred to in the
description of alternate power supply sources. Please briefly describe to what extent and how these mobile diesel generators are modelled in PSA (including equipment and human failures). 2.10 Questions to Slovenia
Please indicate in the drop-own list whether credit was given to plant operation in-house load in the PSA model for the LOOP event: YesYesYes
In the description of power supply architecture and back-up power supply sources it is given that the
Krško “plant has 110 kV transmission line to the combined gas-steam power plant at Brestanica that serves as the alternate preferred source”. Please indicate whether this alternate source is modelled in the LOOP event sequences or not. If yes, how is it taken into account? 2.11 Questions to Sweden (1) – OKG studies In the answers describing the initiating events defined and analysed in the OKG studies it is indicated that ”The initiating event LOOP is called TE in OKG:s studies. Also loss of individual grids in the plant is analysed, if they leads to reactor shutdown.” Further in the answers initiating event frequencies are given as follows: frequency of Loss of 130kV for O1, frequency of Loss of 400kV for O3. Please clarify what is the actual number of power failure events treated separately as initiating events in the OKG studies for the different units and what are the corresponding definitions of these initiating events.
It is indicated in the answers that “External hazards are included implicit”. To avoid double counting
what was the modelling method used in the PSA for those external hazards that cause not only LOOP but failures of other safety-related SSCs?
What are the types of external hazards considered in the external event PSA that can cause LOOP?

NEA/CSNI/R(2017)5
352
2.12 Questions to Sweden (2) – Forsmark NPP Concerning the modelling of recovery the following answer is given: “It is dependent on IE”. Please provide further details including the actual recovery times as well as the methods and data used to model and quantify recovery.
The following answer is given concerning the estimation of initiating frequencies “Different methods
have been used for different IEs.” Please briefly describe the methods and data used for the estimation. It is indicated in the answers that “There are several other external event IEs that cause LOOP”. What
are these external events? Concerning equipment failure modes the following is given in the answers: “In detail with full
functional dependencies (electrical, area and cooling)”. In order to ensure consistency and enable comparison with responses from other countries, please specify the failure modes modelled for diesel generators (and any other active power supply equipment, as applicable) and for bus bars.
In the description of power supply architecture and back-up power supply sources it is given that “A
gas turbine is connected to the 70 kV line”. Please indicate whether this alternate source is modelled in the detailed modelling of power supply failures referred to in the answers. If yes, how is it taken into account?
A “Yes” answer is given for mission time. Please indicate the actual values of mission time in hours
as used in the LOOP PSA model. 2.13 Questions to Switzerland Among others, permanent loss of the 220 kV grid and permanent loss of both the 220 kV and the 50 kV grids are considered as initiating events. Also, it is indicated in the answers that LOOPs caused by external events are always considered unrecovered. Are there other causes than external events that are considered in the analysis as causes that lead to a permanent LOOP event?
Please indicate in the drop-own list whether credit was given to plant operation in-house load in the
PSA model for the LOOP event: YesYesYes Reference is made to an experience-based runback failure probability in the answers. Please provide
this probability, if possible. In the general description of the plant several layers of protection as “safety layers” are listed. Please
briefly describe to what extent and how these safety layers are modelled in PSA. 2.14 Question to USA – CE PWR, Large Dry Containment The LOOP frequency is as low as 2.49E-6/yr. What was the technical basis for estimating LOOP frequency?
2.15 Question to USA – GE BWR, Mark I Containment with external hazards An alternate AC (AAC) of back-up power supply source is described in the answers with a note that “This source is powered from a nearby substation and is dedicated to this plant through a series of manual breaker and switch manipulations performed at both sites”. Please briefly describe to what extent and how the use of this alternate source is modelled in the LOOP sequences.

NEA/CSNI/R(2017)5
353
USA
Task WGRISK 2013(1):
Probabilistic Safety Assessment insights relating to the loss of electrical sources
Complementary questions U.S Response
1 Questions to all countries 1.1 PSA information
Please use the shaded drop-down lists in the following table to amend the information on spent fuel
pool PSA.
Internal events Internal hazards External hazards Spent fuel pool PSA
Level 1 NoNoNo NoNoNo NoNoNo Level 2 NoNoNo NoNoNo NoNoNo
There is no SFP PRA for any of the U.S Plants presented in this survey.
1.2 Initiating event/Modelling and data The recovery of off-site power may require switch and breaker manipulations at the site depending on several factors, i.e. design features, on-site consequences of the initiating event, plant operating mode, as well as power supply configuration (e.g. bus bars out of service during maintenance) during the occurrence of LOOP.
Have you modelled recovery actions at the site explicitly in PSA? NO If yes, what was the approach used to model and quantify the required actions? The SPAR models use empirically derived time dependent curves for recovery of electrical sources.
Neither pieces of equipment (e.g. breakers, transformers) nor specific operator actions are explicitly modelled in the recoveries. Two recoveries of electrical sources are credited in the SPAR models. The first is recovery of off-site power to in-house vital buses. The second is the recovery of failed diesel generators. The credit given is based on the time to core uncovery (surrogate for core damage) for a particular scenario/sequence. 1.3 Safety improvements/mobile equipment Several countries indicate the use of mobile/portable equipment (diesels, pumps). Have you modelled explicitly this equipment in PSA? What is the approach for modelling and quantification (do you consider a human action, a delay for this action)? No modelling of mobile equipment.
1.4 Safety improvements/batteries Please indicate if some safety improvements were performed for the batteries (longer depletion time, additional charging possibilities) and how it is modelled and quantified in the PSA. No safety improvements have been performed for the batteries. Failure to recover ac power before the station
NEA/CSNI/R(2017)5
354
batteries are depleted during a station blackout event will result in core damage. The key assumption here is that the loss of power to instrumentation and circuit breaker control would make it extremely difficult for recovery after battery depletion. Criteria for crediting recovery of off-site power beyond depletion of the divisional batteries are currently being developed.
1.5 PSA results For the plants described in your initial survey response, please provide:
1. Conditional core damage probability (CCDP) for loss of off-site power initiators. Provided on the initial survey response.
2. The relative contribution of loss of off-site power initiating events to overall core damage frequency (i.e. per cent of CDF represented by loss of off-site power events). Provided on the initial survey response.
3. PSA importance measures (risk achievement worth (RAW) and Fussel-Vessely (FV)) for significant components/operator actions related to losses of off-site power. This would include the importance of alternate AC power supplies (e.g. EDG's), non-AC dependent decay heat removal equipment (e.g. steam driven makeup pumps or auxiliary feed water), human actions or other factors deemed to be significant. Provided on the initial survey response.
1.5 PSA modelling/shared equipment In case of use of shared equipment with other units, is the multi-units aspect modelled in the PSA? For example is there explicitly an unavailability of shared systems for a unit if used by another unit? Did you perform sensitivity studies as regards to benefits and drawbacks of interconnections between units? Multi-unit aspect is not modelled on the PSAs.
2 Country-specific questions 2.14 Question to USA – CE PWR, Large Dry Containment
The LOOP frequency is as low as 2.49E-6/yr. What was the technical basis for estimating LOOP frequency? The response provided to this question on the initial survey was not correct. The correct frequency for the LOOP event is 2.84E-2/yr. The 2.49E-6 provided is the contribution to CDF.
2.15 Question to USA – GE BWR, Mark I Containment with external hazards An alternate AC (AAC) of back-up power supply source is described in the answers with a note that “This source is powered from a nearby substation and is dedicated to this plant through a series of manual breaker and switch manipulations performed at both sites”. Please briefly describe to what extent and how the use of this alternate source is modelled in the LOOP sequences.
The alternate AC back-up power supply is used when in station black out. It is modelled as an event under the SBO event tree. It includes two combustion turbines to start and align to plant emergency buses (with a success criteria of ½).