
Probabilistic region failure-aware data center network and...
11
Computer Networks 103 (2016) 56–66 Contents lists available at ScienceDirect Computer Networks journal homepage: www.elsevier.com/locate/comnet Probabilistic region failure-aware data center network and content placement Lisheng Ma a,b , Xiaohong Jiang a , Bin Wu c,∗ , Achille Pattavina d , Norio Shiratori e,f a School of Systems Information Science, Future University Hakodate, 116-2, Kameda Nakano-Cho, Hakodate, Hokkaido 041-8655 Japan b School of Computer and Information Engineering, Chuzhou University, Chuzhou 239000, PR China c School of Computer Science and Technology, Tianjin University, Tianjin 300072, PR China d Department of Electronics and Information, Politecnico di Milano, Piazza Leonardo da Vinci 32, 20133 Milano, Italy e GITS, Waseda University, Tokyo 169-0051, Japan f RIEC, Tohoku University, Sendai-shi 980-8579, Japan a r t i c l e i n f o Article history: Received 12 October 2015 Revised 8 February 2016 Accepted 22 March 2016 Available online 6 April 2016 Keywords: Data center networks (DCNs) Failure probability Region failure Placement a b s t r a c t Data center network (DCN) and content placement with the consideration of potential large-scale region failure is critical to minimize the DCN loss and disruptions under such catastrophic scenario. This paper considers the optimal placement of DCN and content for DCN failure probability minimization against a region failure. Given a network for DCN placement, a general probabilistic region failure model is adopted to capture the key features of a region failure and to determine the failure probability of a node/link in the network under the region failure. We then propose a general grid partition-based scheme to flexibly define the global nonuniform distribution of potential region failure in terms of its occurring probability and intensity. Such grid partition scheme also helps us to evaluate the vulnerability of a given network under a region failure and thus to create a “vulnerability map” for DCN and content placement in the network. With the help of the “vulnerability map”, we further develop an integer linear program (ILP)- based theoretical framework to identify the optimal placement of DCN and content, which leads to the minimum DCN failure probability against a region failure. A heuristic is also suggested to make the overall placement problem more scalable for large-scale networks. Finally, an example and extensive numerical results are provided to illustrate the proposed DCN and content placement. © 2016 Elsevier B.V. All rights reserved. 1. Introduction Data center networks (DCNs), which consist of hundreds or even thousands of servers and massive storage resources, are be- coming increasingly important infrastructures to support the wide spreading cloud computing services [1,2]. In general, DCN de- sign involves the issues of DCN and content placement, path and content/service protection, QoS guarantee, etc. This paper focuses on the DCN and content placement. The DCN placement can be roughly divided into two categories, to place the components of a DCN at different nodes of a given network [3], or to place multi- ple DCNs at different nodes of a given network [4,5]. This paper concerns the latter. This work partially appeared in the HPSR 2015 conference. ∗ Corresponding author. E-mail addresses: [email protected] (L. Ma), [email protected] (X. Jiang), binwu. [email protected] (B. Wu), [email protected] (A. Pattavina), norio@Shiratori. riec.tohoku.ac.jp (N. Shiratori). It is notable that DCNs are facing more and more poten- tial large-scale disaster threats, both natural and human-made. Some recent major network disruptions due to disasters include 2012 Sandy Hurricane, 2011 Japan Tsunami, 2008 China Wenchuan earthquake, etc. [6–12]. Such disasters usually affect a specific ge- ographical region, causing failures of a set of network components and degradations or even breakdowns of vital network services [13]. For instance, China Wenchuan earthquake in 2008 leads to the damages of more than 3000 telecom offices and around 30,000 km optic cables [8]. Thus, the study of DCN and content place- ment with the consideration of region failure is critical for DCN designers to take proactive measures against the region failure in the DCN design phase. Given a network, the placement of DCN and content in the net- work with the consideration of potential region failure usually con- cerns with the following two aspects: (1) to assess the network vulnerability due to a region failure; (2) based on the network vul- nerability information, to properly place the DCN and content in the network such that the DCN failure probability due to region failure is minimized. Some works are available on the assessment http://dx.doi.org/10.1016/j.comnet.2016.03.008 1389-1286/© 2016 Elsevier B.V. All rights reserved.
Transcript of Probabilistic region failure-aware data center network and...

Computer Networks 103 (2016) 56–66
Contents lists available at ScienceDirect
Computer Networks
journal homepage: www.elsevier.com/locate/comnet
Probabilistic region failure-aware data center network and content
placement �
Lisheng Ma
a , b , Xiaohong Jiang
a , Bin Wu
c , ∗, Achille Pattavina
d , Norio Shiratori e , f
a School of Systems Information Science, Future University Hakodate, 116-2, Kameda Nakano-Cho, Hakodate, Hokkaido 041-8655 Japanb School of Computer and Information Engineering, Chuzhou University, Chuzhou 2390 0 0, PR Chinac School of Computer Science and Technology, Tianjin University, Tianjin 30 0 072, PR Chinad Department of Electronics and Information, Politecnico di Milano, Piazza Leonardo da Vinci 32, 20133 Milano, Italye GITS, Waseda University, Tokyo 169-0051, Japanf RIEC, Tohoku University, Sendai-shi 980-8579, Japan
a r t i c l e i n f o
Article history:
Received 12 October 2015
Revised 8 February 2016
Accepted 22 March 2016
Available online 6 April 2016
Keywords:
Data center networks (DCNs)
Failure probability
Region failure
Placement
a b s t r a c t
Data center network (DCN) and content placement with the consideration of potential large-scale region
failure is critical to minimize the DCN loss and disruptions under such catastrophic scenario. This paper
considers the optimal placement of DCN and content for DCN failure probability minimization against a
region failure. Given a network for DCN placement, a general probabilistic region failure model is adopted
to capture the key features of a region failure and to determine the failure probability of a node/link in
the network under the region failure. We then propose a general grid partition-based scheme to flexibly
define the global nonuniform distribution of potential region failure in terms of its occurring probability
and intensity. Such grid partition scheme also helps us to evaluate the vulnerability of a given network
under a region failure and thus to create a “vulnerability map” for DCN and content placement in the
network. With the help of the “vulnerability map”, we further develop an integer linear program (ILP)-
based theoretical framework to identify the optimal placement of DCN and content, which leads to the
minimum DCN failure probability against a region failure. A heuristic is also suggested to make the overall
placement problem more scalable for large-scale networks. Finally, an example and extensive numerical
results are provided to illustrate the proposed DCN and content placement.
© 2016 Elsevier B.V. All rights reserved.
t
r
t
S
2
e
o
a
[
t
k
m
d
t
1. Introduction
Data center networks (DCNs), which consist of hundreds or
even thousands of servers and massive storage resources, are be-
coming increasingly important infrastructures to support the wide
spreading cloud computing services [1,2] . In general, DCN de-
sign involves the issues of DCN and content placement, path and
content/service protection, QoS guarantee, etc. This paper focuses
on the DCN and content placement. The DCN placement can be
roughly divided into two categories, to place the components of a
DCN at different nodes of a given network [3] , or to place multi-
ple DCNs at different nodes of a given network [4,5] . This paper
concerns the latter.
� This work partially appeared in the HPSR 2015 conference.∗ Corresponding author.
E-mail addresses: [email protected] (L. Ma), [email protected] (X. Jiang), binwu.
[email protected] (B. Wu), [email protected] (A. Pattavina), norio@Shiratori.
iec.tohoku.ac.jp (N. Shiratori).
w
c
v
n
t
f
http://dx.doi.org/10.1016/j.comnet.2016.03.008
1389-1286/© 2016 Elsevier B.V. All rights reserved.
It is notable that DCNs are facing more and more poten-
ial large-scale disaster threats, both natural and human-made.
ome recent major network disruptions due to disasters include
012 Sandy Hurricane, 2011 Japan Tsunami, 2008 China Wenchuan
arthquake, etc. [6–12] . Such disasters usually affect a specific ge-
graphical region, causing failures of a set of network components
nd degradations or even breakdowns of vital network services
13] . For instance, China Wenchuan earthquake in 2008 leads to
he damages of more than 30 0 0 telecom offices and around 30,0 0 0
m optic cables [8] . Thus, the study of DCN and content place-
ent with the consideration of region failure is critical for DCN
esigners to take proactive measures against the region failure in
he DCN design phase.
Given a network, the placement of DCN and content in the net-
ork with the consideration of potential region failure usually con-
erns with the following two aspects: (1) to assess the network
ulnerability due to a region failure; (2) based on the network vul-
erability information, to properly place the DCN and content in
he network such that the DCN failure probability due to region
ailure is minimized. Some works are available on the assessment

L. Ma et al. / Computer Networks 103 (2016) 56–66 57
Fig. 1. U.S. national seismic hazard map.
o
z
c
a
b
v
n
p
n
a
f
i
c
p
i
t
m
t
a
p
c
t
a
s
t
t
u
t
n
c
t
f
t
w
w
o
n
u
e
u
r
v
t
w
p
c
o
t
B
a
s
f
r
p
s
a
t
a
c
q
d
r
m
d
f
h
v
S
2
a
n
2
g
t
f
t
t
u
p
f network vulnerability and identification of vulnerable network
ones due to region failure [14–18] . Based on the deterministic
ircular/line cut region failure models, the network vulnerability
ssessments are conducted in [14,15] . In [16] and [17] , a proba-
ilistic failure model and grid partition based framework are de-
eloped to efficiently estimate the network vulnerability. Recently,
etwork vulnerability assessment with the consideration of multi-
le simultaneous probabilistic failures is investigated in [18] . It is
otable that the above works on network vulnerability assessment
ll assume that both occurring probability and intensity of region
ailure(s) follow the uniform distribution in the network area. As
llustrated in Fig. 1 for U.S. national seismic hazard map [19] , we
an observe that in the real world, however, a disaster may hap-
en in different areas with different probabilities and different
ntensities.
Regarding the DCN and content placement with the considera-
ion of potential network failure(s), Xiao et al. [5] study the opti-
al DCN placement problem with service routing and protection
o minimize the network cost, while ensuring fast protection of
ll services against any single link failure or service failure at a
articular DCN. By assuming multiple region failures in fixed lo-
ations, the work in [20] concerns with the joint design of con-
ent placement, routing, and protection of paths and contents to
chieve more efficient protection of optical DCNs than dedicated
ingle-link failure protection, while the work in [21] investigates
he DCN and content placement to minimize both the DCN con-
ents unavailability due to DCN hosting nodes damage and requests
nreachability due to paths damage from disasters.
Notice that two limitations of above works on DCN and con-
ent placement are that they failed to take into account the global
onuniform distribution of potential disasters in terms of their lo-
ations and intensities, and they also did not consider the inherent
radeoff between failure probabilities of DCN hosting nodes and
ailure probabilities of requesting paths (e.g. paths between con-
ent requesting nodes and DCN hosting nodes). In a large-scale net-
ork there are multiple paths between an arbitrary pair of nodes,
hich indicates that the probability that these paths simultane-
usly fail due to disaster is very small. In contrast, if a DCN hosting
ode fails after disaster, the contents provided by this node will be
navailable and the adverse impact of such failure on the DCN is
ven greater than the path failure. Thus, the tradeoff between fail-
re probabilities of DCN hosting nodes and failure probabilities of
equesting paths should be considered. Also, since content or ser-
ice providers in DCNs wish to satisfy user demands with low la-
ency, we need to consider the traffic transmission delay issue as
ell in the DCN design.
To address the above limitations, this paper combines the
robabilistic region failure model and grid partition scheme to
apture the key features of the general nonuniform distribution
f a potential disaster in terms of its location and intensity, and
hen apply them to conduct the network vulnerability assessment.
ased on the vulnerability information of a given network for DCN
nd content placement, an optimal DCN and content placement
cheme is proposed with the consideration of the tradeoff among
ailure probabilities of DCN hosting nodes, failure probabilities of
equesting paths and traffic transmission delay. In our work, DCN
lacement is static, which is implemented at the network planning
tage for only once. However, since the information on disaster
nd content properties (e.g. content request) is time-varying, con-
ent placement can be adjusted when the information on disaster
nd content properties is updated. In general, content placement
an be optimized either periodically according to daily content re-
uests variation, or within the early warning time of an upcoming
isaster if the DCN failure risk is observed higher than the current
isk evaluation. The main contributions of our work can be sum-
arized as follows.
• We first propose a general grid partition-based scheme to eval-
uate the vulnerability of a given network due to the global
nonuniform distribution of a region failure, in which the prob-
abilistic region failure model is applied to determine the failure
probability of a node/link. Then we can create a vulnerability
map for DCN and content placement in the network.
• Based on the grid partition-based scheme and the correspond-
ing vulnerability map , we develop an integer linear program
(ILP)-based theoretical framework to achieve optimal placement
of DCN and content, which leads to minimum DCN failure prob-
ability against a region failure. To make the scheme more scal-
able for large-scale networks, a heuristic is proposed by divid-
ing the problem into two subproblems (i.e., DCN placement and
content placement).
• Extensive numerical experiments are carried out based on the
real gridded data of U.S. national seismic hazard map [22] to
demonstrate our proposed network vulnerability assessment
scheme and to validate the efficiency of the proposed ILP and
heuristic for DCN and content placement under nonuniform
spatial and intensity distribution of a potential disaster.
The rest of the paper is organized as follows. Section 2 intro-
uces the scheme for network vulnerability evaluation. The ILP
or optimal DCN and content placement and the corresponding
euristic are presented in Sections 3 and 4 , respectively. We pro-
ide the numerical results in Section 5 , and conclude this paper in
ection 6 .
. Network vulnerability evaluation
We consider a network with deployment area Z and denote it
s a graph G = (V, E) , where V is a set of nodes and E is a set of
etwork links.
.1. Probabilistic region failure model
A real-world disaster (or attack) is usually confined in a specific
eographical region. A network component (like a link or node) in
his disaster region will fail with certain probability, and such a
ailure probability depends on the intensity of failure, the distance
o failure center and also the dimension of the component (such as
he length of a link). To capture these key features of a region fail-
re, we adopt the general probabilistic region failure (PRF) model
roposed in [17] .
• PRF model definition :
(1) As illustrated in Fig. 2 , the PRF is defined by a set of consec-
utive concentric annuluses with radius r , i = 1 , . . . , m .
i
58 L. Ma et al. / Computer Networks 103 (2016) 56–66
Fig. 2. Probabilistic region failure model, m = 3.
Fig. 3. A grid partition for U.S. InternetMCI network.
i
n
t
w
t
�
H
z
w
t
p
l
w
P
2
a
i
w
t
(2) The i th annulus is associated with failure probability p i , and
such probability is monotonously decreasing with annulus,
i.e., p i ≥ p i +1 , 1 ≤ i ≤ m − 1 . Here, the region failure is only
confined within the circle area of radius r m
, beyond which
the failure probability is regarded as 0.
It is notable that under a probabilistic region failure, multiple net-
work components (e.g. nodes and links) may simultaneously fail,
but with a certain probability for each. In this paper we evaluate
failure probabilities of node and link separately without any de-
pendency between the two. Since failure probability evaluations of
nodes and links are different from each other as follows, the pro-
posed approaches can properly handle various scenarios.
Based on the PRF model, the failure probability P v for a node v
in the i th annulus can be formulated as
P v = p i . (1)
In general, a link spans multiple annuluses of a region failure,
and each annulus contains a segment of the link. Then, failure
probability of the link is determined by that of all those segments.
Therefore, the failure probability P l for a link l can be formulated
as
P l = 1 −m ∏
i =1
(1 − P l i ) , (2)
where m is the number of annuluses in the PRF model and P l i is
the failure probability of segment l i on link l that falls into the i th
annulus.
Consider a segment l i on link l that falls into the i th annulus.
We first divide such a segment into multiple shorter segments, and
each of them is approximated as a node to evaluate the failure
probability of l i . Then, the failure probability P l i for l i can be for-
mulated as
P l i = 1 − (1 − p i ) | l i | ξ , (3)
where ξ is a pre-defined factor representing the length of the
shorter segment and | l i | represents the length of segment l i . Note
that in a practical fiber-optical network, each fiber link has a set of
amplifiers. Generally, a link failure is mainly caused by failures of
those amplifiers. Similar to [18] , we can equivalently treat a seg-
ment on a particular link as a sequence of amplifiers, with each
approximated as a node to evaluate its failure probability. This ex-
plains Eq. (3) .
For example in Fig. 2 , the failure probabilities of segments on
link l are evaluated as
P l 1 = 1 − (1 − p 1 ) | l 1 | ξ ,
P l 2 = 1 − (1 − p 2 ) | l 2 | ξ ,
P l 3 = 1 − (1 − p 3 ) | l 3 | ξ , (4)
where
| l 2 | = | l 2 a | + | l 2 b | , | l 3 | = | l 3 a | + | l 3 b | . (5)
Based on link failure probability, failure probability P r for a path
r can be formulated as
P r = 1 −∏
l∈ r (1 − P l ) , (6)
where P l is the failure probability of a link l on path r .
2.2. Vulnerability metrics
To evaluate the vulnerability of a network, we consider the fol-
lowing two vulnerability metrics:
• NFP (node failure probability): The probability that a node
fails due to a PRF.
• LFP (link failure probability): The probability that a link fails
due to a PRF.
For a given network, one straight-forward approach to assess-
ng the vulnerability of a metric � is to first partition the overall
etwork area into some disjoint region failure location (RFL) zones.
• RFL zone definition : An RFL zone for a specified metric � (e.g.
NFP or LFP) is a network subarea that any PRF with center in it
will always induce the same value of � to the network.
For a specified metric � , suppose that we have already divided
he network deployment area Z into a set of disjoint RFL zones Z n ,
here a PRF in Z n induces the value � Zn of � to the network. Then
he overall metric � can be calculated as
=
∑
Z n
P Z n · � Z n . (7)
ere, P Z n denotes the probability that a PRF falls within the RFL
one Z n .
It is notable that to directly apply (7) for calculating a metric � ,
e first need to find out all RFL zones of the metric, which involves
he complicated geometric computation and quickly becomes com-
utationally intractable for a large-scale network [16,17] . In the fol-
owing section, we propose a general grid partition-based scheme,
hich helps us to flexibly define the nonuniform distribution of
RF and to efficiently estimate the vulnerability of a network.
.3. Grid partition-based vulnerability estimation
As illustrated in Fig. 3 for U.S. InternetMCI network [23] , we
pply a grid partition scheme to evenly divide the network area Z
nto M small square cells. Based on this grid partition scheme, if
e regard each cell as an “RFL” zone and take the center point of
he cell as the failure center to calculate the metric � , then we can

L. Ma et al. / Computer Networks 103 (2016) 56–66 59
g
a
f
a
t
L
A
I
O
A
I
O
n
p
m
t
t
N
t
a
a
m
a
p
3
w
n
f
Fig. 4. Vulnerability map.
Table 1
Links in the U.S. InternetMCI network.
Link number Link Link number Link Link number Link
0 (0,1) 11 (4,8) 22 (9,10)
1 (0,3) 12 (4,9) 23 (9,16)
2 (1,2) 13 (4,16) 24 (11,12)
3 (2,3) 14 (5,8) 25 (11,14)
4 (2,7) 15 (6,7) 26 (12,13)
5 (2,9) 16 (6,12) 27 (12,14)
6 (2,10) 17 (7,12) 28 (14,15)
7 (3,7) 18 (8,9) 29 (14,16)
8 (3,15) 19 (8,14) 30 (15,16)
9 (3,16) 20 (8,16) 31 (16,17)
10 (4,5) 21 (8,18) 32 (17,18)
h
fi
p
3
a
s
q
p
a
a
3
et an estimation of metric � based on (7) . Since the intensity of
disaster may be different in different regions, a PRF with center
alling within different cells may have different parameters of r i nd p i .
If we use (x Z n , y Z n ) to denote the center point of cell Z n , with
he help of the grid partition scheme the estimations of NFP and
FP are summarized as Algorithms 1 and 2 , respectively. Here, the
lgorithm 1 NFP evaluation.
nput:
Network topology information, a set of nodes V and failure
model parameters.
utput:
NF P : � NF P v evaluation for node v ∈ V .
1: for each node v in V do
2: � NF P v = 0 ;
3: for n ∈ [1 , 2 , . . . , M] do
4: calculate NF P �
v Z n
for v by using (x Z n , y Z n ) as the center
point of concentric circles in PRF model with parameters
Z para n ;
5: � NF P v = � NF P v + P Z n · �
v Z n
;
6: end for
7: end for
8: return � NF P v , v ∈ V .
lgorithm 2 LFP evaluation.
nput:
Network topology information, a set of links E and failure
model parameters.
utput:
LF P : � LF P l evaluation for link l ∈ E.
1: for each link l in E do
2: � LF P l = 0 ;
3: for n ∈ [1 , 2 , . . . , M] do
4: calculate LF P �
l Z n
for l by using (x Z n , y Z n ) as the center
point of concentric circles in PRF model with parameters
Z para n ;
5: � LF P l = � LF P l
+ P Z n · �
l Z n
;
6: end for
7: end for
8: return � LF P l , l ∈ E.
umber of square cells M , PRF model parameters Z para n and the
robability P Z n that a PRF falls within the zone Z n can be deter-
ined according to the information of real disaster data, such as
he gridded data of U.S. national seismic hazard map [22] .
It is notable that the grid partition scheme can also help us
o create a “vulnerability map” of a given network, in which the
FP for each node and LFP for each link in the network are illus-
rated. For example, for the network shown in Fig. 3 , its “vulner-
bility map” is shown in Fig. 4 (See Table 1 for link information
nd Section 5.1 for related parameter settings). Such “vulnerability
ap” will be helpful for identifying the optimal placement of DCN
nd content in the network to lead to the minimum DCN failure
robability.
. ILP for DCN and content placement
With the help of the “vulnerability map” of a given network,
e consider here the optimal DCN and content placement in the
etwork to minimize the DCN failure probability due to a region
ailure. The inherent tradeoff among failure probabilities of DCN
osting nodes, failure probabilities of requesting paths and traf-
c transmission delay is also considered in the optimal placement
roblem.
.1. Problem description
Our objective is to minimize the DCN failure probability under
region failure, in which the traffic transmission delay is also con-
idered to avoid the long communication latency between the re-
uesting node and content hosting node. We use the length of a
ath to approximate the transmission delay of the traffic along it,
nd formulate the optimal DCN and content placement problem as
n ILP problem as follows.
.2. Notation list
Inputs:
• V : The set of all nodes in network G( V, E ).
• E : The set of all links in network G( V, E ).
• V
′ : The set of DCN candidate hosting nodes, V ′ ⊆ V .
• C : The set of contents provided by DCNs.
• δ: The scaling factor for adjusting the weight among total fail-
ure probability of DCN hosting nodes, total failure probability
of requesting paths and total traffic transmission delay.
• S : The set of requesting nodes, S ⊆ V .
• R sv : The set of paths between requesting node s and DCN host-
ing node v .
• N d : The number of DCNs to be placed.
• N c : The maximum number of replicas of content c .
• N sv : The number of paths between requesting node s and DCN
hosting node v .

60 L. Ma et al. / Computer Networks 103 (2016) 56–66
U
U
U
o
(
c
m
i
n
r
c
q
r
d
r
b
s
4
s
i
a
r
4
A
b
i
V
n
n
Algorithm 3 DCN placement (DP).
Input:
G (V, E) , V ′ ⊆ V , S ⊆ V , P F s v and L s v for ∀ s ∈ S, ∀ v ∈ V ′ , P F v for
∀ v ∈ V ′ , C, δ, N d and (sc) ∈ R c : the set of connection requests
for content c ∈ C, s ∈ S.
Output:
The set of DCN hosting nodes: L .
1: L = ∅ ; Risk min = ∞ ;
2: c = arg c∈ C max {| R c |} ; 3: for each v ∈ V ′ do
4: Risk v = δP F v +
∑
(sc) ∈ R c , ∀ s ∈ S (P F s v + L s v ) ;
5: if ( Risk v < Risk min ) then
6: Risk min = Risk v ; u = v ; 7: end if
8: end for
9: L = L ⋃ { u } ;
10: while ( | L | < N d ) do
11: Risk min = ∞ ;
12: for each v ∈ (V ′ − L ) do
13: Risk v =
∑
(sc) ∈ R c , ∀ s ∈ S, ∀ c∈ C min ∀ u ∈ (L ⋃ { v } ) (P F su
14: + L su ) ;
15: Risk v = Risk v + δ∑
∀ w ∈ (L ⋃ { v } ) P F w
;
16: if ( Risk v < Risk min ) then
17: Risk min = Risk v ; v ′ = v ; 18: end if
19: end for
20: L = L ⋃ { v ′ } ;
21: end while
22: return L ;
• β: Predefined constant greater than the number of contents | C |.
• PF v : The failure probability of DCN candidate hosting node v
( �
NF P v ) obtained by “vulnerability map”.
• PF rsv : The failure probability of path r between requesting node
s and DCN hosting node v obtained by P r = 1 − ∏
l∈ r (1 − P l ) .
• PF sv : The average failure probability of paths between request-
ing node s and DCN hosting node v .
• L rsv : The length of path r between requesting node s and DCN
hosting node v .
• L sv : The average length of paths between requesting node s and
DCN hosting node v .
Variables:
• U v : Binary variable. It takes 1 if a DCN is placed at node v and
0 otherwise.
• U
c v : Binary variable. It takes 1 if content c is hosted at DCN host-
ing node v and 0 otherwise.
• U
sc v : Binary variable. It takes 1 if requesting node s requests
content c provided by DCN hosting node v and 0 otherwise.
3.3. ILP formulation
Minimize
{
δ∑
v ∈ V ′ U v P F v +
∑
v ∈ V ′
∑
s ∈ S
∑
c∈ C U
sc v (P F s v + L s v )
}
. (8)
Subject to
P F s v =
∑
r∈ R s v P F rs v
N s v , ∀ s ∈ S, ∀ v ∈ V
′ ; (9)
L s v =
∑
r∈ R s v L rs v
N s v , ∀ s ∈ S, ∀ v ∈ V
′ ; (10)
v ≥ 1
β
∑
c∈ C U
c v , ∀ v ∈ V
′ ; (11)
∑
v ∈ V ′ U v ≤ N d ; (12)
∑
v ∈ V ′ U
c v ≥ 2 , ∀ c ∈ C; (13)
∑
v ∈ V ′ U
c v ≤ N c , ∀ c ∈ C; (14)
sc v ≤ U
c v , ∀ v ∈ V
′ , ∀ s ∈ S, ∀ c ∈ C; (15)
∑
v ∈ V ′ U
sc v = 1 , ∀ s ∈ S, ∀ c ∈ C. (16)
Objective (8) (abbreviated as failure risk ) minimizes the total
failure probability of DCN hosting nodes and requesting paths, as
well as the total traffic transmission delay. The scaling factor δ is
used to control the weight among total failure probability of DCN
hosting nodes, total failure probability of requesting paths and to-
tal traffic transmission delay. Eq. (9) determines the average fail-
ure probability of paths between requesting node s and DCN host-
ing node v while Eq. (10) calculates the average length of paths
between requesting node s and DCN hosting node v . Constraint
(11) implies that if any content c is provided by a node v , then
a DCN must be placed at this node. Here, we use β larger than | C |
to ensure that constraint (11) can be properly established when
v = 1 and 1 ≤ ∑
c∈ C U
c v ≤ | C| . Constraint (12) indicates a bound
n the total number of DCNs placed in the network. Constraint
13) guarantees that any content c is replicated at least twice while
onstraint (14) limits the number of replicas of content c to its
aximum possible number. Constraint (15) ensures that if request-
ng node s requests content c provided by DCN hosting node v ,
ode v should contain content c . Constraint (16) guarantees that a
equest from node s for content c can be satisfied by only one DCN
ontaining content c .
It is notable that the content requests (i.e., connection re-
uests from requesting nodes for contents) only depend on the
equesting nodes and the amount of contents, and are indepen-
ent from the final locations of DCN and content placement. As
equesting nodes and contents are given, the content requests can
e modeled/obtained based on those given parameters by simple
tatistics.
. Heuristic
To make the overall placement problem more scalable for large-
cale networks, we propose here a heuristic to divide the problem
nto two subproblems. We first solve the DCN placement problem,
nd then consider the content placement problem by taking the
esults of DCN placement as the input.
.1. Algorithm description
The proposed heuristic is summarized in Algorithms 3 and 4 .
lgorithm 3 gives the pseudo code of DCN placement, and then
ased on the results of Algorithm 3 , the content placement scheme
s shown in Algorithm 4 . Here, the notations PF sv , L sv , PF v , N d , N c ,
′ , C, S and δ are defined in Section 3.2 , and let | B | denote the
umber of elements in an arbitrarily given set B .
DCN placement: In order to determine DCN hosting nodes, we
eed to evaluate the failure risk of each candidate DCN hosting
L. Ma et al. / Computer Networks 103 (2016) 56–66 61
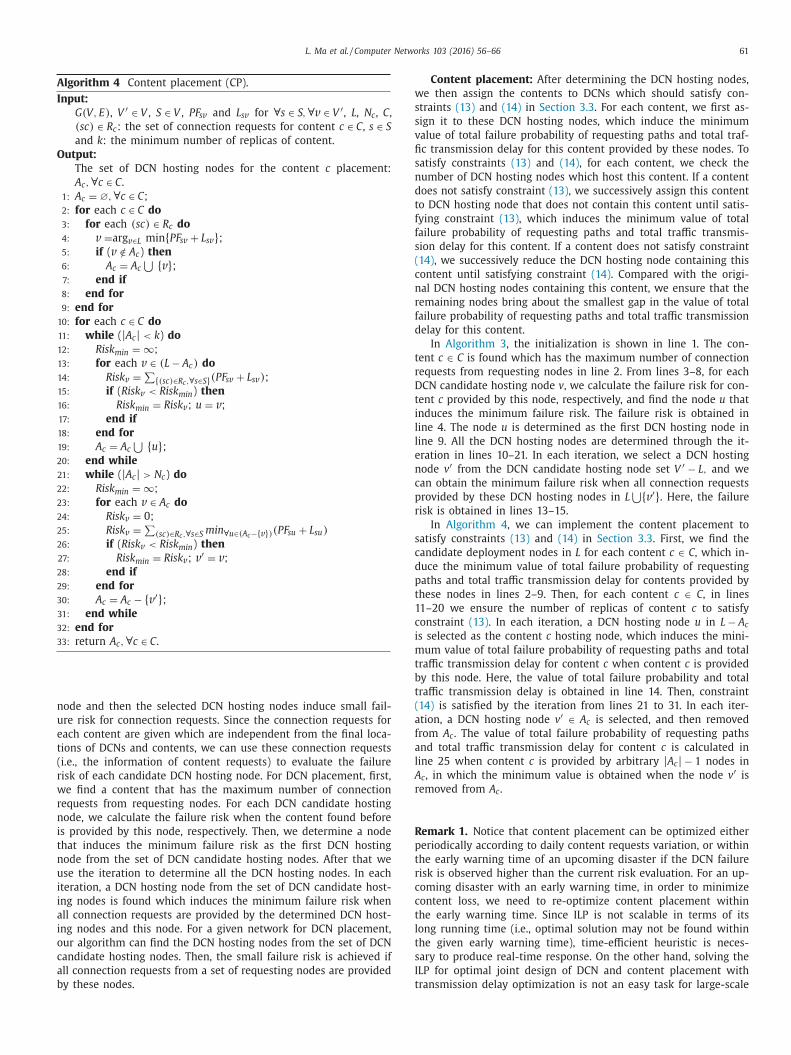
Algorithm 4 Content placement (CP).
Input:
G (V, E) , V ′ ∈ V , S ∈ V , P F s v and L s v for ∀ s ∈ S, ∀ v ∈ V ′ , L , N c , C,
(sc) ∈ R c : the set of connection requests for content c ∈ C, s ∈ S
and k : the minimum number of replicas of content.
Output:
The set of DCN hosting nodes for the content c placement:
A c , ∀ c ∈ C.
1: A c = ∅ , ∀ c ∈ C;
2: for each c ∈ C do
3: for each (sc) ∈ R c do
4: v = arg v ∈ L min { P F s v + L s v } ; 5: if ( v / ∈ A c ) then
6: A c = A c ⋃ { v } ;
7: end if
8: end for
9: end for
10: for each c ∈ C do
11: while ( | A c | < k ) do
12: Risk min = ∞ ;
13: for each v ∈ (L − A c ) do
14: Risk v =
∑
{ (sc) ∈ R c , ∀ s ∈ S} (P F s v + L s v ) ;
15: if ( Risk v < Risk min ) then
16: Risk min = Risk v ; u = v ; 17: end if
18: end for
19: A c = A c ⋃ { u } ;
20: end while
21: while ( | A c | > N c ) do
22: Risk min = ∞ ;
23: for each v ∈ A c do
24: Risk v = 0 ;
25: Risk v =
∑
(sc) ∈ R c , ∀ s ∈ S min ∀ u ∈ (A c −{ v } ) (P F su + L su )
26: if ( Risk v < Risk min ) then
27: Risk min = Risk v ; v ′ = v ; 28: end if
29: end for
30: A c = A c − { v ′ } ; 31: end while
32: end for
33: return A c , ∀ c ∈ C.
n
u
e
t
(
r
w
r
n
i
t
n
u
i
i
a
i
o
c
a
b
w
s
s
v
fi
s
n
d
t
f
f
s
(
c
n
r
f
d
t
r
D
t
i
l
l
e
n
c
p
r
s
c
d
p
t
1
c
i
m
t
b
t
(
a
f
a
l
A
r
R
p
t
r
c
c
t
l
t
s
I
t
ode and then the selected DCN hosting nodes induce small fail-
re risk for connection requests. Since the connection requests for
ach content are given which are independent from the final loca-
ions of DCNs and contents, we can use these connection requests
i.e., the information of content requests) to evaluate the failure
isk of each candidate DCN hosting node. For DCN placement, first,
e find a content that has the maximum number of connection
equests from requesting nodes. For each DCN candidate hosting
ode, we calculate the failure risk when the content found before
s provided by this node, respectively. Then, we determine a node
hat induces the minimum failure risk as the first DCN hosting
ode from the set of DCN candidate hosting nodes. After that we
se the iteration to determine all the DCN hosting nodes. In each
teration, a DCN hosting node from the set of DCN candidate host-
ng nodes is found which induces the minimum failure risk when
ll connection requests are provided by the determined DCN host-
ng nodes and this node. For a given network for DCN placement,
ur algorithm can find the DCN hosting nodes from the set of DCN
andidate hosting nodes. Then, the small failure risk is achieved if
ll connection requests from a set of requesting nodes are provided
y these nodes.
Content placement: After determining the DCN hosting nodes,
e then assign the contents to DCNs which should satisfy con-
traints (13) and (14) in Section 3.3 . For each content, we first as-
ign it to these DCN hosting nodes, which induce the minimum
alue of total failure probability of requesting paths and total traf-
c transmission delay for this content provided by these nodes. To
atisfy constraints (13) and (14) , for each content, we check the
umber of DCN hosting nodes which host this content. If a content
oes not satisfy constraint (13) , we successively assign this content
o DCN hosting node that does not contain this content until satis-
ying constraint (13) , which induces the minimum value of total
ailure probability of requesting paths and total traffic transmis-
ion delay for this content. If a content does not satisfy constraint
14) , we successively reduce the DCN hosting node containing this
ontent until satisfying constraint (14) . Compared with the origi-
al DCN hosting nodes containing this content, we ensure that the
emaining nodes bring about the smallest gap in the value of total
ailure probability of requesting paths and total traffic transmission
elay for this content.
In Algorithm 3 , the initialization is shown in line 1. The con-
ent c ∈ C is found which has the maximum number of connection
equests from requesting nodes in line 2. From lines 3–8, for each
CN candidate hosting node v , we calculate the failure risk for con-
ent c provided by this node, respectively, and find the node u that
nduces the minimum failure risk. The failure risk is obtained in
ine 4. The node u is determined as the first DCN hosting node in
ine 9. All the DCN hosting nodes are determined through the it-
ration in lines 10–21. In each iteration, we select a DCN hosting
ode v ′ from the DCN candidate hosting node set V ′ − L, and we
an obtain the minimum failure risk when all connection requests
rovided by these DCN hosting nodes in L ⋃ { v ′ } . Here, the failure
isk is obtained in lines 13–15.
In Algorithm 4 , we can implement the content placement to
atisfy constraints (13) and (14) in Section 3.3 . First, we find the
andidate deployment nodes in L for each content c ∈ C , which in-
uce the minimum value of total failure probability of requesting
aths and total traffic transmission delay for contents provided by
hese nodes in lines 2–9. Then, for each content c ∈ C , in lines
1–20 we ensure the number of replicas of content c to satisfy
onstraint (13) . In each iteration, a DCN hosting node u in L − A c
s selected as the content c hosting node, which induces the mini-
um value of total failure probability of requesting paths and total
raffic transmission delay for content c when content c is provided
y this node. Here, the value of total failure probability and total
raffic transmission delay is obtained in line 14. Then, constraint
14) is satisfied by the iteration from lines 21 to 31. In each iter-
tion, a DCN hosting node v ′ ∈ A c is selected, and then removed
rom A c . The value of total failure probability of requesting paths
nd total traffic transmission delay for content c is calculated in
ine 25 when content c is provided by arbitrary | A c | − 1 nodes in
c , in which the minimum value is obtained when the node v ′ is
emoved from A c .
emark 1. Notice that content placement can be optimized either
eriodically according to daily content requests variation, or within
he early warning time of an upcoming disaster if the DCN failure
isk is observed higher than the current risk evaluation. For an up-
oming disaster with an early warning time, in order to minimize
ontent loss, we need to re-optimize content placement within
he early warning time. Since ILP is not scalable in terms of its
ong running time (i.e., optimal solution may not be found within
he given early warning time), time-efficient heuristic is neces-
ary to produce real-time response. On the other hand, solving the
LP for optimal joint design of DCN and content placement with
ransmission delay optimization is not an easy task for large-scale

62 L. Ma et al. / Computer Networks 103 (2016) 56–66
Table 2
Parameter settings for PRF MODEL.
g from Fig. 1 r 1 r 2 p 1 p 2
0.8 100 200 0.95 0.75
0.4 60 120 0.8 0.6
0.3 50 100 0.6 0.3
0.2 25 50 0.5 0.25
Others 10 20 0.25 0.1
Fig. 5. Illustration of NFP vulnerable network zone distribution for all nodes.
t
F
s
[
g
P
a
t
a
t
a
p
f
s
N
t
a
U
v
a
o
d
c
networks. To this end, we need a time-efficient heuristic as well
for scalability.
4.2. Complexity analysis of the heuristic
In this subsection, we analyze the complexity of heuristic
DCN and content placement. The complexity of Algorithm 3 is
dominated by the iterations. The complexity in line 2 is O (| C |).
The complexity of the iteration from lines 3 to 8 is O (| V
′ | ×| R c |) and the complexity of the iteration from lines 10 to 21 is
O ((N d − 1) × (| V ′ | − 1) × | S| × | C| × N d ) . Thus, the total complexity
of Algorithm 3 is no more than O (| C | × ( N d ) 2 × | V | 2 ).
The complexity of Algorithm 4 is also dominated by the it-
erations. The complexity of the iteration in lines 2–9 is O (| C | ×max c ∈ C (| R c |) × | L |). The time for the iteration in lines 11–20
is O ((k − min c∈ C (| A c | )) × (| L | − min c∈ C (| A c | )) × max c∈ C (| R c | )) . The
time for the iteration in lines 21–31 is O ((max c∈ C (| A c | ) − N c ) ×max c∈ C (| A c | ) × max c∈ C (| R c | ) × (max c∈ C (| A c | ) − 1)) . Thus, the total
complexity of Algorithm 4 is no more than O (| C | × | N d | 3 × | V |).
From the complexities of these two algorithms, we can find that
the complexity of heuristic DCN and content placement is no more
than O (| C | × | V | 2 × ( N d ) 2 ). Thus, the proposed heuristic runs in
polynomial time.
5. Numerical results
In this section, we carry out numerical experiments based on
the gridded data of U.S. national seismic hazard map [22] . Assume
that the network is deployed in a rectangle area with length 2402
and height 1018. We first demonstrate the proposed vulnerability
assessment scheme in Section 5.1 . Based on the vulnerability in-
formation of a given network, we further validate the efficiency of
the proposed ILP in Section 5.2 and heuristic for DCN and content
placement in Section 5.3 . For DCN and content placement, Gurobi
6.0 is used to solve the ILP in (8) –(16) . We run the ILP and heuris-
tic algorithms on an Intel Core(TM) i3-4030U CPU @ 1.90 GHz and
also develop a simulator to emulate the random connection re-
quests between nodes and DCN contents. Given a network for DCN
and content placement, the simulator generates a random integer
of x between 1 and | C | as the number of content requests from
each requesting node. The simulator also ensures that each con-
tent is requested.
5.1. Vulnerability assessment
For network vulnerability assessment, we consider the U.S. In-
ternetMCI network in Fig. 3 with 19 nodes and 33 links, where the
length of the shorter segment of link ξ is fixed as 20. According to
the gridded data of U.S. national seismic hazard map, the network
area is divided into 1201 × 509 square cells with a side length 2
for each. Each PRF is defined by two concentric circles with ra-
diuses ( r 1 , r 2 ) and probabilities ( p 1 , p 2 ). Since the gridded data of
U.S. national seismic hazard map only contains the information of
grid partition and peak ground acceleration ( g ), we cannot obtain
concrete occurring probability of a PRF falling within one cell from
the gridded data of U.S. national seismic hazard map. To facilitate
the vulnerability assessment, due to the fact that the gridded data
of U.S. national seismic hazard map is obtained based on the map
in Fig. 1 with an exceedance probability of 2% in 50 years, we set
the occurring probability of a PRF falling within one cell as a ran-
dom value between 0.02 and 0.5. For the PRF with center falling
within one cell, we take the center point of the cell as the center
of the PRF and set its parameters r 1 , r 2 , p 1 and p 2 according to the
peak acceleration data ( g ) in the cell from the gridded data of U.S.
national seismic hazard map. The parameter settings are shown
in Table 2 . We compare our vulnerability assessment results with
hat in [16] and [17] and that based on simulation, respectively.
or simplicity, the vulnerability assessment based on our proposed
cheme is referred to as new scheme, while that based on [16] and
17] is referred to as old scheme. In our simulation, we randomly
enerate a location in each cell as the center of a PRF when the
RF occurs in this cell. Other parameter settings keep the same as
bove. Here, we have carried out 10 different simulations, and then
he vulnerability for nodes (or links) is evaluated by the average of
ll simulation results. For vulnerability assessment in [16] and [17] ,
he parameters r 1 , r 2 , p 1 , and p 2 of the PRF are the same and fixed
s r 1 = 50 , r 2 = 100 , p 1 = 0 . 60 , and p 2 = 0 . 30 , and the occurring
robability of a PRF falling within one cell is uniformly distributed.
Fig. 5 illustrates the NFP vulnerable network zone distributions
or all nodes under the simulation, the new scheme and the old
cheme, respectively. The results in Fig. 5 clearly indicate that the
FP vulnerable network zone distribution for all nodes based on
he new scheme generally complies with the simulation results
nd both of them match the potential earthquake distribution in
.S. as illustrated in Fig. 1 . These results show that our proposed
ulnerability assessment scheme is efficient to evaluate the vulner-
bility of nodes due to the real disaster. It is notable that since the
ld scheme does not take the global nonuniform distribution of a
isaster in terms of its occurring probability and intensity into ac-
ount, the NFP vulnerable network zone distribution for all nodes

L. Ma et al. / Computer Networks 103 (2016) 56–66 63
Fig. 6. Illustration of LFP vulnerable network zone distribution for all links.
b
n
f
n
F
a
v
n
e
i
i
b
f
w
D
R
f
n
b
u
i
u
s
5
m
a
t
W
l
Fig. 7. DCN placement scenarios.
c
s
s
c
i
t
F
a
t
n
t
1
i
n
o
t
t
p
t
ased on the old scheme is quite different from that based on the
ew scheme.
Fig. 6 shows the LFP vulnerable network zone distribution
or all links, with Fig. 6 (a) for the simulation, Fig. 6 (b) for the
ew scheme and Fig. 6 (c) for the old scheme, respectively. From
ig. 6 we can get similar conclusions as those in Fig. 5 . We can
lso observe that our proposed scheme is efficient to evaluate the
ulnerability of links due to a region failure. Based on such vul-
erable network zone distribution for all nodes or links, we can
asily identify the most vulnerable network zones, i.e., the zones
n which the PRF falling within each cell has the most significant
mpact to the network nodes or links. Since our proposed vulnera-
ility assessment can efficiently evaluate the impact to a network
rom a real disaster, “vulnerability map” based on the new scheme
ill be very helpful for us to identify the optimal placement of
CN and content in a given network against the disaster.
emark 2. In our experiments, the old scheme only takes uni-
ormly distributed data, but a real disaster generally entails the
onuniform case. The new scheme considers nonuniform distri-
ution and it covers the old scheme as a special case. By using
niform distribution for the old scheme in our experiments, we
ndeed intend to show the drawback of vulnerability assessment
nder uniform distribution, rather than comparing with the new
cheme.
.2. DCN and content placement in small-scale networks
For our proposed ILP framework for DCN and content place-
ent, we also consider the U.S. InternetMCI network with 19 nodes
nd 33 links. In our simulation, we set β = 100 and δ = 10 0 0 (i.e.,
he second DCN and content placement scenario in Section 5.4 ).
e consider 4 DCNs and 20 contents, and each content has at
east 2 and at most 3 replicas. All nodes in the network are set as
andidate placement nodes for DCNs. The “vulnerability map” for
uch network is obtained by the vulnerability assessment with the
ame parameters as in Section 5.1 . To facilitate the calculation, we
onvert the values of L sv to values between 0 and 1.
The DCN placement based on the ILP and the old vulnerabil-
ty assessment scheme is shown in Fig. 7 (a) and that based on
he ILP and the new vulnerability assessment scheme is shown in
ig. 7 (b). From Fig. 7 (a) and (b) we can find that DCNs are placed
t nodes 3, 12, 14 and 18 for the former and 3, 5, 14 and 18 for
he latter. Besides, the failure risk is 97.49 (calculated based on the
ew vulnerability information) for the former and 96.15 for the lat-
er. Although the gap of failure risk is only (97 . 49 − 96 . 15) / 96 . 15 ∼= . 39% between the above two scenarios, the total failure probabil-
ty of DCN hosting nodes can be dramatically reduced under the
ew vulnerability assessment scheme (the total failure probability
f DCN hosting nodes is 0.008111 for the former and 0.0 0 0438 for
he latter).
Fig. 7 (c) shows the DCN placement based on the heuristic solu-
ion and the new vulnerability assessment scheme. The DCNs are
laced at nodes 3, 5, 8 and 14 and the failure risk is 100.21. Thus,
he gap of failure risk between the ILP and heuristic under the

64 L. Ma et al. / Computer Networks 103 (2016) 56–66
Table 3
Content placement in DCNs for ILP and heuristic.
ILP Heuristic
DCNs Contents DCNs Contents
3 0,1,3,4,5,8,10,11 3 0,1,3,4,5,8,10,11,12
12,13,14,16,17 13,14,15,16,17
5 0,3,4,5,7,8,9,11 5 0,3,4,5,7,8,9,11
12,13,15,19 12,13,15,19
14 1,2,3,4,5,6,7,8,9,10,11 8 0,1,2,6,7,8,10,13
13,14,15,16,17,18,19 16,17,18,19
18 0,1,2,6,7,9,12 14 1,2,3,4,5,6,7,9,10,11,12
15,16,18,19 14,15,16,17,18,19
Table 4
Performance analysis in large-scale network with four DCNs and different
numbers of contents for ILP and heuristic.
| C | ILP Heuristic
Failure risk Running time (s) Failure risk Running time (s)
10 60.74 16.64 68.86 0.44
20 115.43 181.61 128.55 0.51
30 163.03 242.99 185.96 0.53
40 210.15 476.88 228.55 0.56
50 264.74 3297.55 286.57 0.59
Table 5
Performance analysis in large-scale network with ten contents and different
numbers of DCNs for ILP and heuristic.
N d ILP Heuristic
Failure risk Running time (s) Failure risk Running time (s)
4 60.74 16.64 68.86 0.44
8 60.45 12.11 74.66 0.56
12 60.67 11.86 76.76 0.61
16 60.94 11.83 79.85 0.71
20 61.21 12.62 80.32 0.8
24 61.49 11.95 78.24 0.88
28 61.77 12.02 80.05 1.04
32 62.05 12.38 79.66 1.039
36 62.34 10.39 80 1.22
40 62.62 10.14 78.22 1.49
Table 6
Tradeoff between DFP and PF P + T D .
Placement scenarios DFP PFP TD
1 0.008111 19.31 70.07
2 0.0 0 0438 20.73 74.98
3 0.0 0 0329 22.31 79.69
4 0.0 0 0283 23.7 84.29
5 0.0 0 0282 24.54 87.26
t
p
5
t
a
l
a
s
a
6 ∑
o
w
(
i
t
d
6
g
d
e
d
a
o
o
m
T
t
s
s
w
t
new vulnerability assessment scheme is (100 . 21 − 96 . 15) / 96 . 15 ∼=4 . 22% . The contents hosted at each DCN are shown in Table 3 for
ILP and heuristic under the new vulnerability assessment scheme,
respectively. Table 3 shows that the same DCN hosting node de-
termined by the ILP and heuristic contains similar contents. From
Figs. 4 and 5 , we can also find that the DCN hosting nodes based
on the ILP and heuristic under the new vulnerability scheme avoid
the nodes with high NFP and the most vulnerable network zones
for all nodes. Besides, under the new vulnerability assessment
scheme we also have carried out other experiments for 10 differ-
ent groups of connection requests generated randomly with similar
network size. The average gap of failure risk between the ILP and
heuristic is 3.5%, which confirms the superior performance of the
proposed heuristic.
5.3. DCN and content placement in large-scale networks
To verify the performance of our proposed heuristic for large-
scale networks under the new vulnerability assessment scheme,
we randomly generate a network by simulator with 100 nodes and
202 links. In order to reduce the complexity, in this experiment we
only consider link-disjoint k -shortest paths between an arbitrary
pair of nodes to implement routes ( k = 3). The “vulnerability map”
for this network is obtained in a similar way as that of U.S. Inter-
netMCI network. Except the number of DCNs and contents to be
placed, other parameter settings are similar to those in Section 5.2 .
The performance of ILP and heuristic for the cases | C | = {10, 20,
30, 40, 50} are summarized in Table 4 when the number of DCNs
to be placed is 4. In Table 5 , we show the performance of ILP and
heuristic for the cases N d = {4, 8, 12, 16, 20, 24, 28, 32, 36, 40}
when the number of contents to be placed is 10. From Tables 4 and
5 , we can observe that our proposed heuristic is more scalable, and
the ILP is sensitive to | C |. Table 5 also shows that the running time
of ILP decreases and that of heuristic increases when N d increases,
but the running time of heuristic increases slowly. Besides, from
Tables 4 and 5 we can find that although the gaps of failure risk
between the ILP and heuristic vary with the increases of | C | and N d ,
their sensitivities to the variations of | C | and N d are different. For a
fixed number of DCNs to be placed of N d = 4 and when we increase
the number of contents to be placed | C | from 10 to 50, the average
gap of failure risk is 11.2%. When we increase the number of DCNs
o be placed N d from 4 to 40 at a fixed number of contents to be
laced of | C | = 10, the average gap of failure risk is 26.4%.
.4. Effect of δ on DCN and content placement
The scaling factor δ is used to control the weight among the to-
al failure probability of DCN hosting nodes, the total failure prob-
bility of requesting paths and the total traffic transmission de-
ay. Thus, for different values of δ, we can obtain different DCN
nd content placement scenarios. Considering the ILP with same
imulation settings in Section 5.2 , for different values of δ, there
re five different DCN and content placement scenarios. In Table
, we show the total failure probability of DCN hosting nodes
v ∈ V ′ U v P F v (abbreviated as DFP ) and the total failure probability
f requesting paths ∑
v ∈ V ′ ∑
s ∈ S ∑
c∈ C U
sc v P F s v (abbreviated as PFP ) as
ell as the total traffic transmission delay ∑
v ∈ V ′ ∑
s ∈ S ∑
c∈ C U
sc v L s v
abbreviated as TD ) for five DCN and content placement scenar-
os, respectively. From Table 6 , we can find a desirable tradeoff be-
ween DFP and P F P + T D by adjusting the value of δ in the DCN
esign phase.
. Conclusions
We studied the DCN and content placement problem under
lobal nonuniform distribution of potential region failure due to
isaster in large-scale geographical areas. By proposing a gen-
ral grid partition-based vulnerability estimation scheme, we can
etermine the “vulnerability map” of a given network for DCN
nd content placement, which provides an important input for
ur proposed ILP and heuristic. Based on the vulnerability map,
ur proposed ILP can generate optimal DCN and content place-
ent solutions to minimize the DCN failure risk due to disaster.
his achieves best-effort protection of DCN and content against
he region failure. To make our solution more scalable for large-
cale networks, a heuristic was further proposed. Numerical results
howed that our work can lead to a more feasible solution. It can
ell protect DCN and content under global nonuniform distribu-
ion of the potential region failure scenario.
L. Ma et al. / Computer Networks 103 (2016) 56–66 65
o
e
S
J
e
R
t
U
R
[
[
[
Acknowledgments
This work was supported in part by the Natural Science Fund
f China (no. 61372085 ), the Key Project of Anhui University Sci-
nce Research (nos. KJ2015A285 and KJ2015A190), the Natural
cience Foundation of Anhui Province (no. 1508085MF123 ), the
apan Society for the Promotion of Science Grants-in-Aid for Sci-
ntific Research (A), 2015 (no. 26240012 ), the Professor Scientific
esearch Foundation of Chuzhou University (no. 2014qd013) and
he Talented Team of Computer System Architecture of Chuzhou
niversity.
eferences
[1] K. Chen , C. Guo , H. Wu , J. Yuan , Z. Feng , Y. Chen , S. Lu , W. Wu , Dac: Generic
and automatic address configuration for data center networks, IEEE/ACM Trans.Netw. 20 (1) (2012) 84–99 .
[2] M. Bari , R. Boutaba , R. Esteves , L. Granville , M. Podlesny , M. Rabbani , Q. Zhang ,
M. Zhani , Data center network virtualization: A survey, IEEE Commun. Surv.Tutor. 15 (2) (2013) 909–928 .
[3] J. Xiao , B. Wu , X. Jiang , A. Pattavina , H. Wen , L. Zhang , Scalable data centernetwork architecture with distributed placement of optical switches and racks,
IEEE/OSA J. Opt. Commun. Netw. 6 (3) (2014) 270–281 . [4] X. Dong , T. EI-Gorashi , J. Elmirghani , Green IP over WDM networks with data
centers, IEEE/OSA J. Lightw. Technol. 29 (12) (2011) 1861–1880 .
[5] J. Xiao , H. Wen , B. Wu , X. Jiang , P.-H. Ho , L. Zhang , Joint design on DCN place-ment and survivable cloud service provision over all-optical mesh networks,
IEEE Trans. Commun. 62 (1) (2014) 235–245 . [6] K. Tanaka, Y. Yamazaki, T. Okazawa, T. Suzuki, T. Kishimoto, K. Iwata, Exper-
iment on seismic disaster characteristics of underground cable, in: The 14thWorld Conference on Earthquake Engineering, Beijing, China, October 12-17,
20 08 . http://www.iitk.ac.in/nicee/wcee/article/14 _ 06-0 069.PDF .
[7] A. Kwasinski , W.W. Weaver , P.L. Chapman , P.T. Krein , Telecommunicationspower plant damage assessment for hurricane katrina-site survey and fol-
low-up results, IEEE Syst. J. 3 (3) (2009) 277–287 . [8] Y. Ran , Considerations and suggestions on improvement of communication
network disaster countermeasures after the wenchuan earthquake, IEEE Com-mun. Mag. 49 (1) (2011) 44–47 .
[9] K. Morrison , Rapidly recovering from the catastrophic loss of a major telecom-
munications office, IEEE Commun. Mag. 49 (1) (2011) 28–35 .
[10] T. Adachi , Y. Ishiyama , Y. Asakura , K. Nakamura , The restoration of telecompower damages by the Great East Japan Earthquake, in: IEEE 33rd International
Telecommunications Energy Conference, IEEE, Amsterdam, Netherlands, Octo-ber 9-13, 2011, pp. 1–5 .
[11] Flooding, power outages from hurricane sandy lead to internet, phoneservice disruptions, 2012, ( http://www.nypost.com/p/news/business/flooding _
from _ hurricane _ sandy _ leads _ CG8gj1SSEenIcuZzj1yRbM ). [12] A. Kwasinski, Lessons from field damage assessments about communi-
cation networks power supply and infrastructure performance during
natural disasters with a focus on hurricane sandy, in: FCC WorkshopNetwork Resiliency, Brooklyn, New York, NY, USA, February 5-6, 2013 .
http://users.ece.utexas.edu/ ∼kwasinski/1569715143%20Kwasinski%20paper% 20FCC-NR2013%20submitted.pdf .
[13] B. Mukherjee , M.F. Habib , F. Dikbiyik , Network adaptability from disaster dis-ruptions and cascading failures, IEEE Commun. Mag. 52 (5) (2014) 230–238 .
[14] S. Neumayer , E. Modiano , Network reliability with geographically correlated
failures, in: IEEE INFOCOM, IEEE, San Diego, CA, USA, March 15-19, 2010,pp. 1–9 .
[15] S. Neumayer , G. Zussman , R. Cohen , E. Modiano , Assessing the vulnerabilityof the fiber infrastructure to disasters, IEEE/ACM Trans. Netw. 19 (6) (2011)
1610–1623 . [16] J. Liu , X. Jiang , H. Nishiyama , N. Kato , Reliability assessment for wireless mesh
networks under probabilistic region failure model, IEEE Trans. Vehic. Technol.
60 (5) (2011) 2253–2264 . [17] X. Wang , X. Jiang , A. Pattavina , Assessing network vulnerability under proba-
bilistic region failure model, in: IEEE 12th International Conference on HighPerformance Switching and Routing, IEEE, Cartagena, Spain, July 4-6, 2011,
pp. 164–170 . [18] P. Agarwal , A. Efrat , S. Ganjugunte , D. Hay , S. Sankararaman , G. Zussman , The
resilience of WDM networks to probabilistic geographical failures, IEEE/ACM
Trans. Netw. 21 (5) (2013) 1525–1538 . [19] 2014 U.S. Geological National Seismic Hazard Maps, 2014, ( http://earthquake.
usgs.gov/hazards/products/conterminous/index.php#2014 ). 20] M.F. Habib , M. Tornatore , M.D. Leenheer , F. Dikbiyik , B. Mukherjee , Design of
disaster-resilient optical datacenter networks, IEEE/OSA J. Lightw. Technol. 30(16) (2012) 2563–2573 .
[21] S. Ferdousi , F. Dikbiyik , M.F. Habib , M. Tornatore , B. Mukherjee , Disaster-aware
datacenter placement and dynamic content management in cloud networks,IEEE/OSA J. Opt. Commun. Netw. 7 (7) (2015) 681–694 .
22] 2014 U.S. Geological National Seismic Hazard Map Gridded Data, 2014,( http://earthquake.usgs.gov/hazards/products/conterminous/2014/data/
2014 _ pga2pct50yrs.dat.zip ). 23] InternetMCI Network, 2011, ( http://www.topology-zoo.org/dataset.html ).

66 L. Ma et al. / Computer Networks 103 (2016) 56–66
mputer science and technology from Taiyuan Normal University, China in 2004 and from
rrently working towards the Ph.D. degree at the School of Systems Information Science, ber at the School of Computer and Information Engineering, Chuzhou University, China.
a center networks.
all from Xidian University, China. He is currently a full professor of Future University
u University, Japan, from February 2005 to March 2010, an assistant professor in Japan m October 2001 to January 2005. He was a JSPS research fellow at JAIST from October
ity of Edinburgh from March 1999to October 1999. His research interests include com- ks, optical networks, etc. He has published more than 260 technical papers at premium
r 50 papers published in IEEE journals like IEEE/ACM Transactions on Networking, IEEE
s the winner of the Best Paper Award and Outstanding Paper Award of IEEE HPCC 2014, l Networking Symposium, and IEEE/IEICE HPSR 2002. He is a senior member of IEEE and
al and electronic engineering from The University of Hong Kong (Pokfulam, Hong Kong)
m 2007 to 2012 in the ECE Department, University of Waterloo (Waterloo, Canada). He d Technology, Tianjin University (Tianjin, China). His research interests include computer
design.
nic engineering from University La Sapienza of Rome (Italy) in 1977, where he worked itecnico di Milano, Milano (Italy). He has been author/coauthor of more than 300 papers
ing international journals/conferences. He has been engaged in many research activities,
ed two books, Switching Theory, Architectures and Performance in Broadband ATM Net- orks (McGraw-Hill, 2007, in Italian). He has been an editor for Switching Architecture
from 1994 to 2011 and editor-in-chief of the Wiley European Transactions on Telecom- of the IEEE Communications Society. His current research interests include the area of
ing and broadband convergent access/metro networks.
ofessor at the RIEC (Research Institute of Electrical Communication), Tohoku University, Hakodate and a Visiting Professor of Chuo University, Japan. He is a fellow of the IEEE
J (Information Processing Society of Japan) and the IEICE (The Institute of Electronics, resident of the IPSJ from 2009 to 2011. He has published more than 15 books and over
lds. He was the recipient of the “IPSJ Memorial Prize Winning Paper Award” in 1985, oration Award” in 1991, the “Best Paper Award of ICOIN-9” in 1994, the “IPSJ Best Paper
nt “Outstanding Paper Award of UIC-07” in 2007.
Lisheng Ma received the B.S. and M.S. degrees both in co
Southwest University, China in 2007, respectively. He is cuFuture University Hakodate, Japan and is also faculty mem
His research interests include switching networks and dat
Xiaohong Jiang received the B.S., M.S. and Ph.D degrees
Hakodate, Japan. He was an associate professor of TohokAdvanced Institute of Science and Technology (JAIST), fro
1999 to 2001. He was a research associate in the Universputer communications networks, mainly wireless networ
international journals and conferences, which include ove
Journal of Selected Areas on Communications, etc. He waIEEE WCNC 2012, IEEE WCNC 2008, IEEE ICC 2005 Optica
a member of ACM and IEICE.
Bin Wu (S’04–M’07) received the Ph.D. degree in electric
in 2007. He worked as a postdoctoral research fellow frois now a professor in the School of Computer Science an
systems and networking as well as communication system
Achille Pattavina received the Dr. Eng. degree in electrountil 1991. Since 1995, he has been a full professor in Pol
in the area of communications networks published in lead
including European Union funded projects. He has authorworks (New York: Wiley, 1998) and Communication Netw
Performance of the IEEE Transactions on Communicationsmunications from 2001 to 2010. He is a senior member
green ICT and cloud computing, software defined network
Norio Shiratori is currently an emeritus and research prJapan. He is also a board member of Future University of
(Institute of Electrical and Electronic Engineers), the IPSInformation and Communication Engineers). He was the p
400 refereed papers in computer science and related fiethe “Telecommunication Advancement Foundation Incorp
Award” in 1997, and many others including the most rece