Discriminative MLE training using a product of Gaussian Likelihoods

Nat. Hazards Earth Syst. Sci., 11, 1293–1302, 2011www.nat-hazards-earth-syst-sci.net/11/1293/2011/doi:10.5194/nhess-11-1293-2011© Author(s) 2011. CC Attribution 3.0 License.
Natural Hazardsand Earth
System Sciences
Probabilistic assessments of climate change impacts on durumwheat in the Mediterranean region
R. Ferrise1, M. Moriondo 1, and M. Bindi2
1IBIMET-CNR, Florence, Italy2DiPSA, University of Florence, Florence, Italy
Received: 23 December 2009 – Revised: 31 March 2010 – Accepted: 8 April 2011 – Published: 9 May 2011
Abstract. Recently, the availability of multi-model ensem-ble prediction methods has permitted a shift from a scenario-based approach to a risk-based approach in assessing the ef-fects of climate change. This provides more useful infor-mation to decision-makers who need probability estimates toassess the seriousness of the projected impacts.
In this study, a probabilistic framework for evaluatingthe risk of durum wheat yield shortfall over the Mediter-ranean Basin has been exploited. An artificial neural net-work, trained to emulate the outputs of a process-based cropgrowth model, has been adopted to create yield response sur-faces which are then overlaid with probabilistic projectionsof future temperature and precipitation changes in order toestimate probabilistic projections of future yields. The riskis calculated as the relative frequency of projected yields be-low a selected threshold.
In contrast to previous studies, which suggest that thebeneficial effects of elevated atmospheric CO2 concentrationover the next few decades would outweigh the detrimentaleffects of the early stages of climatic warming and drying,the results of this study are of greater concern.
1 Introduction
Durum wheat is a rain-fed crop that is widely cultivated overthe Mediterranean Basin. The major climatic constraintsto durum wheat yield in Mediterranean environments arehigh temperatures and drought, frequently occurring duringthe crop’s growth cycle (Porter and Semenov, 2005; Garcıadel Moral et al., 2003). As a consequence, projected cli-mate changes in this region, in particular rising temperaturesand decreasing rainfall (Gibelin and Deque, 2003), may se-
Correspondence to:R. Ferrise([email protected])
riously compromise durum wheat yields, representing a se-rious threat to the cultivation of this typical Mediterraneancrop.
Crop growth models have been widely used to evaluatecrop responses (development, growth and yield) to climatechange impact assessments by combining future climate con-ditions, obtained from General or Regional Circulation Mod-els, with simulations of CO2 physiological effects, derivedfrom crop experiments (see Downing et al., 2000; Ainsworthand Long, 2005). Since future scenarios typically have no as-sociated likelihood, to investigate the uncertainties in futureimpacts, the effects of climate change are usually estimatedover a number of scenarios representing a range of uncertain-ties as realistic as possible (Mearns et al., 2001).
Recently, the availability of multi-model ensemble predic-tion methods (e.g. Murphy et al., 2007; Tebaldi and Knutti,2007) has permitted the assignment of likelihoods to fu-ture climate projections. This has allowed a move from thescenario-based approach to a risk-based approach in assess-ing the effects of climate change (New et al., 2007), pro-viding more useful information to decision-makers, who, asreported by Schneider (2001), need probability estimates toassess the seriousness of the projected impacts.
A probabilistic framework for evaluating crop responsesto climate change involves performing a multi-simulation bylinking impact models (such as crop growth models) to avery large number of climate projections, so as to providea probabilistic distribution of the variable selected in orderto evaluate the impact (Fronzek et al., 2010). By compar-ing the outputs of a multi-simulation with a critical threshold(such as the minimum yield below which it is not admissi-ble to fall), it is possible to evaluate the risk related to futureclimate conditions. Unfortunately, such an approach is time-consuming, due to the large number of model runs neededfor the procedure. An alternative method relies on settingup impact response surfaces (Jones, 2000; Tebaldi and Lo-bell, 2008) with respect to key climatic variables on which a
Published by Copernicus Publications on behalf of the European Geosciences Union.

1294 R. Ferrise et al.: Probabilistic assessments of climate change impacts on durum
probabilistic representation of projected changes in the sameclimatic variables may be overlaid.
This approach has been exploited in the ENSEMBLESFP6 EU Project, which aims to assess the climate changeimpact on typical Mediterranean crops. This study focuseson the assessment of the risk of durum wheat (T. turgidumL.subsp.durum(Desf.) Husn) yield falling below fixed thresh-olds in the Mediterranean Basin.
2 Materials and methods
To perform the probabilistic assessment of climate changeimpact on durum wheat yield, the procedure adopted in-volved the following steps:
1. Calibration and validation of a mechanistic durumwheat crop growth model.
2. Simplification of the mechanistic model using an Arti-ficial Neural Network (ANN) to link the model outputsto some key climatic and management variables.
3. Creation of impact Response Surfaces (RSs) for durumwheat over the case study area, altering the baseline cli-mate with respect to key climatic variables (e.g. Tem-perature (Temp), and Precipitation (Prec), CO2).
4. Assessing the risk of yield shortfall using future prob-abilistic projections for the A1B scenario provided bythe Met-Office Hadley Centre.
5. Generation of maps of future risk of durum wheat yieldshortfall.
2.1 Durum wheat impact model calibration andvalidation
The Sirius Quality v1.1 model (SIRIUS) was calibrated andvalidated to simulate winter durum wheat yield. SIRIUS isa wheat simulation model that calculates biomass produc-tion from intercepted photosynthetically active radiation andgrain growth from simple partitioning rules (Jamieson et al.,1998). The model accounts for the enhanced CO2 effect bylinearly increasing radiation use efficiency (RUE), so that fora doubling of CO2 air concentration the RUE is increased by30% (Jamieson et al., 2000). A simple soil sub-model is usedfor the dynamics of water and nitrogen (N) in the ground. Asinputs, the model needs daily weather data consisting of min-imum temperature (T min), maximum temperature (T max),Prec and global radiation (Rad). It allows the user to specifymanagement parameters such as the sowing date, cultivar ge-netic coefficients (e.g. photoperiodic sensitivity, duration ofgrain filling, minimum and maximum potential leaf numbers,etc.), soil profile properties (e.g. soil hydrological properties,thickness, initial water and nitrogen content, etc.), fertilizerand irrigation management, and atmospheric CO2 concentra-tion.
The SIRIUS model, originally developed for bread wheat,was calibrated to reproduce a general winter durum wheatcrop with a medium growing cycle and few vernalization re-quirements. The calibration was performed using data fromtwo open-field experimental trials carried out in Florence(Italy, 11.11◦ E, 43.3◦ N) in 2003–2005 (Triossi, 2006). Thethermal time of the main phenological phases (e.g. from sow-ing to emergence and grain-filling duration), plant day-lengthresponse (leaf production per hour of daylight), minimumand maximum leaf numbers, and phyllochrone and vernali-sation parameters were the variables calibrated according toexperimental evidence.
The accuracy of the calibrated model in reproducing theobserved yields was tested on both the local and regionalscale to ensure its general applicability. On the local scale,phenological and yield data from 3 sites located in the north(Milano, 9.3◦ E, 45.4◦ N), middle (Roma, 12.2◦ E, 41.8◦ N)and south (Foggia, 15.7◦ E, 41.5◦ N) of the Italian peninsulawere used as an independent data set. Yield and phenologicaldata, soil properties and crop management data (e.g. sowingdate, amount and splitting of N fertilisation) were providedby the Istituto Sperimentale per la Cerealicoltura for the pe-riods 1999–2003 for Milano and Roma and 2000–2004 forFoggia. For each site, daily values ofT min, T max, Prec andRad were obtained by the Italian Meteorological Service.
In order to analyse the performance of SIRIUS in sim-ulating yield on the regional scale, the model was run fora selected number of places evenly distributed across theMediterranean Basin. The outputs of the model were com-pared with the observed yield data for durum wheat, obtainedby the Statistical Office of the European Commission. Thisdataset has a different time series according to the countryand the crop considered: in general, longer time series wereavailable from 1989 to 2004, but in some cases they werelimited to 6 yr.
A complete series of observed 50 km daily interpolatedmeteorological data (T min, T max, Prec and Rad), extractedfrom Monitoring Agricultural ResourceS (MARS) of theJoint Research Centre (JRC) archive (MARS, 2009), wasprocessed and adapted to the requirements of the weatherfiles managed by the SIRIUS model.
Since crop management practices are not retrievable onsuch a spatial scale, a climatic criterion was adopted to iden-tify the optimum sowing date: sowing was matched with thepoint when the mean temperature fell below 13◦C for 5 con-secutive days and rainfall was<2 mm in the period between1 October and 15 February. Nitrogen fertilization was set at100 kg N ha−1, split in two applications: 1/3 during tillering(beginning of March) and 2/3 at shooting (mid April).
Nat. Hazards Earth Syst. Sci., 11, 1293–1302, 2011 www.nat-hazards-earth-syst-sci.net/11/1293/2011/

R. Ferrise et al.: Probabilistic assessments of climate change impacts on durum 1295
2.2 Emulating the SIRIUS model outputs
To reduce the computing time needed to apply the procedureover such a wide area as the Mediterranean Basin and for sev-eral time slices, an ANN was adopted to simplify the SIRIUSmodel.
The ANN is a computer system based on several sim-ple and highly interconnected processing elements similar tothe neural architecture of the human brain (McClelland andRumelhart, 1986) and it was adopted to exploit the non-linearrelationship between predictor variables (climate, soil, man-agement) and SIRIUS outputs. The ANN approach is beingused in several disciplines (Widrow et al., 1994) because ofits ability to perform non-linear modelling without a prioriknowledge about the relationships between input and outputvariables (Bindi and Maselli, 2001; Zhang et al., 1998).
The ANN structure adopted was a multilayer perceptron(MLP) with a feed-forward configuration. This structure, se-lected because of its capacity to solve climate problems, hasbeen well demonstrated in several previous studies (Gardnerand Dorling, 1998; Trigo and Palutikof, 1999). More specif-ically, in this study, an ANN-MLP structure with three lay-ers and 20 hidden nodes was selected. A non-linear transferfunction (log-sigmoid) was selected for all nodes and layers,and a back-propagation algorithm (Rumelhart et al., 1986)was used for training the ANN. The optimal number of hid-den nodes (over a range of 5–25 with a 5-node step) and thecorrect learning rate and momentum were determined by car-rying out a sensitivity analysis (Moriondo and Bindi, 2006).
The ANN was trained using the outputs from SIRIUS ob-tained for a wide range of climate, soil and managementpractices in order to reproduce yield variability over theMediterranean domain. Daily climatic data for Temp, Precand Rad for a 30-year period (1975–2005) were extractedfrom the MARS-JRC archive. Nine grid cells, representa-tive of the climatic variability of the Mediterranean Basin,with particular attention to the winter and spring regime ofTemp and Prec, were first selected. For this purpose, all gridpoints in the study area were grouped with respect to annual,winter and spring total Prec and mean Temp, using K-meanscluster analysis. Within each group, one grid point was ran-domly selected to perform a scenario sensitivity analysis bychanging daily Temp and Prec from−2◦C to +10◦C (2◦Cstep) and from –60% to +40% (20% step), respectively. Theselected grid cells and the central values of Temp and Precof the corresponding class resulting from the cluster analysisare summarized in Table 1.
For each combination of Temp and Prec changes, the SIR-IUS model was run for 5 different CO2 concentration lev-els (from 350 ppm to 750 ppm, with 100 ppm step), 3 differ-ent soil types (Table 2) and 3 N fertilization rates (110, 170and 230 kg N ha−1). For each of the 17 010 resulting com-binations (7 Temp× 6 Prec× 5 CO2 × 3 soils× 3 N fertiliza-tion rates× 9 grid cells), the average grain yield over the 30-
year period was calculated from the output of the SIRIUSmodel and used as predictand variables for training the ANN.
The predictor variables for the ANN training were selectedconsidering the approach proposed by Olesen et al. (2007).Five input variables were selected to take into account theeffects of soil, crop management and climate conditions andused as predictors to train the ANN over the 9 grid points:
– Soil water content (SWC), calculated as the differencebetween field capacity and wilting point, in mm
– Nitrogen fertilization rate, in kg N ha−1
– CO2 concentration, in ppm
– T (AMJ): mean spring temperature (April, May, June)
– P (AMJ): cumulated spring rainfall.
At the onset, data for all seasons were considered as predic-tors, but those related to spring had the best predicting perfor-mances. Dropping the variables relevant to winter, summerand autumn did not affect the predictive accuracy of the ANNand at the same time increased ANN computation efficiencyduring the training phase.
As with any other statistical model, ANNs should gener-ally be trained (calibration) and tested (validation) using 2independent data sets. In this paper, two different strategieswere used to derive the subsets for calibration and validation,namely simple validation and cross validation. In the firstcase, the ANN was trained using a random selection fromthe initial dataset (80%) while the remaining 20% was usedas independent data to test its efficiency. The second valida-tion strategy consisted of a Leave-One-Out cross-validationtest in which one site in turn was omitted from the trainingsubset and used to test the ANN efficiency. In order to avoidover-fitting problems, both strategies included internal test-ing during the calibration phase, which was performed on20% of the training subset used as independent data.
The accuracy of the SIRIUS and the ANN model in simu-lating durum wheat yield was calculated using: (1) root meansquare error (RMSE); (2) mean absolute error (MAE) and (3)Pearson’s correlation coefficient.
2.3 Case study area and impact response surfaces
The domain included in the window 34.2◦ – 46.0◦ Lat N and−9.5◦ – 28.2◦ Lon E was selected as the case study area toperform the probabilistic assessment of climate change im-pacts on winter durum wheat yield over the MediterraneanBasin.
The baseline climate for this area was obtained from theENSEMBLES E-OBS dataset (Haylock et al., 2008), whichconsists of 25 km interpolated daily observed data for Prec,T min andT max covering the period 1950–2006. Grid cellsrelevant to areas of altitude over 700 m a.s.l., where durum
www.nat-hazards-earth-syst-sci.net/11/1293/2011/ Nat. Hazards Earth Syst. Sci., 11, 1293–1302, 2011
1296 R. Ferrise et al.: Probabilistic assessments of climate change impacts on durum
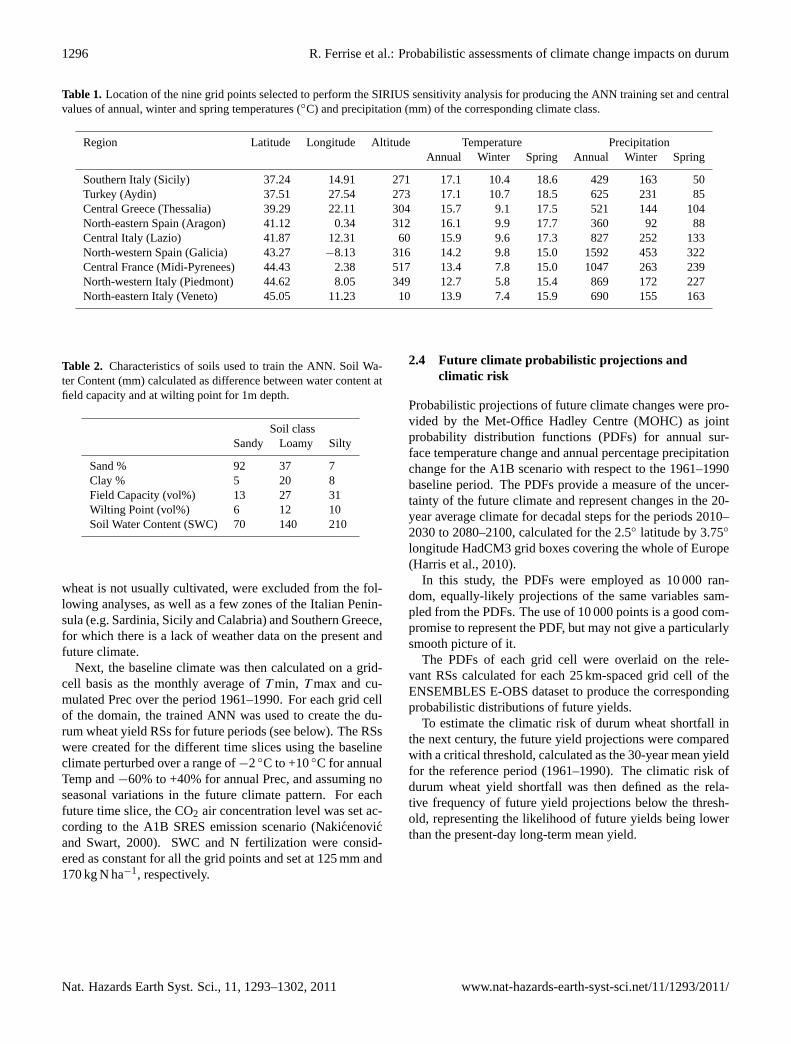
Table 1. Location of the nine grid points selected to perform the SIRIUS sensitivity analysis for producing the ANN training set and centralvalues of annual, winter and spring temperatures (◦C) and precipitation (mm) of the corresponding climate class.
Region Latitude Longitude Altitude Temperature PrecipitationAnnual Winter Spring Annual Winter Spring
Southern Italy (Sicily) 37.24 14.91 271 17.1 10.4 18.6 429 163 50Turkey (Aydin) 37.51 27.54 273 17.1 10.7 18.5 625 231 85Central Greece (Thessalia) 39.29 22.11 304 15.7 9.1 17.5 521 144 104North-eastern Spain (Aragon) 41.12 0.34 312 16.1 9.9 17.7 360 92 88Central Italy (Lazio) 41.87 12.31 60 15.9 9.6 17.3 827 252 133North-western Spain (Galicia) 43.27 −8.13 316 14.2 9.8 15.0 1592 453 322Central France (Midi-Pyrenees) 44.43 2.38 517 13.4 7.8 15.0 1047 263 239North-western Italy (Piedmont) 44.62 8.05 349 12.7 5.8 15.4 869 172 227North-eastern Italy (Veneto) 45.05 11.23 10 13.9 7.4 15.9 690 155 163
Table 2. Characteristics of soils used to train the ANN. Soil Wa-ter Content (mm) calculated as difference between water content atfield capacity and at wilting point for 1m depth.
Soil classSandy Loamy Silty
Sand % 92 37 7Clay % 5 20 8Field Capacity (vol%) 13 27 31Wilting Point (vol%) 6 12 10Soil Water Content (SWC) 70 140 210
wheat is not usually cultivated, were excluded from the fol-lowing analyses, as well as a few zones of the Italian Penin-sula (e.g. Sardinia, Sicily and Calabria) and Southern Greece,for which there is a lack of weather data on the present andfuture climate.
Next, the baseline climate was then calculated on a grid-cell basis as the monthly average ofT min, T max and cu-mulated Prec over the period 1961–1990. For each grid cellof the domain, the trained ANN was used to create the du-rum wheat yield RSs for future periods (see below). The RSswere created for the different time slices using the baselineclimate perturbed over a range of−2◦C to +10◦C for annualTemp and−60% to +40% for annual Prec, and assuming noseasonal variations in the future climate pattern. For eachfuture time slice, the CO2 air concentration level was set ac-cording to the A1B SRES emission scenario (Nakicenovicand Swart, 2000). SWC and N fertilization were consid-ered as constant for all the grid points and set at 125 mm and170 kg N ha−1, respectively.
2.4 Future climate probabilistic projections andclimatic risk
Probabilistic projections of future climate changes were pro-vided by the Met-Office Hadley Centre (MOHC) as jointprobability distribution functions (PDFs) for annual sur-face temperature change and annual percentage precipitationchange for the A1B scenario with respect to the 1961–1990baseline period. The PDFs provide a measure of the uncer-tainty of the future climate and represent changes in the 20-year average climate for decadal steps for the periods 2010–2030 to 2080–2100, calculated for the 2.5◦ latitude by 3.75◦
longitude HadCM3 grid boxes covering the whole of Europe(Harris et al., 2010).
In this study, the PDFs were employed as 10 000 ran-dom, equally-likely projections of the same variables sam-pled from the PDFs. The use of 10 000 points is a good com-promise to represent the PDF, but may not give a particularlysmooth picture of it.
The PDFs of each grid cell were overlaid on the rele-vant RSs calculated for each 25 km-spaced grid cell of theENSEMBLES E-OBS dataset to produce the correspondingprobabilistic distributions of future yields.
To estimate the climatic risk of durum wheat shortfall inthe next century, the future yield projections were comparedwith a critical threshold, calculated as the 30-year mean yieldfor the reference period (1961–1990). The climatic risk ofdurum wheat yield shortfall was then defined as the rela-tive frequency of future yield projections below the thresh-old, representing the likelihood of future yields being lowerthan the present-day long-term mean yield.
Nat. Hazards Earth Syst. Sci., 11, 1293–1302, 2011 www.nat-hazards-earth-syst-sci.net/11/1293/2011/
R. Ferrise et al.: Probabilistic assessments of climate change impacts on durum 1297
Table 3. Results of SIRIUS validation at regional scale. The Pearson’s coefficient was 0.88 and RMSE 0.46 Mg ha−1.
Regions Latitude Longitude Observed yield(Mg ha−1)
Simulated yield(Mg ha−1)
Southern France 43.65 4.96 3.26 3.62Northern Italy 45.48 11.88 4.88 4.53Central Italy 42.34 11.73 2.94 3.58Southern Italy 37.78 12.68 2.17 2.21Central Greece 39.73 22.19 3.02 2.83Southern Spain 36.83 −5.34 2.57 3.32
3 Results
3.1 Calibration and validation of SIRIUS andANN models
On the local scale, SIRIUS was able to adequately simu-late both the phenology and yield of durum wheat in allthree locations. In particular, Pearson’s correlation coef-ficient between the observed and simulated values turnedout to be very high for both anthesis date (r = 0.87) andyield (r = 0.87), whilst the overall RMSE of simulations was3.3 days and 0.371 Mg ha−1 for anthesis and yield respec-tively.
On the regional scale, the ability of the model to repro-duce yields was poorer. When considering all the valida-tion sites and years, the Pearson’s correlation coefficient andRMSE were 0.66 and 0.97 Mg ha−1 respectively. The greateruncertainty of the model on the regional scale may be as-cribed to the large geographical area and the limitations ofthe observed data in fully characterizing spatial variability.For instance, observed yields are largely influenced by man-agement strategies and soil conditions, which vary by farmand region, and which are difficult to measure and includein process-based crop models on this scale (Reidsma et al.,2009).
Importantly, the comparison between the observed andsimulated average yields (Table 3) indicates that the modelcaptured the spatial variability of yield very well (0.88and 0.46 Mg ha−1, Pearson’s coefficient and RMSE, respec-tively) and was thus held to be trustworthy in reproducing thespatial difference in crop yield for present and future climateconditions.
The test analyses showed a high level of correspondencebetween the SIRIUS outputs and the ANN simulated yields,indicating the robustness of the proposed approach in em-ulating the results of the mechanistic model. In particular,the Pearson’s coefficients for the simple and cross validationswere over 0.94, whereas the RMSE and MAE were just be-low 0.47 Mg ha−1 and 0.37 Mg ha−1, respectively.
In any case, the RMSEs calculated for grain yield by boththe SIRIUS and ANN models were comparable to those
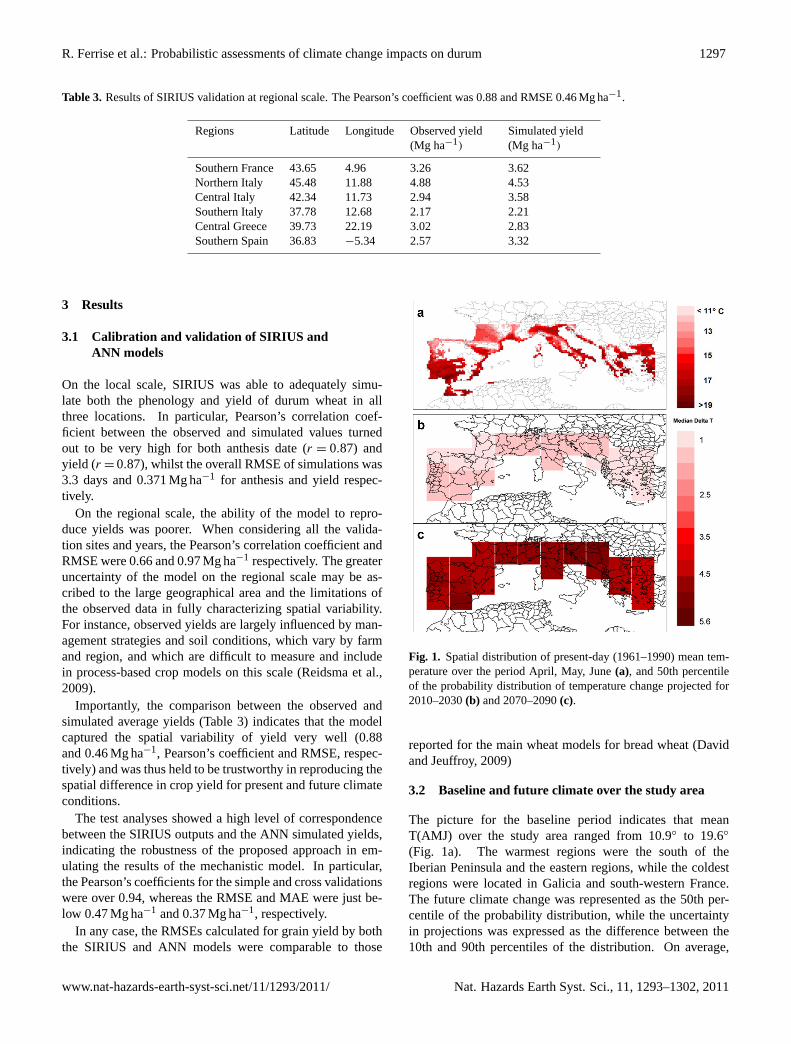
Fig. 1. Spatial distribution of present-day (1961–1990) mean tem-perature over the period April, May, June(a), and 50th percentileof the probability distribution of temperature change projected for2010–2030(b) and 2070–2090(c).
reported for the main wheat models for bread wheat (Davidand Jeuffroy, 2009)
3.2 Baseline and future climate over the study area
The picture for the baseline period indicates that meanT(AMJ) over the study area ranged from 10.9◦ to 19.6◦
(Fig. 1a). The warmest regions were the south of theIberian Peninsula and the eastern regions, while the coldestregions were located in Galicia and south-western France.The future climate change was represented as the 50th per-centile of the probability distribution, while the uncertaintyin projections was expressed as the difference between the10th and 90th percentiles of the distribution. On average,
www.nat-hazards-earth-syst-sci.net/11/1293/2011/ Nat. Hazards Earth Syst. Sci., 11, 1293–1302, 2011

1298 R. Ferrise et al.: Probabilistic assessments of climate change impacts on durum
Fig. 2. Spatial distribution of present-day (1961–1990) cumulatedprecipitation over the period April, May, June(a), and 50th per-centile of the probability distribution of percentage precipitationchange projected for 2010–2030(b) and 2070–2090(c).
median temperature changes vary from 1.6◦C in 2010–2030(Fig. 1b) to about 5◦C at the end of the century (Fig. 1c). Thegreatest increases within the study area were predicted forthe southern areas of central Europe, while the smallest in-creases were projected for the eastern regions of the domainand Galicia and Western France. The range of uncertaintyvaried substantially with the time-distance of future periodsand rose to 4.4◦C, on average, by the end of the century.
The mean P(AMJ) showed a clear latitudinal pattern, withlower values at lower latitudes (Fig. 2a). The greatest precip-itation were recorded in Galicia, the Pyrenees and the North-ern Balkans region, with more than 300 mm, whereas south-ern Italy and the south-eastern areas showed the driest cli-mate with less than 100 mm of rainfall. As regards the futureclimate, a progressive decrease in precipitation was projectedover the whole study area (Fig. 2b, c). Over the next decades,the decrease will be moderate and in some northeastern re-gions a slight increase is expected, but at the end of the cen-tury the reduction will be widespread and more severe in thecentral Iberian Peninsula and Greece (more than 20% reduc-tion). Also for precipitation, the range of uncertainty willincrease as the century progresses and for many grid boxesthere are significant probabilities of both drier and wetter cli-mates.
3.3 Simulated durum wheat yield under present-dayclimate conditions
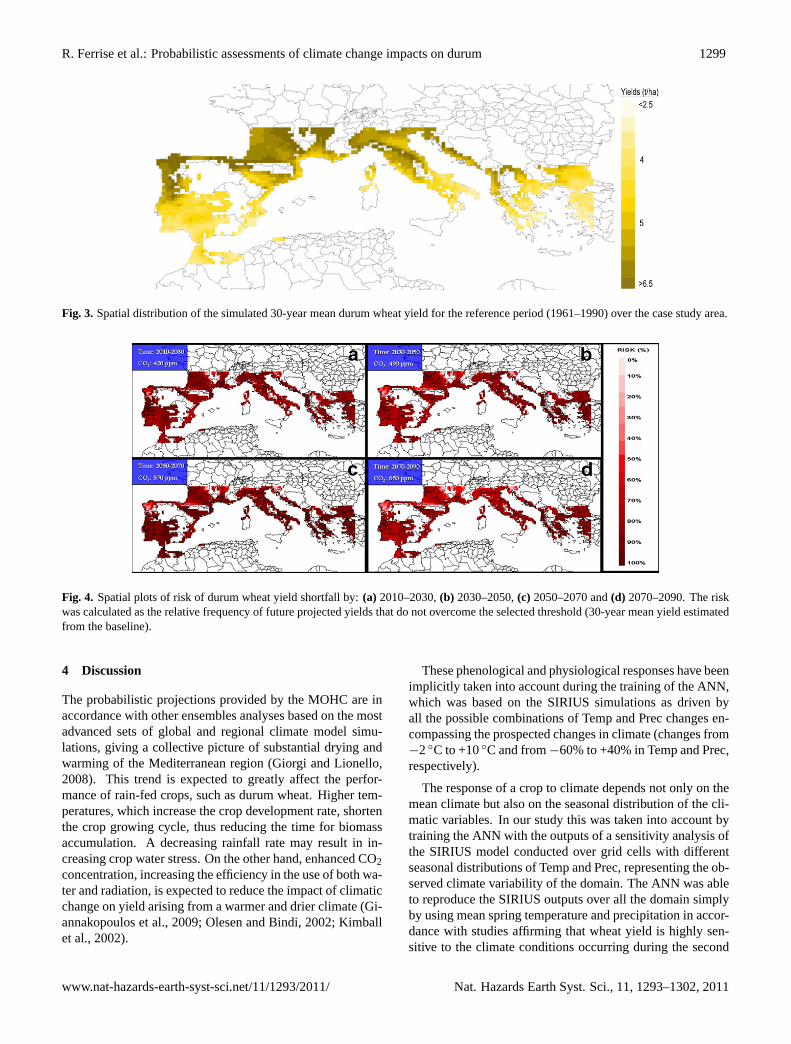
The simulated durum wheat yield for the baseline periodranges from 2.9 to 7.2 Mg ha−1 with a clear latitudinal gra-dient. The highest yields are estimated in Southern Franceand Galicia, with more than 6.5 Mg ha−1 (Fig. 3). Higheryields were also simulated in north-eastern areas of the casestudy area with a layer in north-western and central Italy,while smaller yields, down to 3.5 Mg ha−1, were estimatedfor southern areas of the Mediterranean Basin. These resultsare in agreement with other European-scale assessments ofthe productivity of wheat (Harrison et al., 1995), once moreconfirming the robustness of the ANN procedure in simpli-fying SIRIUS, allowing adequate reproduction of the spatialvariability of yield over a wide area, but with much comput-ing time saving.
3.4 Risk over the study area
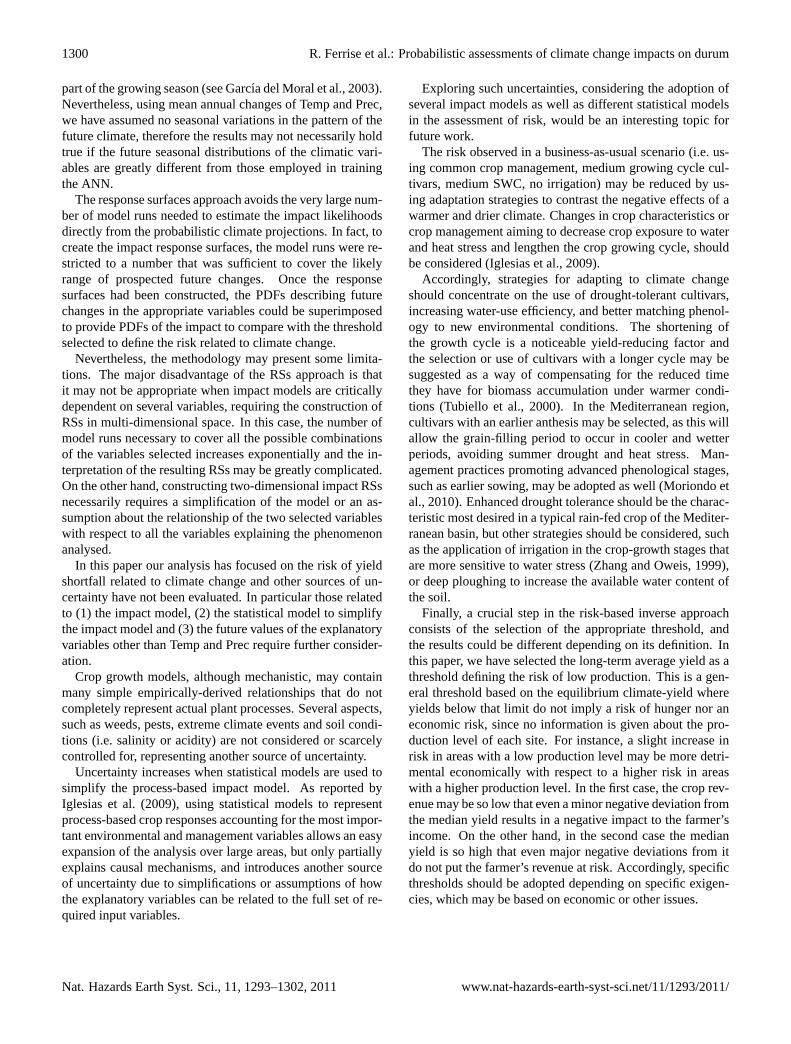
In contrast to previous studies which suggest that the benefi-cial effects of elevated atmospheric CO2 concentration overthe next few decades would outweigh the detrimental effectsof the early stages of climatic warming and drying (e.g. Ole-sen and Bindi, 2002; Parry et al., 2004), the results of ouranalysis bring more concern (Fig. 4a). Early in the nextdecades, the risk of reductions in yield below the long termyield average is quite high and widespread. As the centuryprogresses, for a large part of the study area the risk still in-creases, reaching its maximum by mid century (2050–2070,Fig. 4b,c). In the last period (2070–2090, Fig. 4d), the riskslightly decreases with respect to the previous time slice withthe effect of larger uncertainty in climate projections sim-ulated for the end of the century. In some regions, for in-stance, southern Portugal (grid cell centroid−7.5 lon E, 37.5lat N) Prec in 2050–2070 is expected changing in the rangeof +9% to−42% (10th and 90th percentile respectively; datanot shown). In the same area, at the end of the century Precmay range +28 to−43%, which slightly decreases the risk,given the effect of the positive impact of higher precipitationson yield.
Only a few areas in the northern fringes of the Mediter-ranean domain (i.e. Galicia, the western side of the Pyreneesand Slovenia) show a low risk of yield falling below the base-line long-term mean yield. For these areas, precipitation doesnot represent a limiting factor, even considering the decreas-ing trend for future periods. For instance, in Galicia, present-day P(AMJ) is about 300 mm and the highest median precip-itation change was−18% in 2070–2090. The projected pre-cipitation does not limit crop growth, because the shorteningof the growing season as the effect of the increasing tempera-ture is compensated for by increased radiation and water useefficiency explained by rising CO2 air concentration.
Nat. Hazards Earth Syst. Sci., 11, 1293–1302, 2011 www.nat-hazards-earth-syst-sci.net/11/1293/2011/
R. Ferrise et al.: Probabilistic assessments of climate change impacts on durum 1299
Fig. 3. Spatial distribution of the simulated 30-year mean durum wheat yield for the reference period (1961–1990) over the case study area.
Fig. 4. Spatial plots of risk of durum wheat yield shortfall by:(a) 2010–2030,(b) 2030–2050,(c) 2050–2070 and(d) 2070–2090. The riskwas calculated as the relative frequency of future projected yields that do not overcome the selected threshold (30-year mean yield estimatedfrom the baseline).
4 Discussion
The probabilistic projections provided by the MOHC are inaccordance with other ensembles analyses based on the mostadvanced sets of global and regional climate model simu-lations, giving a collective picture of substantial drying andwarming of the Mediterranean region (Giorgi and Lionello,2008). This trend is expected to greatly affect the perfor-mance of rain-fed crops, such as durum wheat. Higher tem-peratures, which increase the crop development rate, shortenthe crop growing cycle, thus reducing the time for biomassaccumulation. A decreasing rainfall rate may result in in-creasing crop water stress. On the other hand, enhanced CO2concentration, increasing the efficiency in the use of both wa-ter and radiation, is expected to reduce the impact of climaticchange on yield arising from a warmer and drier climate (Gi-annakopoulos et al., 2009; Olesen and Bindi, 2002; Kimballet al., 2002).
These phenological and physiological responses have beenimplicitly taken into account during the training of the ANN,which was based on the SIRIUS simulations as driven byall the possible combinations of Temp and Prec changes en-compassing the prospected changes in climate (changes from−2◦C to +10◦C and from−60% to +40% in Temp and Prec,respectively).
The response of a crop to climate depends not only on themean climate but also on the seasonal distribution of the cli-matic variables. In our study this was taken into account bytraining the ANN with the outputs of a sensitivity analysis ofthe SIRIUS model conducted over grid cells with differentseasonal distributions of Temp and Prec, representing the ob-served climate variability of the domain. The ANN was ableto reproduce the SIRIUS outputs over all the domain simplyby using mean spring temperature and precipitation in accor-dance with studies affirming that wheat yield is highly sen-sitive to the climate conditions occurring during the second
www.nat-hazards-earth-syst-sci.net/11/1293/2011/ Nat. Hazards Earth Syst. Sci., 11, 1293–1302, 2011
1300 R. Ferrise et al.: Probabilistic assessments of climate change impacts on durum
part of the growing season (see Garcıa del Moral et al., 2003).Nevertheless, using mean annual changes of Temp and Prec,we have assumed no seasonal variations in the pattern of thefuture climate, therefore the results may not necessarily holdtrue if the future seasonal distributions of the climatic vari-ables are greatly different from those employed in trainingthe ANN.
The response surfaces approach avoids the very large num-ber of model runs needed to estimate the impact likelihoodsdirectly from the probabilistic climate projections. In fact, tocreate the impact response surfaces, the model runs were re-stricted to a number that was sufficient to cover the likelyrange of prospected future changes. Once the responsesurfaces had been constructed, the PDFs describing futurechanges in the appropriate variables could be superimposedto provide PDFs of the impact to compare with the thresholdselected to define the risk related to climate change.
Nevertheless, the methodology may present some limita-tions. The major disadvantage of the RSs approach is thatit may not be appropriate when impact models are criticallydependent on several variables, requiring the construction ofRSs in multi-dimensional space. In this case, the number ofmodel runs necessary to cover all the possible combinationsof the variables selected increases exponentially and the in-terpretation of the resulting RSs may be greatly complicated.On the other hand, constructing two-dimensional impact RSsnecessarily requires a simplification of the model or an as-sumption about the relationship of the two selected variableswith respect to all the variables explaining the phenomenonanalysed.
In this paper our analysis has focused on the risk of yieldshortfall related to climate change and other sources of un-certainty have not been evaluated. In particular those relatedto (1) the impact model, (2) the statistical model to simplifythe impact model and (3) the future values of the explanatoryvariables other than Temp and Prec require further consider-ation.
Crop growth models, although mechanistic, may containmany simple empirically-derived relationships that do notcompletely represent actual plant processes. Several aspects,such as weeds, pests, extreme climate events and soil condi-tions (i.e. salinity or acidity) are not considered or scarcelycontrolled for, representing another source of uncertainty.
Uncertainty increases when statistical models are used tosimplify the process-based impact model. As reported byIglesias et al. (2009), using statistical models to representprocess-based crop responses accounting for the most impor-tant environmental and management variables allows an easyexpansion of the analysis over large areas, but only partiallyexplains causal mechanisms, and introduces another sourceof uncertainty due to simplifications or assumptions of howthe explanatory variables can be related to the full set of re-quired input variables.
Exploring such uncertainties, considering the adoption ofseveral impact models as well as different statistical modelsin the assessment of risk, would be an interesting topic forfuture work.
The risk observed in a business-as-usual scenario (i.e. us-ing common crop management, medium growing cycle cul-tivars, medium SWC, no irrigation) may be reduced by us-ing adaptation strategies to contrast the negative effects of awarmer and drier climate. Changes in crop characteristics orcrop management aiming to decrease crop exposure to waterand heat stress and lengthen the crop growing cycle, shouldbe considered (Iglesias et al., 2009).
Accordingly, strategies for adapting to climate changeshould concentrate on the use of drought-tolerant cultivars,increasing water-use efficiency, and better matching phenol-ogy to new environmental conditions. The shortening ofthe growth cycle is a noticeable yield-reducing factor andthe selection or use of cultivars with a longer cycle may besuggested as a way of compensating for the reduced timethey have for biomass accumulation under warmer condi-tions (Tubiello et al., 2000). In the Mediterranean region,cultivars with an earlier anthesis may be selected, as this willallow the grain-filling period to occur in cooler and wetterperiods, avoiding summer drought and heat stress. Man-agement practices promoting advanced phenological stages,such as earlier sowing, may be adopted as well (Moriondo etal., 2010). Enhanced drought tolerance should be the charac-teristic most desired in a typical rain-fed crop of the Mediter-ranean basin, but other strategies should be considered, suchas the application of irrigation in the crop-growth stages thatare more sensitive to water stress (Zhang and Oweis, 1999),or deep ploughing to increase the available water content ofthe soil.
Finally, a crucial step in the risk-based inverse approachconsists of the selection of the appropriate threshold, andthe results could be different depending on its definition. Inthis paper, we have selected the long-term average yield as athreshold defining the risk of low production. This is a gen-eral threshold based on the equilibrium climate-yield whereyields below that limit do not imply a risk of hunger nor aneconomic risk, since no information is given about the pro-duction level of each site. For instance, a slight increase inrisk in areas with a low production level may be more detri-mental economically with respect to a higher risk in areaswith a higher production level. In the first case, the crop rev-enue may be so low that even a minor negative deviation fromthe median yield results in a negative impact to the farmer’sincome. On the other hand, in the second case the medianyield is so high that even major negative deviations from itdo not put the farmer’s revenue at risk. Accordingly, specificthresholds should be adopted depending on specific exigen-cies, which may be based on economic or other issues.
Nat. Hazards Earth Syst. Sci., 11, 1293–1302, 2011 www.nat-hazards-earth-syst-sci.net/11/1293/2011/
R. Ferrise et al.: Probabilistic assessments of climate change impacts on durum 1301
5 Conclusions
In this work we have presented a novel approach to climatechange impact assessment in agriculture. This approach haspermitted us to evaluate climate change impacts in terms ofrisk over the wide area of the Mediterranean Basin, with greatcomputing-time saving. The methodology, although intro-ducing additional uncertainty, has allowed us to assess therisk of crop shortfall related to climate change by assigningprobability estimates of the impact instead of providing onlyuncertainty ranges of the possible impact, with no informa-tion on relative likelihoods.
The results of this analysis, in contrast to previous stud-ies, indicate that the projected warmer and drier climate overthe Mediterranean basin will increase the risk of yield loss,while the positive effects of increasing CO2 are not able tocompletely counterbalance this trend. In a few areas, at thenorthern latitudes of the domain, the risk is lower, as the re-sult of the combined effect of non limiting precipitation andincreased CO2. Uncertainties in future climate projectionsprogressively increase up to the end of the century, resultingin a reduction of risk.
For a more comprehensive analysis of the risk, furtherworks are needed to take into account the other sources ofuncertainty and investigate the possible adaptation strategiesneeded to cope with future climate change.
Acknowledgements.The authors thank their colleagues for theircontinuing support and discussion in coffee breaks. Special thanksgo to Giacomo “Jack” Trombi and Camilla Dibari for their help inproducing figures and their GIS support, respectively.
Edited by: J. E. OlesenReviewed by: three anonymous referees
References
Ainsworth, E. A. and Long, S. P.: What have we learned from 15years of free-air CO2 enrichment (FACE)? A meta-analytic re-view of responses to rising CO2 in photosynthesis, canopy prop-erties and plant production, New Phytol., 165, 351–372, 2005.
Bindi, M. and Maselli, F.: Extension of crop model outputs over theland surface by the application of statistical and neural networktechniques to topographical and satellite data, Clim. Res., 16,237–246, 2001.
David, C. and Jeuffroy, M. H.: A sequential approach for improvingAZODYN crop model under conventional and low-input condi-tions, Europ. J. Agronomy, 31, 177–182, 2009.
Downing, T. E., Harrison, P. A., Butterfield, R. E., and Lonsdale,K. G.: Climate change, climatic variability and agriculture inEurope: an integrated assessment, Environmental Change Unit,University of Oxford, Oxford, UK, 445 pp., 2000.
Fronzek, S., Carter T. R., Raisanen, J., Ruokolainen, L., and Lu-oto, M.: Applying probabilistic projections of climate changewith impact models: a case study for sub-arctic palsa mires inFennoscandia, Climatic Change, 99, 515–534, 2010.
Garcıa del Moral, L. F., Rharrabti, Y., Villegas, D., and Royo, C.:Evaluation of grain yield and its components in durum wheat un-der Mediterranean conditions: an onthogenic approach, Agron.J., 95, 266–274, 2003.
Gardner, M. W. and Dorling, S. R.: Artificial neural networks (themultilayer perceptron) – a review of applications in the atmo-spheric sciences, Atmos. Environ., 32, 2627–2636, 1998.
Giannakopoulos, C., Le Sager, P., Bindi, M., Moriondo, M.,Kostopoulou, E., and Goodess, C. M.: Climatic changes andassociated impacts in the Mediterranean resulting from a 2◦Cglobal warming, Global Planet. Change, 68, 209–224, 2009.
Gibelin, A. L. and Deque, M.: Anthropogenic climate change overthe Mediterranean region simulated by a global variable resolu-tion model, Clim. Dyn., 20, 327–339, 2003.
Giorgi, F. and Lionello, P.: Climate change projections for theMediterranean region, Global Planet. Change, 63, 90–104, 2008.
Harris, G. R., Collins, M., Sexton, D. M. H., Murphy, J. M., andBooth, B. B. B.: Probabilistic projections for 21st century Eu-ropean climate, Nat. Hazards Earth Syst. Sci., 10, 2009–2020,doi:10.5194/nhess-10-2009-2010, 2010.
Harrison, P. A., Butterfield, R. E., and Gawith, M. J.: Effects onwinter wheat, sunflower and grassland in Europe, in: Climatechange and agriculture in Europe: assessment of impacts andadaptations, edited by: Harrison, P. A., Butterfield, R. E., andDowning, T. E., Environmental Change Unit, University of Ox-ford, Oxford, UK, 330–385, 1995.
Haylock, M. R., Hofstra, N., Klein Tank, A. M. G., Klok,E. J., Jones, P. D., and New, M.: A European daily high-resolution gridded data set of surface temperature and pre-cipitation for 1950–2006, J. Geophys. Res., 113, D20119,doi:10.1029/2008JD010201, 2008.
Iglesias, A., Garrote, L., Quiroga, S., and Moneo, M.: Impacts ofclimate change in agriculture in Europe, PESETA-Agriculturestudy, Joint Research Centre, Luxembourg, EU, 2009.
Jamieson, P. D., Semenov, M. A., Brooking, I. R., and Francis, G.S.: Sirius: a mechanistic model of wheat response to environ-mental variation, Eur. J. Agron., 8, 161–179, 1998.
Jamieson, P. D., Bernsten, J., Ewert, F., Kimball, B. A., Olesen, J.E., Pinter Jr., P. J., Porter, J. R., and Semenov, M. A.: ModellingCO2 effects on wheat with varying nitrogen supplies, Agric.Ecosyst. Environ., 82, 27–37, 2000.
Jones, R. N.: Managing uncertainty in climate change projections– Issues for impact assessment, Climatic Change, 45, 403–419,2000.
Kimball, B. A., Kobayashi, K., and Bindi, M.: Responses of agri-cultural crops to free-air CO2 enrichment, Adv. Agron., 77, 293–368, 2002.
McClelland, J. L. and Rumelhart, D. E. (Eds.): Parallel distributedprocessing: exploration in the microstructure of cognition, Vol.1, MIT Press, Cambridge, MA, 1986.
Mearns, L. O., Hulme, M., Carter, T. R., Leemans, R., Lal, M.,and Whetton, P.: Climate scenario development, in: Climatechange 2001: impacts, adaptation, and vulnerability. Contribu-tion of working group II to the third assessment report of the in-tergovernmental panel on climate change, edited by: McCarthy,J. J., Canziani, O. F., Leary, N. A., Dokken, D. J., and White,K. S., Cambridge University Press, Cambridge, UK, 739–768,2001.
www.nat-hazards-earth-syst-sci.net/11/1293/2011/ Nat. Hazards Earth Syst. Sci., 11, 1293–1302, 2011

1302 R. Ferrise et al.: Probabilistic assessments of climate change impacts on durum
Monitoring Agricultural Resources (MARS), European Com-mission Joint Research Centre URLhttp://mars.jrc.it/mars/About-us/The-MARS-Unit, 2009.
Moriondo, M. and Bindi, M.: Comparison of temperatures simu-lated by GCMs, RCMs and statistical downscaling: potential ap-plication in studies of future crop development, Clim. Res., 30,149–160, 2006.
Moriondo, M., Bindi, M., Kundzewicz, Z. W., Szwed, M., Choryn-ski, A., Matczak, P., Radziejewski, M., McEvoy, D., and Wre-ford, A.: Impact and adaptation opportunities for European agri-culture in response to climatic change and variability, Mitig.Adapt. Strateg. Glob. Change, 7, 657–679, 2010.
Murphy, J. M., Booth, B. B. B., Collins, M., Harris, G. R., Sexton,D. M. H., and Webb, M. J.: A methodology for probabilisticpredictions of regional climate change from perturbed physicsensembles, Phil. Trans. R. Soc. A, 365, 1993–2028, 2007.
Nakicenovic, N. and Swart R. (Eds.): Special Report on Emis-sions Scenarios, Cambridge University Press, Cambridge, UK,599 pp., 2000.
New, M., Lopez, A., Dessai, S., and Wilby, R.: Challenges in usingprobabilistic climate change information for impact assessments:an example from the water sector, Phil. Trans. R. Soc. A, 365,2117–2131, 2007.
Olesen, J. E. and Bindi, M.: Consequences of climate change forEuropean agricultural productivity, land use and policy, Europ.J. Agronomy, 16, 239–262, 2002.
Olesen, J. E., Carter, T. R., Dıaz-Ambrona, C. H., Fronzek, S., Hei-dmann, T., Hickler, T., Holt, T., Minguez, M. I., Morales, P.,Palutikof, J. P., Quemada, M., Ruiz-Ramos, M., Rubæk, G. H.,Sau, F., Smith, B., and Sykes, M. T.: Uncertainties in projectedimpacts of climate change on European agriculture and terres-trial ecosystems based on scenarios from regional climate mod-els, Climatic Change, 81, 123–143, 2007.
Parry, M. L., Rosenzweig, C., Iglesias, A., Livermore, M., and Fis-cher, G.: Effects of climate change on global food production un-der SRES emissions and socio-economic scenarios, Global Env-iron. Change, 14, 53–67, 2004.
Porter, J. R. and Semenov, M. A.: Crop responses to climatic varia-tion, Phil. Trans. R. Soc. B, 360, 2021–2035, 2005.
Reidsma, P., Ewert, F., Boogaard, H., and van Diepen, K.: Regionalcrop modelling in Europe: The impact of climatic conditions andfarm characteristics on maize yields, Agri. Syst., 100, 51–60,2009.
Rumelhart, D. E., Hinton, G. E., and Williams, R. J.: Learning inter-nal representations by error propagation, in: Parallel distributedprocessing: explorations in the microstructure of cognition, Vol1, McClelland, J. L. and Rumelhart, D. E., MIT Press, Cam-bridge, MA, 318–362, 1986.
Schneider, S.: What is ‘dangerous’ climate change?, Nature, 411,17–19, 2001.
Tebaldi, C. and Knutti, R.: The use of the multi-model ensemblein probabilistic climate projections, Phil. Trans. R. Soc. A, 365,2053–2075, 2007.
Tebaldi, C. and Lobell, D. B.: Towards probabilistic projectionsof climate change impacts on global crop yields, Geophys. Res.Lett., 35, L08705,doi:10.1029/2008GL033423, 2008.
Trigo, R. M. and Palutikof, J. P.: Simulation of daily temperaturesfor climate change scenarios over Portugal: a neural networkmodel approach, Clim. Res., 13, 45–59, 1999.
Triossi, A.: Studio della dinamica dell’accumulo proteico nellagranella di frumento duro ai fini di una caratterizzazione agro-climatica delle potenzialita’ produttive (qualitative e quantita-tive), Ph.D. thesis, Department of Agronomy and Land Manage-ment, University of Florence, Italy, 148 pp., 2006.
Tubiello, F. N., Donatelli, M., Rosenzweig, C., and Stockle, C. O.:Effects of climate change and elevated CO2 on cropping systems:model predictions at two Italian locations, Europ. J. Agronomy,13, 179–189, 2000.
Widrow, B., Rumelhart, D. E., and Lehr, M. A.: Neural networks:Applications in industry, business and science, Communicationsof the ACM, 37, 93–105, 1994.
Zhang, H. and Oweis, T.: Water-yield relations and optimal irriga-tion scheduling of wheat in the Mediterranean region, Agr. WaterManage., 38, 195–211, 1999.
Zhang, G., Eddy Patuwo, B., and Hu, Y. M.: Forecasting with arti-ficial neural networks: The state of the art, Internat. J. Forecast.,14, 35–62, 1998.
Nat. Hazards Earth Syst. Sci., 11, 1293–1302, 2011 www.nat-hazards-earth-syst-sci.net/11/1293/2011/