Probabilistic approach of an oil-water flow pattern map ...
44
Probabilistic approach of an oil-water flow pattern map for pipelines from -90° to 90° inclination. Diana Estefanía Urbano Caguasango. Chemical Engineering Department, Universidad de los Andes, Bogotá Colombia. Abstract: A probabilistic approach to two-phase liquid-liquid (oil-water) flow patterns is presented. An experimental dataset of 8073 points was compiled and processed in order to determine an acceptable data pool. The experimental data was then validated by means of OLGA Multiphase Toolkit and used to generate the probabilistic flow pattern maps. Considering that different dispersion patterns were taken into account, a probability surface was generated for each flow pattern, with the aim of simplifying the reading. Furthermore, a tool was developed to assist the recognition of probabilities. Keywords: Liquid-Liquid pipe flow, flow pattern map, probabilistic classification, recognition techniques. 1. Introduction Flow of two immiscible liquids is related to many processes in the chemical and Oil & Gas industries. Liquid - liquid flow is characterized by a low density ratio and a viscosity ratio that can be of many orders of magnitude [1]. It is not only affected by inertia, viscous, pressure and interfacial forces, but also by the inclination of the pipe, the wetting characteristics of the pipe, the pre-wetting component and the operation conditions such as temperature and superficial velocities. The interaction of these components leads to specific geometric distributions of the phases in a pipe, which are known as flow patterns [2]. Flow patterns are commonly identified by visual observation, moreover, in recent years high speed cameras and conductivity probes among others, have been used to support these observations [3]. Figure 1.a illustrates the most common flow patterns identified for horizontal flow, which are stratified flow (ST), stratified flow with mixture in the interface (ST & MI), dispersion of oil in water (DO/W), oil in water emulsion (O/W), dispersion of water in oil (DW/O), dispersion of oil in water (DO/W) and water in oil emulsion (W/O) [4]. For vertical pipes, annular flow, slug flow, dispersion of oil in water, emulsion of oil in water, churn flow, dispersion of water in oil and emulsion of oil in water for vertical pipes, as it is shown in Figure 1.b [1, 5, 6, 7, 8]. Finally, for inclined pipes the interaction of the parameters described above will change with the leaning, as a consequence, the flow patterns will be similar to those for vertical or horizontal pipes depending on the degree of inclination. As it is noted by Brauner (2002) [1], stratified flow usually disappears from a 30° inclination.
Transcript of Probabilistic approach of an oil-water flow pattern map ...

Probabilistic approach of an oil-water flow pattern map for pipelines from -90° to 90°
inclination.
Diana Estefanía Urbano Caguasango. Chemical Engineering Department, Universidad de los Andes, Bogotá
Colombia.
Abstract:
A probabilistic approach to two-phase liquid-liquid (oil-water) flow patterns is presented. An
experimental dataset of 8073 points was compiled and processed in order to determine an
acceptable data pool. The experimental data was then validated by means of OLGA Multiphase
Toolkit and used to generate the probabilistic flow pattern maps. Considering that different
dispersion patterns were taken into account, a probability surface was generated for each flow
pattern, with the aim of simplifying the reading. Furthermore, a tool was developed to assist the
recognition of probabilities.
Keywords: Liquid-Liquid pipe flow, flow pattern map, probabilistic classification, recognition
techniques.
1. Introduction
Flow of two immiscible liquids is related to many processes in the chemical and Oil & Gas
industries. Liquid - liquid flow is characterized by a low density ratio and a viscosity ratio that can
be of many orders of magnitude [1]. It is not only affected by inertia, viscous, pressure and
interfacial forces, but also by the inclination of the pipe, the wetting characteristics of the pipe, the
pre-wetting component and the operation conditions such as temperature and superficial velocities.
The interaction of these components leads to specific geometric distributions of the phases in a pipe,
which are known as flow patterns [2].
Flow patterns are commonly identified by visual observation, moreover, in recent years high speed
cameras and conductivity probes among others, have been used to support these observations [3].
Figure 1.a illustrates the most common flow patterns identified for horizontal flow, which are
stratified flow (ST), stratified flow with mixture in the interface (ST & MI), dispersion of oil in
water (DO/W), oil in water emulsion (O/W), dispersion of water in oil (DW/O), dispersion of oil in
water (DO/W) and water in oil emulsion (W/O) [4]. For vertical pipes, annular flow, slug flow,
dispersion of oil in water, emulsion of oil in water, churn flow, dispersion of water in oil and
emulsion of oil in water for vertical pipes, as it is shown in Figure 1.b [1, 5, 6, 7, 8]. Finally, for
inclined pipes the interaction of the parameters described above will change with the leaning, as a
consequence, the flow patterns will be similar to those for vertical or horizontal pipes depending on
the degree of inclination. As it is noted by Brauner (2002) [1], stratified flow usually disappears
from a 30° inclination.
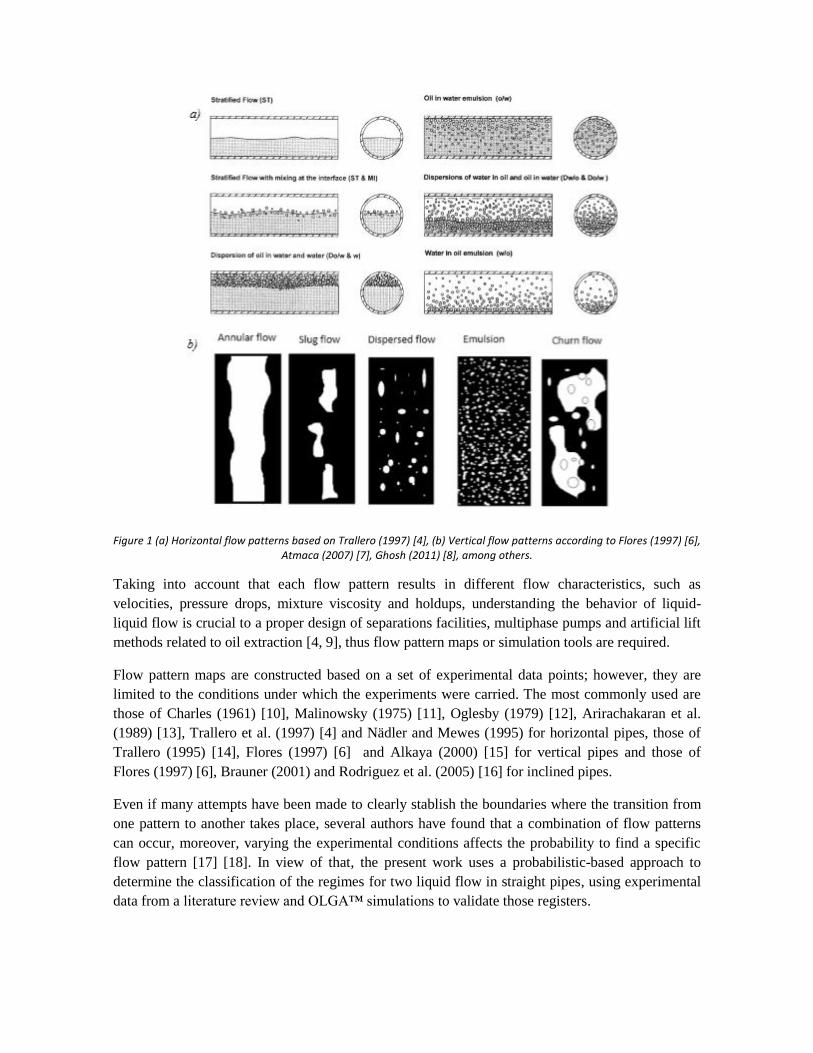
Figure 1 (a) Horizontal flow patterns based on Trallero (1997) [4], (b) Vertical flow patterns according to Flores (1997) [6], Atmaca (2007) [7], Ghosh (2011) [8], among others.
Taking into account that each flow pattern results in different flow characteristics, such as
velocities, pressure drops, mixture viscosity and holdups, understanding the behavior of liquid-
liquid flow is crucial to a proper design of separations facilities, multiphase pumps and artificial lift
methods related to oil extraction [4, 9], thus flow pattern maps or simulation tools are required.
Flow pattern maps are constructed based on a set of experimental data points; however, they are
limited to the conditions under which the experiments were carried. The most commonly used are
those of Charles (1961) [10], Malinowsky (1975) [11], Oglesby (1979) [12], Arirachakaran et al.
(1989) [13], Trallero et al. (1997) [4] and Nädler and Mewes (1995) for horizontal pipes, those of
Trallero (1995) [14], Flores (1997) [6] and Alkaya (2000) [15] for vertical pipes and those of
Flores (1997) [6], Brauner (2001) and Rodriguez et al. (2005) [16] for inclined pipes.
Even if many attempts have been made to clearly stablish the boundaries where the transition from
one pattern to another takes place, several authors have found that a combination of flow patterns
can occur, moreover, varying the experimental conditions affects the probability to find a specific
flow pattern [17] [18]. In view of that, the present work uses a probabilistic-based approach to
determine the classification of the regimes for two liquid flow in straight pipes, using experimental
data from a literature review and OLGA™ simulations to validate those registers.

2. Literature review
Two-phase liquid-liquid flow is defined as the simultaneous flow of two immiscible liquids in a
pipe [7]. Despite its frequency in the industry, liquid-liquid flow has received less attention than
gas-liquid multiphase flow; nevertheless, the effect that the second liquid presence has over the
pressure drop and over other system characteristics is crucial and could compromise the safety and
the economic advantages of transporting a liquid-liquid flow [2].
The decrease of oil reservoirs, higher profits related to the increased production from mature oil
fields among others, has compelled the industries to maximize the use of oil wells [17]. To enable
higher oil extraction, water is introduced and as a consequence, the gradient pressure is lower and
the pumping is easier. In recent years water cuts as high as 0.9 have been operated [19].
Accordingly, in recent years the number of studies who try to throw light upon the nature of the
interaction oil-water has increased.
Unlike gas-liquid systems, in a liquid-liquid flow the density difference between the phases is
relatively low, the viscosity ratio can vary in a wide range and the interfacial chemistry is more
complex [1]. These differences do not allow a direct application of the results obtained for gas-
liquid systems to liquid-liquid systems and so, the importance of its study increases [7].
Understand the distribution of the phases in a liquid-liquid two-phase flow contributes to the
prediction of parameters as pressure drop, the inversion point, liquid holdup or the mixture
viscosity. An accurate prediction of the fluid behavior allows a correct equipment sizing and
therefore, safer and cheaper operations [2, 20].
Each phase distribution is known as a flow pattern and has some unique characteristics;
furthermore, it depends of the interaction between system conditions (inclination of the pipe,
pressure, temperature), physical properties of the fluids (density, viscosity, surface tension) and
forces as inertia, turbulent and shear forces [7, 21, 22].
Depending on the flow condition, the flow pattern can vary from fully segregated flow to fully
dispersed flow. There is not a consensus of the flow patterns classification, their boundaries or their
names. According to Brauner (2002) [1], for horizontal pipes there are four basic prototypes:
1. Stratified layers with either smooth or wavy interface.
2. Large slugs, elongated or spherical of one liquid in the other.
3. Dispersed: Droplets of one into the other.
4. Annular flow: one forms the core and the other the annulus.
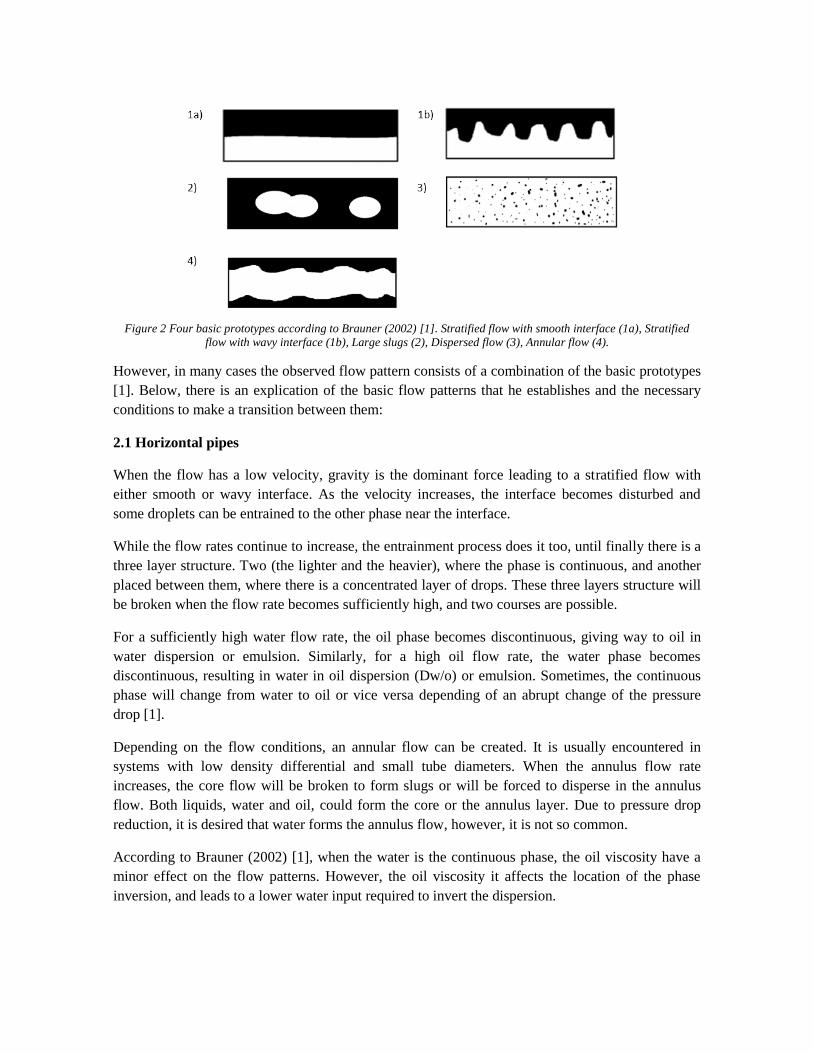
Figure 2 Four basic prototypes according to Brauner (2002) [1]. Stratified flow with smooth interface (1a), Stratified
flow with wavy interface (1b), Large slugs (2), Dispersed flow (3), Annular flow (4).
However, in many cases the observed flow pattern consists of a combination of the basic prototypes
[1]. Below, there is an explication of the basic flow patterns that he establishes and the necessary
conditions to make a transition between them:
2.1 Horizontal pipes
When the flow has a low velocity, gravity is the dominant force leading to a stratified flow with
either smooth or wavy interface. As the velocity increases, the interface becomes disturbed and
some droplets can be entrained to the other phase near the interface.
While the flow rates continue to increase, the entrainment process does it too, until finally there is a
three layer structure. Two (the lighter and the heavier), where the phase is continuous, and another
placed between them, where there is a concentrated layer of drops. These three layers structure will
be broken when the flow rate becomes sufficiently high, and two courses are possible.
For a sufficiently high water flow rate, the oil phase becomes discontinuous, giving way to oil in
water dispersion or emulsion. Similarly, for a high oil flow rate, the water phase becomes
discontinuous, resulting in water in oil dispersion (Dw/o) or emulsion. Sometimes, the continuous
phase will change from water to oil or vice versa depending of an abrupt change of the pressure
drop [1].
Depending on the flow conditions, an annular flow can be created. It is usually encountered in
systems with low density differential and small tube diameters. When the annulus flow rate
increases, the core flow will be broken to form slugs or will be forced to disperse in the annulus
flow. Both liquids, water and oil, could form the core or the annulus layer. Due to pressure drop
reduction, it is desired that water forms the annulus flow, however, it is not so common.
According to Brauner (2002) [1], when the water is the continuous phase, the oil viscosity have a
minor effect on the flow patterns. However, the oil viscosity it affects the location of the phase
inversion, and leads to a lower water input required to invert the dispersion.

2.2 Vertical pipes
As it is shown in Figure 3, here are six typical flow patterns in vertical flow. Three are water
dominant and three are oil dominant. The flow patterns where water is the continuous phase are: i)
dispersion of oil in water, ii) emulsion or very fine dispersion of oil in water and iii) churn flow. For
oil dominated flow patterns, the three most common flow patterns are: i) water in oil churn flow, ii)
dispersion of water in oil and iii) emulsion or very fine dispersion of oil in water. Annular flow in
vertical pipes can only be observed for very viscous oils [6].
Figure 3 From Flores 1997 [6]
In vertical flow, churn flow is characterized by irregular shapes of continuous oil phase and
continuous water phase. As the mixture velocity increases the droplets size decreases until finally
homogeneous droplets are formed [1].
For low superficial velocities there are large bubbles of oil in a continuous water phase. When the
water velocity increases the bubbles break and the oil in water emulsion takes place. The same
happens when the oil velocity is the one that increases, transforming the flow pattern into a water in
oil emulsion [23].
According to Jing-yu et al. [2010], the main difference between upward and downward vertical
flow for the same superficial velocities is the transition from water dominated flow patterns to oil
dominated flow patterns takes place under a lower superficial oil velocity, which is due to the fact
that the slip velocity in downward flow is larger for the same input conditions.
2.3 Inclined pipes
Atmaca (2007) [7] states that the difference of flow patterns encountered in inclined pipes
differences from those found in horizontal pipes because of the effect of gravity force. In inclined
pipes this force has two components, normal to and parallel to the pipe axis. The normal component
promotes the separation of the phases, while the parallel component will have a different effect
depending on the direction of the flow [7]. For downward flow, water velocity will be higher than
for horizontal flow, while for upward flow it will be lower.
Brauner (2002) states that stratified flow can be found until a 30° inclination. However, taking into
account the low density difference, to solve the interface behavior it is necessary to consider the
wetting properties of both liquids and the surface tension.
As Yusuf et al. (2012) [18] establishes, there is some literature that tries to explain the effect of pipe
geometry over flow patterns; however, there is few literature that tries to explain the effect of oil
viscosity over flow patterns.
Authors as Russell et al. (1959) [24], Oglesby (1979) [12], Arirachakaran et al. (1989) [13], Trallero
(1995) [14], Alkaya (2000) [15] and Mckibben et al. (2000) [25] have found that the viscosity has
an important effect over flow patterns, pressure drop and liquid holdup [2]. Yusuf et al. (2012)
studied the effect of oil viscosity in flow patterns in horizontal pipes by studying each flow pattern
separately. The authors divided their results by stratified, bubbly, annular, dual continuous,
dispersion of oil in water, and dispersion of water in oil flows, and compared their experimental
results with those founded in the literature.
In stratified flows, the effect of viscosity depends on the oil velocity. For low oil velocities, a higher
oil viscosity leaded to a bigger stratified flow zone, this is, higher water velocities were needed to
make a transition to a different flow pattern. On the contrary, for high oil velocity, the water
velocity needed to make a transition to dual continuous flow was lower as the oil viscosity
increased [18].
According to the results of Angeli and Hewitt (2000) and Raj et al. (2005), there is no annular flow
for low viscous oils. As the viscosity increases, the probability of observing this flow pattern is
higher, as a higher oil viscosity leads to a higher chance for intermittent flows to form [18]. Finally,
Yusuf et al. (2012) observed that as the oil viscosity increased, the transition to dispersed flow (oil
in water or water in oil) was slower, as the shear force needed to break the bubbles was higher.
Alwahaibi et al. (2014) use the result of Yusuf et al. (2012) to study the effect of the pipe diameter.
They concluded that there is a significant influence over the flow patterns and the pressure drop, as
the boundaries shift substantially [26]. However, as Angeli and Hewitt (2000) remarked, it is also
important to take into account the wetting characteristics of the pipe and the initial configuration of
the phases, as it can affect significantly the development of the flow pattern [27].
If there is a consensus between all the authors here quoted, is that further investigation is required,
and tools able to explain in a more objective way the patterns that are obtained under certain
conditions must be developed, for low and high viscous fluids.
3. Datasets
In this work, an experimental and a synthetic dataset were used. The first one was obtained by a
literature review of liquid - liquid flows and the second one was generated by means of OLGA
2014.3 Multiphase toolkit.

3.1 Experimental Dataset
The experimental dataset consists of 8073 registers and was created based on the report of 42
authors, as shown in Table 1. These authors carried on experiments for different liquid-liquid
superficial velocities (i.e. the volumetric flow rate or each phase divided by the total cross-sectional
flow area), pipe lengths, diameters and orientations. However, it is noted that most of the
experiments where carried for horizontal inclinations (46.94 %). Is worth to be mentioned that only
straight pipes were covered.
Table 1 Experimental Data
Author # Data
points Fluids Diameter [m] L/D
Vs1 water
[m/s]
Vs1 oil
[m/s]
Pipe
inclination [°]
Roughness
[m]
Abduvayt
(2004) [28] 216
Water -
Kerosene 0.1040 1153.8 0.02 - 1.61
0.01 -
1.55
- 3, - 0.5, 3,
90 4.50E-05
Abubakar
(2015) [29] 150
Water - Oil
(Shell Tellus S2
V 15)
0.0306 326.8 0.01 - 1.35 0.01 - 1.35 0 1.00E-04
Alkaya
(2000) [15] 282 Water - Oil 0.0508 415.9 0.02 - 1.71 0.02 - 1.7 - 5, - 1,0,1,5 1.00E-04
Al - Wahaibi
(2014) [26] 196
Water - Mineral
Oil 0.0190 421.1 0.12 - 1.68 0.06 - 1.71 0 1.00E-04
Al - Yaari
(2009) [30] 102 Water - Oil 0.0254 393.7 0.5 - 3.0 0.1 - 0.9 0 1.00E-04
Angeli
(1996) [31] 179
Water -
Kerosene 0.0254 393.7 0.09 - 2.65 0.09 - 2.66 - 0.5 4.50E-05
Atmaca
(2007) [7] 306
Water - Mineral
Oil 0.0508 271.7 0.02 - 1.78 0.02 - 1.75
0,1,2, - 1, - 2, -
5 1.00E-07
Ayello
(2008) [32] 299
Water - Model
Oil 0.1000 250.0 0.01 - 0.22 0.47 - 2.51 0,5,45,90 4.60E-05
Bannwart
(2004) [33] 885
Water - Heavy
Crude Oil 0.0284 88.0 0.01 - 2.45 0.02 - 0.51 0.9 1.00E-07
Bannwart
(2012) [34] 16
Water - Heavy
Oil 0.0620 4838.7 0.03 - 0.08 0.15 - 0.63 90 1.00E-07
Cai (2012) [35] 100 Water -
Paraffinic Oil 0.1000 140.0 0.02 - 0.22 0.5 - 2.51 0 4.50E-05
Castro
(2011) [36] 144 Water - Oil 0.0260 461.5 0.02 - 1.26 0.02 - 1.23
- 20, - 10, 0,
10, 20 1.00E-07
Dasari
(2013) [37] 536
Water - Lube
Oil 0.0250 120.0 0.1 - 1.07 0.02 - 1.24 0 1.00E-04
Du (2012) [38] 103 Water - White
Oil 0.0200 120.0 0.18 - 1.5 0.25 - 4.06 90 4.50E-05
Elseth
(2001) [39] 84 Water - Oil 0.0563 186.5 0.06 - 2.41 0.07 - 1.98 0 1.00E-04
Flores
(1997) [6] 484
Water - Refined
mineral oil 0.0508 305.9 0.04 - 1.32 0.04 - 1.3 45, 60, 75, 90 1.00E-04
Foroughi
(2010) [40] 102
Water -
Silicone Oil 0.0003 288.0 0.002 - 0.75 0. - 0.02 0 1.00E-04
Ghosh
(2010) [5] 102
Water - Lube
Oil 0.0120 208.3 0.07 - 1.52 0.07 - 0.78 - 90 1.00E-07
Ghosh
(2011) [8] 191
Water -
Lubricating
Oil/Kerosene
0.0120 83.3 0.07 - 1.96 0.07 - 1.21 - 90 1.00E-07
Ismail
(2015) [41] 72
Water - Waxy
crude oil 0.0508 1311.0 1E- 4 - 0.01 1E-4 - 0.01 0 4.50E-05
Kumara
(2009) [19] 504
Water - Exxsol
D60 oil 0.0560 267.9 0.24 - 1.51 0.02 - 0.98 - 1, 0, 1, 5 1.00E-04

Li (2010) [42] 46
Water -
limpidity
mineral oil
0.0500 400.0 2E-4 - 0.09 6E-4 –5E-3 0 1.00E-04
Liu (2008) [43] 124 Water - Oil 0.0261 371.6 0.07 - 0.64 0.05 - 0.96 0 4.50E-05
Lovick
(2004) [17] 100 Water - Oil 0.0380 210.5 0.07 - 2.7 0.07 - 2.41 0 4.50E-05
Lum
(2006) [44] 201 Water - Oil 0.0380 210.5 0.06 - 2.25 0.06 - 2.26 - 5, 5, 10 4.50E-05
Mukhaimer
(2015a) [45] 127
Water/Salty
Water -
Kerosene
0.0225 355.6 0.06 - 1.91 0.08 - 2.1 0 5.00E-06
Nadler
(1997) [46] 79
Water - Mineral
White Oil 0.0590 813.6 0.02 - 1.31 0.02 - 1.45 0 2.01E-02
Poesio
(2008) [47] 43
Water - High
viscosity oil 0.0210 428.6 0.40 - 1.09 0.23 - 0.41 0 1.00E-07
Rodriguez
(2005) [16] 153 Water - Oil 0.0828 181.2 0.02 - 2.57 0.02 - 3.03 0, - 2, - 5,5 4.60E-05
Rodriguez
(2006) [48] 102 Water - Oil 0.0828 181.2 0.02 - 2.62 0.02 - 3.03 1.5,1,2 4.50E-05
Rodriguez
(2011) [49] 33 Water - Oil 0.0260 396.2 1.00 - 3.00 0.2 - 1.00 0 1.00E-07
Soleimaini
(1997) [50] 351 Water - Oil 0.0254 381.9 0.05 - 3.15 0.08 - 3.15 0 4.50E-05
Souza
(2013) [51] 331
Water - Heavy
Oil 0.0260 461.5 0.02 - 2.99 0.02 - 1.01 0 1.00E-07
Tan (2015) [52] 68 Water - White
Oil 0.0500 300.0 0.04 - 2.06 0.07 - 2.0 0 4.60E-05
Trallero
(1997) [4] 250
Water - White
Oil 0.0501 310.0 0.01 - 1.79 0.01 - 1.62 0 1.00E-04
Vielma
(2008) [9] 154
Water - Refined
mineral oil 0.0508 415.9 0.02 - 1.81 0.02 - 1.75 0 5.00E-06
Wang
(2010) [53] 161
Water - Mineral
Oil 0.0254 2047.2 0.02 - 0.24 0. - 1.03 0 1.00E-07
Xu (2008) [54] 29 Water - White
Oil 0.0500 260.0 0.07 - 3.15 0.02 - 2.02 0 1.00E-04
Xu (2010) [55] 95 Water - Diesel
Oil 0.0200 350.0 0.05 - 1.67 0.04 - 0.8 0 1.00E-04
Yao
(2009) [56] 74
Water - Crude
Oil 0.0257 2023.3 0.05 - 0.76 0.1 - 0.88 0 4.60E-05
Yusuf
(2012) [18] 283
Water - Mineral
Oil 0.0254 255.9 0.10 - 1.94 0.06 - 1.8 0 1.00E-04
Zhai
(2015) [57] 216 Water - Oil 0.0200 60.0 0.11 - 2.24 0.1 - 2.59 0 1.00E-04
Total range 8073 - 3E-4 - 0.104 83.3-
4838.7 2E-4 – 3.15 0.01 - 4.06 -90 - 90 1E-7- 1E-4
1 Superficial Velocity
The distribution of experimental data over different parameters is shown from Figure 4 to Figure 6.
According to the authors, the inner diameter of the pipe used in the experiments corresponds with
the diameters used in the Oil and Gas Industry, which can vary from 50.8mm to 200mm.

Figure 4 Distribution of experimental data based on inner diameter
In figure 5 the number of experimental data reported by pipe inclination is shown. It can be seen
that a high proportion of the experimental data found in the literature corresponds to horizontal
pipes, and in a lower degree, to vertical pipes. For inclined pipes the number of data is considerably
lower even though in the Oil industry inclinations in the range of ±5° is common [15].
Figure 5 Distribution of experimental data by pipe inclination
In Figure 6, the distribution of the experimental data based on the pipe material where the flow
patterns were developed is shown. It is notorious that the pipe material used is in general, similar to
the one used in industry [58].

Figure 6 Distribution of experimental data by pipe material
As it is evidenced in figure 7, the recollected database covered a wide range of reported
experiments. It should be noted, the variation of the parameters in figure 7, i.e. Oil viscosity,
Interfacial tension and Oil density, affects the results. Thus, extrapolation should not be done.
Figure 7 Distribution of experimental data by oil viscosity (a), interfacial tension (b), oil density (c).
Based on the data compilation, the range for each parameter that has to be taken into account is
reported in table 2.

Table 2 Ranges for experimental and synthetic datasets.
Parameter Experimental
Minimum Maximum
Pipe inner diameter [m] 0.25 0.106
Pipe angle [°] -90 90
Wall Roughness [m] 1.00E-07 1.00E-04
Pipe Length [m] 0.072 300
Oil superficial velocity [m/s] 1.00E-04 4.06
Water superficial velocity [m/s] 1.00E-04 3.15
Pressure [Pa] 101300 353648
Oil density [kg/m3] 780 988.02
Degree API 49.54 11.43
Water density [kg/m3] 980 1071.8
Oil viscosity [Pa s] 0.0012 2
Water viscosity [Pa s] 0.35 1.2
Tension [N/m] 0.013 0.05
3.2 Synthetic Dataset:
Due to the uneven distribution of experimental data, it was intended to expand the data pool with
synthetic registers. Taking into account the high precision of OLGA Multiphase Toolkit 2014.3 in
the prediction of liquid hold-up, it was considered as the proper software for the task. However, the
liquid - liquid flow patterns used by OLGA were more general that those reported in the literature,
which are intended to use in this report. Furthermore, they did not allowed to study the behavior of
the dispersion phenomena. As a consequence, it was decided to not use OLGA Multiphase Toolkit
as synthetic data generator, but only as a tool to validate experimental data and to complete partial
reported data.
4. Data validation
Considering that the data pool has been created based on different authors’ results, a filter has to be
developed, in order to recognize incoherent registers and minimize their effect over the results.
4.1 Experimental Data
To determine the set of the experimental data that should be used based on a tolerable error, the
same combination of parameters was simulated with OLGA Multiphase Toolkit and compared with
their corresponding experimental dataset by means of the water hold up.

Figure 8 Ratio between simulated and experimental water holdup within ±30% error
In figure 8 the relation between the reported water hold up and the simulated result is presented. It
can be seen that the tendency is to overestimate the water hold up. However, as 7033 registers did
not report it, the implementation of pattern recognition techniques to classify those registers as
acceptable or non-acceptable was necessary. To this end, K-nearest neighbors (KNN) pattern
recognition technique [59], Quadratic discriminant analysis (QDA) [60] and Support Vector
Machines (SVMs) [60] were tested.
KNN technique assumes that the data is distributed in space, so it is possible to have a notion of
distance. Thus, it classifies new data based on the class to which the k nearest neighbors belong.
QDA divides the space into a quadratic surface, classifying the observation into the group with the
smaller squared distance. Finally, SVMs construct a hyperplane in space giving the maximum
separation between classes, and classify new data based on the closest one.
To determine the tolerable error and the patterns recognition technique that should be implemented,
the performance of each classifier was analyzed for all the error span. As figure 9 shows, KNN had
the best performance, with a correct classification rate of 79.71 % under a tolerable error of 29 %.
Thus, the acceptable experimental data pool was then composed by all the registers whose error was
below 29 %. This data pool attempts to include as much available registers as it can without
compromising the reliability of results. As a result 6435 registers are used.

Figure 9 Performance of classifiers for different tolerable errors
4.2 Synthetic Data
In an attempt to expand the data pool, registers who did not reported the liquid hold up were
compared by means of the flow pattern with those registers that were already classified as
acceptable data. When the reported flow pattern and the flow patterns that was given by the
corresponding classification was the same, it was assumed that the observation was correct, and
OLGA Multiphase Toolkit was used to complete the liquid hold up register information.
It should be said that in order to compare the flow patterns, it was not possible to use the 60 flow
patterns reported in the literature, as the quantity made it quite extensive. It was observed that most
of the times, it was the name that the authors used the one that differ from each other, nevertheless,
the description and characteristics of the flow were the same. In view of that, they were organized
in 11 groups, based on Trallero [4], Flores [6] and Atmaca [7] classification.
Once the classification was made, the final data pool consisted of 2775 registers. It should be
noticed that the difficulty of generating synthetic data to fill the universe and the uneven
distribution of the available data will have a significant effect over the flow pattern maps, and the
results should be analyzed based on those limitations. As an example, in figure 10 the acceptable
data is represented for a pipe with 5° inclination, and the gaps are quite significant.
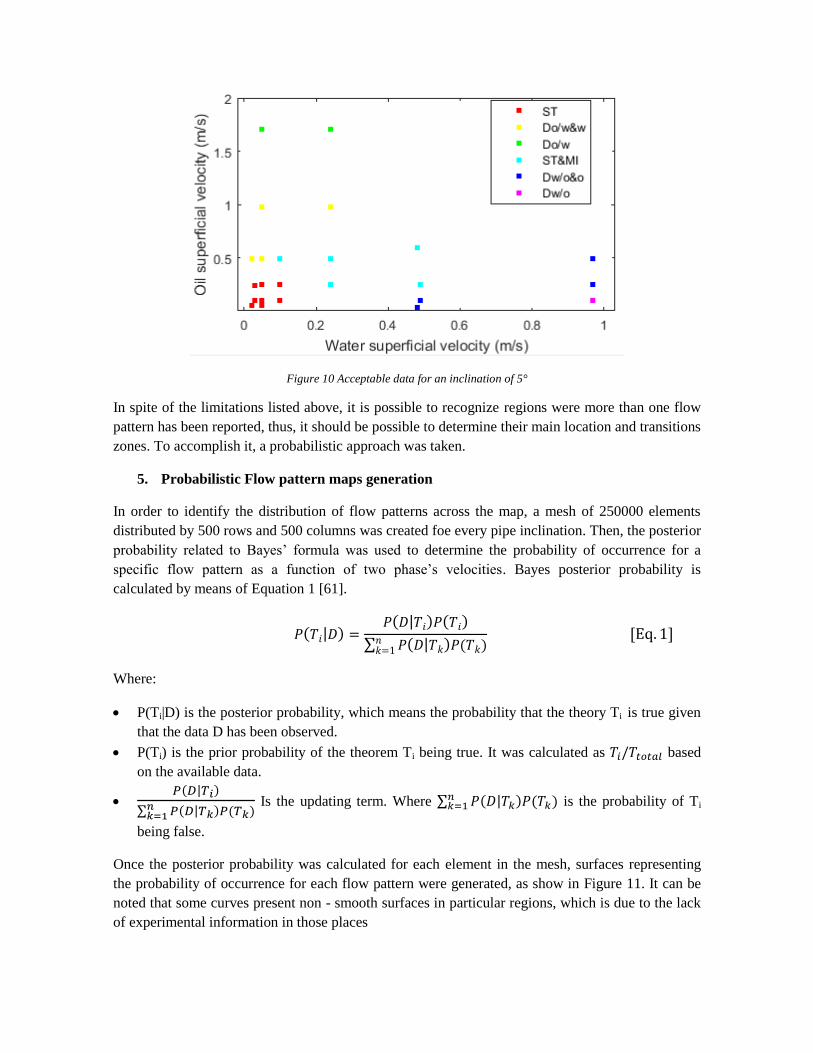
Figure 10 Acceptable data for an inclination of 5°
In spite of the limitations listed above, it is possible to recognize regions were more than one flow
pattern has been reported, thus, it should be possible to determine their main location and transitions
zones. To accomplish it, a probabilistic approach was taken.
5. Probabilistic Flow pattern maps generation
In order to identify the distribution of flow patterns across the map, a mesh of 250000 elements
distributed by 500 rows and 500 columns was created foe every pipe inclination. Then, the posterior
probability related to Bayes’ formula was used to determine the probability of occurrence for a
specific flow pattern as a function of two phase’s velocities. Bayes posterior probability is
calculated by means of Equation 1 [61].
𝑃(𝑇𝑖|𝐷) =𝑃(𝐷|𝑇𝑖)𝑃(𝑇𝑖)
∑ 𝑃(𝐷|𝑇𝑘)𝑃(𝑇𝑘)𝑛𝑘=1
[Eq. 1]
Where:
P(Ti|D) is the posterior probability, which means the probability that the theory Ti is true given
that the data D has been observed.
P(Ti) is the prior probability of the theorem Ti being true. It was calculated as 𝑇𝑖/𝑇𝑡𝑜𝑡𝑎𝑙 based
on the available data.
𝑃(𝐷|𝑇𝑖)
∑ 𝑃(𝐷|𝑇𝑘)𝑃(𝑇𝑘)𝑛𝑘=1
Is the updating term. Where ∑ 𝑃(𝐷|𝑇𝑘)𝑃(𝑇𝑘)𝑛𝑘=1 is the probability of Ti
being false.
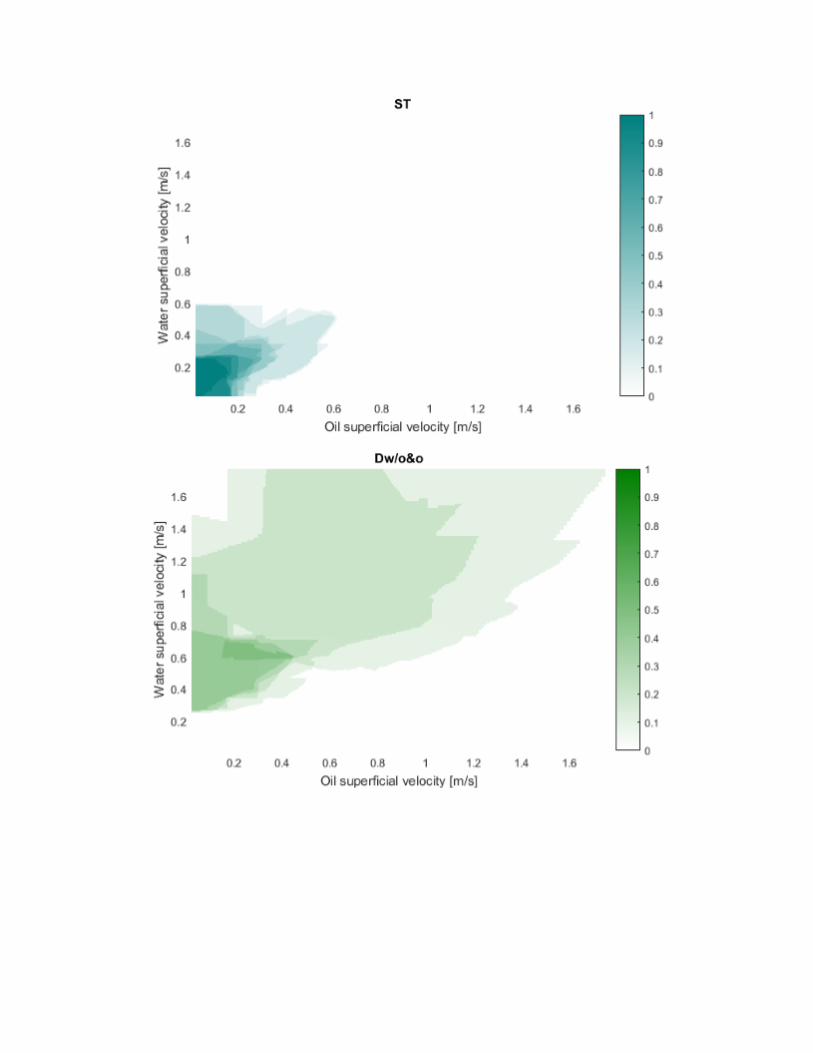
Once the posterior probability was calculated for each element in the mesh, surfaces representing
the probability of occurrence for each flow pattern were generated, as show in Figure 11. It can be
noted that some curves present non - smooth surfaces in particular regions, which is due to the lack
of experimental information in those places
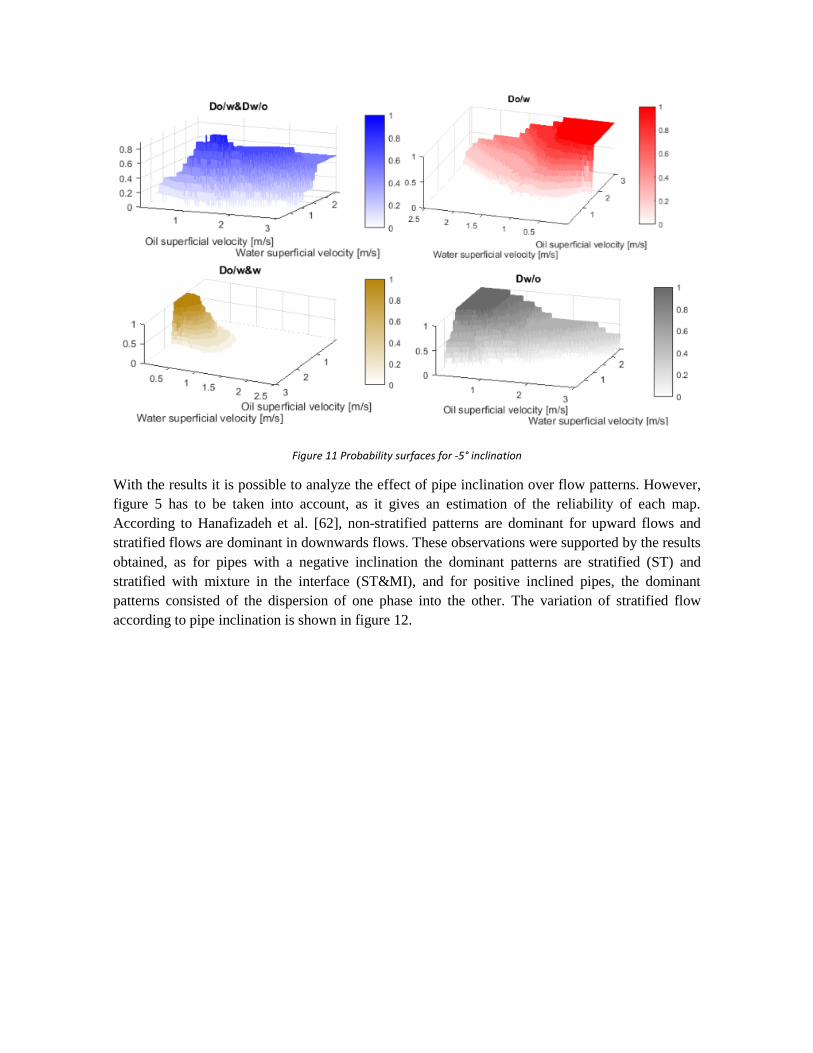
Figure 11 Probability surfaces for -5° inclination
With the results it is possible to analyze the effect of pipe inclination over flow patterns. However,
figure 5 has to be taken into account, as it gives an estimation of the reliability of each map.
According to Hanafizadeh et al. [62], non-stratified patterns are dominant for upward flows and
stratified flows are dominant in downwards flows. These observations were supported by the results
obtained, as for pipes with a negative inclination the dominant patterns are stratified (ST) and
stratified with mixture in the interface (ST&MI), and for positive inclined pipes, the dominant
patterns consisted of the dispersion of one phase into the other. The variation of stratified flow
according to pipe inclination is shown in figure 12.

Figure 12 Effect of pipe inclination over ST&MI flow pattern
In general, the results agree with the literature, with slightly differences for 5° inclination, as the
quantity of accepted data was lower. For example, in figures 13 and 14 the transition between
stratified flow and stratified with mixing in the interface for horizontal pipes and slightly inclined
a) -0.5° inclination
b) -1° inclination
c) 5° inclination

pipes is presented, and it corresponds with those found in the literature. The results for other
inclinations are in the appendix A.
Figure 13 horizontal pipe
Figure 14 1° inclined pipe
It should be noted that the probability of stratified flow with mixing in the interface for very
inclined pipes is small, and as none of the consulted references reported it, this pattern disappears
after 5°, which is not true.
After the probability surfaces were generated for each flow pattern and pipe leaning, an attempt of
creating one flow pattern map for each inclination, with all the probabilities functions included, was
made. However, as many dispersion patterns were used, the data overlapped and difficult the
reading of probabilities. In order to overcome these problems, a tool was developed, which offers
different plotting options and calculates all probabilities for new observations. In this way, it is
possible to know the pattern distributions in a more comprehensive way.
6. Developed tool
The probabilistic flow pattern map generator, based on pipe inclination was developed using Matlab
2015a®. First, an Excel file with the two phases’ velocities, inclination and diameter of the pipe is
loaded. Then, the data must be analyzed in order to determine which recognition technique and
tolerable error is chosen, and finally, the preferred inclination must be selected, which belongs to

those available in the dataset. Moreover, if the loaded dataset includes different pipe diameters, a
range can be selected, thus, the effect of the diameter over flow patterns could be studied.
7. Conclusions and future work
A probabilistic tool is developed to generate flow pattern maps based on experimental data.
Different recognitions techniques are implemented to recognize acceptable data under a tolerable
error, which are used afterwards as the base to flow pattern maps generation. These functions are
integrated via a developed tool and furthermore, the possibility to study the effect of pipe diameter
over the flow patterns is presented.
As many dispersion patterns are taken into account, one map per inclination was insufficient to
provide all the information, a decision to generate figures for each pattern was taken and a new
function was included in the tool. The new function allows the recognition of the same input data in
all the different figures and returns the probabilities associated with them. As a consequence, the
transitions boundaries are treated as zones.
An extension of the database is necessary to make the tool more precise, as many registers could not
be used because of the lack of liquid holdup information and synthetic data did not include the same
level of disaggregation of flow patterns. Moreover, the developed tool could be updated, to study
the effect of viscosities, pipe roughness and interfacial surface among others over the flow pattern
transitions.

References
[1] Brauner and Neimar, "Modelling and Control of Two-Phase Phenomena: Liquid-Liquid Two-
Phase Flow Systems," Tel-Aviv University, Tel-Aviv, 2002.
[2] A. Izwan, I. Ismail, M. Zoveidavianpoor, R. Mohsin, A. Piroozian, M. Shahir and M. Zaiga,
"Experimental investigation of oil-water two-phase flow in horizontal pipes: Pressure losses,
liquid holup and flow patterns," Journal of Petroleum Science and Engineering, vol. 127, pp.
409-420, 2015.
[3] K. Kee, S. Richter, M. Babij and S. Nesic, "Flow Patterns and Water Wetting in Oil-Water Two
Phase Flow – A Flow Loop Study," in Corrosion 2014, Texas, 2014.
[4] J. Trallero, C. Sarica and J. Brill, "A Study of Oil/Water Flow Patterns in Horizontal Pipes," SPE
Production & Facilities, vol. 12, no. 3, pp. 165-172, 1997.
[5] S. Ghosh, D. Das and P. Das, "Hydrodynamics of Lube oil-water downflow through a vertical
pipe," in 7th International Conference on Multiphase Flow, Tampa, 2010.
[6] J. Flores, T. Chen, C. Sarica and J. Brill, "Characterization of Oil-Water Flow Patterns in Vertical
and Deviated Wells," SPE International, vol. II, no. 38810, pp. 601-610, 1997.
[7] S. Atmaca, "Characterization of oil-water flows in inclined pipes," The University of Tulsa,
Tulsa, 2007.
[8] S. Ghosh, G. Das and P. Kumar, "Inception and Termination of the Core-Annular Flow Pattern
for Oil-Water Downflow Through a Vertical Pipe," American Institute of Chemical Engineers,
vol. 0, no. 0, pp. 1-10, 2011.
[9] M. Vielma, S. Atmaca, C. Sarica and H. Zhang, "Characterization of Oil / Water Flows in
Horizontal Pipes," SPE Projects, Facilities and Construction, University of Tulsa, 2008.
[10] M. Charles, G. Govier and G. Hodgson, "The horizontal pipe line flow of equal density oil–
water mixture," Journal of Chemical Engineering, vol. 39, pp. 27-29, 1961.
[11] M. Malinowsky, "An experimental study of Oil-Water and Air-Oil-Water Flowing Mixtures in
Horizontal Pipes," The University of Tulsa, 1975.
[12] K. Oglesbly, "An experimental study on the effects of oil viscosity, mixture velocity and water
fraction on horizontal oil water flow," The University of Tulsa, Tulsa, 1979.
[13] S. Arirachakaran, K. Oglesby, M. Malinowsky, O. Shoham and J. Brill, "An Analysis of Oil/Water
Flow Phenomena in Horizontal Pipes," in SPE Production Operations Symposium, Oklahoma

City, 1989.
[14] J. Trallero, "Oil-Water Flow Patterns in Horizontal Pipes," The University of Tulsa, Tulsa, 1995.
[15] B. Alkaya, Oil Water flow patterns and pressure gradients in slightly inclined pipes, Tulsa: The
University of Tulsa, 2000.
[16] O. Rodriguez and R. Oliemans, "An inverted flow pattern dependent model for horizontal and
inclined oil-water well logging," in 18th International Congress of Mechanical Engineering,
Ouro Preto, 2005.
[17] J. Lovick and P. Angeli, "Experimental studies on the dual continuous flow pattern in oil-water
flows," International Journal of Multiphase Flow, no. 30, pp. 139-157, 2004.
[18] N. Yusuf, Y. Al-Wahaibi, A. Al-Ajmi, A. Olawale and I. Mohammed, "Effect of oil viscosity on
the flow structure and pressure gradient in horizontal oil-water flow," Chemical Engineering
Research and Design, vol. 90, pp. 1019-1030, 2012.
[19] W. Kumara, B. Halvorsen and M. Melaaen, "Pressure drop, flow pattern and local water
volume fraction measurements of oil–water flow in pipes," Measurement Science and
Technology, vol. 20, pp. 1-19, 2009.
[20] A. Mukhaimer, A. Al.Sarkhi, M. Nakla, W. Ahmen and L. AL-Hadhrami, "Pressure drop and flow
pattern of oil-water flow for low viscosity oils: Role of mixture viscosity," International Journal
of Multiphase Flow, vol. 73, pp. 90-96, 2015.
[21] S. Bhagwat and A. Ghajar, "Flow patterns and void fraction in downward two phase flow,"
ASME Early Career Technical Conference, vol. Fayetteville, 2011.
[22] A. Dalkilic and S. Wongwises, "An investigation of a model of the flow pattern transition
mechanism in relation to the identification of annular flow of R134a in a vertical tube using
various void fraction models and flow regime maps," Experimental Thermal and Fluid Science,
vol. 34, pp. 692-705, 2010.
[23] X. Jing-yu, L. Dong-hui and W. Ying-xiang, "Investigations of phase inversion and frictional
pressure gradients in upward and downward oil-water flow in vertical pipes," International
Jurnal of Multiphase Flow, vol. 36, pp. 930-939, 2010.
[24] T. Russell, G. Hodgson and G. Govier, "Horizontal pipeline flow of mixtures of Oil and Water,"
The Canadian Journal of Chemical Engineering, pp. 9-17, 1959.
[25] M. McKibben, R. Gillies and C. Shook, "A laboratory investigation of horizontal well heavy Oil-
Water Flows," The canadian journal of chemical engineering, vol. 78, pp. 743-751, 2000.

[26] T. Al-Wahaibi, Y. Al-Wahaibi, A. Al-Ajmi, R. Al-Hajri, N. Yusuf and A. Olawale, "Experimental
investigation on flow patterns and pressure gradient through two pipe diameters in horizontal
oil–water flows," Journal of Petroleum Science and Engineering, vol. 122, pp. 266-273, 2014.
[27] P. Angeli and G. Hewitt, "Flow structure in horizontal oil±water ¯ow," International Journal of
Multiphase Flow, vol. 26, p. 1117±1140, 2000.
[28] P. Abduvays, R. Manabe, T. Watanabe and N. Arihara, "Analisis of Oil-Water Flow Test in
Horizontal, Hilly-Terrain, and Vertical Pipes," in SPE90096, Houston, Texas, 2004.
[29] A. Abubakar, Y. Al.Wahibi, A. Al-Hashmi and A. E. M. Al-Ajmi, "Effect of low interfacila tension
on flow patterns, pressure gradients and holdups of medium-viscosity oil/water flow in
horizontal pipe," Experimental Thermal and Fluid Science, vol. 68, pp. 58-67, 2015.
[30] M. S. A. Al-Yaari, B. Abu-Sharkh, U. Al-Mubaiyedh and A. Al-sarkhi, "Effect of drag reducing
polymers on oil–water flow in a horizontal pipe," International Journal of Multiphase Flow,
vol. 35, pp. 516-524, 2009.
[31] P. Angeli, Liquid-liquid dispersed flows in horizontal pipes, London, 1996.
[32] F. Ayello, C. Li, X. Tang and J. N. S. Cai, "Determination of phase wetting in oil-water pipe
flows," in NACE International, Houston, Texas, 2008.
[33] A. Bannwart, O. Rodriguez, C. Carvalho and I. V. R. Wang, "Flow patterns in heavy crude oil-
water flow".
[34] A. Bannwart, O. Rodriguez, J. Biazussi, F. Martins and M. C. C. Selli, "Water-assisted flow of
heavy oil in a vertical pipe: Pilot-scale experiments," International Journal of Chemical Reactor
Engineering, vol. 10, pp. 1-18, 2012.
[35] J. Cai, C. Li, X. Tang, F. Ayello, S. Richter and S. Nesic, "Experimental study of water wetting in
oil–water two phase flow-Horizontal flow of model oil," Chemical Engineering Science, vol.
2012, pp. 334-344, 2012.
[36] M. Castro, C. Pereira, F. Mendes and O. Rodriguez, "Holdup, pressure drop and objective
classification of inclined oil-water stratified flow," BHR group, vol. 15, pp. 277-291, 2011.
[37] A. Dasari, A. Desamala, A. Kumar and T. Mandal, "Experimental Studies and Probabilistic
Neural Network Prediction on Flow Pattern of Viscous Oil-Water Flow through a Circular
Horizontal Pipe," Industrial & Engineering Chemistry Research, vol. 52, pp. 7975-7985, 2013.
[38] M. Du, N. Jing, Z. Gao, Z. Wang and L. Zhai, "Flow pattern and water holdup measurements of
vertical upward oil–water two-phase flow in small diameter pipes," International Journal of

Multiphase Flow, vol. 41, pp. 91-105, 2012.
[39] G. Elseth, An Experimental Study of Oil / Water Flow in Horizontal Pipes, Kjolnes: The
Norwegian University of Science and Technology (NTNU), 2001.
[40] H. Foroughi and M. Kawaji, "Immiscible liquid-liquid two-phase flow in a microchannel: flow
patterns and pressure drop characteristics," in 7th International Conference on Multiphase
Flow, Tampa, 2010.
[41] A. Ismail, I. Ismail, M. Zoveidavianpoor, R. Mohsin, A. Piroozian, M. Misnan and M. Sariman,
"Experimental investigatio nof oil–watertwo-phase flow in horizontal pipes: Pressure losses,
liquid holdup and flow patterns," Journal of Petroleum Science and Engineering, vol. 127, pp.
109-420, 2015.
[42] D. Li, J. Xu, F. Feng and Y. Wu, "The Flow Rate Measurement of Oil-Water Two Phase Flow
Using Turbine Flow Meter," in 7th International Conference on Multiphase Flow, Tampa, 2010.
[43] Y. Liu, H. Zhang, S. Wang and J. Wnag, "Prediction of Pressure Gradient and Holdup in Small
Eötvös Number Liquid-Liquid Segregated Flow," Chinese Journal of Chemical Engineering, vol.
16, no. 2, pp. 184-191, 2009.
[44] J. Lum, T. Al.Wahibi and P. Angeli, "Upward and downward inclination oil–water flows,"
International Journal of Multiphase Flow, vol. 32, pp. 413-435, 2006.
[45] A. Muckhaimer, A. Al-Sarkhi, M. Nakla, W. Ahmed and L. Al-Hadhrami, "Effect of water salinity
on flow pattern and pressure drop in oil-water flow," Journal of Petroleum Science and
Engineering, vol. 128, pp. 145-149, 2015.
[46] M. Nädler and D. Mewes, "Flow induces emulsificatio in the flow of two immiscible liquids in
horizontal pipes," International Journal of Multiphase Flow , vol. 23, no. I, pp. 55-68, 1997.
[47] P. Poesio, "Experimental determination of pressure drop and statistical properties of oil-water
intermittent flow through horizontal pipe," Experimental Thermal and Fluid Science, vol. 32,
pp. 1523-1529, 2008.
[48] O. Rodriguez and R. Oleimans, "Experimental study on oil–water flow in horizontal and
slightly inclined pipes," International Journal of Multiphase Flow, vol. 32, pp. 323-343, 2006.
[49] I. Rodriguez, H. Yamaguti and M. Castro, "Drag reduction phenomenon in viscous oil-water
dispersed pipe flow: Experimental Investigation and phenomenological modeling," AIChE
Journal, vol. 0, no. 0, pp. 1-11, 2011.
[50] A. L. C. Soelimani and G. Hewitt, "Effect of mixers on flow pattern and pressure drop in
horizontal oil-water pipe flow," London, 1997.
[51] M. Souza and O. Rodriguez, "Transition from wavy stratified to drops in horizontal heavy oil-
water flow: a spatial phenomenon," in 8th International Conference on Multiphase Flow, Jeju,
Korea, 2013.
[52] C. Tan, F. Dong, F. Zhang and W. Li, "Oil-Water Two-Phase Flow Measurement with a V-Cone
Meter in a Horizontal Pipe," in International Instrumentation and MeasurementTechnology
Conference, Singapore, 2009.
[53] W. Wang and J. Gong, "Flow Regimes and Transition Characters of the High Viscosity oil-water
two phase flow," in SPE International Oil & Gas conference and exhibition, Beijing, 2010.
[54] J. Xu, Y. Wu, Y. Chang and J. Guo, "Experimental Investigation on the Holdup Distribution of
Oil-Water Two-Phase Flow in Horizontal Parallel Tubes," Chemical Engineering Technology,
vol. 37, no. 10, pp. 1536-1540, 2008.
[55] M. Xu, R. Xioing, Y. Li, J. Ynag, X. Luo, Y. Yu and T. Zhao, "Pattern transition and holdup
behaviors of horizontal oil-water pipe flow," in 7th International Conference on Multiphase
Flow, Tampa, 2010.
[56] H.-Y. Yao, Q.-P. Li and T. Wang, "An Experimental Investigation on Pressure Gradients in
Horizontal Heavy Oil-Water Pipe Flows," in Proceedings of the Nineteenth (2009) International
Offshore and Polar Engineering Conference, Osaka, Japan, 2009.
[57] L.-S. Zhai, N.-D. Jin, Y.-B. Zong, Q.-Y. Hao and Z.-K. Gao, "Experimental flow pattern map,
slippage and time-frequency representation of oil-water two-phase flow in horizontal small
diameter pipes," International Journal of Multiphase Flow, 2015.
[58] International Association of Oil & Gas Producers, "Material standards and committees for the
international oil & gas industry," OGP, 2009.
[59] K. Hechenbichler and K. Schliep, Weighted k-Nearest-Neighbor Techniques and Ordinal
Classification, Munich: LMU, 2004.
[60] F. Porter and I. Narsky, tatistical Analysis Techniques in Particle Physics:Fits, Density
Estimation and Supervised Learning, Pasadena: Wiley-VCH, 2013, pp. 221-227.
[61] V. K. Borooah, Conditional Probabilities and Bayes' Theorem, Shore Road, Newtownabbey:
University of Ulster, 2012.
[62] Hanafizadeh, J. P.Hojati and K. A., "Experimental Investigation of Oil- Water Two Phase Flow
Regime in an Inclined Pipe," Journal of Petroleum Science and Engineering, pp. 1-24, 2015.

Appendix A
Results for pipes deviated from de horizontal by -5°, -3°, -2°, -0.5° 0°, 2°, 3°, 5°, 90° are
here presented, as those inclinations were characterized by the presence of acceptable data
once the data was validated.
A.1) Results for a -5° inclined pipe


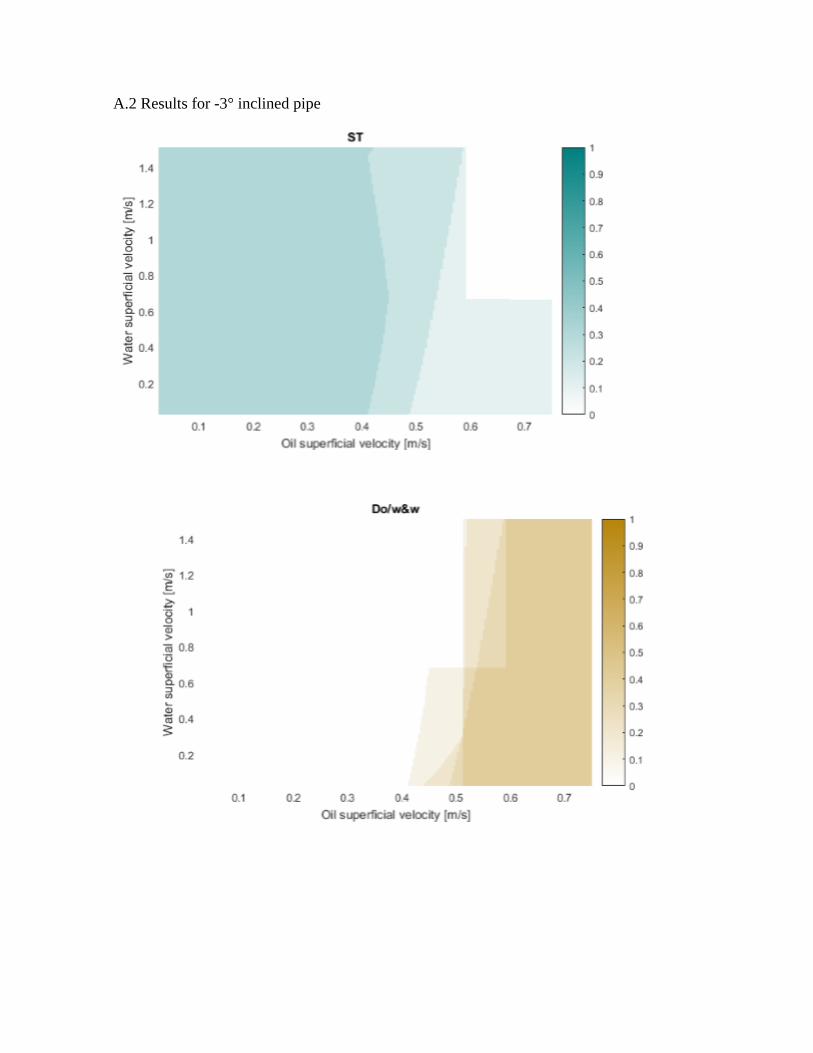
A.2 Results for -3° inclined pipe

A.3 Results for -2° inclined pipe

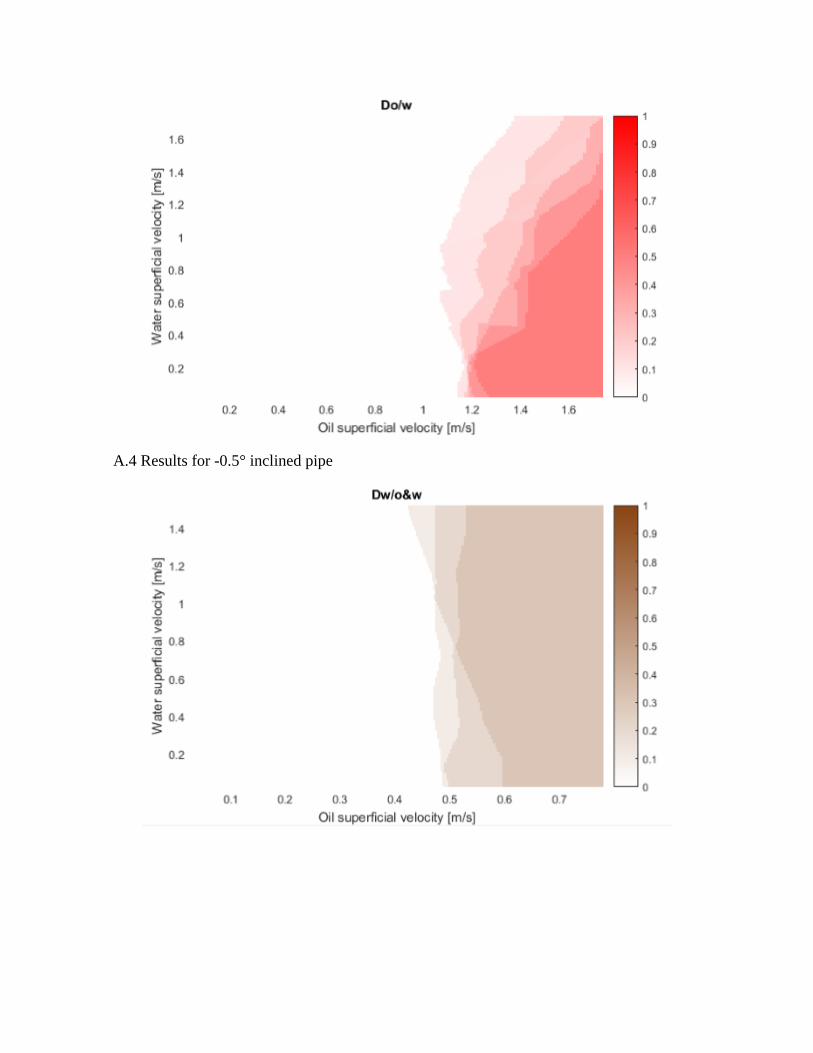
A.4 Results for -0.5° inclined pipe


A.5 Results for horizontal pipe


A.6 Results for 2° inclined pipe
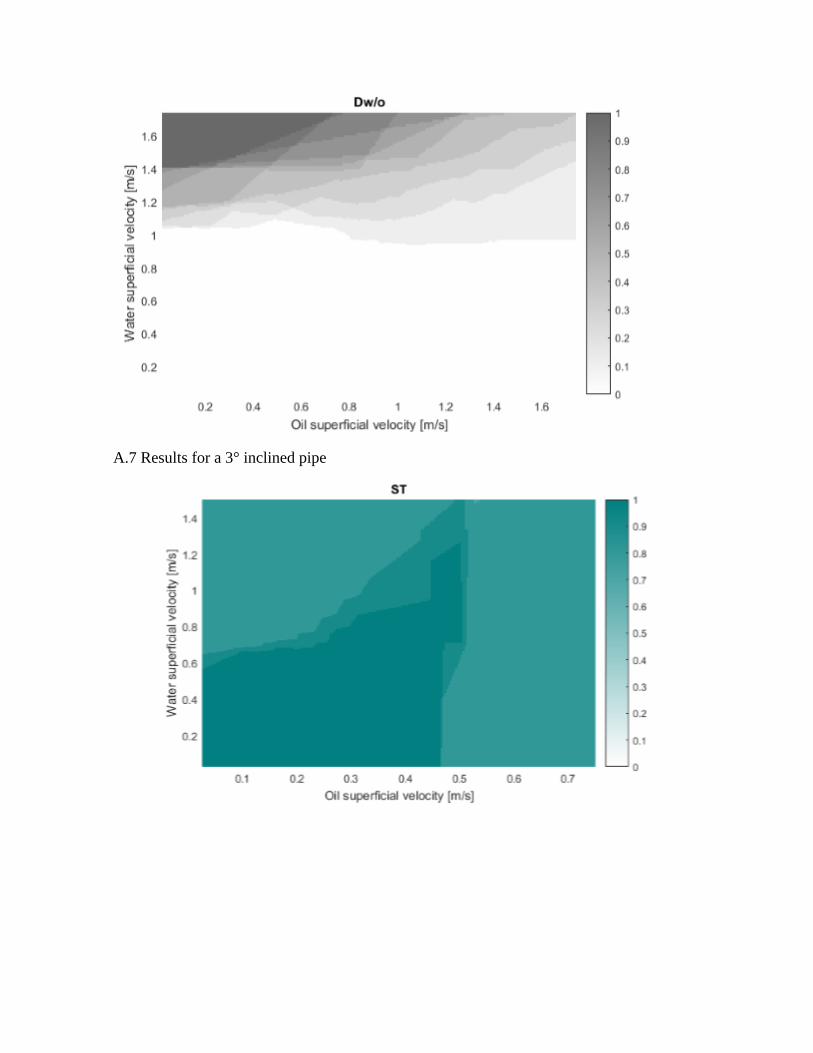
A.7 Results for a 3° inclined pipe


A.8 Results for a 5° inclined pipe


A.9 Results for a 90° inclined pipe