DGIS: Increasing Effectiveness and Efficiency through Probabilistic Decision Modelling

�����������������
���������
����������������������������������
Paper 01-01
Probabilistic Analysis ofCost-effectiveness Models:
Choosing Between Treatment Strategies forGastro-Esophogeal Reflux Disease
A. Briggs, R. Goeree, G. Blackhouse, B. O’Brien

CHEPA WORKING PAPER SERIES
The Centre for Health Economics and Policy Analysis (CHEPA) Working PaperSeries provides for the circulation on a pre-publication basis of research con-ducted by CHEPA faculty, staff, and internal associates. The Working PaperSeries is intended to stimulate discussion on analytical, methodological, quanti-tative, and policy issues in health economics and health policy analysis. Theviews expressed in the papers are the views of the author(s) and do not neces-sarily reflect the views of the Centre or its sponsors. Readers of Working Papersare encouraged to contact the author(s) with comments, criticism, and sug-gestions.
A list of papers in the Series and papers in the CHEPA Health Policy CommentarySeries, together with information on how to obtain specific titles, is provided atthe end of this paper. Further information can be obtained by contacting theCentre for Health Economics and Policy Analysis, Department of Clinical Epide-miology and Biostatistics, McMaster University, Hamilton, Ontario, Canada, L8N
3Z5; (905) 525-9140, Ext. 22135.
THE CENTRE FOR HEALTH ECONOMICS AND POLICY ANALYSIS
The Centre for Health Economics and Policy Analysis officially opened in May,1988. The objectives of the Centre include research, education, and the pro-motion of interactions among academic researchers and policy makers. CHEPAincludes researchers from a number of departments in the University includingClinical Epidemiology and Biostatistics, Management Science, Family Medicine,and Geography.

Paper 01-01 1
A. Briggs, R. Goeree, G. Blackhouse, B. O'Brien
Probabilistic analysis of cost-effectiveness models:choosing between treatment strategies for
Gastro-Esophogeal Reflux Disease
Andrew H. BriggsHealth Economics Research Centre
University of Oxford
Ron Goeree
Gord Blackhouse
Bernie O’BrienCentre for Evaluation of Medicines
McMaster University
Cite as: Briggs A, Goeree R, Blackhouse G, O'Brien B. Probabilistic Analysis of Cost-effec-
tiveness Models: Choosing Between Treatment Strategies for Gastro-Esophogeal Reflux Dis-
ease, McMaster University Centre for Health Economics and Policy Analysis Research Working
Paper 01-01, February,2001.

2 CHEPA Working Paper Series
Probabilistic Analysis of Cost-Effectiveness Models:Choosing Between Treatment Strategies for Gastro-Esophogeal Reflux Disease
Paper 01-01 3
A. Briggs, R. Goeree, G. Blackhouse, B. O'Brien
ABSTRACT
When choosing between mutually exclusive treatment options, it is common to construct a
cost-effectiveness frontier on the cost-effectiveness plane that represents efficient points from
among the treatment choices. Treatment options internal to the frontier are considered inefficient
and are excluded either by strict dominance or by appealing to the principle of extended
dominance. However, when uncertainty is considered, options excluded under the baseline
analysis may form part of the cost-effectiveness frontier. By adopting a Bayesian approach, where
distributions for model parameters are specified, uncertainty in the decision concerning which
treatment option should be implemented is addressed directly. The approach is illustrated using
an example from a recently published cost-effectiveness analysis of different possible treatment
strategies for gastro-esophageal reflux disease. It is argued that probabilistic analyses should be
encouraged since they have potential to summarise the strength of evidence in favour of particular
treatment choices.
4 CHEPA Working Paper Series
Probabilistic Analysis of Cost-Effectiveness Models:Choosing Between Treatment Strategies for Gastro-Esophogeal Reflux Disease
ACKNOWLEDGEMENTS
Participants at the workshop on “Health Economics and Outcomes Research: Making
Statistics More Relevant to Decision-Makers” held in Washington, DC, September 1998 and at
a Harvard Centre for Risk Analysis seminar, in particular Denny Fryback, Karl Claxton and
Milton Weinstein, for discussions concerning the issues addressed in this paper. Of course, all
errors are our own responsibility.

Paper 01-01 5
A. Briggs, R. Goeree, G. Blackhouse, B. O'Brien
1. Introduction
It is now increasingly common for economic evaluations to be conducted alongside
clinical trials. Recent research attention has been focussed on how to handle uncertainty in these
so-called stochastic cost-effectiveness analyses where patient level data are available on the
costs and effects of treatment options (O’Brien et al.1994; van Hout et al. 1994; Stinnett and
Paltiel, 1997). However, the majority of economic evaluations still employ a decision analytic
modelling framework to synthesise data from a number of sources (Briggs and Gray, 1999). Such
cost-effectiveness models are often described as deterministic analyses. Although the limitations
of simple univariate sensitivity analysis are well known, this remains the most popular technique
for handling uncertainty in cost-effectiveness models.
Probabilistic sensitivity analysis is an alternative approach which involves specifying
distributions for input parameters in the model and employing Monte Carlo simulation to sample
from these distributions allowing the joint effect of parameter uncertainty to be assessed
(Critchfield et al. 1986; Doubilet et al. 1985). A number of commentators have suggested that
probabilistic sensitivity analysis methods should be used to handle uncertainty in cost-
effectiveness models (O’Brien et al. 1994; Briggs, 2000), including the U.S. panel on cost-
effectiveness analysis (Manning et al. 1996). Despite these recommendations, few probabilistic
analyses of cost-effectiveness models have been undertaken. The relative paucity of probabilistic
analyses may be due to the increased complexity of the approach and a lack of clarity concerning
which distributions for input parameters are appropriate. The aim of this paper is to demonstrate
the use of probabilistic sensitivity analysis to handle uncertainty in a cost-effectiveness decision
problem relating to alternative treatment options for gastro-esophageal reflux disease (GERD).
We argue that adopting a Bayesian approach to uncertainty offers both technical and conceptual
advantages over traditional sensitivity analyses. It is natural to interpret uncertainty in the input
parameters in a Bayesian way reflecting our belief that the parameter could take different values,
rather than using the standard frequentist notion that parameters have a single true value that does
not vary. We believe that employing a Bayesian approach will encourage analysts to consider
very carefully uncertainty in parameter values, which should lead to better quality analyses. A
Bayesian approach also allows a more intuitive interpretation of probability – in particular, we
show how the study question of whether a treatment is cost-effective can be answered directly in
the form of a probability that the intervention is cost-effective. Furthemore, we demonstrate this
approach in the case of multiple treatment options for GERD, rather than the standard two
alternative treatment approach that is the norm in the majority of analyses.
6 CHEPA Working Paper Series
Probabilistic Analysis of Cost-Effectiveness Models:Choosing Between Treatment Strategies for Gastro-Esophogeal Reflux Disease
The paper is structured as follows. In the next section we give a brief introduction to the
decision problem, the structure of the model and the results of the previously published
deterministic cost-effectiveness model. The section that follows then demonstrates how the
model can be made probabilistic by specifying distributions for the input parameters following
standard principles of Bayesian methods. The assumptions and calculations involved in
specifying these distributions are laid out in full. Results of the probabilistic analysis are then
presented on the cost-effectiveness plane and summarised through the use of cost-effectiveness
acceptability curves. These results, and the general probabilistic approach to cost-effectiveness
modelling are discussed in the final section of the paper.

Paper 01-01 7
A. Briggs, R. Goeree, G. Blackhouse, B. O'Brien
2. Treatment strategies for gastro-esophageal reflux disease
In this section, a model for assessing the cost-effectiveness of six management strategies
for the treatment of gastro-esophageal reflux disease is briefly outlined. Full details of the model
have been presented in detail in a previous publication (Goeree et al. 1999). First the structure
and assumptions concerning the decision model are discussed. Second the results of the
deterministic analysis are presented. Finally, the limitations of the originally reported univariate
sensitivity analysis are highlighted.
2.1 A model for assessing the cost-effectiveness of GERD treatmentGastro-esophageal reflux disease (GERD) is a common condition that results from
regurgitation of acid from the stomach into the esophagus. The most frequent symptom of GERD
is heartburn and the majority of patients with GERD require pharmacotherapy to reduce acid
secretion. Currently, the choice of first-line antisecretory therapy is between the H2-receptor
antagonists (H2RAs), such as ranitidine and cimetidine and proton pump inhibitors (PPIs) such as
omeprazole. Although they have higher acquisition costs, PPIs have been found to be more
efficacious than H2RAs in terms of both the rate and speed of healing (Chiba et al. 1993; Chiba
et al. 1993) .
The objective of the original study was to compare, over a one-year period, the expected
costs and outcomes of alternative drug treatment strategies for the management of patients with
erosive esophagitis confirmed by endoscopy, but without complications such as Barrett’s
esophagus or stricture. Outcomes are quantified in terms of GERD recurrence and weeks per year
without GERD as indicated by data from clinical trials on healing and recurrence of esophagitis.
Treatment strategies and model structure
Six strategies involving different combinations of first-line agents and change of therapy
conditional on failure to heal or recurrence of GERD were modelled.
Strategy A: Intermittent PPI. Acute treatment with a PPI for 8 weeks and then no further
treatment with prescription medication until recurrence.
Strategy B: Maintenance PPI. Acute treatment with a PPI for 8 weeks then continuous
maintenance treatment with a PPI (same dose).
Strategy C: Maintenance H2RA. Acute treatment with an H2RA for 8 weeks and then
continuous maintenance treatment with an H2RA (same dose).

8 CHEPA Working Paper Series
Probabilistic Analysis of Cost-Effectiveness Models:Choosing Between Treatment Strategies for Gastro-Esophogeal Reflux Disease
Strategy D: Step-Down Maintenance Prokinetic Agent. Acute treatment with a
prokinetic agent (PA) for 12 weeks and then continuous maintenance treatment
with a lower dose of PA.
Strategy E: Step-Down Maintenance H2RA. Acute treatment with a PPI for 8 weeks
and then continuous maintenance treatment with a H2RA.
Strategy F: Step-Down Maintenance PPI. Acute treatment with a PPI for 8 weeks and
then continuous maintenance treatment with a lower dose PPI.
Treatment options A to F represent clinical strategies rather than single drug treatments
for the management of erosive-esophagitis where the physician is assumed to increase the dose
of a drug or switch to another drug if the patient fails to respond to the first-line treatment. The
logic of these assumptions regarding stepping-up dosage or switching can be found in Table 1.
The structure of the decision tree that was developed is shown in Figure 1 and was based on the
treatment strategies and step-up switching algorithms in Table 1. The model is recursive in two
6-month periods; hence, probabilities of recurrence in the period to 12 months are conditional
upon recurrence or non-recurrence in the period from 0 to 6 months.
Treatment outcomes
For GERD, the most commonly used formulation of outcome for economic evaluation
has been either esophagitis-free or symptom-free time in a period of follow-up. The advantage
of such a measure is that it combines two important aspects of efficacy: (i) the speed with which
esophagitis is healed; and (ii) the likelihood of esophagitis recurring. In this analysis, the pri-
mary outcome measure is GERD-free time during the 12-month period of the model, defined as
the time where the esophagitis is healed. A meta-analysis of healing and recurrence studies
published to November 1997 was undertaken to estimate healing and recurrence probabilities
together with associated GERD-free time. Full details of this analysis are given in the original
study (Goeree et al. 1999).
Resource use and unit costs
Generic prices were used for drugs where a generic equivalent is available, employing
the ‘best available price’ from the Ontario Drug Benefit (ODB) program (Ministry of Health,
1996) together with a 10% pharmacy mark-up charge. A dispensing fee of Can $4.11 was used
(i.e. ODB Program fee of Can $6.11 less a Can $2.00 patient co-payment).
Cost estimates for physician fees were taken from the Physician fee schedule for Ontario
(Ontario Ministry of Health, 1992) and procedure costs, such as endoscopy, were estimated

Paper 01-01 9
A. Briggs, R. Goeree, G. Blackhouse, B. O'Brien
from a hospital participating in the Ontario Case Costing Project in Southwestern Ontario (On-
tario Hospital Association, 1995).
To estimate the costs associated with the management of patients with symptoms of GERD
recurrence, information on clinical practice patterns and resource utilisation was obtained by
convening an expert physician panel and using a modified Delphi technique (Park et al. 1986).
Estimated resource utilisation was then combined with unit cost information to give the average
cost associated with each recurrence under each management strategy.
2.2 Results of the deterministic CEAThe decision tree model outlined above was evaluated to estimate the expected costs and
the expected weeks without GERD in the 12-month period of the model. The analysts of the
original study took the accepted conventional approach to examining the cost-effectiveness of
the alternative strategies (Weinstein, 1995; Gold et al. 1996; Drummond et al. 1997). First, it
was determined if any strategies were dominated by other strategies having both lower costs and
greater therapeutic effects. Second, it was determined if any strategies were dominated through
the principles of extended dominance (i.e. whether linear combinations of other strategies can
produce the same (or greater) benefit at lower (or the same) cost (Cantor, 1994). Finally, among
non-dominated treatment options, incremental cost-effectiveness ratios were calculated by com-
paring each option to the next most costly and effective intervention. This process produces an
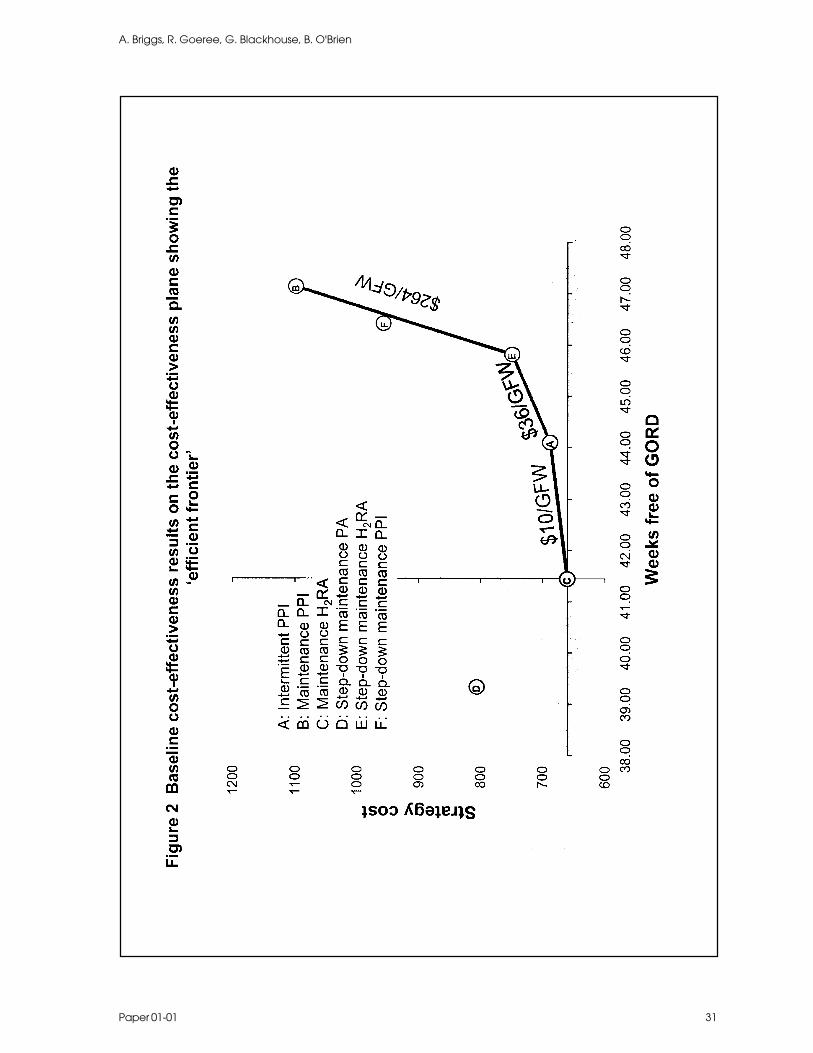
‘efficient frontier’ of increasingly more costly, but more effective strategies. The results of the
analysis is presented on the cost-effectiveness (CE) plane in Figure 2, which also shows the
efficient frontier.
The figure clearly shows that step down maintenance PA (strategy D) is dominated by
maintenance H2RA, (strategy C), intermittent PPI (strategy A) and step-down maintenance H
2RA
(strategy E). The efficient frontier is given by the lines joining strategies C (the origin) A, E and
B. Strategy F is internal to this frontier indicating that it is extended dominated by a linear
combination of strategies E and B. The slope of the frontier reflects incremental cost-effective-
ness – the additional cost at which additional effects can be purchased.
2.3 Limitations of conventional sensitivity analysisThe three-step approach to generating the efficient frontier described in the section above
was undertaken deterministically without consideration of uncertainty. Of course, parameter
estimates employed in the model are not known with certainty and it is important to explore the
implications of parameter uncertainty for the results of the analysis. In particular, given the

10 CHEPA Working Paper Series
Probabilistic Analysis of Cost-Effectiveness Models:Choosing Between Treatment Strategies for Gastro-Esophogeal Reflux Disease
importance of excluding strictly dominated and extended dominated interventions from the analysis
before calculating the frontier, the extent to which particular strategies are part of (or can be
excluded from) the frontier should be assessed.
In the original analysis, the authors examined the effect of a number of the parameters in
their model using conventional sensitivity analysis techniques. They showed how the uncer-
tainty in the parameter values chosen for the baseline analysis might affect the frontier. The
sensitivity analysis that the authors presented was much less arbitrary than that of many reported
cost-effectiveness analyses since the outcome ranges chosen were the 95% confidence limits
from the reported meta-analyses of healing and recurrence rates. The authors reported that
“there were marked differences in expected costs, recurrences and weeks with
GERD when using the lower and upper CIs for both healing and recurrence rates.
However, there were no changes in the relative ranking of strategies for either
costs or outcomes. The basic conclusions of the base-case analysis were not
altered by using the lower or upper 95% CIs for healing or recurrence rates.”
(Goeree et al. 1999, p689 & 671.)
Despite this convincing argument, we might still be concerned that the full effects of uncertainty
are more important that the authors suggest. It is well known that conventional univariate sensi-
tivity analysis, whereby individual parameters are varied while maintaining all remaining pa-
rameters at their baseline value, is likely to underestimate uncertainty since, in reality, param-
eters will not vary in isolation.

Paper 01-01 11
A. Briggs, R. Goeree, G. Blackhouse, B. O'Brien
3. A Bayesian approach to probabilistic sensitivity analysis
In this section, the general appeal of adopting a Bayesian approach to probabilistic analysis
of cost-effectiveness models is presented. Particular emphasis is given to the choice of distribu-
tions for the different types of parameters commonly encountered in cost-effectiveness models.
In section 4, the Bayesian approach to probabilistic analysis of cost-effectiveness models is
illustrated fro the GERD example.
3.1 Probabilistic analysisProbabilistic sensitivity analysis involves specifying distributions for model parameters
to represent uncertainty in their estimation and employing Monte Carlo simulation to select
values at random from those distributions. In this way, probabilistic models allow the effects of
joint uncertainty across all the parameters of the model to be considered. Note that for standard
frequentist analyses (such as practised in almost all clinical trials) parameters to be estimated
from the data are considered to have true values that do not vary. Probabilities attached to
confidence limits relate to the long-run coverage probabilities of the intervals if the same experi-
ment were to be repeated many times.
By contrast, in probabilistic modelling, parameters are considered random variables,
which can take a range of values described by the specified distribution. Although these distri-
butions will represent ‘degrees of belief’ in the parameters of interest, it does not necessarily
follow that the analysis will become automatically ‘subjective’ (the great fear of many of those
who object to Bayesian methodology). Where data are lacking and it becomes necessary to
engage experts to provide information on prior distributions then a number of experts should be
consulted in order that the distributions reflect uncertainty between experts rather than represent-
ing the subjective beliefs of a single expert. Eddy and colleagues have outlined just such an
approach to synthesising data based on Bayesian methods that they term the ‘confidence’ profile
technique (Eddy et al. 1990; Eddy et al. 1990).
3.2 Choosing distributions for the parametersParameters in decision models represent summary values related to the average experi-
ence across a population of (potential) patients. Therefore the relevant uncertainty to capture in
the formation of a distribution for the parameter is second-order uncertainty related to the sam-
pling distribution of the parameter, not the variability in the values observed in a particular
population (first-order uncertainty) (see Stinnett and Paltiel, 1997 for further discussion). Al-
though an assumption of normality for parameters is widely used in statistics it is worth remem-

12 CHEPA Working Paper Series
Probabilistic Analysis of Cost-Effectiveness Models:Choosing Between Treatment Strategies for Gastro-Esophogeal Reflux Disease
bering that the assumption is based on asymptotics (the central limit theorem) and that the
normal distribution has no bounds on values it can take. In practice, parameters of the model
will have logical limitations on the values they can take. In this section we discuss five different
parameter types commonly employed in cost-effectiveness models: probabilities, resource items,
unit costs, relative risks and utility scores. For each we discuss the nature of the data informing
parameter estimates, the logical bounds on the parameter and the way in which Bayesian meth-
ods can help to select distributions for parameters.
Probability parameters
Probabilities for cost-effectiveness models are often based on the observed proportions
of the event of interest, say the number of successfully treated cases. Consider that at an indi-
vidual level a treated patient is either classed as a success or as a failure, therefore, the data can
be considered as independent Bernoulli trials leading to a Binomial form of the data likelihood.
With such data it is natural to use the proportion of successful patients as the estimate of the
corresponding probability in the model. However, in considering the distribution of that prob-
ability, note that the binomial distribution is a discrete distribution related to the sample size of
the study generating the data, whereas it makes sense to model the distribution of probability in
the model as continuous.
Standard frequentist methods for estimating a confidence interval for a proportion in-
volves calculating the Binomial estimate of variance and assuming a normal sampling distribu-
tion in order to generate the interval ( . ( ) / , . ( ) /ρ ρ ρ ρ ρ ρ− × − + × −1 96 1 1 96 1n n
(where p is the proportion and n is the sample size) (Altman, 1991). While this method gives
a good approximation to the true confidence interval when p is not close to zero or one, the
assumption of normality is not appropriate for probabilistic sensitivity analysis. This is because
the probability is known to be bounded on the interval zero-one, while the normal distribution
will (eventually) generate values outside this interval in a Monte Carlo simulation.
Fortunately, Bayesian methods provide a method for moving from the discrete Binomial
likelihood to the continuous uncertainty concerning the probability parameter. The Beta distri-
bution is a continuous distribution on the interval zero-one and is conjugate to the binomial
distribution. This means that if it is possible to represent prior belief using a Beta distribution,1
1 Fortunately, by varying the two parameters of the Beta distribution, a wide variety of possible shapes to the distributionover the interval can be obtained: skewed, symetric, uniform, near normal and even U-shaped.
Paper 01-01 13
A. Briggs, R. Goeree, G. Blackhouse, B. O'Brien
then the integration of that prior belief with the Binomial data has a closed form with the result
that the posterior distribution of the probability will also follow a Beta distribution. One
parameterisation of the Beta distribution Beta(r,n) is has a similar interpretation to r successes
from n trials. The mean and variance of this distribution is given by
m eanr
nsd
r n r
n n= = −
+( )
( )2 1
.
Furthermore, if we can specify a prior distribution as Beta(r’,n’-r’) then following an
observation of r successes and n-r failures in n trials, the application of Bayes theorem yields
the result that the posterior distribution is Beta(r’+r,n’-r’+n-r). Where no prior information
exist as to the probability, it is appropriate to use an ‘uninformative’ or reference prior. Al-
though Beta(1,1), which yields a uniform distribution over the interval zero-one, seems an intui-
tively obvious choice of prior, in fact, what consitutes ‘uninformative’ in this context is not as
straightforward as it appears (Pratt et al. 1995)and Beta(0.5,0.5) which yields a U-shaped inter-
val is also a popular choice for a reference prior. Since uninformative priors will be dominated
by the data, the issue of which uninformative prior to employ is unlikely to be of practical
importance where data are available to update that prior.
Resource item parameters
All economic analyses are concerned with the use of resources. The numbers of re-
source items that a patient utilises can be considered a count variable. The Poisson distribution
with parameter ��(which gives both the mean and variance of the distribution) is often used to
model count data. If we are interested in the distribution of the mean resource use for a group of
patients we could use the Poisson estimate of variance to obtain a standard error for the mean
resource use, relying on the central limit theorem to give a normal sampling distribution. How-
ever, this may be problematic for smaller samples due to a non-negligible probability that the
normal distribution could take a value less than zero, when it is clear that mean resource use
cannot be negative.
Again, the Bayesian approach provides a solution. The Gamma distribution is conjugate
to the Poisson distribution, is constrained to be positive and is fully continuous. Therefore, the
Gamma distribution for the mean resource use can be specified without fear of generating incon-
sistent values in a probabilistic analysis.

14 CHEPA Working Paper Series
Probabilistic Analysis of Cost-Effectiveness Models:Choosing Between Treatment Strategies for Gastro-Esophogeal Reflux Disease
Unit cost parameters
Unit costs are applied to resource volumes in order to evaluate all resource use on a common
(monetary) scale. Note that the unit of analysis for such costs is different to that for other
parameters – unit costs are typically calculated across a broad group of patients. The unit cost of
a surgical procedure or stay in a particular ward will typically be given at the level of the
hospital (or similar provider unit). By contrast, the unit cost of a drug or device may be set
nationally or provincially and may not vary at all, within the context of a country-specific cost-
effectiveness analysis. Furthermore, the unit cost of a resource item is strictly continuous, unlike
the data on resource use considered above. While unit costs are constrained to be positive, it is
less likely that unit costs will be close to zero (in the sense of their variability rather than
absolute value) than the resource items they seek to value. For this reason, it may be more
appropriate to assume a normal distribution for representing uncertainty in unit cost information,
although it is worth considering the nature of the unit of sampling being considered. It is perhaps
telling that most economic analyses conducted alongside clinical trials treat unit costs as fixed
rather than stochastic.
Relative risk parameters
It is very common for economic models to include relative risks as parameters. This mirrors the
fact that relative risk is often the primary outcome in clinical trials. Methods for calculating
confidence intervals for relative risk estimated in such trials assumes the central limit theorem
will lead to log relative risk (which is additive) being normally distributed such that confidence
intervals can be determined in the usual way. A confidence interval for relative risk is then
obtained by anti-logging (exponentiating) the confidence limits on the log scale. This standard
approach to confidence interval estimation clearly suggests an equivalent approach to specifying
a log-normally distributed parameter for relative risk to be used in a probabilistic sensitivity
analysis. Furthermore, since the normal distribution is self-conjugate (a normal prior and a
normal data likelihood generate a normal posterior distribution), the application of Bayes theo-
rem on a normally distributed parameter is especially straightforward.

Paper 01-01 15
A. Briggs, R. Goeree, G. Blackhouse, B. O'Brien
4. A probabilistic analysis of choosing treatment strategies for GERD
In this section, we describe how a probabilistic sensitivity analysis of this decision
problem was undertaken in order to more fully account for uncertainty in the choice of treatment
strategy for GERD. Within the model there are three main categories of parameters. Model
probabilities relating to the healing and recurrence rates of GERD symptoms, parameters relat-
ing to the level of resource consumption by patients with GERD symptoms and unit costs of those
resources. Each of these parameter categories are discussed in detail below. Note that the
outcome variables in the model – weeks free of GERD – are completely determined by the
healing and recurrence rates and are therefore endogenous variables in the model.
4.2 Parameter distributions
Distributions for the healing and recurrence probabilities
All patients begin the model with GERD. Following first-line therapy there is a prob-
ability that their GERD will have healed. Once GERD has healed there is then the probability
that it will recur. The healing and recurrence probabilities were estimated from the literature.
Consider that at an individual level a patient with GERD has either healed/experienced a recur-
rence or not. At the individual level, therefore, the data from clinical investigation of healing
and recurrence can be considered as independent Bernoulli trials leading to a Binomial form of
the data likelihood as described above -- hence a beta distribution was chosen to represent
uncertainty in this parameter.
The original study went to some lengths to present a rigorous meta-analysis of healing
and recurrence probabilities. This method resulted in estimates of constant hazards for healing
probabilities and estimates of proportions of patients recurring in two periods: 0-6 months fol-
lowing healing and 6-12 months following healing, together with associated estimates of stand-
ard error. Equating the mean and standard errors from the meta-analysis to the estimates of mean
and standard error of the beta distribution given above allowed the Beta distributions to be fitted
directly. Due to the random-effects assumption, this is more conservative than the direct Bayesian
updating approach described above. Details of the distributions for the healing hazards and the
recurrence probabilities fitted by this method are given in Table 3.

16 CHEPA Working Paper Series
Probabilistic Analysis of Cost-Effectiveness Models:Choosing Between Treatment Strategies for Gastro-Esophogeal Reflux Disease
Distributions for resource use assumptions
In contrast to the rigorous meta-analytic approach employed to summarise the wealth of
information on the healing and recurrence rates associated with different drug interventions for
GERD, the information on resource use, particularly the level of investigations received by
patients following a recurrence, were extremely sparse. Although in the original study a Delphi
panel of experts was convened in order to estimate the likely experience of patients, the purpose
of the panel was to forge consensus and no information on the variance of estimates that emerged
prior to consensus of the experts remains. Therefore the assumptions concerning the distribu-
tions of estimated resource use are much more arbitrary.
For the estimated number of visits to general practitioners and for endoscopic investiga-
tion a gamma distribution was assumed. This is because the number of visits is constrained to be
positive and the gamma distribution is only defined for positive values. Again a method of
moments approach to fitting was employed such that the mean of the gamma distribution was
equal to the point estimates of the visits generated by the expert panel and assuming the standard
error was half that value (i.e. assuming the coefficient of variation was 0.5).
For the proportions of patients receiving the various investigative procedures, it was
assumed that the expert panel had related their estimates to a hypothetical cohort of 100 patients.
Therefore, a beta distribution was again employed as if the event rates given by the expert panel
were per one hundred. Given the considerable experience of the panel with GERD treatment, it
is likely that this approach is conservative.
It is assumed that variation in medication use is negligible, such that all patients obtain
their prescriptions and all prescriptions accord with the treatment strategies under evaluation.
The chosen distributions for the resource use parameters are presented in Table 4.
Variation in unit costs of resources
The second component of variation in cost is the potential variation in unit cost esti-
mates. We do not believe that it is appropriate to handle variation in drug prices probabilistically
since, at the point of the evaluation, drug prices are determined by the manufacturers. Of course,
there may be some uncertainty concerning which drugs it is appropriate to prescribe, but that is
part of the decision problem and is best handled outside of the probabilistic component of the
analysis. Therefore drug prices were not varied in this analysis.
Paper 01-01 17
A. Briggs, R. Goeree, G. Blackhouse, B. O'Brien
A separate issue relates to the use of scheduled information of the cost of resource items
in Ontario, Canada, where the original study was carried out. Although there is certainly an
issue concerning whether scheduled reimbursement values for resources reflect the true opportu-
nity cost of those resources, it is not clear how such uncertainty could be represented in this
model. Therefore, all unit costs were taken as being deterministic and were not ascribed distri-
butions in this analysis. While there are some problems with this approach (Rittenhouse et al.
1999), this is not conceptually different to the approach taken in stochastic CEA alongside clini-
cal trials where it is typical for unit costs to be treated as fixed.
4.3 Results of the probabilistic analysisHaving specified distributions for all the relevant parameters of the model, the probabilistic
analysis was undertaken by randomly sampling from each of the parameter distributions and
calculating the expected costs and expected weeks free of GERD for that combination of param-
eter values. This process formed a single replication of the model results and a total of 10,000
replications were performed in order to examine the distribution of the resulting cost and out-
comes for each strategy. The results of these 10,000 replications from the model are presented
on the CE plane in Figure 3 together with the baseline estimate of the efficient frontier.
It is clear that for each of the individual replications an efficient frontier could be calcu-
lated together with the incremental cost-effectiveness ratios for treatments on the frontier. In
particular, Figure 3 shows how it may not be possible to rule out strategy F, the strategy based on
step-down maintenance PPI, since it potentially forms part of the frontier in many replications.
Having generated the estimated joint distribution of costs and effects for each of the treatment
strategies, how should this information be summarised? While the recent health economic litera-
ture has widely explored the handling of uncertainty in the case of two mutually exclusive treat-
ment alternatives (refs), there has been little work on handling uncertainty in the presence of
many mutually exclusive treatment options.
If the shadow price (or the maximum that society is willing to pay) for a week free of
GERD symptoms was known, it would be possible to choose between all of the treatment strat-
egies, not just identify those that form the efficient frontier. Therefore, conditional on knowing
that shadow price there is only one treatment of choice from the six strategies under evaluation
and the proportion of times that an intervention is the treatment of choice from the 10,000 repli-
cations of the model gives the strength of evidence in favour of that treatment. Although it would
be possible to identify the efficient frontier, calculate the incremental cost-effectiveness ratios
and choose one strategy from the six available for each of the 10,000 replications, a much more
straightforward approach exists.

18 CHEPA Working Paper Series
Probabilistic Analysis of Cost-Effectiveness Models:Choosing Between Treatment Strategies for Gastro-Esophogeal Reflux Disease
The net-benefit framework has been argued to offer many advantages for handling uncer-
tainty in cost-effectiveness analysis (Stinnett and Mullahy, 1998) and overcomes the particular
problem associated with negative ICERs (Stinnett and Mullahy, 1997). A further property is
that while average cost-effectiveness ratios have no meaningful interpretation, average net-ben-
efits have the useful property that the incremental net-benefit between any two treatments can be
calculated from the difference between their individual average net-benefits (Stinnett and Mullahy,
1998). Therefore, the treatment of choice from the six strategies under evaluation will be the
treatment with the greatest average net-benefit. This must be the case since only that treatment
will have a positive incremental net-benefit when compared to any other treatment alternative.
Therefore, the proportion of times a strategy has the highest net-benefit among the 10,000 repli-
cations of the model gives the strength of evidence in favour of that strategy being cost-effective.
Of course, in reality the shadow price of a week free of GERD symptoms is not known.
However, by plotting out, for all possible values of the shadow price, the proportion of times the
intervention has the greatest net-benefit much can be learned concerning the implications of the
estimated uncertainty for the treatment decision. Figure 4 shows the result of just such an exer-
cise for the probabilistic evaluation of the GERD model presented in Figure 3. These curves are
conceptually the same as the use of acceptability curves to summarise uncertainty on the CE
plane in a two-treatment decision problem (van Hout et al. 1994).

Paper 01-01 19
A. Briggs, R. Goeree, G. Blackhouse, B. O'Brien
5. Discussion
Having adopted a formal Bayesian approach to the probabilistic analysis of the model
allows the intuitive interpretation often afforded to acceptability curves as showing the prob-
ability that the intervention is cost-effective. Note that the curves all sum to one on the vertical
axis (this clearly must be the case since only one strategy is chosen for each value of the ceiling
ratio and for each replication of the model). It is immediately apparent from both Figures 3 and
4 that strategy D is always dominated. The acceptability curves in Figure 4 clearly show that
initial concern that strategy F might form part of the frontier was unwarranted. In fact, the
conditions necessary for strategy F to be considered the most cost-effective option rarely arose
in the simulations.
While the sort of presentation of the choice between mutually exclusive treatments in the
face of many options is a natural extension of the use of cost-effectiveness acceptability curves
in the two treatment case, the issue arises of how exactly decision-makers are expected to use
this information to choose between the remaining strategies that form part of the frontier. One
approach (as illustrated in Figure 5) would be to say that for any given value of the shadow
price, the optimal decision would be to choose the strategy that is most likely to be cost-effec-
tive. But of course, this decision rule completely ignores the uncertainty that has just been
modelled and gives the exact same treatment recommendations as the base line estimates in
Figure 2.
The conventional approach to statistical decision-making is based on the adoption of a
5% type I error rate. We might therefore adopt a decision-rule that a more effective and more
expensive treatment strategy should only replace the currently provided treatment if it can be
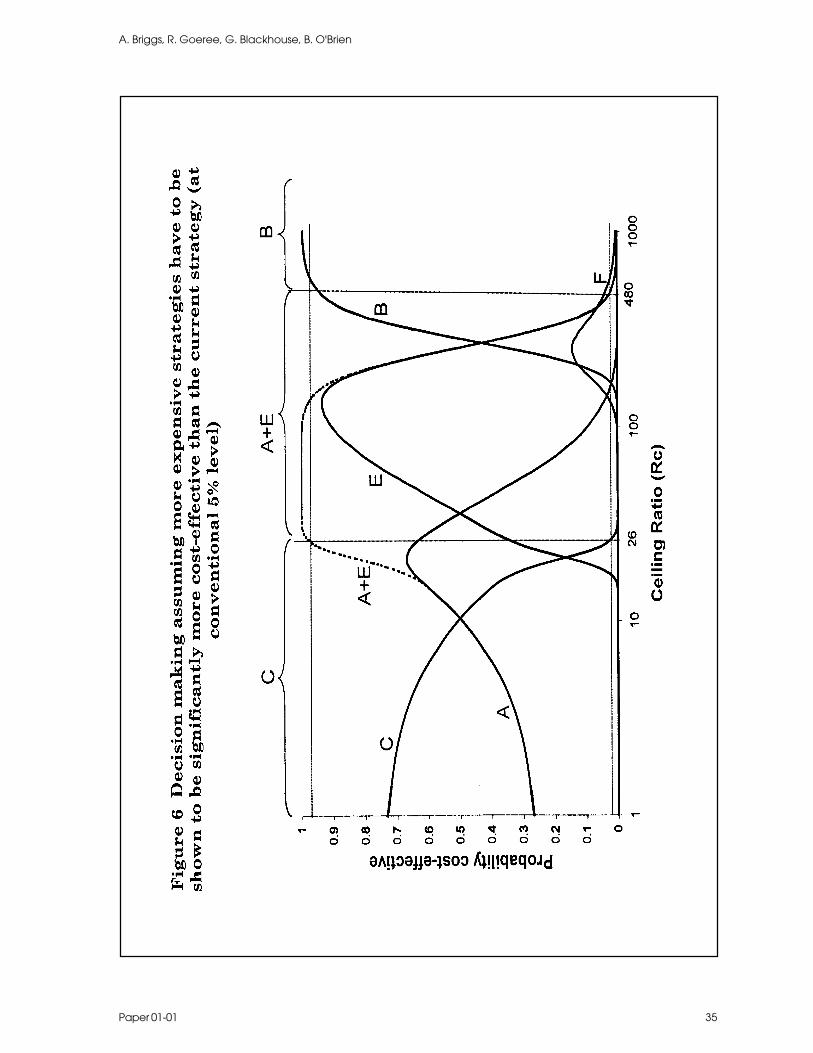
shown to be significantly more cost-effective. This approach to decision-making is illustrated in
Figure 6 and gives markedly different cut-off points for decision-maker’s ceiling ratios for the
different strategies to be considered cost-effective. For example, the most effective therapy,
step-down maintenance PPI, would only be considered the appropriate treatment option if deci-
sion-makers had an underlying willingness to pay of $480 per week free of GERD symptoms.
Note that under a 5% significance decision rule, neither strategy A or E would be consid-
ered significantly cost-effective to be a clear decision choice. However, it is clear that the basic
strategy C is not cost-effective (at the 5% error rate) for a shadow price greater than $26 per
week free of GERD symptoms. Recall that strategy A involves healing with PPI without mainte-
nance and strategy E involves healing with PPI then maintenance using H2RAs. The choice
20 CHEPA Working Paper Series
Probabilistic Analysis of Cost-Effectiveness Models:Choosing Between Treatment Strategies for Gastro-Esophogeal Reflux Disease
between these strategies is between no maintenance and maintenance with H2RAs following
healing. If the shadow price of a week free of GERD symptoms is between $26 and $480 per
week free of GERD symptoms then we know that strategies B, C, D and F are not cost-effective.
We cannot distinguish strategies A & E at conventional significance levels so for purposes of
decision making it should be clear that the strategy to heal with PPI should be adopted, but that it
is unlikely to be important whether, subsequent to healing, no maintenance or maintenance with
H2RAs is undertaken. This is illustrated in Figure 6 by combining the two strategies in one
acceptability curve.
It is important to recognise, however, the arbitrary nature of the conventional decision
rule. Consider if instead of placing the ‘burden of proof’ for cost-effectiveness on more expen-
sive and more effective strategies, it is the cheaper but less effective strategies that would only
be used if they were shown to be significantly cost-effective. Although not shown in Figure 6, it
should be clear from the above exposition that this change in the burden of proof would result in
a new set of threshold values such that strategy B would be the treatment of choice unless the
shadow price were below $170 per week free of GERD symptoms; between $17.50 and $170
per week free of GORD symptoms either strategy A or E would be considered cost-effective;
and below a shadow price of $17.50, either A or C would be the strategy of choice.
Of course the arbitrary nature of such decision-making under uncertainty emphasises the
inadequacies of such a simple decision rule – Claxton has argued that significance testing of this
sort is irrelevant (Claxton, 1999). Instead he suggests that decision-making should be concerned
fundamentally with expected values. That is not to say that the decisions should be made on the
basis of the baseline point estimates as presented in Figure 2 without reference to uncertainty in
obtaining those estimates. Rather, that the expected returns to obtaining further information
should be assessed in order to determine whether it is worth commissioning more research to
obtain improved estimates of the decision parameters. Such an approach would require esti-
mates of: the loss function associated with incorrect decision-making; the size of the population
relevant to the decision; the lifetime of the technologies associated with each management strat-
egy; and the returns to sampling. Each of these things is itself subject to a great deal of uncer-
tainty and the methods for incorporating all this information into one overall analysis are cur-
rently under development. We have not attempted such an analysis in this paper, although we
recognise that this is a possible extension to the work presented here.
In summary, probabilistic modelling of deterministic models is a practical solution to the
problems of conventional sensitivity analysis. Adopting a formal Bayesian approach encour-

Paper 01-01 21
A. Briggs, R. Goeree, G. Blackhouse, B. O'Brien
ages analysts and users to think carefully about the state of evidence relating to the parameters of
the model. Single parameter specifications are straightforward to apply in a Bayesian frame-
work and provide a simple way to update parameter distributions as new data becomes avail-
able. The use of acceptability curves to present information on the probability of multiple
treatment options is a natural extension of the two alternative case usually presented in the
literature. Much current research interest is focused on expected value of information methods.
It is clear that such methods will have to be predicated on a well specified probabilistic model.

22 CHEPA Working Paper Series
Probabilistic Analysis of Cost-Effectiveness Models:Choosing Between Treatment Strategies for Gastro-Esophogeal Reflux Disease
Paper 01-01 23
A. Briggs, R. Goeree, G. Blackhouse, B. O'Brien
Reference List
Altman, D.G. (1991) Practical statistics for medical research. London: Chapman & Hall.
Briggs, A.H. (2000) Handling uncertainty in cost-effectiveness models. PharmacoEconomics17, 479-500.
Briggs, A.H. and Gray, A.M. (1999) Handling uncertainty when performing economicevaluation of health care interventions. Health Technology Assessment 3.
Cantor, S.B. (1994) Cost-effectiveness analysis, extended dominance, and ethics: aquantitative assessment. Med.Decis.Making. 14, 259-265.
Chiba, N., Wilkinson, J. and Hunt, R.H. (1993) Symptom relief in erosive GERD [abstract].American Journal of Gastroenterology 88, A1486
Chiba, N., de Gara, C.J. and Berget, D. (1993) Rapidity of healing in GERD [abstract].Gastroenterology 104, A53
Claxton, K. (1999) The irrelevance of inference: A decision-making approach to thestochastic evaluation of health care technologies. Journal of Health Economics 18, 341-364.
Critchfield, G.C., Willard, K.E. and Connelly, D.P. (1986) Probabilistic sensitivity analysismethods for general decision models. Computers and biomedical research 19, 254-265.
Doubilet, P., Begg, C.B., Weinstein, M.C. and et al (1985) Probabilistic sensitivity analysisusing Monte Carlo simulation. A practical approach. Med.Decis.Making. 5, 157-177.
Drummond, M.F., O’Brien, B., Stoddart, G.L. and Torrance, G.W. (1997) Methods for theeconomic evaluation of health care programmes, 2nd Edition edn. Oxford: OxfordUniversity Press.
Eddy, D.M., Hasselblad, V. and Shachter, R. (1990) A Bayesian method for synthesizingevidence. The Confidence Profile Method. Int.J.Technol.Assess.Health Care 6, 31-55.
Eddy, D.M., Hasselblad, V. and Shachter, R. (1990) An introduction to a Bayesian method formeta-analysis: The confidence profile method. Med.Decis.Making. 10, 15-23.
Goeree, R., O’Brien, B., Hunt, R., Blackhouse, G., Willan, A. and Watson, J. (1999)Economic evaluation of long term management strategies for erosive oesophagitis.PharmacoEconomics. 16, 679-697.

24 CHEPA Working Paper Series
Probabilistic Analysis of Cost-Effectiveness Models:Choosing Between Treatment Strategies for Gastro-Esophogeal Reflux Disease
Gold, M.R., Siegel, J.E., Russell, L.B. and Weinstein, M.C. (1996) Cost-effectiveness inhealth and medicine, New York: Oxford University Press.
Manning, W.G., Fryback, D.G. and Weinstein, M.C. (1996) Reflecting uncertainty in cost-effectiveness analysis. In: Gold, M.R., Siegel, J.E., Russell, L.B. and Weinstein, M.C., (Eds.)Cost-effectiveness in health and medicine, pp. 247-275. New York: Oxford UniversityPress.
Ministry of Health (1996) Drug benefit formulary: comparative drug index No.35. Toronto:Publications Ontario.
O’Brien, B.J., Drummond, M.F., Labelle, R.J. and Willan, A. (1994) In search of power andsignificance: issues in the design and analysis of stochastic cost-effectiveness studies in healthcare. Med.Care 32, 150-163.
Ontario Hospital Association (1995) Ontario case costing project: Ontario guide to casecosting. Toronto: Publications Ontario.
Ontario Ministry of Health (1992) Schedule of benefis: physician services under the healthinsurance act. Toronto: Publications Ontario.
Park, R.E., Fink, A., Brook, R.H. and et, a. (1986) Physician ratings of approapriateindications for six medical and surgical procedures American Journal of Public Health 76,766-772.
Pratt, J.W., Raiffa, H. and Schlaifer, R. (1995) Introduction to statistical decision theory.Cambridge: MIT Press.
Rittenhouse, B.E., Dulisse, B. and Stinnett, A.A. (1999) At what price significance? The effectof price estimates on statistical inference in economic evaluation. Health Econ. 8, 213-219.
Stinnett, A.A. and Mullahy, J. (1997) The negative side of cost-effectiveness analysis [letter].JAMA 277, 1931-1932.
Stinnett, A.A. and Mullahy, J. (1998) Net health benefits: a new framework for the analysis ofuncertainty in cost-effectiveness analysis. Med.Decis.Making. 18, S65-S80
Stinnett, A.A. and Paltiel, A.D. (1997) Estimating CE ratios under second-order uncertainty:the mean ratio versus the ratio of means. Med.Decis.Making 17, 483-489.
van Hout, B.A., Al, M.J., Gordon, G.S. and Rutten, F.F. (1994) Costs, effects and C/E-ratiosalongside a clinical trial. Health Econ. 3, 309-319.
Weinstein, M.C. (1995) From cost-effectiveness ratios to resource allocation: where to drawthe line? In: Sloan, F.A., (Ed.) Valuing health care, pp. 77-98. Cambridge: CambridgeUniversity Press.

Paper 01-01 25
A. Briggs, R. Goeree, G. Blackhouse, B. O'Brien

26 CHEPA Working Paper Series
Probabilistic Analysis of Cost-Effectiveness Models:Choosing Between Treatment Strategies for Gastro-Esophogeal Reflux Disease
Table 2 Parameters in the model
Name Value Description
Healing hazardshPA 0.045 hazard for healing on PAhH2 0.068 hazard for healing on H2RAshDDH2 0.091 hazard for healing on double dose H2RAshPPI 0.215 hazard for healing on PPIshDDPPI 0.209 hazard for healing on double dose PPIs
Corresponding transition probabilitiespPA 0.42 probability of healing on PA (at 12 weeks)pH2 0.42 probability of healing on H2RAs (at 8 weeks)pDDH2 0.52 probability of healing on double dose H2RAs (at 8 weeks)pPPI 0.82 probability of healing on PPIs (at 8 weeks)
pDDPPI 0.81 probability of healing on double dose PPIs (at 8 weeks)
Recurrence variablesp06PL 0.67 probability of recurrence on placebo (0-6months)p06PA 0.23 probability of recurrence on PA (0-6months)p06H2 0.38 probability of recurrence on H2RAs (0-6months)p06PPI 0.12 probability of recurrence on PPIs (0-6months)p06LDPPI 0.25 probability of recurrence on low dose PPIs (0-6months)p06SU 0.12 probability of recurrence after surgery (0-6months)p612PL 0.23 probability of recurrence on placebo (0-6months)p612PA 0.13 probability of recurrence on PA (6-12months)p612H2 0.18 probability of recurrence on H2RAs (6-12months)p612PPI 0.08 probability of recurrence on PPIs (6-12months)p612LDPPI 0.13 probability of recurrence on low dose PPIs (6-12months)
Symptom-week variablesSWPA 2.280 symptom weeks on PASWH2 1.521 symptom weeks on H2RAsSWDDH2 1.816 symptom weeks on double dose of HRRAsSWPPI 2.386 symptom weeks on PPIsSWDDPPI 2.383 symptom weeks on double dose of PPIsSWSU 0.539 symptom weeks after surgery

Paper 01-01 27
A. Briggs, R. Goeree, G. Blackhouse, B. O'Brien
Name Value Description
Unit cost variables ($)Fee 4.11 Dispensing feeH2RA 0.44 150mg H2RACIS 0.61 10mg PAPPI 2.42 20mg PPILDPPI 1.93 10mg PPIGPGA 48.20 GP general assessmentGPRA 28.10 GP re-assessmentGPMA 16.25 GP minor assessmentGERA 38.65 gastroenterologist re-assessmentGEPA 23.10 gastroenterologist partial assessmentUGIE 118.22 upper GI endoscopyUGIS 141.43 upper GI seriesCST 84.81 cardiac stress test
ECG 42.77 ECGBS 135.10 barium swallowNF 2,462.60 laparoscopic fundal plication
Resource use variablesnGPR1 2.5 Visits to GP (first recurrence)nGER1 1.5 Visits to gastroenterologist (first recurrence)nBSR1 0.1 Percentage getting a barium swallow (first recurrence)nCSTR1 0.0 Percentage getting cardiac stress test (first recurrence)nECGR1 0.0 Percentage getting ECG (first recurrence)nUGIER1 0.1 Percentage getting upper GI endoscopy (first recurrence)nUGISR1 0.1 Percentage getting upper GI series (first recurrence)nGPR2 2.5 Visits to GP (second recurrence)nGER2 1.5 Visits to gastroenterologist (second recurrence)nBSR2 - Percentage getting a barium swallow (second recurrence)nCSTR2 0.0 Percentage getting cardiac stress test (second recurrence)nECGR2 0.0 Percentage getting ECG (second recurrence)nUGIER2 0.6 Percentage getting upper GI endoscopy (second recurrence)nUGISR2 0.1 Percentage getting upper GI series (second recurrence)

28 CHEPA Working Paper Series
Probabilistic Analysis of Cost-Effectiveness Models:Choosing Between Treatment Strategies for Gastro-Esophogeal Reflux Disease

Paper 01-01 29
A. Briggs, R. Goeree, G. Blackhouse, B. O'Brien

30 CHEPA Working Paper Series
Probabilistic Analysis of Cost-Effectiveness Models:Choosing Between Treatment Strategies for Gastro-Esophogeal Reflux Disease
Paper 01-01 31
A. Briggs, R. Goeree, G. Blackhouse, B. O'Brien

32 CHEPA Working Paper Series
Probabilistic Analysis of Cost-Effectiveness Models:Choosing Between Treatment Strategies for Gastro-Esophogeal Reflux Disease

Paper 01-01 33
A. Briggs, R. Goeree, G. Blackhouse, B. O'Brien

34 CHEPA Working Paper Series
Probabilistic Analysis of Cost-Effectiveness Models:Choosing Between Treatment Strategies for Gastro-Esophogeal Reflux Disease
Paper 01-01 35
A. Briggs, R. Goeree, G. Blackhouse, B. O'Brien

36 CHEPA Working Paper Series
Probabilistic Analysis of Cost-Effectiveness Models:Choosing Between Treatment Strategies for Gastro-Esophogeal Reflux Disease