Pro-Poor Livestock Policy Initiative Status and … Living from Livestock Pro-Poor Livestock Policy...
12
Status and Prospects for Smallholder Milk Production A Global Perspective Pro-Poor Livestock Policy Initiative
Transcript of Pro-Poor Livestock Policy Initiative Status and … Living from Livestock Pro-Poor Livestock Policy...
Status and Prospects forSmallholder Milk Production
A Global Perspective
Pro-Poor Livestock Policy Initiative

A Living from Livestock
Pro-Poor Livestock Policy Initiative
Status and Prospects forSmallholder Milk Production
A Global Perspective
Editors:Torsten Hemme
Joachim Otte
FOOD AND AGRICULTURE ORGANIZATION OF THE UNITED NATIONSRome, 2010
iv © IFCN 2008
Editors
Torsten HemmeIFCN Dairy Research Center at University Kiel, www.ifcndairy.org Schauenburgerstr. 116, 24118 Kiel, Germany [email protected]
Joachim OttePro-Poor Livestock Policy Initiative, www.fao.org/ag/pplpi.html FAO Animal Production and Health Division Rome, Italy [email protected]
Recommended citation
FAO 2010: Status of and Prospects for Smallholder Milk Production – A Global Perspective, by T. Hemme and J. Otte. Rome
Credits
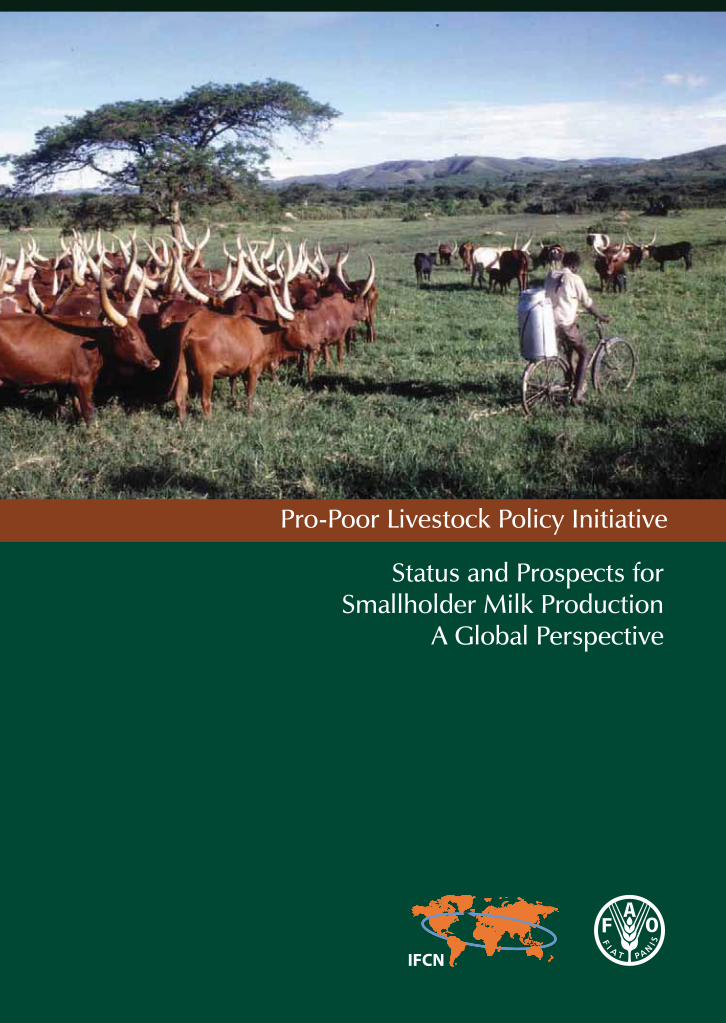
The photographs were provided by IFCN researchers and Katja Seifert Cover photo 19312_R.FaiduttiDesign, layout & image editing: Katja Seifert Cover design: S. Villicana
The designations employed and the presentation of material in this information product do not imply the expression of any opinion whatsoever on the part of the Food and Agriculture Organization of the United nations (FAO) or the International Farm Comparison Network (IFCN) concerning the legal or development status of any country, territory, city or area or of its authorities, or concerning the delineation of its frontiers or boundaries. The mention of specific companies or products of manufacturers, whether or not these have been patented, does not imply that these have been endorsed or recommended by FAO or IFCN in preference to others of similar nature that are not mentioned. The views expressed in this information product are those of the authors and do not necessarily reflect the views of FAO.
All rights reserved. Reproduction and dissemination of material in this information product for educational or other non-commercial purposes are authorized without any prior written permission from the copyright holders provided the source is fully acknowledged. Reproduction of material in this information product for resale or other commercial purposes is prohibited without prior permission of the copyright holders. Applications for such permission should be addressed to:
ChiefElectronic Publishing Policy and Support BranchCommunication Division
FAOViale delle terme di Caracalla, 00153 Rome, Italyor by e-mail to:[email protected]
ISBN 978-92-5-106545-7
© IFCN 2008 1
Preface
Of an estimated 2.6 billion people in the developing world surviving on less than US$2 per day, some 1.4 billion are classified as ‘extremely’ poor inasmuch as they live on less than US$1.25/day. Although the incidence of extreme poverty is highest in sub-Saharan Africa (50 percent), Asia is home to the majority of the extremely poor (933 million). Poverty is closely associated with malnutrition, particularly under-nutrition; the Food and Agriculture Organization of the United Nations (FAO) estimates that, in 2009, some 1.02 billion people, or one sixth of the world’s population, were under-nourished.
More than three quarters of these 1.4 billion extremely poor live in rural areas and partly or wholly depend on agriculture for their livelihoods; almost half a billion of them also partly depend on livestock. Given that it is impossible for the expansion of agricultural land to keep pace with population growth in most developing countries, it is not easy to expand agricultural production horizontally. Rather, productivity gains that result in increased value of output per hectare of land are essential for the purpose of improving rural incomes.
Livestock have a number of characteristics that contribute to sustainable rural development: among other things, livestock provide marketable products (generally of a higher value and less vulnerable to critical harvest timing than many crops) that can be produced by small-scale, household production systems. Judicious development of the livestock sector could thus make a substantial contribution to raising nutrition levels, increasing agricultural productivity, improving the lives of rural people, contributing to growth of the world economy and achieving the Millennium Development Goal of eradicating extreme poverty and hunger.
It is estimated that almost 150 million farm households, i.e. more than 750 million people, are engaged in milk production, the majority of them in developing countries. Annual milk consumption growth rates in these countries averaged 3.5 to 4.0 percent over the decade 1995-2005, at least double the growth rates of 1.4 to 2.0 percent for major staple foods over the same period. Therefore, if properly directed, dairy sector development could serve as a powerful tool for reducing poverty.
The aim of the present publication is to provide an overview of the global dairy sector and of the forces shaping its development vis-à-vis the characteristics of ‘typical’ dairy farming systems. In this way, it is hoped to facilitate a better understanding of the opportunities available for improvement, as well as the constraints/threats faced by smallholder dairy producers in a rapidly changing world. It also attempts to chart an approach to dairy sector development that will allow smallholder producers to participate in the growing market for milk and milk products.
Samuel Jutzi Director, Animal Production and Health Division, FAO
2 © IFCN 2008
Page No.
Abbreviations and acronyms 4
Note of the editors and acknowledgements 5
Executive Summary 6
1 Introduction 10
2 Global Dairy Sector: Status and Trends 2.1 Summary 16
2.2 Global price trends for feed and dairy products 18
2.3 Milk production trends 20
2.4 Farmers’ milk prices and milk:feed price ratio 22
2.5 Dairy farm numbers world wide 24
2.6 Pattern of dairy trade and milk processing 26
2.7 Milk consumption and its drivers 28
3 Milk Production and Dairy Sector Profiles 3.1 Summary 34
3.2 India 38
3.3 Pakistan 42
3.4 Bangladesh 46
3.5 Thailand 50
3.6 Viet Nam 54
3.7 China 58
3.8 Uganda 62
3.9 Cameroon 66
3.10 Morocco 70
3.11 Peru 74
3.12 Germany 78
3.13 United States of America 82
3.14 New Zealand 86
4 International Competitiveness of ‘Typical’ Dairy Farms 4.1 Summary 94
4.2 Overview of selected dairy farm types 96
4.3 Overview of the whole farm 98
4.4 Farm income, profits and returns to labour 100
4.5 Asset structure and returns on investments 102
4.6 Producer milk prices and non-milk returns 104
4.7 Costs of milk production only; milk prices 106
4.8 Total milk production costs and returns to the dairy enterprise 108
4.9 Cost component: labour 110
4.10 Cost component: land 112
4.11 Cost component: capital (excluding land and quota) 114
Table of Contents
© IFCN 2008 3
Table of Contents
5 Special Studies 5.1 Summary 120
5.2 Impact analysis of dairy development programmes in Andhra Pradesh, India 122
5.3 Impact analysis of dairy development programmes in Uganda 124
5.4 Farm development strategies for dairy farms in Haryana (India) 126
5.5 Policy impact analysis for dairy farms in Thailand and Viet Nam 128
5.6 Comparison of dairy chains in Karnal, India 130
5.7 Cost of ‘quality milk’ in Karnataka, India: a case study 132
5.8 The competitiveness of skim milk powder from Uganda 134
5.9 The dairy feed chain in Peru: a case study 136
5.10 A comparison of dairy farming systems in India 138
5.11 A comparison of rural & peri-urban milk production systems in South Asia 140
5.12 Comparison of small- and large-scale dairy farming systems in India & US 142
5.13 Comparing household, whole farm and dairy enterprise levels in India 144
5.14 Methodological approach for guiding dairy development activities 146
5.15 Comparison of IFCN and Extrapolate approaches to impact analysis 148
5.16 Assessing the risks faced by dairy farms 150
5.17 Incorporating risk in dairy development strategy formulation 152
5.18 Carbon footprints of dairy farming systems 154
6 Conclusions and Recommendations for Smallholder Dairy Development 160
7 References 165
AnnexesA1 The International Farm Comparison Network (IFCN) 168
A2 FAO’s Pro-Poor Livestock Policy Initiative (PPLPI) 169
A3 Further reading / papers by IFCN and PPLPI 171
A4 Researchers who have contributed 172
A5 Farm description 176
A6 Description of data collection for typical dairy farms 178
A7 Exchange rates 1996 – 2007 179
A8 Assumptions for the calculations – farm economic indicators 180
4 © IFCN 2008
Abbreviations and acronyms
Currencies
ALL Albanian Lek ARS Argentine Peso AUD Australian Dollar BDT Bangladeshi Taka BGL Bulgarian Lev BRL Brazilian Real BYR Belarus Rouble CAD Canadian Dollar CHF Swiss Franc CLP Chilean Peso CNY Chinese Renminbi Yuan CSK Czech Koruna DKK Danish Krone ECS Ecuador Sucre EEK Estonian Kroon EGP Egyptian Pound ETB Ethiopian Birr EUR European Euro GBP British Pound GTQ Guatemalan Quetzal HUF Hungarian Forint IDR Indonesian Rupiah ILS Israeli New Shekel INR Indian Rupee IRR Iranian Rial JOD Jordanian Dinar JPY Japanese Yen KRW South Korean Won KZT Kazakhstan Tenge LKR Sri Lankan Rupee LTL Lithuanian Litas
Countries
AL Albania AM Armenia AR Argentina AT Austria AU Australia AZ Azerbaijan BA Bosnia and Herzegovina BD Bangladesh BE Belgium BG Bulgaria BR Brazil BY Belarus CA Canada CH Switzerland CL Chile CM Cameroon CN China CY Cyprus CZ Czech Republic DE Germany DK Denmark EC Ecuador EE Estonia EG Egypt ES Spain ET Ethiopia FI Finland FR France GB United Kingdom GR Greece GT Guatemala HR Croatia HU Hungary ID Indonesia IE Ireland IL Israel IN India IR Iran IS Iceland IT Italy
Units
ct cent Cwt hundredweight = 100 Ib (45.36 kg) ECM Energy corrected milk 4% fat, 3.3% protein g gram h hour ha hectare Ib Pound (453.59 g) kg kilogram l litre MCAL Mega calorie ml millilitre NE Net energy ppl pence per litre Snf Solids non-fat t metric tons yr year
Others
AI Artificial insemination CAP Common Agricultural Policy (in EU) CIF Cost, insurance, freight CIS Commonwealth of Independent States (Countries of the former Soviet Union) CPI Consumer Price Index FAO Food and Agricultural Organisation FOB Free on board GDP Gross Domestic Product HH household IDF International Dairy Federation IFCN International Farm Comparison Network IMF International Monetary Fund ME Milk Equivalent OECD Organisation for Economic Co-operation and Development P&L Profit and loss account PAM Policy analysis matrix PPLPI Pro Poor Livestock Policy Initiative sbm soya bean meal SMP Skim milk powder TIPI-CAL Technology Impact and Policy Impact Calculation Model UHT Ultra High Temperature (milk) VAT Value added tax WTO World Trade Organization ZMP Zentrale Markt- und Preisberichtstelle (Germany)
JO Jordan JP Japan KR Korea, Republic of KZ Kazakhstan LK Sri Lanka LT Lithuania LU Luxembourg LV Latvia MA Morocco MD Moldova MK Macedonia MM Myanmar MN Mongolia MX Mexico NG Nigeria NL The Netherlands NO Norway NZ New Zealand PE Peru PH Philippines PK Pakistan PL Poland PT Portugal RO Romania RU Russian Federation SA Saudi Arabia SD Sudan SE Sweden SI Slovenia SK Slovakia SY Syria TH Thailand TR Turkey TW Taiwan UA Ukraine UG Uganda US USA UY Uruguay UZ Uzbekistan VN Viet Nam ZA South Africa
LVL Latvian Lats MAD Moroccan Dirham MMK Myanmar Kyat MNT Mongolian Tugrik MXN Mexican Peso NGN Nigerian Naira NOK Norwegian Kroner NZD New Zealand Dollar PEN Peruvian Nuevo Sol PHP Philippine Peso PKR Pakistan Rupee PLN Polish Zloty RON Romanian New Lei RUB Russian Rouble SAR Saudi Riyal SDD Sudanese Dinar SEK Swedish Krona SIT Sloveniaan Tolar SKK Slovak Koruna SYP Syrian Pound THB Thai Baht TRL Turkish Lira TWD Taiwan Dollar UAH Ukraine Hryvnia UGX Uganda Shilling USD US Dollar UYP Uruguayan Peso UZS Uzbekistani Soum VND Viet Namese Dong XAF Communaute Financiere Africaine Franc ZAR South African Rand
© IFCN 2008 5
Note of the editors and acknowledgements
Why dairy?
Since 2003, the Pro Poor Livestock Policy Initiative of the Food and Agriculture Organization of the United Nations and the IFCN (International Farm Comparison Network) have been cooperating on the compilation and analysis of information on dairy sector development and on the household economics of dairy farming over a wide range of countries across the globe. The aim of this book is to bring these studies together and to provide a holistic picture on the trends and drivers in the dairy sector as well as the implications these may have for the future of dairy farming, in particular among the smaller-scale producers. We consider the following to be the salient findings of the studies:
The dairy sector provides income and employment to many, often poor, people:
It is estimated that some 12 to 14 percent of the world population, or 750 to 900 million people, live on dairy farms or within dairy farming households. The mean dairy herd size is around two cows that give an average milk yield of 11 litres per farm per day. Production of 1 million litres of milk per year on small-scale dairy farms creates approximately 200 on-farm jobs: in developed countries and in intensive dairy operations, such a volume of milk creates less than five on-farm jobs.
There is a great opportunity for dairy sector development to contribute to poverty reduction:
Throughout the world, there are more than 6 billion consumers of milk and milk products, the majority of them in developing countries. As such, if it is to keep pace with the growth in demand, milk production will need to grow by close to 2 percent per year. If small-scale milk producers in developing countries continue being in a position to compete on a level ‘playing field’ with large-scale, capital-intensive dairy farming systems in developed (and developing) countries, dairy-sector development will be a powerful tool for reducing poverty and creating wealth in the developing world.
A word of thanks:
We would both like to express our sincere thanks to all dairy farmers, researchers and institutions that have contributed, directly and indirectly, to this book. It is thanks to the passion for dairy-sector development and the continuous input from researchers from more than 60 countries cooperating under the umbrella of the IFCN, that it has been possible to produce this book. Among the researchers, special mention is due to the contributions of Otto Garcia, Asaah Ndambi, Amit Saha, Khalid Mahmood, Juliane Stoll, Carlos Gomez, Henning Bendfeld and Martin Hagemann.
In addition to the dairy researchers who provided the contents of the book, none of this would have been possible without the help of those who worked behind the scenes on the ‘organizational’ and ‘editorial’ aspects involved. In this respect, we also wish to express our special gratitude to Eva Asmussen, Katja Seifert and Brenda Thomas for their contributions and dedication.
Joachim Otte, Torsten Hemme, Coordinator of the PPLPI Chairman of the IFCN
6 © IFCN 2008
Executive summary
It is estimated that, throughout the world, almost 150 million farm households are engaged in milk production, the majority of them in developing countries where annual growth rates in milk consumption averaged 3.5 to 4.0 percent in the decade 1995-2005. This is at least double the growth rates of 1.4 to 2.0 percent for major staple foods over the same period. Therefore, if properly directed, dairy sector development could serve as a powerful tool for reducing poverty.
With this in mind, the aim of the present publication is to provide an overview of the global dairy sector and the forces shaping its development with a focus on the characteristics of, and implications for, ‘typical’, mostly smallholder, dairy farming systems in developing countries.
Status and trends in the global dairy sector
Based on milk equivalents (ME), average per capita global milk consumption amounts to about 100 kg of milk per year, with very significant differences between countries/regions. Per capita consumption in Western Europe is in excess of 300 kg of milk per year compared with less than 30 kg (and even sometimes as little as 10 kg) in some African and Asian countries. In the past, increases in global milk demand have been mainly driven by population growth, whereas nowadays they are increasingly also fuelled by rising per capita milk consumption in some highly populated developing countries. Increasing income levels are expected to raise the demand for milk and dairy products by more than 1.8 percent per annum. Should increases in milk production not follow suit, dairy prices will rise significantly over past levels.
South Asia and EU-25 are the most important dairy regions, accounting for 44 percent of global milk production. In the period 2002 to 2007, world milk production grew by 13 percent, or by an average of 15 million tons of energy-corrected milk (ECM) per year – mainly through production increases in China, India and Pakistan. Overall, therefore, developing countries, which rely predominantly on smallholder dairy production systems, have increased their share in world milk production.
Milk is likely to become one of the most volatile agricultural commodities owing to: (a) the strong influence that small changes in the quantities available internationally have on world market prices; (b) the length of time required for milk production to increase in response to rising prices; and (c) the delayed reaction of consumer demand to changing dairy commodity prices.
A key determinant of milk prices is the cost of feed, which directly affects milk production through increased production costs and, indirectly, higher land values. Demand for grain, an ingredient of dairy rations, is driven by the need for food, feed and fuel of a growing world population. Higher incomes in
developing countries raise the demand for food derived from livestock, leading to more demand for animal feed. Higher energy prices and policies that promote bio-fuels lead to an increased use of crops for energy production and, thereby, push up the prices of feed and land. The Organisation for Economic Co-operation and Development (OECD) and the Food and Agricultural Policy Research Institute (FAPRI) forecast that, in the long term, feed price levels will increase to about 50 percent above those of 2002-2006.
The milk:feed price ratio is one of the main factors determining the choice of dairy production system. The highest milk:feed price ratio (more than 2.5) is seen in North America, where, as a likely consequence, the most intensive milk production systems are found. Farming systems with lower milk yields, making little use of compound feed, are generally observed in countries with a milk:feed price ratio of less than 1.5.
Very few countries are self-sufficient with regard to milk. The main milk-surplus countries are Argentina, Australia, New Zealand, USA, Uruguay and countries of the European Union (EU) and Eastern Europe. The main milk-deficit countries are Algeria, China, Japan, Mexico, the Philippines and Russia. Over the period1990-2004, global milk exports increased from 4.4 to 7.1 percent of production, while the share delivered to formal milk processors increased from 14 to 24 percent.
International competitiveness of ‘typical’
dairy farms
Farms representative of various dairy farming systems in Bangladesh, Cameroon, China, India, Morocco, Pakistan, Peru, Thailand, Uganda and Viet Nam were subjected to detailed technical and economic analyses. For industrialized countries, similar analyses were conducted for farms in Germany, New Zealand and the USA.
Milk returns account for 55 to 95 percent of the returns of all farm types analysed and range from US$12 to US$36/100 kg of ECM. Non-milk returns range from US$2 to 38/100 kg ECM. Non-milk returns were very low for the farms in India whereas they were very high in Germany and Morocco.
Average milk production costs in the three industrialized countries covered by the study stand at US$31.4/100 kg, or 56 percent above the average production cost of US$20.2/100 kg calculated for the ten developing countries while the average price of milk in the three industrialized countries (US$31.2/100 kg) is only 30 percent higher than that in the developing countries (US$24.0/100 kg). Thus, the overall profitability of milk production appears to be higher in developing than in industrialized countries, which may be one of the reasons why developing countries are increasing their shares in global dairy production.
© IFCN 2008 7
Given the major differences in agricultural wage rates between industrialized and developing countries, it could be assumed that in the latter farms have a labour cost advantage. However, this was found not to be the case when comparing labour costs per litre of milk, mainly because countries with higher salaries also tend to have a significantly higher level of labour productivity. Per litre of milk, the labour costs of a nine-cow dairy farm in Punjab, India, are similar to those of a 350-cow farm in the USA. The main cost advantage of smallholder dairy farming lies in the use of low(er)-cost feed and the overall ‘low-tech’ approach to milk production. Cows fed on crop residues, such as straw, are significantly lower-cost producers of milk than high-yielding, grain-fed dairy cows.
Given the rapid increases in feed prices over the recent past, it is important to consider how this trend affects the competitiveness of small-scale dairy farmers in developing countries. As these smallholder dairy systems normally use much less compound feed per kilogram of milk than dairy farms in industrialized countries, rising feed prices increase the cost of milk production in the latter to a larger extent than in the low-yield systems predominating in developing countries. Thus, as feed prices increase, ‘typical’ smallholder dairy farms become more cost-competitive.
For dairy farming to remain sustainable, it must be able to compete for labour on local labour markets. If the ‘return to labour’ in dairy farming (i.e. the ‘value-added’ per hour of labour put into dairy farming) is higher than the average local wage rate, the dairy farming system can pay competitive wages and should be sustainable from the labour standpoint. The average return to labour observed in the developing countries covered by this study is US$0.45/hour, which is 45 percent higher than the average local wage of US$0.31/hour. In the three industrialized countries covered, the average return to labour is US$16.30/hour, which is still 22 percent above the average estimated wage of US$13.30/hour. These figures indicate that it would be possible for dairy farming to compete on local labour markets in both groups of countries. However, milk production quickly loses its competitive advantage when local wages rise faster than labour productivity.
Conclusions for smallholder dairy development
The various analyses and case studies presented in this document indicate that:
small-scale milk production not only improves the food security of milk-producing households but also helps to create numerous employment opportunities throughout the dairy chain, i.e. for small-scale rural processors and intermediaries; and
small-scale milk producers incur low production costs. Thus, if well organized, they should be able to compete with large-scale, capital-intensive ‘high-tech’ dairy farming systems in industrialized (and developing) countries.
Dairy development may therefore serve as a powerful tool for reducing poverty. Devising a viable dairy development strategy for smallholders calls for a detailed analysis of strengths, weaknesses, opportunities and threats posed by the external environment. The strengths of smallholder dairy systems are low production costs; high profit margins; low liabilities; limited liquidity risk; and relative resilience to rising feed prices – strengths that enable smallholders to serve as a competitive source of milk supply. However, smallholder milk producers are also beset by a number of weaknesses: lack of knowledge and technical know-how; poor access to support services; low capital reserves and limited access to credit; low (labour) productivity; and poor milk quality – all of which limit their ability to take advantage of market opportunities.
Major opportunities for smallholder producers engaged in dairy production are: (i) growing demand for dairy products in developing countries; (ii) probable milk price increases; (iii) potential to increase milk yields through relatively few additional inputs; (iv) potential to increase dairy labour productivity; and (v) employment generation in the dairy value chain (for example, absorbing family labour released by higher on-farm labour productivity). However, smallholders in developing countries also face major threats, namely (a) policy support for (and competition from) dairy farmers in OECD countries; (b) increased consumer demand for food safety; (c) environmental concerns (low-yield dairy systems are estimated to have higher carbon footprints per 100 kg of milk produced than high-yield systems); (d) increasing local wage rates; (e) intergenerational discontinuity (children of the better-performing farmers leave the system); (f) under-investment in dairy chain infrastructure; and (g) inappropriate dairy development policies and investment plans.
Given the increasing ‘interconnectedness’ of global agriculture, the ability of smallholder milk producers to participate in the dairy market in a profitable manner will depend not only on their own competitiveness, mainly determined by production costs, but also, and to an increasing extent, on the efficiency of the dairy chains of which they are part. Therefore, recommendations for smallholder dairy development must include strategies to increase the competitiveness in all segments of the dairy chain, namely, input supply, milk production, processing, distribution and retailing. In other words, to be successful, any dairy development strategy must be based on the principle of ‘creating value’ in each and every segment of the dairy chain. This makes formulation of a dairy development strategy a complex task, involving a large number of stakeholders and requiring comprehensive analysis and continuous reassessment.
Executive summary
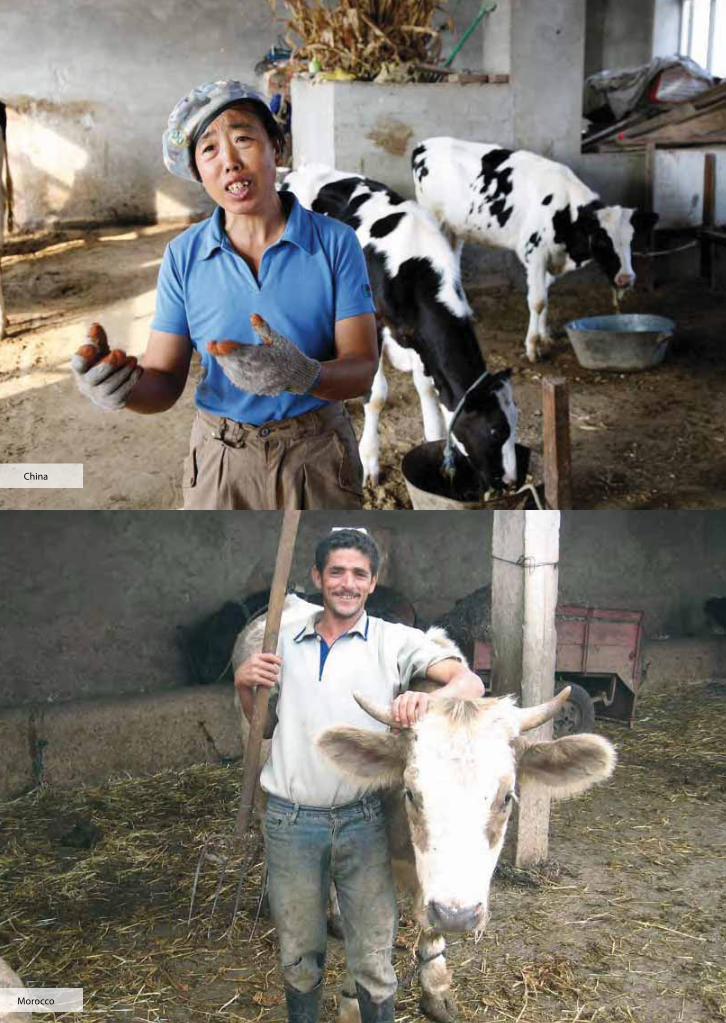
China
Morocco