Private Sector vs. Public Sector Compensation … Mission Statement RIPEC is an independent,...
70
Private Sector vs. Public Sector Compensation – A Preliminary Comparison of Salaries and Benefits in Rhode Island
-
Upload
nguyenminh -
Category
Documents
-
view
217 -
download
2
Transcript of Private Sector vs. Public Sector Compensation … Mission Statement RIPEC is an independent,...
Private Sector vs. Public Sector
Compensation – A Preliminary
Comparison of Salaries and
Benefits in Rhode Island

RIPEC Mission Statement
RIPEC is an independent, nonprofit and nonpartisan public policy research and education
organization dedicated to the advancement of effective, efficient and equitable government in
Rhode Island.
Through in-depth research, program monitoring, advocacy and public information activities,
RIPEC:
Suggests approaches to help improve the effectiveness and efficiency of government
agencies;
Promotes fiscal responsibility and sound management practices;
Assists elected officials and their staffs in the development of sound policies and
programs;
Enhances understanding between the private sector and state and local governments;
Provides objective information and conducts educational programs for the benefit of
Council members, public officials, and the general public;
Builds coalitions with other community groups to promote sound public policies; and
Promotes a public policy agenda to foster a climate for economic opportunity.

Private Sector vs. Public Sector Compensation –
A Preliminary Comparison of Salaries and Benefits in
Rhode Island
Prepared as a public service by the
Rhode Island Public Expenditure Council
November 2011

Table of Contents
Page
I. Introduction 1
II. Executive Summary 3
III. Workforce Overview 12
IV. Wages Analysis 20
V. Benefits Analysis 26
VI. Selected Occupations 32
VII. Appendix 45

1
I. Introduction
Employees in both the private and public sectors are provided with a variety of compensation
packages – salaries or hourly rates and benefits, which can include the provision of employer-
sponsored healthcare, employer contributions to a retirement plan, paid leave and other
supplemental forms of compensation. The how and why of employee compensation between the
public and private sectors has long been an issue of debate, and has moved to the forefront as
state and local budgets continue to be strained. This analysis will provide an overview of wages
and benefits of public and private sector employees in order to provide some context to the
debate about public sector compensation.
Questions to consider include: how do private sector wages compare with public sector wages
with similar job titles? How do employer contributions to healthcare or retirement plans
compare between the two sectors? Are there additional factors that mitigate compensation levels
between the two sectors, such as education and age? Ultimately, public sector compensation
packages must allow state and local governments to attract and retain a quality workforce within
the constraints of affordability and equity to taxpayers.
The following RIPEC report – Private Sector vs. Public Sector Compensation – A Preliminary
Comparison of Salaries and Benefits in Rhode Island – provides the foundational tools for
policymakers and stakeholders to begin to answer the above questions and to address the issue of
public compensation and benefits in the Ocean State. This report is the first in a series of reports
on compensation differences in the public and private sector. The following publication provides
data on and analysis of demographics and compensation, including salaries and benefits, in each
sector vis-à-vis the national average and the New England region. This publication is designed
to serve as a research tool to begin to evaluate the differences between public sector and private
sector employee compensation and how this may affect policymaking decisions on behalf of
stakeholders.
In addition to this Introduction, the report is divided into seven parts:
- Executive Summary – Summarizes the analysis performed and provides an overview of
the differences in compensation between the public and private sectors;
- Workforce Overview – Provides a snapshot of the workforce that consists of statewide
data on educational attainment levels and the distribution of workers by age. This section
explores the demographic makeup of the workforce in Rhode Island and draws regional
comparisons of a variety of skill sets, educational attainment, and average age across
sectors;
- Wage Analysis – Focuses on compensation in the form of average wage and salary for
the selected occupations within both the private and public sectors. Comparisons between
private and public sector occupations are made using variables such as educational
attainment and average age within selected occupations;
- Benefits Analysis – Examines differences in benefit levels and structures between public
sector and private sector workers. Variables include employer-sponsored health
insurance, employer-offered pension or retirement plans, and employer contributions to
healthcare;

2
- Selected Occupations – Examines eight individual occupations that provide a broad
overview of the workforce in Rhode Island as well as a range of compensation, education
and skill levels within both sectors. These occupations include: nurses, teachers,
engineers, maintenance and janitorial staff, social workers, lawyers, office and
administrative staff, and IT technicians. This section also includes occupational profiles
of individuals in Rhode Island employed in both the private and public sector –
comparing average salary, percentages of workers with employer-sponsored healthcare
and retirement plans, and salary by education level;
- Appendix – Details the methodology used to perform the analysis and provides
additional information on data collected. Includes a glossary of the Standard
Occupational Classification system used by the Bureau of Labor Statistics to distinguish
job titles; and
- Literature Review - Provides a background detailing the various approaches that
scholars and analysts have taken to assess compensation and benefits packages within the
public and private sectors and serves as a guide for the remainder of the study.
This report was produced in conjunction with the Rhode Island Office of the General Treasurer
and the Department of Administration. RIPEC would also like to thank Jack Combs and David
Blanding of Brown University for their assistance with data collection. This project aims to
contribute to the ongoing debate regarding public sector employment and the issue of pensions.
The report will also be available on RIPEC‘s website: www.ripec.org

3
II. Executive Summary
The ―Great Recession‖ has left a lasting imprint on all levels of government. As state and local
governments work to respond to historic revenue declines, and adjust their spending accordingly,
the question of public sector compensation has become an area of renewed focus and debate.
Employee compensation – the combination of salaries or wages and benefits – represents one of
the largest and fastest-growing government expenditures. Data indicates that average public
sector salaries tend to be higher than average private sector salaries. Moreover, rapidly
increasing health insurance and pension costs are of growing concern, particularly as public
sector coverage for these two benefits outpaces private sector access. At the same time, there are
a number of demographic differences between the two sectors that complicate direct
comparisons of average salaries.
The demographic composition of the public and private sectors vary on a number of accounts,
many of which affect compensation. There are a number of private sector occupations – such as
retail salespersons and cashiers – that do not have an analogue in the public sector. Outside of
the diffusion of jobs that exist in the private sector, these jobs also tend to be on the lower end of
the pay scale, require lower levels of education, and, in general, attract younger workers. All of
these factors combine to dampen average private sector pay. In contrast, the largest share of
state and local employees is engaged in teaching, which requires higher levels of education, and
generally has higher levels of pay, increasing the average pay for the public sector.
In addition to the types of occupations prevalent in each sector, demographic factors also affect
pay between the two sectors. Data indicates that the public sector tends to be better educated
than the private sector. On average, public sector workers were found to be almost twice as
likely as their private sector counterparts to hold at least a bachelor‘s degree. Age is another
factor which appears to have an effect on employee compensation. That is, older employees are
generally better compensated than younger employees, and the older the workforce, on average,
the higher the pay. The graying of the public sector workforce may be one contributing factor to
that sector‘s higher wages.
At the same time, benefits tend to be richer in the public sector, both in cost and access. Data
from the Bureau of Labor Statistics indicates that benefits account for 35 percent of public sector
employee compensation, compared to 30 percent in the private sector. The major drivers of the
differential between the two sectors were health insurance and retirement benefits. Combined,
these two factors accounted for 20 percent of public sector compensation, compared to 11
percent in the private sector. Further, employees in the public sector are more likely to be the
recipients of these benefits; in 2010, 51 percent of the private sector participated in an
employer‘s health insurance program, compared to 78 percent of the public sector. Similarly, 84
percent of private sector employees participated in an employer-sponsored retirement program
(defined benefit or defined contribution), compared to 96 percent of public sector employees.
Undoubtedly, the issue of public v. private sector compensation will continue to be a large part
of the public policy discussion around the appropriate level of government services and
expenditures. The long-term sustainability of public sector benefits, in particular, will be an
issue of increasing importance as market losses are phased into pension investment returns, and

4
as healthcare costs continue to rise faster than inflation and wages. At the same time, the ability
of governments to attract and retain high-quality employees – particularly as the current public
sector workforce ages – is paramount to ensure the effective delivery of government services.
Overview of Findings
Based on data from the BLS, average salaries for both public (state, local and federal) and
private sector workers increased in all New England states between 2001 and 2010; however, in
all cases, public sector wages increased faster than average private sector wages during the time
frame, as shown on tables 1 and 2. Public sector workers had higher levels of compensation
when compared to private sector workers in Maine, Rhode Island and Vermont, while private
sector workers in Connecticut, Massachusetts and New Hampshire had higher levels of
compensation.
In addition:
Rhode Island ranked 20th
in private sector pay and 3rd
in public sector pay when compared
to the US in 2010. This gap between pay for workers of different sectors is larger in Rhode
Island than in any other New England state;
Public sector pay in Rhode Island increased 36.7 percent from 2001 to 2010, the 7th
highest
rates of growth in the country. Public sector salaries within Rhode Island grew at a greater
rate than any state in New England;
The state‘s private sector pay, by contrast, grew by 32.2 percent, and was the 15th
highest
rate of growth in the nation. Despite a slower rate of growth in private sector salaries,
compared to the public sector, private sector salary growth in Rhode Island was higher than
any other New England state.
While both Connecticut and Massachusetts also rank in the top ten states for public sector
pay, private sector salaries in both states also ranked in the top ten. By contrast, Rhode
Island‘s private sector pay ranked 20th
highest in the country in 2010, while public sector
pay ranked 3rd
highest.
Table 1
Salary Rank Salary Rank Salary Rank Salary Rank Salary Rank Salary Rank
CT $42,493 5 $54,256 6 27.7% 43 CT $47,733 1 $60,394 2 26.5% 39
ME 30,960 37 40,996 35 32.4% 21 ME 28,397 38 36,581 45 28.8% 28
MA 40,928 7 53,925 7 31.8% 27 MA 45,561 3 58,319 3 28.0% 33
NH 32,301 28 44,016 25 36.3% 10 NH 35,955 15 46,281 15 28.7% 29
RI 42,620 4 58,276 3 36.7% 7 RI 32,179 24 42,532 20 32.2% 15
VT 31,899 32 43,075 28 35.0% 16 VT 29,918 32 38,644 36 29.2% 26
* Includes local, state and federal government employees *Includes private sector pay only
Source: BLS and RIPEC calculations Source: BLS and RIPEC calculations
Public Sector* Pay 2001-2010
2001 2010 Change 2001-10
Table 2
Private Sector* Pay 2001-2010
2001 2010 Change 2001-10
5
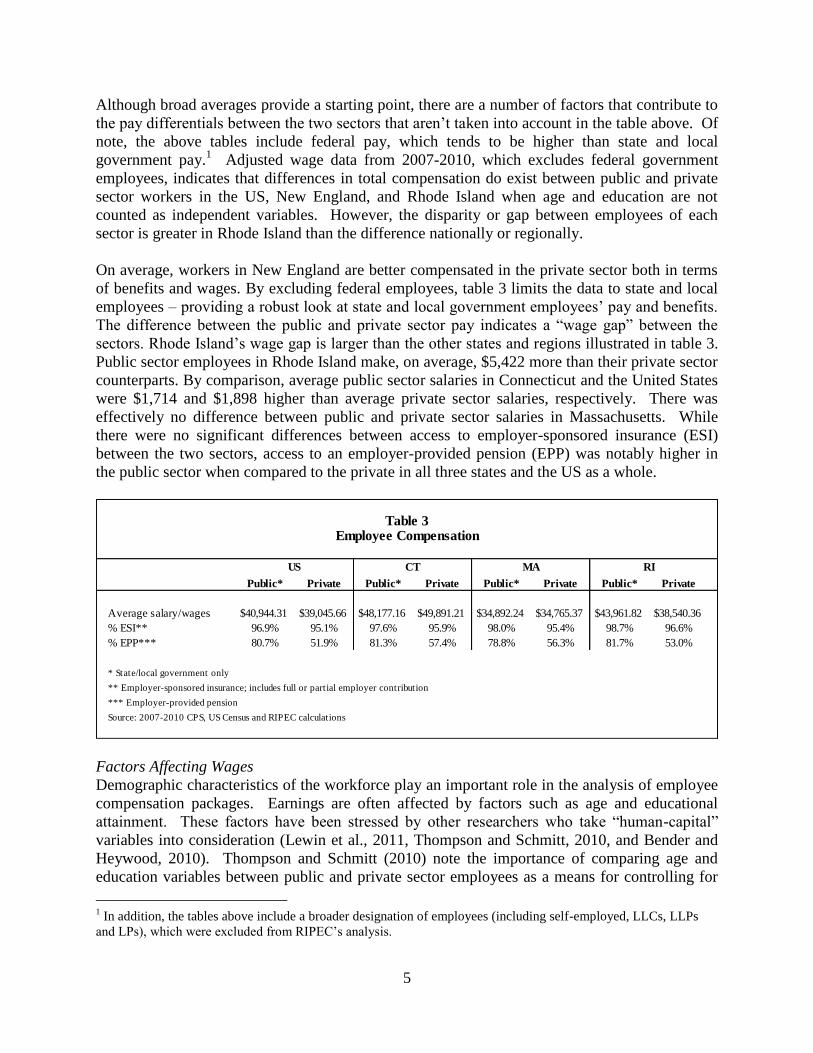
Although broad averages provide a starting point, there are a number of factors that contribute to
the pay differentials between the two sectors that aren‘t taken into account in the table above. Of
note, the above tables include federal pay, which tends to be higher than state and local
government pay.1 Adjusted wage data from 2007-2010, which excludes federal government
employees, indicates that differences in total compensation do exist between public and private
sector workers in the US, New England, and Rhode Island when age and education are not
counted as independent variables. However, the disparity or gap between employees of each
sector is greater in Rhode Island than the difference nationally or regionally.
On average, workers in New England are better compensated in the private sector both in terms
of benefits and wages. By excluding federal employees, table 3 limits the data to state and local
employees – providing a robust look at state and local government employees‘ pay and benefits.
The difference between the public and private sector pay indicates a ―wage gap‖ between the
sectors. Rhode Island‘s wage gap is larger than the other states and regions illustrated in table 3.
Public sector employees in Rhode Island make, on average, $5,422 more than their private sector
counterparts. By comparison, average public sector salaries in Connecticut and the United States
were $1,714 and $1,898 higher than average private sector salaries, respectively. There was
effectively no difference between public and private sector salaries in Massachusetts. While
there were no significant differences between access to employer-sponsored insurance (ESI)
between the two sectors, access to an employer-provided pension (EPP) was notably higher in
the public sector when compared to the private in all three states and the US as a whole.
Factors Affecting Wages
Demographic characteristics of the workforce play an important role in the analysis of employee
compensation packages. Earnings are often affected by factors such as age and educational
attainment. These factors have been stressed by other researchers who take ―human-capital‖
variables into consideration (Lewin et al., 2011, Thompson and Schmitt, 2010, and Bender and
Heywood, 2010). Thompson and Schmitt (2010) note the importance of comparing age and
education variables between public and private sector employees as a means for controlling for
1 In addition, the tables above include a broader designation of employees (including self-employed, LLCs, LLPs
and LPs), which were excluded from RIPEC‘s analysis.
Public* Private Public* Private Public* Private Public* Private
Average salary/wages $40,944.31 $39,045.66 $48,177.16 $49,891.21 $34,892.24 $34,765.37 $43,961.82 $38,540.36
% ESI** 96.9% 95.1% 97.6% 95.9% 98.0% 95.4% 98.7% 96.6%
% EPP*** 80.7% 51.9% 81.3% 57.4% 78.8% 56.3% 81.7% 53.0%
* State/local government only
** Employer-sponsored insurance; includes full or partial employer contribution
*** Employer-provided pension
Source: 2007-2010 CPS, US Census and RIPEC calculations
Table 3Employee Compensation
US CT MA RI

6
demographic considerations. An employee‘s level of education can also be a determinant in
levels of compensation. Keefe (2010) describes education as being the ―single most important
earnings predictor‖ in the public and private sector. Bender and Heywood (2010) suggest that
education plays a large role in determining comparability between public sector and private
sector positions and, that education goes underestimated by other research on compensation. The
current general consensus among compensation researchers is that comparing wages alone is also
insufficient as employer-provided benefits are an important component of compensation
packages (Keefe, 2010 and Bender and Heywood, 2010).
BLS data indicate that public sector employees tend to have higher levels of education than their
private sector counterparts, but that there is a wage penalty for public sector workers with at least
a bachelor‘s degree, nationally, regionally and in Rhode Island. On average, public sector
salaries for individuals with a bachelor‘s degree were 20.0 percent less than private sector
workers in Rhode Island (27.1 percent lower nationally, 26.1 percent lower regionally). The gap
increased for workers with a graduate degree: public sector salaries were, on average, 27.5
percent lower than private sector salaries in Rhode Island (35.4 percent lower nationally, 37.8
percent lower regionally). Notably, the wage gap between Rhode Island‘s public and private
sectors was smaller than the wage gap nationally or regionally, both on an absolute and on a
percentage basis.
In addition, workers in Rhode Island‘s private sector make less than those with comparable
education levels in the New England private sector for employees with at least some college or
an associate‘s degree. Moreover, the wage penalty increases with higher levels of education.
Individuals with a graduate or master‘s degree in Rhode Island‘s private sector earn $15,385 less
than New England private sector workers and $9,727 less than US private sector workers,
respectively. Conversely, public sector workers in Rhode Island tend to be slightly better
compensated than their national counterparts, although the difference narrows with higher levels
of education. At all levels of education, with the exception of ―some college/associate‘s‖, New
England public sector workers have higher average salaries than their Rhode Island peers.
Public Private Public Private Public Private
Less than HS Diploma $16,249 $18,803 $17,313 $16,249 $15,894 $18,480
HS Diploma 30,569 30,651 35,673 33,376 33,188 31,234
Some College or Associate's 35,530 34,797 38,854 35,103 40,750 33,996
Bachelor's 43,839 60,106 46,860 63,392 44,340 55,425
Graduate+ 59,744 92,437 61,005 98,095 60,004 82,710
Source: 2007-2010 CPS, U.S. Census and RIPEC calculations
Table 4
Salary by Educational Attainment
US NE RI
7
A report by William D. Eggers (2007) on public sector employment trends discusses the
challenges in attracting young, talented individuals to the public sector as a ―graying‖ of the
public sector workforce occurs. The ―graying‖ refers to an aging workforce – most notably, in
the public sector. Eggers (2007) suggests that the gap between ―supply of and the demand for
skilled government workers‖ is projected to grow in coming years. A shortage of mid-career
talent coupled with traditional hiring practices centered on seniority presents a problem for future
generations of public sector employees. The private sector‘s ability to outperform the public
sector in attracting and retaining top talent will further exacerbate what scholars refer to as the
―brain drain‖ of the public sector workforce (Phillips, 2011). While older workforces represent
an area of concern, both with regard to the replacement of workers and the increasing costs of
providing retirement benefits, older workers are often more experienced workers who may be
more productive due to their experience.
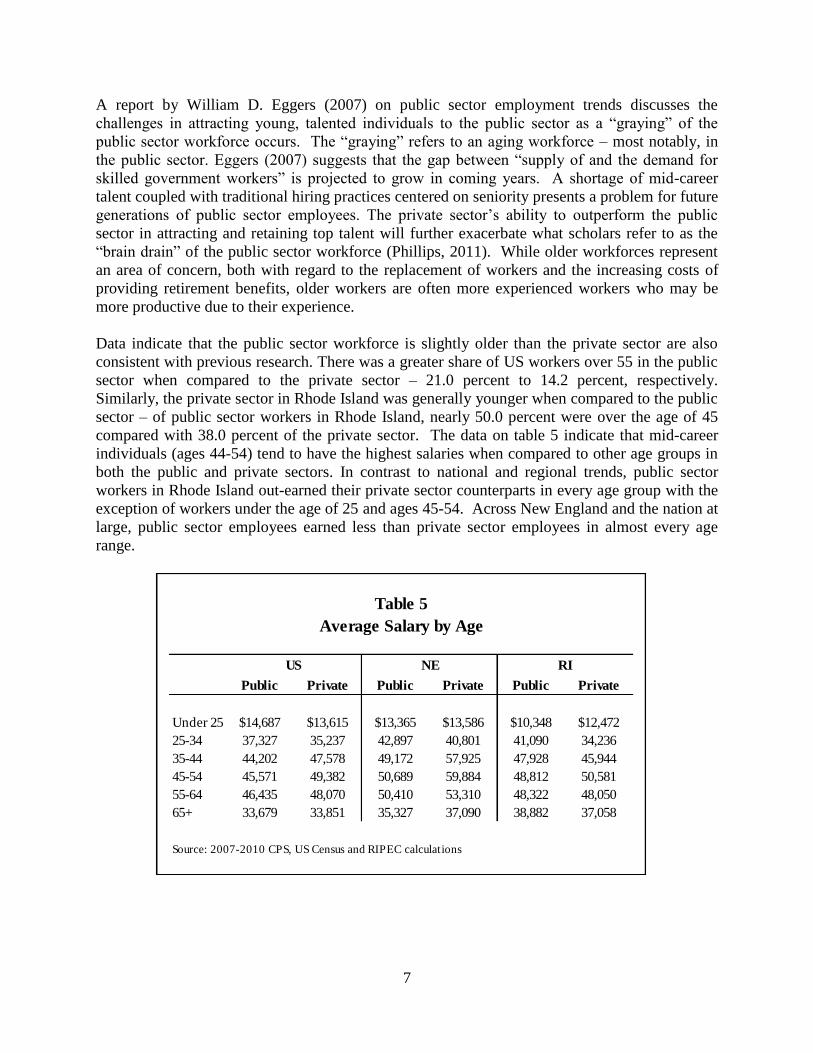
Data indicate that the public sector workforce is slightly older than the private sector are also
consistent with previous research. There was a greater share of US workers over 55 in the public
sector when compared to the private sector – 21.0 percent to 14.2 percent, respectively.
Similarly, the private sector in Rhode Island was generally younger when compared to the public
sector – of public sector workers in Rhode Island, nearly 50.0 percent were over the age of 45
compared with 38.0 percent of the private sector. The data on table 5 indicate that mid-career
individuals (ages 44-54) tend to have the highest salaries when compared to other age groups in
both the public and private sectors. In contrast to national and regional trends, public sector
workers in Rhode Island out-earned their private sector counterparts in every age group with the
exception of workers under the age of 25 and ages 45-54. Across New England and the nation at
large, public sector employees earned less than private sector employees in almost every age
range.
Public Private Public Private Public Private
Under 25 $14,687 $13,615 $13,365 $13,586 $10,348 $12,472
25-34 37,327 35,237 42,897 40,801 41,090 34,236
35-44 44,202 47,578 49,172 57,925 47,928 45,944
45-54 45,571 49,382 50,689 59,884 48,812 50,581
55-64 46,435 48,070 50,410 53,310 48,322 48,050
65+ 33,679 33,851 35,327 37,090 38,882 37,058
Source: 2007-2010 CPS, US Census and RIPEC calculations
Table 5
Average Salary by Age
RINEUS
8
Benefits
Benefits tend to be both more available and more costly in the public sector. The major cost-
drivers with respect to benefits in the public sector were health insurance and retirement benefits.
When healthcare costs and retirement benefits are combined, they account for 20 percent of
public sector compensation, compared to 11 percent in the private sector. Firm size had one of
the most significant effects on the cost of benefits as a share of total compensation. Benefits
accounted for a smaller share of total compensation for small firms (less than 99 employees) than
for larger (500+ employees). Notably, the share of compensation accounted for by benefit costs
was similar between large employers and state/local governments, the composition of those
benefits varied between the two groups.
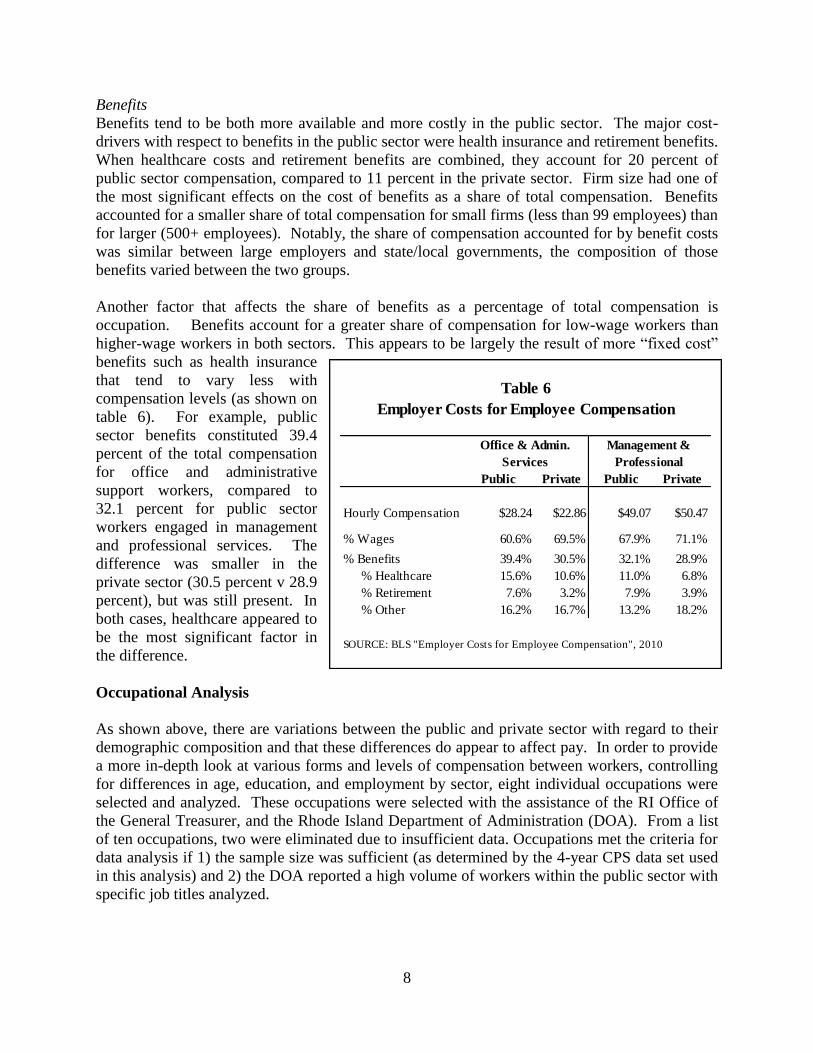
Another factor that affects the share of benefits as a percentage of total compensation is
occupation. Benefits account for a greater share of compensation for low-wage workers than
higher-wage workers in both sectors. This appears to be largely the result of more ―fixed cost‖
benefits such as health insurance
that tend to vary less with
compensation levels (as shown on
table 6). For example, public
sector benefits constituted 39.4
percent of the total compensation
for office and administrative
support workers, compared to
32.1 percent for public sector
workers engaged in management
and professional services. The
difference was smaller in the
private sector (30.5 percent v 28.9
percent), but was still present. In
both cases, healthcare appeared to
be the most significant factor in
the difference.
Occupational Analysis
As shown above, there are variations between the public and private sector with regard to their
demographic composition and that these differences do appear to affect pay. In order to provide
a more in-depth look at various forms and levels of compensation between workers, controlling
for differences in age, education, and employment by sector, eight individual occupations were
selected and analyzed. These occupations were selected with the assistance of the RI Office of
the General Treasurer, and the Rhode Island Department of Administration (DOA). From a list
of ten occupations, two were eliminated due to insufficient data. Occupations met the criteria for
data analysis if 1) the sample size was sufficient (as determined by the 4-year CPS data set used
in this analysis) and 2) the DOA reported a high volume of workers within the public sector with
specific job titles analyzed.
Public Private Public Private
Hourly Compensation $28.24 $22.86 $49.07 $50.47
% Wages 60.6% 69.5% 67.9% 71.1%
% Benefits 39.4% 30.5% 32.1% 28.9%
% Healthcare 15.6% 10.6% 11.0% 6.8%
% Retirement 7.6% 3.2% 7.9% 3.9%
% Other 16.2% 16.7% 13.2% 18.2%
SOURCE: BLS "Employer Costs for Employee Compensation", 2010
Table 6
Employer Costs for Employee Compensation
Office & Admin.
Services
Management &
Professional
9
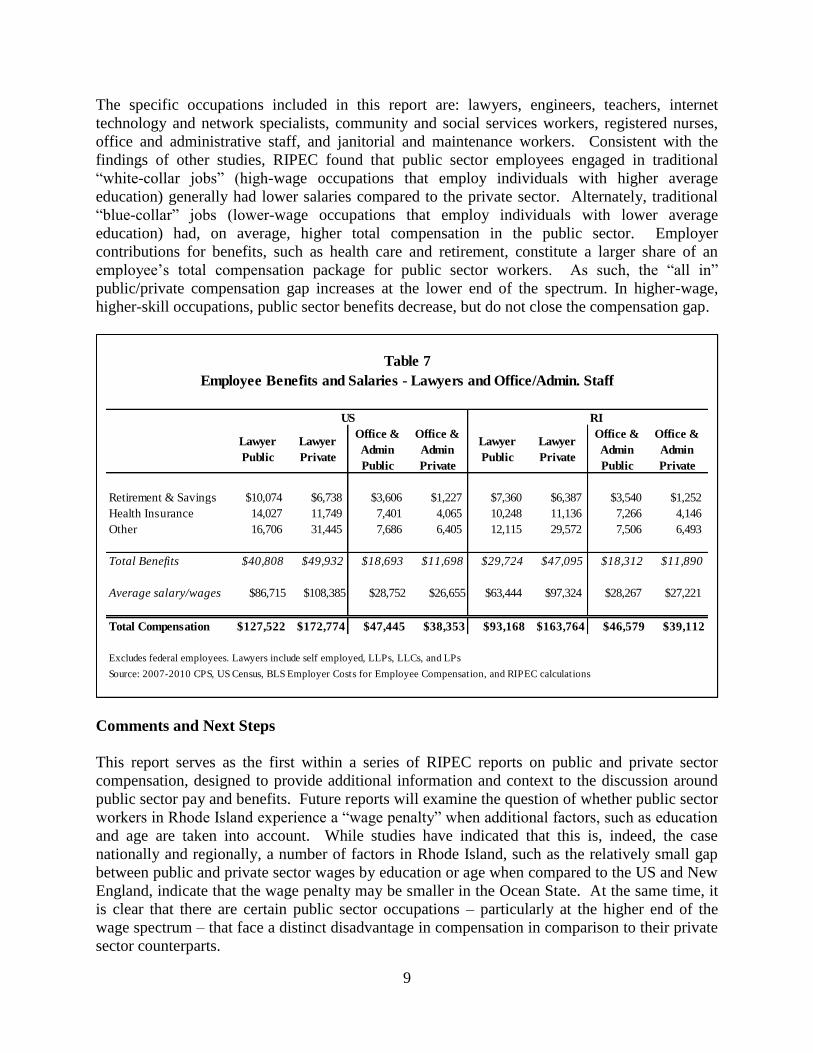
The specific occupations included in this report are: lawyers, engineers, teachers, internet
technology and network specialists, community and social services workers, registered nurses,
office and administrative staff, and janitorial and maintenance workers. Consistent with the
findings of other studies, RIPEC found that public sector employees engaged in traditional
―white-collar jobs‖ (high-wage occupations that employ individuals with higher average
education) generally had lower salaries compared to the private sector. Alternately, traditional
―blue-collar‖ jobs (lower-wage occupations that employ individuals with lower average
education) had, on average, higher total compensation in the public sector. Employer
contributions for benefits, such as health care and retirement, constitute a larger share of an
employee‘s total compensation package for public sector workers. As such, the ―all in‖
public/private compensation gap increases at the lower end of the spectrum. In higher-wage,
higher-skill occupations, public sector benefits decrease, but do not close the compensation gap.
Comments and Next Steps
This report serves as the first within a series of RIPEC reports on public and private sector
compensation, designed to provide additional information and context to the discussion around
public sector pay and benefits. Future reports will examine the question of whether public sector
workers in Rhode Island experience a ―wage penalty‖ when additional factors, such as education
and age are taken into account. While studies have indicated that this is, indeed, the case
nationally and regionally, a number of factors in Rhode Island, such as the relatively small gap
between public and private sector wages by education or age when compared to the US and New
England, indicate that the wage penalty may be smaller in the Ocean State. At the same time, it
is clear that there are certain public sector occupations – particularly at the higher end of the
wage spectrum – that face a distinct disadvantage in compensation in comparison to their private
sector counterparts.
RI
Lawyer
Public
Lawyer
Private
Office &
Admin
Public
Office &
Admin
Private
Lawyer
Public
Lawyer
Private
Office &
Admin
Public
Office &
Admin
Private
Retirement & Savings $10,074 $6,738 $3,606 $1,227 $7,360 $6,387 $3,540 $1,252
Health Insurance 14,027 11,749 7,401 4,065 10,248 11,136 7,266 4,146
Other 16,706 31,445 7,686 6,405 12,115 29,572 7,506 6,493
Total Benefits $40,808 $49,932 $18,693 $11,698 $29,724 $47,095 $18,312 $11,890
Average salary/wages $86,715 $108,385 $28,752 $26,655 $63,444 $97,324 $28,267 $27,221
Total Compensation $127,522 $172,774 $47,445 $38,353 $93,168 $163,764 $46,579 $39,112
Excludes federal employees. Lawyers include self employed, LLPs, LLCs, and LPs
Source: 2007-2010 CPS, US Census, BLS Employer Costs for Employee Compensation, and RIPEC calculations
Table 7
Employee Benefits and Salaries - Lawyers and Office/Admin. Staff
US

10
The report‘s findings present a number of questions and challenges for both the public and
private sectors. One of the most significant findings of the report is that, in general, there is a
wage penalty for private sector workers in Rhode Island, when compared to New England and,
often, the US as a whole. While this finding did not hold in all occupations, the relatively low
levels of private sector compensation present challenges that are two-fold:
First, the fact that private sector wages in Rhode Island are not competitive with New
England private sector wages points to a distinct need for the state to examine its
economic and workforce development strategies.
Second, private sector wages must be robust enough to support public services including,
but not limited to, competitive wage rates in the public sector that allow governments to
attract and retain quality employees.
The shift from a goods-producing economy to a knowledge-based and service-providing
economy has resulted in a depletion of blue-collar jobs that traditionally employ individuals with
little to no post-secondary education. Between December 2006 and February 2009, the highest
percentages of job losses in Rhode Island were concentrated in construction (18.4 percent),
manufacturing (25.7 percent), and trade, transportation, and utilities industries (20.8 percent),
respectively.2 The loss of blue-collar jobs has presented challenges at the national and state
levels, as such populations with little to no post-secondary education continue to experience grim
employment prospects – as the transition to a service-providing economy fails to create a
sufficient demand for the type of work typically performed by blue-collar workers.
Changing economic tides have resulted in a decreased demand for professions that typically
required lower levels of education, pointing to a need for the state‘s education systems to
respond to these changes in kind. Strengthening the PK-12 system and integrating a workforce
development program that is responsive to the needs of employers are imperative if the state is to
attract the type of employer that will be able to support competitive private wages. At the same
time, the state must continue to evaluate its tax and regulatory policies with an eye to creating a
competitive economic climate. These actions go hand-in-hand with regard to creating a robust
private sector workforce.
Another issue raised by the report – consistent with other analyses of public and private sector
compensation – is that higher-paid occupations such as lawyers and IT professionals appear to
face a larger wage penalty in the public sector, compared to lower-wage occupations. While
public sector benefits mediate the impact of this wage gap, it raises larger questions about the
state‘s overall personnel structure. Specifically, in fostering an environment that attracts top
talent in the public sector, state and local governments must have a compensation scale that pays
employees market value for their skill sets, but in the context of a government that is affordable
to the taxpayer. Similarly, compensation packages must be responsive to the demands of the
workforce. Data indicate that back-loaded pension plans, such as those in Rhode Island tend to
foster longer terms of service, but are less attractive to younger employees who are less likely to
desire career employment.
2 Harington, et al. ―The Labor Market Impacts of the National Economic Crisis in Rhode Island.‖ Workforce
Development Response to National Economic Crisis, April 2009. p 5.

11
Personnel costs should be an integral, but not exclusive, part of a larger discussion of
government restructuring. RIPEC believes that governments at all levels should examine
personnel levels and individual jobs functions in an effort to streamline government. They
should initiate staffing models that account for long-term personnel needs, beginning with an
examination of current staffing levels against anticipated needs based on current policies.
Opportunities to streamline operations or job functions should be explored. Moreover, a
determination should be made as to whether the service being performed is necessary, or if it
could be more effectively performed as part of another agency or level of government.
Reevaluating service delivery and government structure is a necessary step towards long-term
fiscal sustainability.

12
85.9% 86.5% 86.0% 88.3%
14.1% 13.5% 14.0% 11.7%
0%
10%
20%
30%
40%
50%
60%
70%
80%
90%
100%
US CT MA RI
Private State and Local
Chart 1
Distribution of Employees by Sector
Source: 2007-2010 CPS, U.S. Census and RIPEC calculations
III. Workforce Overview
The demographic composition of the workforce should be taken into account when analyzing
compensation levels between professions and sectors. Data from national studies indicate that
the average age of workers between sectors and average educational levels are related to
compensation levels. Demographic characteristics such as education should be taken into
account when assessing variation in compensation. Of note, the ―public sector‖ in this report
refers specifically to state and local government employees; federal employees and members of
the armed forces are excluded from this definition. In addition, self-employed individuals,
LLCs, LPs and LLPs are excluded from the definition of private sector. All data in this section is
from the Current Population Survey March Supplement (2007-2010) and the Bureau of Labor
Statistics and represent the most current information available as of publication.
Public v. Private Employment
Nationally, 85.9 percent
of employees worked
within the private sector
and 14.1 percent work
within the public sector.
Rhode Island had a
smaller share of the
workforce employed by
state and local
governments when
compared to the national
average and neighboring
states. The private sector
in Rhode Island employed
88.3 percent of the
workforce compared to
11.7 percent in the public
sector. The private sector
employed 86.0 percent of the workforce in Massachusetts while the public sector employed 14.0
percent, on par with the national average. Public sector employees in Connecticut constituted
13.5 percent of their total workforce, 1.8 percent more than in Rhode Island.
Private Sector Occupations
Occupations vary between the public and private sectors, which has an effect on overall
compensation levels; specifically, the high volume of lower-paying positions in the private sector
can weigh down the overall average salary of the private sector as a whole. Moreover, many
private sector jobs do not have an analogue in the public sector – for example, manufacturing
jobs and retail positions. These two factors complicate comparisons of public v. private sector
wages and can skew the results if they are not considered. Table 8 lists the top ten private sector
occupations by percentage of total workforce and number of employees as of May 2010.
13
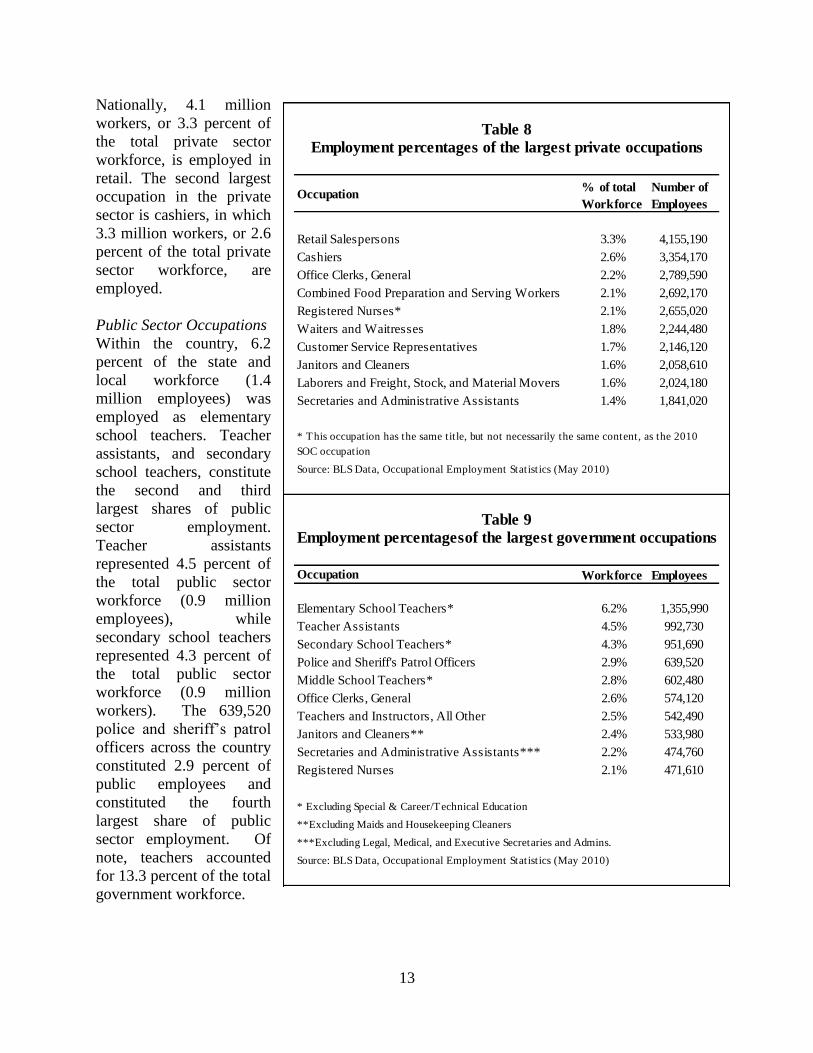
Nationally, 4.1 million
workers, or 3.3 percent of
the total private sector
workforce, is employed in
retail. The second largest
occupation in the private
sector is cashiers, in which
3.3 million workers, or 2.6
percent of the total private
sector workforce, are
employed.
Public Sector Occupations
Within the country, 6.2
percent of the state and
local workforce (1.4
million employees) was
employed as elementary
school teachers. Teacher
assistants, and secondary
school teachers, constitute
the second and third
largest shares of public
sector employment.
Teacher assistants
represented 4.5 percent of
the total public sector
workforce (0.9 million
employees), while
secondary school teachers
represented 4.3 percent of
the total public sector
workforce (0.9 million
workers). The 639,520
police and sheriff‘s patrol
officers across the country
constituted 2.9 percent of
public employees and
constituted the fourth
largest share of public
sector employment. Of
note, teachers accounted
for 13.3 percent of the total
government workforce.
Occupation% of total
Workforce
Number of
Employees
Retail Salespersons 3.3% 4,155,190
Cashiers 2.6% 3,354,170
Office Clerks, General 2.2% 2,789,590
Combined Food Preparation and Serving Workers 2.1% 2,692,170
Registered Nurses* 2.1% 2,655,020
Waiters and Waitresses 1.8% 2,244,480
Customer Service Representatives 1.7% 2,146,120
Janitors and Cleaners 1.6% 2,058,610
Laborers and Freight, Stock, and Material Movers 1.6% 2,024,180
Secretaries and Administrative Assistants 1.4% 1,841,020
Source: BLS Data, Occupational Employment Statistics (May 2010)
Occupation
% of total
Workforce
Number of
Employees
Elementary School Teachers* 6.2% 1,355,990
Teacher Assistants 4.5% 992,730
Secondary School Teachers* 4.3% 951,690
Police and Sheriff's Patrol Officers 2.9% 639,520
Middle School Teachers* 2.8% 602,480
Office Clerks, General 2.6% 574,120
Teachers and Instructors, All Other 2.5% 542,490
Janitors and Cleaners** 2.4% 533,980
Secretaries and Administrative Assistants*** 2.2% 474,760
Registered Nurses 2.1% 471,610
* Excluding Special & Career/Technical Education
**Excluding Maids and Housekeeping Cleaners
***Excluding Legal, Medical, and Executive Secretaries and Admins.
Source: BLS Data, Occupational Employment Statistics (May 2010)
Table 8
Employment percentages of the largest private occupations
Employment percentagesof the largest government occupations
* This occupation has the same title, but not necessarily the same content, as the 2010
SOC occupation
Table 9

14
Educational Attainment
Based on national studies, levels of education appear to influence salary and access to benefits
across all sectors. Nationally, educational trends illustrate that, in general, a higher percentage of
state and local public sector workers have received college degrees, both undergraduate and
graduate level, when compared with those employed in the private sector. National trends
indicate that levels of educational attainment have increased in both sectors. The shift from a
goods-producing economy to a service-based economy has changed the average educational
attainment within a variety of positions, and in turn, led to the shrinkage of certain industries
(such as the decrease in manufacturing and production over the last 20 years), which has affected
private sector employment and educational levels as shown on Chart 2.
Between 1983 and 2008, the levels of educational attainment had increased in all sectors;
however, there still remained a gap between public and private sector workers. Bender and
Heywood (2010) performed this analysis of a 25 year period in which educational attainment
levels across sectors changed. Some of their findings include:
For private sector workers, the number of employees with some college increased by 6.5
percentage points and those with a college degree increased by 9.3 percentage points;
For state workers, the number of employees with some college increased by 3.2
percentage points and those with a college degree increased by 13.9 percentage points;
and
For local workers, the number of employees with some college increased by 6.4
percentage points and those with a college degree increased by 12.6 percentage points.
For all sectors, the number of employees with a high school diploma as the highest level of
educational attainment decreased between 7.5 and 12.2 percentage points. The data indicated that
workers in both sectors achieved a higher level of education in 2008 compared to workers in
-9.1%
6.5%
9.3%
0.6%
-12.2%
3.2%
13.9%
1.0%
-7.5%
6.4%
12.6%
-4.0%
-15.0%
-10.0%
-5.0%
0.0%
5.0%
10.0%
15.0%
20.0%
HS Diploma Some College College Degree Graduate Degree
Chart 2
Change in Educational Attainment, 1983-2008
Private State LocalSource: Bender and Heywood, 2010 and RIPEC Calculations

15
1983. The number of individuals
with a college degree (excluding
graduate or master‘s degrees) in
the public sector at the state and
local level increased at a greater
rate than the private sector.
Nationally and regionally, the
private sector employs a greater
percentage of individuals with
lower educational attainment
levels than the public sector.
Based on the 2007-2010 data, at
the national level, the public
sector employed a higher
percentage of individuals with
college and advanced degrees
(chart 4). Individuals with
educational attainment levels
lower than an associate‘s degree
(some college, high school
diploma, or no high school
diploma) constitute a greater
share of the private sector than
the public sector (57.2 percent of
total workers in the private
sector with less than an
associate‘s degree compared to
35.7 percent in the public
sector).
New England generally has a
higher level of educational
attainment for both the public
and private sectors when
compared to national data. The
percentage of workers with
college degrees was higher in
both sectors when compared to
the national averages. In New
England, 21.7 percent of all
private sector workers had
attained a bachelor‘s degree,
compared to the national figure
of 18.1 percent. New England
public sector workers were more
Chart 3
Education by Sector
0.0%
5.0%
10.0%
15.0%
20.0%
25.0%
30.0%
35.0%
Less than HS
diploma
HS diploma Some college Associate's Bachelor's Graduate
United States
% Private % Public
0.0%
5.0%
10.0%
15.0%
20.0%
25.0%
30.0%
35.0%
Less than HS
diploma
HS diploma Some college Associate's Bachelor's Graduate
New England
% Private % Public
0.0%
5.0%
10.0%
15.0%
20.0%
25.0%
30.0%
35.0%
Less than HS HS diploma Some college Associate's Bachelor's Graduate
Rhode Island
% Private % PublicSource: 2007-2010 CPS, U.S. Census and RIPEC calculations
16
likely to have a bachelor‘s degree compared to their private sector peers, but less likely to hold a
bachelor‘s degree compared to the national average.
At the same time, a higher percentage of workers in the New England public sector held graduate
degrees than public or private sector employees at the national level and private sector
employees at the regional level; 28.4 percent of New England public sector workers held some
form of a graduate degree (master‘s, professional, or PhD), compared to 11.1 percent of private
sector employees in the region and 23.3 percent of public sector workers nationally. Nationally
and in New England, private sector workers were more likely to have some college, hold a high
school diploma or have some high school as their highest level of educational attainment when
compared to public sector workers.
In Rhode Island, the percentage of workers with a bachelor‘s degree or higher level of
educational attainment is higher in the public sector. State and local employees in Rhode Island
were more likely to have some form of a graduate degree compared to their peers nationally and
regionally and had similar percentage of employees with a bachelor‘s degree. Similarly, private
sector workers were more likely to have some college, a high school diploma or less than their
public sector counterparts in Rhode Island. In Rhode Island, 70.8 percent of all private sector
employees had an associate‘s degree or less, compared to 35.1 percent of the public sector
population. At the same time, a larger share of private sector employees had less than an
associate‘s degree compared to their national and regional peers (64.4 percent and 57.2 percent,
respectively).
Age
Age generally relates to experience, which is often a factor in determining compensation costs.
As such, the average age within a sector is an important demographic to be taken into
consideration when analyzing compensation. In addition, the need to recruit workers becomes
more important as the workforce continues to age and retire. How compensation packages are
structured across the public and private sectors may have an impact on the ability of either sector
to attract and retain new employees. Such findings on the ―greying‖ of the public workforce
have been echoed by scholars such as William D. Eggers (2007). National trends have indicated
that the average ages in both the private and public sectors have increased over recent years, as
individuals are living longer and working longer, i.e. the problem with state and local pensions.3
Noteworthy findings on age distribution across the country include:
The percentage of workers under 25 in the private sector is 16.4 percent, compared to 7.0
percent of workers in the public sector;
Of the total private sector workforce, 63.6 percent were under 45. By contrast, 51.2 percent
of the national public sector was younger than 45; and
A greater share of workers was over 55 in the public sector compared to the private sector
(21.0 percent v. 14.2 percent).
3 Eggers, William D. (2007). ―The Graying Government Workforce.‖ Deloitte Public Sector (2007): 1-4. Deloitte
Research - Public Sector.

17
In general, New England
workers were older in both
sectors compared to workers
nationally. This was
particularly true for public
sector workers in New
England and across all three
southern New England states.
Regionally, 59.9 percent of
private sector workers were
under the age of 45, while
48.7 percent of public sector
workers fell in this age
cohort. Of the three states,
Massachusetts had the
smallest share of public
sector workers under 45 –
just 46.7 percent of public
employees in the Bay State
were under 45. Moreover,
the gap between the public
sector and the private sector
was larger in Massachusetts
than the other states, the
region and the national
average (14.6 percent,
compared to a regional gap
of 11.1 percent and a national
gap of 12.3 percent).
As shown on chart 5, age
distribution patterns in Rhode
Island were similar to
national and regional
averages. However, the 10.2
percentage point age gap
between public and private
sector workers aged 25 or
younger was larger in Rhode
Island than it was nationally
and regionally. Only
Massachusetts had a larger
age gap. Rhode Island‘s
state and local sectors have a
similar percentage of workers
in the public sector aged 45
Age by Sector
Chart 4
0.0%
5.0%
10.0%
15.0%
20.0%
25.0%
30.0%
Under 25 25-34 35-44 45-54 55-64 Over 65
United States
State and Local
Private
0.0%
5.0%
10.0%
15.0%
20.0%
25.0%
30.0%
Under 25 25-34 35-44 45-54 55-64 Over 65
New England
State and Local Private
0.0%
5.0%
10.0%
15.0%
20.0%
25.0%
30.0%
35.0%
Under 25 25-34 35-44 45-54 55-64 Over 65
Rhode Island
State and Local PrivateSource: 2007-2010 CPS, U.S. Census and RIPEC calculations
18
or under (62.0 percent in
Rhode Island compared to
63.6 percent nationally).
Within the region, a larger
share of the state‘s private
sector workforce was under
45. Similarly, a larger share of
public sector employees was
45 or younger when compared
to the region and
Massachusetts. At the same
time, Rhode Island had a
greater percentage of public
sector employees ages 65 and
older when compared to the
US. Within the US, 3.9 percent
of all public sector workers
were 65 and over whereas in
Rhode Island, 4.5 percent of
public sector workers were age
65 and over.
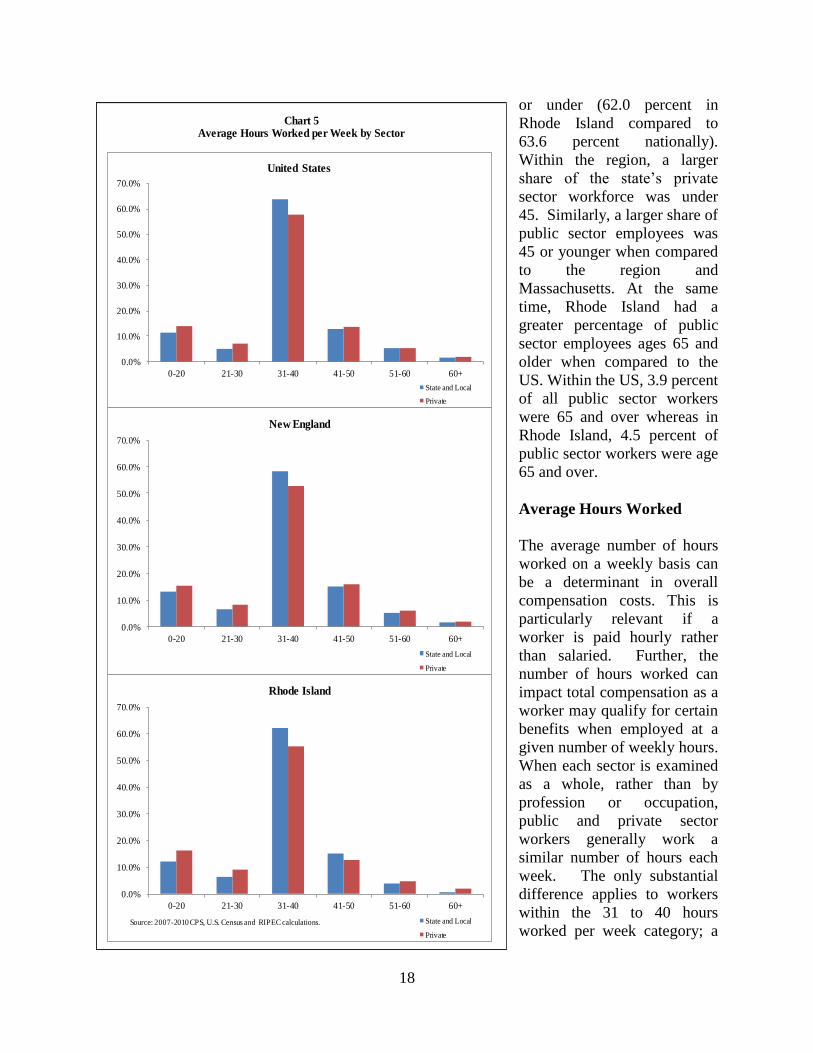
Average Hours Worked
The average number of hours
worked on a weekly basis can
be a determinant in overall
compensation costs. This is
particularly relevant if a
worker is paid hourly rather
than salaried. Further, the
number of hours worked can
impact total compensation as a
worker may qualify for certain
benefits when employed at a
given number of weekly hours.
When each sector is examined
as a whole, rather than by
profession or occupation,
public and private sector
workers generally work a
similar number of hours each
week. The only substantial
difference applies to workers
within the 31 to 40 hours
worked per week category; a
Chart 5Average Hours Worked per Week by Sector
0.0%
10.0%
20.0%
30.0%
40.0%
50.0%
60.0%
70.0%
0-20 21-30 31-40 41-50 51-60 60+
United States
State and Local
Private
0.0%
10.0%
20.0%
30.0%
40.0%
50.0%
60.0%
70.0%
0-20 21-30 31-40 41-50 51-60 60+
New England
State and Local
Private
0.0%
10.0%
20.0%
30.0%
40.0%
50.0%
60.0%
70.0%
0-20 21-30 31-40 41-50 51-60 60+
Rhode Island
State and Local
Private
Source: 2007-2010 CPS, U.S. Census and RIPEC calculations.

19
larger percentage of public sector employees fall within this category when compared to the
private sector.
Data suggests that:
A higher percentage of public sector employees nationally, regionally and in Rhode Island
work an average of 31 to 40 hours weekly when compared to the private sector;
The private sector has a higher percentage of workers clocking 51 to 60 or more hours a
week; and
Private sector workers constitute a larger share of workers that average 21 to 30 hours a
week, but also constitute a higher percentage of workers that put in over 60 hours a week on
average.

20
IV. Wage Analysis
Employees receive a share of their total compensation in the form of wages – earnings typically
based on either an annual salaried or hourly rate. Salaries and wages represent the largest share
of compensation, regardless of sector, occupation or geographical location. As such, the cost of
wages is an important variable to consider when evaluating public and private sector
compensation. At the same time, wages vary with a number of factors, such as education, age,
sector, and number of hours worked. This section examines wages in the public and private
sectors using data from the BLS CPS March Supplement, 2007-2010 using both average salaries
and ranges of salaries based on certain demographic factors.
Wages Overview
National data indicate that public
sector employees (including state,
local and federal), on average, are
better compensated that private sector
workers. In 2010, the most recent
year for which data is available,
average public sector salaries of $48,
170 were 3.7 percent higher than
average private sector salaries.
Public sector salaries tend to be
higher in the southern New England
states than in Maine, New
Hampshire, Vermont or the national
average. At the same time, however,
average public sector salaries in
Rhode Island (which were 3rd
highest
in the country) outpace public sector
salaries in both Connecticut and
Massachusetts, who were ranked 5th
and 6th
highest, respectively. Moreover, although public
sector salaries in Connecticut and Massachusetts also rank in the top ten, private sector salaries
in these states also rank in the top ten; in 2010, private sector salaries were the 2nd
highest in the
country in Connecticut, while salaries in Massachusetts were the 3rd
highest. Rhode Island‘s
private sector wages in 2010 of $42,532 ranked the Ocean State 20th
highest in the country – the
largest wage gap of the 50 states. It should be noted that table 5 includes federal employees‘
salary, as the BLS included federal pay into this particular analysis on the public sector.
At the same time, there are a number of factors that affect public and private sector wages such
as education, age and occupation. For example, as noted in the previous section, public sector
workers tend to be both older and better educated than their private sector counterparts. Private
sector employees are more likely to work more than 50 hours a week, as indicated in the
workforce overview section. Data has indicated that these two factors have an effect on
compensation so, as such, one may expect public sector workers to be better compensated, on
average, unless these factors are controlled for in the analysis. Additionally, as shown in the
Salary Rank Salary Rank Salary Rank
US $48,170 - $46,451 - 3.7% -
CT $54,408 5 $60,394 2 -9.9% 49
ME 40,816 36 36,581 45 11.6% 12
MA 53,699 6 58,319 3 -7.9% 48
NH 43,865 23 46,281 15 -5.2% 44
RI 57,036 3 42,532 20 34.1% 1
VT 42,494 28 38,644 36 10.0% 11
* Includes local, state and federal government employees
Source: BLS and RIPEC calculations
Table 10
Public Sector* v Private Sector Pay, 2010
Public Private Difference

21
previous section, a large share of the national workforce is engaged in occupations – such as
retail and cashiers – that tend to have low wages, thus skewing public and private sector
compensation when just examining averages.
When wages were broken down further (and federal employees were excluded) it was possible to
see a pattern of compensation between the two sectors. Although the share of private sector
employees with salaries over $100,000 was roughly double the percentage of public sector
employees with salaries in the six figures, a larger share of the private sector receives lower
salaries than the public sector: at the lowest end of the wage spectrum, 37.9 percent of
individuals working in the private sector earn less than $21,000 annually compared to 26.3
percent of public employees. More public sector employees were medium-income earners
(between $41,000 annually and $80,000 annually) than private sector employees. Alternately,
there is greater income stratification in the private sector than in the public sector, and the private
sector is, generally, heavily skewed toward the lower end of the wage spectrum when compared
to the public sector.
Factors Affecting Wages
This section of the report examines wages between the public and private sectors in Rhode
Island, New England, and the country as a whole and explores different factors that can
contribute to differences in wages amongst workers. Specifically, this section examines how
wages are affected by a number of demographic factors such as educational attainment, average
age of worker, regional differences, and the types of occupations in each sector.
0.0%
5.0%
10.0%
15.0%
20.0%
25.0%
30.0%
35.0%
40.0%
Less than 21k 21k-40k 41k-60k 61k-80k 81k-100k Over 100k
Chart 6
US - Annual Salary and Wages by Sector
State and Local PrivateSource: 2007-2010 CPS March Supplement, U.S. Census and RIPEC calculations

22
Sector and Occupation
Tables 11 and 12 show the
top ten largest occupations
measured by their share of
total sector employment
and their average salaries as
calculated by the BLS.
Differences in the types of
occupations in each sector
will have an impact on
average compensation.
That is, if a higher
percentage of employees in
a given sector are employed
in lower-paying
professions, average salary
will be lower than if a
larger share of workers is
employed in higher-paying
professions, all things being
equal.
As shown on the tables to
the right, average salaries
were lower for the 10
largest occupations in the
private sector when
compared to the public
sector. Of the top ten
largest private occupations,
only one (registered nurses)
had a salary of over
$50,000 in 2010. By
contrast, five of the ten
largest public sector
occupations had salaries
over $50,000. Together,
elementary, middle and
secondary school teachers
accounted for 13.3 percent
of total state and local
employment in 2010 and all
three occupations had
average salaries of over
$50,000.
Occupation% of Total
Workforce
Average
Salary
Retail Salespersons 3.3% $25,000
Cashiers 2.6% 19,810
Office Clerks, General 2.2% 28,240
Combined Food Preparation & Serving Workers 2.1% 18,610
Registered Nurses* 2.1% 67,720
Waiters & Waitresses 1.8% 20,790
Customer Service Representatives 1.7% 32,780
Janitors & Cleaners 1.6% 24,560
Laborers & Freight, Stock, & Material Movers 1.6% 25,710
Secretaries & Administrative Assistants 1.4% 32,000
Source: BLS Data, Occupational Employment Statistics (May 2010)
Occupation% of Total
Workforce
Average
Salary
Elementary School Teachers* 6.2% $55,350
Teacher Assistants 4.5% 25,330
Secondary School Teachers* 4.3% 56,600
Police & Sheriff's Patrol Officers 2.9% 55,670
Middle School Teachers* 2.8% 55,510
Office Clerks, General 2.6% 29,990
Teachers & Instructors, All Other 2.5% 37,200
Janitors & Cleaners** 2.4% 28,930
Secretaries & Administrative Assistants*** 2.2% 34,320
Registered Nurses 2.1% 67,040
* Excluding Special & Career/Technical Education
**Excluding Maids & Housekeeping Cleaners
***Excluding Legal, Medical, & Executive Secretaries & Admins.
Source: BLS Data, Occupational Employment Statistics (May 2010)
Table 11
Employment & wages of the largest private occupations
* This occupation has the same title, but not necessarily the same content, as the 2010
SOC occupation
Table 12
Employment & wages of the largest state and local occupations
23
Of note, three positions were common between the two sectors: registered nurses, janitors and
cleaners, and secretaries and administrative assistants. Of these three, only nurses had higher
wages in the private sector compared to their public sector counterparts. Nursing salaries were
$680 higher in the private sector, while salaries for janitors and cleaners were $4,370 higher in
the public sector and secretarial and administrative assistant salaries were $2,320 higher in the
public sector.
Retail salespersons, who accounted for the largest share of private sector employment (3.3
percent), had average salaries of $25,000. The second largest share of private sector
employment – cashiers – accounted for 2.6 percent of employment and had average annual
salaries of $19,810. Conversely, the largest occupational category in the public sector was
elementary school teachers, who accounted for 6.2 percent of employment and had average
annual salaries of $55,350. Teacher assistants, the second largest share of public sector
employees, accounted for 4.5 percent of the population and had average annual salaries of
$25,330 in 2010. It should be noted, however, that teachers and teacher assistants are
compensated differently than other occupations because the number of days worked per year is
less when the summer term is factored in.
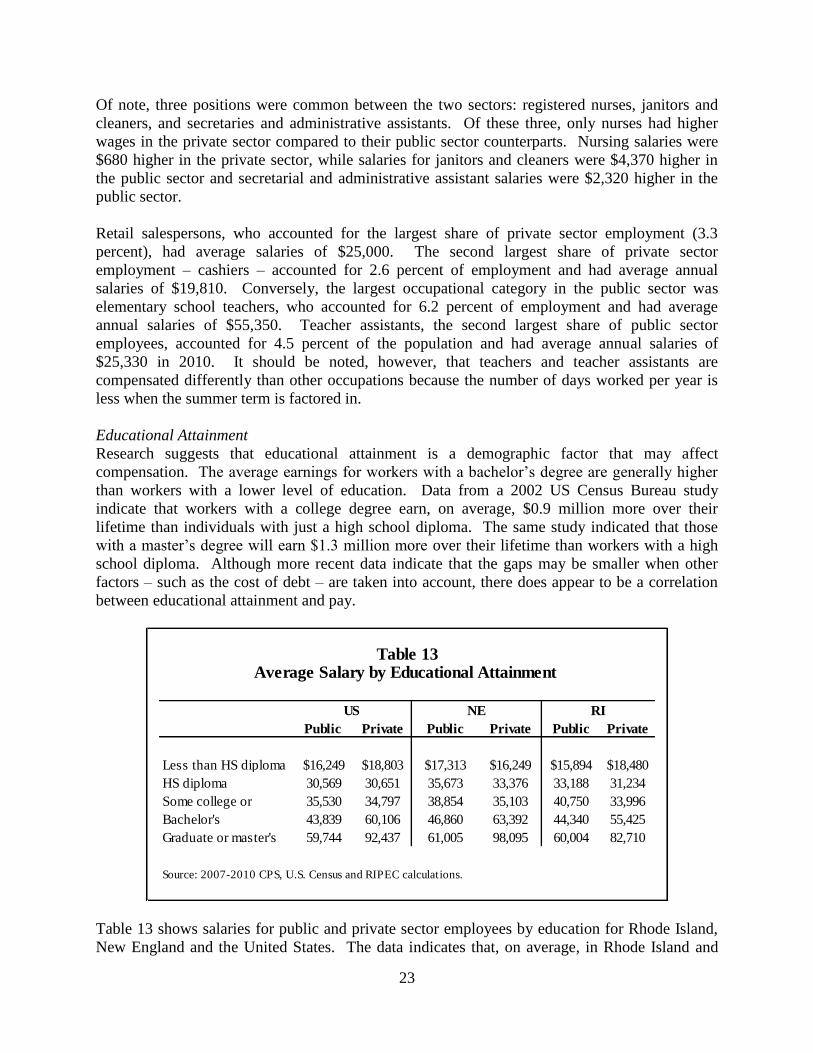
Educational Attainment
Research suggests that educational attainment is a demographic factor that may affect
compensation. The average earnings for workers with a bachelor‘s degree are generally higher
than workers with a lower level of education. Data from a 2002 US Census Bureau study
indicate that workers with a college degree earn, on average, $0.9 million more over their
lifetime than individuals with just a high school diploma. The same study indicated that those
with a master‘s degree will earn $1.3 million more over their lifetime than workers with a high
school diploma. Although more recent data indicate that the gaps may be smaller when other
factors – such as the cost of debt – are taken into account, there does appear to be a correlation
between educational attainment and pay.
Table 13 shows salaries for public and private sector employees by education for Rhode Island,
New England and the United States. The data indicates that, on average, in Rhode Island and
Public Private Public Private Public Private
Less than HS diploma $16,249 $18,803 $17,313 $16,249 $15,894 $18,480
HS diploma 30,569 30,651 35,673 33,376 33,188 31,234
Some college or 35,530 34,797 38,854 35,103 40,750 33,996
Bachelor's 43,839 60,106 46,860 63,392 44,340 55,425
Graduate or master's 59,744 92,437 61,005 98,095 60,004 82,710
Source: 2007-2010 CPS, U.S. Census and RIPEC calculations.
Table 13Average Salary by Educational Attainment
US NE RI

24
New England, individuals with less than a bachelor‘s degree earn more in the public sector at the
state and local level. However, at higher levels of education (bachelors or higher), private sector
pay is higher for Rhode Island, New England, and the US as a whole. For the US as a whole,
public sector workers with less than a high school diploma make less than private sector workers.
Pay between the sectors was relatively the same for workers with a high school diploma and
some college or an associate‘s degree. Additional findings for workers in Rhode Island include:
Public sector workers with some college (including an associate‘s degree) earn
approximately 16.6 percent more than their private sector counterpart in Rhode Island;
Wages for Rhode Island public sector workers with a bachelor‘s degree, on average, are
25.0 percent less compared to a private sector worker with a bachelor‘s degree; and
The gap between private and public sector workers in Rhode Island is greatest when
individuals with a master‘s or graduate-level degree are assessed on the basis of educational
attainment. When compared as a whole, private sector workers earn approximately 27.5
more than a comparable public sector worker who possesses a master‘s or graduate level
degree.
Age
The average age of workers within a given profession may affect compensation, because age
often translates into number of years of experience; theoretically, an older workforce generally
has more experience and is, therefore, better compensated. Data from the BLS on median weekly
earnings of full-time workers notes that wages varied by age. Men aged 45-54 and 55-64 had the
highest median weekly earnings ($974 and $1,001, respectively), while usual weekly earnings
were highest for women aged 35-64 (for ages 35-44: $742; ages 45-54: $742; and ages 55-64:
$753). Table 14 shows the average salaries as grouped by age ranges for the public and private
sectors.
The data indicate that workers in the public sector earn more than their private sector
counterparts in certain age groups, and vise-versa in others. In general, public sector earnings are
higher than private sector earnings for employees in the middle age ranges (25-44) while private
Public Private Public Private Public Private
Under 25 $14,687 $13,615 $13,365 $13,586 $10,348 $12,472
25-34 37,327 35,237 42,897 40,801 41,090 34,236
35-44 44,202 47,578 49,172 57,925 47,928 45,944
45-54 45,571 49,382 50,689 59,884 48,812 50,581
55-64 46,435 48,070 50,410 53,310 48,322 48,050
65+ 33,679 33,851 35,327 37,090 38,882 37,058
Source: 2007-2010 CPS, US Census and RIPEC calculations
Table 14
Average Salary by Age
US NE RI

25
sector earnings are higher at the early and later years of employment. On average, the Rhode
Island public sector earns more than the private for employees between the ages 25 and 44, and
for employees between the ages of 55 and 64. In New England, the private sector outpaces the
public sector, on average, for all age cohorts except for the 25-34 age range, while nationally, the
private sector has higher average salaries for all age ranges except for the under 25 and 35-44
age group. Additional findings for Rhode Island include:
In Rhode Island, a worker in the public sector between the ages of 35 and 44 earns, on
average, $47,928 while the same age group in the private sector in Rhode Island earns
$45,944, on average;
Private sector workers in Rhode Island under 25 years of age earn $2,124 more annually
than then public sector workers under the age of 25; and
As with education, Rhode Island private sector workers generally earn less than their age
cohorts in the public sectors, less than New England and US workers on average.

26
V. Benefits Analysis
In addition to wages, most employees receive additional compensation in the form of benefits
such as health insurance, retirement/savings plans and paid leave. Benefit costs have become an
increasingly large share of total compensation – and employer costs – as growth in the cost of
health insurance and pension obligations outpace wage growth. Traditionally, public employees
have had greater access to benefits, and are more likely to participate in defined benefit pension
plans, which tend to have higher employer costs than defined contribution plans. As such, the
cost of benefits is an important variable to consider when evaluating public and private sector
compensation. This section examines the availability of benefits in the public and private sectors
using data from the BLS CPS March Supplement, 2007-2010. In addition, this section provides
a wage adjustment using national data from the BLS Employer Costs for Employee
Compensation and the Employee Benefits Survey.
Employer-Provided Pension and Retirement Plans
There are a number of different retirement or pension plans that may be offered by an employer.
Employer-provided pensions (EPPs) are arrangements between employers and employees that
provide an income after the employee retires. Generally, there are two types of retirement plans:
defined benefit and defined contribution.
A defined benefit (DB) plan promises a specified dollar amount upon retirement.
Usually, this amount is calculated as a percent of average highest salary for a certain
number of years of service (i.e., the average of the highest-earning years). In a defined
benefit plan, employees generally make a set contribution as a share of their pay and the
employer bears the risk (or reward) of the investment.
Defined contribution (DC) plans, in contrast, do not promise a specific amount of
benefits at retirement. Instead, employers make a set contribution (e.g., five percent of
annual earnings), which is then invested on the employee‘s behalf. In a defined
contribution plan, the employee bears the market risk of their investment. Examples of
defined contribution plans include 401(k) plans, 403(b) plans, employee stock ownership
plans, and profit-sharing plans.
Although the existence of a retirement plan
does not mean all employees are eligible to
participate, DB plans tend to be more
common in the public sector. As the data on
table 15 indicates, DB plans are twice as
common in the public sector compared to the
private sector, while the inverse relationship
exists with respect to DC plans in the private
sector. Similarly, of the 87 public sector
retirement plans examined in the Wisconsin
Legislative Bureau‘s 2010 report ―2008
Comparative Study of Major Public Employee
Retirement Systems‖, only four were not DB
plans. As shown on table 15, an estimated 79
Public Private Public Private
2007 79% 32% 18% 53%
2008 79% 33% 18% 55%
2009 79% 32% 17% 55%
2010 79% 30% 17% 54%
* Companies with 100+ employees
SOURCE: BLS Employee Benefits Survey
Table 15
Retirement Plan Participation by Sector
Defined Benefit Defined Contribution

27
percent of public employees participated in a DB plan in 2010, compared to 30 percent in the
private sector. That same year, 17 percent of public employees and 54 percent of private
employees participated in a DC plan.
Table 16 shows the percentage of employees with access to, though not necessarily participation
in, retirement plans (DB or DC) in Rhode Island, Connecticut, Massachusetts, New England, and
the US. As shown on the table, and consistent with findings above, state and local workers are
more likely to have access to an employer-sponsored retirement plan than their private sector
counterparts. Nationally, 80.7 percent of public sector workers had access to a pension plan,
compared to 51.9 percent in the private sector. Ratios were similar in New England, and in
Connecticut, Massachusetts and Rhode Island; however, New England private sector employees
were more likely to have access to retirement plans than the US as a whole – 56.8 percent
compared to 51.9 percent. Current Population Survey data provides information on access to
employer-provided pension plans but does not distinguish between participation in a DB or DC
plan. At the same time,
as noted above, DB
plans tend to be more
scarce in the private
sector where
employees are more
likely to participate in a
DC plan, while public
sector workers, in
general, participate in
DB plans.
Employer-Sponsored Health Insurance
Employer-sponsored insurance (ESI)
is one of the largest – and fastest-
growing – benefit costs; between FY
2002 and FY 2012, state spending on
medical insurance increased by 53.5
percent (unadjusted), more than double
the rate at which net salaries increased.
Table 17 shows public and private
sector ESI participation and the
average employee contribution for a
single and a family plan between 2007
and 2010. In both sectors,
participation rates have increased;
however, public sector employees
were between 22 and 27 percent more
likely to participate in ESI compared
to private sector workers.
US NE CT MA RI
Private 51.9% 56.8% 57.4% 56.3% 53.0%
State and Local 80.7% 80.4% 81.3% 78.8% 81.7%
Source: 2007-2010 CPS, U.S. Census and RIPEC calculations
Table 16
Access to Employer-Sponsored Retirement Plan
Public Private Public Private Public Private
2007 72% 49% $73.25 $81.30 $320.15 $312.70
2008 73% 53% 73.34 87.69 328.01 330.99
2009 73% 52% 77.67 92.43 342.50 349.30
2010 78% 51% 85.18 99.07 354.66 383.12
SOURCE: BLS Employee Benefits Survey, National Compensation Survey
Average Monthly Employee Premiums
ESI Participation and
Table 17
* Average flat monthly employee contribution
FamilySingle
Ave. Employee Contribution*Participation

28
Private sector employee contribution amounts were higher than public sector employee
contribution amounts for both the single and family plan (with the exception of the 2007 family
plan). Between 2007 and 2010, premiums increased across the board, although the rate of
growth was slower for the public plans. Employee contribution amounts to health insurance for
single plans increased by 16.3 percent for public sector workers and 21.9 percent for private
sector workers. The difference in the rate of growth was more significant for family plans:
private sector family employee contribution amounts increased more than twice as fast as public
sector family employee contribution amounts (22.5 percent v 10.8 percent).
Table 18 outlines the access to employer-sponsored health insurance for Connecticut,
Massachusetts, Rhode Island, New England and the US. In general, workers in both the public
and private sector have access to ESI.4 As shown on the table, approximately 95 percent of
private sector workers have some level of access to ESI, while approximately 98 percent of state
and local workers have access to ESI. At the same time, state and local employees are more
likely to have access to some form of employer-sponsored health insurance than workers in the
private sector across the board. The percent of private sector workers with no ESI was
approximately twice as large as the percent of public sector workers with no access to ESI,
although the gap was smaller at the national level than in New England or any of the three
surveyed states. State and local workers were, in general more likely to have access to a plan
where all of their
insurance was
covered by their
employer, although
the difference was
small in both Rhode
Island (16.0 percent
in the private sector
verses 16.7 percent in
the public sector) and
in New England (13.8
percent for the
private sector and
13.7 percent for the
public sector).
Benefit Markup Adjustments to Compensation
Quantifying the value of benefits across sectors is an important component of determining how
compensation varies across the public and private sectors. As noted above, there is variation
with regard to access, cost and type of benefit offered between the two sectors, which would be
expected to have an effect on total compensation costs and should be taken into account when
evaluating public and private sector compensation. However, there is little state-level data on
4 NOTE: the sample set excludes individuals who worked less than full time, which may explain the higher
incidence rate of access to ESI.
All Some None All Some None
Connecticut 14.0% 81.9% 4.1% 10.1% 87.5% 2.4%
Massachusetts 15.1% 80.3% 4.6% 23.6% 74.4% 2.0%
Rhode Island 16.0% 80.6% 3.5% 16.7% 82.0% 1.3%
New England 13.8% 82.3% 3.9% 13.7% 84.4% 1.9%
United States 17.5% 77.6% 4.9% 23.1% 73.8% 3.2%
Source: 2007-2010 CPS March Supplement, U.S. Census and RIPEC calculations
Table 18
Access to Health Insurance Paid by Employer
Private State and Local

29
benefits due, in part, to the complexity of data collection. The BLS Employer Cost of Employee
Compensation (ECEC) calculates the relative importance of employer costs for employee
compensation, assigning a share of benefit costs to overall compensation at the national level.
This data can be used to adjust wages to calculate an ―all in‖ cost of an employee.
As shown on table
19, benefits play a
larger role in
overall
compensation at the
state and local level
than in the private
sector. At the same
time, it appears that
firm size has an
effect on the
percent of total
compensation
accounted for by
benefit costs. Firm
size can affect the
share of
compensation costs
– smaller
businesses tend to
absorb a larger
share of wages as a
share of total
compensation.
Table 19 illustrates
that in the private
sector, as firm size
increases, so does
the share of
benefits as a
percent of total
compensation. For
firms with less than
99 employees,
benefits accounted
for just 26.0 percent
of total compensation, compared to 30.1 percent in firms with 100-499 employees and 33.8
percent for firms with over 500 employees. Benefits accounted for 34.5 percent of total
employee compensation at the state and local level in the 2011 survey. In general, benefits as a
share of compensation were the most similar between firms of 500 or more employees and
state/local governments.
State &
<99 100-499 500+ Local
Wages 74.0% 69.9% 66.2% 65.5%
Total Benefits 26.0% 30.1% 33.8% 34.5%
Paid Leave 5.6% 6.9% 8.6% 7.5%
Vacation 2.8% 3.6% 4.5% 2.8%
Holiday 1.9% 2.2% 2.5% 2.2%
Sick 0.7% 0.9% 1.1% 1.9%
Personal 0.3% 0.3% 0.4% 0.5%
Supplemental Pay 2.2% 2.6% 3.7% 0.8%
Overtime 0.8% 1.0% 0.9% 0.4%
Shift Differential 0.1% 0.2% 0.5% 0.1%
Nonproduction Bonuses 1.4% 1.3% 2.2% 0.3%
Insurance 6.6% 8.9% 9.4% 12.0%
Life 0.1% 0.2% 0.2% 0.2%
Health 6.3% 8.4% 8.7% 11.7%
Short-term Disability 0.1% 0.2% 0.2% 0.1%
Long-term Disability 0.1% 0.1% 0.2% 0.1%
Retirement & Savings 2.5% 3.6% 5.1% 8.2%
Defined Benefit 0.9% 1.4% 2.5% 7.4%
Defined Contribution 1.6% 2.1% 2.6% 0.8%
Legally-Required Benefits 9.0% 8.2% 7.1% 6.0%
Social Security 4.9% 4.6% 4.5% 3.6%
Medicare 1.2% 1.1% 1.1% 1.0%
Federal Unemployment Ins 0.2% 0.1% 0.1% 0.0%
State Unemployment Ins 0.9% 0.7% 0.4% 0.2%
Workers‘ Compensation 1.8% 1.5% 1.0% 1.1%
Table 19
Benefits as a % of Total Compensation Costs for
Private & State/Local Workforce
Private by Firm Size
SOURCE: BLS "Employer Costs for Employee Compensation", March 2011
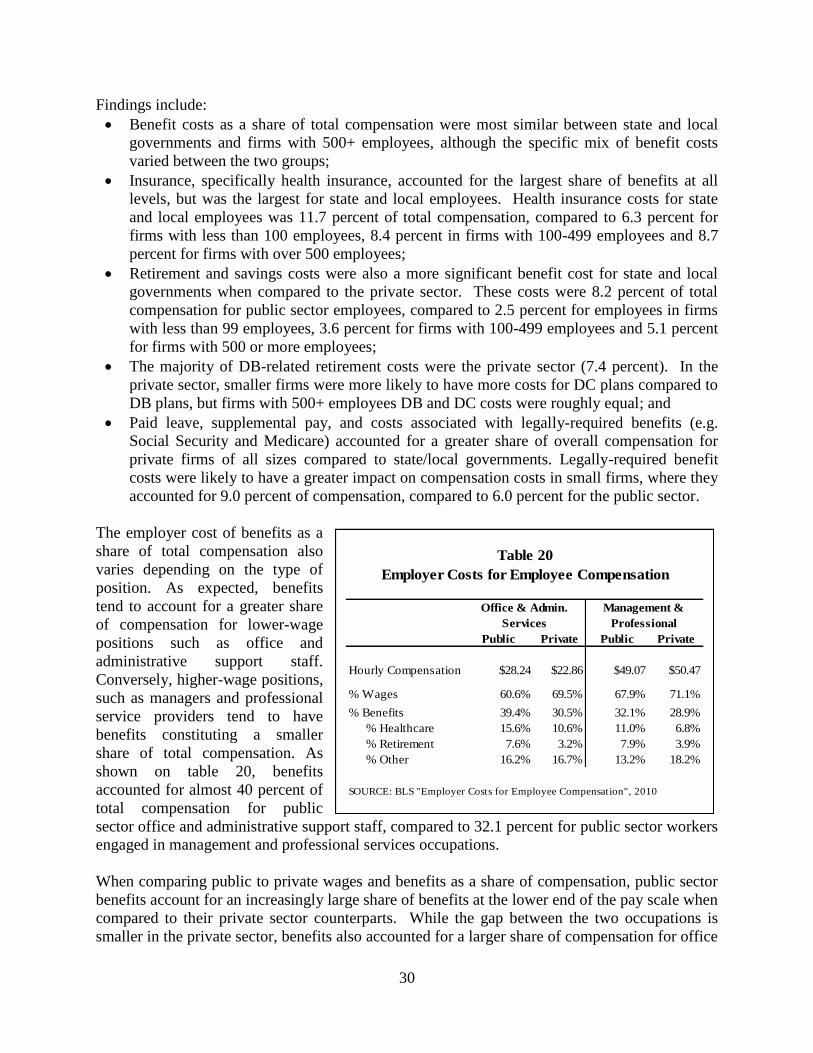
30
Findings include:
Benefit costs as a share of total compensation were most similar between state and local
governments and firms with 500+ employees, although the specific mix of benefit costs
varied between the two groups;
Insurance, specifically health insurance, accounted for the largest share of benefits at all
levels, but was the largest for state and local employees. Health insurance costs for state
and local employees was 11.7 percent of total compensation, compared to 6.3 percent for
firms with less than 100 employees, 8.4 percent in firms with 100-499 employees and 8.7
percent for firms with over 500 employees;
Retirement and savings costs were also a more significant benefit cost for state and local
governments when compared to the private sector. These costs were 8.2 percent of total
compensation for public sector employees, compared to 2.5 percent for employees in firms
with less than 99 employees, 3.6 percent for firms with 100-499 employees and 5.1 percent
for firms with 500 or more employees;
The majority of DB-related retirement costs were the private sector (7.4 percent). In the
private sector, smaller firms were more likely to have more costs for DC plans compared to
DB plans, but firms with 500+ employees DB and DC costs were roughly equal; and
Paid leave, supplemental pay, and costs associated with legally-required benefits (e.g.
Social Security and Medicare) accounted for a greater share of overall compensation for
private firms of all sizes compared to state/local governments. Legally-required benefit
costs were likely to have a greater impact on compensation costs in small firms, where they
accounted for 9.0 percent of compensation, compared to 6.0 percent for the public sector.
The employer cost of benefits as a
share of total compensation also
varies depending on the type of
position. As expected, benefits
tend to account for a greater share
of compensation for lower-wage
positions such as office and
administrative support staff.
Conversely, higher-wage positions,
such as managers and professional
service providers tend to have
benefits constituting a smaller
share of total compensation. As
shown on table 20, benefits
accounted for almost 40 percent of
total compensation for public
sector office and administrative support staff, compared to 32.1 percent for public sector workers
engaged in management and professional services occupations.
When comparing public to private wages and benefits as a share of compensation, public sector
benefits account for an increasingly large share of benefits at the lower end of the pay scale when
compared to their private sector counterparts. While the gap between the two occupations is
smaller in the private sector, benefits also accounted for a larger share of compensation for office
Public Private Public Private
Hourly Compensation $28.24 $22.86 $49.07 $50.47
% Wages 60.6% 69.5% 67.9% 71.1%
% Benefits 39.4% 30.5% 32.1% 28.9%
% Healthcare 15.6% 10.6% 11.0% 6.8%
% Retirement 7.6% 3.2% 7.9% 3.9%
% Other 16.2% 16.7% 13.2% 18.2%
SOURCE: BLS "Employer Costs for Employee Compensation", 2010
Table 20
Employer Costs for Employee Compensation
Office & Admin.
Services
Management &
Professional

31
and administrative support workers. In both cases, benefits accounted for a greater share of
compensation for public sector employees, but the gap between the two sectors was larger at the
lower end of the wage spectrum. Based on the data in the table above, it appears that healthcare
is the primary driver of the difference in benefits as a share of compensation. Health insurance
costs as a share of total compensation were roughly four percent higher for both public and
private office and administrative workers, compared to management and professional service
workers.
Table 21 adjusts total average wages from section IV (Wage Analysis) for the US, New England
and Rhode Island, using table 19 as a guide. Total compensation was derived by adjusting
average wages by the wage ratio, while benefits were calculated using the benefit ratios. Wages
and benefits were then summed to arrive at the total estimated average compensation. Based on
these adjustments, average total public sector compensation in Rhode Island is estimated to be
$67,117, compared to average total compensation of $52,082 for small private firms and $58,218
for large firms. Consistent with other sections of this report, table 21 excludes data pertaining to
federal employees and represents average salaries for full-time private, and full-time state and
local employees only.
Small* Large** Public Small* Large** Public Small* Large** Public
Paid Leave $2,962 $5,056 $4,625 $3,314 $5,656 $4,823 $2,927 $4,995 $5,034
Supplemental Pay 1,170 2,168 493 1,309 2,426 514 1,156 2,142 537
Insurance 3,490 5,527 7,399 3,904 6,184 7,717 3,448 5,461 8,054
Retirement & Savings 1,328 2,993 5,056 1,486 3,349 5,273 1,312 2,957 5,504
Legally Required 4,755 4,172 3,700 5,320 4,667 3,858 4,698 4,122 4,027
Total Benefits $13,705 $19,916 $21,273 $15,334 $22,283 $22,186 $13,541 $19,678 $23,155
Wages $39,007 $39,007 $40,388 $43,642 $43,642 $42,121 $38,540 $38,540 $43,962
Total $52,712 $58,923 $61,661 $58,976 $65,925 $64,307 $52,082 $58,218 $67,117
* Less than 99 employees
** More than 500 employees
SOURCE: BLS "Employer Costs for Employee Compensation", March 2011; CPS March Supplement, 2007-2010; RIPEC calculations
Table 21
Benefit Costs and Adjusted Total Compensation, US, New England and Rhode Island
US New England Rhode Island

32
VI. Occupational Analysis
Data was collected and analyzed for eight individual occupations regarding worker
compensation and demographics. The profiles in this section provide an overview of the
workforce population by occupation. This section includes information on the average annual
salary/wages for each occupation. In addition, wages were adjusted using data from the BLS
Employer Costs of Employee Compensation (ECEC) to find total compensation, that is, salary
plus benefits. This section also includes information on the prevalence of employer-sponsored
insurance (ESI) and employer-provided pension plans (EPP). Due to the data collection
methodology employed by the CPS March Supplement, this data does not indicate participation
in either plan, just whether a plan is offered. Similarly, CPS data does not indicate whether a DB
or DC plan is offered. Lastly, this section includes two demographic variables for each
occupation: average age and the percent of population with at least a bachelor‘s degree.
Demographic and wage data are derived from the CPS March Supplement for years 2007-2010.
These occupations were selected with the assistance of the Office of the General Treasurer, and,
from a list of ten occupations, two were eliminated due to insufficient data. The RI Department
of Administration (DOA) also provided input on the occupation selection regarding the types of
occupations that are most prevalent at the state level. Occupations met the criteria for data
analysis if 1) the sample size was sufficient (as determined by the 4 year CPS data set used in
this analysis) and 2) the DOA reported a high volume of workers within the public sector with
specific job titles analyzed.
The highlights of our analysis of the eight individual occupations that exist both in the private
and public sectors include:
Workers in low-wage occupations, such as janitorial and maintenance workers, public
sector employees receive greater total compensation than private sector workers in the
same occupation in Rhode Island, New England, and the United States;
For high-wage occupations, such as lawyers and engineers, private sector employees
receive greater total compensation than public sector workers in the same occupation in
Rhode Island, New England, and the United States;
On average, public sector workers receive a larger percentage of benefits as a share of
total compensation than private sector workers. This is more prominent in low-wage
occupations such as office and administrative staff; and
For low-wage occupations, benefits tend to constitute a greater percentage of an
employees‘ total compensation than high-wage occupations.
Methodology
Our analysis focuses on the following occupational categories: lawyers, engineers, teachers,
internet technology and network specialists, community and social services workers, registered
nurses, office and administrative staff, and janitorial and maintenance workers. For in-depth
descriptions of the selected occupations as defined by the US Census Standard Occupational
Classification (SOC) system, see the appendix. In some instances, specific professions were
combined to increase sample size and improve the reliability of our calculations. For example,
the occupation of ―engineer,‖ includes civil, environmental, and mechanical engineers to
increase the sample size. Such combinations were designed to create an occupational category

33
broad enough to increase the overall sample size. Individuals who reported as self-employed,
unemployed, or classified as unable to work were excluded from the sample. LLCs, LLPs, and
LPs were also excluded with the exception of the ―lawyers‖ occupational group.5
Average salary, access to employer-sponsored insurance and access to employer-provided
pensions were extracted for each occupation and sector using the data from the Current
Population Survey for the four-year period between 2007 and 2010. Wage data was not
calculated by RIPEC for either sector or for any occupation. In order to provide a more complete
picture of total employee compensation—that is, salaries and benefits—average compensation
was calculated using data from the Employer Costs for Employee Compensation (ECEC) in a
manner similar to other compensation studies. For a detailed account of other compensation
studies that draw upon ECEC and BLS data, please refer to the literature review. The ECEC, a
product of the National Compensation Survey from the Bureau of Labor Statistics, measures
employer costs for wages, salaries, and employee benefits. Benefit costs as a share of total
compensation were adjusted for New England and Rhode Island to account for the slight
differences in average levels of compensation between the region and the country as a whole.6
The following provides a step-by-step description of how total compensation was calculated for
public and private sector occupations, using nurses as an example, nationally, regionally, and in
Rhode Island:
Step 1: Wage data for the occupations was extracted from the merged 2007-2010 CPS data. As
noted previously, no adjustments were made by RIPEC for wage data for either sector. Based on
the extracted CPS data, nurses in the US earned $50,993 in the public sector and $52,736 in the
private sector.
Step 2: The ECEC provides data on wages as a share of total compensation by sector and by
occupation or industry. In order to calculate total compensation, the wage ratio, that is, wages as
a share of total compensation as provided by the ECEC, was applied to the wage data extracted
from the CPS. For example, since wages for private sector nurses nationally accounted for 69.6
percent of total compensation, total compensation was determined by dividing salary by this
wage ratio. For US private sector nurses, total compensation was calculated as:
CPS wage data (US private nurses)/ECEC wage ratio (US private nurses)
= $52,736/69.9% = $75,770
Step 3: Because the share of salary/wages as a percent of total compensation varies by region,
total compensation for New England and Rhode Island were adjusted by a regional factor.
Wages as a share of total compensation for Rhode Island and New England were calculated by
determining the wages as a share of total compensation ratio for New England to the US. Wages
5 The lawyers occupational analyses include LLCs, LLPs, and LPs in order to account for the preponderance of
lawyers that are self-employed or fall into one of these categories. The BLS estimated that approximately 26.0
percent of lawyers are self-employed, either as partners in law firms or in solo practices. 6 Nationally, benefits accounted for 29.6 percent of private sector compensation, compared to 29.5 percent of private
sector compensation in New England.
34
accounted for 70.5 percent of total compensation for the New England private sector, compared
to 70.4 percent for the US private sector. Therefore, wages in New England accounted for a
slightly higher share of compensation compared to the US as a whole:
ECEC NE wages as a % of compensation/ ECEC US wages as % of compensation/ =
70.5%/70.4 = 100.1%
Step 4: By applying the aforementioned ratios, determinations for specific occupations by region
can be made. Total compensation for New England private sector nurses was calculated by
multiplying the ECEC wage ratio for private sector nurses by the New England to US wages as a
share of compensation ratio:
ECEC wage ratio * NE:US wage ratio
= 69.6%*100.1% = 69.7%
Thus, total compensation for private sector nurses in New England was estimated to be:
CPS wage data for NE private sector nurses/NE wage ratio
= $59,719/69.7% = $85,717
Total compensation for Rhode Island private sector nurses was calculated in the same manner:
CPS wage data for RI private sector nurses/NE wage ratio
= $53,381/69.7% = $76,621
Step 5: The ECEC does not provide occupation- or industry-specific data for all of the selected
occupations for both sectors (that is, public and private). In the event that only private sector
data was provided by the ECEC, public sector data was calculated using the ratio of all public
sector wages as a share of total compensation to all private sector wages as a share of total
compensation. If only public sector data was given (i.e., in the case of teachers), the ratio was
calculated in the inverse:
ECEC public sector wages as a share of compensation for all workers = 65.5%
ECEC private sector wages as a share of compensation for all workers = 70.4%
Public:Private wage ratio = 70.4%/65.5% = 107.5%
Private:Public wage ratio = 65.5%/70.4% = 93.0%
Step 6: The ratio calculated in step 5 was then applied to the extracted wage data to calculate the
total compensation for the appropriate sector. In the case of nurses, no public sector data for the
occupation was provided by the ECEC. Therefore, the wage ratio (wages as a share of total
compensation) for US public sector nurses was calculated by applying the public to private wage
ratio as shown above to the US private sector nurses wage ratio:
ECEC wage ratio (US private nurses)*Private:Public wage ratio
= 69.6%*93.0% = 64.5%

35
This wage ratio was then applied to the CPS wage data for US public sector nurses to calculate
total compensation for US public sector nurses:
CPS wage data (US public nurses)/Public sector wage ratio
= $50,993/64.5% = $79,082
Step 7: As noted in step 3, regional differences in compensation patterns were accounted for by
calculating the ratio of wages as a share of total compensation for private sector workers in the
US and New England. If public or private sector wages as a share of compensation were not
provided by the ECEC, and were calculated by RIPEC, the regional adjuster was applied to the
calculated wage ratio, as in the case of nurses:
US public share of wages = 69.9% * 93.0% = 64.5%
NE/RI public share of wages = 64.5% * 100.1% = 64.6%
NE public sector nurse total compensation
= $47,118/64.5% = $73,051
RI public sector nurse total compensation
= $60,667/64.5% = $94,057

36
CPS wage data on US Nurses - $50,993 in public $52,736 in the private
Private sector nurses in RI = $53,381
ECEC wages = 69.9% of total compensation (private sector nurses)
Wage data on public sector nurses not available
ECEC wages = 65.5% (public sector)
New England wages = 70.5% of total compensation
NE:US Ratio = 70.5%:70.4% = 100.1%
$52,736
Total Compensation for US = 69.9% = $75,770
Share of wages as a % of comp. for NE = 69.6% * 100.1% = 69.7%
$59,719
Total Comp. for NE private = 69.7% = $85,717
Total Comp. for RI private= $53,381
69.7% = $76,621
Public: Private = 70.4% = 108%
65.5%
Private:Public = 65.5% = 93%
70.4%
Wages as a share of comp. (public) = 69.6% * 93.0% = 64.5%
Total Comp. for US Public = $50, 993 = $79,082
64.5%
Wages as a share of comp. ( NE public) = 64.5% * 100.1% = 64.5%
Total Comp. for NE public = 47,118$ = $73,051
64.5%
Total Comp. for RI Public Nurses: $60,667 = $94,057
64.5%
Total Compensation = Sum of Wages and Benefits
Source: CPS March Supplement 2007-2010, BLS, ECEC, and RIPEC Calculations
Total Compensation Calculation Example: Nurses

37
Occupational Comparisons
Janitorial and Maintenance Workers
This occupational code includes housecleaners and maids, janitors and building cleaners, and
grounds maintenance workers. General duties of this profession include maintaining cleanliness
in buildings or outdoor areas. Such workers may perform heavy cleaning duties, such as cleaning
floors, but may also include landscaping and grounds-keeping duties. Compensation was
calculated using the private sector occupational group data for ―natural resources, construction
and maintenance‖. Public sector compensation was derived from the wage ratio for private
sector workers in the occupational group, adjusting for the average difference between all public
and all private sector wage ratios.
The data on janitorial and maintenance workers indicates that:
Within all regions, public sector wages and total compensation were higher than public
sector wages. However, the pay gap between public and private sector wages was smaller
in Rhode Island than in the region or nationally;
On average, janitorial and maintenance workers in Rhode Island had higher wages and total
compensation in both the public and private sectors when compared to their peers in New
England or the rest of the country;
Consistent with other professions, the public sector was more likely to have access to ESI
compared to the private sector; however, both sectors were likely to have some form of
employer-sponsored insurance;
Public sector workers in Rhode Island were almost three times more likely to have access to
an EPP than private sector janitorial and maintenance workers. Nationally and regionally,
public sector workers were roughly 2.5 times more likely to have access to an EPP;
In all three groups, public sector workers were, on average, older than workers in the
private sector. The average age difference in Rhode Island was larger than the average age
difference in New England and the US.
Public Private Public Private Public Private
Average salary $26,029 $19,248 $25,350 $16,843 $23,397 $16,705
Total salary plus benefits** $43,538 $28,224 $42,402 $24,698 $39,191 $24,529
% with ESI* 100.0% 91.8% 100.0% 92.2% 95.6% 94.1%
% with EPP* 77.3% 26.8% 70.6% 30.6% 71.1% 27.9%
Average age 48 40 46 40 45 41
% with bachelor's degree+ 8.7% 5.4% 4.6% 6.3% 4.8% 4.3%
*Employer-Sponsored Insurance; ** Employer-Provided Pension; ***Adjusted using "nat. resources, construct. & maint." data
Source: 2007-2010 CPS, U.S. Census and RIPEC calculations
Table 22
Janitorial and Maintenance Workers
RI NE US

38
Office and Administrative Support Occupations
This occupational code provides a broad array of administrative positions and office workers that
provide professional office support or perform secretarial duties. The job titles in this category
include, but are not limited to, bookkeeping, data entry, secretarial positions, and administrative
workers. As the ECEC includes data for both public and private sector office and administrative
support employees, wages and benefits both sectors were adjusted accordingly.
CPS data on office and administrative support workers indicates that:
Public sector salaries were slightly higher than private sector salaries in Rhode Island and
the US, but were lower in New England at large although the difference was slight for all
three groups;
When benefits were included, however, public sector compensation was higher for the
public sector across the board. ECEC data indicates that benefit costs as a share of total
compensation – specifically health insurance and retirement benefit costs – were notably
higher in the public sector;
In general, employees in both the public and private sectors had access to ESI in Rhode
Island, New England and the US, although workers in the public sector were slightly more
likely to have access than private sector employees;
Office and administrative support workers in the public sector were roughly 25 percent
more likely to have access to an EPP than private sector workers in Rhode Island or the US.
The gap is slightly smaller for New England in general; however, public sector workers in
New England were less likely to have access to an EPP than other public sector workers
while their private sector counterparts were more likely to have access to an EPP; and
Similar to IT employees, and in contrast to most other occupations included in this study,
private sector workers were, on average, more likely to have a bachelor‘s degree or higher
compared to their public sector peers in Rhode Island and New England.
Table 23
Public Private Public Private Public Private
Average salary $28,267 $27,221 $27,805 $29,120 $28,752 $26,655
Total salary plus benefits** $46,579 $39,112 $45,817 $41,839 $47,445 $38,353
% with ESI* 96.3% 93.6% 96.2% 95.4% 96.9% 95.1%
% with EPP* 78.6% 54.3% 74.8% 58.2% 80.1% 53.4%
Average age 47 44 46 44 45 42
% with bachelor's degree+ 14.0% 21.4% 16.6% 21.1% 17.9% 17.4%
*Employer-Sponsored Insurance; ** Employer-Provided Pension; *** Adjusted using "office and admin" industry data
Source: 2007-2010 CPS, U.S. Census and RIPEC calculations
Office and Administrative Staff
RI NE US
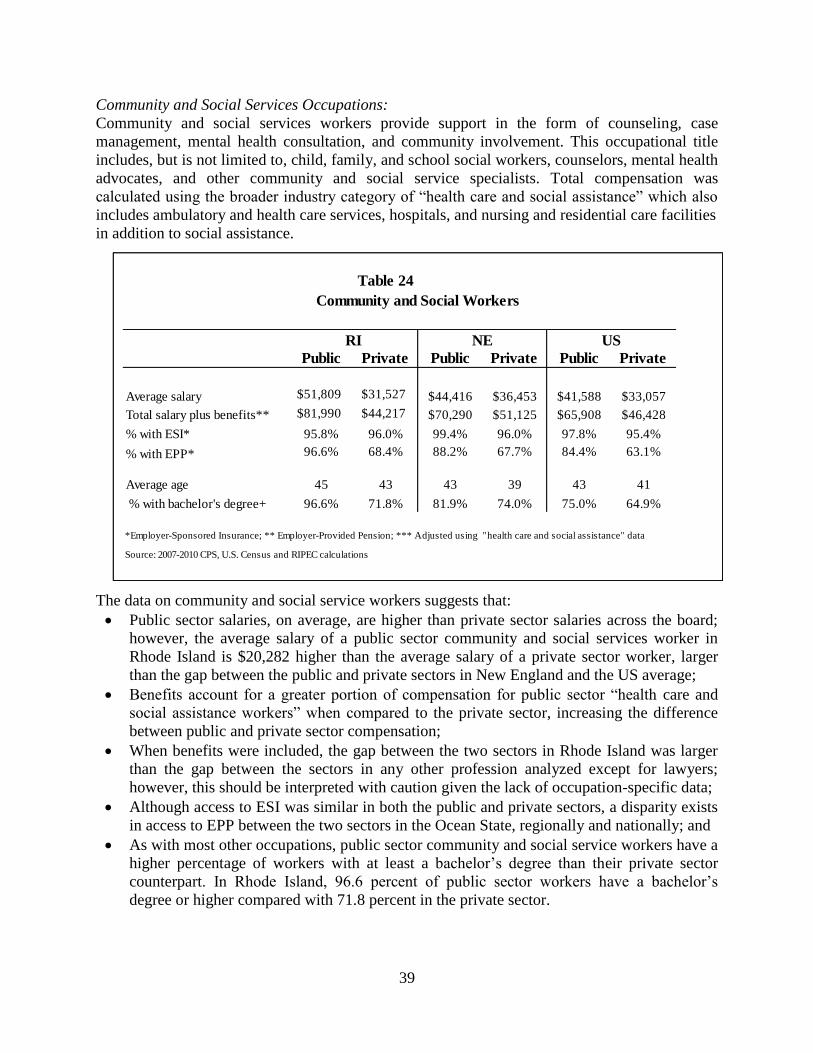
39
Community and Social Services Occupations:
Community and social services workers provide support in the form of counseling, case
management, mental health consultation, and community involvement. This occupational title
includes, but is not limited to, child, family, and school social workers, counselors, mental health
advocates, and other community and social service specialists. Total compensation was
calculated using the broader industry category of ―health care and social assistance‖ which also
includes ambulatory and health care services, hospitals, and nursing and residential care facilities
in addition to social assistance.
The data on community and social service workers suggests that:
Public sector salaries, on average, are higher than private sector salaries across the board;
however, the average salary of a public sector community and social services worker in
Rhode Island is $20,282 higher than the average salary of a private sector worker, larger
than the gap between the public and private sectors in New England and the US average;
Benefits account for a greater portion of compensation for public sector ―health care and
social assistance workers‖ when compared to the private sector, increasing the difference
between public and private sector compensation;
When benefits were included, the gap between the two sectors in Rhode Island was larger
than the gap between the sectors in any other profession analyzed except for lawyers;
however, this should be interpreted with caution given the lack of occupation-specific data;
Although access to ESI was similar in both the public and private sectors, a disparity exists
in access to EPP between the two sectors in the Ocean State, regionally and nationally; and
As with most other occupations, public sector community and social service workers have a
higher percentage of workers with at least a bachelor‘s degree than their private sector
counterpart. In Rhode Island, 96.6 percent of public sector workers have a bachelor‘s
degree or higher compared with 71.8 percent in the private sector.
Table 24
Public Private Public Private Public Private
Average salary $51,809 $31,527 $44,416 $36,453 $41,588 $33,057
Total salary plus benefits** $81,990 $44,217 $70,290 $51,125 $65,908 $46,428
% with ESI* 95.8% 96.0% 99.4% 96.0% 97.8% 95.4%
% with EPP* 96.6% 68.4% 88.2% 67.7% 84.4% 63.1%
Average age 45 43 43 39 43 41
% with bachelor's degree+ 96.6% 71.8% 81.9% 74.0% 75.0% 64.9%
*Employer-Sponsored Insurance; ** Employer-Provided Pension; *** Adjusted using "health care and social assistance" data
Source: 2007-2010 CPS, U.S. Census and RIPEC calculations
Community and Social Workers
RI NE US

40
Nurses
Nurses perform a variety of duties associated with patient health care and the occupation
classification encompasses a range of duties and specialties. It should be noted that, although the
occupations included in this category are fairly broad and include, for example, geriatric nurses,
ambulatory care nurses, hospice and palliative care nurses, and psychiatric/mental health nurses.
Similar to teachers, compensation data was available for the private sector, but not for the public
sector. As such, total compensation was derived by the wage ratio for private sector nurses,
adjusting for the average difference between all public and all private sector wage ratios.
The data shown in table 25 indicates that:
On average, Rhode Island public sector nurses tend to be better compensated than their
private sector counterparts, in contrast to national and regional trends;
This pattern persists even when benefit costs are included in compensation costs; however,
when benefits are included, average public sector compensation nationwide is greater than
average private sector compensation;
Of note, ECEC data indicates that a large share of compensation for nurses in the private
sector is from benefits, which appears to be driven, in part, by supplemental pay;
While the majority of nurses had access to ESI in all three regions, 100 percent of public
and privates sector nurses in the sample had access to ESI, or a higher percentage when
compared to averages in New England and the US;
The percentage of Rhode Island public sector nurses with access to EPP is higher than the
percentage of public sector nurses with access to EPP in New England and nationally by
12.9 percent and 14.1 percent, respectively;
Of those sampled, Rhode Island had a notably higher percentage of public sector nurses
with at least a bachelor‘s degree compared to New England and the US as a whole; and
Although the average age of Rhode Island‘s public sector nursing employees is 49, which
was older than national and regional averages, the gap between the public and private sector
was similar to the national and regional gaps.
Public Private Public Private Public Private
Average salary $60,667 $53,381 $47,118 $59,719 $50,993 $52,736
Total Salary plus benefits $94,057 $76,621 $73,051 $85,717 $79,082 $75,770
% with ESI* 100.0% 100.0% 98.0% 97.8% 97.6% 95.4%
% with EPP** 100.0% 81.8% 87.1% 84.1% 85.9% 77.3%
Average age 49 46 47 45 47 44
% with bachelor's degree+ 100.0% 61.2% 51.1% 69.2% 64.0% 57.5%
*Employer-Sponsored Insurance; ** Employer-Provided Pension; ***Public sector adjusted using private sector data
Source: 2007-2010 CPS, U.S. Census and RIPEC calculations
Table 25
Nurses
RI NE US
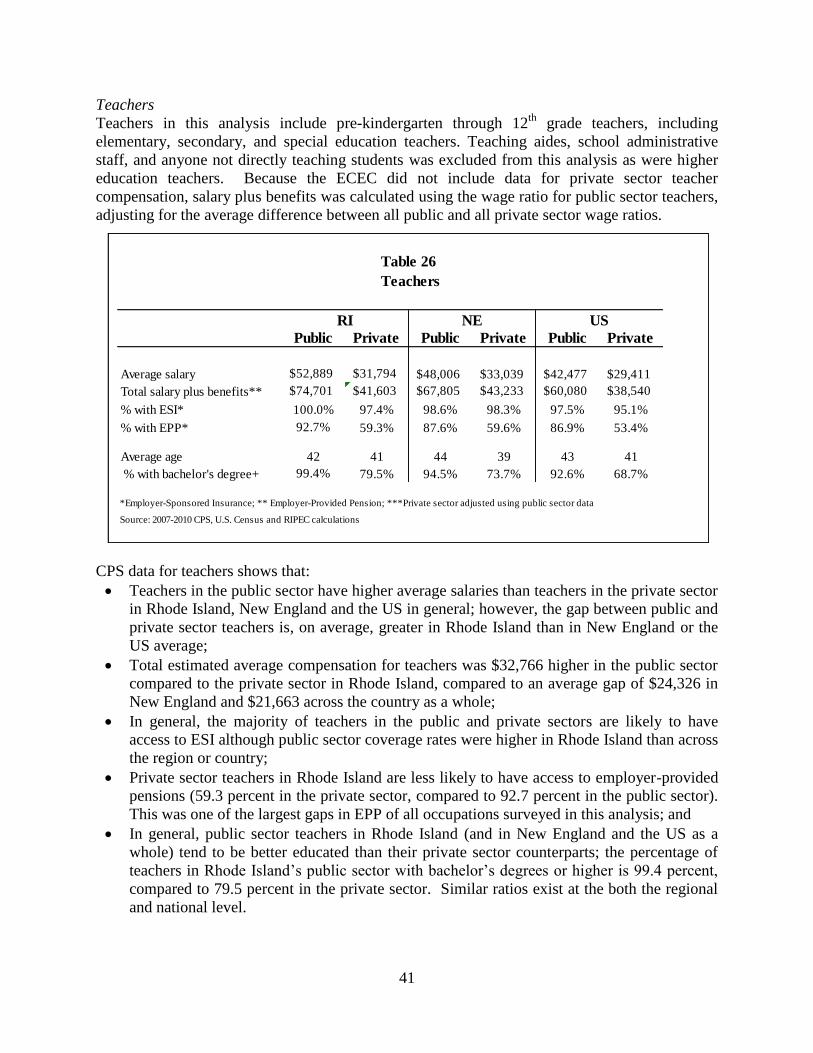
41
Teachers
Teachers in this analysis include pre-kindergarten through 12th
grade teachers, including
elementary, secondary, and special education teachers. Teaching aides, school administrative
staff, and anyone not directly teaching students was excluded from this analysis as were higher
education teachers. Because the ECEC did not include data for private sector teacher
compensation, salary plus benefits was calculated using the wage ratio for public sector teachers,
adjusting for the average difference between all public and all private sector wage ratios.
CPS data for teachers shows that:
Teachers in the public sector have higher average salaries than teachers in the private sector
in Rhode Island, New England and the US in general; however, the gap between public and
private sector teachers is, on average, greater in Rhode Island than in New England or the
US average;
Total estimated average compensation for teachers was $32,766 higher in the public sector
compared to the private sector in Rhode Island, compared to an average gap of $24,326 in
New England and $21,663 across the country as a whole;
In general, the majority of teachers in the public and private sectors are likely to have
access to ESI although public sector coverage rates were higher in Rhode Island than across
the region or country;
Private sector teachers in Rhode Island are less likely to have access to employer-provided
pensions (59.3 percent in the private sector, compared to 92.7 percent in the public sector).
This was one of the largest gaps in EPP of all occupations surveyed in this analysis; and
In general, public sector teachers in Rhode Island (and in New England and the US as a
whole) tend to be better educated than their private sector counterparts; the percentage of
teachers in Rhode Island‘s public sector with bachelor‘s degrees or higher is 99.4 percent,
compared to 79.5 percent in the private sector. Similar ratios exist at the both the regional
and national level.
Public Private Public Private Public Private
Average salary $52,889 $31,794 $48,006 $33,039 $42,477 $29,411
Total salary plus benefits** $74,701 $41,603 $67,805 $43,233 $60,080 $38,540
% with ESI* 100.0% 97.4% 98.6% 98.3% 97.5% 95.1%
% with EPP* 92.7% 59.3% 87.6% 59.6% 86.9% 53.4%
Average age 42 41 44 39 43 41
% with bachelor's degree+ 99.4% 79.5% 94.5% 73.7% 92.6% 68.7%
*Employer-Sponsored Insurance; ** Employer-Provided Pension; ***Private sector adjusted using public sector data
Source: 2007-2010 CPS, U.S. Census and RIPEC calculations
Teachers
RI NE US
Table 26

42
Engineers
Engineers design, evaluate, and develop solutions to technical problems related, but not limited
to, machines, structures, chemicals, and computers. This specific category includes civil,
mechanical, electrical, chemical, industrial, and environmental engineers. The engineering
specialties chosen are common in both the public and private sectors within Rhode Island, New
England, and nationally. As with lawyers and IT professionals, compensation was adjusted
using data for the ―management, professional and other related occupations‖ industry.
The data on engineers suggests that:
On average, public sector engineers were paid less than their private sector counterparts
within the state, region and country. The average salary for private sector engineers was
$12,504 higher than the average salary of public sector engineers in Rhode Island;
The average salary for Rhode Island engineers in both the public and private sectors was
less than the respective sector salary for engineers in New England and nationally;
When total compensation is considered, the wage gap between the public and private
sectors narrow, but average compensation for private sector engineers in Rhode Island
remained 14.4 percent higher than public sector compensation;
All surveyed engineers in Rhode Island and all employees in the public sector in New
England, had access to employer-sponsored health insurance. Access to ESI was similar in
the New England private sector and the US public and private sectors;
In contrast to most professions in this study the average age of public sector engineers was
lower than the average age of private sector engineers (40 years v. 42 years, respectively).
Notably, engineers in Rhode Island were, on average, younger than their peers in the region
and US, in contrast to the majority of occupations in this analysis; and
A lower percentage, 81.4 percent, of engineers in the private sector in Rhode Island have
obtained a bachelor‘s degree or higher compared to 100.0 percent in the public sector.
Public Private Public Private Public Private
Average salary $63,250 $75,754 $68,280 $83,779 $68,815 $79,830
Total salary plus benefits** $92,883 $106,394 $100,270 $117,665 $101,198 $112,278
% with ESI* 100.0% 100.0% 100.0% 98.7% 98.1% 98.0%
% with EPP* 100.0% 85.7% 97.0% 82.5% 90.0% 80.4%
Average age 40 42 45 43 45 43
% with bachelor's degree+ 100.0% 81.4% 94.2% 76.0% 79.3% 78.5%
*Employer-Sponsored Insurance; ** Employer-Provided Pension; ***Adjusted using "management and professional" data
Source: 2007-2010 CPS, U.S. Census and RIPEC calculations
Table 27
Engineers
RI NE US
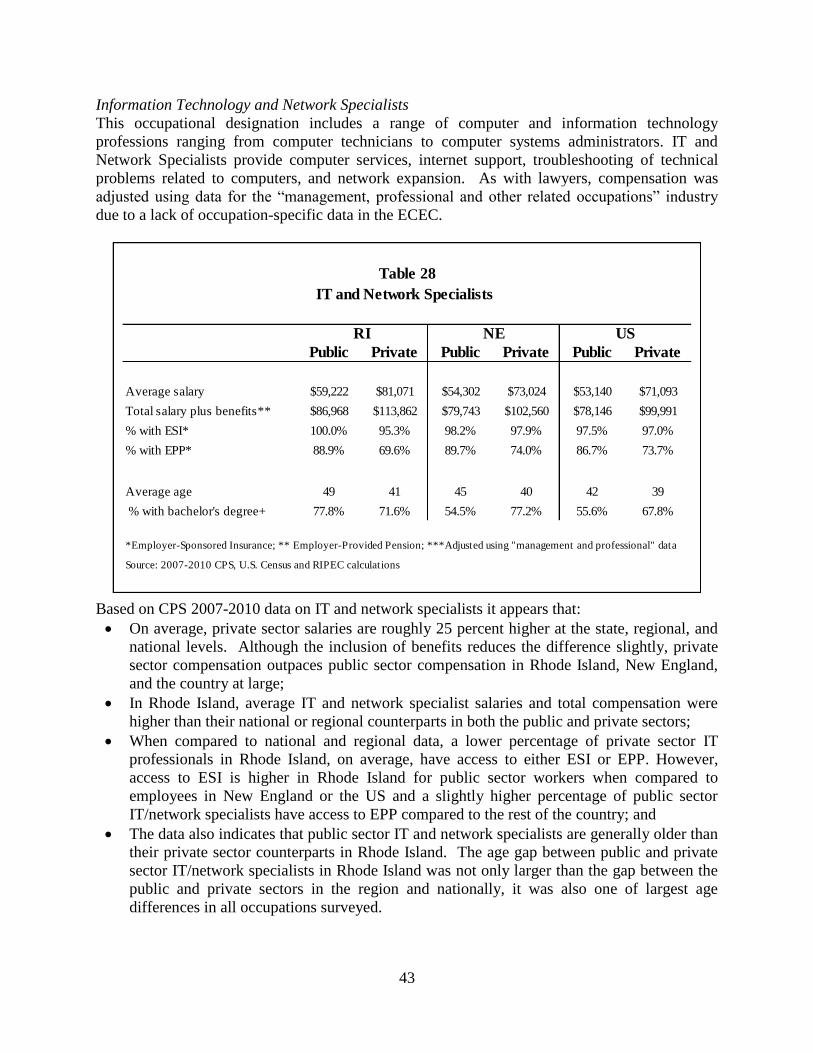
43
Information Technology and Network Specialists
This occupational designation includes a range of computer and information technology
professions ranging from computer technicians to computer systems administrators. IT and
Network Specialists provide computer services, internet support, troubleshooting of technical
problems related to computers, and network expansion. As with lawyers, compensation was
adjusted using data for the ―management, professional and other related occupations‖ industry
due to a lack of occupation-specific data in the ECEC.
Based on CPS 2007-2010 data on IT and network specialists it appears that:
On average, private sector salaries are roughly 25 percent higher at the state, regional, and
national levels. Although the inclusion of benefits reduces the difference slightly, private
sector compensation outpaces public sector compensation in Rhode Island, New England,
and the country at large;
In Rhode Island, average IT and network specialist salaries and total compensation were
higher than their national or regional counterparts in both the public and private sectors;
When compared to national and regional data, a lower percentage of private sector IT
professionals in Rhode Island, on average, have access to either ESI or EPP. However,
access to ESI is higher in Rhode Island for public sector workers when compared to
employees in New England or the US and a slightly higher percentage of public sector
IT/network specialists have access to EPP compared to the rest of the country; and
The data also indicates that public sector IT and network specialists are generally older than
their private sector counterparts in Rhode Island. The age gap between public and private
sector IT/network specialists in Rhode Island was not only larger than the gap between the
public and private sectors in the region and nationally, it was also one of largest age
differences in all occupations surveyed.
Public Private Public Private Public Private
Average salary $59,222 $81,071 $54,302 $73,024 $53,140 $71,093
Total salary plus benefits** $86,968 $113,862 $79,743 $102,560 $78,146 $99,991
% with ESI* 100.0% 95.3% 98.2% 97.9% 97.5% 97.0%
% with EPP* 88.9% 69.6% 89.7% 74.0% 86.7% 73.7%
Average age 49 41 45 40 42 39
% with bachelor's degree+ 77.8% 71.6% 54.5% 77.2% 55.6% 67.8%
*Employer-Sponsored Insurance; ** Employer-Provided Pension; ***Adjusted using "management and professional" data
Source: 2007-2010 CPS, U.S. Census and RIPEC calculations
IT and Network Specialists
RI NE US
Table 28
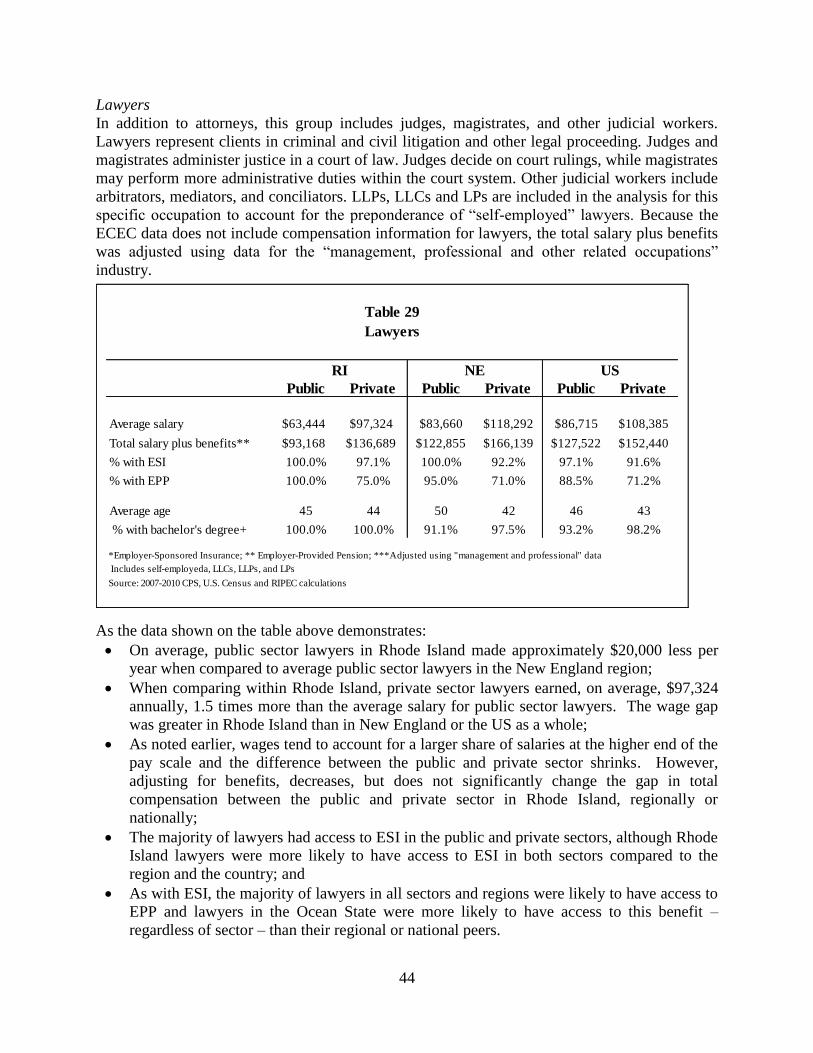
44
Lawyers
In addition to attorneys, this group includes judges, magistrates, and other judicial workers.
Lawyers represent clients in criminal and civil litigation and other legal proceeding. Judges and
magistrates administer justice in a court of law. Judges decide on court rulings, while magistrates
may perform more administrative duties within the court system. Other judicial workers include
arbitrators, mediators, and conciliators. LLPs, LLCs and LPs are included in the analysis for this
specific occupation to account for the preponderance of ―self-employed‖ lawyers. Because the
ECEC data does not include compensation information for lawyers, the total salary plus benefits
was adjusted using data for the ―management, professional and other related occupations‖
industry.
As the data shown on the table above demonstrates:
On average, public sector lawyers in Rhode Island made approximately $20,000 less per
year when compared to average public sector lawyers in the New England region;
When comparing within Rhode Island, private sector lawyers earned, on average, $97,324
annually, 1.5 times more than the average salary for public sector lawyers. The wage gap
was greater in Rhode Island than in New England or the US as a whole;
As noted earlier, wages tend to account for a larger share of salaries at the higher end of the
pay scale and the difference between the public and private sector shrinks. However,
adjusting for benefits, decreases, but does not significantly change the gap in total
compensation between the public and private sector in Rhode Island, regionally or
nationally;
The majority of lawyers had access to ESI in the public and private sectors, although Rhode
Island lawyers were more likely to have access to ESI in both sectors compared to the
region and the country; and
As with ESI, the majority of lawyers in all sectors and regions were likely to have access to
EPP and lawyers in the Ocean State were more likely to have access to this benefit –
regardless of sector – than their regional or national peers.
Public Private Public Private Public Private
Average salary $63,444 $97,324 $83,660 $118,292 $86,715 $108,385
Total salary plus benefits** $93,168 $136,689 $122,855 $166,139 $127,522 $152,440
% with ESI 100.0% 97.1% 100.0% 92.2% 97.1% 91.6%
% with EPP 100.0% 75.0% 95.0% 71.0% 88.5% 71.2%
Average age 45 44 50 42 46 43
% with bachelor's degree+ 100.0% 100.0% 91.1% 97.5% 93.2% 98.2%
*Employer-Sponsored Insurance; ** Employer-Provided Pension; ***Adjusted using "management and professional" data
Includes self-employeda, LLCs, LLPs, and LPs
Source: 2007-2010 CPS, U.S. Census and RIPEC calculations
Table 29
Lawyers
RI NE US

45
VII. Appendix
Methodology
In order to provide an overview of the workforce composition in Rhode Island, New England,
and the US, data from the US Bureau of Labor and Statistics (BLS) and the US Census Bureau‘s
annual Current Population Survey (CPS) regarding employment benefits, wages, and trends were
obtained. Specifically, the March Annual Demographic File and Income Supplement from 2007
through 2010 was used. The CPS is administered jointly by the US Census Bureau and the
Bureau of Labor Statistics each month. The March Annual Demographic File and Income
Supplement is the most commonly used data source for information regarding earnings among
social scientists. Using four years of CPS data (2007 through 2010) allowed for a more robust
sample size, consistent with the methodology used in other compensation studies.
Comparing benefits and wages between sectors is challenging as compensation packages vary as
a result of geographic location, education, age, union membership, type of employer contribution
to health insurance and employer-sponsored retirement plans, and any other number of factors.
For consistency purposes, the data used within this report related to workers classified as full-
time only or 35 hours or more worked per week. Geographic location was taken into
consideration for total compensation adjustments using data from the Employer Cost of
Employee Compensation (ECEC). Union membership was not taken into account in this
analysis, although the prevalance of employer-sponsored healthcare and retirement plans were
examined along with age and education.
Certain observations were excluded from the data analysis to create a more accurate picture of
the population relevant to this study. In the public sector, those employed within the armed
forces and the federal governments were excluded from the dataset. In the private sector, those
who were self-employed, unemployed, or classified as unable to work were excluded from the
sample. LLCs, LLPs, and LPs were also excluded.7 Those coded as ―not in universe‖ by the CPS
include children, those on disability leave, and those, such as retirees, who were out of the
workforce at the time of the survey were also not included in this analysis.
The 2007, 2008, 2009, and 2010 CPS March Supplement datasets were merged together using
SPSS, a statistical software program, and were then weighted with an average weight of the four
years. Weighting the dataset allowed for adjustments for CPS sampling methods and to ensure
that the results were more representative of the total population, rather than the sample size. The
four datasets were merged in order to increase the sample size for the workforce, which, in turn,
improved the reliability and validity of the data. The sample size was 830,766 total observations
with 50,823 public employee observations for the complete, merged dataset.
The variables selected to obtain data from the CPS and provide for an overview of the workforce
are as follows:
7 The lawyers occupational analyses include LLCs, LLPs, and LPs in order to account for the preponderance of
lawyers that are self-employed or fall into one of these categories.

46
Demographics, Age (A_AGE): reports the age of each respondent;
Current status, class of worker (A_CLSWKR): classifies respondents who are within
the workforce by sector;
Demographics, Educational attainment (A_HGA): describes the highest level of
education attained by individual respondents 25 years of age or older;
Geography – FIPS state code (GESTFIPS): provides locational information, can be
used to select observations from within a specific geographic region or state;
Health insurance paid by employer (HIPAID): reports whether or not an observation
has access to employer-provided insurance with a yes or no response;
Industry and occupation (main job), occupation code (PEIOOCC): classifies
observations on the basis of type of employment by individual occupations or
professions;
Pension plan provided by employer (PENPLAN): classifies respondents on the basis
of whether or not some form of retirement plan is accessible to a worker through their
employer;
Total wage and salary earnings amount (WSAL_VAL): reports the total annual wages
or salary of each respondent. This does not include the value of other forms of
compensation that can be received by employees.
The aforementioned standard CPS variables were recoded within SPSS for the purpose of this
study. Recoding permitted for the selection of information relevant to the study. For example,
the FIPS code variable was recoded in order to select information from Rhode Island only and
then from New England only for portions of the report. After recoding the standard CPS
variables into more pertinent and applicable variables, the cross tabulations, descriptive statistics,
and subsequently, and regression analyses were conducted.
Following the collection of data and the preliminary analysis of this information, specific
occupations were chosen to be included as one component of this report in order to provide some
comparison between workers in the different geographic regions and sectors. RIPEC and the RI
Office of the General Treasurer identified occupations in the private and public sector to be
further analyzed. The final occupational selection was also based upon data provided by the RI
Department of Administration indicating current staffing levels throughout the state.
The occupations selected (nurse, lawyer, social worker, engineer, teacher, janitorial and
maintenance staff, office and administrative staff, and internet technologies and network
specialist) were intended to provide for both an appropriate comparison of positions present
within both sectors and intended to provide a sample of some common occupations in Rhode
Island, New England, and the US representing a variety of individuals within the workforce.
This cross-section of the workforce includes a sample of individuals of different ages, income
levels, and education levels.
As noted above, individuals classified as self-employed, as well as LLCs, LLPs and LPs, were
excluded from the data set, including the individual occupations that were analyzed. However,
because the these individuals account for the majority of private sector lawyers, exclusion of
these individuals tended to significantly inflate the mean salary and the inclusion increased the

47
sample size, data for lawyers organized as LLCs, LLPs, LPs and reporting as self-employed were
included.
Wage data was extracted from the merged CPS data set, as were the share of employees with
access to employer-sponsored insurance and an employer-provided pension, average ages and
the share of workers with a bachelor‘s degree for both the public and private sectors. In order to
account for the relative value of benefits, total compensation (salaries plus benefits) was
calculated using data from the ECEC. New England and Rhode Island values for each
occupation were adjusted by the ratio of US to New England wages as a share of compensation.
Wages as a share of total compensation also vary with occupation or industry. Because the
ECEC does not include employer costs for all occupations, and the difference in workforce
composition between the two industries, total compensation was calculated as follows:
In some cases, specifically for engineers and lawyers, data did not exist for the occupation or
industry in either sector. In this case, wages were adjusted using data for ―management and
professional occupations‖ as in example 3 above. Please see page 32 for a detailed explanation
on methods used to gain a broader picture of the total compensation package for specific
occupations. The methodology employed throughout this report was consistent with similar,
previous research concerning comparisons of compensation across sectors, both nationally and
regionally.
If data for the occupation or industry was only available for the private sector (e.g. Nurses):
PubWage
PvWage
If data for the occupation or industry was only available for the public sector (e.g. Teachers):
PvWage
PubWage
If data for the occupation or industry was available for both sectors (e.g. Office and Administrative Staff):
OcWage = occupation total wage estimate
PubWage = public sector wage ratio
PvWage = private sector wage ratio
PubOcWage = public sector wage ratio for occupation
PvOcWage = private sector wage ratio for occupation
*
*
PvWage /
/
OcWage
OcWage
OcWage
PuWage
)
)
3 or
(
(
PvOcWage1
2 PubOcWage
/
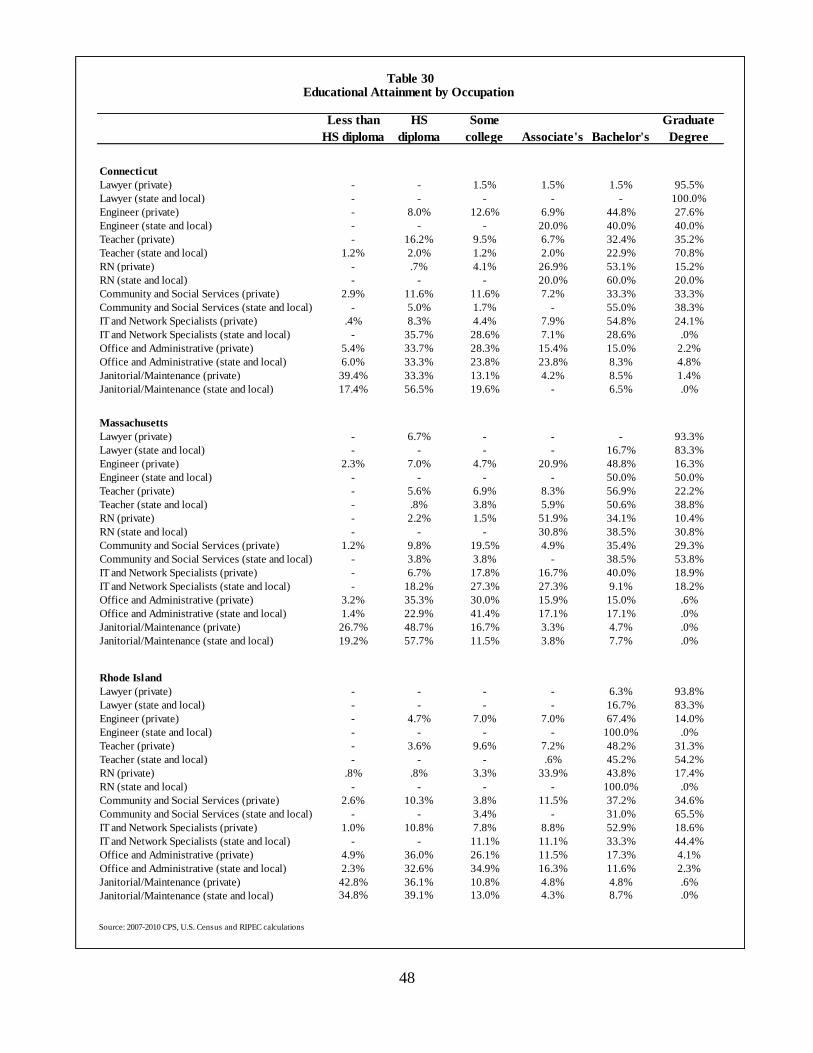
48
Less than
HS diploma
HS
diploma
Some
college Associate's Bachelor's
Graduate
Degree
Connecticut
Lawyer (private) - - 1.5% 1.5% 1.5% 95.5%
- - - - - 100.0%
- 8.0% 12.6% 6.9% 44.8% 27.6%
- - - 20.0% 40.0% 40.0%
- 16.2% 9.5% 6.7% 32.4% 35.2%
1.2% 2.0% 1.2% 2.0% 22.9% 70.8%
- .7% 4.1% 26.9% 53.1% 15.2%
- - - 20.0% 60.0% 20.0%
2.9% 11.6% 11.6% 7.2% 33.3% 33.3%
- 5.0% 1.7% - 55.0% 38.3%
.4% 8.3% 4.4% 7.9% 54.8% 24.1%
- 35.7% 28.6% 7.1% 28.6% .0%
5.4% 33.7% 28.3% 15.4% 15.0% 2.2%
6.0% 33.3% 23.8% 23.8% 8.3% 4.8%
39.4% 33.3% 13.1% 4.2% 8.5% 1.4%
17.4% 56.5% 19.6% - 6.5% .0%
Massachusetts
Lawyer (private) - 6.7% - - - 93.3%
- - - - 16.7% 83.3%
2.3% 7.0% 4.7% 20.9% 48.8% 16.3%
- - - - 50.0% 50.0%
- 5.6% 6.9% 8.3% 56.9% 22.2%
- .8% 3.8% 5.9% 50.6% 38.8%
- 2.2% 1.5% 51.9% 34.1% 10.4%
- - - 30.8% 38.5% 30.8%
1.2% 9.8% 19.5% 4.9% 35.4% 29.3%
- 3.8% 3.8% - 38.5% 53.8%
- 6.7% 17.8% 16.7% 40.0% 18.9%
- 18.2% 27.3% 27.3% 9.1% 18.2%
3.2% 35.3% 30.0% 15.9% 15.0% .6%
1.4% 22.9% 41.4% 17.1% 17.1% .0%
26.7% 48.7% 16.7% 3.3% 4.7% .0%
19.2% 57.7% 11.5% 3.8% 7.7% .0%
Rhode Island
Lawyer (private) - - - - 6.3% 93.8%
- - - - 16.7% 83.3%
- 4.7% 7.0% 7.0% 67.4% 14.0%
- - - - 100.0% .0%
- 3.6% 9.6% 7.2% 48.2% 31.3%
- - - .6% 45.2% 54.2%
.8% .8% 3.3% 33.9% 43.8% 17.4%
- - - - 100.0% .0%
2.6% 10.3% 3.8% 11.5% 37.2% 34.6%
- - 3.4% - 31.0% 65.5%
1.0% 10.8% 7.8% 8.8% 52.9% 18.6%
- - 11.1% 11.1% 33.3% 44.4%
4.9% 36.0% 26.1% 11.5% 17.3% 4.1%
2.3% 32.6% 34.9% 16.3% 11.6% 2.3%
42.8% 36.1% 10.8% 4.8% 4.8% .6%
34.8% 39.1% 13.0% 4.3% 8.7% .0%
Source: 2007-2010 CPS, U.S. Census and RIPEC calculations
Janitorial/Maintenance (private)
Janitorial/Maintenance (state and local)
Community and Social Services (state and local)
IT and Network Specialists (private)
IT and Network Specialists (state and local)
Office and Administrative (private)
Office and Administrative (state and local)
Janitorial/Maintenance (state and local)
Lawyer (state and local)
Engineer (private)
Engineer (state and local)
Teacher (private)
Teacher (state and local)
RN (private)
RN (state and local)
Community and Social Services (private)
Lawyer (state and local)
Engineer (private)
Engineer (state and local)
Teacher (private)
Janitorial/Maintenance (private)
IT and Network Specialists (private)
IT and Network Specialists (state and local)
Office and Administrative (private)
Office and Administrative (state and local)
Janitorial/Maintenance (private)
Janitorial/Maintenance (state and local)
Teacher (state and local)
RN (private)
RN (state and local)
Community and Social Services (private)
Community and Social Services (state and local)
Office and Administrative (state and local)
Table 30Educational Attainment by Occupation
Lawyer (state and local)
Engineer (private)
Engineer (state and local)
Teacher (private)
Teacher (state and local)
RN (private)
RN (state and local)
Community and Social Services (private)
Community and Social Services (state and local)
IT and Network Specialists (private)
IT and Network Specialists (state and local)
Office and Administrative (private)

49
US NE CT MA RI
Lawyer (private) 91.6% 92.2% 90.0% 100.0% 91.7%
Lawyer (state and local) 97.1% 100.0% 100.0% 100.0% 100.0%
Engineer (private) 98.0% 98.7% 100.0% 100.0% 100.0%
Engineer (state and local) 98.1% 100.0% 100.0% 100.0% 100.0%
Teacher (private) 95.1% 98.3% 100.0% 97.8% 97.4%
Teacher (state and local) 97.5% 98.6% 96.8% 99.4% 100.0%
RN (private) 95.4% 97.8% 99.1% 96.9% 100.0%
RN (state and local) 97.6% 98.0% 100.0% 100.0% 100.0%
Community and Social Services (private) 95.4% 96.0% 100.0% 98.2% 96.0%
Community and Social Services (state and local) 97.8% 99.4% 100.0% 100.0% 95.8%
IT and Network Specialists (private) 97.0% 97.9% 97.8% 98.7% 95.3%
IT and Network Specialists (state and local) 97.5% 98.2% 100.0% 100.0% 100.0%
Office and Administrative (private) 95.1% 95.4% 94.4% 94.3% 93.6%
Office and Administrative (state and local) 96.9% 96.2% 94.3% 93.5% 96.3%
Janitorial/Maintenance (private) 94.1% 92.2% 94.4% 94.9% 91.8%
Janitorial/Maintenance (state and local) 95.6% 100.0% 100.0% 100.0% 100.0%
Table 31
Percentage of Workers with Employer Sponsored Healthcare*
Source: 2007-2010 CPS March Supplement, U.S. Census and RIPEC calculations
*Includes employees with partial or full employer contributions.

50
Detailed Occupational Descriptions
For the purpose of this study, individual occupations within the US Census classifications were
combined in order to increase sample size and improve the reliability and validity of the data.
Provided below is a description of each occupation included within the report and a list of
specific occupations that are included for more broad occupational classifications.
Engineer: Mechanical, chemical, civil, environmental, electrical, and industrial engineers are
included within this occupation.
Mechanical Engineer (17-2141): Perform engineering duties in planning and designing
tools, engines, machines, and other mechanically functioning equipment. Oversee
installation, operation, maintenance, and repair of such equipment as centralized heat,
gas, water, and steam systems.
Chemical Engineer (17-2041): Design chemical plant equipment and devise processes for
manufacturing chemicals and products, such as gasoline, synthetic rubber, plastics,
detergents, cement, paper, and pulp, by applying principles and technology of chemistry,
physics, and engineering.
Civil Engineer (17-2051): Perform engineering duties in planning, designing, and
overseeing construction and maintenance of building structures, and facilities, such as
roads, railroads, airports, bridges, harbors, channels, dams, irrigation projects, pipelines,
power plants, water and sewage systems, and waste disposal units. Include architectural,
structural, traffic, ocean, and geo-technical engineers. Exclude "Hydrologists" (19-2043).
Environmental Engineer (17-2081): Design, plan, or perform engineering duties in the
prevention, control, and remediation of environmental health hazards utilizing various
engineering disciplines. Work may include waste treatment, site remediation, or pollution
control technology.
Electrical Engineer (17-2071): Design, develop, test, or supervise the manufacturing and
installation of electrical equipment, components, or systems for commercial, industrial,
military, or scientific use. Exclude "Computer Hardware Engineers" (17-2061).
Industrial Engineer (17-2121): Design, develop, test, and evaluate integrated systems for
managing industrial production processes including human work factors, quality control,
inventory control, logistics and material flow, cost analysis, and production coordination.
Exclude "Health and Safety Engineers, Except Mining Safety Engineers and Inspectors"
(17-2111).
Information Technology and Network Specialist: Computer scientists and systems analysts,
computer programmers, computer software engineers, computer support specialists, database
administrators, network and computer systems administrators, and network systems and data
communications analysts are included within this occupation.
Computer Programmers (15-1021): Convert project specifications and statements of
problems and procedures to detailed logical flow charts for coding into computer
language. Develop and write computer programs to store, locate, and retrieve specific
documents, data, and information. May program web sites.
Computer Software Engineers - applications and systems software (15-1031, 15-1032):
Develop, create, and modify general computer applications software or specialized
utility programs. Analyze user needs and develop software solutions. Design software or

51
customize software for client use with the aim of optimizing operational efficiency. May
analyze and design databases within an application area, working individually or
coordinating database development as part of a team. May also research, design,
develop, and test operating systems-level software, compilers, and network distribution
software for medical, industrial, military, communications, aerospace, business,
scientific, and general computing applications. Set operational specifications and
formulate and analyze software requirements. Apply principles and techniques of
computer science, engineering, and mathematical analysis.
Computer Support Specialists (15-1041): Provide technical assistance to computer
system users. Answer questions or resolve computer problems for clients in person, via
telephone or from remote location. May provide assistance concerning the use of
computer hardware and software, including printing, installation, word processing,
electronic mail, and operating systems.
Database Administrators (15-1061): Coordinate changes to computer databases, test and
implement the database applying knowledge of database management systems. May
plan, coordinate, and implement security measures to safeguard computer databases.
Network and Computer Systems Administrators (15-1071): Install, configure, and
support an organization's local area network (LAN), wide area network (WAN), and
Internet system or a segment of a network system. Maintain network hardware and
software. Monitor network to ensure network availability to all system users and perform
necessary maintenance to support network availability. May supervise other network
support and client server specialists and plan, coordinate, and implement network
security measures.
Network Systems and Data Communication Analysts (15-1081): Analyze, design, test,
and evaluate network systems, such as local area networks (LAN), wide area networks
(WAN), Internet, intranet, and other data communications systems. Perform network
modeling, analysis, and planning. Research and recommend network and data
communications hardware and software. Include telecommunications specialists who
deal with the interfacing of computer and communications equipment. May supervise
computer programmers.
Janitorial and Maintenance Workers (37-2011): Keep buildings in clean and orderly
condition. Perform heavy cleaning duties, such as cleaning floors, shampooing rugs, washing
walls and glass, and removing rubbish. Duties may include tending furnace and boiler,
performing routine maintenance activities, notifying management of need for repairs, and
cleaning snow or debris from sidewalk. Other sub-occupations include:
Maids and Housekeeping Cleaners (37-2012): Perform any combination of light cleaning
duties to maintain private households or commercial establishments, such as hotels,
restaurants, and hospitals, in a clean and orderly manner. Duties include making beds,
replenishing linens, cleaning rooms and halls, and vacuuming.
Landscaping and Groundskeeping Workers (37-3011): Landscape or maintain grounds of
property using hand or power tools or equipment. Workers typically perform
a variety of tasks, which may include any combination of the following: sod laying,
mowing, trimming, planting, watering, fertilizing, digging, raking, sprinkler installation,
and installation of mortarless segmental concrete masonry wall units.

52
Pesticide Handlers, Sprayers, and Applicators, Vegetation (37-3012): Mix or apply
pesticides, herbicides, fungicides, or insecticides through sprays, dusts, vapors, soil
incorporation or chemical application on trees, shrubs, lawns, or botanical crops. Usually
requires specific training and State or Federal certification. Excludes "Commercial Pilots"
(53-2012) who operate aviation equipment to dust or spray crops.
Tree Trimmers and Pruners (37-3013): Cut away dead or excess branches from trees or
shrubs to maintain right-of-way for roads, sidewalks, or utilities, or to improve
appearance, health, and value of tree. Prune or treat trees or shrubs using handsaws,
pruning hooks, sheers, and clippers. May use truck-mounted lifts and power pruners. May
fill cavities in trees to promote healing and prevent deterioration.
Grounds Maintenance Workers, All Other (37-3019): All grounds maintenance workers
not listed separately.
Lawyer: Lawyers; judges, magistrates, and other judicial workers; administrative law judges,
adjudicators, and hearings officers; and arbitrators, mediators, and conciliators are included
within this occupation.
Lawyers (23-1011): Represent clients in criminal and civil litigation and other legal
proceedings, draw up legal documents, or manage or advise clients on legal transactions.
May specialize in a single area or may practice broadly in many areas of law.
Judges, Magistrates, and Other Judicial Workers (23-1020): Arbitrate, advise,
adjudicate, or administer justice in a court of law. May sentence defendant in criminal
cases according to government statutes or sentencing guidelines. May determine liability
of defendant in civil cases. May perform wedding ceremonies.
Administrative Law Judges, Adjudicators, and Hearing Officers (23-1021): Conduct
hearings to recommend or make decisions on claims concerning government programs or
other government-related matters. Determine liability, sanctions, or penalties, or
recommend the acceptance or rejection of claims or settlements.
Arbitrators, Mediators, and Conciliators (23-1022): Facilitate negotiation and conflict
resolution through dialogue. Resolve conflicts outside of the court system by mutual
consent of parties involved.
Office and Administrative Staff: Bookkeeping, accounting, and auditing clerks; payroll and
timekeeping clerks; procurement clerks; court, municipal and license clerks; order clerks; human
resources assistants; receptionists and information clerks; secretaries and administrative
assistants; computer operators; data entry keyers; word processors and typists; general office
clerks, and all other office and administrative support workers are included within this
occupation.
Bookkeeping, Accounting, and Auditing Clerks (43-3031): Compute, classify, and record
numerical data to keep financial records complete. Perform any combination of routine
calculating, posting, and verifying duties to obtain primary financial data for use in
maintaining accounting records. May also check the accuracy of figures, calculations, and
postings pertaining to business transactions recorded by other workers.
Payroll and Timekeeping Clerks (43-3051): Compile and post employee time and payroll
data. May compute employees' time worked, production, and commission. May compute
and post wages and deductions. May prepare paychecks.

53
Procurement Clerks (43-3061): Compile information and records to draw up purchase
orders for procurement of materials and services.
Court, Municipal, and License Clerks (43-4031): Perform clerical duties in courts of law,
municipalities, and governmental licensing agencies and bureaus. May prepare docket of
cases to be called; secure information for judges and court; prepare draft agendas
or bylaws for town or city council; answer official correspondence; keep fiscal records
and accounts; issue licenses or permits; record data, administer tests, or collect fees.
Include chief clerks with "Managers, All Other" (11-9199).
Order Clerks (43-4151): Receive and process incoming orders for materials,
merchandise, classified ads, or services such as repairs, installations, or rental of
facilities. Duties include informing customers of receipt, prices, shipping dates, and
delays; preparing contracts; and handling complaints.
Human Resources Assistants (43-4161): Compile and keep personnel records. Record
data for each employee, such as address, weekly earnings, absences, amount of sales or
production, supervisory reports on ability, and date of and reason for termination.
Compile and type reports from employment records. File employment records. Search
employee files and furnish information to authorized persons. Excludes payroll and
timekeeping.
Receptionists and Information Clerks (43-4171): Answer inquiries and obtain
information for general public, customers, visitors, and other interested parties. Provide
information regarding activities conducted at establishment; location of departments,
offices, and employees within organization.
Secretaries and Administrative Assistants (43-6011, 43-6012, 43-6013):
- Executive Secretaries and Administrative Assistants: Provide high-level
administrative support by conducting research, preparing statistical reports,
handling information requests, and performing clerical functions, such as
preparing correspondence, receiving visitors, arranging conference calls, and
scheduling meetings. May also train and supervise lower-level clerical
staff.
- Secretaries, Legal: Perform secretarial duties utilizing legal terminology,
procedures, and documents. Prepare legal papers and correspondence, such as
summonses, complaints, motions, and subpoenas. May also assist with legal
research.
- Secretaries, Medical: Perform secretarial duties utilizing specific knowledge of
medical terminology and hospital, clinic, or laboratory procedures. Duties include
scheduling appointments, billing patients, and compiling and recording medical
charts, reports, and correspondence.
Computer Operators (43-9011): Monitor and control electronic computer and peripheral
electronic data processing equipment to process business, scientific, engineering, and
other data according to operating instructions. May enter commands at a computer
terminal and set controls on computer and peripheral devices. Monitor and respond to
operating and error messages.
Data Entry Keyers (43-9021): Operate data entry device, such as keyboard or photo
composing perforator. Duties may include verifying data and preparing materials for
printing.

54
Word Processors and Typists (43-9022): Use word processor/computer or typewriter to
type letters, reports, forms, or other material from rough draft, corrected copy, or voice
recording. May perform other clerical duties as assigned. Include composing data keyers.
Office Clerks, General (43-9061): Perform duties too varied and diverse to be classified
in any specific office clerical occupation, requiring limited knowledge of office
management systems and procedures. Clerical duties may be assigned in accordance with
the office procedures of individual establishments and may include a combination of
answering telephones, bookkeeping, typing or word processing, stenography, office
machine operation, and filing.
Office and Administrative Support Workers, All Other (43-9199): All office and
administrative support workers not listed separately.
Registered Nurse (29-1141): Assess patient health problems and needs, develop and implement
nursing care plans, and maintain medical records. Administer nursing care to ill, injured,
convalescent, or disabled patients. May advise patients on health maintenance and disease
prevention or provide case management. Licensing or registration required. Includes Clinical
Nurse Specialists. Excludes "Nurse Anesthetists" (29-1151), "Nurse Midwives" (29-1161), and
"Nurse Practitioners" (29-1171).
Social Worker: Child, family, and school social workers, healthcare social workers, counselors,
mental health and substance abuse social workers, and all other social workers are included
within this occupation.
Child, Family, and School Social Workers (21-1021): Provide social services and
assistance to improve the social and psychological functioning of children
and their families and to maximize the family well-being and the academic functioning of
children. May assist single parents, arrange adoptions, and find foster homes for
abandoned or abused children. In schools, they address such problems as teenage
pregnancy, misbehavior, and truancy. May also advise teachers on how to deal with
problem children.
Healthcare Social Workers (21-1022): Provide individuals, families, and groups with the
psychosocial support needed to cope with chronic, acute, or terminal illnesses. Services
include advising family care givers, providing patient education and counseling, and
making referrals for other services. May also provide care and case management or
interventions designed to promote health, prevent disease, and address barriers to access
to healthcare.
Mental Health and Substance Abuse Social Workers (21-1023): Assess and treat
individuals with mental, emotional, or substance abuse problems, including abuse of
alcohol, tobacco, and/or other drugs. Activities may include individual and group
therapy, crisis intervention, case management, client advocacy, prevention, and
education.
Social Workers, all other (21-1029)
Counselors (21-1010):
- Substance Abuse and Behavioral Disorder Counselors (21-1011): Counsel and
advise individuals with alcohol, tobacco, drug, or other problems, such as
gambling and eating disorders. May counsel individuals, families, or groups or
engage in prevention programs.

55
- Educational, Vocational, and School Counselors (21-1012): Counsel individuals
and provide group educational and vocational guidance services.
- Marriage and Family Therapists (21-1013): Diagnose and treat mental and
emotional disorders, whether cognitive, affective, or behavioral, within the
context of marriage and family systems. Apply psychotherapeutic and family
systems theories and techniques in the delivery of professional services to
individuals, couples, and families for the purpose of treating such diagnosed
nervous and mental disorders.
- Mental Health Counselors (21-1014): Counsel with emphasis on prevention.
Work with individuals and groups to promote optimum mental health. May help
individuals deal with addictions and substance abuse; family, parenting, and
marital problems; suicide; stress management; problems with self-esteem; and
issues associated with aging and mental and emotional health.
- Rehabilitation Counselors (21-1015): Counsel individuals to maximize the
independence and employability of persons coping with personal, social, and
vocational difficulties that result from birth defects, illness, disease, accidents, or
the stress of daily life. Coordinate activities for residents of care and treatment
facilities. Assess client needs and design and implement rehabilitation programs
that may include personal and vocational counseling, training, and job placement.
- Counselors, All Other (21-1019): All counselors not listed separately.
Miscellaneous community and social service specialists (21-1090):
- Health Educators (21-1091): Promote, maintain, and improve individual and
community health by assisting individuals and communities to adopt healthy
behaviors. Collect and analyze data to identify community needs prior to
planning, implementing, monitoring, and evaluating programs designed to
encourage healthy lifestyles, policies and environments. May also serve as a
resource to assist individuals, other professionals, or the community, and may
administer fiscal resources for health education programs.
- Probation Officers and Correctional Treatment Specialists (21-1092): Provide
social services to assist in rehabilitation of law offenders in custody or on
probation or parole. Make recommendations for actions involving formulation of
rehabilitation plan and treatment of offender, including conditional release and
education and employment stipulations.
- Social and Human Service Assistants (21-1093): Assist professionals from a wide
variety of fields, such as psychology, rehabilitation, or social work, to provide
client services, as well as support for families. May assist clients in identifying
available benefits and social and community services and help clients obtain
them. May assist social workers with developing, organizing, and conducting
programs to prevent and resolve problems relevant to substance abuse, human
relationships, rehabilitation, or adult daycare.
- Community and Social Service Specialists, All Other (21-1099): All community
and social service specialists not listed separately.

56
Teacher: Pre-K, elementary and middle school teachers, secondary school teachers, and special
education teachers are included within this occupation. Elementary and middle school teachers
(25-2020), secondary school teachers (25-2030), and special education teachers (25-2040).
Preschool and Kindergarten Teachers (25-2010):
- Preschool Teachers (25-2011): Instruct children (normally up to 5 years of age)
in activities designed to promote social, physical, and intellectual growth needed
for primary school in preschool, day care center, or other child development
facility. May be required to hold State certification. Exclude "Special Education
Teachers" (25-2041 through 25-2043).
- Kindergarten Teachers (25-2012): Teach elemental natural and social science,
personal hygiene, music, art, and literature to children from 4 to 6 years old.
Promote physical, mental, and social development. May be required to hold State
certification. Exclude "Special Education Teachers" (25-2041 through 25-2043).
Elementary and Middle School Teachers (25-2020)
- Elementary School Teachers, except Special Education (25-2021): Teach pupils
in public or private schools at the elementary level basic academic, social, and
other formative skills.
- Middle School Teachers, except Special and Vocational Education (25-2022):
Teach students in public or private schools in one or more subjects at the middle,
intermediate, or junior high level, which falls between elementary and senior high
school as defined by applicable State laws and regulations.
- Vocational Education Teachers, Middle School (25-2023): Teach or instruct
vocational or occupational subjects at the middle school level.
Secondary School Teachers (25-2030):
- Secondary School Teachers, except Special and Vocational Education (25-2031):
Instruct students in secondary public or private schools in one or more subjects at
the secondary level, such as English, mathematics, or social studies. May be
designated according to subject matter specialty, such as typing instructors,
commercial teachers, or English teachers.
- Vocational Education Teachers, Secondary School (25-2032): Teach or instruct
vocational or occupational subjects at the secondary school level.
Special education teachers (25-2041):
- Special Education Teachers, Preschool, Kindergarten, and Elementary School
(25-2041): Teach elementary and preschool school subjects to educationally and
physically handicapped students. Include teachers who specialize and work with
audibly and visually handicapped students and those who teach basic academic
and life processes skills to the mentally impaired.
- Special Education Teachers, Middle School (25-2042): Teach middle school
subjects to educationally and physically handicapped students. Include teachers
who specialize and work with audibly and visually handicapped students and
those who teach basic academic and life processes skills to the mentally impaired.
- Special Education Teachers, Secondary School (25-2043): Teach secondary
school subjects to educationally and physically handicapped students. Include
teachers who specialize and work with audibly and visually handicapped students
and those who teach basic academic and life processes skills to the mentally
impaired.

57
VIII. Literature Review
This literature review provides a background explaining the various approaches that scholars and
analysts have taken to assess compensation and benefits packages within the public and private
sectors and serves as a guide for the study. The bulk of the research performed on public and
private sector compensation has been at the national level. Given the current fiscal situation
facing states and localities in relation to pensions and other employee benefits, it is imperative to
take a more robust look at employee compensation in Rhode Island.
Background
Organizations such as the Economic Policy Institute (EPI), the Center for State & Local
Government Excellence, the Heritage Foundation, and the National Institute on Retirement
Security have published articles comparing public and private sector compensation trends. The
research has yielded results as broad as the organizations performing the research. In recent
decades, there has been considerable attention paid to the compensation of employees of similar
professions in the public and private sectors. As the federal and multiple local and state
governments have encountered fiscal challenges, attention on this comparison and any disparities
between the two sectors has only increased (Quinn, 1979).
Attention has also been given to public sector employees and compensation packages, as it
represents a substantial portion of the national economy. In 2008, it was reported that wages and
benefits represented approximately half of all local and state government spending (Edwards,
2008). Empirical evidence has also shown that public sector employees have access to
compensation packages that are more generous than those received by similar private sector
employees (Quinn, 1979 and Biggs and Richwine, 2011). Public sector employees of federal
and state governments typically receive greater fringe benefits and experience greater job
stability, which has been classified as one form of compensation by some researchers. In the
instance of lower wages for a particular profession, there often exist other forms of compensation
that enhance the overall compensation package, thereby offsetting this disparity (Quinn, 1979
and Keefe, 2010).
Fogel and Lewin (1974) present evidence that public sector clerical, data processing, and manual
laborers received higher wages than their private sector counterparts. This data was
representative of municipalities in 11 large urban areas surveyed by the US Bureau of Labor
Statistics (BLS). With respect to job stability and job security, Fogel and Lewin (1974) found
that there tend to be lower rates of employee turnover in the public sector, especially within state
and local governments. In 1972, employee turnover totaled 19.0 percent within state and local
government positions and 22.0 percent in the federal government. More recent data also
suggests that there existed a greater proportion of low-wage employees in the private sector,
arguably a factor of the supply unskilled, immobile workers (Keefe, 2010). Presumably, both
factors have contributed to the attractive nature of public sector employment.
For a broad historical overview, between 1950 and 1980, average total compensation, which
includes wages and benefits, were similar for full-time employees in both the public and private
sectors. Post-1980, however, growth in public sector compensation began to outpace private

58
sector compensation. The gap narrowed during the late 1990s, but increased again during the
2000s. It has been reported that this disparity was primarily a factor of maintained benefits, such
as defined-benefit pension and health insurance plans (Edwards, 2010 and Hacker, 2002).
Trends in Compensation Research
Over time, the focus of compensation analysis has varied substantially. Beginning in the 1970s,
much of the focus centered on whether or not there was a disparity in wages between public and
private sector employees. Little discussion occurred between scholars over benefits, both the
type and level offered. Excluding benefits from analyses of compensation does not allow for a
complete picture of the total compensation received by all workers, regardless of sector or
occupation. The current general consensus among compensation researchers is that comparing
wages alone is also insufficient as employer-provided benefits are an important component of
compensation packages (Keefe, 2010 and Bender and Heywood, 2010). Presently, the BLS
engages in more in-depth surveying and reporting of employment trends and issues, thereby
providing researchers a greater variety of data and an ability to compare most types of
compensation. Most of the available data on benefits for public sector employees, however, is
available at the national level (Bender and Heywood, 2010). Although the Bureau of Labor
Statistics combines federal workers into the public sector group as a whole, it becomes
challenging to separate federal from state and local when analyzing this particular data set.
More current research has examined trends in benefit structures, levels, and packages offered to
workers. Although benefits constitute a greater share of employee compensation in the public
sector than in the private sector, scholars are divided on which sector tends to have employees
with higher overall compensation. For example, Bender and Heywood (2010), in a joint
publication put forth by the Center for State & Local Government Excellence, and the National
Institute on Retirement Security argue that state and local employees have a lower total
compensation than their private sector counterparts when education is used as a definitive
variable for determining compensation levels.
Wages Analysis
In 1962, the US Congress passed the Federal Salary Reform Act, which mandated that ―federal
pay rates be comparable with private enterprise pay rates for the same level of work.‖ Despite a
number of challenges with this type of approach, it has been common practice for wages in the
public sector to be determined, in part, by their private sector counterpart (Quinn, 1979). This
approach is commonly referred to as the ―prevailing wage‖ principle (Fogel and Lewin, 1974).
The US Department of Labor‘s Bureau of Labor Statistics (BLS) released data in 1996 indicating
that some workers, including professional and administrative workers, typically earn more in the
private sector. When all workers were analyzed, BLS found that the average wage is higher
amongst state and local government workers. If workers are categorized by wage, low-wage
workers typically earn more in the public sector whereas high-wage workers tend to earn more in
the private sector (Miller, 1996). Better-educated and older workers theoretically earn more than
younger and less-educated workers; pay-scale comparisons between sectors should take these
demographics into consideration when performing compensation analysis (Thompson and

59
Schmitt, 2010). Thompson and Schmitt (2010) stress the importance of comparing age and
education variables between public and private sector employees – and assert that when this type
of analysis is performed properly, the data will show that state and local workers earn less, on
average, than their private sector counterparts. In New England, more than half of the state and
local employees have a bachelor‘s degree, and almost 30.0 percent have an advanced degree.
This contrasts with the lower percentages in the private sector – 37.9 percent with a bachelor‘s
degree and 13.3 percent with an advanced degree (Thompson and Schmitt, 2010).
Lewin et al. (2011) argued that public employees, on average, earn 11.5 percent less in wages
and salaries when taking education and other human-capital variables (such as age) into
consideration. Most public employees are not receiving higher compensation than private
employees when considerations are made for education and training. Generally, public
employees are required to have higher levels of education, especially at the local and state levels,
because of specialized state services. In recent years, public employees have chosen to maintain
benefits, such as healthcare and defined-benefit pensions, in exchange for deferred (or
eliminated) raises with regard to wages and salaries (Lewin et al., 2011).
The Center for Economic and Policy Research at the University of Massachusetts Amherst
Political Economy Research Institute also purports that although state and local government
workers, on average, earn higher wages, they are typically better educated and older. If workers
are compared on the basis of education and age, public sector employees fare worse and earn less
than their private sector counterparts. Thompson and Schmitt (2010) describe public sector
employees as incurring a ―wage penalty‖ in comparison to their private sector counterparts. Data
also suggests that high school graduates experience a wage penalty totaling 1.6 percent, and
those with a bachelor‘s degree experience a wage penalty totaling 7.0 percent. If wages are
compared, public sector low-wage workers in New England receive a 5.0 percent penalty and
high-wage workers make about 13.0 percent less (Thompson and Schmitt, 2010).
In contrast, the Center for Union Facts dismisses previous research and argues that public sector
employees receive greater wages and salaries. Following an analysis of the EPI‘s compensation
study, the Center for Union Fact disputes the methods used by the EPI that discounts certain
workers, including part-time and part-year workers. The Center also addresses the approach
used by the EPI in order to calculate teachers‘ wages and salaries in the public sector that pro-
rates the annual teachers‘ salary from the school year to the calendar year or from 36 weeks to 52
weeks, thereby deflating the monthly total wage amount. Making adjustments for the EPI‘s
method, the Center for Union Facts states that public sector employees receive greater base pay
(Center for Union Facts, 2010).
Employee Benefits
Retirement Benefits
With respect to benefits, many employees in the private sector have transitioned to defined-
contribution (DC) from defined-benefit (DB) retirement plans. Such plans are more portable,
and typically attractive to younger workers as opposed to a traditional pension plan; however,
DC plans require the employee to bear more of the risk with respect to investments and this may
alleviate the employer from a larger financial obligation (Hacker, 2002). In 1989, Mitchell and

60
Smith reported that more than 95.0 percent of public sector employees who had access to an
employer-sponsored retirement plan were part of a defined benefit plan. When comparing public
to private compensation levels, benefits seem to have become a focal point for many researchers
examining this topic. In a publication on other post-employment benefits (OPEB), Poulson and
Hall (2011) discuss the need for states to shift from DB to DC plans for public employees.
Poulson and Hall (2011) ask why ―more tax dollars are being used to finance pensions and health
benefits for public sector retirees that are more generous to those available to employees in the
private sector?‖ There are a limited number of institutions that provide state-level data to assist
policymakers with determining appropriate benefits and wages for public workers.
Employer-Sponsored Healthcare
Healthcare benefits have traditionally been provided by employers on a fee-for-service basis,
meaning that the employee receives treatment on their own and is reimbursed for the cost of that
service through the benefit plan. Beginning in the 1980s, the fee-for-service employer-provided
healthcare plans started to integrate cost containment measures such as managed care (which can
restrict access to certain healthcare services or direct costly services to less costly locations) into
the benefits package (Burke and Jain, 1991). Crimmel (2011) outlines three basic employer-
sponsored health insurance coverage options: single coverage (solely for employee), employee-
plus-one coverage (for the employee and one family member), and family coverage (for the
employee and one or more family members). Healthcare benefits provided by the employer
provide workers with access to healthcare for a variety of reasons: to promote productivity by
encouraging health, to protect themselves from financial losses that occur when a worker
becomes ill, and to recruit prospective employees (EBRI, 2009).
Crimmel (2011) specifically focuses on private sector employer-sponsored healthcare, citing the
percentage increase in employee contributions by coverage type for employer-sponsored health
insurance in the private industry between 2001 and 2009. Following an assessment of all three
coverage types in the private sector, Crimmel (2011) found that changes in employee
contributions to healthcare plans were much greater than the changes in premiums.
The Employee Benefits Research Institute (EBRI) performed an analysis on public sector
employer-provided healthcare benefits using Current Population Survey (CPS) - March 2006
Supplement - data. The EBRI (2009) found that in 2005, 76.5 percent of federal workers, 74.9
percent of state government workers, and 73.9 percent of local government workers received an
employer-sponsored healthcare plan. These coverage percentages can be contrasted with 54.0
percent of private-sector workers covered that same year. EBRI (2009) identifies one salient
characteristic of public-employee group health plans as the employees attain eligibility to
participate in such healthcare plans upon hiring. In 2002, long-term care insurance became
available to federal employees, annuitants, and their families (such as coverage of nursing home
care, assisted living facility care, hospice, etc.) who are unable to care for themselves (EBRI,
2009).
It is also noted that healthcare costs have continued to rise for both public and private employers,
even when managed care arrangements are implemented (EBRI, 2009 and Hacker, 2002). Public
sector group health plans often encourage employees to opt for HMOs (health maintenance
organizations) by providing financial incentives for them to do so (EBRI, 2009). The EBRI brief

61
(2009) concludes with stating that most public-sector employment-based group health plans have
―ceased to offer traditional indemnity coverage altogether, relying instead on managed care
arrangements.‖ Traditional indemnity is another term for the ―fee-for-service‖ model, essentially
referring to a healthcare plan in which payments are immediate and oversight is limited.
Time-Off
The BLS (1992) reported that large private firms and governments tend to offer more generous
provisions for employee leave. The survey data was collected from full-time employees only
and specifically looked at formal time-off plans with the understanding that smaller
establishments may offer time-off on a more informal, discretionary basis. Other notable
findings include:
Public sector workers receive more time-off for formal personal leave plans;
Leave benefits are costly to employers; it was estimated that in March 1991, 3.4 percent
of total compensation for employees in private industry was directly due to paid vacation
benefits and an additional 2.3 percent was due to paid holidays, while 0.3 percent was
due to other paid leave benefits;
Public sector employees were more likely to have access to paid military leave than
private sector employees; and
The incidence of unpaid parental leave was more frequent for public employees. The
incidence of paid parental leave was more frequent for employees in medium and large
private sector firms, but representative of a small percentage of employees. The BLS
1991 estimates indicated that paid maternity leave was offered to 3.0 percent of
employees and paid paternity leave was offered to 1.0 percent of its employees.
Methodology
Researchers traditionally use the Current Population Survey (CPS), a monthly survey of 50,000
to 60,000 households conducted by the BLS, to extract employment statistics data. It is important
to note that the conclusions drawn by different researchers may be linked to methodology.
Generally, researchers use human capital studies or comparability analyses to compare the two
sectors. The cross-sectional human capital method is often used to compare public sector
workers to private sector workers with similar skill sets and demographic factors such as sex,
age, race, and education. Results can vary from study to study depending on factors such as
sample size and cross-sectional human capital parameters. Comparability analyses assess
differences in the average pay of workers in the same occupation between sectors. Results can
also vary with this methodology if researchers do not use the same factors to calculate the
average wage rates used in the study.
Keefe (2010) utilized the Integrated Public Use Microdata Series (IPUMS) of the March
Supplement to the CPS for a compensation study performed by the Economic Policy Institute
(EPI). Other researchers have examined the Bureau of Economic Analysis (Edwards, 2010),
which breaks down the term ―employee compensation‖ into a few different categories: wages
and salaries, paid leave, supplemental pay, health insurance, other insurance, defined benefit
retirement plan, defined contribution retirement plan, and legally required benefit. Using such
subcategories, Edwards (2010), referred to BLS statistics to draw conclusions regarding total
employee compensation using a limited scope of public and private sector occupational titles:

62
―management and professional,‖ ―sales and office,‖ and ―service.‖ Edwards (2010) found that
BLS data showed higher average public sector compensation than the BEA data.
Bender and Heywood (2010) found that public employees receiving 11.0 percent to 12.0 percent
less than their private sector counterparts while utilizing a ―standard comparability exercise‖
with CPS data. While holding education and other demographic characteristics, such as age, the
same, the initial findings of higher wages in state and local government was demystified (Bender
and Heywood, 2010). Researchers will often adjust certain measurements that are seemingly
―intangible‖ to argue a specific point – as in the case of Biggs and Richwine (2011). As a result
of implementing at 6.0 percent baseline value for public sector job security, Biggs and Richwine
(2011) found that state and local compensation levels can be up to 30.0 percent higher than
private sector compensation levels. The theory behind creating a value for job security is based
on a labor economics theory that workers with a ―comparatively low probability of being
discharged should accept lower wages than workers with a greater chance of being discharged‖
(Biggs and Richwine, 2011). Biggs and Richwine (2011) included the job security measurement
under the assumption that job security is much higher in the public sector than the private sector.
For example, in the case of public sector employees in California, Biggs and Richwine (2011)
provided an additional 15.0 percent of the original compensation to factor in job security. The
basic assertion in this study is that public employees are afforded a higher risk aversion, but state
that ―perhaps the 15.0 percent is too high or too low – we are open to alternative estimates‖
(Biggs and Richwine 2011).
Another compensation study by Richwine (2011) examined workers who had transitioned from
private to federal employment and found average pay increases ranging from 10.0 percent to
20.0 percent. Richwine (2011) argues that cross-sectional human capital methodology only
looks at a single point in time, which can create misleading results, such as in the case of Keefe‘s
compensation study (2010). One of the flaws with this particular methodology is unilateralism
of the career path. If the only cohort being studied is the group of individuals moving from the
private sector into the public sector (and only at the federal level), then factors such as years of
experience and salary requirements may be left out of the equation. Richwine (2011) states that
―when a person switches jobs, he may do so because he received a new training or moved to a
new location, but his underlying personality traits likely remain the same.‖ This was the method
employed by Richwine (2011) for controlling demographic characteristics – by assuming that
they remain the same.
The varying methodology between Keefe (2010) and Richwine (2011) illustrates the differing
approaches to compensation and the contentions between policy-minded organizations. Benefits
tend to be the most difficult part of compensation to measure accurately and place value upon.
Benefits are not only complex and individualized, but some argue that there is no true way of
comparing public and private benefits. A single benefit, such as job security, may not have a
measurable (let alone comparable) value. Specifically, Richwine states that Keefe‘s
methodology was flawed in the sense that it failed to include retiree health benefits, undervalued
pensions, and did not account for job security as a factor in total compensation. This report
argues that job security alone is approximately 15.0 percent more compensation for a public
sector employee in California – however the valuation of job security is not entirely clear. This
assumption is drawn from labor economics based upon the theory that employees will accept a

63
lower level of pay for a lower probability of being discharged from their occupation. Scholars
such as Keefe (2010) and Bender and Heywood (2010), who use cross-sectional human capital
methodology, would argue that the more accurate measurements lie in demographics rather than
an inclusion of a valued ―job security.‖
Thompson and Schmitt (2010) used a slightly different methodology in their study on New
England ―wage penalties‖ incurred by local and state government workers. Using ―quantile
regression analysis,‖ the effect of being classified as a state or local government employee on
wages for workers was applied across a set wage distribution. The wage distribution was
classified in percentiles, and showed that the lowest-wage workers (those in the 10th
percentile of
the wage distribution) working in state and local governments in New England were paid almost
5.0 percent less relative to their private sector counterparts (Thompson and Schmitt, 2010). The
wage differential approach is unique and rarely used by compensation analysts. Because it gives
a clear illustration of how wages relate to one another between sectors, it has the potential to be a
very valuable determinant of public and private sector compensation.
Whether one is examining compensation at the federal level or the state/local level can also
drastically impact research. Federal employees can reach the highest levels of career
advancement within the government, and, therefore, have access to the highest paying
government jobs. Because of this, federal employment comparison is more appropriately
compared to individuals in the private sector working for large, national corporations. Such
comparisons are challenging due to the nature of the positions and the disparities between
occupations and industries, especially in an economic downturn. Compensation of public
employees compared to private employees should be examined at the state and local level for the
most accurate apples-to-apples comparison (Keefe, 2010).
Demographic Considerations
Comparing public to private sector compensation alone can also be misleading if demographics,
such as education and age, are not taken into consideration. For example, public sector workers
tend to generally have higher degrees and are older (which translates into more years of
experience in a given field) than the private sector as a whole both nationally and at the state-
level. Keefe (2010) describes education as being the ―single most important earnings predictor‖
in both the public and private sectors. Bender and Heywood (2010) suggest that the education
variable plays a large role in determining comparability between public sector and private sector
positions – and that this variable is vastly underestimated by other researchers performing
analysis on compensation. They note that employees in state and local government are twice as
likely as private sector counterparts to have a college degree or an advanced degree, and that
factor alone can be a major determinant in explaining the compensation differences between the
two sectors. Bender and Heywood (2010) use educational variables in their analysis of public
and private sector compensation in their determination that, ―while public sector employees
experience a greater share of benefits of their compensation packages, they still experience lower
overall compensation compared to the private sector.‖
A 1995 study examining college graduates employed with jobs that they are overqualified for
found that (Tyler, et al. 1995) in the 1980s, a wage gap between those with high school diplomas
and those with college degrees had widened substantially. Tyler, et al. (1995) concluded that
64
there will inevitably always be college graduates working in jobs that only require a high school
education, and the growing college labor supply is indicative of this fact. In the 1980s, the
college labor supply grew by 60.0 percent. Following such demographic trends in education
such as a growing percentage of college graduates is necessary to understand historical changes
in the labor market. Hecker (1995) refuted the study by Tyler, et al. (1995), calling for a focus
on the comparison between bachelor‘s degrees, associate‘s degrees, post-high school
certification and other educational programs. Median earnings of college graduates are higher
than high school graduates, but Hecker (1995) asserts that there are other factors at play, such as
school attended, fields of study, and other college-related factors.
A report by William D. Eggers (2007) and published by Deloitte on public sector employment
trends discusses the challenges in attracting young, talented individuals to the public sector as a
―graying‖ of the public sector workforce occurs. The ―graying‖ refers to an aging workforce –
most notably, in the public sector. Eggers (2007) suggests that the gap between ―supply of and
the demand for skilled government workers‖ is projected to grow in coming years. The high
volume of individuals of the baby boomer generation in government means that the number of
retirees is expected to rise rapidly.
The government is projected to lose a number of senior-level executives, resulting in a lack of
leadership across top levels of government. Eggers (2007) refers to this as an ―impending talent
gap‖ in which changing job expectations between generations and the need for new skill sets will
create workforce challenges for the public sector. A shortage of mid-career talent coupled with
traditional hiring practices centered on seniority presents a problem for future generations of
public sector employees. The private sector‘s ability to outperform the public sector in attracting
and retaining top talent by adapting to the changing demands of new workers (who tend to prefer
a work/life balance and job flexibility over competitive salaries and long hours in the office) will
further exacerbate what scholars refer to as a ―brain drain‖ in the public sector (Phillips, 2011).
Conclusion
Although research appears to be divided on a few noteworthy issues – appropriate compensation
comparisons between sectors, educational variables, and total compensation packages – there are
some areas of research that seem to have common ground. Most of the scholars studied for this
literature review agree that benefits constitute the majority of compensation packages for public
workers, that unions influence the process of determining compensation, and that the private
sector tends to be more successful with regard to attracting and retaining younger talent. This
literature review provides a substantive background on previous research performed on
compensation between sectors and aims to serve as a basis for state-level compensation research
to be conducted by RIPEC.

65
References
Bender, Keith, and John Heywood. (2010). ―Out of Balance? Comparing Public and Private
Sector Compensation over 20 Years.‖ Center for State & Local Government Excellence, and the
National Institute on Retirement Security.
Biggs, Andrew and Jason Richwine (2011). ―Public Sector Compensation: Correcting the
Economic Policy Institute, Again.‖ The Heritage Foundation.
Burke, Thomas P., and Rita S. Jain. (1991). ―Trends in employer-provided healthcare benefits.‖
Monthly Labor Review, February 1991.
Crimmel, Beth Levin. (2011). ―Changes in Premiums and Employee Contributions for
Employer-Sponsored Health Insurance, Private Industry, 2001-2009.‖ Medical Benefits.
Statistical Brief #325, June 2011.
Edwards, Chris. (2010). Public Sector Unions and the Rising Costs of Employee Compensation.
Cato Journal, 30, 1. 87-115.
Eggers, William D. (2007). ―The Graying Government Workforce.‖ Deloitte Public Sector
(2007): 1-4. Deloitte Research - Public Sector.
Employee Benefit Research Institute (EBRI). (2009) ―Employment-based health benefits in the
public sector.‖ Fundamentals of Employee Benefit Programs – 6th
Edition.
Fogel, Walter and David Lewin. (1974). Wage Determination in the Public Sector. Industrial
and Labor Relations Review, 27, 3. 410-431.
Hacker, Jacob S. (2002). The Divided Welfare State: The Battle Over Public and Private Social
Benefits in the US. Cambridge University Press.
Hecker, Daniel E. (1995). ―College graduates in ‗high school‘ jobs: a commentary.‖ Monthly
Labor Review, December 1995.
Keefe, Jeffery. (2010). ―Debunking the Myth of the Overcompensated Public Employee.‖ Issue
brief no. 276. Economic Policy Institute Publication, September 2010.
Miller, Michael A. (1992). ―Time-off benefits in small establishments.” Monthly Labor Review.
115, 3. 3-8.
Mitchell, Olivia S. and Robert S. Smith. (1989). ―Pension Funding in the Public Sector.‖ The
Review of Economics and Statistics.
Moore, William J. and John Raisian. (1987). ―Union-Nonunion Wage Differentials in the Public
Administration, Educational, and Private Sectors: 1970-1983.‖ The Review of Economics and
Statistics.

66
Phillips, Lucy. (2011) "Cuts to Public Sector Could Lead to 'Brain Drain' from North and
Midlands.‖ Public Finance — Official CIPFA Magazine. Date Accessed: 20 July 2011.
<http://www.publicfinance.co.uk/news/2011/02/cuts-to-public-sector-could-lead-to-brain-drain-
from-north-and-midlands/>.
Poulson, Barry W., and Arthur P. Hall. (2011)."Public Employees "Other Post-Employment
Benefit" Plans: A Case for Shifting to a Defined-Contribution Approach." American Legislative
Exchange Council.
Quinn, Joseph F. (1979). ―Wage Differentials among Older Workers in the Public and Private
Sectors.‖ The Journal of Human Resources, 14, 1. 41-62.
Richwine, Jason. (2011). "Same Worker, Higher Wage: A Study of Workers Who Switch from
Private to Federal Employment." The Heritage Foundation 11.02
Thompson, Jeffery and John Schmitt. (2010) ―The Wage Penalty for State and Local
Government Employees in New England.‖ Political Economy Research Institute at University of
Massachusetts Amherst. September 2010.
Tyler, John, Murnane, Richard J., and Frank Levy. (1995). ―Are more college graduates really
taking ‗high school‘ jobs?‖ Monthly Labor Review, December 1995.