Private Sector Development and Governance Sector Development and Governance in Ghana Freda Asem...
43
Working paper Private Sector Development and Governance in Ghana Freda Asem Matthias Busse Robert Osei Magdalene Silberberger April 2013
Transcript of Private Sector Development and Governance Sector Development and Governance in Ghana Freda Asem...

Working paper
Private Sector Development and Governance in Ghana
Freda Asem Matthias Busse Robert Osei Magdalene Silberberger April 2013

Private Sector Development and Governance in Ghana
Freda Asem, Matthias Busse*, Robert Osei*, and Magdalene Silberberger
*Corresponding authors, Robert Osei: phone +233-21-501182 extension 118, e-mail: [email protected]; Matthias Busse: phone +49-234-32-22902, e-mail: [email protected]. This paper is an output of the International Growth Centre (IGC). We would like to thank Mr Sam Poku, Dr Joe Abbey and Prof Ninsin for sharing with us wonderful insights on various aspects of the economy of Ghana.

2
Contents
1. Introduction
2. Private Sector Development and Regulations: A Cross-Country Analysis 2.1 Variables and Methodology
2.2 Empirical Results
3. Private Sector Development and Regulations: Country Case Study Ghana 3.1 Performance of Ghana with Respect to Private Sector Development and Regulation
Indicators
3.2 History of Regulatory Reforms in Ghana
3.3 Importance of the Private Sector in the Quality of Regulatory Environment in Ghana
4. Conclusions and Policy Recommendations
Literature
Appendix

3
1. Introduction
“Good governance is perhaps the single most important factor in eradicating poverty and
promoting development.” (Kofi Annan, former United Nations Secretary General)1
Starting in the 1990s, it has been increasingly recognised around the world that governance
matters for economic and social development – that institutions, rules and political processes
play a major role in influencing whether economies grow, whether poverty is persistent,
whether children attend school, and whether human development moves forward or backward
(Engerman and Sokoloff 1997, Acemoglu et al. 2001, World Bank 2005).
On the other hand, opinions differ on how to improve governance in a country. While some
scholars believe that large amounts of foreign aid can enhance the quality of governance
(Sachs 2005), others stress the importance of history, social norms or political factors, such as
democracy or leadership (Easterly 2006, Acemoglu and Robinson 2012). As further drivers of
change in governance, researchers have analysed the importance of IMF and World Bank
programmes (Boockmann and Dreher 2003, Dreher and Rupprecht 2007), international trade
(Acemoglu et al. 2005, Levchenko 2011), or the impact of reforms in neighbouring countries
(Gassebner et al. 2011).
While the importance of regulations generally recognised, opinions differ on what really
drives changes in governance. In particular, the economic drivers of change in governance –
apart from international trade – have not received much attention in the literature. In this
study, we examine the role of the private sector, that is, whether or not the private sector is an
important driver of change in governance. In contrast to external pressure (e.g., by the World
Bank or the IMF) or foreign aid, we argue that local ownership is more likely to be ensured if
the private sector as an important stakeholder in society seeks improvements in governance.
What is more, private firms usually know much better than foreign advisors the kind of
business environment they need to compete on world markets. The changes in governance
they aspire are then more successful in terms of efficiency and sustainability.
1 United Nations (1998).
4
Within the broad area of governance, we are particularly interested in business regulations,
namely, government regulations of labour, product and financial markets. These include, for
example, hiring and firing regulations, restrictions on ownership of banks, or costs of
compliance with regulations. Simple and transparent regulations lower transaction costs of the
private sector, which then can operate more efficiently. Private investment is likely to increase
and entrepreneurship is boosted, as high-quality regulations reduce the cost of doing business.
Regulations are thus likely to be high on the agenda of the private sector when it comes to
improving governance.
To the best of our knowledge, no previous study has attempted to examine the business-state
nexus with respect to the influence of the private sector on business regulations (or even
governance in general) in a comprehensive way. We thus attempt to fill this important gap in
the literature and explore in more detail the economic drivers of change in business
regulations. Our approach is twofold: We first investigate the business-state nexus in a
quantitative analysis using a cross-country empirical investigation. In a second step, we focus
on Ghana using qualitative methods. Ghana has been chosen for the country case study, as the
country has achieved considerable progress in terms of its quality of government regulations
over the last 25 years. It is therefore important to know whether or not the Ghanaian private
sector has influenced the business climate in the past.
We examine three main hypotheses: The first one states that the private sector has a positive
influence on the quality of government regulations and that this influence is more effective as
opposed to external pressure or that induced by foreign aid. We argue that an improvement in
the quality of regulations due to pressure by the private sector is much more helpful in
shaping the regulatory framework a developing country like Ghana needs. Above all, if
Ghanaian companies lobby for high-quality regulations that enable them to compete on world
markets, a positive governance-growth nexus can be created. In other words, if the regulatory
quality is improved, Ghanaian firms can grow much faster, and subsequently demand further
improvements in the regulations. This could be extremely beneficial for the long-run
development of the Ghanaian economy.
The second hypothesis proposes that the private sector has to reach a critical size to have any
influence on policy makers. If the private sector is too small, a significant and positive impact
on the quality of regulations cannot be expected. We examine different threshold levels for
5
the critical size of the private sector for all countries and look into the Ghanaian private sector
in more detail.
Finally, the third hypothesis suggests that the impact of activities of the private sector on
regulatory quality could well be negative. Depending on the circumstances of the particular
sector, such as the type of product involved, profit margins and competition intensity, the
private sector might prefer a situation where business regulations are complex and costly. In
other words, the private sector could prefer a situation where the regulatory environment is
dominated by closed and disordered deals. For example, costly and time consuming market
entry regulations favour incumbent firms. Existing firms might thus have an incentive to leave
the status quo unchanged or even try to prevent the entry of competitors by making
regulations more complex.
The study is divided into two main parts. The first part consists of an econometric analysis of
the main determinants of changes in government regulations over time and across countries
(Section 2). Using a quantitative approach for more than 100 countries and a relatively long
period (35 years), we identify the main drivers of change in government regulations across
countries. We include all relevant (political and economic) variables that could have an
impact on changes in regulations. As for private sector activities, we use different proxies that
capture the extent and influence of the private sector in a country.
In the second part, we undertake an in-depth analysis of the political economy of changes in
governance in Ghana (Section 3). We start by comparing the quality of regulations in Ghana
vis-à-vis other sub-Saharan African or developing countries (benchmarking). We then
examine in more detail the changes in Ghanaian regulations over the past 30 years and try to
analyse the drivers of change. Again, we distinguish between political and economic drivers
of change. In line with the first part, the main focus is on the influence of private enterprises
or business associations on changes in the government regulations. In this part, we use a
mainly qualitative approach, based on interviews with stakeholders in the sector and existing
literature.
The study ends with a summary of the main results and various policy implications for policy
makers and stakeholders in Ghana (Section 4).

6
2. Private Sector Development and Regulations: A Cross-Country Analysis
What is the role of the private sector in changes in the quality of regulations? To answer this
key question, this section uses an econometric analysis in a cross-country setting that includes
variations over time (panel data analysis). That approach is useful to examine the links
between the private sector and changes in regulations for a large number of countries, not
only Ghana. In a first step, we describe the specific methodology, the data sample and the
variables used. Subsequently, we present and explain the results.
2.1 Variables and Methodology
While there are many indicators available for measuring business regulations, most of them
are either restricted to recent years or do not measure business regulations precisely enough.
For example, the comprehensive Good Governance indicators provided by the World Bank
(2012b), which include the quality of the bureaucracy, are available only since 1996.
Similarly, in 1995 the Heritage Foundation (Miller and Holmes 2011) started publishing the
“Index of Economic Freedom”, including the indicator “Regulatory Efficiency”, which is
hardly sufficient for a panel analysis over time. Especially when looking at a causal
relationship between private sector development and regulations, profound data can be crucial
for robust results.
The most detailed set of business regulations indicators for a longer period of time is
compiled by the Fraser Institute. In their annual report Economic Freedom of the World
(Gwartney et al. 2012), they provide extensive data on different dimensions of economic
freedom. More than forty variables are employed to construct an overall summary index as
well as to measure the degree of economic freedom in five broad areas: the size of
government, the legal structure and property rights, access to sound money, freedom to trade
internationally, and regulation of credit, labour and business.
The fifth indicator, regulation, is used in this study as a proxy for the quality of business
regulations. As briefly mentioned in the previous section, this indicator includes a broad range
of subjective and objective sub-indicators for regulations that affect firms in various ways in
terms of labour, product and credit markets. Examples include hiring regulations and
7
minimum wages, mandated costs of worker dismissal, market entry barriers, licensing
restrictions, or bureaucracy costs.2 All of these regulations are highly relevant for private
sector development. The overall regulation indicator, which is published for more than 140
countries, ranges from 1 (low) to 10 (high quality regulations) and is available for five-year
intervals from 1970 to 2000 and annually since then. We use changes in the indicator over
time (five-year periods) as we are primarily interested in the drivers of change in regulations
rather than the determinants of levels of regulatory quality. For example, we use the level of
the regulation indicator in 1975 and subtract the 1970 value to obtain changes in regulations
for that period.3 The variable is labelled RegulationChange.
In the analysis, we focus on the period 1970 to 2005. While we do have data for the most
recent period 2006-2010, we prefer to exclude that period as the data is likely to be affected
by the financial and economic crisis in 2008/2009. This applies in particular to private sector
and other economic variables. Any results from an empirical investigation that includes that
period and uses highly cyclical economic data are likely to be biased. We compute five-year
averages for all variables, which leaves us with seven time periods.
To find out what drives changes in regulations, we include a broad set of independent
variables. As mentioned before, our main interest is to investigate the influence of the private
sector on regulatory quality. While we would have preferred to use the share of the private
sector in total Gross Domestic Product (GDP) as a measure for private sector development (or
size), exact figures for this indicator are frequently not available in developing countries. As a
remedy, we use three proxies. To begin with, we use the total credit provided to the private
sector in percent of total GDP (PrivateSectorCredit). Needless to say, that variable captures
only part of the total size of the private sector. For example, small entrepreneurs in the
informal sector are not likely to have access to (formal) private sector credit but rather use
microcredits (if at all). On the other hand, small firms are less likely to be able to influence
the regulatory environment in a country. Mid-sized and larger firms form the formal sector,
which do have access to credit, are then the potential drivers of change. As a consequence,
PrivateSectorCredit is likely to be an adequate proxy for the extent of the activities of the
private sector in an economy in a given period and is thus used as our main variable.
2 Appendix A provides information on the detailed variables used by the Fraser Institute to compute the regulation indicator. 3 More exactly, we use that figure for the period 1971 to 1975 as we use 5-year averages for all other variables.
8
The second proxy is international trade, that is, the sum of total exports and imports of a
country divided by its GDP (Trade). From a theoretical perspective, there are two main
channels through which openness to trade could affect regulatory quality (governance) in a
positive way. Firstly, economic agents in open economies may learn from the experiences in
their trading partners’ countries by adapting (or imitating) successful regulations (and
institutions). Secondly, international competition may force countries to improve their
regulatory setting as domestic producers would go out of business without reforms. Thirdly,
rents from international trade makes merchants well off and enable them to exert political
power.
There is empirical evidence for these linkages. Learning from a historical case study,
Acemoglu et al. (2005) argue that international trade can indeed be a powerful driver of
change in governance. According to their results, the booming transatlantic trade in the 16th
and 17th century induced institutional changes by strengthening merchant groups and
constraining the power of the monarchy in England. Importantly, trade enabled merchants to
obtain stronger property rights which were then the key to subsequent economic growth. This
result has been supported by Levchenko (2011) who shows both in a theoretical and empirical
analysis that international trade can enhance the quality of institutions, including the rule of
law or property rights protection.
While the variable Trade captures the extent of international links of the private sector, it
could include trade of government-owned firms and might therefore be biased. Still, most of
the trade is conducted by private firms, which applies in particular to non-resource trade. We
thus use trade as an additional proxy for private sector development.4
The third and final proxy is foreign direct investment, measured as a share of the recipient’s
GDP (FDI). Similar to trade, we explore the international links of the private sector in the
form of activities of foreign-owned firms in the host country. Yet not all foreign
multinationals are private firms. If they are state-owned, they officially do not belong to the
4 In additional regressions, reported in Table 4, we differentiate between resource and non-resource trade. The distinction might matter as non-resource trade, e.g., in manufactured better captures private sector firms that depend on high-quality regulations for their operations.

9
private sector. On the other hand, the difference between private and state firms may matter
less if they operate abroad and press for changes in regulations.
In addition to these independent variables of main interest, we include a set of further control
variables that are likely to influence changes in the quality of regulations:5
x RegulationLevelt-1 stands for the level of regulations in the previous period. The level is
likely to have an impact on changes in regulations, as the scope for improvements
decreases with better regulations (and higher scores for that variable). Hence, we expect a
negative impact on changes in regulations.
x Growth represents the (real) per-capita growth rate of GDP, which is likely to foster
improvements in regulations; a growing economy strengthens preferences of the local
population for better regulations and generates the required financial resources for the
enhancement (Gassebener et al. 2011).
x Population acts as a proxy for the country size and refers to the total number of people. It
might be easier for a larger country to push through necessary reforms or required rules to
improve regulations, since it possesses a critical financial mass. Yet bigger countries might
face more information asymmetry problems, higher transaction costs, and/or more
intensive ethnical conflicts, which could impede improvements in regulations. Therefore,
the sign of this control variable is unclear.
x PoliticalRegime is an indicator of democracy and autocracy in a country, ranging from -10
(strongly autocratic) to +10 (strongly democratic). Acemoglu and Robinson (2012) argue
that having a democratic government with some degree of centralisation of power, and/or
forms of pluralism in society are necessary preconditions for (what they define as)
inclusive political institutions. Dispersed political power that exists in democracies is
conducive to contestability and competition, which then create the conditions for broadly
shared prosperity through inclusive economic institutions. The latter includes high-quality
regulations to foster private investment and to encourage entrepreneurship. While we
cannot control for all three political factors, we focus on the most important one, that is,
5 Data sources and descriptive statistics can be found in Appendices B and C.
10
the political regime of a country in form of democracy or autocracy. We thus expect
PoliticalRegime to have a positive impact on RegulationChange.
x Education refers to educational attainment levels, quantified by the average years of
schooling of the population 25 years and older. A higher score is expected to have a
positive impact on regulations, as a better educated population is more likely to participate
in (public) decision making and to demand better regulations (governance). In a
democratic society, the impact of educational attainment on regulatory quality is even
more pronounced as citizens are able to demand accountability of the government.
x Aid quantifies the amount of official development assistance (ODA) a country receives,
measured by total ODA as a share of the recipient’s GDP. Foreign aid could release
governments from binding revenue constraints and enable them to concentrate on
enforcing the quality of regulations; also, it provides developing countries with much
needed technical assistance in building effective institutions to improve regulations (Sachs
2005). On the other hand, due to moral hazard problems and rent seeking, high levels of
aid could delay or block necessary domestic reforms to improve regulations (Bräutigam
and Knack 2004, Heckelman and Knack 2008). Hence, the net impact of foreign aid on
regulatory quality is unclear at the outset.
Finally, we include year dummies for each time period to capture both a time trend and
special developments within a particular period that are not caused by factors included in our
analysis.
In our analysis, we have incorporated all countries for which we obtained sufficient data for
the dependent and independent variables. That leaves us with a sample of 109 countries,
including 79 developing countries.6 We use the World Bank classification for developing
countries. To ensure that countries that were growing rapidly over the last couple of decades
belong to the group of developing countries in our analysis, we attempt to classify developing
countries at the beginning of our analysis rather than at the end. Yet the following results
hardly change if we use the classification in 2010. It is important to note that no generally
6 See Appendix D for the country sample.

11
accepted classification of developing countries existed before the 1980s. We define a country
as developing if its GDP per capita was US $6,000 or below in 1987 (World Bank 2011).
We take the natural logarithm of most variables to reduce the skewness in the data. The
average score for RegulationChange is positive and slightly higher in developing countries in
comparison to high-income countries (Table 1). The reason for that is the fact that developed
countries have better regulations in the first place and hence, less scope for further
improvements. What is more, developing countries – on average – provide considerably less
credit to their private sector, are as open to trade as developed countries and receive similar
amounts of foreign direct investment (as a share of GDP).
Table 1: Mean for Main Variables and Country Groupings, Period 1970-2005 Variable All
countries Developed countries
Developing countries
RegulationChange 0.24 0.22 0.25
RegulationLevel 5.92 6.54 5.65
ln PrivateSectorCredit 3.38 4.11 3.07
ln Trade 4.06 4.05 4.06
ln FDI -0.06 -0.06 -0.07
Growth 3.40 3.17 3.5
ln Population 16.37 16.35 16.38
ln Education 1.81 2.15 1.66
PoliticalRegime 3.12 6.75 1.58
ln Aid 0.57 -1.331 0.71
No. of Countries 109 30 79
Notes: 1The negative figure is due to the fact that a few developed countries were classified as developing countries in the past and received (small) amounts of foreign aid in the period under consideration, which has partly been repaid. Also, the natural logarithm has been taken.
Apart from the population size, educational attainment and the political regime, all
independent variables are likely to be endogenous, that is, they have an impact on changes in
the quality of regulations but they are influenced by RegulationChange too. Above all,
various studies have shown that better regulations will lead to enhanced growth rates, more
trade and FDI, and improved private sector credit (World Bank 2005, Jütting 2003, Levine
2005). This calls for an appropriate instrumental variable approach. By using such a method,
we employ other variables (instruments) to explain variations in the endogenous variables
which then can explain differences in the dependent variable of main interest.

12
As an appropriate method, we use a dynamic GMM panel estimator (system-GMM) that
allows us to analyse changes across countries and over time (panel analysis), while effectively
dealing with reverse causality by using a set of instruments for the endogenous variables.7
One of the main advantages of the system-GMM estimator is the fact that it does not require
any external instruments other than the variables already included in our dataset. In fact, it
uses lagged levels and differences between two periods as instruments for current values of
the endogenous variable, as shown in Figure 1. In that figure, “Private Sector” represents the
three different proxies for private sector development (PrivateSectorCredit, Trade, FDI). For
the PrivateSectorCredit variable and period 1995 to 1999, for example, the system-GMM
method uses as instruments (a) levels of PrivateSectorCredit, that is, data for the period 1990-
1994 and previous periods, and (b) differences in PrivateSectorCredit, namely, differences
between the periods 1990-1994 and 1995-1999 (and preceding differences).8 Importantly, the
estimator does not use lagged levels or differences by itself for the estimation, but rather
employs them to instrument the variation in the private sector development variables in a
given period to explain variation in the change in the regulations indicator. This approach
ensures that all information is used efficiently and that we concentrate on the impact of
private sector development on changes in regulations and not vice versa.
7 Appendix E provides a more formal presentation and further (technical) details on the estimator used. 8 In fact, the system-GMM approach consists of a simultaneous estimation of two equations; one in levels and another in differences (see Appendix E).

13
Figure 1: Estimation Strategy
2.2 Empirical Results
Following the introduction of the variables and the econometric method used, we now turn to
the empirical results. We begin with the first hypothesis, stating that the private sector
exercises pressure on the government which leads to an improvement in the quality of
regulations. For a start, we use the entire sample of 109 countries. We always incorporate a
set of control variables, including the level of regulations in the previous period, economic
growth, the size of the country, education attainment, and the political regime.9 We then add
each of the three private sector development variables (PrivateSectorCredit, FDI, Trade)
separately, reported in columns 1-3 in Table 2.
As mentioned above, PrivateSectorCredit is arguably the most appropriate proxy for the size
of the private sector. Yet we do not find any effect on RegulationChange, as the estimated
coefficient is negative but not significant in statistical terms. This suggests that the private
sector is not a major driver of change in regulations, when using this proxy for private sector
development. This result could be interpreted differently: Either the private sector overall
9 Foreign aid is added at a later stage, as the country sample declines significantly once we control for that influence.
Change in Regulations
Private Sector
Control Variables
Instruments
Instruments

14
does not influence regulations or there are considerable time lags involved which are difficult
to capture in such an econometric analysis. For example, a growing private sector is intending
or able to exert its influence only after a more extended period of time, e.g., after 10 or more
years. In that case, the time span under consideration is not sufficient to explore the links
between the private sector and regulations. However, a longer time series is not available.
Next, we examine the impact of international trade on changes in regulations. Similar to
private sector credit, trade does not have an influence on changes in regulations (positive but
insignificant coefficient in column 3). We therefore do not find evidence to support the results
by Acemoglu et al. (2005) and Levchenko (2011), who found a positive influence of trade on
governance/institutions. The diverging results could be explained by two main factors. Firstly,
we focus on business regulations rather than governance or institutions overall. International
trade thus might have an effect on other dimensions of governance that are not included in our
analysis. Secondly, the methodology differs. While Acemoglu et al. (2005) and Levchenko
(2011) use cross-sectional data, our approach includes the time dimension. An investigation
of changes in regulations over time is – from an econometric point of view – much more
demanding and is less likely to yield statistically significant results. Nonetheless, while more
challenging, our approach is potentially more powerful as we explore changes in regulations
over time.
For the activities of foreign firms, we do find a positive and significant impact on
RegulationChange, implying that foreign investors are a driver of change in the quality of
regulations in the country they operate in (column 2).10 This is quite an interesting and
relevant result from a policy perspective. The interpretation of the results is far from obvious.
More speculatively, foreign investors may need a better regulatory environment in
comparison to their domestic competitors, as foreign multinationals are less likely to know
how to do business effectively given existing regulations. In comparison to domestic firms,
they thus have a stronger incentive to press for simple and transparent regulations that reduce
transaction costs. Another possible interpretation is that foreign firms are much bigger and
consequently formal. These firms will invariably be more connected as they deal relatively
10 If a variable has a positive and significant impact on changes in regulations, the coefficient is highlighted in green. Negative and significant coefficients are displayed in red.

15
more with institutions of state. They are therefore likely to be more effective in pushing and
achieving regulatory changes.
Finally, in column 4 we include all three private sector variables at the same time to test the
robustness of previous results. Again, we find the strongest effect for FDI. Although the size
of the coefficient of FDI decreases slightly, it remains significant despite the inclusion of
other private sector variables. This outcome emphasises the fact that foreign firms are an
important driver of change in regulations in their country of operation.
In addition to being statistical significant, foreign direct investment is of economic relevance
for changes in regulations too. Taking the estimated coefficient for FDI in column 2 at face
value, a small increase in the share of foreign investment in GDP by one per cent improves
the score for regulatory quality by 0.196. This is quite a sizable impact and even close to the
average of RegulationChange for each five-year period (0.23). Pressure by foreign
multinationals can thus act as an important driver of change in regulations.11
Concerning our control variables, we find that the level of regulation in the previous period
(RegulationLevelt-1) is indeed very robust and has a negative influence on changes in
regulations. This is in line with our expectation as countries that start off with better
government regulations have less room for improvements. In terms of the regulation
indicator, this implies that, e.g., increasing the score from 3 to 4 is easier than from 8 to 9, as
regulations are of relatively high quality in the latter case, and further improvements are
difficult.
The only other major driver of change in regulations (with a significant and robust positive
impact) is educational attainment. Apparently, a better educated population may exert more
pressure for improvements in regulations. Closely related to education is the political regime,
as democratic countries are more likely to be associated with improvements in regulations.
Yet this effect is not robust as the estimated coefficient for PoliticalRegime is only significant
11 We also tested the impact of FDI stocks on changes in regulations. While we find again a positive and significant impact, significance levels are a bit lower in comparison to that for FDI flows.

16
in one out of four regressions.12 Still, a more democratic regime with a better educated
population may create a more favourable environment for regulatory reforms, as citizens are
more likely to press for changes and the government is more responsive to their demands for
better governance. Finally, the size of a country, proxied by the population, and economic
growth rates are not important drivers of change in regulations.
The results obtained so far have been for the total sample of countries, including both
developed and developing countries. Since the drivers of change may differ in the latter
group, we run the same set of four regressions for these countries (columns 5-8). In
comparison to the full sample, the results are fairly similar for developing countries. Again,
FDI is an important driver of change in regulations in developing countries. The estimated
coefficients are larger, meaning that the impact of the activities of foreign firms on regulations
is even more pronounced. Similar to the full sample, we do not find evidence that the other
two private sector variables (PrivateSectorCredit, Trade) influence regulatory quality in
developing countries.
Again, we find strong evidence for education as a driver of change, but no robust evidence for
economic growth rates. Additionally, the political regime seems to be more important for
developing countries, as the variable is positively significant in two out of four regressions.13
In developing countries, a democratic government is even more associated with political
reforms, including improvements in regulatory quality generally. In terms of the size of the
country, we find a negative coefficient for Population though the coefficients are not always
significant. That indicates that larger developing countries are less likely to better their
regulatory environment. We finally control for foreign aid as another determinant of changes
in regulations, but neither does aid have an impact on RegulationChange nor does its
inclusion change any previous results (columns 9 and 10).14
12 Note, however, that the t-values for PoliticalRegime in the three regressions without significant results are not far from the conventional 10 per cent threshold level. Also, significance levels for that variable improve further once we focus on the developing country subsample (see below). 13 In a third regression, the coefficient is just below the 10 per cent threshold level. 14 This result is in line with inconclusive previous findings; see Dreher and Gehring (2012) for an overview of the literature.

17
Table 2: Private Sector Development and Regulations
Independent variables
Dependent variable: RegulationChange
All countries Developing countries (1) (2) (3) (4) (5) (6) (7) (8) (9) (10)
RegulationLevelt-1 -0.232*** -0.275*** -0.257*** -0.230*** -0.373*** -0.432*** -0.321*** -0.387*** -0.284*** -0.303*** (-4.946) (-7.182) (-5.706) (-4.397) (-5.778) (-7.294) (-6.589) (-6.235) (-5.786) (-7.276) Growth 0.00849 -0.0221 -0.00123 -0.0121 0.0602** 0.0289 0.0260 0.0278 0.0443 0.0318 (0.388) (-0.759) (-0.0640) (-0.517) (2.112) (0.841) (1.077) (1.085) (0.919) (1.101) ln Population -0.00868 0.0453 -0.00361 0.0532 -0.0780** 0.00780 -0.0681* -0.0346 -0.0349 -0.0376 (-0.402) (1.253) (-0.115) (1.018) (-2.496) (0.166) (-1.769) (-0.584) (-0.833) (-0.667) ln Education 0.377*** 0.211*** 0.303*** 0.302*** 0.258*** 0.144 0.315*** 0.192** 0.269*** 0.210** (4.902) (2.876) (4.810) (3.243) (3.707) (1.595) (3.220) (1.967) (2.977) (2.083) PoliticalRegime 0.00843* 0.00776 0.00778 0.00978 0.0119** 0.0148* 0.0105 0.00904 0.00528 0.00568 (1.946) (1.260) (1.385) (1.566) (2.242) (1.933) (1.628) (1.169) (0.886) (0.777) ln PrivateSectorCredit -0.0400 -0.116 0.0609 0.0330 0.0629 (-0.422) (-1.313) (0.614) (0.318) (0.725) ln FDI 0.196** 0.119** 0.256*** 0.196** 0.148*** (2.471) (2.154) (2.843) (2.475) (2.856) ln Trade 0.0815 0.0728 -0.0860 -0.158 -0.279 (0.662) (0.339) (-0.441) (-0.549) (-1.026) ln Aid 0.0156 0.0396 (0.377) (0.884) Observations 547 509 545 505 383 358 384 357 344 322 Countries 109 108 109 108 79 79 79 79 70 70 Hansen Test (p-value)1 0.69 0.08 0.13 0.26 0.56 0.27 0.21 0.33 0.38 0.88 Instruments 38 38 38 76 32 32 32 64 26 65 AB 2 (p-value)2 0.18 0.35 0.15 0.23 0.16 0.35 0.20 0.10 0.12 0.14 Notes: Significance at the 10, 5, and 1 percent level is denoted by *, **, and ***, respectively. Estimation based one two-step system-GMM estimator with robust standard errors; corresponding z-values are reported in parentheses. Constant terms and time dummies are always included but not reported. 1 Hansen-test of overidentification. 2 Arellano-Bond-test that second-order autocorrelation in residuals is 0; first-order autocorrelation is always rejected (not reported).

18
While we find only for FDI a positive effect on changes in regulations but not for the two
other proxies for private sector development, it can be argued that the private sector has to
reach a critical size in order to have any impact on policymakers and thus press for changes in
regulations or governance in general. This is our second hypothesis, which can be tested
empirically by using different threshold levels for private sector development. We sort all
countries in our sample according to the respective size of each private sector variable and
then split the sample into top and bottom performers. For example, we identify those
countries that belong to the best 25 per cent for each variable (Top25PrivateSectorCredit,
Top25FDI, and Top25Trade) and the respective bottom 75 per cent
(Bottom75PrivateSectorCredit, Bottom75FDI, and Bottom75Trade). Thereafter, we include
both (top/bottom) variables and run our baseline regressions.
The results for this particular cut-off point are reported in Table 3. The outcome supports the
finding from the previous table, as the results do not differ much from those in the baseline
regressions in Table 2. Even for the top 25 per cent performers for PrivateSectorCredit and
Trade, we do not find any impact on changes in regulations. That applies to the full sample as
well as the developing country sample. Again, we find positive and significant results for FDI.
For developing countries (column 5), we even find a positive impact in those countries that do
not receive much FDI (bottom 75). For countries that belong to the most attractive locations
for FDI (top 25), the effect is much higher as the size of the estimated coefficient is more than
twice as large as in the bottom 75 countries. In other words: The more FDI a country receives,
the more likely it is that foreign firms act as a driver of change in regulations and the stronger
their pressure for change.
Needless to say, these results could have been influenced by the arbitrarily chosen cut-off
point. To account for this, we use various threshold levels, e.g., top 10 per cent versus bottom
90 per cent, 20/80, 30/70, 40/60, 50/50, etc., but the results hardly change.15 We also employ
the top/bottom cut-offs in the form of dummies and interact these with our private sector
variables, but the results again do not differ. We conclude that no support for the second
hypothesis can be found. The exception, again, is foreign direct investment with stronger
pressure for change in those countries that receive more FDI.
15 All results that are not reported are available upon demand from the corresponding authors.

19
Table 3: Private Sector Development and Regulations: Different Cut-off Points
Independent variables
Dependent variable: RegulationChange
All countries Developing countries (1) (2) (3) (4) (5) (6)
RegulationLevelt-1 -0.258*** -0.270*** -0.349*** -0.335*** -0.393*** -0.361*** (-6.030) (-7.489) (-7.126) (-5.813) (-7.341) (-6.388) Growth 0.0251 0.0154 0.0229 0.0434** 0.0354 0.0424* (1.050) (0.610) (1.234) (2.497) (1.147) (1.769) ln Population -0.0313 0.00235 -0.00246 -0.0604** 0.00218 -0.0348 (-1.451) (0.0992) (-0.0734) (-2.147) (0.0514) (-0.753) ln Education 0.332*** 0.293*** 0.195** 0.313*** 0.114 0.244** (5.391) (4.531) (2.405) (4.829) (1.061) (2.557) PoliticalRegime 0.0107** 0.00854* 0.0115* 0.0156*** 0.0149** 0.0105* (2.404) (1.671) (2.230) (2.778) (2.093) (1.695) ln Top25PrivateSectorCredit 0.0104 -0.0124 (0.156) (-0.139) ln Bottom75PrivateSectorCredit -0.00569 -0.0214 (-0.0769) (-0.214) ln Top25FDI 0.133* 0.328*** (1.653) (2.811) ln Bottom75FDI 0.0557 0.155* (1.073) (1.786) ln Top25Trade 0.132 0.0634 (1.035) (0.300) ln Bottom25Trade 0.0649 -0.0215 (0.474) (-0.0873) Observations 547 509 437 583 358 384 Countries 109 108 90 79 79 79 Hansen Test (p-value) 0.67 0.52 0.48 0.73 0.58 0.71 Instruments 57 57 57 57 57 57 AB 2 (p-value) 0.18 0.19 0.16 0.21 0.21 0.17
Notes: See Table 2; significance at the 10, 5, and 1 percent level is denoted by *, **, and ***, respectively.
We then explore our third hypothesis stating that the impact of the private sector on
regulations may depend on the sector the firm operates in. The argument is relatively straight
forward. Some private firms, for instance, those in the resource-extraction sector, are less
dependent on good regulations than manufacturing firms. That applies in particular to
technology-intensive firms in the manufacturing sector, which are more governance-sensitive
regarding contract enforcements and various forms of (other) business regulations (Rajan and
Subramanian 2007).
Unfortunately, we do not have data by sectors for developing countries starting in the 1970s.
As a remedy, we use information on the structure of exports and replace the trade variable by
different kinds of exports of goods. Firstly, we use the share of natural resource exports in
total GDP (NaturalResourceExports) and the appropriate counterpart, that is, the share of
non-resource exports in GDP (Non-NaturalResourceExports). Secondly, we compute the
respective shares of manufacturing and non-manufacturing exports in GDP

20
(ManufacturesExports and Non-ManufacturesExports). The results, reported in Table 4
below, indicate that the different forms of trade (exports) do not have an impact on regulatory
quality. We then test the impact of various other trade variables (share of manufacturing
exports in total exports or the exports of natural resources and agricultural goods in per cent
of GDP, numerous forms of imports, etc.), but again we do not find any robust impact on
changes in regulations. As a consequence, we do not find support for the third hypothesis
either.
Table 4: Private Sector Development and Regulations: Different Trade Variables
Independent variables
Dependent variable: RegulationChange
All countries Developing countries (1) (2) (3) (4)
RegulationLevelt-1 -0.284*** -0.252*** -0.407*** -0.376*** (-5.842) (-7.564) (-6.434) (-7.358) Growth 0.0106 0.00525 0.00550 0.0465** (0.597) (0.227) (0.209) (2.442) ln Population 0.0316 -0.0178 -0.00715 -0.0691 (0.918) (-0.349) (-0.121) (-1.236) ln Education 0.353*** 0.275*** 0.326** 0.292** (3.288) (3.434) (2.471) (2.159) PoliticalRegime -0.00189 -0.000541 0.00119 0.00473 (-0.274) (-0.0790) (0.101) (0.487) ln FDI 0.102** 0.178*** 0.169* 0.194** (2.048) (3.043) (1.700) (2.561) ln NaturalResourceExports -0.0675 -0.0980 (-1.302) (-1.488) ln Non-NaturalResourceExports 0.143 0.0474 (0.989) (0.253) ln ManufacturesExports -0.0274 -0.0509 (-1.067) (-1.440) ln Non-ManufacturesExports -0.158 -0.251 (-1.081) (-1.281) Observations 376 471 232 323 Countries 98 108 70 79 Hansen Test (p-value) 0.30 0.45 0.78 0.36 Instruments 76 76 64 64 AB 2 (p-value) 0.23 0.64 0.21 0.56
Notes: See Table 2; significance at the 10, 5, and 1 percent level is denoted by *, **, and ***, respectively.
Summing up the results from the empirical investigation, we do not find that the private sector
influences changes in regulations. The exception is foreign direct investment, which we
identify as an important driver of change in regulations. That effect is even stronger the more
FDI a country receives.
21
3. Private Sector Development and Regulations: Country Case Study Ghana
We begin the country case study by comparing Ghana’s performance in terms of the key
indicators with other sub-Saharan African (SSA) countries as well as other developing
countries and developed countries. We then explain in detail the changes in regulations that
have been made in Ghana since independence and the influence of the private sector in
shaping the regulatory environment over time.
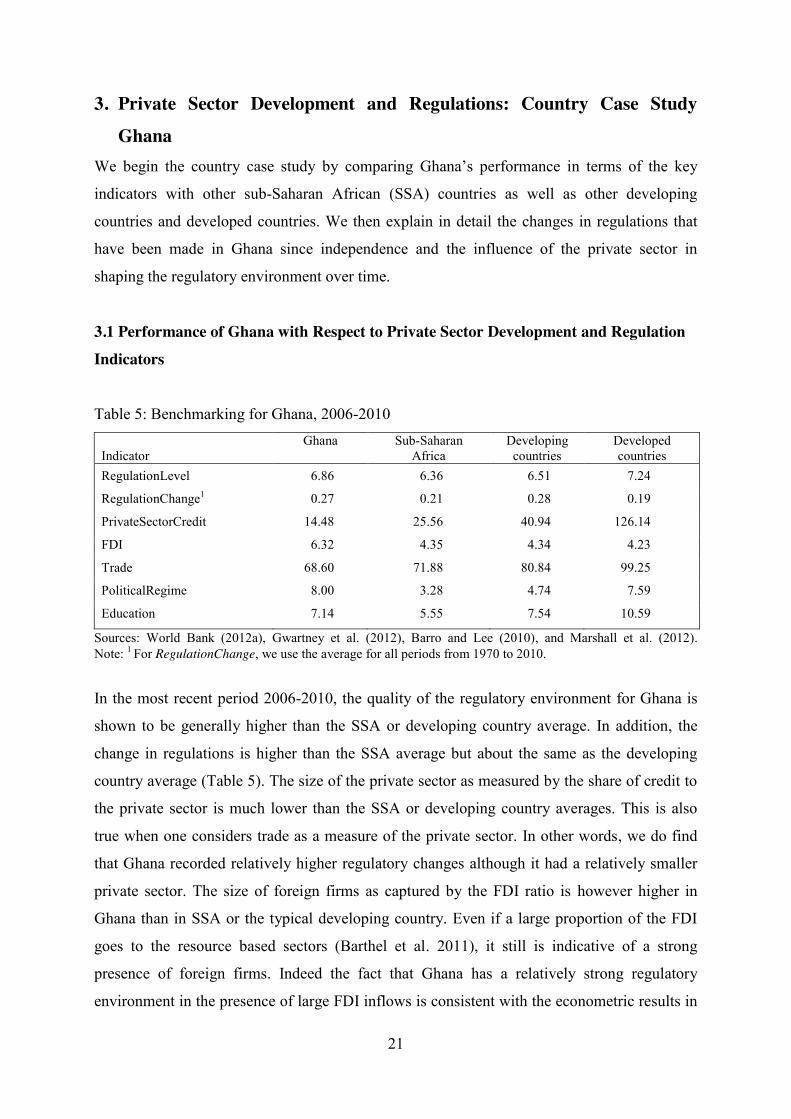
3.1 Performance of Ghana with Respect to Private Sector Development and Regulation Indicators
Table 5: Benchmarking for Ghana, 2006-2010 Indicator
Ghana Sub-Saharan Africa
Developing countries
Developed countries
RegulationLevel 6.86 6.36 6.51 7.24
RegulationChange1 0.27 0.21 0.28 0.19
PrivateSectorCredit 14.48 25.56 40.94 126.14
FDI 6.32 4.35 4.34 4.23
Trade 68.60 71.88 80.84 99.25
PoliticalRegime 8.00 3.28 4.74 7.59
Education 7.14 5.55 7.54 10.59
Sources: World Bank (2012a), Gwartney et al. (2012), Barro and Lee (2010), and Marshall et al. (2012). Note: 1 For RegulationChange, we use the average for all periods from 1970 to 2010.
In the most recent period 2006-2010, the quality of the regulatory environment for Ghana is
shown to be generally higher than the SSA or developing country average. In addition, the
change in regulations is higher than the SSA average but about the same as the developing
country average (Table 5). The size of the private sector as measured by the share of credit to
the private sector is much lower than the SSA or developing country averages. This is also
true when one considers trade as a measure of the private sector. In other words, we do find
that Ghana recorded relatively higher regulatory changes although it had a relatively smaller
private sector. The size of foreign firms as captured by the FDI ratio is however higher in
Ghana than in SSA or the typical developing country. Even if a large proportion of the FDI
goes to the resource based sectors (Barthel et al. 2011), it still is indicative of a strong
presence of foreign firms. Indeed the fact that Ghana has a relatively strong regulatory
environment in the presence of large FDI inflows is consistent with the econometric results in

22
the previous section. We also note that the education levels in Ghana is higher than that of the
SSA average but still lower than the developing country average. Lastly we note that the level
of democracy in Ghana is higher than that of the SSA or developing country average. Indeed
it is higher than even the average for the developed countries. Admittedly, democracy in itself
does not guarantee a good regulatory environment. However, it does come with improved
institutions as required by political contestations and this in turn fosters institutions that help
improve the regulatory environment.
Figure 2: Business Regulations, 1975-2010
Source: Gwartney et al. (2012). Note: The drop in RegulationLevel in Ghana between 1995 and 2000 is due to a decrease in the “Credit Market Regulation” indicator from 6.00 in 1995 to 4.93 in 2000. More specifically, the subcomponent “Private Sector” has significantly decreased from 8.99 to 4.85 in this period.
The quality of regulatory environment in Ghana has generally improved over the last half
century. We note from Figure 2 that since the mid-1980s, Ghana has seen remarkable
improvements in the quality of the regulatory environment surpassing both the SSA and
developing country averages. Between 1995 and 2000, there was a change in the generally
upward trend, only to be changed again from 2001. What explains the trends in the quality of
the regulatory environment in Ghana? How important are some of the significant factors
found in the econometrics section of this paper for Ghana? To answer these questions among
others we discuss the regulatory, political and economic history of Ghana with a view to
understanding how important the private sector have been in shaping the quality of regulation
over the years.
0
1
2
3
4
5
6
7
8
1975 1980 1985 1990 1995 2000 2005 2010
Re
gula
tio
nLe
vel
Developed Countries
Ghana
Developing Countries
SSA Countries

23
Ghana’s regulatory quality trends reflect the different experiences from the different historical
phases that the country has passed through. Indeed the state-business relations have differed
over the years in line with these different phases. Not surprisingly there have been many
studies that have looked at how different reforms has promoted private sector development
(see inter alia, Hutchful 2002, Ackah et al. 2010, Killick 2010).
3.2 History of Regulatory Reforms in Ghana
There have been many developments on the regulatory front in Ghana since independence.
During Nkrumah’s reign as president, many legislations were passed to regulate business
relations. The Industrial Relations Act of 1958 was passed with the objective of streamlining
relations between employers and employees. In 1960 the Companies Code was also passed
with the aim of regulating all companies – including for profit and not-for-profit companies.
The 1963 Capital Investment Act was instituted to guide the giving of fiscal products and
concessions to investors. In spite of all these business-related legislations, Ackah et al. (2010)
note that the state business relationship during these years of Nkrumah was plagued with
distrust as the state consistently tried to weaken businesses it perceived to be in opposition to
it.
After Nkrumah’s overthrow by the National Liberation Council (NLC) in 1966, the
development strategy of the state moved from being statist to become more liberal with a
preference for private sector-led development. There was a new relationship between the state
and the private sector. Even though this regime lasted for a short period of time, it registered a
significant change in state dealings with the private sector.
In 1969, the Progressive Party (PP) led by Dr Busia took over from the NLC government and
continued the general policy of improving the state business relations. During this time, a
major institutional arrangement in the management of land was introduced and lands were
reverted to traditional landowners. A very positive signal for this improved state business
relation was with debarment by the Constitution of the state from compulsorily acquiring land
– a strong statement for the safeguard of property rights. In line with encouraging the
development of domestic businesses, the PP government also passed the Ghana Business Act
in 1970 which gave monetary ceilings and restrictions to foreign nationals from engaging in
24
economic ventures in certain sectors of the economy. Although the intention of government
was to protect Ghanaian businesses, it is noted in Ackah et al. (2010) that business owners
were not complementary of these policies.
The Busua government was overthrown in 1972 by the National Redemption Council led by
Colonel Acheampong. The main economic policy of this government was indigenization;
including the promotion of entrepreneurial skills of Ghanaians to enable them partake more in
business activities. Efforts to promote businesses over this period is seen with the passage of
the Investment Policy Decree, 1975 (NRCD 329), the Ghanaian Enterprises Development
Decree, 1975 (NCD 330) and the National Board for Small Scale Industries (NBSSI) (Ninsin
& Hansen, 1989). Oquaye (1979) argues that the relationship between the government and
businesses deteriorated as corruption and rent-seeking became the order of the day with the
net result that the economy declined.
The Armed Forces Revolutionary Council (AFRC) overthrew the Supreme Military Council
II (SMC II) government which was led by General Akuffo in 1979. After only three months,
the AFRC handed over power to a civilian government, the People’s National Party (PNP) in
1979. Even though the AFRC was in power for only three months, it is argued to have meted
out the worst treatment to business owners (Oquaye 1979). During the PNP era, very little
changed with respect to the relationship between government and businesses. The poorly
performing economy did not help matters and compounded the problems of the government.
In December 1981, the PNP was overthrown by the Provisional National Defence Council
(PNDC).
These very frequent and capricious overthrow of governments over this period meant no
consistent policy reform agenda could have been pursued. It is therefore not surprising that
the quality of the regulatory environment deteriorated over this period. Indeed Killick (2010,
p-398) describes the period 1972-1983 as the ‘Black Years’.
Under the PNDC regime, the relationship between government and businesses saw some
significant changes. Due to the very poor state of the economy at the time, the government
had no choice than to agree to the Economic Recovery Programme (ERP) in 1983. The main
objectives of the ERP were three-fold: First, government intended to improve production
incentives by minimizing public expenditures as a means to alleviate pressures on the banking
25
sector, improve tax collection, and devalue the cedi. Second, the government sought to
privatize state-owned enterprises. Third, there was an intensification of monetary reforms and
a reduction of private corporate tax in support of the private sector (Hutchful 2002, Killick
2010).
Over the PNDC era, there were quite a number of reforms. In 1985 the Ghana Investment
Promotion Centre (GIPC) Act was passed with the aim of promoting investments (both
domestic and foreign) in the Ghanaian economy. In 1986 the Minerals and Mining Act was
also passed to ensure that Government had the right of pre-emption of all minerals obtained in
Ghana. Between 1986 and 1992 the country implemented the Structural Adjustment
Programme (SAP). The economic dimension of the SAP involved market-oriented policies
such as trade liberalization, privatization and fiscal discipline. The political aspect involved
the structuring of government in favour of the governed, i.e. democratization (Hutchful 2002).
In 1988 there was the formation of the Divestiture Implementation Committee with the
objective of carrying through the proposed privatisation of State Owned Enterprises (Ayee et
al. 1999). By 1996, about 180 state owned enterprises (SOEs) had been divested.
The government in 1991 formed the Private Sector Advisory Group (PSAG), tasked to
examine all existing laws and regulatory procedures which impeded private sector investment
and development. It was also to advise government on relevant revisions of obstructive laws
and to develop a set of specific recommendations for legal reform. Though the PSAG was
short lived, Ackah et al. (2010) viewed their operations as successful as their main
recommendations were implemented by the government.
In 1992, Ghana held elections and reverted to democratic rule with the National Democratic
Congress (NDC), which was formed by the military government of the PNDC, winning
power. This meant that most policies and reforms were continued. In 1995 the Private
Enterprise Foundation (PEF) was founded by government with representation from a majority
of the large business associations such as the Association of Ghana Industries (AGI), GNCCI,
GUTA, Ghana Chamber of Mines, and the Federation of Association of Ghana Exporters.
PEF was tasked to perform advocacy for Ghana’s private sector. It seems to have had good
collaborations with state institutions and has been quite visible in the promotion of the private
sector. The Ghana Free Zones Board (GFZB) was also established in 1995 under an Act of
26
Parliament to enable the establishment of free zones in Ghana for the promotion of economic
development, to provide for the regulation of activities in free zones and for related purposes.
In 2001, the main opposition party, the New Patriotic Party (NPP), took office after defeating
the NDC in elections. It has been argued that the NPP at the time envisaged the pursuance of a
more liberalised trade regime, investment and industrial policies will attract more local and
foreign manufacturers, entrepreneurs and traders to establish job opportunities in labour-
intensive export industries in Ghana (Arthur 2006). Therefore, the economic policies of the
NPP were generally geared towards supporting the growth of the private sector. Soon after
assuming office the government of the NPP established a Ministry for Private Sector
Development (PSD). Together with the Ministry of Trade and Industry, they embarked on a
comprehensive public-private partnership known as the President’s Special Initiative (PSI)
that sought to identify and develop potential business opportunities in Ghana. The government
also enhanced the Free Zones Board concept initiated by NDC as well as establish the Export
Development and Investment Fund (EDIF) in 2001. EDIF’s mission was (and still remains)
the provision of funds on concessionary terms for the development and promotion of the
country’s export.
The one unambiguous inference that one can make with this historical account of the state and
businesses relationships over the years is that political stability has been conducive to the
quality of the regulatory environment in Ghana. Also, one can argue that the private sector
would have had no or little influence in the changes in the quality of the regulatory
environment over the immediate post-independence period to the mid-1980s. We explore
some of these issues in more details in the next section
3.3 Importance of the Private Sector in the Quality of Regulatory Environment in Ghana
We have argued that the regulatory quality in Ghana is much better than the SSA and
developing country averages. Trends in the regulatory quality also show that much of the
improvement occurred after the mid-1980s. Is the World Bank/IMF led adjustment policies
solely to account for these improvements? How important has the private sector been in
explaining the positive changes that has occurred in the quality of the regulatory environment
in Ghana? We argue that there are three main areas that have impacted differentially on the
27
quality of regulatory environment in Ghana: the political history, foreign aid, and the private
sector.
Politically, we note that the period before the much talked about economic recovery
programme was characterised by high levels of political instability. Consequently, the initial
optimism in relation to economy of Ghana at the time of independence had waned by the
early 1980s. Indeed the period had seen no consistent building of regulatory capital and
unsurprisingly the period was associated with a decline in the level of the quality of the
regulatory environment. The ERP and post-ERP period has seen not only political stability
but also a move to democratic rule in 1992. This period has therefore seen access and the
symmetry of information improve considerably; civil society and their organisational capacity
have improved; and there has been increased political competition. However, it can be argued
that the scope for policy and policy processes have been limited, or slower than anticipated
with the government-business relations still remaining in a patron-client mould (Booth et al.
2005). It is our estimation that the influence of the democratic process has had limited effect
on change in quality of the regulatory environment. Booth et al. (2005) attribute the low
efficacy of the democratic process with respect to the quality of the regulatory environment,
to the large and inefficient public sector. They further argue that although there is a general
recognition for a reform of the public sector, “…the political arithmetic is stacked heavily
against doing seriously what needs to be done…” (Booth et al. 2005, p-5).
Another argument offered as to why the reforms, and therefore the regulatory environment
slowed down over the initial years of democracy in Ghana relates to the loss in political
autonomy of the executive. As Hutchful (2002, p-219) notes “…the inability to manage
political liberalisation was offered as an explanation for the slow-down in reform”. One of
the explanations offered by Hutchful (2002) as to why political liberalisation may affect
adjustments in the economic environment is because of the trade-off between continuing a set
of reforms and winning political power. These are key pointers as to why the quality of the
regulatory environment slowed down in the 1990s. Indeed one should note that the legislature
in 1992-1996 was dominated by the NDC and unsurprisingly offered very little or no check to
the executive. Between 1996-2000, even though the NDC still had the majority in parliament,
it did not enjoy the same level of support by the legislature, with the strong presence of the
main opposition party. This in part may explain why we observe a decline in the regulatory
environment over this period.

28
Foreign aid has undoubtedly been important in explaining the changes in the quality of the
regulatory environment and reforms generally that have been witnessed in Ghana particularly
since the mid-1980s. In discussing the influence of economic policy changes relative to
outside forces, Killick (2010, p-451) notes “…the rapid rise in assistance during the early
ERP years, say 1984-1988, was surely of crucial importance to the sustainability of the
reforms of that period”. Ninsin (2012) also infers that aid was key in influencing and paying
for the economic and social reforms under the economic recovery programme. As he notes
“…If you are retrenching so many workers, as happened in our case right from the initial
stages of the structural adjustment, then the potential market for the economy, within the
economy is restricted” (Personal Interview, 2012). This point is again reinforced in an
interview with Dr Joe Abbey, who was one of the key government persons during the
implementation of the ERP. He notes that “The World Bank Economic Recovery Program
changed the culture of account management. We got out of bureaucratic control of the
economy, which was destroying the Ghanaian economy by rewarding retailers to the
detriment of producers, through price controls. Before then those who could bribe the
bureaucrats were those who could make profits” (Personal Interview, 2012). One can
therefore argue that aid did play a part in influencing changes in the quality of the regulatory
environment in Ghana in the post 1983 period.
Finally, we discuss the effects of the private sector on the quality of the regulatory
environment and argue that this has been limited. Typically firms producing within any given
country will ask for better regulatory environment. However, this is only possible if these
firms are large and visible (or can afford to be seen). Unfortunately in Ghana, the majority of
private enterprises are small and informal (Osei-Boateng and Ampratwum 2011). This means
that a large section of the private sector cannot be effectively mobilised to demand for
improved quality in the regulatory environment. This problem is also compounded by the
patronage-oriented nature of the government-business relationship. The nature of the deal
space is a closed one and dominated by these large firms.
It is generally argued that the private sector in Ghana do have an avenue for dialogue with
government through bodies such as the Association of Ghanaian Industries (AGI), Private
Enterprise Foundation (PEF) etc. In the view of Mr. Sam Poku, CEO of The Business Council
for Africa Ghana (BCA), however, the private sector has been unsuccessful to influencing

29
policy or shaping regulations made (Personal interview: November, 2012). For the relatively
smaller enterprises, he cites the lack of credibility as one of the key reasons why they have not
been able to influence the general direction of policy of the governments. An example he uses
to buttress this point is the high default rate on government guaranteed loans to some of these
enterprises. Another important factor which comes up as to why the private sector has
generally been ineffective in driving changes in the regulatory environment has to do with
potential conflict with donor policy. A good example relating to this tension can be seen in the
interesting case between the poultry farmers and the government in 2005 and captured in the
box below.
Box 1: Ghana Chickens Out - The Case of Poultry Farmers and Government in 2005
Faced with increasing and intense competition of imported poultry from EU countries, poultry
farmers lobbied for an increase in the tariffs on imported poultry products. In its 2003 budget,
the government proposed an additional 20% duty on finished poultry products imported into
the country. However, after parliament had endorsed the budget, and with pressure from the
IMF and World Bank, the government decided not to enforce the 20% increase in import
tariffs on poultry. The IMF’s argument was that the government had not followed the due
process. In its Poverty Reduction and Growth Facility (PRGF) agreement, the government
said it was going to avoid the use of import surcharges to protect local industry and that they
were committed to eliminating all surcharges.
An increase in import tariffs on poultry products therefore contravened this agreement. On
11th, March 2005 a high court judge in Accra-Ghana ruled that Ghana Customs, Excise and
Preventive Service (CEPS) must increase the tariffs on imported poultry from 20% to 40% as
stipulated in the 2003 budget of the Government of Ghana. The court’s ruling was hailed by
some as historic since it was the first time the courts had insisted that policies of the
government, which had been approved by parliament, should be implemented. A week later, a
bill, which sought to repeal the law on increasing import tariffs on poultry, was sent to
parliament and was passed into law. Views of different interest groups on this particular
matter are as follows:

30
Ministry of Finance: - they argued that the bill should have been introduced earlier but was
delayed because of congested parliamentary time. The bill was therefore not a response to the
court ruling.16
Lawyer representing the poultry Farmers: ”…we think the constitution has been undermined.
We cannot simply sit back and accept that our sovereign government is so heavily influenced
by the IMF and others that the course of our industrial development is fundamentally
changed.”
IMF: - they argued that this policy would have been adverse for Ghana’s growth and poverty
reduction strategy as it would have increased the price of a key staple (poultry) and reduced
the long-run competitiveness of the industry.
This case study clearly demonstrates that the preference functions of private enterprises and
donors sometimes differ and in this instance the push for a change in the regulatory
environment by the private sector can be blocked by donors. Indeed the fact that the size of
the private sector is small and not very organised does not help in their push for favourable
regulatory reforms.
4. Conclusions and Policy Recommendations
While there is broad consensus among researchers and policy makers that governance matters
for economic and social development, there is less agreement on how to improve governance
in a particular country. In this study, we investigate what exactly contributes to changes in
governance. Above all, we differentiate between political and economic drivers as well as
internal and external drivers of change. The main focus, however, is on the impact of one
potentially influential actor, that is, the private sector. In comparison to external drivers,
demands for change from within a country could be much more sustainable in the long run.
16 This comment and those that follow were culled from a Christain Aid Report on Ghana in 2005, which attributed this argument to the Deputy Minister of Finance in charge of Economic Planning. The title of the article is ‘Ghana: Democracy under attack’

31
Within the broad area of governance, we focussed on the quality of government regulations,
e.g., labour, product and financial market regulations. These regulations are important for the
private sector to operate efficiently and to expand their output.
The main results of the study can be summarised as follows: As for the cross-country
empirical investigation, we do not find evidence for an overall positive influence of the
private sector on regulations (Hypothesis 1). We argue that either the private sector is too
small (Hypothesis 2) or, depending on the product involved and specific country setting
(Hypothesis 3), is not pushing for long-run improvements in the regulatory quality.
Interestingly, we find evidence for a positive and significant impact of foreign-owned firms
on regulatory quality, in the country they operate in. In other words, in contrast to domestic-
owned firms, those that are foreign-owned are pressing harder for improvements in
regulations. We think that this result could be due to the fact that the foreign firms depend
much more on a sound regulatory environment than their domestically-owned competitors,
Also, they are much bigger and consequently formal, enabling them to be more effective in
pushing and achieving regulatory changes.
Among the political drivers of change, we find a positive influence of the regime type on
regulations; namely, democracies are conducive to improvements in regulations. A
government that is more accountable to their population could be associated with political
reforms that are enhancing the quality of regulations. Also, we find evidence for a positive
impact of education on regulatory quality. A better educated population is more likely to
participate in (public) decision making and to demand better regulations (or governance
overall).
In the country case study, we find that Ghana has improved the quality of government
regulations (and governance overall) considerably in recent years. On the other hand, there is
ample room for improvements in the business climate which would allow Ghanaian firms to
be more competitive abroad and to expand their output. In terms of the political drivers of
change, we find that whereas political stability has been good for regulatory reforms
democratic reforms in the 1990s haven’t necessarily yielded the expected dividends. In part
we have argued that this may be because Ghana’s democracy remains young and will need to
mature for benefits to the regulatory environment to be adequately realised.

32
We also find that foreign aid has been important in leveraging changes in regulatory quality in
Ghana. In particular over the period when dependency on aid was highest (say the first two
decades in the ERP/SAP), donors were able to encourage the implementation of many
reforms (e.g., include trade and exchange liberalisation, tax reforms, etc) that had not been
possible in the period before. Finally, we do find that private sector in Ghana have not had a
significant impact on the changes in the regulatory quality. We advance three complementary
reasons as to why this has been the case. First and consistent with our econometric results, is
the relatively small size of the private sector. This has meant that the ability of the private
sector to organise and push for some of these reforms have been limited. Second, the
government business relations in Ghana have been of the patron-client nature. This has meant
that the nature of the deal space is of a closed type, which does not usually foster a push for
more broad based reforms. Third, we argue that the very strong donor presence in Ghana have
crowded out the private sector with respect to reforms. This is worrisome from a sustainability
point particularly as the dependence and therefore influence of donors have already begun to
wane.
This study concludes with the recommendation that Ghana needs to create a more effective
policy space for the private sector to inform the reform agenda of the country. In line with this
we would argue that both the government and the donors have a role to play. For the
government this would entail engaging a broader base of the private sector over and above
that defined by the patron-client relationships. For the donors, it is important that they use
their leverage not only to push reforms but to encourage government to engage the private
sector. This is important if Ghana is to sustain the increasing quality of its regulatory
environment and subsequently continue to grow in a way that is sustainable and
developmentally transformative.

33
Literature
Acemoglu, Daron, Simon Johnson and James Robinson (2001), The Colonial Origins of Comparative Development: An Empirical Investigation, American Economic Review, Vol. 91, No. 5, pp. 1369-1401.
Acemoglu, Daron, Simon Johnson and James Robinson (2005), The Rise of Europe: Atlantic Trade, Institutional Change, and Economic Growth, American Economic Review, Vol. 95, No. 3, pp. 546-579.
Acemoglu, Daron and James Robinson (2012), Why Nations Fail: The Origins of Power, Prosperity, and Poverty, New York: Crown.
Ackah, Charles, Ernest. Aryeetey, Joseph Ayee and Ezekiel Clottey (2010), State-Business Relations and Economic Performance in Ghana, IPPG Discussion Paper Series 35, Available online at http://www.ippg.org.uk/.
Anderson, Theodore and Cheng Hsiao (1982), Formulation and Estimation of Dynamic Models Using Panel Data, Journal of Econometrics, Vol. 18, No. 1, pp. 47-82.
Arellano, Manuel and Stephen Bond (1991), Some Tests of Specification for Panel Data: Monte Carlo Evidence and an Application to Employment Equations, Review of Economic Studies, Vol. 58, No. 2, pp. 277-297.
Arellano, Manuel and Olympia Bover (1995), Another Look at the Instrumental Variable Estimation of Error Component Models, Journal of Econometrics, Vol. 68, No. 1, pp. 29-51.
Arthur, Peter (2006). The State, Private Sector Development and Ghana’s “Golden Age of Business, African Studies Review, Vol. 49, No. 1, pp. 31-50.
Ayee, Joseph, Lofchie, Michael and Carolina Wieland (1999), Government-Business Relations in Ghana: Experience with Consultative Mechanisms, PSD Occasional Paper, The World Bank, Private Sector Development Department (No. 36, October), pp. vi+64. Available online at http://www-wds.worldbank.org/.
Barro, Robert and Jong-Wha Lee (2010), A New Data Set of Educational Attainment in the World: 1950-2010, NBER Working Paper 15902.
Barthel, Fabian, Matthias Busse and Robert Osei (2011), The Characteristics and Determinants of FDI in Ghana, European Journal of Development Research, Vol. 23, No. 3, pp. 389-408.
Blundell, Richard and Stephen Bond (1998), Initial Conditions and Moment Restrictions in Dynamic Panel Data Models, Journal of Econometrics, Vol. 87, No. 1, pp. 115-143.
Boockmann, Bernhard and Axel Dreher (2003), The Contribution of the IMF and the World Bank to Economic Freedom, European Journal of Political Economy, Vol. 19, No. 3, pp. 633–649.
Booth, David, Richard Crook, E. Gyimah-Boadi, Tony Killick and Robin Luckham (2005), What are the Drivers of Change in Ghana? CDD/ODI Policy Brief No.1, November. Available online at http://www.odi.org.uk.
Bräutigam, Deborah and Stephen Knack (2004), Foreign Aid, Institutions, and Governance in Sub-Saharan Africa, Economic Development and Cultural Change, Vol. 52, No. 2, pp. 255-285.

34
Christain Aid. (n.d.), The Damage Done: Aid, Death and Dogma. UK. Available online at http://www.christianaid.org.uk.
Dreher, Axel and Sarah Rupprecht (2007), IMF Programs and Reforms: Inhibition or Encouragement?, Economics Letters, Vol. 95, No. 3, pp. 320-326.
Dreher, Axel and Kai Gehring (2012), Does Aid Buy (Economic) Freedom? In: Gwartney, James, Robert Lawson and Joshua Hall (eds.), Economic Freedom of the World: 2012 Annual Report, Vancouver: Fraser Institute, pp. 219-246.
Easterly, William (2006) The White Man’s Burden: Why the West’s Efforts to Aid the Rest Have Done So Little, New York: Penguin.
Engerman Stanley and Kenneth Sokoloff (1997), Factor Endowments, Institutions, and Differential Paths of Growth among New World Economies: A View from Economic Historians of the United States, in: Stephen Harber (ed.), How Latin America Fell Behind, Stanford, CA: Stanford University Press, pp. 260-304.
Gwartney, James, Robert Lawson and Joshua Hall (2012), Economic Freedom of the World: 2012 Annual Report, Vancouver: Fraser Institute.
Gassebener, Martin, Noel Gaston and Michael Lamla (2011), The Inverse Domino Effect: Are Economic Reforms Contagious?, International Economic Review, Vol. 52, No. 1, pp. 183-200.
Heckelman, Jac and Stephen Knack (2008), Foreign Aid and Market-Liberalizing Reform, Economica, Vol. 75, No. 299, pp. 524-548.
Hutchful, Eboe (2002), Ghana’s Adjustment Experience: The Paradox of Reform, United Nations Research Institute for Social Department (UNRISD), Geneva.
Jütting, Johannes (2003), Institutions and Development: A Critical Review, OECD Development Centre Working Paper 210.
Killick, Tony (2010), Development Economics in Action: A Study of Economic Policies in Ghana, Second Edition, Routledge, UK.
Levine, Ross (2005), Law, Endowments and Property Rights, Journal of Economic Perspectives, Vol. 19, No. 3, pp. 61-88.
Levchenko, Andrei (2011), International Trade and Institutional Change, NBER Working Paper 17675.
Marshall, Monty, Keith Jaggers and Ted Robert Gurr (2012), Polity IV Project: Political Regime Characteristics and Transitions, 1800-2010, Internet Posting: http://www.systemicpeace.org/polity/polity4.htm.
Miller, Terry and Kim Holmes (2011), 2011 Index of Economic Freedom, Washington, DC: Heritage Foundation.
Ninsin, Kwame and Emmanuel Hansen (eds.) (1989), The State, Development and Politics in Ghana, CODESRIA Book Series, London, United Kingdom. Available online at http://afraf.oxfordjournals.org.
Osei-Boateng, Clara and Ampratwum, Edward (2011), The Informal Sector in Ghana, Accra. Available online at 11/02/2013 from www.fesghana.org.
Oquaye, Mike (1980), Politics in Ghana, 1972-1979, Accra-Tema, Ghana Publishing Corporation.
35
Rajan, Raghuram and Arvind Subramanian (2007), Does Aid Affect Governance?, American Economic Review, Vol. 97, No. 2, pp. 322-327.
Sachs, Jeffrey (2005), The End of Poverty: Economic Possibilities for Our Time, New York: Penguin Press.
Tangri, Roger (1999), The Politics of Patronage in Africa: Parastatals, Privatization and Private Enterprise, Oxford: James Currey. Available online at http://books.google.com.gh/books.
United Nations (1998), Cooperating for Development, Annual Report of the Secretary-General on the Work of the Organization, Document A/53/1, New York, Internet Posting: www.un.org/Docs/SG/Report98/ch2.htm.
World Bank (2005), World Development Report 2006: Equity and Development, New York and Washington, DC: Oxford University Press and World Bank.
World Bank (2011), A Short History, Internet Posting: http://data.worldbank.org/about/country-classifications/a-short-history.
World Bank (2012a), World Development Indicators, Internet Posting: http://data.worldbank.org/data-catalog/world-development-indicators.
World Bank (2012b), Worldwide Governance Indicators, Internet Posting: http://info.worldbank.org/governance/wgi/sc_country.asp.

36
Appendix A: Components of Regulations Indicator, Area 5 of Economic Freedom of the World Dataset
Credit market regulations Description Data source
Ownership of banks
Data used to construct rating intervals: the percentage of bank deposits held in privately owned banks. Countries with larger shares of privately held deposits received higher ratings (95%- 100%, rating of 10, 75%-95%, rating of 8, 40%-75%, rating of 5, 10%-40%, rating of 2, 10% or less of total, rating of 0).
James R. Barth, Gerard Caprio, Jr., and Ross Levine, Bank Regulation and Supervision (various years)
Private sector Measures the extent to which government borrowing crowds out private sector borrowing. This sub-component is calculated as the government fiscal deficit as a share of gross saving. In a few cases where the deficit data are not available, the component is instead based on the share of private credit to total credit extended in the banking sector.
World Bank, WDI (various issues); IMF, IFS (various issues).
Interest rate controls/ negative real interest rates
Data on credit market controls and regulations: countries with interest rates determined by the market, stable monetary policy, and positive real deposit and lending rates receive higher ratings (ratings given: 0, 2, 4, 6, 8, 10, according to interest rates, real rates, deposit/lending rates.
World Bank, WDI (various issues); IMF, IFS (various issues).
Labour market regulations Description Data source
Hiring regulations and minimum wage
Doing Business (DB) “Difficulty of Hiring Index”: measures (i) whether fixed-term contracts are prohibited for permanent tasks; (ii) the maximum cumulative duration of fixed-term contracts; and (iii) the ratio of the minimum wage for a trainee or first-time employee to the average value added per worker. Countries with higher difficulty of hiring are given lower ratings.
World Bank Doing Business Employing Workers
Hiring and firing regulations
Based on the Global Competitiveness Report question: “The hiring and firing of workers is impeded by regulations (= 1) or flexibly determined by employers (= 7).
World Economic Forum World Competitiveness Report
Centralized collective bargaining
Based on the Global Competitiveness Report question: Wages in your country are set by a centralized bargaining process (= 1) or up to each individual company (= 7).
World Economic Forum World Competitiveness Report
Hours regulations
DB “Rigidity of Hours Index”: has 5 components: (i) whether there are restrictions on night work; (ii) whether there are restrictions on weekly holiday work; (iii) whether the work-week can consist of 5.5 days; (iv) whether the work-week can extend to 50 hours or more (including overtime) for 2 months a year to respond to a seasonal increase in production; and (v) whether paid annual vacation is 21 working days or fewer.
World Bank Doing Business Employing Workers
Mandated cost of worker dismissal
Based on the DB data on the cost of the advance notice requirements, severance payments, and penalties due when dismissing a redundant worker.
World Bank Doing Business Employing Workers
Conscription Data on the use and duration of military conscription were used to construct rating intervals. Countries with longer conscription periods received lower ratings. A rating of 10 was assigned to countries without military conscription.
International Institute for Strategic Studies, The Military Balance; War Resisters International, World Survey of Conscription and Conscientious Objection to Military Service.

37
Business regulations Description Data source
Administrative requirements
Based on the Global Competitiveness Report question: Complying with administrative requirements (permits, regulations, reporting) issued by the government in your country is (1 = burdensome, 7 = not burdensome).
World Economic Forum World Competitiveness Report
Bureaucracy costs
Based on the Global Competitiveness Report question: Standards on product/service quality, energy and other regulations (outside environmental regulations) in your country are: (1 = Lax or non-existent, 7 = among the world‘s most stringent), belonging to “presence of demanding regulatory standards”
World Economic Forum World Competitiveness Report
Starting a business
Based on DB data on the amount of time and money it takes to start a new limited-liability business. Countries where it takes longer or is more costly to start a new business are given lower ratings. Zero-to-10 ratings were constructed for three different variables: (1) time (measured in days) necessary to comply with regulations when starting a limited liability company, (2) money costs of the fees paid to regulatory authorities (measured as a share of per-capita income) and (3) minimum capital requirements, that is, funds that must be deposited into a company bank account (measured as a share of per capita income).
World Bank Doing Business
Extra payments/ bribes/ favouritism
Based on the Global Competitiveness Report questions: In your industry, how commonly would you estimate that firms make undocumented extra payments or bribes connected with the following: A – Import and export permits; B – Connection to public utilities (e.g., telephone or electricity); C – Annual tax payments; D – Awarding of public contracts (investment projects); E – Getting favourable judicial decisions. Common (= 1) Never occur (= 7); Do illegal payments aimed at influencing government policies, laws or regulations have an impact on companies in your country? 1 = Yes, significant negative impact, 7 = No, no impact at all; and To what extent do government officials in your country show favouritism to well-connected firms and individuals when deciding upon policies and contracts? 1 = Always show favouritism, 7 = Never show favouritism
World Economic Forum World Competitiveness Report
Licensing restrictions
Based on DB data on the time in days and monetary costs required to obtain a license to construct a standard warehouse. Zero-to-10 ratings were constructed for (1) the time cost (measured in number of calendar days required to obtain a license) and (2) the monetary cost of obtaining the license (measured as a share of per-capita income).
World Bank Doing Business
Cost of tax compliance
Based on DB data on the time required per year for a business to prepare, file, and pay taxes on corporate income, value added or sales taxes, and taxes on labour.
World Bank Doing Business
Source: Gwartney et al. (2012).

38
Appendix B: Definition of Variables and Data Sources
Variable Definition Source
RegulationLevel Credit market, labour and business regulations, Area 5 of Economic Freedom of the World dataset, levels
Gwartney et al. (2012)
RegulationChange Credit market, labour and business regulations, change in regulation indicator (RegulationLevel) over five-year period
Gwartney et al. (2012)
PrivateSectorCredit Credit to the private sector in per cent of total GDP World Bank (2012a) Trade Total exports and imports of goods and services in per cent of
GDP World Bank (2012a)
FDI Foreign direct investment in per cent of the recipient’s GDP World Bank (2012a) Growth Real growth of GDP per capita in per cent World Bank (2012a) Population Total population World Bank (2012a) Education Average years of total schooling in the population, ages 25
and over Barro and Lee (2010)
PoliticalRegime Indicator for democracy and autocracy, Polity IV dataset, ranging from -10 (strongly autocratic) to +10 (strongly democratic)
Marshall et al. (2012)
Aid Foreign aid (ODA) in per cent of recipient’s GDP World Bank (2012a) NaturalResource Exports
Exports of natural resources, e.g., fuel and minerals, in per cent of GDP
World Bank (2012a)
Non-Natural ResourceExports
Total exports minus natural resource exports in per cent of GDP
World Bank (2012a)
Manufactures Exports
Exports of manufactured goods in per cent of GDP World Bank (2012a)
Non-Manufactures Exports
Total exports minus exports of manufactured goods in per cent of GDP
World Bank (2012a)
Appendix C: Descriptive Statistics of Main Variables, Period 1970-2005
Variable Observations Mean Standard Deviation
Minimum Maximum
RegulationChange 549 0.24 0.55 -1.32 2.80 RegulationLevel 549 5.92 0.59 3.20 7.74 ln PrivateSectorCredit 547 3.38 0.33 2.26 4.42 ln Trade 545 4.06 0.23 1.92 5.50 ln FDI 509 -0.06 1.10 -8.52 3.60 Growth 549 3.40 2.36 -5.95 15.70 ln Population 549 16.37 0.16 15.83 16.89 ln Education 549 1.81 0.16 1.27 2.27 PoliticalRegime 549 3.12 3.23 -9.64 13.69 ln Aid 370 0.57 0.70 -4.48 2.46
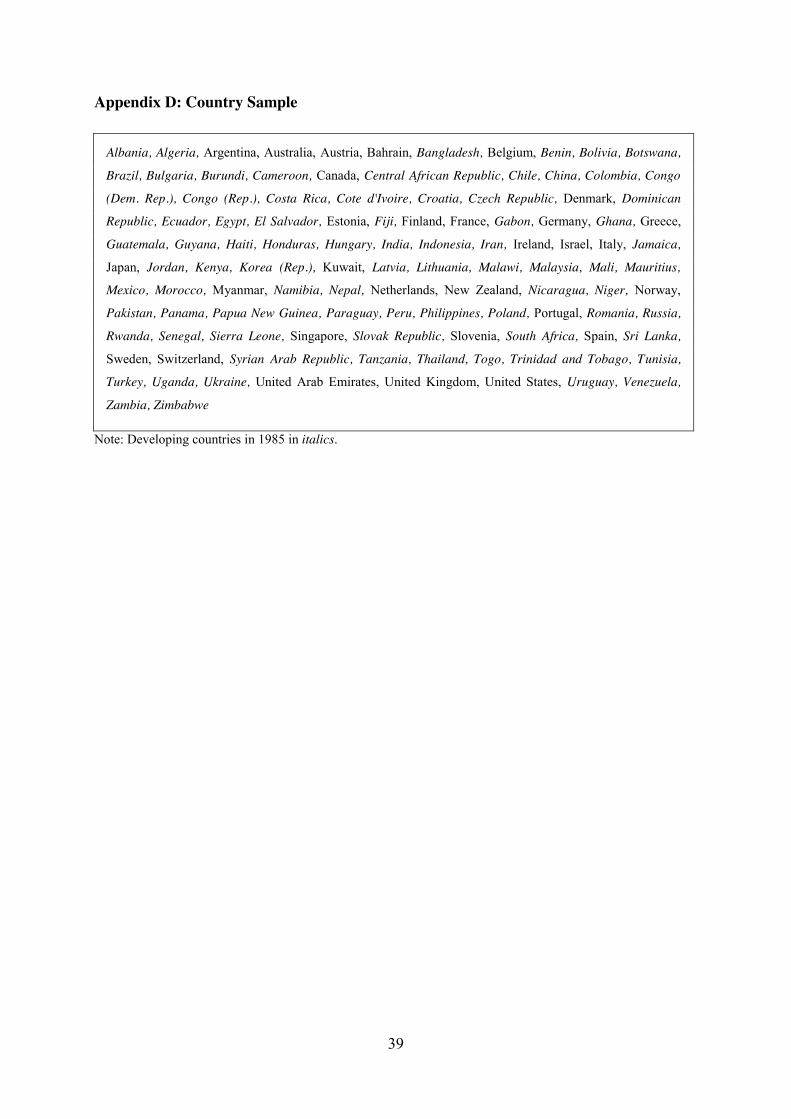
39
Appendix D: Country Sample
Albania, Algeria, Argentina, Australia, Austria, Bahrain, Bangladesh, Belgium, Benin, Bolivia, Botswana,
Brazil, Bulgaria, Burundi, Cameroon, Canada, Central African Republic, Chile, China, Colombia, Congo
(Dem. Rep.), Congo (Rep.), Costa Rica, Cote d'Ivoire, Croatia, Czech Republic, Denmark, Dominican
Republic, Ecuador, Egypt, El Salvador, Estonia, Fiji, Finland, France, Gabon, Germany, Ghana, Greece,
Guatemala, Guyana, Haiti, Honduras, Hungary, India, Indonesia, Iran, Ireland, Israel, Italy, Jamaica,
Japan, Jordan, Kenya, Korea (Rep.), Kuwait, Latvia, Lithuania, Malawi, Malaysia, Mali, Mauritius,
Mexico, Morocco, Myanmar, Namibia, Nepal, Netherlands, New Zealand, Nicaragua, Niger, Norway,
Pakistan, Panama, Papua New Guinea, Paraguay, Peru, Philippines, Poland, Portugal, Romania, Russia,
Rwanda, Senegal, Sierra Leone, Singapore, Slovak Republic, Slovenia, South Africa, Spain, Sri Lanka,
Sweden, Switzerland, Syrian Arab Republic, Tanzania, Thailand, Togo, Trinidad and Tobago, Tunisia,
Turkey, Uganda, Ukraine, United Arab Emirates, United Kingdom, United States, Uruguay, Venezuela,
Zambia, Zimbabwe
Note: Developing countries in 1985 in italics.

40
Appendix E: System-GMM Dynamic Panel Estimator
We begin with a relatively simple model specification in levels:
ittitit2iit ελXγ'Sector PrivateβαLevelRegulation )1( ����
where RegulationLevelit stands for the level of business regulations in country i in period t, αi
is the country fixed effect, PrivateSectorit represents the three different private sector
development variables (as explained in Section 2.1), Xit denotes the set of control variables
(again, as introduced before), λt is a set of time dummies which is supposed to capture period
specific effects, and εit stands for the error term.
We then subtract the lagged level of regulatory quality (RegulationLevelit-1) from both sides,
which yields:
ittitit21it1iit ελXγ'Sector PrivateβLevelRegulationβαChangeRegulation )2( ����� �
where RegulationChangeit stands for the change in the level of business regulations in country
i from period t-1 to period t.
Estimating equation (2) by ordinary least squares for the typical pooled cross-country time
series analysis with “small T and large N” is very likely to produce biased coefficients due to
the well-known problems if independent variables are endogenous (which is true for our
sample). As a remedy, we follow the procedure suggested by Arellano and Bond (1991) and,
as a first step, eliminate the country-specific effects using first differences:
ittitit21it1it ελXγ'Sector PrivateβLevelRegulationβChangeRegulation )3( '�'�'�'�' ' �
where ΔRegulationChangeit = RegulationChangeit - RegulationChangeit-1. As a second step,
we estimate equation (3) by Generalised Method of Moments (GMM). By following this
approach, we would get the Arellano and Bond difference-GMM estimator. This estimator,
which can be thought of as an extension of the Anderson and Hsiao (1982) estimator,
produces efficient (and consistent) estimates, since the latter estimator fails to take all the
potential orthogonality conditions into account.

41
In two later papers, however, Arellano and Bover (1995) and Blundell and Bond (1998)
reveal a potential weakness of the difference-GMM estimator. They show that lagged levels
can be poor instruments for first-differenced variables, in particular if the variables are
persistent. In their modification of the estimator, they suggest to include lagged levels along
lagged differences. In contrast to the original difference-GMM, they term this expanded
estimator system-GMM. In fact, the system-GMM approach estimates equations (2) and (3)
simultaneously, by using lagged levels and lagged differences as instruments. We favour the
system-GMM estimator, as not only levels but also changes in regulations can be quite
persistent.
The consistency of the system-GMM estimator requires a lack of second-order serial
correlation in the residuals. The regression statistics, reported at the bottom of each regression
output table, show that there is no second-order serial correlation in the large majority of
regressions, as the null-hypothesis is always rejected.17 To test the appropriateness of the
instruments used, we report the results of a Hansen test of over-identifying restrictions in all
tables. The J-statistics show that the applied instruments are valid.
As we use lagged levels and lagged differences, the number of instruments can be quite large
in a system-GMM estimator. Yet too many instruments can overfit endogenous variables and
fail to expunge their endogenous components. Moreover, it also weakens the power of the
Hansen test to detect overidentification. Since the risk can be quite high with this estimator, it
has become common practice in the literature to keep the number of instruments below the
number of observations, that is, the number of countries included in our sample. To avoid this
bias, we reduce in a number of regressions the size of the instrument matrix by restricting the
number of lags used.
17 In only regression, this does not hold (Table 2, column 2). First-order autocorrelation of the residuals is always rejected by another Arellano-Bond test.

Designed by soapbox.co.uk
The International Growth Centre (IGC) aims to promote sustainable growth in developing countries by providing demand-led policy advice based on frontier research.
Find out more about our work on our website www.theigc.org
For media or communications enquiries, please contact [email protected]
Subscribe to our newsletter and topic updates www.theigc.org/newsletter
Follow us on Twitter @the_igc
Contact us International Growth Centre, London School of Economic and Political Science, Houghton Street, London WC2A 2AE