Private Schools in American Education A Small Sector Still ...
46
Private Schools in American Education [Working Paper], March 5, 2018 UCLA Civil Rights Project 1 Private Schools in American Education A Small Sector Still Lagging in Diversity Jongyeon Ee Gary Orfield Jennifer Teitell
Transcript of Private Schools in American Education A Small Sector Still ...

Private Schools in American Education [Working Paper], March 5, 2018
UCLA Civil Rights Project
1
Private Schools in American Education
A Small Sector Still Lagging in Diversity
Jongyeon Ee
Gary Orfield
Jennifer Teitell

Private Schools in American Education [Working Paper], March 5, 2018
UCLA Civil Rights Project
2
Table of Contents
List of Tables .................................................................................................................................. 3
List of Figures ................................................................................................................................. 4
Executive Summary ........................................................................................................................ 5
Private Schools in American Education: A Small and Distinctive Sector of a Vast Enterprise ..... 7
National Trends: Private School Declining Share, Public School Growth .................................. 12
Regional Trends: Southern Private School Growth ...................................................................... 17
Student Enrollment in Private and Public Schools in States with Voucher Programs ................. 23
Segregation Analysis – National Level......................................................................................... 26
Segregation Analysis – Regional Level ........................................................................................ 28
Most Segregated States ................................................................................................................. 38
Conclusion .................................................................................................................................... 41
Appendix ....................................................................................................................................... 46

Private Schools in American Education [Working Paper], March 5, 2018
UCLA Civil Rights Project
3
List of Tables
Table 1: Private School Enrollment Rates, by Race/Ethnicity and Sector, 2015-2016 .............................. 14
Table 2: Racial Composition of School Enrollments, by Sector and Type of Private School, 2015-2016 . 15
Table 3: Number of Schools by Sector and by Region, 2015-2016 ............................................................ 17
Table 4: Total Enrollment and Racial Composition of Private and Public Schools in States with Voucher
Laws, 1995-96 through 2015-16 ................................................................................................................. 23
Table 5: Average Intergroup Contacts in Northeastern Schools that the Typical Student of Each Race
experiences by Sector, 1995-2015 .............................................................................................................. 31
Table 6: Average Intergroup Contacts in Midwestern Schools that the Typical Student of Each Race
experiences by Sector, 1995-2015 .............................................................................................................. 33
Table 7: Average Intergroup Contacts in Southern Schools that the Typical Student of Each Race
experiences by Sector, 1995-2015 .............................................................................................................. 35
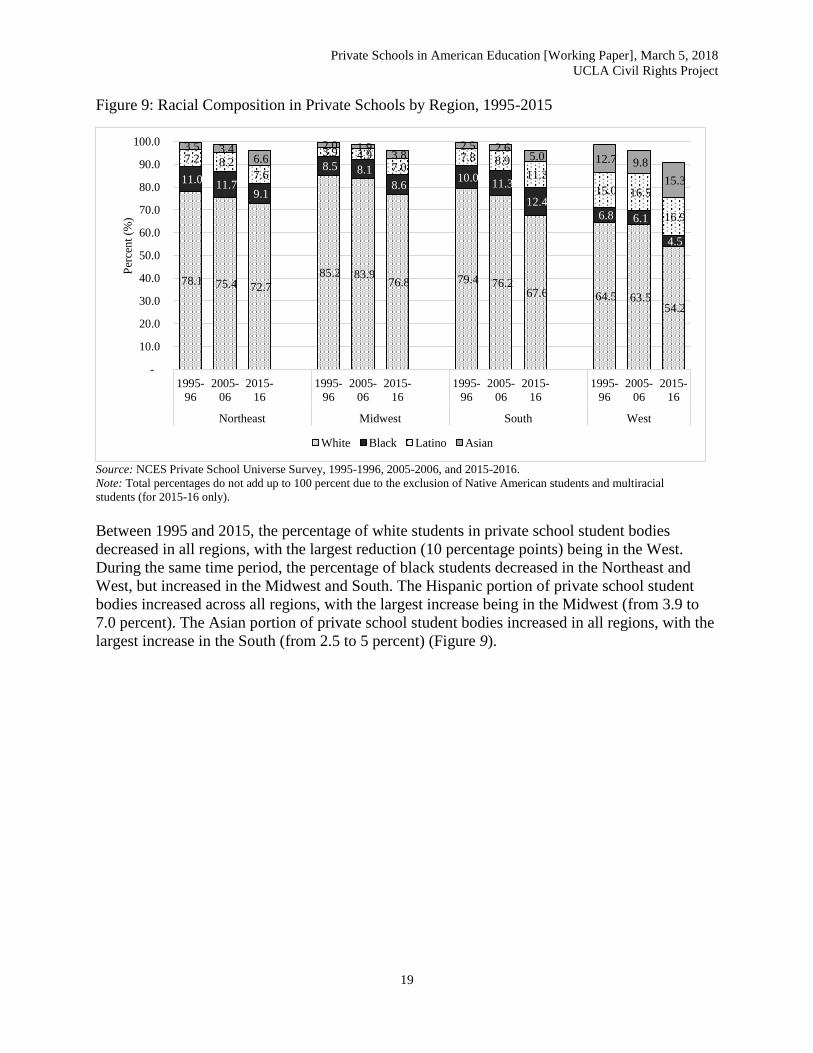
Table 8: Average Intergroup Contacts in Western Schools that the Typical Student of Each Race
experiences by Sector, 1995-2015 .............................................................................................................. 37
Table 9: Exposure to White Students by the Typical Black Student in Private Schools and Black and
White Enrollment in Private Schools by State, 2015-2016 ......................................................................... 38
Table 10: Exposure to White Students by the Typical Hispanic Student in Private Schools and Hispanic
and White Enrollment in Private Schools by State, 2015-2016 .................................................................. 39
Table 11: Private and public schools and enrollment, by state and by race: 2015-2016 ............................ 43
Table 12: Comparisons of Public, Charter, and Private Schools by State, 2015-2016 ............................... 44
Table 13: Low-income student enrollment in Private and public schools and, by state and by Sector:
2015-2016 ................................................................................................................................................... 45

Private Schools in American Education [Working Paper], March 5, 2018
UCLA Civil Rights Project
4
List of Figures
Figure 1: Total Enrollment in Public and Private Schools, 1991-2015 ...................................................... 12
Figure 2: Number of Public and Private Schools, 1995-2015 .................................................................... 13
Figure 3: Racial Composition in Public and Private Schools, 1995-2015 .................................................. 13
Figure 4: K-12 Private School Attendance Rates by Race and Ethnicity, 1995-2015 ................................ 14
Figure 5: Private Schools and Total Enrollments by Sector, 1995-2015 .................................................... 15
Figure 6: Racial Composition in Private Schools by Sector, 1995-2015 .................................................... 16
Figure 7: Total Private Schools by Region, 1995-2015 .............................................................................. 17
Figure 8: Total Enrollment Trends in Private Schools by Region and by Sector, 1995-2015 .................... 18
Figure 9: Racial Composition in Private Schools by Region, 1995-2015 .................................................. 19
Figure 10: Racial Composition in Private Schools by Region and by Sector, 1995-2015.......................... 20
Figure 11: Average Intergroup Contacts that the Typical Student of Each Race experiences, 1995-2015 27
Figure 12: Average Intergroup Contacts that the Typical Student of Each Race experiences by Region,
2015-2016 ................................................................................................................................................... 29
Private Schools in American Education [Working Paper], March 5, 2018
UCLA Civil Rights Project
5
Executive Summary
Private schools have a long and important tradition in U.S. education and have been the focus of a great
deal of political controversy in recent years. There is deep division among Americans over the desirability
of using public funds to finance vouchers for private education—an issue that has become the leading
educational goal of the Trump Administration. Surveys of the public show that substantial majorities of
Americans do not favor voucher policies, yet these efforts have long been supported by significant shares
of the public, the religious groups that operate nonpublic schools, and leaders of one of our national
parties. This deep division is reflected in the extraordinary differences among the states in their adoption
of voucher policies over the past two decades. Examining these differences, along with data on national
and regional trends in private education, provides a useful framework for considering the relationship
between private school enrollment and the impact of voucher policies.
This report explores how the size and share of private education has changed in the U.S. over two
decades, from 1995 to 2015-16 (the most recent federal data), along with how the students are divided
among different kinds of private schools: secular, Catholic, and non-Catholic religious schools. It also
examines the racial composition of these schools, providing key data for evaluating the civil rights
dimension of private schooling and voucher policies. The civil rights questions concern how well private
schools serve students of color, what kinds of schools these students attend, how segregated they are, and
whether students of color are getting a major share of the growth of private schools in the areas they are
growing, especially in the South.
Key findings of the report include:
Student enrollment in private schools peaked in 2001 and has moderately declined over
the past fifteen years. In 2015, private schools served 9 percent of the nation’s students
and accounted for 28 percent of the nation’s schools.
Private schools seem to compete with charter schools. Since its appearance a decade ago,
the growth of charter schools is noticeable. In 2015, private schools serve 4.9 million
students while charter schools enroll 2.7 million students.
The 2015 racial composition of private school enrollment was 68.6% white, 9.3% black,
10.4% Hispanic, 6.9% Asian. The student body of public schools differed substantially
from private schools, comprising 48.7% white, 15.2% black, 26.3% Hispanic, and 5.4%
Asian students,
Private school enrollment rates among white students have not changed over time—one
in eight white students in the nation attend private schools. Meanwhile, private school
attendance rates among non-white students have slightly declined. As of 2015, 5.6
percent of blacks, 3.8 percent of Hispanics, and 11.3 percent of Asians in the nation are
enrolled in private schools.
Students from low-income families are underrepresented in private schools, accounting
for 9% of the private school student body. The secular sector in particular has the

Private Schools in American Education [Working Paper], March 5, 2018
UCLA Civil Rights Project
6
smallest percentage of poor students: 5.4%. In public schools, poor students make up
more than 50% of student enrollment.
White students are overrepresented in private schools, making up 69 percent of private
school enrollment; they comprise 51 percent of total enrollment of school-aged
population in the country. African American and Hispanic students are severely
underrepresented in private schools. The latter comprise over 25 percent of students in
the public sector but only 10 percent of students in private schools.
The South has seen an 11% increase in the number of private schools—non-Catholic
religious schools in particular—over the past two decades unlike other regions in which
private schools have declined over years.
The number of Catholic private schools and Catholic school enrollment have decreased
over the past two decades in the Northeast and Midwest in particular. Enrollment in non-
Catholic religious private schools and secular private schools has grown during the same
period. The growth of non-Catholic religious schools stands out in the Northeast and the
South in particular.
The South has the largest number of schools for both private and public sectors, which
account for one third of the country’s schools. Given the number of schools for both
private and public systems, private schools are most overrepresented in the Northeast.
Black and Hispanic private school students on average experience more diversity
compared to their peers in public schools. White students are the most isolated group in
terms of intergroup contact, and white students in the non-Catholic religious sector across
regions have the most limited intergroup experiences, typically attending schools with
large white majorities.
The secular sector has seen the largest increase in diversity over time compared to
Catholic and non-Catholic religious schools, although the level of diversity does not
reach the same level of public schools.

Private Schools in American Education [Working Paper], March 5, 2018
UCLA Civil Rights Project
7
Private Schools in American Education: A Small and Distinctive Sector of a Vast
Enterprise
Americans are deeply invested in public education—the country’s largest set of public
institutions. The public education system is widely seen as central to the country’s development
as its only near-universal institution. However, private schools have a long and important
tradition in education as well and have been the focus of a great deal of political controversy in
recent years. They are very visible, especially in large cities with overwhelming nonwhite and
poor public school populations, and they can seem in those contexts to be a large sector of the
educational offerings. This is true in some places, especially for white students, but private
schools are not a large share on a state or national level, and their numbers are not increasing. In
fact, they are shrinking slowly, and public schools are gaining share. They have been growing
significantly in recent years in few states.
There is deep division among Americans over the desirability of vouchers for private
education. Surveys of the public show that substantial majorities of Americans do not favor
using public funds to pay for students’ access to private schools, yet these efforts have long been
supported by significant shares of the public, the religious groups that operate nonpublic schools,
and the leaders of one of our national parties. The annual Gallup education poll has been asking
for many years, “Do you favor or oppose allowing students and parents to choose a private
school to attend at public expense?” In 2017, 52 percent were opposed, but 39 percent favored
vouchers. The survey also asked a more specific question: “Some people say public funds should
be used only to pay for public schools that offer tuition-free education for all students. Others say
parents should be able to direct some public funds to any school their child attends, whether
public, private, or religious. This would cover the full cost of public school or the partial cost of
private or religious schools.” The response showed that “61% prefer a system that funds public
schools only vs. 34% support for the voucher option, a broader 27-point gap. Further, when told
that a voucher system either could help public schools by making them compete or hurt them by
reducing their funding, preference for only funding public schools rises to 67%, compared to
26% support for vouchers, a 41-point gap.”1 In other words, we are looking at trends happening
in a country that is deeply divided, a reality reflected in the extraordinary differences among the
states in their embrace of voucher policies (reflected in the state-by-state table of changes over
two decades included in this report). Since the issue has become the leading educational goal of
the Trump Administration, this data on national trends helps set the stage for considering
expanded voucher programs.
This report explores how the size and share of private education has changed in the U.S. over
two decades, from 1995 to 2015-16 (the most recent federal data) and how private school
students are divided among different kinds of schools: secular, Catholic, and non-Catholic
religious schools. The civil rights questions raised concern how well the private schools serve
students of color and students living in poverty, what kinds of schools these students attend, how
segregated they are, and whether students of color are getting a major share of the growth of
private schools in the areas they are growing, especially in the South.
1 49th annual PDK Survey of the Public’s Attitude toward the Public Schools,” supplement to Kappan, Sept. 2017.

Private Schools in American Education [Working Paper], March 5, 2018
UCLA Civil Rights Project
8
U.S. children are overwhelmingly educated in regular public schools. Unlike many
countries where the government has historically supported religious schools and middle class
families avoid public schools, the great majority of U.S. students (about nine-tenths) go to public
schools. The share of students in private schools, which peaked in the mid-20th century, has
declined significantly since that time. Since 2000, public school enrollment is up by millions, but
enrollment in private schools has dropped modestly in spite of the enactment of vouchers or
other subsidies for private school enrollment in several states and the national capital. There is no
real sign of a private school revival except in the South and in a handful of states where they
have been heavily subsidized. The private schools have long been overwhelmingly religious
schools (almost four of every five). Many were originally set up by religious groups, of course,
to protect and perpetuate their religious beliefs. Catholic schools, the largest private sector, are
mostly run by parishes and were initially created to counter perceived anti-Catholic bias in the
public schools when an overwhelmingly Protestant nation was divided over large immigrations
from Catholic countries.2
The issue of public funds for religious schools long faced the dual obstacles: (1) the
prohibition of policies that amounted to the “establishment of religion” by the government,
forbidden by the First Amendment, and (2) the opposition of public school advocates and
religions that did not run their own schools or wanted government to keep out of religious
schooling, fearing regulation of religion. Division over this issue was one of the major reasons
why it was impossible to enact general federal aid to education until 1965, when President
Lyndon Johnson worked out a bargain that included some indirect aid to private schools serving
low-income children and launched what has been the basic federal aid structure ever since.3 The
voucher effort became serious under President Reagan and was a major issue in the l996
presidential campaign. Voucher policies have long been favored by conservatives but were voted
down in referenda in a number of states. Use of federal funds for religious schools was
supported by the increasingly conservative Supreme Court in the l972 Zelman decision. In a
closely divided (5-4) decision, the court authorized funds for religious schools for nonwhite
students locked into weak urban public schools. There have been legal battles in many states
since. Though the federal Constitution says nothing about education, there is specific language
and prohibitions in many state constitutions concerning funding for religious schools (see Green
& Welner, 2018).
Private schools do disproportionately serve white and higher-income families. In contrast,
more than half of public school students are from families so poor that they cannot afford school
lunches. The nation’s private schools show a very different pattern, with only nine percent poor
students. This number is slightly higher for Catholic schools (11 percent), but is only one-
twentieth for the secular private schools. In other words, contemporary U.S. private schools
serve overwhelmingly white and middle class students (Table 13). There has been a dramatic
widening in the economic gap between public and private school enrollment since the late 1960s,
with a substantial drop in private enrollment not only of students from poor families but also
2 Anthony S. Bryk, Valerie E. Lee, Peter B. Holland Catholic Schools and the Common Good. Cambridge: Harvard
Univ. Press, l993, pp. 23-33. 3 G. Orfield, “Lyndon Johnson and American Education,” in Robert H. Wilson, Norman J. Glickman and Laurence
E Lynn, Jr., LBJ’s Neglected Legacy, Austin: Univ. of Texas Press, 2015, pp. 204-207.

Private Schools in American Education [Working Paper], March 5, 2018
UCLA Civil Rights Project
9
among middle-income families. Only the proportion of higher-income families going to private
schools has held constant.4 This helps explain the pressure—once vouchers or subsidies through
tax provisions are created for poor children—to expand them to students from higher income
ranges, many of whom are in private schools and finding it hard to pay the bills.
The strongest evidence for the academic strength of private religious schools came from
studies of Catholic schools a generation ago,5 but the Catholic schools have declined
dramatically from their peak in l965, and their rapid decline has continued since 2000. In the
past, parish schools had modest budgets because there was a large supply of nuns who
volunteered their time and skills. However, women’s religious orders in the Catholic Church
have drastically declined since, greatly increasing the cost of labor for the schools.6 The growth
in private schools is largely among non-Catholic religious schools, including many
fundamentalist Christian schools. Private schools are very weakly regulated in many states.
There is some evidence that the non-Catholic religious schools place much more priority on
religious teaching and less on general academic achievement. The Zelman decision said nothing
prohibiting the subsidization of religious instruction or proselytism.
Only a very small share of black, Latino and American Indian children attend private
schools. The growth in private schools has been most rapid in the South, which has become
predominantly nonwhite in its school age population. Curiously, although the West has by good
measure the smallest share of whites, private school enrollment is not growing significantly
there, and the number of private schools is down significantly. The number of low-income
private school students is very low there. Among the states with voucher programs, some,
including D.C., have actually seen shrinkage in private school enrollment while a few, including
Indiana and Florida, have seen substantial growth. It seems likely that the outcomes may be
related both to the characteristics of the programs and subsidies and the alternatives that exist for
families. It may depend upon whether or not the voucher programs include funds or tax subsidies
for middle class families.
Black and Latino students, on average, experience significantly less segregation in
private schools—not surprising, given the very low percent of such students in typical private
schools and in the overall private school population. In Washington, D.C., for example, a white
child is seven times as likely as a black child to attend private schools, something that half of
white children in the city do but only one in fourteen black children. In spite of that, given the
large white enrollment in private schools and the relatively small black enrollment, black private
school students experience less segregation, on average. Private schools attended by white
students across the nation are slowly becoming diverse but remain overwhelmingly white on
average. One clear advantage of the private schools now is that the small minority of black and
Latino students are considerably less segregated than in the public system, primarily because
there are so few students of color in private schools and a very disproportionate share of whites.
In a region where only 3 or 5 percent of the private students are black, it is hard to segregate
4 Richard J. Murnane and Sean F. Reardon, “Long-Term Trends in Private School Enrollments by Family Income,”
NBER Working Paper No. 23571, Cambridge: National Bureau of Economic Research. July 2017. 5 Bryk, Lee, and Holland, l993. 6 The number of religious sisters in the U.S. declined by 72% between 1965 and 2014. Michael Lipka, “U.S. nuns
face shrinking numbers and tensions with the Vatican,” FactTank, Pew Research Center, Aug. 2014.

Private Schools in American Education [Working Paper], March 5, 2018
UCLA Civil Rights Project
10
blacks from whites. If the private schools were to expand substantially and serve a significant
share of the nonwhite majority of students, the integration numbers would likely change and so
would the race and class composition.
In terms of creating a real alternative for students of color, the analysis must begin with
the fact that these schools have historically served a small share of black students and an even
smaller share of Latino students. In both of the states we are closely examining, the expansion of
vouchers has taken place as the overall private school share of enrollment of students of color
was actually declining. Based on the history and the recent trends, private schools are a minor
factor in the education of blacks and Latinos. Without major changes adding substantial money,
expanding the system without regulations would serve an overwhelmingly white higher-income
population unless there were specific civil rights polices, priorities, and accountability. Making
untargeted subsidies available will likely increase the participation of white, Asian and middle-
class students. We know from research on school choice conducted by Charles Clotfelter and
others that, when holding constant other factors, whites will choose to move from schools with
more nonwhites to whiter schools, triggering re-segregation.7 The much whiter racial
composition of private schools could well be an important reason for white enrollment choices.8
As the share of nonwhite students in public schools continues to grow, it is important to watch
this issue.
Part of the difficulty in assessing private schools is that they have an important overlap
with charter schools. When charter schools provide a major alternative to public schools at no
cost to the families, it undermines a substantial part of the argument for subsidizing access to
private schools. Although charter schools are publicly funded and are more subject to regulation
than private schools, they typically are given a large degree of autonomy, are not directly
supervised by elected boards or officials, and most are independent of teachers unions. Indeed,
blocking large voucher programs was one of the attractions of charters to those who were
opposed to a large transfer of resources to non-public schools and ending the tradition of
separation of church and state in American education. The whole situation is made even more
complex when religious schools convert into charters, as did a whole group of Catholic schools
in Washington. Though these schools no longer teach religion in school time, they retain staff
from that religion, and many former students from the same religion continue to attend the same
school. And, of course, public schools and charter schools often make provisions for groups that
wish to do voluntary religious instruction outside of regular class time. As we examine the data
presented here, the important thing to remember is that the private school trends are taking place
in the context of a transforming national population and a broad expansion of school choice,
including a rapidly growing charter system. By 2015, there were 2.7 million charter school
students and the rapidly growing charter sector was already more than half as big as the private
school sector.
When there is a major increase in private school support, do the schools become whiter or
more integrated? Private schools are becoming significantly more diverse as a group, but they
7 Charles T. Clotfelter. After "Brown": The Rise and Retreat of School Desegregation Princeton University Press,
2006. 8 Robert W. Fairlie and Alexandra M. Resch, “Is There “White Flight” into Private Schools? Evidence from the
National Educational Longitudinal Survey,” Review of Economics and Statistics, 2002 84:1, 21-33.

Private Schools in American Education [Working Paper], March 5, 2018
UCLA Civil Rights Project
11
are experiencing a much slower change than the overall change in the country—so they are
increasingly diverging from the public school levels. When the whole society is changing
rapidly, private schools can become more unrepresentative simply by changing significantly
more slowly than their public counterparts.
What is really distinctive about private schools in racial terms is the very high isolation of
whites within this system.9 One of the obvious risks of an untargeted voucher system is that it
could have some of the same effects the “segregation academies” of the l960s did. Those
institutions were private, highly segregated, often religious schools explicitly created to provide a
refuge for whites who did not want their children going to desegregated public schools. They
were fueled by fear and provided a basic mechanism for white flight. These schools, where they
had a major impact, undermined support and funding for public schools. In an extreme case, a
Virginia district voted to stop funding public schools altogether for several years and distributed
funds for vouchers instead. As there was no voucher school created for black students, this
effectively barred them from accessing education. The Supreme Court struck down the plan in
the 7-2 Griffin decision holding that the local government had denied the black student the
opportunity they provided to other students. Griffin v. County School Board of Prince Edward
County (377 U.S. 218 (1964). If modern-day vouchers reached the point where they were seriously
taking funding away from public schools that were overwhelmingly occupied by students of
color in some areas, this doctrine might be applicable. So far, however, the changes are modest
except in a handful of states.
What we see in the following tables shows the trends and the variation within the
country. It does not show what would happen if there were a major federal voucher initiative, but
our study of the only existing significant federal program shows a modest impact. The 2017 tax
reform bill included an important subsidy for private schools by allowing tax-sheltered savings
accounts like those provided for college savings to be used to finance K-12 private school
education. This means that families with enough money to save substantial amounts years in
advance can earn large profits on investments and pay no tax, which amounts to a subsidy of a
third or more for high-income families. Unsurprisingly, only families with high incomes, an
overwhelmingly white and Asian population, have used these subsidies significantly.
These tables do not answer the large questions about the future of private schools and the
varied policies that may evolve. They do show very clearly, the role private schools have played
in the past two decades and what the basic pattern of changes has been. Without very large
policy changes, the trends and patterns show that private schools are likely to play a very small
role in the future of American communities of color, though they may be quite important for the
students who attend them and in some localities or states. This makes careful analysis of the
large state and federal programs very important in informing the conversation.
9 Emma Brown, “The overwhelming whiteness of U.S. private schools, in six maps and charts,” Washington Post,
March 29, 2016

Private Schools in American Education [Working Paper], March 5, 2018
UCLA Civil Rights Project
12
National Trends: Private School Declining Share, Public School Growth
After increasing from 4.8 million to 5.4 million between school years (SY) 1991-92 and 2001-02
private school enrollment gradually fell to 4.9 million in 2015-16, according to analysis of U.S.
National Center for Education Statistics Private School Universe Survey data (Figure 1). Over
the past two decades, there was very little net change in enrollment in spite of all the public
discussion and policy changes concerning vouchers. In SY 2015–16, on the other hand, there
were 50.3 million public school students, an increase of 19.7 percent from the 42 million
students reported in SY 1991-92. This means that the private school share of all U.S. students
dropped from 10.4 percent to 8.9 percent over the past two decades. As of SY 2015-16, private
schools accounted for 27.5 percent of the nation's schools, but only enrolled 8.9 percent of the
national total, likely due to their small size (Figure 2). Additionally, since the advent of charter
schools about a decade ago, the number of charter schools has risen, and they have attracted a
noticeable portion of public students across the nation.
Figure 1: Total Enrollment in Public and Private Schools, 1991-2015
Source: U.S. Department of Education, National Center for Education Statistics (NCES), Common Core of Data 1991-92
through 2015-16; Private School Universe Survey, 1991-92 through 2015-16.Note: Analysis included private schools offering
no grade higher than kindergarten.
0
10,000
20,000
30,000
40,000
50,000
60,000
In t
hou
san
ds
1991 1995 2001 2003 2005 2007 2009 2012 2013 2015
Private 4,890 5,147 5,440 5,213 5,147 5,072 4,700 4,495 4,576 4,904
Charter 1,610 2,269 2,522 2,722
Public 42,047 44,840 47,672 48,540 49,113 49,291 47,751 47,502 47,523 47,608
Total Enrollment in Public and Private Schools
Public Charter Private

Private Schools in American Education [Working Paper], March 5, 2018
UCLA Civil Rights Project
13
Figure 2: Number of Public and Private Schools, 1995-2015
Source: NCES Common Core of Data 1995-96, 2005-06, and 2015-16; Private School Universe
Survey, 1995-96, 2005-06, and 2015-16.Note: Analysis included private schools offering no grade
higher than kindergarten.
White students were the largest group in both public (48.7 percent) and private schools (68.6
percent) in 2015, but the white shares have decreased over time. Since a decade ago, Hispanic
students have been the second largest group, rapidly increasing in public schools. Hispanic
students now account for more than one-quarter of the student body in public schools. The shares
of black and Latino students were similar in private schools over time. The black share, in
particular, remained around the same over the past 25 years in both public (15 percent) and
private schools (9 percent). The proportion of Asian students grew gradually in both systems,
increasing faster in private schools (Figure 3).
Figure 3: Racial Composition in Public and Private Schools, 1995-2015
Source: NCES Common Core of Data 1995-96, 2005-06, and 2015-16; Private School Universe Survey, 1995-96, 2005-06, and
2015-16.
Note: Total percentages do not add up to 100 percent due to the exclusion of Native American students and multiracial students
82,763 89,567 91,128
34,934 35,054 34,576
-
20,000
40,000
60,000
80,000
100,000
120,000
1 9 9 5 - 9 6 2 0 0 5 - 0 6 2 0 1 5 - 1 6
Public Private
64.056.6
48.7
77.8 75.3 68.6
16.516.9
15.2
9.3 9.6 9.3
14.620.6
26.3
8.0 9.2 10.4
3.8 4.75.4
4.6 4.1 6.9
1 9 9 5 - 9 6 2 0 0 5 - 0 6 2 0 1 5 - 1 6 1 9 9 5 - 9 6 2 0 0 5 - 0 6 2 0 1 5 - 1 6
P U B LIC S C H O O LS P R IV AT E S C H O O LS
Per
cen
t (%
)
White Black Hispanic Asian

Private Schools in American Education [Working Paper], March 5, 2018
UCLA Civil Rights Project
14
(for 2015-16 only).
The percentage of white students attending private schools has not changed significantly over the
past two decades. In general, one in eight white K-12 students have been enrolled in private
schools. In 1995, around 6 percent of black and Hispanic students attended private schools, but
the black and Hispanic private school enrollment rates dropped to 5.6 percent and 3.8 percent,
respectively. Asian private school enrollment rates were similar to those of white students in
1995 but declined slightly to 11.3 percent in 2015, still much higher than the black and Hispanic
levels (Figure 4).
Figure 4: K-12 Private School Attendance Rates by Race and Ethnicity, 1995-2015
Source: NCES Common Core of Data 1995-1996, 2005-2006, and 2015-2016; Private School Universe Survey, 1995-1996,
2005-2006, and 2015-2016.
Note: Total percentages do not add up to 100 percent due to the exclusion of Native American students and multiracial students
in this chart.
Table 1: Private School Enrollment Rates, by Race/Ethnicity and Sector, 2015-2016
White Black Hispanic Asian Native
American Multiracial Total
Public 87.8 94.4 96.2 88.7 95.4 88.9 91.0
Private 12.2 5.6 3.8 11.3 4.6 11.1 9.0
Catholic 4.5 1.9 2.2 3.7 1.9 4.3 3.5 Other Religious 5.1 2.5 0.9 3.8 1.6 3.3 3.5
Secular 2.5 1.2 0.6 3.8 1.1 3.5 2.0
Total 100.0 100.0 100.0 100.0 100.0 100.0 100.0 Source: NCES Common Core of Data 2015-16; NCES Private School Universe Survey, 2015-16.
In 2015, 12.2 percent of white students, 5.6 percent of black students, 3.8 percent of Hispanic
students, 11.3 percent of Asian students, 4.6 percent of Native American students, and 11.1
percent of multiracial students were enrolled in private schools. White students were the most
likely to attend private schools in general, whereas Hispanic students were the least likely (96.2
percent attended public schools). Of Hispanics enrolled in private schools, those enrolled in
Catholic schools outnumbered those enrolled in non-Catholic religious or secular private schools.
12.4
6.1 6.0
12.3 12.3
5.7
4.6
8.4
12.2
5.6
3.8
11.3
-
2.0
4.0
6.0
8.0
10.0
12.0
14.0
White Black Hispanic Asian
Per
cent
(%)
1995-96
2005-06
2015-16

Private Schools in American Education [Working Paper], March 5, 2018
UCLA Civil Rights Project
15
Asian and multiracial students were significantly more likely than white students to attend
secular private schools (Table 1).
The 2015 racial composition of public school enrollment was 48.7 percent white, 15.2 percent
black, 26.3 percent Hispanic, 5.4 percent Asian, 1 percent Native American, and 3.4 percent
multiracial. Private school enrollment, by contrast, was 68.6 percent white, 9.3 percent black,
10.4 percent Hispanic, 6.9 percent Asian, 0.5 percent Native American, and 4.3 percent
multiracial. White, Asian, and multiracial students were substantially overrepresented in private
schools. The most drastic overrepresentation was of white students, who made up 65.9% of
private school enrollment despite comprising only 50.6 percent of total enrollment of school-
aged population in the country. Black, Hispanic, and Native American students were severely
underrepresented in private schools, with Hispanic students experiencing the most
underrepresentation (10.4 percent compared to 25 percent of total enrollment) (Table 2).
Table 2: Racial Composition of School Enrollments, by Sector and Type of Private School,
2015-2016
White Black Hispanic Asian Native
American Multiracial Total
Public 48.7 15.2 26.3 5.4 1.0 3.4 100.0
Private 68.6 9.3 10.4 6.9 0.5 4.3 100.0
Catholic 65.9 7.8 15.6 5.8 0.5 4.3 100.0 Other Religious 73.1 10.6 6.6 5.9 0.4 3.3 100.0
Secular 65.2 9.3 8.0 10.8 0.5 6.2 100.0
Total 50.6 14.8 25.0 5.5 1.0 3.5 100.0 Source: NCES Common Core of Data 2015-16; NCES Private School Universe Survey, 2015-16.
Figure 5: Private Schools and Total Enrollments by Sector, 1995-2015
Source: NCES Private School Universe Survey, 1995-1996, 2005-0606, and 2015-2016.
Both the number of Catholic private schools and Catholic private school enrollment have
declined in the past two decades. Between 1995 and 2015, Catholic school enrollment dropped
from 2.5 million to 1.9 million students. Non-Catholic religious private schools rose in
8,406
15,082
11,447
7,744
16,164
11,146
7,008
16,264
11,304
0
2,000
4,000
6,000
8,000
10,000
12,000
14,000
16,000
18,000
Catholic Religious Secular
Number of Schools
1995-96 2005-06 2015-16
2,522.8
1,780.1
843.8
2,249.0
1,911.5
986.4
1,901.5 1,932.8
1,069.3
-
500.0
1,000.0
1,500.0
2,000.0
2,500.0
3,000.0
Catholic Religious Secular
In t
hou
san
ds
Total Enrollment
(in thousands)
1995-96 2005-06 2015-16

Private Schools in American Education [Working Paper], March 5, 2018
UCLA Civil Rights Project
16
prominence between 1995 and 2005, with the number of schools increasing more than a
thousand from 15,082 to 16,164 and enrollment increasing by over a million students. However,
the number of institutions and enrollment in this category has remained fairly stagnant over the
past decade, with extremely slight increases in both. Over the 20 years, secular private schools
increased their enrollment by over 200,000 students, yet the number of secular institutions
actually decreased by 143 schools, indicating growth in the average student body size at these
institutions.
Figure 6: Racial Composition in Private Schools by Sector, 1995-2015
Source: NCES Private School Universe Survey, 1995-1996, 2005-0606, and 2015-2016.
Note: Total percentages do not add up to 100 percent due to the exclusion of Native American students and multiracial students
76.3 74.165.9
8.4 7.9
7.8
10.7 12.6
15.6
4.3 3.55.8
0.0
10.0
20.0
30.0
40.0
50.0
60.0
70.0
80.0
90.0
100.0
1995-96 2005-06 2015-16
Per
cen
t (%
)
Catholic
White Black Hispanic Asian
81.2 77.8 73.1
9.510.8
10.6
5.2 6.36.6
3.7 3.65.9
0.0
10.0
20.0
30.0
40.0
50.0
60.0
70.0
80.0
90.0
100.0
1995-96 2005-06 2015-16
Other Religious
White Black Hispanic Asian
74.8 73.365.2
11.5 11.0
9.3
5.9 7.2
8.0
7.3 6.1
10.8
0.0
10.0
20.0
30.0
40.0
50.0
60.0
70.0
80.0
90.0
100.0
1995-96 2005-06 2015-16
Secular
White Black Hispanic Asian

Private Schools in American Education [Working Paper], March 5, 2018
UCLA Civil Rights Project
17
Regional Trends: Southern Private School Growth
Changes in the number of private schools over the past two decades clearly reflect regional
differences. Our analyses show that the South has the largest number of schools for both private
and public systems, which account for one third of the nation’s schools. Following the South, the
Midwest has one quarter of the nation’s schools, including both private and public sectors.
However, private schools are most overrepresented in the Northeast, when compared to its
respective percentage of all schools (22.5 percent vs. 17.9 percent). The 6,491 private schools in
the West made up the lowest percentage of total private schools (18.8 percent), and this share
was 4.3 percentage points lower than the share of the nation’s public schools in this region
(Table 3).
Table 3: Number of Schools by Sector and by Region, 2015-2016
Region Public Private All Schools
Number Percent (%) Number Percent (%) Number Percent (%)
Northeast 14,451 16.2 7,771 22.5 22,222 17.9
Midwest 23,092 25.9 8,985 26 32,077 25.8
South 31,224 34.8 11,328 32.8 42,552 34.3
West 20,685 23.1 6,491 18.8 27,176 21.9
Total 89,452 100 34,576 100 124,028 99.9 Source: NCES Common Core of Data, 2015-2016; NCES Private School Universe Survey, 2015-2016.Note: See
appendix for the Census defined regions. In this report we use the Census definition of regions, not the definition
normally used in the Civil Rights Project reports.
Figure 7: Total Private Schools by Region, 1995-2015
Source: NCES Private School Universe Survey, 1995-1996, 2005-2006, and 2015-2016.
Between 1995 and 2015, the number of private schools in the Northeast declined by 8.2 percent,
or about 700 institutions. The West saw a 13.6 percent reduction from 1995 levels. Private
school growth in the Midwest was modest, increasing by only 3 percent between 1995 and 2015.
The South was the only region where private school numbers increased each decade. Between
1995 and 2015, the region experienced a 10.7 percent increase in the number of private schools.
8,468 8,278 7,771
8,720 8,163
8,985
10,232 10,830
11,328
7,515 7,783
6,491
1995-
96
2005-
06
2015-
16
1995-
96
2005-
06
2015-
16
1995-
96
2005-
06
2015-
16
1995-
96
2005-
06
2015-
16
Northeast Midwest South West

Private Schools in American Education [Working Paper], March 5, 2018
UCLA Civil Rights Project
18
In 2015, the South had the most private schools (11,328), followed by the Midwest (8,985) and
the Northeast (7,771). The West had the least, with 6,491 institutions (Figure 7).
Figure 8: Total Enrollment Trends in Private Schools by Region and by Sector, 1995-2015
Source: NCES Private School Universe Survey, 1995-1996, 2005-2006, and 2015-2016.
Between 1995 and 2015, enrollment in Catholic private schools decreased in all regions, with the
most drastic decline being a decrease of 358,800 students (-45%) in the Northeast. Declines in
the South and West were more modest. Changes in enrollment at non-Catholic religious private
schools were mixed, with increases in the Northeast and South and modest declines in the West.
Secular private schools saw growth in all regions and experienced a particularly large growth of
students (+35.4%) in the South (Figure 8).
Catholic Religious Secular Catholic Religious Secular Catholic Religious Secular Catholic Religious Secular
Northeast Midwest South West
1995-96 795.3 299.5 225.7 870.1 394.8 102.9 491.1 680.6 308.9 366.2 405.2 206.4
2005-06 648.1 323.1 257.1 749.7 382.0 116.6 494.1 800.6 354.7 357.1 405.8 257.9
2015-16 437.5 419.3 278.8 682.6 416.7 114.2 446.5 793.2 418.1 334.9 303.6 258.2
-
100.0
200.0
300.0
400.0
500.0
600.0
700.0
800.0
900.0
In t
ho
usa
nd
s
1995-96 2005-06 2015-16
Private Schools in American Education [Working Paper], March 5, 2018
UCLA Civil Rights Project
19
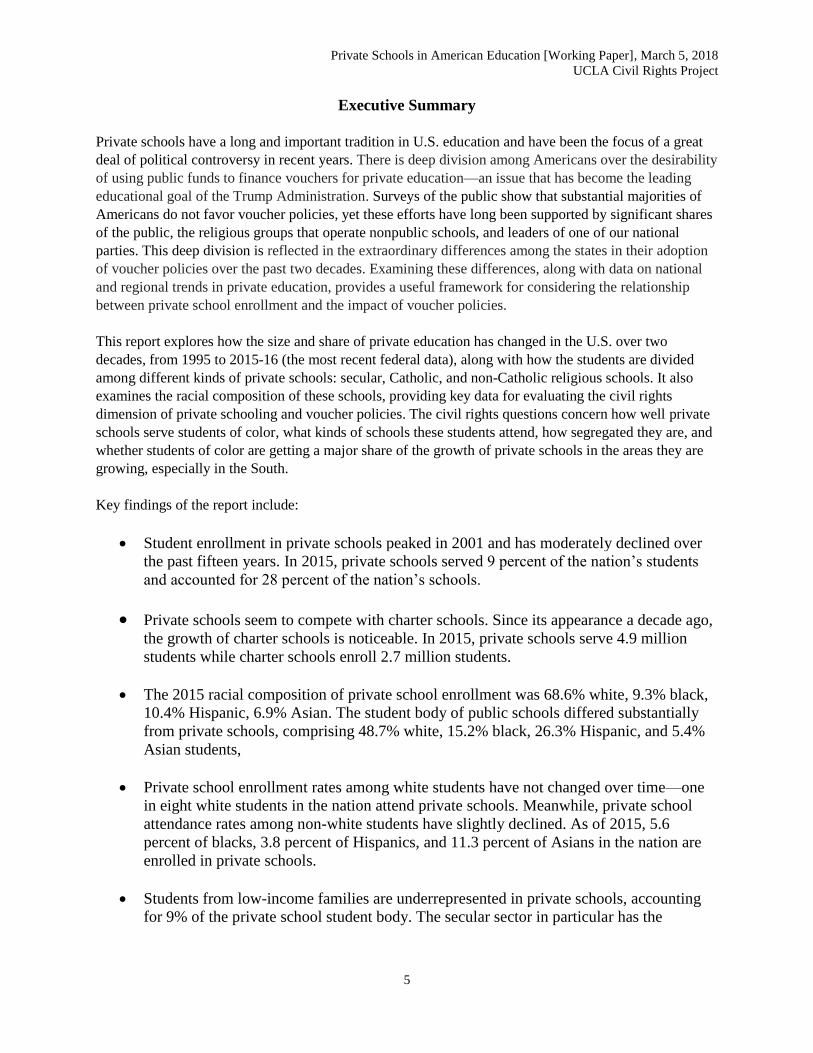
Figure 9: Racial Composition in Private Schools by Region, 1995-2015
Source: NCES Private School Universe Survey, 1995-1996, 2005-2006, and 2015-2016.
Note: Total percentages do not add up to 100 percent due to the exclusion of Native American students and multiracial
students (for 2015-16 only).
Between 1995 and 2015, the percentage of white students in private school student bodies
decreased in all regions, with the largest reduction (10 percentage points) being in the West.
During the same time period, the percentage of black students decreased in the Northeast and
West, but increased in the Midwest and South. The Hispanic portion of private school student
bodies increased across all regions, with the largest increase being in the Midwest (from 3.9 to
7.0 percent). The Asian portion of private school student bodies increased in all regions, with the
largest increase in the South (from 2.5 to 5 percent) (Figure 9).
78.1 75.4 72.7
85.2 83.9 76.8 79.4 76.2
67.6 64.5 63.5 54.2
11.0 11.7 9.1
8.5 8.1
8.6 10.0
11.3
12.4 6.8 6.1
4.5
7.2 8.2 7.6
3.9 4.9 7.0
7.8 8.9
11.3
15.0 16.5
16.9
3.5 3.4 6.6
2.0 1.9 3.8
2.5 2.6 5.0 12.7 9.8
15.3
-
10.0
20.0
30.0
40.0
50.0
60.0
70.0
80.0
90.0
100.0
1995-
96
2005-
06
2015-
16
1995-
96
2005-
06
2015-
16
1995-
96
2005-
06
2015-
16
1995-
96
2005-
06
2015-
16
Northeast Midwest South West
Per
cen
t (%
)
White Black Latino Asian

Private Schools in American Education [Working Paper], March 5, 2018
UCLA Civil Rights Project
20
Figure 10: Racial Composition in Private Schools by Region and by Sector, 1995-2015
0
76.872.2
65.8
84.8 83.1 83.3
73.9 73.9
0
10.111.6
11.2
10.6 10.85.6
15.0 13.0
0
9.411.5
13.0
2.83.2
3.0 5.3 6.2
0
3.6 3.46.4
1.72.1
4.95.6 5.1
0
10
20
30
40
50
60
70
80
90
100
1995-
96
2005-
06
2015-
16
1995-
96
2005-
06
2015-
16
1995-
96
2005-
06
Catholic Religious Secular
Per
cent
(%)
Northeast
85.7 85.8
77.5
87.784.1
79.0
70.7 70.764.7
7.3 5.8
6.5
8.710.4
11.5
18.4 15.3
11.2
4.8 5.7
9.4
2.0 3.03.7 4.2
5.3
4.8
1.8 1.53.0
1.4 1.7
3.2 6.05.6
10.7
0.0
10.0
20.0
30.0
40.0
50.0
60.0
70.0
80.0
90.0
100.0
1995-
96
2005-
06
2015-
16
1995-
96
2005-
06
2015-
16
1995-
96
2005-
06
2015-
16
Catholic Religious Secular
Per
cent
(%)
Midwest
White Black Hispanic Asian

Private Schools in American Education [Working Paper], March 5, 2018
UCLA Civil Rights Project
21
Source: NCES Private School Universe Survey, 1995-1996, 2005-2006, and 2015-2016.
Note: Total percentages do not add up to 100 percent due to the exclusion of Native American students and multiracial students (for 2015-16 only).
74.9 73.6
64.0
81.377.1
69.4
82.477.6
67.8
10.08.7
9.8
10.613.2
15.0
8.810.6
10.3
12.5 14.2
18.2
5.6 6.5
8.3
5.16.8
9.8
2.5 2.24.1
2.2 2.44.1
3.4 3.7
7.5
0.0
10.0
20.0
30.0
40.0
50.0
60.0
70.0
80.0
90.0
100.0
199
5-9
6
200
5-0
6
201
5-1
6
199
5-9
6
200
5-0
6
201
5-1
6
199
5-9
6
200
5-0
6
201
5-1
6Catholic Religious Secular
Per
cent
(%)
South
White Black Hispanic Asian
54.6 53.845.1
72.2 69.160.6
66.7 68.1
58.4
5.1 4.5
3.6
7.56.6
4.7
8.3 7.5
5.3
24.9 26.9
28.3
9.311.6
11.5
8.5 9.8
8.4
14.1 10.0
13.0
9.99.1
15.6
15.8 10.6
17.8
0.0
10.0
20.0
30.0
40.0
50.0
60.0
70.0
80.0
90.0
100.0
1995-
96
2005-
06
2015-
16
1995-
96
2005-
06
2015-
16
1995-
96
2005-
06
2015-
16
Catholic Religious Secular
Per
cent
(%)
West
White Black Hispanic Asian

Private Schools in American Education [Working Paper], March 5, 2018
UCLA Civil Rights Project
22
Between 1995 and 2015, Catholic private schools in all regions experienced a rise in the
nonwhite portion of the student body. Northeastern Catholic private schools saw an increase in
the black portion of the student body, but this number decreased in the Midwest, South, and
West. The Hispanic portion of the student body in Catholic private schools increased in all
regions, and the Asian portion of the student body increased in every region but the West. Non-
Catholic religious private schools also saw a decrease in the white portion of the student body.
The black portion of these schools’ student bodies decreased in the Northeast and West, yet
increased in the Midwest and South. The Hispanic and Asian portions increased across all
regions, reflecting the large immigrations of the 1980s until the Great Recession. Secular private
schools experienced a decrease in the white portion of their student bodies. The black portion of
these schools decreased in every region except the South. The Hispanic portion increased in
every region except the West, where it experienced a very slight decline. The Asian portion
increased in every region. All three sectors experienced a decrease in the portion of white
students in every region, mixed changes in the portion of black students, and mostly across-the-
board increases in the Hispanic and Asian portions (Figure 10).

Private Schools in American Education [Working Paper], March 5, 2018
UCLA Civil Rights Project
23
Student Enrollment in Private and Public Schools in States with Voucher Programs
Fourteen states offer voucher programs, will vary greatly in their characteristics and target
populations. In general, mixed patterns emerge in terms of overall effects of voucher programs,
although the effects of the programs vary depending on each state’s program content. In some
states (e.g., Ohio and Vermont), both private and public schools have experienced substantial
drops in total enrollment. However, the decreasing rates for the private and public sectors differ
from state to state. In contrast, some states have witnessed a huge increase in total enrollment in
both private and public sectors (e.g., Florida, Georgia, Indiana, North Carolina, and Utah), in
several cases likely influenced by large growth in state population. With regard to the growth of
public and private schools, Washington D.C. requires further investigation. DC's public school
total enrollment grew by 2 percent for the past ten years, but its private school enrollment
declined by 9 percent, which may well be related to DC charter schools' significant growth for
the past ten years. For Georgia and Indiana, the expansion of their private schools outpaced the
growth of their public schools, although relationships between their voucher programs and the
overall increase in private schools remain unknown (Table 4).
Table 4: Total Enrollment and Racial Composition of Private and Public Schools in States with
Voucher Laws, 1995-96 through 2015-16
Private Schools
Public Schools
1995-
96 2005-
06 2015-
16 Percentage
Change* 1995-
96 2005-
06 2015-
16 Percentage
Change*
Arizona Total
Enrollment 46,290 52,006 46,265 -0.06% 722,511 1,018,451 1,089,339 50.77%
% White 71.3 65.8 57.8 56.5 46.9 39.7
% Black 3.3 3.5 3.6 4.3 5.2 5.3
% Hispanic 18.1 22.6 23.8 30.2 39.6 44.8
% Asian 2.8 3.0 5.0 1.7 2.5 3.1
% Native
American 4.5 5.0 4.5 7.3 5.8 4.5
% Multiracial 5.2 2.7
Washington
DC
Total
Enrollment 17,480 18,220 15,856 -9.29% 79,802 71,607 81,307 1.89%
% White 47.4 48.6 53.6 4.0 4.5 10.4
% Black 44.4 41.8 25.7 87.6 82.9 70.3
% Hispanic 4.8 5.9 10.8 7.0 11.0 15.6
% Asian 3.3 3.4 3.7 1.4 1.5 1.6
% Native
American 0.1 0.3 0.1 0.0 0.1 0.2
% Multiracial 6.2 1.9
Florida Total
Enrollment 256,975 325,963 328,509 27.84% 2,172,841 2,614,178 2,727,105 25.51%
% White 73.1 66.9 53.1 57.5 49.8 39.7
% Black 7.1 11.1 14.0 25.3 23.5 22.1
% Hispanic 17.0 18.7 24.7 15.3 24.1 31.7
% Asian 2.6 2.2 4.3 1.8 2.3 2.8
% Native
American 0.3 1.1 0.3 0.2 0.3 0.3
% Multiracial 3.6 3.4
Georgia Total
Enrollment 99,413 127,275 167,913 68.90% 1,311,126 1,552,319 1,753,296 33.72%
% White 81.1 79.5 75.0 58.2 49.2 41.1
% Black 15.2 13.8 13.7 37.9 39.2 36.9
% Hispanic 1.5 3.3 4.0 2.2 8.7 14.6
% Asian 2.1 2.3 4.1 1.6 2.8 3.9
% Native
American 0.1 1.1 0.1 0.1 0.1 0.2

Private Schools in American Education [Working Paper], March 5, 2018
UCLA Civil Rights Project
24
% Multiracial 3.0 3.4
Indiana Total
Enrollment 100,764 118,885 149,460 48.33% 971,499 1,030,582 1,045,085 7.57%
% White 88.9 88.3 83.4 85.6 80.4 69.3
% Black 6.7 5.6 5.0 11.1 12.4 12.4
% Hispanic 3.1 3.8 6.6 2.3 5.7 11.1
% Asian 1.3 1.4 2.0 0.8 1.2 2.2
% Native American
0.1 0.9 0.3 0.2 0.3 0.2
% Multiracial 2.7 4.7
Louisiana Total
Enrollment 147,681 124,968 152,955 3.57% 797,366 639,218 714,923 -10.34%
% White 82.8 83.5 70.9 51.0 51.9 45.5
% Black 12.4 11.1 20.7 46.0 43.9 44.2
% Hispanic 2.9 2.8 3.2 1.1 2.1 5.9
% Asian 1.8 1.9 3.4 1.3 1.3 1.6
% Native American
0.1 0.7 0.4 0.5 0.8 0.7
% Multiracial 1.3 2.0
Maine Total
Enrollment 16,986 18,894 17,273 1.68% 213,768 195,418 176,396 -17.48%
% White 96.5 93.7 85.3 97.3 95.1 90.3
% Black 1.0 2.0 2.4 0.8 2.0 3.4
% Hispanic 0.7 1.2 2.1 0.4 0.9 2.0
% Asian 1.4 2.4 7.8 0.9 1.4 1.6
% Native American
0.5 0.6 0.8 0.6 0.5 0.7
% Multiracial 1.6 2.1
Mississippi Total
Enrollment 50,427 50,931 38,168 -24.31% 506,272 494,954 487,178 -3.77%
% White 92.0 88.3 83.1 47.7 46.5 44.8
% Black 6.3 9.5 10.9 51.0 51.2 49.2
% Hispanic 0.4 0.9 2.8 0.3 1.4 3.4
% Asian 1.1 0.7 2.1 0.6 0.8 1.1
% Native
American 0.1 0.6 0.2 0.4 0.2 0.2
% Multiracial 1.0 1.3
North
Carolina
Total
Enrollment 82,652 102,919 110,242 33.38% 1,182,780 1,408,664 1,536,724 29.92%
% White 87.8 82.5 76.8 64.6 56.7 49.8
% Black 9.1 12.1 8.9 30.7 31.4 25.7
% Hispanic 1.2 2.5 5.6 1.9 8.4 16.2
% Asian 1.6 1.7 4.7 1.3 2.1 3.1
% Native
American 0.3 1.1 0.4 1.5 1.4 1.3
% Multiracial 3.6 3.8
Ohio Total
Enrollment 259,225 225,324 222,881 -14.02% 1,837,042 1,785,820 1,708,484 -7.00%
% White 88.7 87.2 79.2 82.2 79.0 71.4
% Black 7.9 8.1 10.4 15.3 17.0 16.3
% Hispanic 1.7 2.4 3.8 1.4 2.4 5.1
% Asian 1.5 1.3 3.1 1.0 1.4 2.2
% Native
American 0.1 1.0 0.1 0.1 0.1 0.1
% Multiracial 3.4 4.8
Oklahoma Total
Enrollment 24,844 30,208 26,977 8.59% 610,793 634,739 692,546 13.38%
% White 84.9 81.8 72.9 69.5 59.6 50.0
% Black 6.1 5.2 4.6 10.4 10.9 8.9
% Hispanic 3.3 5.8 6.9 3.9 8.9 16.2
% Asian 2.9 3.8 6.9 1.3 1.7 2.3
% Native
American 2.8 3.5 5.5 15.0 18.9 14.3
% Multiracial 0.0 3.2 8.4
Utah Total
Enrollment 13,076 17,255 17,636 34.88% 475,518 497,873 636,734 33.90%
% White 87.5 81.5 72.3 90.3 81.9 75.4

Private Schools in American Education [Working Paper], March 5, 2018
UCLA Civil Rights Project
25
% Black 2.0 3.1 4.0 0.7 1.3 1.4
% Hispanic 6.4 8.0 10.9 5.4 12.2 16.5
% Asian 3.5 5.2 7.3 2.2 3.1 3.3
% Native
American 0.6 2.1 0.8 1.4 1.5 1.1
% Multiracial 4.8 2.3
Vermont Total
Enrollment 9,872 10,389 9,339 -5.40% 105,565 93,858 84,355 -20.09%
% White 93.4 92.3 89.5 97.3 95.5 90.8
% Black 2.5 2.2 2.5 0.7 1.5 2.0
% Hispanic 2.3 1.5 2.0 0.4 1.0 1.8
% Asian 1.4 1.9 4.2 1.0 1.6 2.1
% Native American
0.4 2.2 0.1 0.6 0.4 0.2
% Multiracial 0.0 1.8 3.1
Wisconsin Total
Enrollment 143,608 125,669 126,035 -12.24% 870,175 870,745 861,518 -0.99%
% White 90.6 81.2 66.7 83.2 77.9 71.4
% Black 4.9 10.8 17.0 9.4 10.4 9.3
% Hispanic 2.2 5.5 10.2 3.3 6.7 11.2
% Asian 1.5 1.4 3.0 2.8 3.6 3.9
% Native American
0.7 1.1 0.6 1.3 1.4 1.2
% Multiracial 2.5 3.0
Source: NCES Common Core of Data 1995-96, 2005-06, and 2015-16; Private School Universe Survey, 1995-96, 2005-06, and 2015-16.
Note: Percentage change shows an increase or a decrease in total enrollment between School Years 1995-96 and 2015-16.

Private Schools in American Education [Working Paper], March 5, 2018
UCLA Civil Rights Project
26
Segregation Analysis – National Level
The nation has witnessed rapidly increasing racial and ethnic diversity for the past two decades.
In public schools, the sharp growth of racial and ethnic minority populations—particularly
Hispanic and Asian students—over the past two decades has changed the overall intergroup
contact levels for students of all racial and ethnic groups. Unlike this fast-moving nationwide
change, changes in intergroup contacts within private schools during the same period were
modest. In this section, we will first look at nationwide trends of private school intergroup
contact experiences and then explore regional trends. Finally, we will examine different patterns
and trends of intergroup experiences in each private sector by region.
The Civil Rights Project has done many studies of patterns of public school segregation and
several of charter school racial patterns, showing high levels of segregation in both and even
worse segregation in charter schools than in public schools. One of the advantages cited by
voucher advocates has been that students of color would get a much less segregated experience.
In general, it is true that black and Hispanic students in private schools, which have very large
white majorities, are, on average, in schools with substantially more white classmates.
The group that has the most isolated intergroup experiences in private schools, both 20 years ago
and now, is white students. In 2015, the typical white student attended a private school where
white students made up an overwhelming percentage (81 percent) of the student body—much
like the situation white students experienced twenty years ago. The remaining 20 percent of
private school enrollment was approximately 5 percent black, Hispanic, and Asian students,
respectively, and 5 percent students of other races. The change in intergroup contacts that the
typical black student in private school experiences has not been substantial in the last two
decades, either. Nevertheless, twenty years ago, the typical black student went to a private school
where more than half of his/her peers were black, but today he/she attends a school that has 44
percent blacks, 37 percent whites, and less than 10 percent Hispanics. Regarding intergroup
experiences of Hispanic students, the typical Hispanic student goes to a private school where
Hispanic students account for more than 40 percent of the student body, as he/she did twenty
years ago. In 2015, he/she also meets less than 40 percent whites, 9 percent blacks, and 7 percent
Asians. A decade ago, the typical Asian student went to a private school where more than half of
students were white, but now the white share has dropped below 50 percent. The percentages of
Asian, black and Hispanic students that the typical Asian student meets remain unchanged at 29
percent, 7 percent, and 10 percent, respectively (Figure 11).

Private Schools in American Education [Working Paper], March 5, 2018
UCLA Civil Rights Project
27
Figure 11: Average Intergroup Contacts that the Typical Student of Each Race experiences,
1995-2015
Source: NCES Private School Universe Survey, 1995-1996, 2005-2006, and 2015-2016.
Note: Total percentages do not add up to 100 percent due to the exclusion of Native American students and multiracial students
(for 2015-16 only).
88.5
33.540.9
51.6
86.2
37.5 40.751.8
80.9
37.2 37.547.1
4.0
54.6
9.5
6.9
4.8
48.7
9.8
7.3
5.0
44.0
8.5
6.7
4.2 8.2
42.7
11.2
5.0 9.5
42.6
10.8
5.7 9.6
42.8
9.9
3.0 3.4 6.4
29.9
2.8 3.1 4.7
29.1
4.8 5.0 6.6
28.9
0.0
10.0
20.0
30.0
40.0
50.0
60.0
70.0
80.0
90.0
100.0
white
student
black
student
Hispanic
student
Asian
student
white
student
black
student
Hispanic
student
Asian
student
white
student
black
student
Hispanic
student
Asian
student
By the typical… By the typical… By the typical…
1995-96 2005-06 2015-16
Per
cen
t (%
)
% White % Black % Hispanic % Asian

Private Schools in American Education [Working Paper], March 5, 2018
UCLA Civil Rights Project
28
Segregation Analysis – Regional Level
The population growth rates of each ethnic group vary from region to region. As a result of such
variation, patterns of intergroup experiences in private schools of each region are far more
diversified than those of the country.
Similar to national trends, regional patterns also show that white students in private schools have
the most isolated experiences. The case of white students in the Northeast and Midwest, in
particular, is even more extreme compared to the South and West. The white share in the two
regions’ private schools that the typical white student goes to is approximately 85 percent. No
other groups of students, including non-white and white students in the country, experience such
severe degrees of isolation as white students in the Northeast and Midwest do. The typical white
student in the West has more diversity than his/her white peers in the other three regions.
However, given that the white proportion in the West is less than 40 percent, white students in
private schools in the West also have relatively very isolated intergroup experiences. Other
groups’ exposure to white students vary by group and by region. Black and Hispanic students’
exposure to white students across the four regions is similar, ranging from 32 to 40 percent.
Nevertheless, Hispanic students’ exposure to whites in the Midwest private schools is higher (47
percent) than the average levels. Asian students, on average, attend private schools where whites
make up the majority of the student body. However, Asians in private schools in the West
experience higher exposure (41 percent) to fellow Asians than to white students (34 percent)
(Figure 12).
As for black students, the typical black private school student in the Midwest goes to a less
integrated school than his/her black peers in the other regions, probably reflecting the extreme
residential segregation in some centers of Midwest black population. On average, black students
in private schools had more than half black schoolmates. Black students’ exposure to fellow
blacks in the Northeast and South private schools was at 40 percent, but this number dropped to
22 percent in the West due to the region’s much smaller proportions of blacks (Figure 12).
With regard to Hispanic students’ exposure to other racial groups, the typical Hispanic student in
private schools in the South and West has the highest exposure (45-47 percent) to Hispanic
students. However, the typical Hispanic students in the Northeast and Midwest go to private
schools in which their group makes up slightly more than 35 percent of the student body.
Regional variation in Hispanic students’ exposure to fellow white students is not large. In
general, the typical Hispanic student across regions attends private schools that enroll 32 percent
or more white students. The share of black students that the typical Hispanic student is exposed
to varies from region to region, ranging from 4.6 percent (West) to 15.2 percent (Northeast). In
private schools in the Midwest and South, the typical Hispanic student’s exposure to Asians is
very minimal, around 4 percent, but the typical Hispanic student in the West has more exposure
to Asians (11 percent) compared to the other regions (Figure 12).
Finally, our analyses find that Asian students in private schools have the most isolated intergroup
experiences after white students, but their exposure to other racial groups differs tremendously
from region to region. The typical Asian student’s exposure to white students, for example, is the
largest in the Midwest (64 percent), but the figure drops to half (34 percent) in the West. Except

Private Schools in American Education [Working Paper], March 5, 2018
UCLA Civil Rights Project
29
white students, the group that the typical Asian student is most exposed to is fellow Asian
students. The typical Asian student’s exposure to the same racial group in private schools in the
West (41 percent) exceeds his/her exposure to whites (34 percent), which shows a high
concentration of Asian population in the West. In contrast, the typical Asian’s exposure to
Hispanic and black students in private schools is modest—less than 10 percent in most cases—
compared to his/her exposure to white and Asian students (Figure 12).
Figure 12: Average Intergroup Contacts that the Typical Student of Each Race experiences by
Region, 2015-2016
Source: NCES Private School Universe Survey, 2015-2016.
Note: Total percentages do not add up to 100 percent due to the exclusion of Native American students and multiracial
students (for 2015-16 only).
In this section, we explore to what extent intergroup experiences change over time by region and
by sector to show varying schooling experiences of each group of private school students.
Intergroup Contact Analysis – Northeast
Our analyses show that the overall levels of intergroup experiences in Northeastern private
schools have grown over time, but the degree varies by sector. Nevertheless, while private school
students in Catholic and secular sectors experience increasing diversity in general, students in
non-Catholic religious schools experience less diversity. The typical white student in non-
Catholic religious private schools, in particular, has extremely isolated schooling experiences,
virtually meeting only white students in his/her school. Black and Asians students in such
religious schools also experience less diverse intergroup contacts compared to their peers in
Catholic and secular sectors in the Northeast. Among Hispanic students across all three sectors,
those who attend secular private schools have the least diversity in terms of intergroup
83.8
36.0 38.5
51.7
85.8
34.946.5
63.8
79.5
38.3 37.1
56.1
70.0
40.332.4 33.6
4.5
40.6
15.2
8.6
3.9
51.0
8.4
6.8
7.0
46.4
8.6
10.1
3.3
22.3
4.6 3.6
4.0
12.8
35.2
8.1
4.3 6.9
37.0 7.3
6.2 7.9
47.0 9.1
10.1
17.2
45.2
12.1
4.7 6.3 7.0
24.1
3.1 3.0 3.9
16.5
4.1 4.1 4.0
19.99.5 12.1 11.0
41.1
0.0
10.0
20.0
30.0
40.0
50.0
60.0
70.0
80.0
90.0
100.0
whit
e st
uden
t
bla
ck s
tuden
t
His
pan
ic s
tuden
t
Asi
an s
tuden
t
whit
e st
uden
t
bla
ck s
tuden
t
His
pan
ic s
tuden
t
Asi
an s
tuden
t
whit
e st
uden
t
bla
ck s
tuden
t
His
pan
ic s
tuden
t
Asi
an s
tuden
t
whit
e st
uden
t
bla
ck s
tuden
t
His
pan
ic s
tuden
t
Asi
an s
tuden
t
by the typical by the typical by the typical by the typical
Northeast Midwest South West
Per
cen
t (%
)
% White % Black % Hispanic % Asian

Private Schools in American Education [Working Paper], March 5, 2018
UCLA Civil Rights Project
30
experiences. Specifically, the typical Hispanic student in the secular sector goes to a private
school that enrolls more than 50 percent Hispanic students (Table 5).

Private Schools in American Education [Working Paper], March 5, 2018
UCLA Civil Rights Project
31
Table 5: Average Intergroup Contacts in Northeastern Schools that the Typical Student of Each Race experiences by Sector, 1995-
2015
1995-96 2005-06 2015-16
Percent (%) Percent (%) Percent (%)
Catholic White Black Hispanic Asian White Black Hispanic Asian White Black Hispanic Asian
By the
typical…
white student 89.3 3.8 4.1 2.6 86.9 4.6 5.0 2.4 79.0 5.6 7.0 5.3
black student 29.1 50.1 16.6 4.0 29.0 48.1 18.1 3.7 32.7 40.0 17.3 6.2
Hispanic student 33.6 17.8 42.2 6.2 31.7 18.2 43.6 4.6 35.6 15.0 38.8 6.9
Asian student 56.5 11.1 16.3 15.9 51.6 12.6 15.5 19.8 54.2 10.8 13.9 17.0
Percent (%) Percent (%) Percent (%)
Other Religious White Black Hispanic Asian White Black Hispanic Asian White Black Hispanic Asian
By the
typical…
white student 94.1 3.1 1.5 1.3 93.3 3.3 1.6 1.3 92.4 2.2 1.3 2.5
black student 25.1 66.9 5.5 2.3 25.6 64.0 6.9 2.7 32.0 50.6 7.4 6.1
Hispanic student 44.7 21.3 29.9 4.0 40.4 23.1 31.5 3.9 35.5 14.0 40.2 6.6
Asian student 62.1 13.8 6.3 17.6 51.3 13.4 5.9 28.3 41.6 7.0 4.0 33.6
Percent (%) Percent (%) Percent (%)
Secular White Black Hispanic Asian White Black Hispanic Asian White Black Hispanic Asian
By the
typical…
white student 83.7 7.6 3.5 4.9 81.6 8.1 4.2 4.4 75.4 7.1 4.5 7.9
black student 37.2 50.7 8.5 3.4 45.9 39.0 10.2 3.7 44.6 33.9 9.6 6.7
Hispanic student 49.2 24.1 20.7 5.6 49.7 21.4 23.3 4.2 50.4 17.0 19.6 7.7
Asian student 65.2 9.2 5.3 20.0 63.9 9.3 5.1 20.9 56.9 7.7 5.0 24.1 Source: NCES Private School Universe Survey, 1995-1996, 2005-0606, and 2015-2016.Note: Total percentages do not add up to 100 percent due to the exclusion of Native American students and multiracial students (for 2015-16 only).

Private Schools in American Education [Working Paper], March 5, 2018
UCLA Civil Rights Project
32
Intergroup Contact Analysis – Midwest
As in the Northeast, private schools of each sector in the Midwest have witnessed slowly
increasing diversity over time, but again, the non-Catholic religious sector remains the most
insensitive to the change. Moreover, white students in both Catholic and non-Catholic religious
sectors are more isolated than their peers in the secular sector. For black students, those who are
in non-Catholic religious private schools experience the most isolated intergroup contacts,
having more than 60 percent black students in their schools. Conversely, other groups’ exposure
to black students is tremendously limited, ranging from 3 to 15 percent across sectors. Next,
Hispanic students in Midwestern Catholic schools have the largest exposure to the same racial
group, which is 42 percent, followed by the religious sector (23 percent) and the secular sector
(12 percent). Asians in Midwestern private schools tend to have far higher exposure to whites
compared to their black and Hispanic peers. The typical Asian student in Catholic schools
attends a school where 70 percent of his/her classmates are white. In contrast, Asian students in
religious and secular private schools have more diverse intergroup experiences, having 22%
Asians and 60% whites than their peers in Catholic private schools (Table 6).

Private Schools in American Education [Working Paper], March 5, 2018
UCLA Civil Rights Project
33
Table 6: Average Intergroup Contacts in Midwestern Schools that the Typical Student of Each Race experiences by Sector, 1995-2015
1995-96 2005-06 2015-16
Percent (%) Percent (%) Percent (%)
Catholic White Black Hispanic Asian White Black Hispanic Asian White Black Hispanic Asian
By the
typical…
white student 92.5 2.7 3.0 1.6 91.6 2.8 3.5 1.3 85.6 3.4 5.4 2.7
black student 31.6 61.7 5.0 1.6 40.4 50.6 6.9 1.3 41.3 41.3 10.2 2.7
Hispanic student 53.4 7.7 35.3 3.2 53.0 7.1 36.9 2.1 44.0 7.0 41.6 3.3
Asian student 76.0 6.4 8.6 8.8 77.1 5.1 8.2 8.7 70.1 5.9 10.6 9.1
Percent (%) Percent (%) Percent (%)
Other Religious White Black Hispanic Asian White Black Hispanic Asian White Black Hispanic Asian
By the
typical…
white student 93.9 3.4 1.4 1.1 91.7 4.3 2.0 1.3 89.2 4.0 2.6 2.4
black student 34.0 62.4 2.1 1.3 34.7 60.2 3.2 1.3 27.5 62.7 3.9 2.4
Hispanic student 60.9 9.3 26.5 2.7 54.8 10.9 30.7 2.6 54.4 12.0 25.5 4.5
Asian student 72.4 7.9 3.9 14.8 62.7 7.7 4.7 24.4 60.0 8.5 5.3 22.4
Percent (%) Percent (%) Percent (%)
Secular White Black Hispanic Asian White Black Hispanic Asian White Black Hispanic Asian
By the
typical…
white student 83.2 7.9 2.9 5.5 81.6 7.6 3.4 5.2 72.0 7.1 4.0 9.5
black student 30.4 62.2 3.9 3.0 35.0 54.9 5.8 3.0 40.8 40.7 6.5 6.2
Hispanic student 48.8 17.1 26.1 7.4 45.4 16.9 29.3 6.0 53.6 15.2 15.5 9.4
Asian student 65.4 9.2 5.2 20.0 65.8 8.1 5.7 19.5 57.7 6.6 4.3 22.4 Source: NCES Private School Universe Survey, 1995-1996, 2005-0606, and 2015-2016.Note: Total percentages do not add up to 100 percent due to the exclusion of Native American students and
multiracial students (for 2015-16 only).

Private Schools in American Education [Working Paper], March 5, 2018
UCLA Civil Rights Project
34
Intergroup Contact Analysis – South
In Southern private schools, the last two decades have seen a steady increase in white student
contact with other groups of students, including Hispanic, black, and Asian students. Although it
is not as severe as religious schools in the Northeast and Midwest, non-Catholic religious private
schools in the South still remain the most limited in terms of white contact with other racial
groups. The percentage of white students where the typical white student attends private school
is 82 percent in the non-Catholic religious sector, but the same figure declines to 78 percent in
the Catholic and secular sectors. Black students in the non-Catholic religious sector also have
very limited intergroup experiences. The typical black student in this sector goes to a school
where more than half of his/her classmates are of the same race. A similar trend exists for
Hispanic students in Catholic private schools in the South. The Hispanic proportion in a Catholic
school that the typical Hispanic student attends is more than 54 percent, and his/her exposure to
black and Asian students is less than 6 percent. Asians’ exposure to whites is larger than whites’
exposure to Hispanic and black students, and Asians in the Catholic sector tend to have more
white classmates than their peers in the other sectors do. The typical Asian student in the South
has more exposure to fellow Asian students in non-Catholic religious (20 percent) or secular (26
percent) schools than his/her peers in Catholic schools (Table 7).

Private Schools in American Education [Working Paper], March 5, 2018
UCLA Civil Rights Project
35
Table 7: Average Intergroup Contacts in Southern Schools that the Typical Student of Each Race experiences by Sector, 1995-2015
1995-96 2005-06 2015-16
Percent (%) Percent (%) Percent (%)
Catholic White Black Hispanic Asian White Black Hispanic Asian White Black Hispanic Asian
By the
typical…
white student 87.5 4.4 5.5 2.4 85.1 4.9 6.9 1.9 77.5 5.5 9.4 4.0
black student 32.9 59.2 5.6 2.2 41.6 47.0 8.1 2.1 35.8 46.9 10.2 3.6
Hispanic student 33.2 4.5 59.9 2.3 36.0 5.0 55.9 2.1 33.3 5.5 54.3 3.4
Asian student 71.3 8.8 11.4 8.1 63.3 8.5 13.7 13.8 61.7 8.5 15.2 9.3
Percent (%) Percent (%) Percent (%)
Other Religious White Black Hispanic Asian White Black Hispanic Asian White Black Hispanic Asian
By the
typical…
white student 89.7 5.0 3.3 1.8 86.9 6.4 4.2 1.8 81.5 7.9 4.9 3.3
black student 38.1 55.0 4.3 2.4 37.2 55.1 5.2 1.9 36.5 50.2 6.9 3.4
Hispanic student 47.7 8.1 40.8 3.1 49.6 10.5 36.4 2.7 41.1 12.5 39.9 3.7
Asian student 67.4 11.5 8.0 12.5 57.8 10.4 7.3 23.8 55.1 12.4 7.4 20.4
Percent (%) Percent (%) Percent (%)
Secular White Black Hispanic Asian White Black Hispanic Asian White Black Hispanic Asian
By the
typical…
white student 89.1 4.9 2.8 3.0 85.0 6.7 3.9 3.2 77.6 7.0 5.5 5.9
black student 46.4 45.8 4.4 3.0 48.5 40.1 7.1 3.2 45.9 35.4 8.3 6.3
Hispanic student 45.2 7.6 42.7 4.1 44.7 11.1 39.4 3.6 38.0 8.8 43.7 5.5
Asian student 72.8 7.8 6.2 13.0 66.9 9.2 6.6 16.1 53.7 8.7 7.3 25.6 Source: NCES Private School Universe Survey, 1995-1996, 2005-0606, and 2015-2016.Note: Total percentages do not add up to 100 percent due to the exclusion of Native American students and
multiracial students (for 2015-16 only).

Private Schools in American Education [Working Paper], March 5, 2018
UCLA Civil Rights Project
36
Intergroup Contact Analysis – West
The private schools of the West show the greatest regional increase in diversity. Still, white
students have the least diverse intergroup experiences among all racial groups, and those who are
in the non-Catholic religious sector in particular have extremely isolated intergroup contacts
despite the region’s high level of diversity. For example, the typical white student in the religious
sector goes to a school where the student enrollment is more than three-quarters white. Given the
region’s relatively low black population, the typical black student of each sector has similar
exposure to fellow blacks, ranging from 20 to 24 percent. Hispanic students’ exposure to their
group stands out the most in Catholic schools. The typical Hispanic student in the Catholic sector
goes to a school with 53 percent Hispanic students. On the other hand, the typical Hispanic
student’s exposure to the same racial group in the non-Catholic religious and secular sectors is
not as high as the one in Catholic schools. As opposed to Hispanic students, Asian students tend
to have higher exposure to the same racial group in non-Catholic religious and secular private
schools. The typical Asian student in those sectors has 46-49 percent Asian classmates, and
his/her exposure to Asians is higher than his/her exposure to white students in these two sectors
(Table 8).
Private Schools in American Education [Working Paper], March 5, 2018
UCLA Civil Rights Project
37
Table 8: Average Intergroup Contacts in Western Schools that the Typical Student of Each Race experiences by Sector, 1995-2015
1995-96 2005-06 2015-16
Percent (%) Percent (%) Percent (%)
Catholic White Black Hispanic Asian White Black Hispanic Asian White Black Hispanic Asian
By the
typical…
white student 72.0 2.5 14.9 9.9 71.9 2.8 15.1 7.0 62.7 2.6 16.0 10.2
black student 26.9 38.9 22.8 11.0 33.8 27.7 26.0 8.7 32.9 20.3 25.2 12.7
Hispanic student 32.6 4.7 50.6 11.4 30.2 4.3 53.9 7.4 25.6 3.2 53.7 10.5
Asian student 38.1 4.0 20.1 37.3 37.7 3.8 19.9 37.6 35.3 3.5 22.9 27.0
Percent (%) Percent (%) Percent (%)
Other Religious White Black Hispanic Asian White Black Hispanic Asian White Black Hispanic Asian
By the
typical…
white student 83.4 3.6 6.8 5.5 80.4 4.1 8.4 5.0 75.6 3.3 8.1 8.0
black student 34.7 47.4 9.8 7.6 42.6 33.8 13.3 7.3 42.6 22.0 14.7 13.7
Hispanic student 53.1 7.9 28.9 9.2 49.6 7.5 32.5 7.4 43.1 6.1 32.6 12.1
Asian student 40.1 5.8 8.6 45.1 37.9 5.3 9.5 46.4 31.2 4.2 8.9 45.9
Percent (%) Percent (%) Percent (%)
Secular White Black Hispanic Asian White Black Hispanic Asian White Black Hispanic Asian
By the
typical…
white student 79.4 4.8 6.3 8.8 76.8 5.1 6.9 8.0 70.3 4.0 6.5 10.5
black student 38.8 40.6 12.2 7.6 46.0 30.5 13.8 6.9 44.4 24.4 12.6 10.0
Hispanic student 49.8 11.9 27.4 9.8 48.1 10.7 29.1 8.5 45.2 7.9 27.9 11.3
Asian student 37.1 4.0 5.2 53.4 51.7 4.9 7.8 33.9 34.3 3.0 5.3 49.4 Source: NCES Private School Universe Survey, 1995-1996, 2005-0606, and 2015-2016.Note: Total percentages do not add up to 100 percent due to the exclusion of Native American students and
multiracial students (for 2015-16 only).

Private Schools in American Education [Working Paper], March 5, 2018
UCLA Civil Rights Project
38
Most Segregated States
For the past decades, the Civil Rights Project has been publishing lists of the states where black
and Hispanic students have been most severely segregated. Most of our work has focused on
public schools, but the tables below show segregation in private schools. The tables demonstrate
three results: black (or Hispanic) students’ exposure to white students, the share of black (or
Hispanic) students, and the proportion of white students in each state, so that results can be
interpreted in each state’s context.
The private school data below show that some Midwestern and Southern states, including
Wisconsin, Washington D.C., Missouri, Maryland, and Florida, rank in the top five most
segregated states in terms of black students’ exposure to white students (Table 9). The same
analyses for public schools, however, reveal slightly different landscape, showing that New
York, California, Illinois, Maryland, and Texas have the nation’s highest segregation for black
students (Orfield, Ee, Frankenberg, and Siegel-Hawley, 2016).
Table 9: Exposure to White Students by the Typical Black Student in Private Schools and Black
and White Enrollment in Private Schools by State, 2015-2016
State Black exposure to white
students
State percentage of black
enrollment
State percentage of white
enrollment
Wisconsin 15.8 17.0 66.7
District of Columbia 21.8 25.7 53.6
Missouri 26.6 12.6 76.2
Maryland 27.0 23.5 61.2
Florida 28.2 14.0 53.1
Illinois 29.0 9.9 67.6
New York 29.9 8.9 71.1
Alabama 34.4 15.5 76.3
California 34.6 5.1 48.9
New Jersey 35.6 9.3 69.8
New Mexico 36.3 2.8 42.4
Georgia 36.5 13.7 75.0
Pennsylvania 37.0 11.0 75.6
Hawaii 37.8 0.9 21.2
Texas 39.3 6.8 58.1
Ohio 42.1 10.4 79.2
Louisiana 44.9 20.7 70.9
Oregon 45.0 4.6 69.9
Massachusetts 47.0 7.2 72.6
Virginia 47.3 10.6 70.1
Connecticut 48.1 9.4 71.3
Arizona 50.6 3.6 57.8
Delaware 51.0 10.6 76.6
Mississippi 52.1 10.9 83.1
Indiana 52.3 5.0 83.4
Minnesota 53.4 5.2 78.1
Oklahoma 53.9 4.6 72.9
Nevada 54.2 4.5 67.5
Tennessee 54.4 9.2 80.5
South Carolina 55.1 8.1 82.1
North Carolina 55.4 8.9 76.8
Rhode Island 55.6 6.2 75.7
Iowa 56.4 2.9 84.9
Washington 56.7 4.3 68.8
Colorado 57.1 3.2 74.8
Kansas 57.7 3.3 76.6

Private Schools in American Education [Working Paper], March 5, 2018
UCLA Civil Rights Project
39
Nebraska 59.3 3.2 86.1
North Dakota 59.8 3.6 83.6
Michigan 59.9 4.8 83.1
Utah 63.5 4.0 72.3
Alaska 68.1 3.1 67.5
Wyoming 68.7 2.7 81.6
Kentucky 69.8 3.9 88.3
South Dakota 71.0 4.9 73.7
New Hampshire 72.3 3.8 81.0
Arkansas 73.0 5.3 82.5
Maine 78.1 2.4 85.3
Idaho 78.8 2.1 86.9
Montana 80.3 0.8 77.5
Vermont 84.0 2.5 89.5
West Virginia 84.2 2.8 91.1
Source: NCES Private School Universe Survey, 2015-2016
With regard to segregation for Hispanic students, private schools in Alaska, Washington D.C.,
Wisconsin, New Mexico, and California, are more segregated from whites than those of other
states. Wisconsin and Washington D.C. rank high again as was seen in the list of segregation for
black students (Table 10). Our analyses of segregation for Hispanic students in public schools
find that states with higher shares of Hispanic population, such as California, Texas, New York,
New Mexico, and Maryland, have the nation’s highest segregation for Hispanic students
(Orfield, Ee, Frankenberg, and Siegel-Hawley, 2016). These results show that New Mexico and
California are listed for segregation in both private and public sectors. However, analyzing
segregation in private schools requires understanding overall contexts and backgrounds,
including different private sectors and policy and legal decisions.
Table 10: Exposure to White Students by the Typical Hispanic Student in Private Schools and
Hispanic and White Enrollment in Private Schools by State, 2015-2016
State Hispanic exposure to white
students
State percentage of Hispanic
enrollment
State percentage of white
enrollment
Alaska 16.8 15.0 67.5
District of Columbia 24.0 10.8 53.6
Wisconsin 26.1 10.2 66.7
New Mexico 27.7 37.0 42.4
California 28.2 20.3 48.9
Florida 29.9 24.7 53.1
New York 30.5 9.7 71.1
Texas 31.8 23.1 58.1
North Dakota 33.1 4.8 83.6
Hawaii 34.1 1.8 21.2
Arizona 34.3 23.8 57.8
Minnesota 40.0 6.5 78.1
Illinois 41.7 11.5 67.6
New Jersey 42.4 8.2 69.8
Pennsylvania 44.6 4.6 75.6
Rhode Island 45.6 8.1 75.7
Colorado 49.1 13.5 74.8
Maryland 51.7 4.4 61.2
Massachusetts 51.8 7.0 72.6
North Carolina 52.6 5.6 76.8
Connecticut 53.7 7.8 71.3
Indiana 53.7 6.6 83.4
Oklahoma 54.4 6.9 72.9
Nevada 54.5 10.1 67.5

Private Schools in American Education [Working Paper], March 5, 2018
UCLA Civil Rights Project
40
Oregon 54.6 8.9 69.9
Iowa 54.6 8.3 84.9
South Dakota 55.6 3.5 73.7
Kansas 55.8 12.0 76.6
Georgia 56.4 4.0 75.0
Ohio 57.1 3.8 79.2
Mississippi 57.2 2.8 83.1
Washington 58.3 6.4 68.8
Missouri 58.4 3.5 76.2
Virginia 58.5 6.4 70.1
Michigan 59.3 4.5 83.1
Maine 60.1 2.1 85.3
Alabama 60.3 2.8 76.3
Louisiana 61.8 3.2 70.9
Wyoming 61.9 10.2 81.6
Utah 62.6 10.9 72.3
Tennessee 63.5 3.6 80.5
Nebraska 65.0 5.7 86.1
South Carolina 67.9 3.3 82.1
Delaware 69.4 3.5 76.6
Arkansas 69.5 3.7 82.5
New Hampshire 69.6 3.9 81.0
Idaho 77.1 5.5 86.9
Montana 78.6 2.6 77.5
West Virginia 81.4 1.6 91.1
Kentucky 81.4 2.4 88.3
Vermont 87.2 2.0 89.5
Source: NCES Private School Universe Survey, 2015-2016

Private Schools in American Education [Working Paper], March 5, 2018
UCLA Civil Rights Project
41
Conclusion
The private school data for the U.S. show that private schools are, by and large, a small and
shrinking sector of American education. They serve a largely white population and a very small
proportion of low-income students—about one tenth of their enrollment in a society where a
majority of all public school students are poor enough to need subsidized lunches. Private
schools differ from public schools in a variety of ways. In multiple Civil Rights Project reports,
we demonstrate that American public schools have witnessed a wide spectrum of diversity in
many ways that schools in the past did not experience before. This notable increase in diversity
has stimulated and changed various aspects American students’ schooling experiences, and these
new conditions require a great deal of policy efforts to better serve students in the public sector.
Although the portion of private schools responsible for American education has been declining
for decades, private schools still play a significant role in many communities of each region.
Since the charter system emerged a decade ago, private schools in some areas have been
competing with charter schools, which can increasingly absorb private school students.
Competing with this growing charter system and local public schools, private schools need to
maintain good educational programs and quality education for their students. More importantly,
private schools need to seriously consider how to incorporate the nation's growing diversity into
their system in order to offer diversified interpersonal contact and to develop appropriate social
skills for their students who will work and study in a racially diverse society.
Our data analyses throughout this report find that private schools have shown signs of change,
which vary by region and by sector, but the pace of change experienced by private schools is still
sluggish compared to public schools. Specifically, whites are the most segregated group in
private education, and, even within the three major sectors, the white students are
disproportionately concentrated with whites. Moreover, private school enrollment rates among
other racial groups have declined for years, but the number has remained unchanged for white
students in the past 20 years. Compared to public school statistics, students of color in private
schools experience considerably greater contact with whites. In spite of the fact that black and
Hispanic students make up a very small fraction of the enrollments, in some sectors and regions
there are substantial concentrations of these groups. The historically dominant Catholic school
segment continues to shrink while the other religious and secular sectors have grown but not
dramatically.
Among the states with voucher programs, there are very divergent patterns in the growth or
shrinkage of the number and capacity of the private school sector. The only national voucher
program, in Washington, D.C. has not produced a growth in the private sector, which has
declined both in the number of schools and their enrollment. Given the extreme variety and
complex elements of voucher policies and the widely varying local contexts and charter
competition, it is very important to study individual programs in depth. One clear policy need is
much better and more open data from all schools and programs that are receiving public funds,
either from vouchers or from tax subsidies, to permit a serious evaluation of these programs and
to maintain transparency and openness in operating public funds. From a civil rights perspective,
it would be invaluable to collect data on applications and acceptances, income levels of
participating families, attrition as students pass through the schools, curriculum and testing, and

Private Schools in American Education [Working Paper], March 5, 2018
UCLA Civil Rights Project
42
other inputs and outcomes. It would, of course, enrich our understanding if the data could include
subgroups of Asians and Latinos by national origin of their families and statistics in ELL status.
This data is only a start but it is an important start to give context to our other papers and work to
come in the field.

Private Schools in American Education [Working Paper], March 5, 2018
UCLA Civil Rights Project
43
Table 11: Private and public schools and enrollment, by state and by race: 2015-2016
State Private Public
All
Students White Black Hispanic Asian
Native
American
Multiracial
All
Students White Black Hispanic Asian
Native
American Multiracial
Private schools
as a percent of
all schools
All
Students White Black Hispanic Asian
Native
American Multiracial
United States 34,576 89,452 4,903,596 3,363,901 453,594 510,395 339,917 24,035 211,776 49,314,194 24,193,609 7,567,877 12,723,369 2,645,069 497,224 1,687,046 27.9 9.0 12.2 5.7 3.9 11.4 4.6 11.2
Alabama 352 1,320 63,920 48,740 9,901 1,766 2,243 206 1,065 740,713 412,780 245,229 50,612 11,072 6,558 14,462 21.1 7.9 10.6 3.9 3.4 16.8 3.0 6.9
Alaska 53 478 4,518 3,049 138 677 235 225 194 129,054 62,074 4,038 8,599 11,275 29,731 13,337 9.9 3.4 4.7 3.3 7.3 2.0 0.7 1.4
Arizona 321 1,961 46,265 26,740 1,680 11,029 2,333 2,077 2,405 1,090,158 432,676 57,375 487,758 34,259 48,936 29,154 14.1 4.1 5.8 2.8 2.2 6.4 4.1 7.6
Arkansas 333 1,052 30,607 25,239 1,629 1,123 1,024 230 1,362 491,390 303,856 102,023 60,533 10,990 3,125 10,863 24.0 5.9 7.7 1.6 1.8 8.5 6.9 11.1
California 3,424 8,805 544,570 266,312 28,036 110,439 89,546 2,711 47,527 6,044,665 1,460,133 343,111 3,256,266 726,876 32,941 225,338 28.0 8.3 15.4 7.6 3.3 11.0 7.6 17.4
Colorado 604 1,756 47,875 35,798 1,553 6,479 2,115 237 1,693 878,804 478,040 40,371 290,930 29,490 6,172 33,801 25.6 5.2 7.0 3.7 2.2 6.7 3.7 4.8
Connecticut 422 1,062 60,353 43,007 5,679 4,722 4,525 96 2,323 519,528 293,038 65,830 118,095 27,018 1,405 14,142 28.4 10.4 12.8 7.9 3.8 14.3 6.4 14.1
Delaw are 97 198 17,310 13,253 1,827 608 1,135 35 453 124,161 56,980 38,050 19,786 4,849 471 4,025 33.0 12.2 18.9 4.6 3.0 19.0 6.8 10.1
District of Columbia 93 216 15,856 8,505 4,072 1,705 583 10 981 81,307 8,473 57,196 12,709 1,289 126 1,514 30.1 16.3 50.1 6.6 11.8 31.2 7.2 39.3
Florida 2,204 3,716 328,509 174,534 45,920 80,993 14,136 1,095 11,854 2,727,105 1,082,320 602,652 864,512 77,084 8,779 91,758 37.2 10.8 13.9 7.1 8.6 15.5 11.1 11.4
Georgia 1,216 2,237 167,913 125,969 23,061 6,674 6,888 231 5,091 1,753,296 720,207 646,499 255,484 68,373 3,447 59,286 35.2 8.7 14.9 3.4 2.5 9.2 6.3 7.9
Haw aii 142 288 41,703 8,832 386 753 23,019 313 8,401 181,870 23,378 3,517 21,744 110,329 574 22,328 33.1 18.7 27.4 9.9 3.3 17.3 35.3 27.3
Idaho 255 635 13,901 12,073 295 764 460 102 207 286,447 218,179 2,892 50,244 4,445 3,945 6,742 28.7 4.6 5.2 9.3 1.5 9.4 2.5 3.0
Illinois 1,498 3,927 231,275 156,442 22,958 26,712 14,090 409 10,664 2,012,523 983,611 345,799 515,746 97,193 5,374 64,800 27.6 10.3 13.7 6.2 4.9 12.7 7.1 14.1
Indiana 1,664 1,863 149,460 124,595 7,470 9,923 3,003 416 4,053 1,045,085 724,684 129,562 116,404 23,207 2,267 48,961 47.2 12.5 14.7 5.5 7.9 11.5 15.5 7.6
Iow a 509 1,324 59,419 50,449 1,694 4,911 1,360 242 763 497,345 386,093 27,643 51,031 13,025 1,864 17,689 27.8 10.7 11.6 5.8 8.8 9.5 11.5 4.1
Kansas 209 1,315 37,786 28,933 1,262 4,546 1,803 269 972 488,382 317,862 34,146 93,578 14,192 4,497 24,107 13.7 7.2 8.3 3.6 4.6 11.3 5.6 3.9
Kentucky 329 1,222 61,766 54,569 2,414 1,453 1,776 197 1,357 676,793 531,204 70,062 40,281 11,564 809 22,873 21.2 8.4 9.3 3.3 3.5 13.3 19.6 5.6
Louisiana 578 1,341 152,955 108,506 31,634 4,887 5,246 681 2,002 714,923 325,371 316,117 42,495 11,483 4,936 14,521 30.1 17.6 25.0 9.1 10.3 31.4 12.1 12.1
Maine 143 581 17,273 14,728 413 371 1,350 132 279 176,396 159,239 5,958 3,600 2,804 1,170 3,625 19.7 8.9 8.5 6.5 9.4 32.5 10.1 7.1
Mary land 765 1,329 122,207 74,820 28,700 5,372 6,343 196 6,776 861,595 339,304 291,871 134,208 55,935 2,464 37,813 36.5 12.4 18.1 9.0 3.8 10.2 7.4 15.2
Massachusetts 755 1,796 105,960 76,918 7,638 7,449 9,026 172 4,757 914,158 572,713 79,852 168,143 61,466 2,048 29,936 29.6 10.4 11.8 8.7 4.2 12.8 7.8 13.7
Michigan 886 2,963 151,909 126,310 7,365 6,776 5,655 602 5,201 1,412,238 953,788 250,154 103,919 47,179 9,299 47,899 23.0 9.7 11.7 2.9 6.1 10.7 6.1 9.8
Minnesota 472 1,686 65,496 51,120 3,399 4,260 3,602 796 2,319 832,485 574,007 84,119 72,106 55,408 13,248 33,597 21.9 7.3 8.2 3.9 5.6 6.1 5.7 6.5
Mississippi 182 915 38,168 31,708 4,161 1,080 788 63 369 487,178 218,053 239,763 16,499 5,300 1,163 6,400 16.6 7.3 12.7 1.7 6.1 12.9 5.1 5.4
Missouri 869 2,247 110,089 83,852 13,862 3,846 3,909 455 4,166 913,246 660,617 145,557 53,860 19,855 3,678 29,679 27.9 10.8 11.3 8.7 6.7 16.4 11.0 12.3
Montana 122 817 9,604 7,443 75 247 220 1,429 189 145,240 114,975 1,272 6,495 1,515 16,508 4,475 13.0 6.2 6.1 5.6 3.7 12.7 8.0 4.0
Nebraska 346 1,009 43,985 37,893 1,387 2,501 1,209 108 887 316,014 213,942 21,136 57,120 8,477 4,370 10,969 25.5 12.2 15.0 6.2 4.2 12.5 2.4 7.5
Nev ada 146 610 19,166 12,934 863 1,938 1,940 127 1,364 464,272 157,799 48,372 193,638 32,013 4,399 28,051 19.3 4.0 7.6 1.8 1.0 5.7 2.8 4.6
New Hampshire 259 490 19,993 16,185 765 773 1,859 100 311 181,307 157,322 3,444 9,026 5,935 502 5,078 34.5 9.9 9.3 18.2 7.9 23.9 16.6 5.8
New Jersey 1,269 2,384 172,214 120,262 15,979 14,137 14,180 301 7,355 1,337,561 624,001 208,460 349,561 132,767 1,644 21,128 34.7 11.4 16.2 7.1 3.9 9.6 15.5 25.8
New Mex ico 171 841 19,571 8,292 550 7,242 955 1,444 1,088 330,429 77,985 6,387 202,871 4,196 33,546 5,444 16.9 5.6 9.6 7.9 3.4 18.5 4.1 16.7
New York 1,939 4,618 461,297 327,813 41,041 44,584 29,312 689 17,858 2,634,356 1,191,065 455,685 680,289 237,586 16,832 52,899 29.6 14.9 21.6 8.3 6.2 11.0 3.9 25.2
North Carolina 646 2,497 110,242 84,645 9,793 6,228 5,183 467 3,927 1,536,724 765,554 394,920 249,110 48,297 20,333 58,510 20.6 6.7 10.0 2.4 2.4 9.7 2.2 6.3
North Dakota 49 481 6,404 5,353 228 310 144 280 89 108,464 85,447 4,576 4,980 1,885 9,534 2,042 9.3 5.6 5.9 4.7 5.9 7.1 2.9 4.2
Ohio 1,357 3,479 222,881 176,527 23,201 8,448 6,838 217 7,651 1,708,484 1,219,819 278,828 87,938 37,894 2,142 81,863 28.1 11.5 12.6 7.7 8.8 15.3 9.2 8.5
Oklahoma 183 1,791 26,977 19,654 1,251 1,851 1,874 1,489 860 692,546 346,313 61,367 112,286 15,632 98,899 58,049 9.3 3.7 5.4 2.0 1.6 10.7 1.5 1.5
Oregon 412 1,209 47,078 32,892 2,181 4,167 4,477 464 2,897 562,870 357,054 13,074 126,573 26,361 8,007 31,801 25.4 7.7 8.4 14.3 3.2 14.5 5.5 8.3
Pennsy lv ania 2,737 2,925 271,050 205,018 29,933 12,445 13,248 345 10,062 1,692,726 1,146,615 247,427 175,306 63,950 2,578 56,850 48.3 13.8 15.2 10.8 6.6 17.2 11.8 15.0
Rhode Island 131 297 18,104 13,711 1,123 1,461 1,023 49 737 136,719 83,029 10,813 32,047 4,691 957 5,182 30.6 11.7 14.2 9.4 4.4 17.9 4.9 12.4
South Carolina 375 1,185 48,393 39,729 3,899 1,581 1,624 141 1,418 761,721 393,902 261,361 64,788 12,319 2,464 26,887 24.0 6.0 9.2 1.5 2.4 11.6 5.4 5.0
South Dakota 72 651 8,758 6,453 432 304 245 1,081 244 132,433 99,897 3,859 6,845 2,425 14,867 4,540 10.0 6.2 6.1 10.1 4.3 9.2 6.8 5.1
Tennessee 500 1,805 79,878 64,282 7,344 2,903 3,277 126 1,947 991,648 638,534 220,807 89,351 19,566 1,634 21,756 21.7 7.5 9.1 3.2 3.1 14.3 7.2 8.2
Tex as 2,399 7,872 269,180 156,426 18,254 62,215 21,219 967 10,099 5,224,531 1,497,609 654,264 2,724,596 219,697 20,638 107,727 23.4 4.9 9.5 2.7 2.2 8.8 4.5 8.6
Utah 162 935 17,636 12,747 709 1,920 1,280 132 848 636,734 480,086 8,677 105,155 20,735 7,140 14,941 14.7 2.7 2.6 7.6 1.8 5.8 1.8 5.4
Vermont 115 298 9,339 8,356 233 184 394 9 164 84,355 76,614 1,702 1,503 1,744 199 2,593 27.8 10.0 9.8 12.0 10.9 18.4 4.3 5.9
Virginia 952 1,846 110,987 77,844 11,750 7,148 8,683 417 5,145 1,281,866 647,825 293,348 184,143 87,169 3,697 65,684 34.0 8.0 10.7 3.9 3.7 9.1 10.1 7.3
Washington 641 1,989 83,300 57,341 3,619 5,304 10,368 661 6,006 1,039,665 579,906 45,402 236,017 88,027 13,337 76,976 24.4 7.4 9.0 7.4 2.2 10.5 4.7 7.2
West Virginia 128 682 12,951 11,793 357 213 362 5 220 276,449 250,390 12,242 4,358 1,961 283 7,215 15.8 4.5 4.5 2.8 4.7 15.6 1.8 3.0
Wisconsin 1,054 2,147 126,035 84,074 21,443 12,821 3,793 751 3,155 861,518 615,285 79,989 96,870 33,324 10,320 25,730 32.9 12.8 12.0 21.1 11.7 10.2 6.8 10.9
Wy oming 37 361 1,510 1,233 40 153 19 40 25 94,717 73,961 1,079 13,361 943 3,367 2,006 9.4 1.6 1.6 3.6 1.1 2.0 1.2 1.2
School Count Total Enrollment in Private Schools Total Enrollment in Public Schools
Private school enrollment
as a percent of total enrollment in all schools, by race
Source: National Center for Education Statistics, Common Core of Data, 2015-2016; Private School Universe Survey Data, 2015-2016

Private Schools in American Education [Working Paper], March 5, 2018
UCLA Civil Rights Project
44
Table 12: Comparisons of Public, Charter, and Private Schools by State, 2015-2016
Public School Charter School Private School Percent (%)
Number Total Enrollment Number Total Enrollment Number Total Enrollment
Charter Schools out of All Public Schools
Public School Students Enrolled in Charter Schools
Private Schools out of All Schools
Students Enrolled in Private Schools
United States 89,431 49,314,194 6,373 2,751,900 34,576 4,903,596 7.1 5.6 27.9 9.0
Alabama 1,320 740,713
352 63,920 - - 21.1 7.9
Alaska 478 129,054 28 6,343 53 4,518 5.9 4.9 9.9 3.4
Arizona 1,948 1,090,158 546 175,439 321 46,265 28.0 16.1 14.2 4.1
Arkansas 1,052 491,390 63 23,927 333 30,607 6.0 4.9 24.0 5.9
California 8,804 6,044,665 1,203 566,371 3,424 544,570 13.7 9.4 28.0 8.3
Colorado 1,756 878,804 208 101,101 604 47,875 11.8 11.5 25.6 5.2
Connecticut 1,062 519,528 24 9,132 422 60,353 2.3 1.8 28.4 10.4
Delaware 198 124,161 28 13,622 97 17,310 14.1 11.0 33.0 12.2
Washington D.C. 216 81,307 111 35,001 93 15,856 51.4 43.0 30.1 16.3
Florida 3,716 2,727,105 560 250,797 2,204 328,509 15.1 9.2 37.2 10.8
Georgia 2,237 1,753,296 81 71,980 1,216 167,913 3.6 4.1 35.2 8.7
Hawaii 288 181,870 34 10,444 142 41,703 11.8 5.7 33.1 18.7
Idaho 635 286,447 48 18,729 255 13,901 7.6 6.5 28.7 4.6
Illinois 3,927 2,012,523 64 64,108 1,498 231,275 1.6 3.2 27.6 10.3
Indiana 1,863 1,045,085 88 39,671 1,664 149,460 4.7 3.8 47.2 12.5
Iowa 1,324 497,345 3 430 509 59,419 0.2 0.1 27.8 10.7
Kansas 1,315 488,382 10 3,186 209 37,786 0.8 0.7 13.7 7.2
Kentucky 1,221 676,793
329 61,766 - - 21.2 8.4
Louisiana 1,341 714,923 137 73,647 578 152,955 10.2 10.3 30.1 17.6
Maine 581 176,396 7 1,518 143 17,273 1.2 0.9 19.7 8.9
Maryland 1,329 861,595 50 20,988 765 122,207 3.8 2.4 36.5 12.4
Massachusetts 1,796 914,158 81 40,199 755 105,960 4.5 4.4 29.6 10.4
Michigan 2,961 1,412,238 332 139,499 886 151,909 11.2 9.9 23.0 9.7
Minnesota 1,686 832,485 213 50,682 472 65,496 12.6 6.1 21.9 7.3
Mississippi 915 487,178 2 226 182 38,168 0.2 0.0 16.6 7.3
Missouri 2,247 913,246 70 21,619 869 110,089 3.1 2.4 27.9 10.8
Montana 817 145,240
122 9,604 - - 13.0 6.2
Nebraska 1,009 316,014
346 43,985 - - 25.5 12.2
Nevada 610 464,272 47 35,130 146 19,166 7.7 7.6 19.3 4.0
New Hampshire 490 181,307 31 3,011 259 19,993 6.3 1.7 34.5 9.9
New Jersey 2,384 1,337,561 89 41,026 1,269 172,214 3.7 3.1 34.7 11.4
New Mexico 841 330,429 94 22,079 171 19,571 11.2 6.7 16.9 5.6
New York 4,617 2,634,356 253 117,114 1,939 461,297 5.5 4.4 29.6 14.9
North Carolina 2,497 1,536,724 157 82,260 646 110,242 6.3 5.4 20.6 6.7
North Dakota 480 108,464
49 6,404 - - 9.3 5.6
Ohio 3,479 1,708,484 336 114,012 1,357 222,881 9.7 6.7 28.1 11.5
Oklahoma 1,791 692,546 41 19,769 183 26,977 2.3 2.9 9.3 3.7
Oregon 1,209 562,870 126 30,728 412 47,078 10.4 5.5 25.4 7.7
Pennsylvania 2,924 1,692,726 175 130,940 2,737 271,050 6.0 7.7 48.4 13.8
Rhode Island 297 136,719 27 6,434 131 18,104 9.1 4.7 30.6 11.7
South Carolina 1,185 761,721 67 29,420 375 48,393 5.7 3.9 24.0 6.0
South Dakota 651 132,433
72 8,758 - - 10.0 6.2
Tennessee 1,804 991,648 98 28,862 500 79,878 5.4 2.9 21.7 7.5
Texas 7,872 5,224,531 499 241,108 2,399 269,180 6.3 4.6 23.4 4.9
Utah 935 636,734 115 67,093 162 17,636 12.3 10.5 14.7 2.7
Vermont 298 84,355
115 9,339 - - 27.8 10.0
Virginia 1,846 1,281,866 7 1,001 952 110,987 0.4 0.1 34.0 8.0
Washington 1,989 1,039,665
641 83,300 - - 24.4 7.4
West Virginia 682 276,449
128 12,951 - - 15.8 4.5
Wisconsin 2,147 861,518 220 43,254 1,054 126,035 10.2 5.0 32.9 12.8
Wyoming 361 94,717
37 1,510 - - 9.4 1.6
Source: NCES Common Core of Data Public Elementary/Secondary School Universe Survey Data, 2015-2016; NCES PSU Survey, 2015-2016.

Private Schools in American Education [Working Paper], March 5, 2018
UCLA Civil Rights Project
45
Table 13: Low-income student enrollment in Private and public schools and, by state and by Sector: 2015-2016
Public School Private School
Enrollment % Low-income
Enrollment % Low-income
All Catholic Other religious Nonsectarian All Catholic Other religious Nonsectarian United States 49,314,194 50.9 4,903,596 1,901,474 1,932,819 1,069,303 9.0 10.9 9.1 5.4
Alabama 740,713 51.1 63,920 12,178 35,722 16,020 2.8 7.2 1.6 2.2
Alaska 129,054 42.8 4,518 1,696 2,397 426 - - - -
Arizona* 1,090,158 44.4 46,265 21,032 18,135 7,098 11.8 20.8 4.2 4.8
Arkansas 491,390 63.5 30,607 7,352 19,404 3,851 3.1 7.5 1.4 3.8
California 6,044,665 58.8 544,570 221,063 163,652 159,855 3.4 5.7 0.9 2.7
Colorado 878,804 41.6 47,875 16,514 16,982 14,378 6.1 10.4 0.6 7.7
Connecticut 519,528 37.6 60,353 24,993 9,318 26,041 4.9 2.5 11.0 5.0
Delaware 124,161 38.5 17,310 6,999 5,322 4,989 1.3 1.5 1.3 1.1
Washington D.C.* 81,307 74.8 15,856 4,270 5,338 6,249 8.1 21.9 1.5 4.3
Florida* 2,727,105 59.0 328,509 83,794 153,041 91,674 5.7 2.7 6.6 7.1
Georgia* 1,753,296 62.4 167,913 17,031 110,417 40,465 1.4 3.8 0.9 1.8
Hawaii 181,870 49.6 41,703 6,256 18,527 16,920 0.7 4.7 0.1 -
Idaho 286,447 46.6 13,901 3,703 7,148 3,049 4.6 12.6 1.5 2.3
Illinois 2,012,523 49.9 231,275 142,283 53,483 35,509 10.4 10.6 9.0 11.4
Indiana* 1,045,085 48.2 149,460 52,960 85,640 10,860 10.5 22.2 4.4 1.7
Iowa 497,345 41.2 59,419 42,331 15,775 1,312 14.9 17.3 5.4 52.7
Kansas 488,382 49.2 37,786 26,344 8,512 2,929 13.6 18.2 4.1 0.9
Kentucky 676,793 59.4 61,766 37,512 17,255 6,999 5.9 8.6 1.8 1.5
Louisiana* 714,923 58.4 152,955 68,556 70,051 14,348 10.6 20.1 3.0 2.1
Maine* 176,396 46.0 17,273 2,247 2,624 12,402 8.2 4.0 0.0 10.7
Maryland 861,595 44.7 122,207 53,341 38,041 30,825 6.0 9.3 4.4 2.2
Massachusetts 914,158 0.0 105,960 49,326 11,182 45,451 8.4 12.1 1.9 6.0
Michigan 1,412,238 45.8 151,909 61,940 77,454 12,516 6.0 9.0 4.0 3.6
Minnesota 832,485 37.6 65,496 37,282 20,713 7,502 10.5 13.4 8.8 0.9
Mississippi* 487,178 75.0 38,168 6,483 20,756 10,929 3.1 11.8 1.7 0.6
Missouri 913,246 50.0 110,089 56,868 36,856 16,366 6.5 7.3 4.4 8.9
Montana 145,240 44.8 9,604 4,094 4,004 1,506 19.9 39.5 3.1 11.5
Nebraska 316,014 44.2 43,985 30,380 12,368 1,237 11.0 13.9 4.9 -
Nevada 464,272 57.3 19,166 6,059 9,281 3,826 0.1 - 0.3 -
New Hampshire 181,307 28.3 19,993 6,313 4,884 8,796 2.9 0.6 1.6 5.3
New Jersey 1,337,561 37.5 172,214 76,243 54,882 41,089 10.9 6.4 19.3 8.2
New Mexico 330,429 71.7 19,571 5,287 7,288 6,996 10.3 19.3 9.3 4.6
New York 2,634,356 48.4 461,297 157,675 217,226 86,396 27.2 13.4 44.0 10.0
North Carolina* 1,536,724 57.2 110,242 15,761 58,194 36,287 0.9 6.1 0.0 0.1
North Dakota 108,464 31.1 6,404 3,762 2,540 102 9.7 10.3 7.8 36.5
Ohio* 1,708,484 44.7 222,881 159,397 45,423 18,061 12.6 14.3 9.3 5.4
Oklahoma* 692,546 61.3 26,977 8,471 14,660 3,846 4.1 7.0 2.8 2.6
Oregon 562,870 49.7 47,078 16,312 19,838 10,927 5.0 4.8 1.2 12.3
Pennsylvania 1,692,726 46.9 271,050 106,782 117,235 47,033 10.4 16.3 3.7 13.9
Rhode Island 136,719 46.3 18,104 12,148 1,262 4,695 6.5 3.6 - 15.9
South Carolina 761,721 60.0 48,393 6,405 29,313 12,674 3.6 17.2 1.5 1.6
South Dakota 132,433 41.7 8,758 4,434 4,006 317 12.1 15.3 2.2 91.6
Tennessee 991,648 57.5 79,878 11,384 46,915 21,579 4.0 9.4 3.4 2.7
Texas 5,224,531 58.8 269,180 76,332 126,374 66,474 2.7 4.6 1.1 3.4
Utah* 636,734 36.2 17,636 5,871 3,142 8,623 3.0 7.5 0.1 1.0
Vermont* 84,355 38.4 9,339 1,783 690 6,866 15.3 13.0 5.9 16.9
Virginia 1,281,866 40.8 110,986 24,926 36,422 49,638 1.4 1.5 1.3 1.4
Washington 1,039,665 45.8 83,300 26,328 32,704 24,268 2.4 5.0 1.0 1.6
West Virginia 276,449 49.3 12,951 5,709 6,021 1,221 2.2 4.8 - 0.9
Wisconsin* 861,518 39.4 126,035 64,591 53,918 7,527 26.9 22.7 33.3 17.6
Wyoming 94,717 37.5 1,510 672 484 354 20.1 22.7 0.4 42.3
Source: NCES Common Core of Data Public Elementary/Secondary School Universe Survey Data, 2015-2016; NCES PSU Survey, 2015-2016.Note: * shows states with voucher laws. – shows data missing or too small to report.

Private Schools in American Education [Working Paper], March 5, 2018
UCLA Civil Rights Project
46
Appendix
This report includes private schools that offer no grade higher than Kindergarten.
This report uses Census-defined regions:
Northeast: Connecticut, Maine, Massachusetts, New Hampshire, New Jersey, New York,
Pennsylvania, Rhode Island, and Vermont;
South: Alabama, Arkansas, Delaware, District of Columbia, Florida, Georgia, Kentucky,
Louisiana, Maryland, Mississippi, North Carolina, Oklahoma, South Carolina,
Tennessee, Texas, Virginia, and West Virginia;
Midwest: Illinois, Indiana, Iowa, Kansas, Michigan, Minnesota, Missouri, Nebraska,
North Dakota, Ohio, South Dakota, and Wisconsin; and
West: Alaska, Arizona, California, Colorado, Hawaii, Idaho, Montana, Nevada, New
Mexico, Oregon, Utah, Washington, and Wyoming.
Segregation Statistics (Exposure Rates)
This report uses exposure statistics to measure segregation and to capture student experiences of
segregation. Exposure of certain racial groups to one another or to majority groups shows the
distribution of racial groups among organizational units and describes the average contact
between different groups. It is calculated by employing the percentage of a particular group of
students of interest in a small unit (e.g., school) with a certain group of students in a larger
geographic or organizational unit (e.g., state or district) to show a weighted average of the
composition of a particular racial group. The formula for calculating the exposure rates of a
student in racial group A to students in racial group B is:
where
n is the number of small units (e.g., school) in a larger unit (e.g., state or district)
ai is the number of students in racial group A in the small unit i (school i)
A is the total number of students in racial group A in the larger unit (state or district)
bi is the number of students in racial group B in the small unit i (school i)
ti is the total number of students in all racial groups in the small unit i (school i)