
Private Equity Trend Report 2018 - PwC · Private Equity Trend Report 2018 The Coming of Age 12TH...
91
www.pwc.de/de/privateequity Private Equity Trend Report 2018 The Coming of Age 12TH annual survey on current developments in German and European private equity investment.
Transcript of Private Equity Trend Report 2018 - PwC · Private Equity Trend Report 2018 The Coming of Age 12TH...
www.pwc.de/de/privateequity
Private Equity Trend Report 2018The Coming of Age
12TH annual survey on current developments in German and European private equity investment.


Private Equity Trend Report 2018The Coming of Age
12TH annual survey on current developments in German and European private equity investment.

Private Equity Trend Report 2018
Published by PricewaterhouseCoopers GmbH Wirtschaftsprüfungsgesellschaft
By Steve Roberts and Elena Naydenova
February 2018, 92 pages, 77 figures, softcover
All rights reserved. This material may not be reproduced in any form, copied onto microfilm or saved and edited in any digital medium without the explicit permission of the editor.
This publication is intended to be a resource for our clients, and the information therein was correct to the best of the authors’ knowledge at the time of publication. Before making any decision or taking any action, you should consult the sources or contacts listed here. The opinions reflected are those of the authors. The graphics may contain rounding differences.
© February 2018 PricewaterhouseCoopers GmbH Wirtschaftsprüfungsgesellschaft.All rights reserved. In this document, “PwC” refers to PricewaterhouseCoopers GmbH Wirtschaftsprüfungsgesellschaft, which is a member firm of PricewaterhouseCoopers International Limited (PwCIL). Each member firm of PwCIL is a separate and independent legal entity.
Private Equity Trend Report 2018 5
Preface
Preface
Dear colleague,
2017 has been yet another very strong year for the German private equity market, with deal volumes maintaining the record levels reached in 2016 and investment sentiment for the region at an all-time high. Our recent Mittelstand studies highlight a strong and positive development both in the recognition of private equity and what it can achieve, as well as the acceptance of partnering with or selling to a financial investor. With the record levels of dry powder and the interest rate environment projected to continue for the long foreseeable future, one needs to reflect on what the underlying dynamics of this situation are and where the journey will take the industry over the next five years. Is this a coming of age for private equity or a natural and gradual evolution in Germany?
The statistics on deal value and volume speak for themselves. However, attributing this to the economic backdrop of Germany and to the levels of available capital and debt only tells half of the story. Private equity has consistently matured over the last decades, demonstrating a robustness proven by its ability to ride the storms of economic turbulence, political uncertainty and social upheaval, as well as face increased public scrutiny and regulation. This progression has manifested itself in various ways.
There has been a gravitation of PE houses towards their specific industry sweet spots, moving away from a homogenous approach to investing towards a strategy of sector focused targeting enabled through a proven track record and industry specialisation. This has enabled them to not only act quicker and potentially pay more because they see the value that can be unlocked, but also to talk on eye level with business founders and endear a level of trust and cooperation that may not have been possible only 10 years ago. Transactions in recent times such as Ottobock and Schön Kliniken, both famed German family businesses, highlight this clearly, both in the fact that PE investors were actively sought to support the future of these businesses and also notably in which specific investors were approached.
The more deals that get done in the sector, the more widespread the talent in the industry becomes. There is now a generation of private equity professionals as well as management teams that have all spent their careers working in this sector and that are training and pulling through the next. This has not happened overnight, it has taken years of development, learning from both its successes and mistakes. Value creation is clearly the driver, multiple arbitrage and financial engineering belong to the distant past, but the levers of the current equity stories are themselves evolving with factors such as digital and cyber being now established topics that have to be addressed.
6 Private Equity Trend Report 2018
Preface
Considering Germany’s positioning regarding the impact of Brexit it is important not to get carried away with the hype of the potential. There will not be more deals or assets available – the whole Brexit topic has simply led to Germany winning what could be viewed as the “perception war”. Therefore, although sentiment for the region is at a record high, it is a myth to believe that this will lead to record deals growth, but rather even more competition and even higher prices for a limited number of assets. Similar to the (now widely accepted) myth over a decade ago regarding the Mittelstand boom that was predicted – the scarcity of assets will remain the major issue.
So will Germany ever fulfil its full potential? The conclusion depends on your definition of this. The market here has developed significantly, but also at a gradual pace. This has been a natural development and there will not be a boom, and factors like the Brexit should not be considered potential catalysts for it, but rather natural factors that over a certain timeline will happen in one form or another. A cornerstone of the safe haven reputation of Germany has been earned through natural and gradual progression, the downside protection offered through the lack of peak and trough/boom and bust that other developed nations have experienced. It is therefore unsurprising that the region has remained strong and will continue to do so for the foreseeable future. If that is the potential, then it has been fully achieved.
As always our thanks go to all those who participated in this year’s survey and shared their opinions. We look forward to working with you again in 2018.
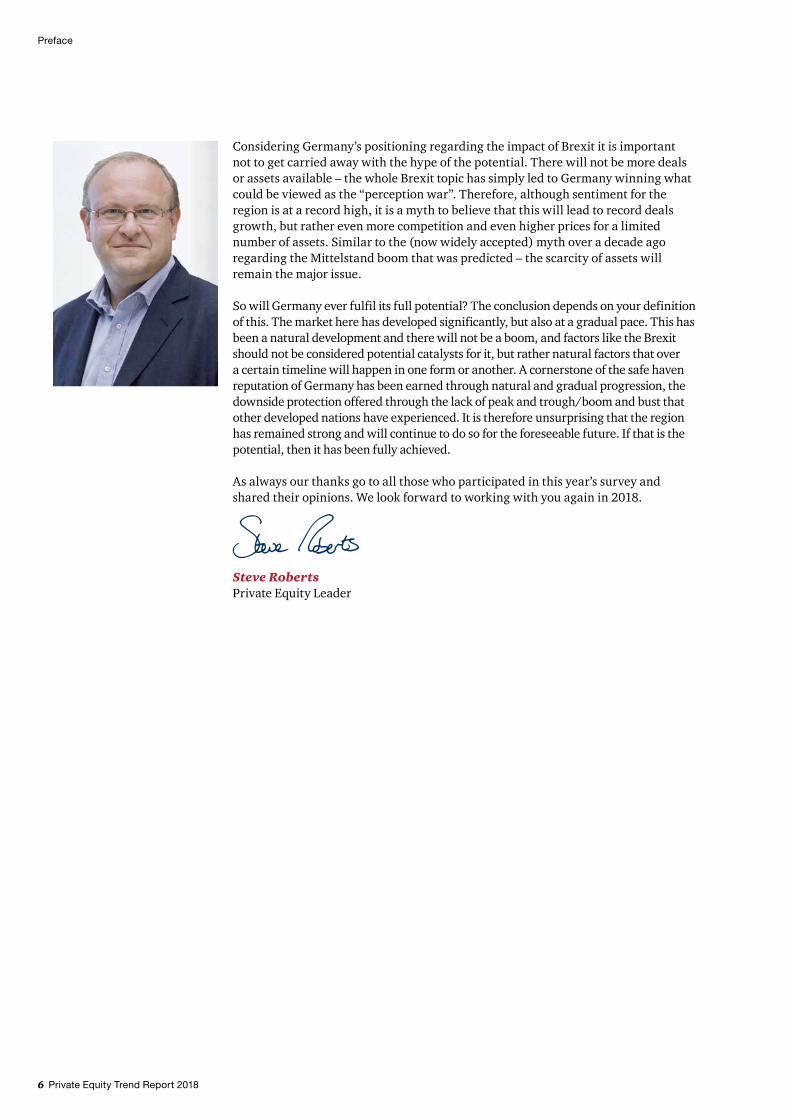
Steve RobertsPrivate Equity Leader

Private Equity Trend Report 2018 7
Table of contents
Table of contents
Table of figures......................................................................................................... 8
A Market Overview ..............................................................................................141 Private Equity in Europe .................................................................................. 15
Deep dive: DACH Spotlight .............................................................................. 25 Deep dive: Benelux Spotlight ........................................................................... 30
B Key findings .................................................................................................... 35
C Detailed Findings ............................................................................................ 381 2017 in review: PE comes out fighting ............................................................. 392 The year ahead ................................................................................................ 523 Focus on value creation ................................................................................... 714 Global Hotspots ............................................................................................... 80
D Methodology ................................................................................................... 84
Appendix ............................................................................................................... 85
List of abbreviations ............................................................................................... 88
Contacts ................................................................................................................. 90
8 Private Equity Trend Report 2018
Table of figures
Table of figures
Fig. 1 European Private Equity Trends, 2012–2017 .......................................... 15
Fig. 2 European Buyout Trends, 2012–2017 ......................................................16
Fig. 3 European Buyouts, Split by Deal Size, 2012–2017 ...................................17
Fig. 4 European Exit Trends, 2012–2017 ...........................................................18
Fig. 5 Buyout volume, split by region ................................................................19
Fig. 6 Buyout value, split by region .................................................................. 20
Fig. 7 Buyout volume, split by industry ............................................................ 22
Fig. 8 Buyout value, split by industry ............................................................... 23
Fig. 9 DACH Private Equity Trends, 2012–2017 ............................................... 25
Fig. 10 DACH Buyout Trends, 2012–2017 .......................................................... 26
Fig. 11 DACH Exit Trends, 2012–2017 ............................................................... 27
Fig. 12 DACH Buyouts, Split by Deal Size, 2012–2017 ........................................ 27
Fig. 13 DACH Buyout volume, split by industry .................................................. 28
Fig. 14 DACH Buyout value, split by industry ..................................................... 29
Fig. 15 Benelux Private Equity Trends, 2012–2017 ............................................ 30
Fig. 16 Benelux Buyout Trends, 2012–2017 ........................................................31
Fig. 17 Benelux Buyouts, Split by Deal Size, 2012–2017 .....................................31
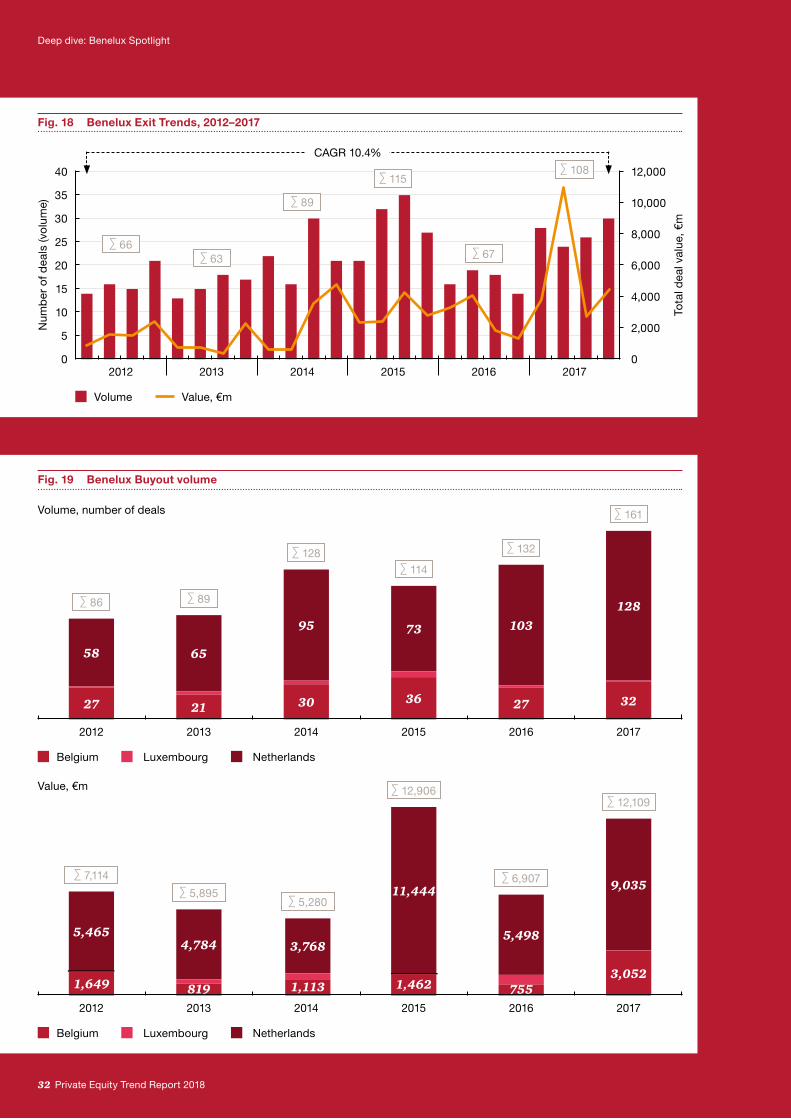
Fig. 18 Benelux Exit Trends, 2012–2017 ............................................................ 32
Fig. 19 Benelux Buyout volume .......................................................................... 32
Fig. 20 Benelux Buyout volume, split by industry ............................................... 33
Fig. 21 Benelux Buyout value, split by industry .................................................. 34
Fig. 22 How would you characterise the global economic situation over the past year …? ..................................................................................... 39
Fig. 23 Development in the number of new investments compared to previous year ......................................................................................... 40
Private Equity Trend Report 2018 9
Table of figures
Fig. 24 Firstly, compared to 2016, has the number of potential transactions which you have reviewed in an average month in 2017 …? .....................41
Fig. 25 Development in the number of exits compared to previous year ............. 42
Fig. 26 Compared to 2016, would you say that competition for investments among private equity firms has …? .................................... 43
Fig. 27 Perception of availability of credit for leveraged buyouts ....................... 44
Fig. 28 Expectations for availability of credit in 2018 compared to 2017............ 44
Fig. 29 Average debt-to-equity ratios used on new investments in 2017 ............. 45
Fig. 30 Level of satisfaction with the overall development of portfolio companies ............................................................................... 46
Fig. 31 How satisfied or dissatisfied are you with the development of your portfolio companies in 2017? ..................................................................47
Fig. 32 Percentage of portfolio companies that experienced covenant breaches by geography ........................................................................... 48
Fig. 33 During 2017, what percentage of your portfolio companies broke one or more bank covenants, or otherwise needed to enter negotiations with their financing providers? .......................................... 48
Fig. 34 Factors influencing investment rationale in 2017 ....................................51
Fig. 35 Factors influencing investment rationale in 2017 by geography ..............51
Fig. 36 How do you expect the world economic situation to develop in 2018? ................................................................................................. 52
Fig. 37 Do you believe that the next financial crisis will occur in the short to mid-term period (i.e. 1–3 years) from now? ....................................... 53
Fig. 38 How do you expect the European deal market for private equity to develop in 2018? ................................................................................ 54
Fig. 39 How do you expect the European deal market for private equity to develop in 2018? ................................................................................ 54
Fig. 40 Compared to 2017, do you expect the number of new investments made by your organisation in 2018 to …? ............................................... 55
Fig. 41 Compared to 2017, do you expect the number of exits made by your organisation in 2018 to …? ........................................................ 55
Fig. 42 Compared to 2017, do you expect competition for investments among private equity firms in 2018 to …? .............................................. 56
Fig. 43 Looking ahead to 2018 do you expect the availability of credit for leveraged buyouts to …? ................................................................... 57
10 Private Equity Trend Report 2018
Table of figures
Fig. 44 Percentage of companies expected to break one or more bank covenants in 2018 .................................................................................. 58
Fig. 45 Looking forward to 2018 which factors, do you consider will influence equity stories on acquisitions for your organisation?............... 60
Fig. 46 Looking forward to 2018 which (of these) factors, do you consider will influence equity stories on acquisitions for your organisation? (Please select all that all that apply) ....................................................... 60
Fig. 47 Please rank the following in terms of importance, regarding their influence on your return on investment. .........................................61
Fig. 48 In your opinion, which, if any, of these will be sources of new deal opportunities for your organisation in 2018? (Please select all that apply) ......................................................................................... 62
Fig. 49 Which of the following changes, if any, have occurred to your organisation’s business model over the last three years? ........................ 64
Fig. 50 Have expectations and requirements of your Limited Partners (LPs) changed during the prior three years?........................................... 65
Fig. 51 Which of the following best describe the changes in expectations and requirements from your Limited Partners …? (Please rank top three, where 1 = biggest change) ..................................................... 65
Fig. 52 Expected target industries for future investment ................................... 66
Fig. 53 Again looking ahead, what are the key issues which the private equity industry in Europe will face in the next five years? (Please rank top three, where 1 = most important issue) ................................... 68
Fig. 54 Looking forward to the next three years do you expect the number of Private Equity (PE) houses in Europe to …? .......................... 68
Fig. 55 Has your organisation either raised a fund or been in the process of fundraising during the last three years? ............................................. 69
Fig. 56 And compared to your fundraising activity before this period (prior to the last three years), has the fund size …? ................................ 69
Fig. 57 Comparing your experience of your most recent fundraising to the prior funds, do you perceive the most recent fundraising process to be …? .................................................................................... 69
Fig. 58 Expected investment partner contributors to future funds ..................... 70
Fig. 59 Which levers are most important to value creation within the equity/investment story? ....................................................................... 72
Fig. 60 Impact on return on investment of operational improvements, multiple arbitrage, financial leverage and digitisation in the last three years ............................................................................................. 72
Private Equity Trend Report 2018 11
Table of figures
Fig. 61 Has digitisation/industry 4.0 changed the way you look at new investments and do you model it into your equity story already at entry? .................................................................................... 73
Fig. 62 Do you believe that digitizing portfolio companies will speed up the realisation of the equity story and thus decrease the holding period of the portfolio? ...........................................................................74
Fig. 63 Impact of digitisation ............................................................................. 75
Fig. 64 To what extent do you believe that the level of digital transformation is important to the future exits from your current portfolio companies and the subsequent return to be achieved? ........................... 75
Fig. 65 Have you made investments in digitally transforming your own firm or portfolio company business models in the past year?...................76
Fig. 66 If yes, in which of the following areas of digital transformation have you focused your investment in? .................................................... 77
Fig. 67 Will you be investing in digitisation over the next year? ......................... 78
Fig. 68 Which of the following areas will you be investing in? (Select all that apply and the most important) ....................................... 79
Fig. 69 Which countries or regions will become more attractive for private equity investments over the next five years? ............................... 80
Fig. 70 In an international comparison with other countries, how would you assess the attractiveness of Germany as a location for private equity investment? ................................................................ 82
Fig. 71 PE houses planning to invest in Germany over thr next five years .......... 82
Fig. 72 Do you think that the assets that you allocate to Germany over the next five years will …? .............................................................. 83
Fig. 73 Respondent by country .......................................................................... 84
Fig. 74 Capital under management of respondents ............................................ 84
Fig. 75 Expected target industries for future investment ................................... 85
Fig. 76 Which of the following areas will you be investing in? (Select all that apply and the most important) ....................................... 86
Fig. 77 Which countries or regions will become more attractive for private equity investments over the next five years? ............................... 87
12 Private Equity Trend Report 2018
In conversation with Steve Roberts, Private Equity Group Leader at PwC in Germany
In conversation with Steve Roberts, Private Equity Group Leader at PwC in Germany
business with PE’s limited partners, 37% stated that they much more frequently co-invest in deals. This is also what I find very interesting. In the past, pension funds or insurers preferred to hide behind private equity. Nowadays, they step aggressively into the public gaze as co-investors and sponsors.
In the past, private equity in Germany has been accused of burdening their portfolio companies with high levels of debt in order to maximize their own return. Are financial investors nowadays also more cooperative in this respect?
Definitely. 68% of the surveyed PE managers stated that financial engineering has become much less significant – and this for quite some time now. Multiples and valuations are currently very high – on average even higher than before the financial crisis in 2008. However, what we are seeing is that the amount of debt that is taken on to finance transactions has decreased and remained at a significantly lower level than it was in 2007 for example. The results from our survey also support this: when asked what is the most important component of their own business model, 44% nowadays state that the primary objective is to “drive forward the operations” of the portfolio companies. Further confirmation in this respect is that, according to another recently published PwC survey, 83% of German family-owned middle market companies could imagine a financial investor participating in their company. What we also see in our day to day business is that private equity continues
The latest trend analysis of PwC shows: Europe’s financial investors are adopting a much more cooperative approach than five or ten years ago. The European market continues to boom and deal volumes have achieved new heights. Steve Roberts, Head of Private Equity at PwC in Germany, explains why.
One of the main findings of the Private Equity Trend Report 2018 is that Europe’s private equity companies are increasingly focusing on collaboration rather than confrontation. How precisely do you come to this conclusion?
Correct. There are multiple factors behind this. On one hand there are record levels of dry powder, raised funds have grown and the virtually zero interest environment has made the underlying macroeconomic conditions almost perfect for private equity and their operating model. However, there is a scarcity of takeover targets to feed this heightened appetite and this combined with increasing competition, continuing geopolitical uncertainty, unpredictable financial markets as well as increased pressure from LPs has all led to this current dynamic. For example, we asked private equity managers to indicate how the business model of the sector has changed during the past three years. In response to this question, 66% answered that they would cooperate with strategic investors much more frequently than was previously the case. In other words: instead of competing for a takeover target, the preferred approach is to adopt a strategy based on common ground. In response to the question about what has changed in doing
Private Equity Trend Report 2018 13
“Private equity has continuously matured, demonstrating its robustness and agility: a coming of age.”
to place more and more emphasis on developing equity stories based on operational value creation as well digitization initiatives. With the factors and market dynamics stated previously, some private equity fund managers who do not have the pressure to invest, have turned to their current portfolio and working on making it bigger, stronger and more robust. Emphasis for many is increasing profitability, while focusing on top-line growth – also with help of new digital channels. On the other hand, this portfolio strategy has also spurred dealmaking – that is why sectors, which are very fragmented and thus ripe for market consolidation are a core focus for private equity – a perfect field for developing buy-and-build strategies.
But doesn’t this mean lower returns for the private equity sector and inevitably so for limited partners?
On the face of it one may think this to be the case, however, the industry is working hard to counteract this through deep value creation and buy-and-build strategies, which are realized through longer holding periods. You must see that times have changed, and with it there has also been a change in the approach of most financial investors. The picture is of a sector which is becoming more and more mature, a sort of coming of age. Private equity has outperformed every other alternative investment class – and significantly so. This is also the reason in this low-yield environment for more and more insurance companies, pension funds and even sovereign wealth funds to be dedicating larger amounts to private equity. It has become more difficult for private equity fund managers to generate
these top returns – and now they are not focusing on leverage and multiple arbitrage but have to pull up their sleeves and work deeply together with their portfolios to build better businesses. The sector has achieved a constant high growth on this basis. Accordingly, 48% of private equity managers stated that the number of their investments in 2017 has increased compared with the prior year – whereas another 32% stated investments remained at the same level as in 2016 – which was already at a very high level.
Is there a link between the cooperative approach and the strong growth rates?
That is precisely what I believe. There is a link between the ever increasing operational focus of private equity on their portfolios and the increased cooperation with strategic investors as well as limited partners. Private equity has joined forces and this has proven to be a success. There is definitely no sign of an end to the private equity boom which has been ongoing for many years now. Even in a slow macroeconomic environment our survey shows that 57% stated that they were satisfied with the development of their portfolio companies; only 14% were dissatisfied. In addition, 50% expect to see even better business this year, while 64% expect investments in 2018 to increase further. The private equity sector is not experiencing a temporary upswing; on the contrary, it is in the process of further establishing itself as a permanent and prominent presence in Europe.
14 Private Equity Trend Report 2018
Market Overview
A Market Overview
Private Equity Trend Report 2018 15
Market Overview
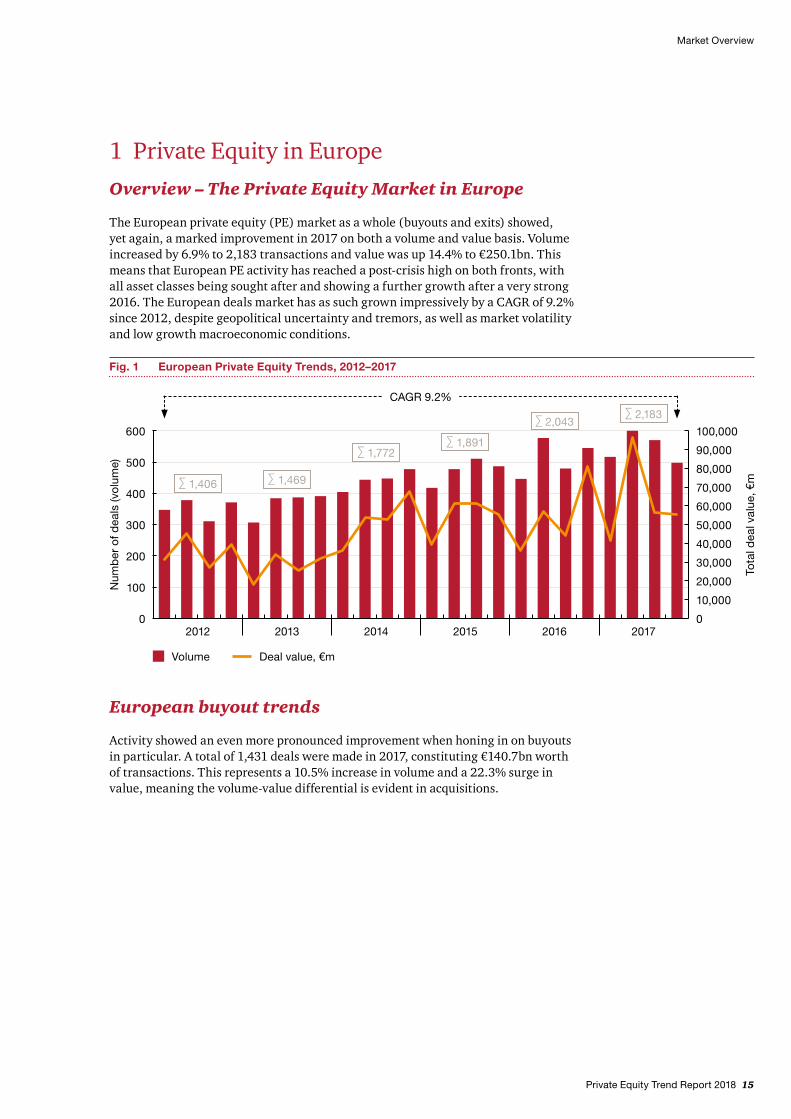
1 Private Equity in EuropeOverview – The Private Equity Market in Europe
The European private equity (PE) market as a whole (buyouts and exits) showed, yet again, a marked improvement in 2017 on both a volume and value basis. Volume increased by 6.9% to 2,183 transactions and value was up 14.4% to €250.1bn. This means that European PE activity has reached a post-crisis high on both fronts, with all asset classes being sought after and showing a further growth after a very strong 2016. The European deals market has as such grown impressively by a CAGR of 9.2% since 2012, despite geopolitical uncertainty and tremors, as well as market volatility and low growth macroeconomic conditions.
European buyout trends
Activity showed an even more pronounced improvement when honing in on buyouts in particular. A total of 1,431 deals were made in 2017, constituting €140.7bn worth of transactions. This represents a 10.5% increase in volume and a 22.3% surge in value, meaning the volume-value differential is evident in acquisitions.
Fig. 1 European Private Equity Trends, 2012–2017
CAGR 9.2%
∑ 1,406 ∑ 1,469
∑ 1,772∑ 1,891
∑ 2,043∑ 2,183
Volume Deal value, €m
300
2012 2013 2014 2015 2016 20170
100
400
500
600
200
Num
ber
of d
eals
(vo
lum
e)
Tota
l dea
l val
ue, €
m
10,000
20,000
30,000
40,000
50,000
60,000
80,000
90,000
100,000
70,000
0
16 Private Equity Trend Report 2018
Market Overview
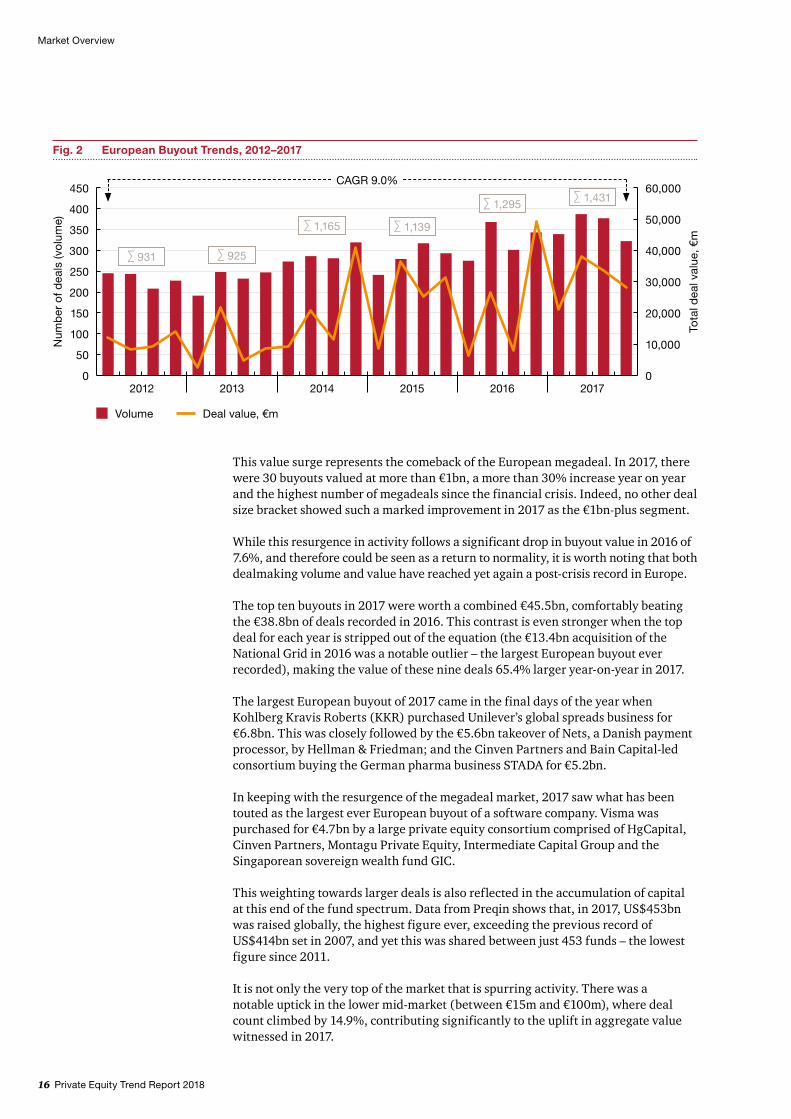
This value surge represents the comeback of the European megadeal. In 2017, there were 30 buyouts valued at more than €1bn, a more than 30% increase year on year and the highest number of megadeals since the financial crisis. Indeed, no other deal size bracket showed such a marked improvement in 2017 as the €1bn-plus segment.
While this resurgence in activity follows a significant drop in buyout value in 2016 of 7.6%, and therefore could be seen as a return to normality, it is worth noting that both dealmaking volume and value have reached yet again a post-crisis record in Europe.
The top ten buyouts in 2017 were worth a combined €45.5bn, comfortably beating the €38.8bn of deals recorded in 2016. This contrast is even stronger when the top deal for each year is stripped out of the equation (the €13.4bn acquisition of the National Grid in 2016 was a notable outlier – the largest European buyout ever recorded), making the value of these nine deals 65.4% larger year-on-year in 2017.
The largest European buyout of 2017 came in the final days of the year when Kohlberg Kravis Roberts (KKR) purchased Unilever’s global spreads business for €6.8bn. This was closely followed by the €5.6bn takeover of Nets, a Danish payment processor, by Hellman & Friedman; and the Cinven Partners and Bain Capital-led consortium buying the German pharma business STADA for €5.2bn.
In keeping with the resurgence of the megadeal market, 2017 saw what has been touted as the largest ever European buyout of a software company. Visma was purchased for €4.7bn by a large private equity consortium comprised of HgCapital, Cinven Partners, Montagu Private Equity, Intermediate Capital Group and the Singaporean sovereign wealth fund GIC.
This weighting towards larger deals is also reflected in the accumulation of capital at this end of the fund spectrum. Data from Preqin shows that, in 2017, US$453bn was raised globally, the highest figure ever, exceeding the previous record of US$414bn set in 2007, and yet this was shared between just 453 funds – the lowest figure since 2011.
It is not only the very top of the market that is spurring activity. There was a notable uptick in the lower mid-market (between €15m and €100m), where deal count climbed by 14.9%, contributing significantly to the uplift in aggregate value witnessed in 2017.
Fig. 2 European Buyout Trends, 2012–2017
Volume Deal value, €m
300
2012 2013 2014 2015 2016 20170
50
350
400
450
250
200
150
100
Num
ber
of d
eals
(vo
lum
e)
Tota
l dea
l val
ue, €
m
10,000
20,000
30,000
40,000
50,000
60,000
0
∑ 931 ∑ 925
∑ 1,165 ∑ 1,139
∑ 1,295∑ 1,431
CAGR 9.0%
Private Equity Trend Report 2018 17
Market Overview
This increase in buyout investment is expected given the improvement in market conditions and macroeconomic indicators in 2017. The previous year had been marked by uncertainty, both geopolitically and in capital markets. The year began with a number of major global stock market indices below where they had started the year before. Private market investors look to stock markets as a proxy for investor sentiment and the likelihood of being able to float their companies for exit, as well as a benchmark for market comp valuations.
In Europe, 2016 was also notable for the uncertainty surrounding the Brexit referendum. This had a noticeable impact on the UK and Ireland private equity market, which accounted for a smaller share of activity in the year as buyout funds in the country eased off, amid the unpredictable geopolitical environment.
In contrast, investors appear to have adjusted to the reality that the UK is leaving the EU. Equipped with dry powder and strict deployment timeframes, GPs must ultimately continue to put capital to work and intensify investment ahead of the country initiating its exit in 2019.
In the US, markets have rallied to record highs since the inauguration of President Trump. Meanwhile, stock market volatility, at least for the time being, has decreased. This is likely to be a result of the administration’s pro-business agenda. The most notable example of this has been the corporate tax overhaul that will accrue to company earnings.
Monetary policy remains loose, especially in Europe where the interest rate is essentially zero, and therefore the debt necessary to finance buyouts continues to be cheap. There also remains a supply-demand imbalance, with more equity capital than there are opportunities to invest that capital, sustaining the high-price environment.
This is a persistent challenge for private equity funds, but with markets performing well and capital being returned to investors, who still face a low-yield environment, money continues to be recycled back into PE funds, as evidenced by last year’s record fundraising figures. So long as these conditions persist, the pressure to deploy should ensure dealmaking remains buoyant.
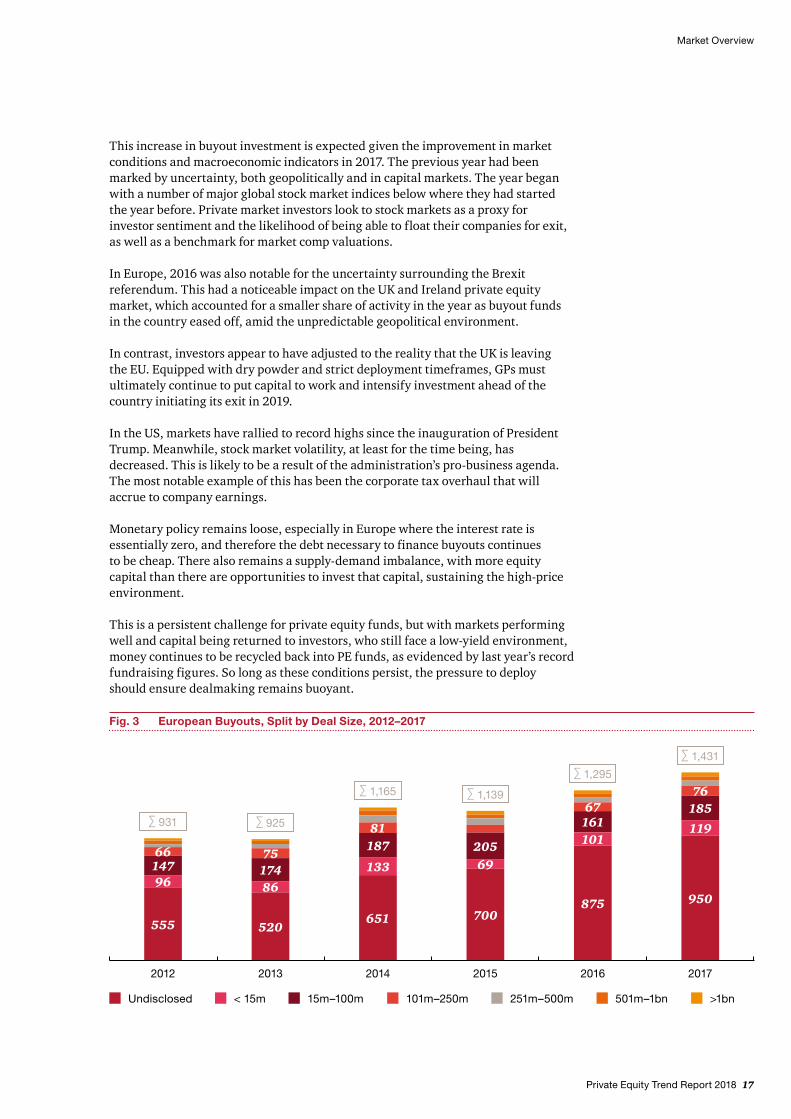
Fig. 3 European Buyouts, Split by Deal Size, 2012–2017
Undisclosed 15m–100m< 15m 101m–250m 251m–500m 501m–1bn >1bn
201420132012 2015 2016 2017
∑ 931
555
14766
96
∑ 925
520
8617475
∑ 1,165
651
133
18781
∑ 1,139
700
69205
∑ 1,295
875
10116167
∑ 1,431
950
119
18576
18 Private Equity Trend Report 2018
Market Overview
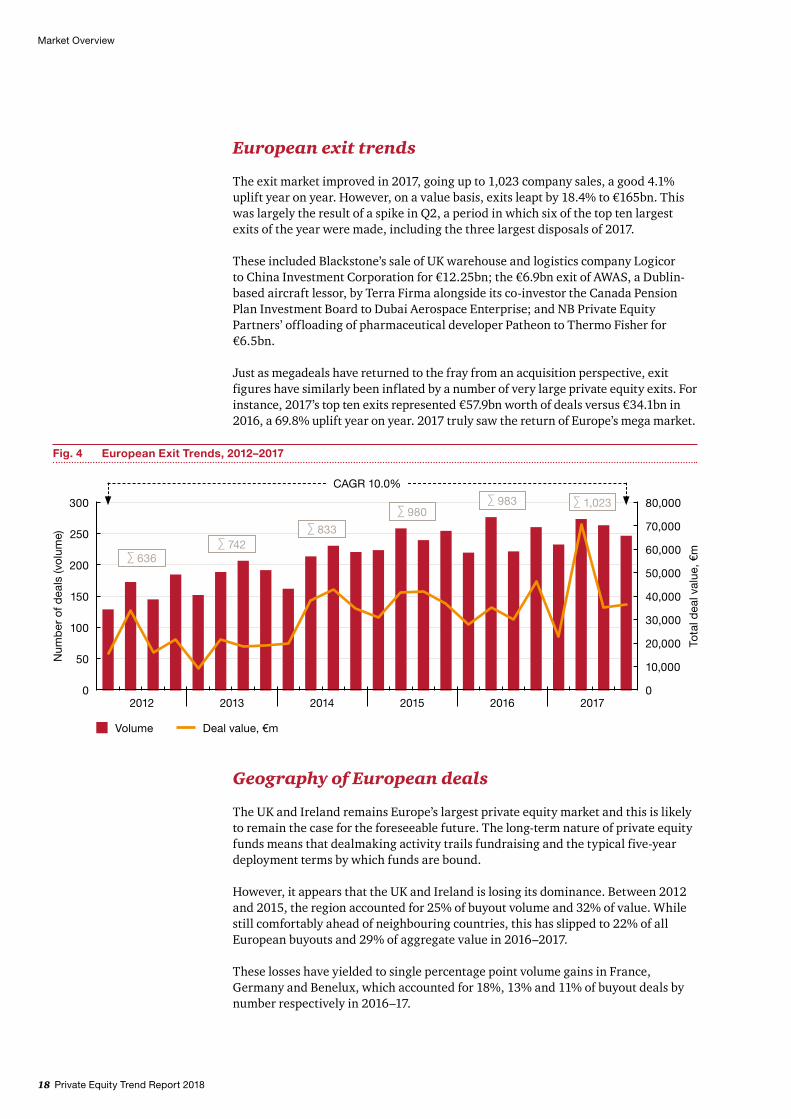
European exit trends
The exit market improved in 2017, going up to 1,023 company sales, a good 4.1% uplift year on year. However, on a value basis, exits leapt by 18.4% to €165bn. This was largely the result of a spike in Q2, a period in which six of the top ten largest exits of the year were made, including the three largest disposals of 2017.
These included Blackstone’s sale of UK warehouse and logistics company Logicor to China Investment Corporation for €12.25bn; the €6.9bn exit of AWAS, a Dublin-based aircraft lessor, by Terra Firma alongside its co-investor the Canada Pension Plan Investment Board to Dubai Aerospace Enterprise; and NB Private Equity Partners’ offloading of pharmaceutical developer Patheon to Thermo Fisher for €6.5bn.
Just as megadeals have returned to the fray from an acquisition perspective, exit figures have similarly been inflated by a number of very large private equity exits. For instance, 2017’s top ten exits represented €57.9bn worth of deals versus €34.1bn in 2016, a 69.8% uplift year on year. 2017 truly saw the return of Europe’s mega market.
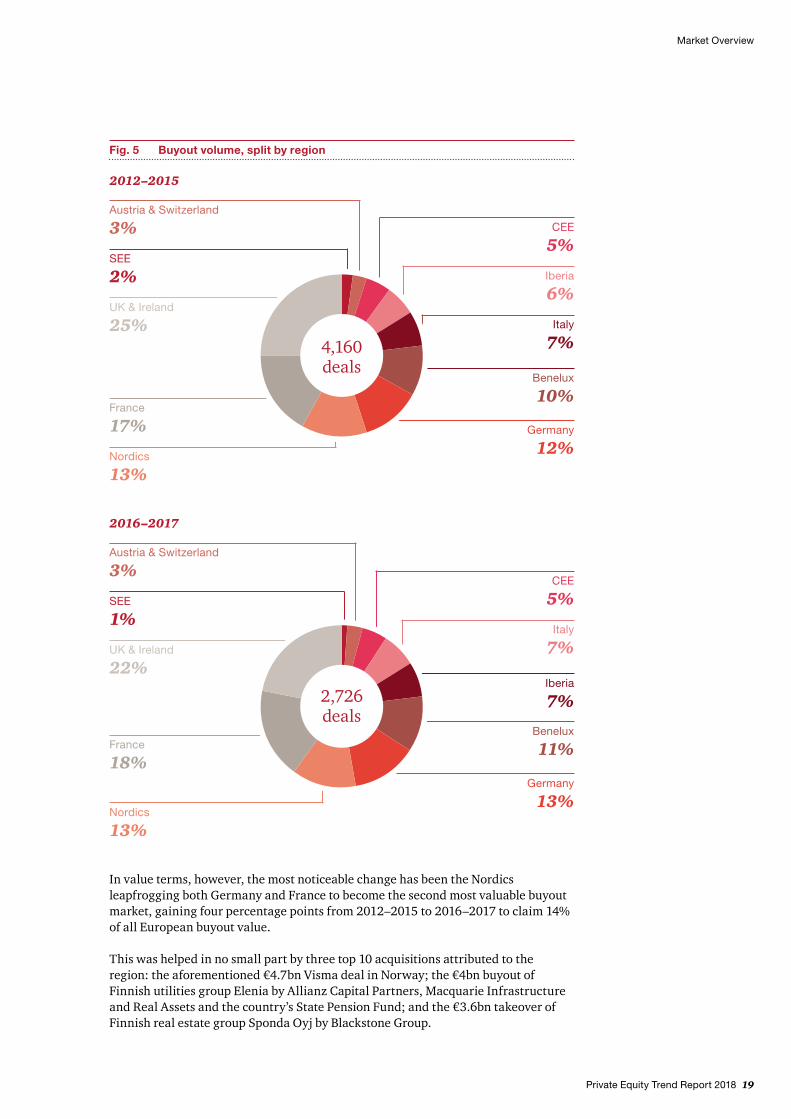
Geography of European deals
The UK and Ireland remains Europe’s largest private equity market and this is likely to remain the case for the foreseeable future. The long-term nature of private equity funds means that dealmaking activity trails fundraising and the typical five-year deployment terms by which funds are bound.
However, it appears that the UK and Ireland is losing its dominance. Between 2012 and 2015, the region accounted for 25% of buyout volume and 32% of value. While still comfortably ahead of neighbouring countries, this has slipped to 22% of all European buyouts and 29% of aggregate value in 2016–2017.
These losses have yielded to single percentage point volume gains in France, Germany and Benelux, which accounted for 18%, 13% and 11% of buyout deals by number respectively in 2016–17.
Fig. 4 European Exit Trends, 2012–2017
Volume Deal value, €m
150
2012 2013 2014 2015 2016 20170
50
200
250
300
100
Num
ber
of d
eals
(vo
lum
e)
Tota
l dea
l val
ue, €
m
10,000
20,000
30,000
40,000
50,000
60,000
80,000
70,000
0
∑ 636∑ 742
∑ 980∑ 833
∑ 983 ∑ 1,023
CAGR 10.0%
Private Equity Trend Report 2018 19
Market Overview
In value terms, however, the most noticeable change has been the Nordics leapfrogging both Germany and France to become the second most valuable buyout market, gaining four percentage points from 2012–2015 to 2016–2017 to claim 14% of all European buyout value.
This was helped in no small part by three top 10 acquisitions attributed to the region: the aforementioned €4.7bn Visma deal in Norway; the €4bn buyout of Finnish utilities group Elenia by Allianz Capital Partners, Macquarie Infrastructure and Real Assets and the country’s State Pension Fund; and the €3.6bn takeover of Finnish real estate group Sponda Oyj by Blackstone Group.
Fig. 5 Buyout volume, split by region
2016–2017
SEE
1%
UK & Ireland
22%
France
18%Germany
13%
Austria & Switzerland
3%
Benelux
11%
CEE
5%
Italy
7%
Iberia
7%
Nordics
13%
2,726 deals
2012–2015
SEE
2%
France
17%
UK & Ireland
25%
Nordics
13%
Germany
12%
Austria & Switzerland
3%
Benelux
10%
CEE
5%
Iberia
6%
Italy
7%4,160 deals
20 Private Equity Trend Report 2018
Market Overview
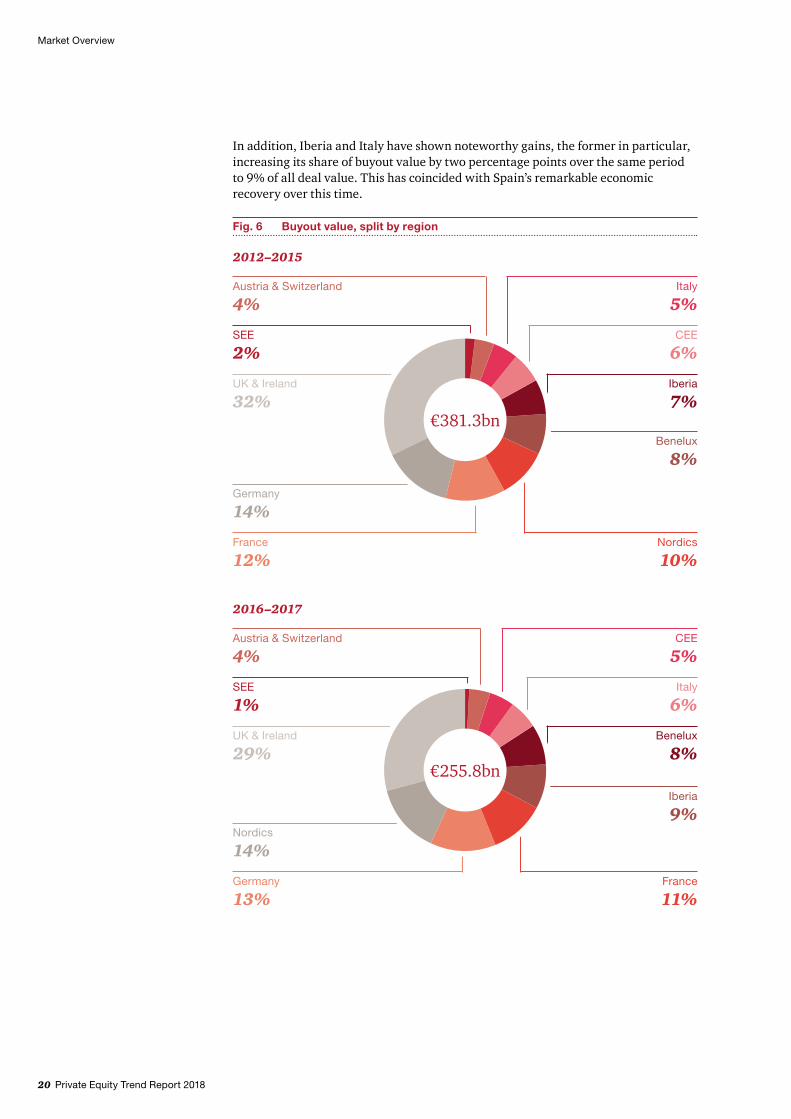
In addition, Iberia and Italy have shown noteworthy gains, the former in particular, increasing its share of buyout value by two percentage points over the same period to 9% of all deal value. This has coincided with Spain’s remarkable economic recovery over this time.
Fig. 6 Buyout value, split by region
2012–2015
SEE
2%
Germany
14%
UK & Ireland
32%
France
12%Nordics
10%
Austria & Switzerland
4%
Benelux
8%
Italy
5%
CEE
6%
Iberia
7%€381.3bn
2016–2017
SEE
1%
UK & Ireland
29%
Nordics
14%
France
11%
Austria & Switzerland
4%
Iberia
9%
CEE
5%
Italy
6%
Benelux
8%
Germany
13%
€255.8bn

Private Equity Trend Report 2018 21
Market Overview
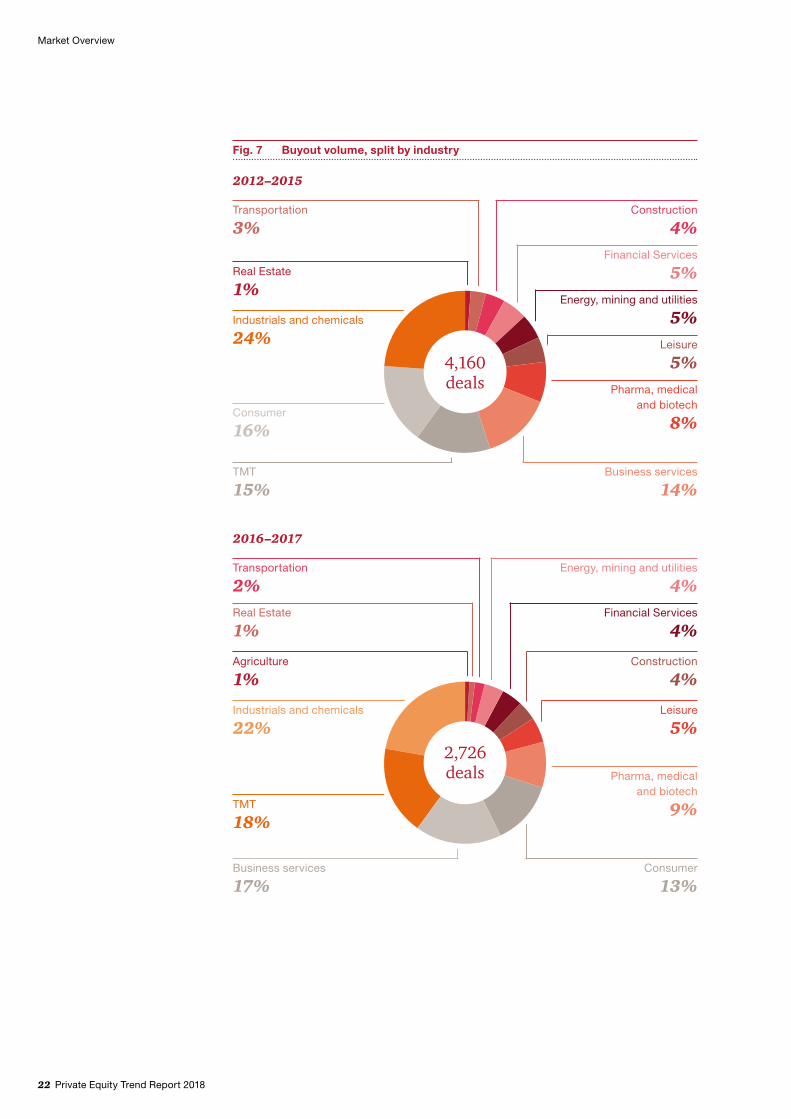
Industry focus
The sectoral composition of Europe’s buyout activity remains relatively static over time in that the most in-demand industries for investment are: industrials and chemicals, technology, media and telecommunications (TMT), business services, consumer, pharma, medical and biotech, and financial services.
However, some of these have shown signs of falling out of favour among private equity investors. For instance, consumer has slipped out of the top three sectors, on both a volume and value basis over the last year.
This might be expected. The UK and Ireland represents the region’s largest buyout market. At the same time, fund managers have signalled a wariness for investments in companies exposed to inflationary effects linked to Brexit. Businesses that have inputs denominated in euro and other overseas currencies but are dependent on a weaker sterling for revenues are under pressure and seen as riskier bets.
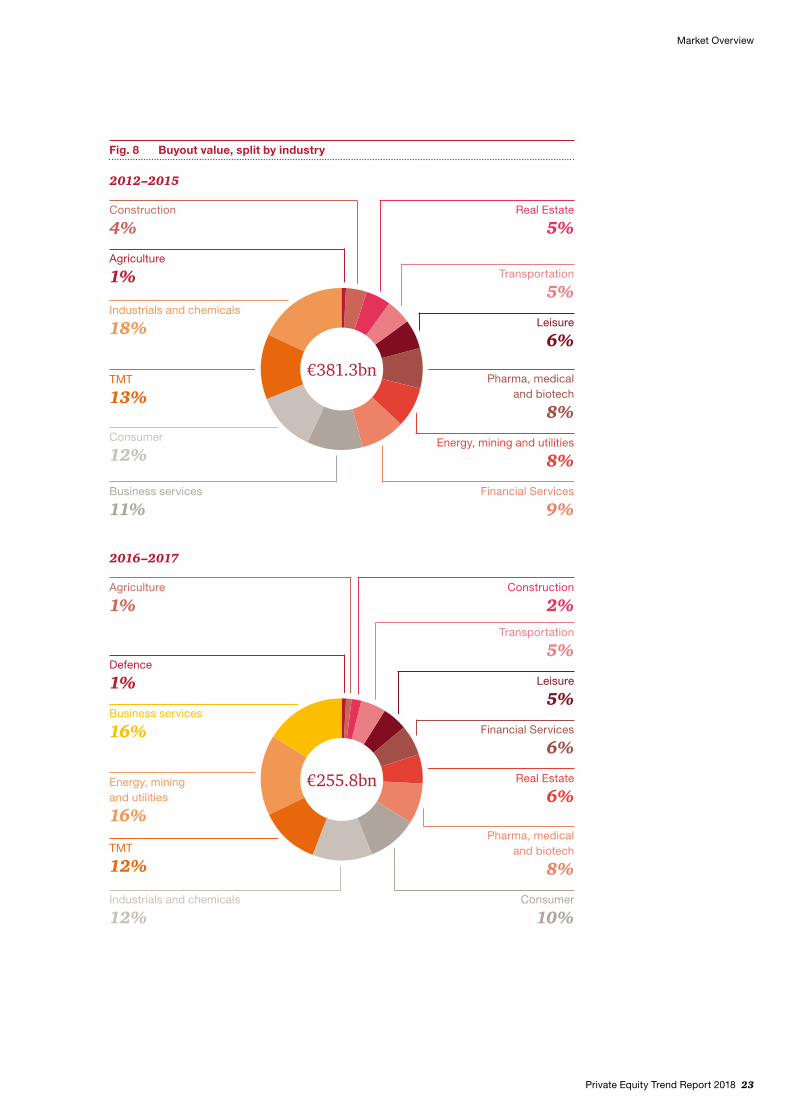
Over the same period, business services’ deal value has surged, from 11% of buyout value to 16%, putting it neck and neck with energy, mining and utilities as the top sector in Europe for euros invested. Indeed, the energy industry was not even a top five sector in previous years, but has barged its way to the top. This may be a sign that private equity funds have called the bottom of the energy and commodities market, which went into free fall in 2014, and see value upside in underpriced assets.
22 Private Equity Trend Report 2018
Market Overview
Fig. 7 Buyout volume, split by industry
2012–2015
Real Estate
1%
Consumer
16%
Industrials and chemicals
24%
TMT
15%Business services
14%
Pharma, medicaland biotech
8%
Transportation
3%
Leisure
5%
Construction
4%Financial Services
5%Energy, mining and utilities
5%
4,160 deals
2016–2017
Agriculture
1%
Industrials and chemicals
22%
TMT
18%
Business services
17%Consumer
13%
Real Estate
1%
Transportation
2%Energy, mining and utilities
4%
Pharma, medical and biotech
9%
Financial Services
4%
Construction
4%
Leisure
5%2,726 deals
Private Equity Trend Report 2018 23
Market Overview
Fig. 8 Buyout value, split by industry
2012–2015
Agriculture
1%
Construction
4%
TMT
13%
Industrials and chemicals
18%
Consumer
12%
Business services
11%Financial Services
9%
Real Estate
5%
Pharma, medicaland biotech
8%
Energy, mining and utilities
8%
Transportation
5%
Leisure
6%
€381.3bn
2016–2017
Construction
2%
Energy, mining and utilities
16%
Agriculture
1%
Business services
16%
Defence
1%
TMT
12%
Industrials and chemicals
12%
Transportation
5%
Consumer
10%
Pharma, medical and biotech
8%
Leisure
5%
Financial Services
6%
Real Estate
6%€255.8bn
Market Overview
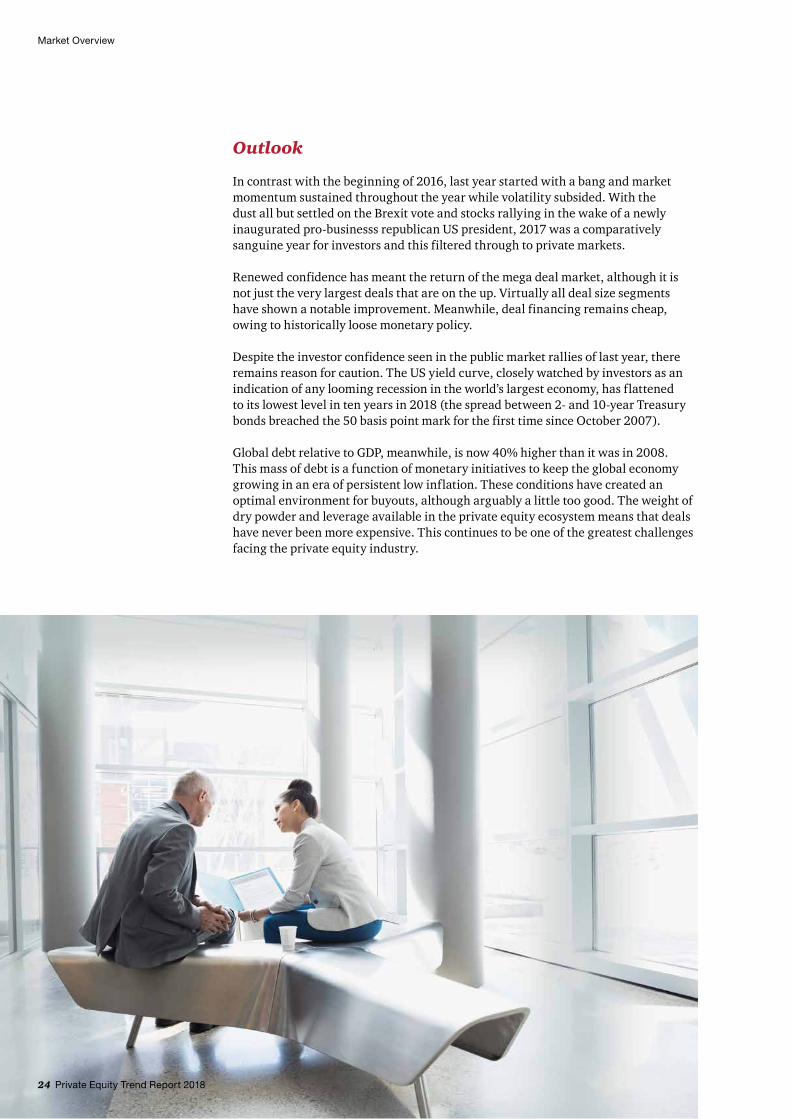
Outlook
In contrast with the beginning of 2016, last year started with a bang and market momentum sustained throughout the year while volatility subsided. With the dust all but settled on the Brexit vote and stocks rallying in the wake of a newly inaugurated pro-businesss republican US president, 2017 was a comparatively sanguine year for investors and this filtered through to private markets.
Renewed confidence has meant the return of the mega deal market, although it is not just the very largest deals that are on the up. Virtually all deal size segments have shown a notable improvement. Meanwhile, deal financing remains cheap, owing to historically loose monetary policy.
Despite the investor confidence seen in the public market rallies of last year, there remains reason for caution. The US yield curve, closely watched by investors as an indication of any looming recession in the world’s largest economy, has flattened to its lowest level in ten years in 2018 (the spread between 2- and 10-year Treasury bonds breached the 50 basis point mark for the first time since October 2007).
Global debt relative to GDP, meanwhile, is now 40% higher than it was in 2008. This mass of debt is a function of monetary initiatives to keep the global economy growing in an era of persistent low inflation. These conditions have created an optimal environment for buyouts, although arguably a little too good. The weight of dry powder and leverage available in the private equity ecosystem means that deals have never been more expensive. This continues to be one of the greatest challenges facing the private equity industry.
24 Private Equity Trend Report 2018
Private Equity Trend Report 2018 25
DACH Spotlight
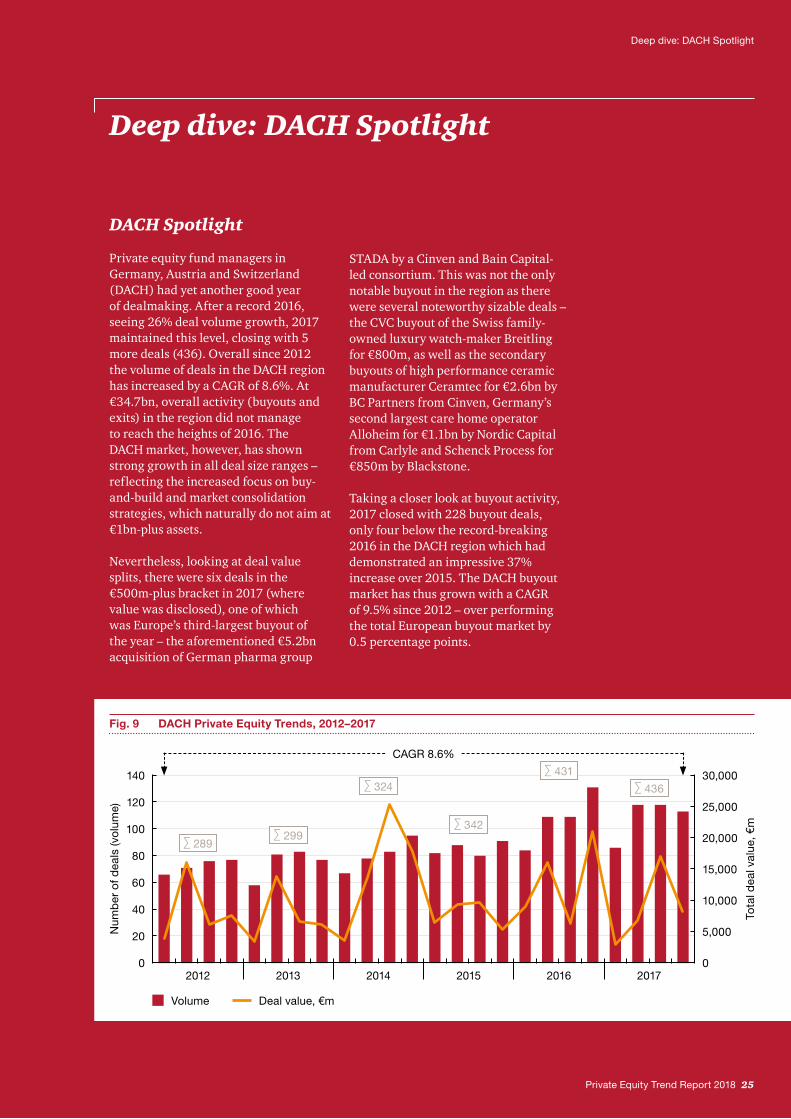
Private equity fund managers in Germany, Austria and Switzerland (DACH) had yet another good year of dealmaking. After a record 2016, seeing 26% deal volume growth, 2017 maintained this level, closing with 5 more deals (436). Overall since 2012 the volume of deals in the DACH region has increased by a CAGR of 8.6%. At €34.7bn, overall activity (buyouts and exits) in the region did not manage to reach the heights of 2016. The DACH market, however, has shown strong growth in all deal size ranges – reflecting the increased focus on buy-and-build and market consolidation strategies, which naturally do not aim at €1bn-plus assets.
Nevertheless, looking at deal value splits, there were six deals in the €500m-plus bracket in 2017 (where value was disclosed), one of which was Europe’s third-largest buyout of the year – the aforementioned €5.2bn acquisition of German pharma group
STADA by a Cinven and Bain Capital-led consortium. This was not the only notable buyout in the region as there were several noteworthy sizable deals – the CVC buyout of the Swiss family-owned luxury watch-maker Breitling for €800m, as well as the secondary buyouts of high performance ceramic manufacturer Ceramtec for €2.6bn by BC Partners from Cinven, Germany’s second largest care home operator Alloheim for €1.1bn by Nordic Capital from Carlyle and Schenck Process for €850m by Blackstone.
Taking a closer look at buyout activity, 2017 closed with 228 buyout deals, only four below the record-breaking 2016 in the DACH region which had demonstrated an impressive 37% increase over 2015. The DACH buyout market has thus grown with a CAGR of 9.5% since 2012 – over performing the total European buyout market by 0.5 percentage points.
Deep dive: DACH Spotlight
Deep dive: DACH Spotlight
Fig. 9 DACH Private Equity Trends, 2012–2017
Volume Deal value, €m
Num
ber
of d
eals
(vo
lum
e)
60
2012 2013 2014 2015 2016 20170
20
80
100
140
120
40 Tota
l dea
l val
ue, €
m
5,000
10,000
15,000
30,000
25,000
20,000
0
∑ 289∑ 299
∑ 324
∑ 342
∑ 431∑ 436
CAGR 8.6%
Deep dive: DACH Spotlight
26 Private Equity Trend Report 2018
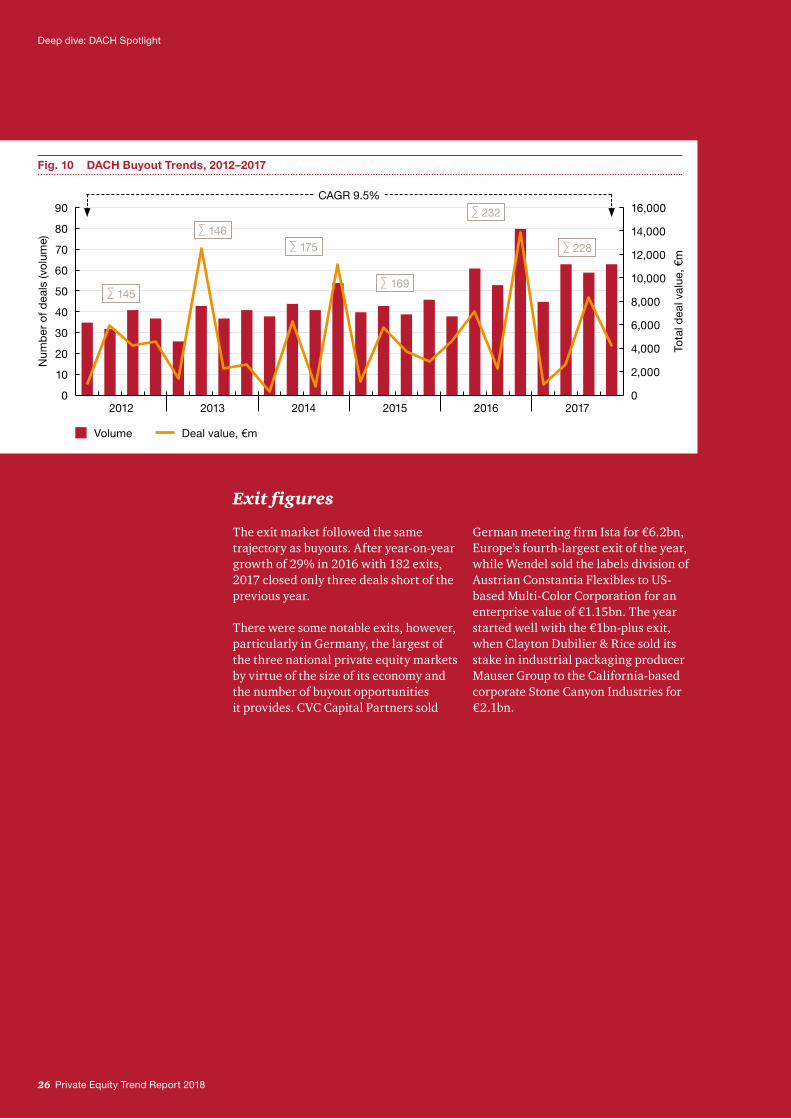
Exit figures
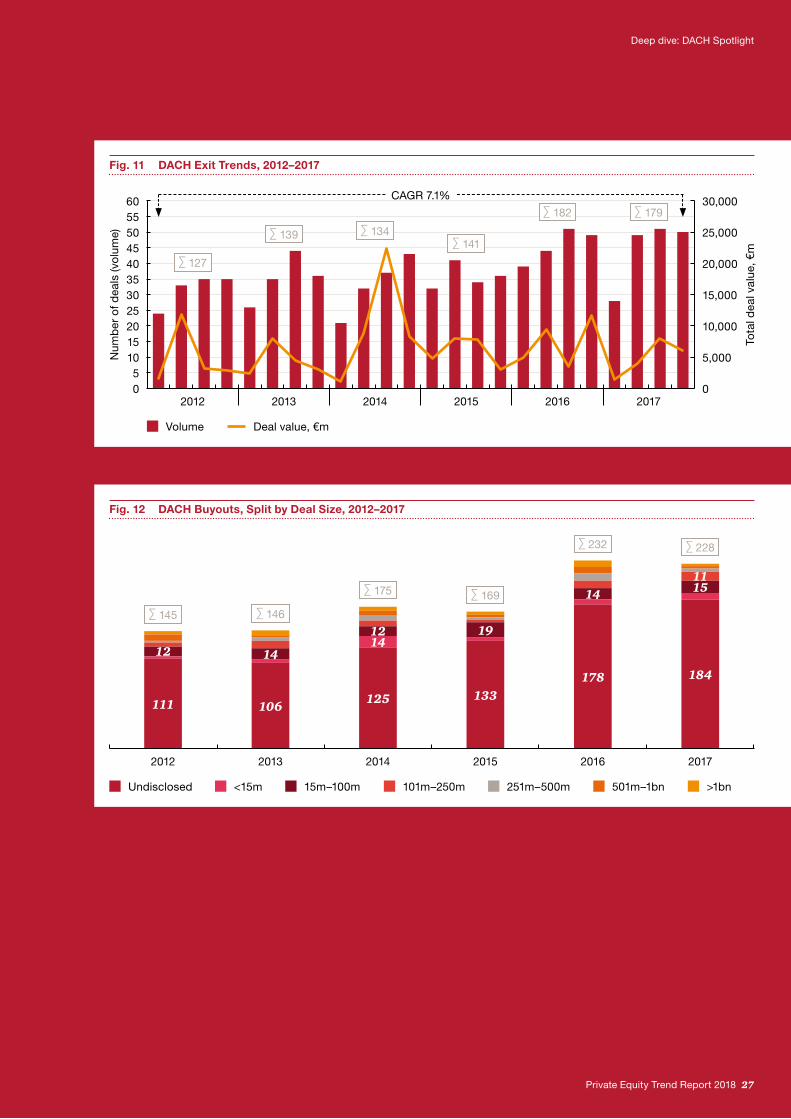
The exit market followed the same trajectory as buyouts. After year-on-year growth of 29% in 2016 with 182 exits, 2017 closed only three deals short of the previous year.
There were some notable exits, however, particularly in Germany, the largest of the three national private equity markets by virtue of the size of its economy and the number of buyout opportunities it provides. CVC Capital Partners sold
German metering firm Ista for €6.2bn, Europe’s fourth-largest exit of the year, while Wendel sold the labels division of Austrian Constantia Flexibles to US-based Multi-Color Corporation for an enterprise value of €1.15bn. The year started well with the €1bn-plus exit, when Clayton Dubilier & Rice sold its stake in industrial packaging producer Mauser Group to the California-based corporate Stone Canyon Industries for €2.1bn.
Fig. 10 DACH Buyout Trends, 2012–2017
Volume Deal value, €m
Num
ber
of d
eals
(vo
lum
e)
60
2012 2013 2014 2015 2016 20170
40
30
20
10
70
80
90
50
Tota
l dea
l val
ue, €
m
8,000
6,000
4,000
2,000
10,000
12,000
16,000
14,000
0
∑ 145
∑ 146∑ 175
∑ 169
∑ 232
∑ 228
CAGR 9.5%
Deep dive: DACH Spotlight
Private Equity Trend Report 2018 27
Fig. 12 DACH Buyouts, Split by Deal Size, 2012–2017
Undisclosed 15m–100m<15m 101m–250m 251m–500m 501m–1bn >1bn
201420132012 2015 2016 2017
∑ 145
111
12
∑ 146
106
14
∑ 175
125
1412
∑ 169
133
19
∑ 232
178
14
∑ 228
184
1511
Fig. 11 DACH Exit Trends, 2012–2017
Volume Deal value, €m
Num
ber
of d
eals
(vo
lum
e)
2012 2013 2014 2015 2016 2017
35
0
252015105
4045
605550
30
Tota
l dea
l val
ue, €
m
5,000
10,000
15,000
30,000
25,000
20,000
0
∑ 127
∑ 139 ∑ 134∑ 141
∑ 182 ∑ 179
CAGR 7.1%
28 Private Equity Trend Report 2018
Deep dive: DACH Spotlight
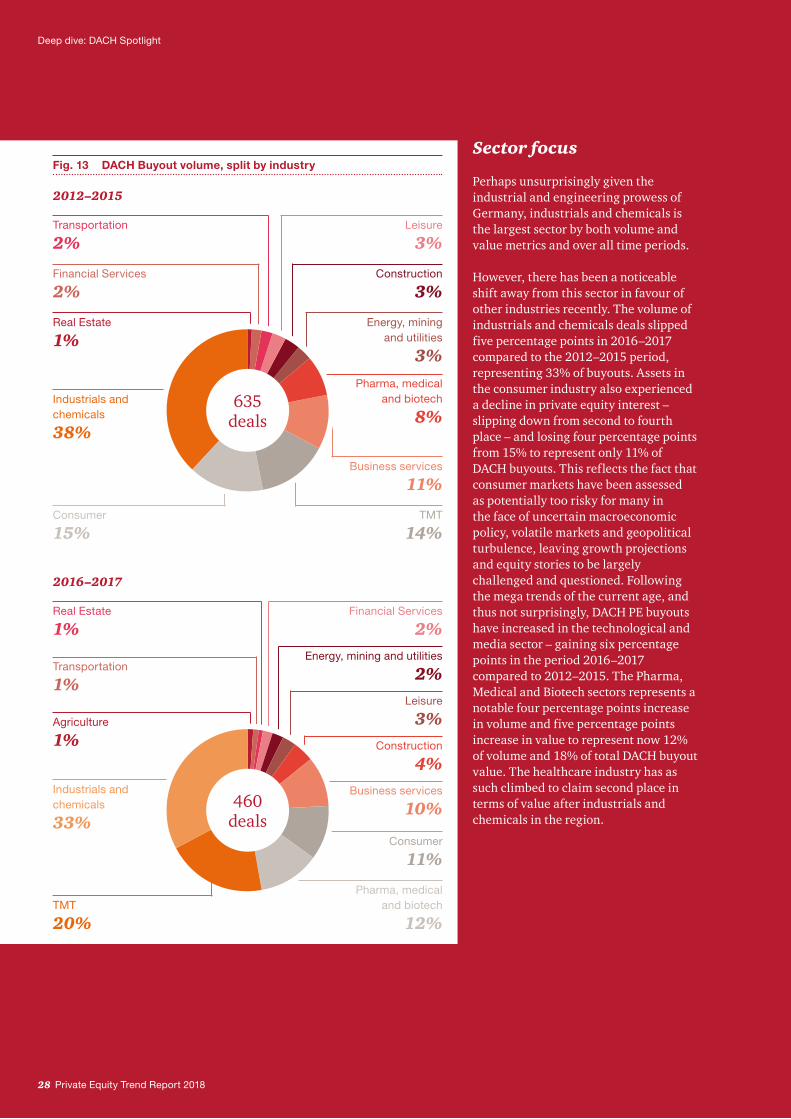
Sector focus
Perhaps unsurprisingly given the industrial and engineering prowess of Germany, industrials and chemicals is the largest sector by both volume and value metrics and over all time periods.
However, there has been a noticeable shift away from this sector in favour of other industries recently. The volume of industrials and chemicals deals slipped five percentage points in 2016–2017 compared to the 2012–2015 period, representing 33% of buyouts. Assets in the consumer industry also experienced a decline in private equity interest – slipping down from second to fourth place – and losing four percentage points from 15% to represent only 11% of DACH buyouts. This reflects the fact that consumer markets have been assessed as potentially too risky for many in the face of uncertain macroeconomic policy, volatile markets and geopolitical turbulence, leaving growth projections and equity stories to be largely challenged and questioned. Following the mega trends of the current age, and thus not surprisingly, DACH PE buyouts have increased in the technological and media sector – gaining six percentage points in the period 2016–2017 compared to 2012–2015. The Pharma, Medical and Biotech sectors represents a notable four percentage points increase in volume and five percentage points increase in value to represent now 12% of volume and 18% of total DACH buyout value. The healthcare industry has as such climbed to claim second place in terms of value after industrials and chemicals in the region.
Fig. 13 DACH Buyout volume, split by industry
2012–2015
Consumer
15%
Industrials and chemicals
38%
Real Estate
1%
Financial Services
2%
Transportation
2%
Business services
11%
TMT
14%
Pharma, medical and biotech
8%
Energy, mining and utilities
3%
Construction
3%
Leisure
3%
635 deals
2016–2017
Consumer
11%
Construction
4%
TMT
20%
Industrials and chemicals
33%
Transportation
1%
Agriculture
1%
Real Estate
1%
Pharma, medical and biotech
12%
Business services
10%
Financial Services
2%Energy, mining and utilities
2%Leisure
3%
460 deals
Private Equity Trend Report 2018 29
Deep dive: DACH Spotlight
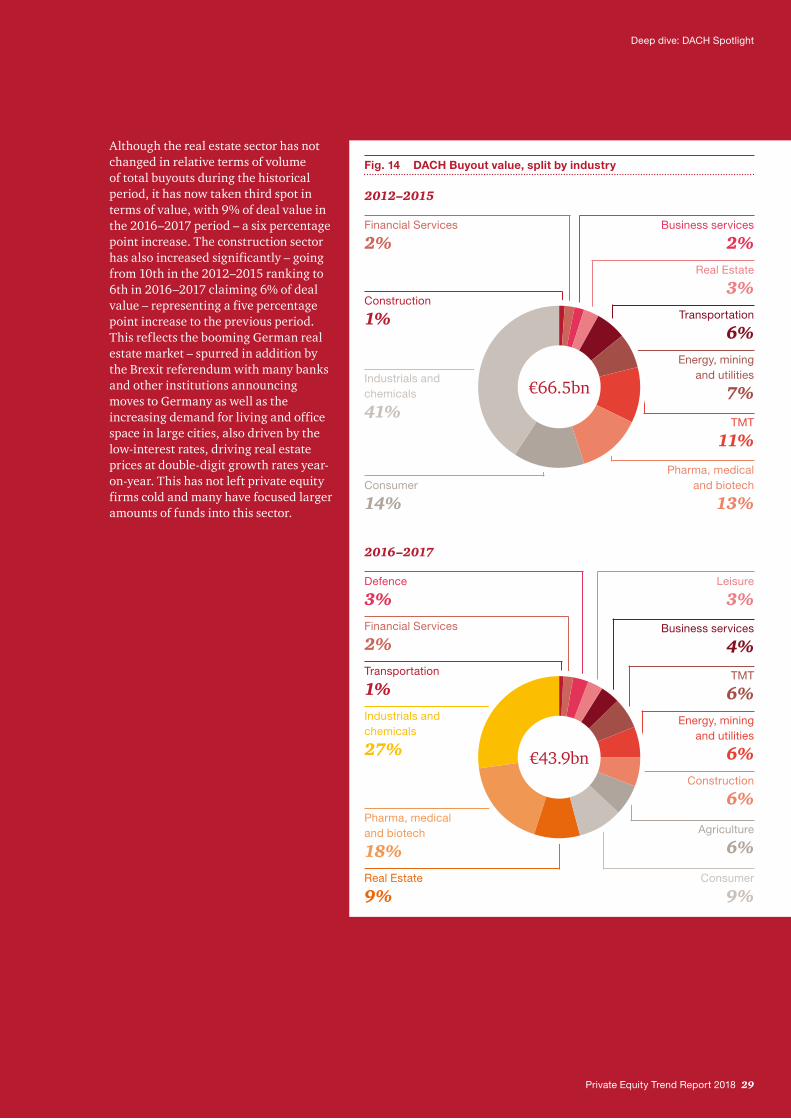
Although the real estate sector has not changed in relative terms of volume of total buyouts during the historical period, it has now taken third spot in terms of value, with 9% of deal value in the 2016–2017 period – a six percentage point increase. The construction sector has also increased significantly – going from 10th in the 2012–2015 ranking to 6th in 2016–2017 claiming 6% of deal value – representing a five percentage point increase to the previous period. This reflects the booming German real estate market – spurred in addition by the Brexit referendum with many banks and other institutions announcing moves to Germany as well as the increasing demand for living and office space in large cities, also driven by the low-interest rates, driving real estate prices at double-digit growth rates year-on-year. This has not left private equity firms cold and many have focused larger amounts of funds into this sector.
Fig. 14 DACH Buyout value, split by industry
2012–2015
Construction
1%
Consumer
14%
Industrials and chemicals
41%
Financial Services
2%
Pharma, medical and biotech
13%
TMT
11%
Energy, mining and utilities
7%
Business services
2%Real Estate
3%Transportation
6%
€66.5bn
2016–2017
TMT
6%
Construction
6%
Real Estate
9%
Pharma, medical and biotech
18%
Industrials and chemicals
27%
Transportation
1%
Financial Services
2%
Defence
3%
Agriculture
6%
Consumer
9%
Energy, mining and utilities
6%
Leisure
3%
Business services
4%
€43.9bn
Deep dive: Benelux Spotlight
Deep dive: Benelux Spotlight
Benelux Spotlight
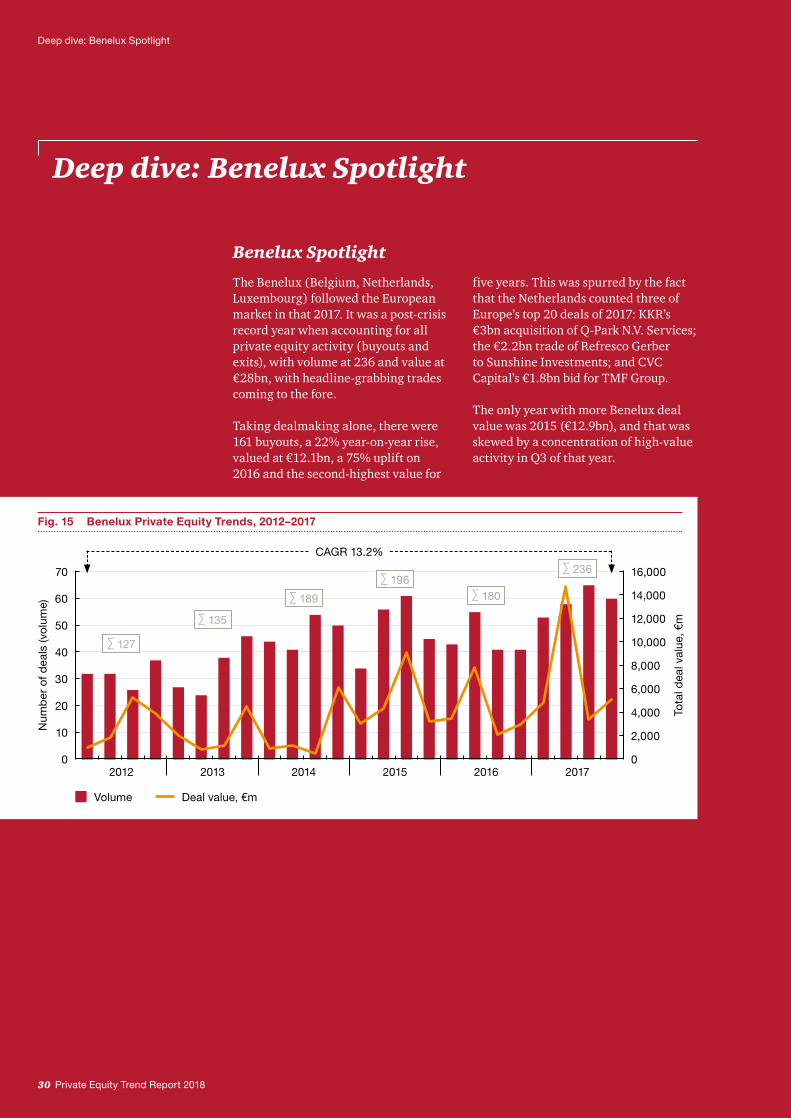
The Benelux (Belgium, Netherlands, Luxembourg) followed the European market in that 2017. It was a post-crisis record year when accounting for all private equity activity (buyouts and exits), with volume at 236 and value at €28bn, with headline-grabbing trades coming to the fore.
Taking dealmaking alone, there were 161 buyouts, a 22% year-on-year rise, valued at €12.1bn, a 75% uplift on 2016 and the second-highest value for
five years. This was spurred by the fact that the Netherlands counted three of Europe’s top 20 deals of 2017: KKR’s €3bn acquisition of Q-Park N.V. Services; the €2.2bn trade of Refresco Gerber to Sunshine Investments; and CVC Capital’s €1.8bn bid for TMF Group.
The only year with more Benelux deal value was 2015 (€12.9bn), and that was skewed by a concentration of high-value activity in Q3 of that year.
30 Private Equity Trend Report 2018
Fig. 15 Benelux Private Equity Trends, 2012–2017
Volume Deal value, €m
Num
ber
of d
eals
(vo
lum
e) 60
2012 2013 2014 2015 2016 20170
40
30
20
10
70
50
Tota
l dea
l val
ue, €
m8,000
6,000
4,000
2,000
10,000
12,000
16,000
14,000
0
∑ 127
∑ 135
∑ 189
∑ 196∑ 180
∑ 236
CAGR 13.2%
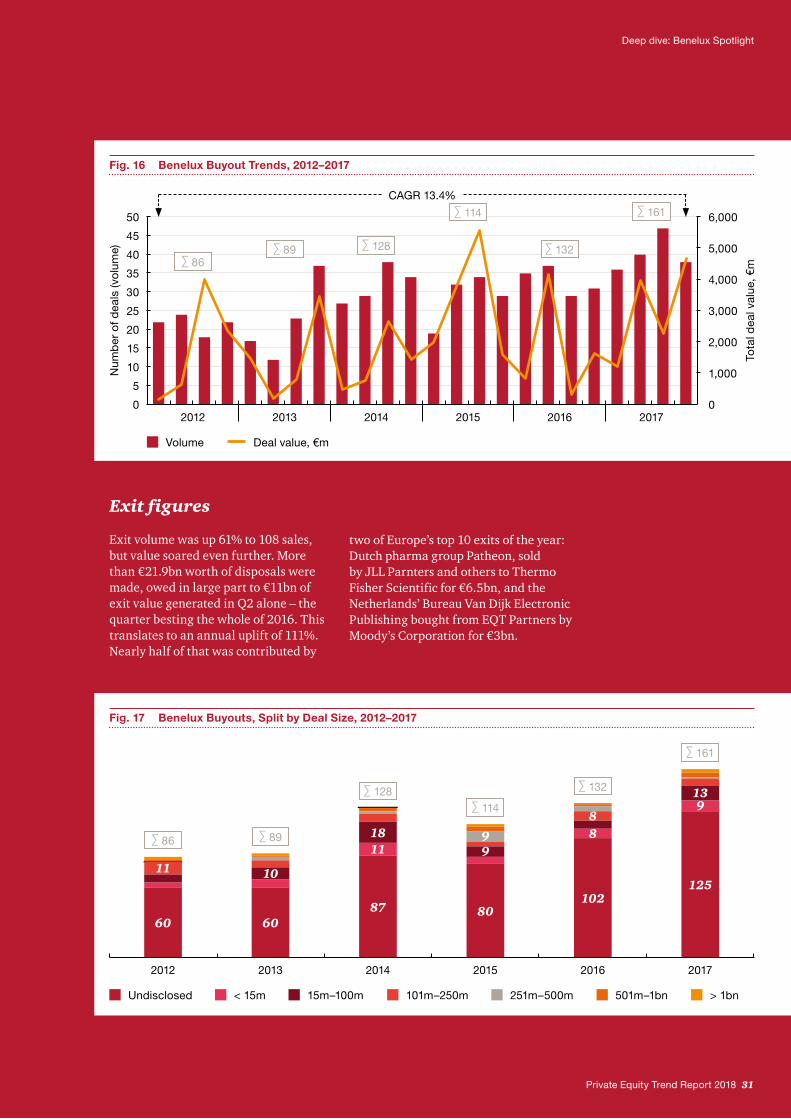
Exit figures
Exit volume was up 61% to 108 sales, but value soared even further. More than €21.9bn worth of disposals were made, owed in large part to €11bn of exit value generated in Q2 alone – the quarter besting the whole of 2016. This translates to an annual uplift of 111%. Nearly half of that was contributed by
two of Europe’s top 10 exits of the year: Dutch pharma group Patheon, sold by JLL Parnters and others to Thermo Fisher Scientific for €6.5bn, and the Netherlands’ Bureau Van Dijk Electronic Publishing bought from EQT Partners by Moody’s Corporation for €3bn.
Deep dive: Benelux Spotlight
Private Equity Trend Report 2018 31
Fig. 16 Benelux Buyout Trends, 2012–2017
Volume Deal value, €m
Num
ber
of d
eals
(vo
lum
e)
2012 2013 2014 2015 2016 2017
Tota
l dea
l val
ue, €
m
2,000
1,000
3,000
4,000
6,000
5,000
0
35
0
25
20
15
10
5
40
45
50
30
∑ 86∑ 89 ∑ 128
∑ 114
∑ 132
∑ 161
CAGR 13.4%
Fig. 17 Benelux Buyouts, Split by Deal Size, 2012–2017
∑ 86 ∑ 89
∑ 128∑ 114
∑ 132
∑ 161
60
11
60
10
1811
87
125
913
102
88
80
99
Undisclosed 15m–100m< 15m 101m–250m 251m–500m 501m–1bn > 1bn
201420132012 2015 2016 2017
Deep dive: Benelux Spotlight
32 Private Equity Trend Report 2018
Fig. 18 Benelux Exit Trends, 2012–2017
Volume Value, €m
Num
ber
of d
eals
(vo
lum
e)
2012 2013 2014 2015 2016 2017
Tota
l dea
l val
ue, €
m
4,000
2,000
6,000
8,000
12,000
10,000
0
25
0
15
10
5
30
35
40
20
∑ 66∑ 63
∑ 89
∑ 115
∑ 67
∑ 108
CAGR 10.4%
Volume, number of deals
Fig. 19 Benelux Buyout volume
Belgium Netherlands Luxembourg
∑ 86
58
27
∑ 89
65
21
∑ 128
95
30
∑ 114
73
36
∑ 132
103
27
∑ 161
128
32
201420132012 2015 2016 2017
5,465
1,649
∑ 7,114
4,784
819
∑ 5,895
3,768
1,113
∑ 5,28011,444
1,462
∑ 12,906
5,498
755
∑ 6,907 9,035
3,052
∑ 12,109Value, €m
201420132012 2015 2016 2017
Belgium Netherlands Luxembourg
Deep dive: Benelux Spotlight
Sector focus
Benelux companies in the business services sector have been heavily targeted in the last year. The industry went from claiming 13% to 19% of buyout volume between 2012–2015 and 2016–2017, and from 10% to 38% of deal value over the same timeframe. This means that €7.2bn worth of deals in the sector were clocked up in the year, making it the most-invested industry. One of the most notable buyouts came when CVC Capital Partners acquired TMF Group, a Dutch supplier of compliance and administration services from Doughty Hanson for €1.75bn.
Private Equity Trend Report 2018 33
Fig. 20 Benelux Buyout volume, split by industry
2016–2017
Business services
19%
Industrials and chemicals
21%
TMT
18%
Consumer
14%
Pharma, medical and biotech
11%
Financial Services
3%Energy, mining and
utilities
3%Construction
4%
Agriculture
1%
Transportation
3%
Leisure
3%
293 deals
2012–2015
Consumer
17%
Industrials and chemicals
28%
TMT
16%
Business services
13%
Energy, mining and utilities
4%Pharma, medical
and biotech
9%
Financial Services
4%Transportation
4%Leisure
2%
Construction
3%
417 deals
Deep dive: Benelux Spotlight
TMT, the sector attracting the most equity from 2012–2015, when it constituted 29% of all buyout value, has fallen to second place after losing seven percentage points in 2016–2017.
34 Private Equity Trend Report 2018
Fig. 21 Benelux Buyout value, split by industry
2016–2017
Consumer
15%
Pharma, medical and biotech
2%
Financial Services
7%
Industrials and chemicals
13%
Business services
38%
TMT
22%
Leisure
1%
Construction
1%
Energy, mining and utilities
1%
€19.0bn
2012–2015
TMT
29%
Industrials and chemicals
17%
Leisure
1%
Transportation
2%
Real Estate
2%
Consumer
13%Financial Services
14%
Business services
10%
Energy, mining and utilities
2%
Pharma, medical and biotech
8%
Agriculture
2%
€31.2bn
Private Equity Trend Report 2018 35
Key findings
B Key findings
36 Private Equity Trend Report 2018
agree digitising portfolio companies will speed up
realisation of equity stories95%cite operational
improvements for having an increasing
impact on value creation
91%
Key findings
An active year
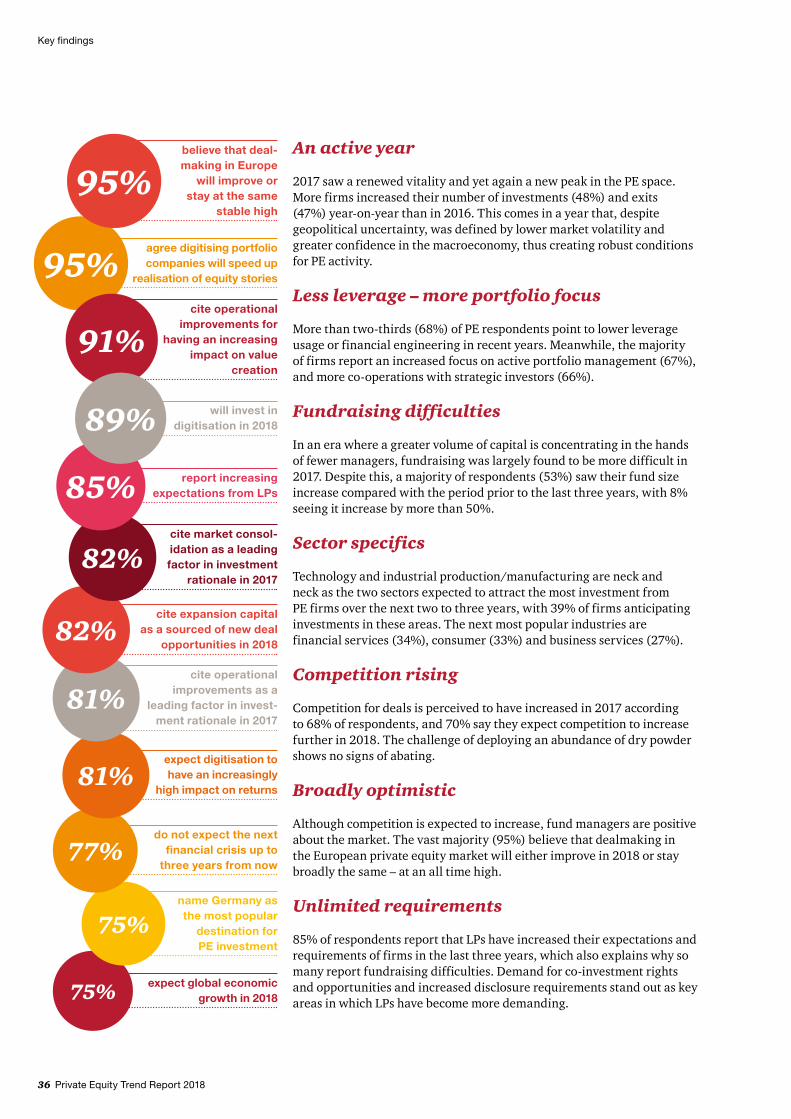
2017 saw a renewed vitality and yet again a new peak in the PE space. More firms increased their number of investments (48%) and exits (47%) year-on-year than in 2016. This comes in a year that, despite geopolitical uncertainty, was defined by lower market volatility and greater confidence in the macroeconomy, thus creating robust conditions for PE activity.
Less leverage – more portfolio focus
More than two-thirds (68%) of PE respondents point to lower leverage usage or financial engineering in recent years. Meanwhile, the majority of firms report an increased focus on active portfolio management (67%), and more co-operations with strategic investors (66%).
Fundraising difficulties
In an era where a greater volume of capital is concentrating in the hands of fewer managers, fundraising was largely found to be more difficult in 2017. Despite this, a majority of respondents (53%) saw their fund size increase compared with the period prior to the last three years, with 8% seeing it increase by more than 50%.
Sector specifics
Technology and industrial production/manufacturing are neck and neck as the two sectors expected to attract the most investment from PE firms over the next two to three years, with 39% of firms anticipating investments in these areas. The next most popular industries are financial services (34%), consumer (33%) and business services (27%).
Competition rising
Competition for deals is perceived to have increased in 2017 according to 68% of respondents, and 70% say they expect competition to increase further in 2018. The challenge of deploying an abundance of dry powder shows no signs of abating.
Broadly optimistic
Although competition is expected to increase, fund managers are positive about the market. The vast majority (95%) believe that dealmaking in the European private equity market will either improve in 2018 or stay broadly the same – at an all time high.
Unlimited requirements
85% of respondents report that LPs have increased their expectations and requirements of firms in the last three years, which also explains why so many report fundraising difficulties. Demand for co-investment rights and opportunities and increased disclosure requirements stand out as key areas in which LPs have become more demanding.
expect global economic growth in 201875%
name Germany as the most popular
destination for PE investment
75%
do not expect the next financial crisis up to
three years from now77%
expect digitisation to have an increasingly
high impact on returns81%
cite operational improvements as a
leading factor in invest - ment rationale in 2017
81%
cite expansion capital as a sourced of new deal
opportunities in 201882%
cite market consol - idation as a leading factor in investment
rationale in 201782%
report increasing expectations from LPs85%
will invest in digitisation in 201889%
believe that deal - making in Europe
will improve or stay at the same
stable high
95%
Private Equity Trend Report 2018 37
Key findings
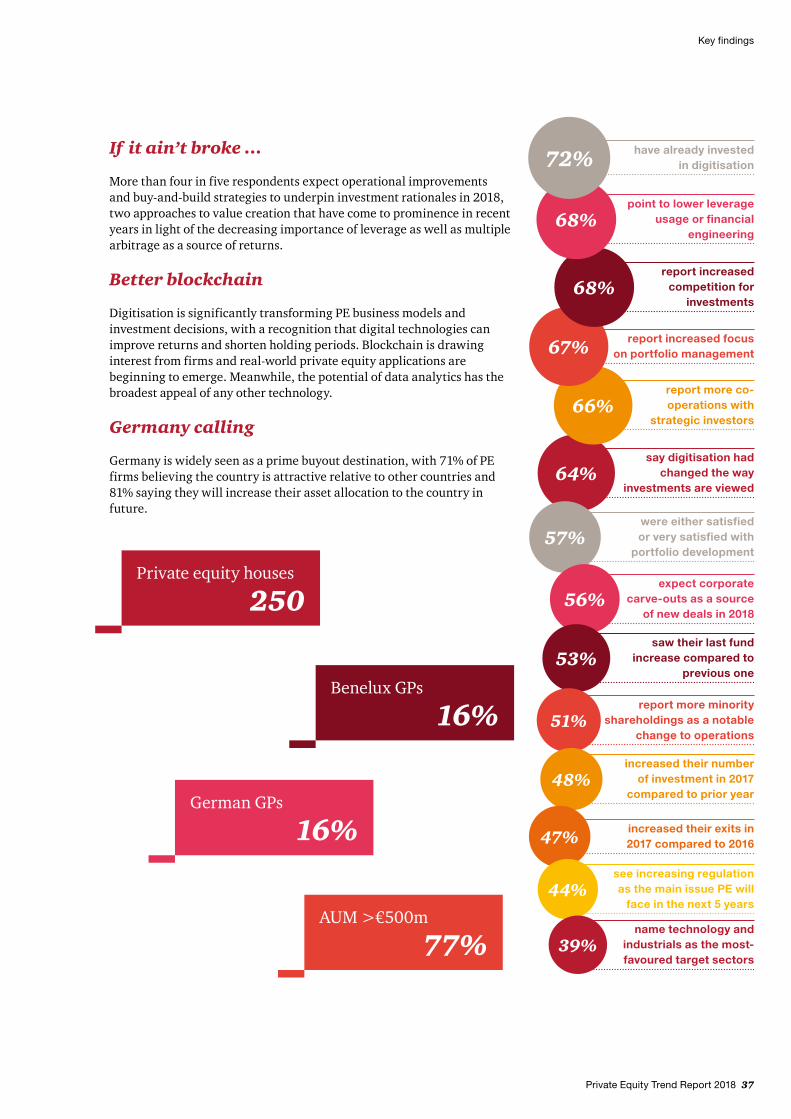
say digitisation had changed the way
investments are viewed
expect corporate carve-outs as a source
of new deals in 2018
saw their last fund increase compared to
previous one
64%
were either satisfied or very satisfied with
portfolio development57%
56%
53%
report more minority shareholdings as a notable
change to operations51%
increased their number of investment in 2017
compared to prior year48%
increased their exits in 2017 compared to 201647%
see increasing regulation as the main issue PE will
face in the next 5 years44%
name technology and industrials as the most-favoured target sectors
39%
report more co-operations with
strategic investors66%
report increased focus on portfolio management 67%
report increased competition for
investments68%
point to lower leverage usage or financial
engineering68%
have already invested in digitisation 72%If it ain’t broke …
More than four in five respondents expect operational improvements and buy-and-build strategies to underpin investment rationales in 2018, two approaches to value creation that have come to prominence in recent years in light of the decreasing importance of leverage as well as multiple arbitrage as a source of returns.
Better blockchain
Digitisation is significantly transforming PE business models and investment decisions, with a recognition that digital technologies can improve returns and shorten holding periods. Blockchain is drawing interest from firms and real-world private equity applications are beginning to emerge. Meanwhile, the potential of data analytics has the broadest appeal of any other technology.
Germany calling
Germany is widely seen as a prime buyout destination, with 71% of PE firms believing the country is attractive relative to other countries and 81% saying they will increase their asset allocation to the country in future.
Private equity houses
250
Benelux GPs
16%
German GPs
16%
AUM >€500m
77%

38 Private Equity Trend Report 2018
Detailed Findings
C Detailed Findings
Private Equity Trend Report 2018 39
Detailed Findings
1 2017 in review: PE comes out fightingAfter a tumultuous 2016, European private equity firms took advantage of a stable global economy and started putting their surfeit of dry powder to work.
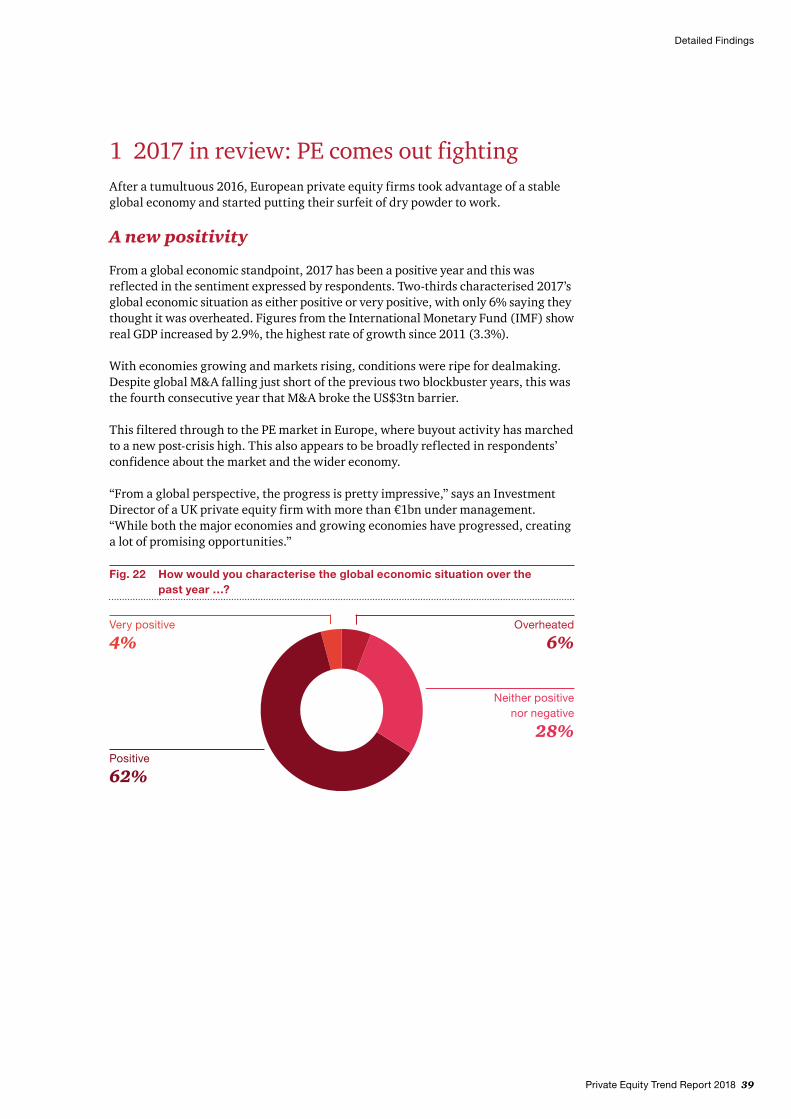
A new positivity
From a global economic standpoint, 2017 has been a positive year and this was reflected in the sentiment expressed by respondents. Two-thirds characterised 2017’s global economic situation as either positive or very positive, with only 6% saying they thought it was overheated. Figures from the International Monetary Fund (IMF) show real GDP increased by 2.9%, the highest rate of growth since 2011 (3.3%).
With economies growing and markets rising, conditions were ripe for dealmaking. Despite global M&A falling just short of the previous two blockbuster years, this was the fourth consecutive year that M&A broke the US$3tn barrier.
This filtered through to the PE market in Europe, where buyout activity has marched to a new post-crisis high. This also appears to be broadly reflected in respondents’ confidence about the market and the wider economy.
“From a global perspective, the progress is pretty impressive,” says an Investment Director of a UK private equity firm with more than €1bn under management. “While both the major economies and growing economies have progressed, creating a lot of promising opportunities.”
Fig. 22 How would you characterise the global economic situation over the past year …?
Positive
62%
Very positive
4%
Neither positive nor negative
28%
Overheated
6%
40 Private Equity Trend Report 2018
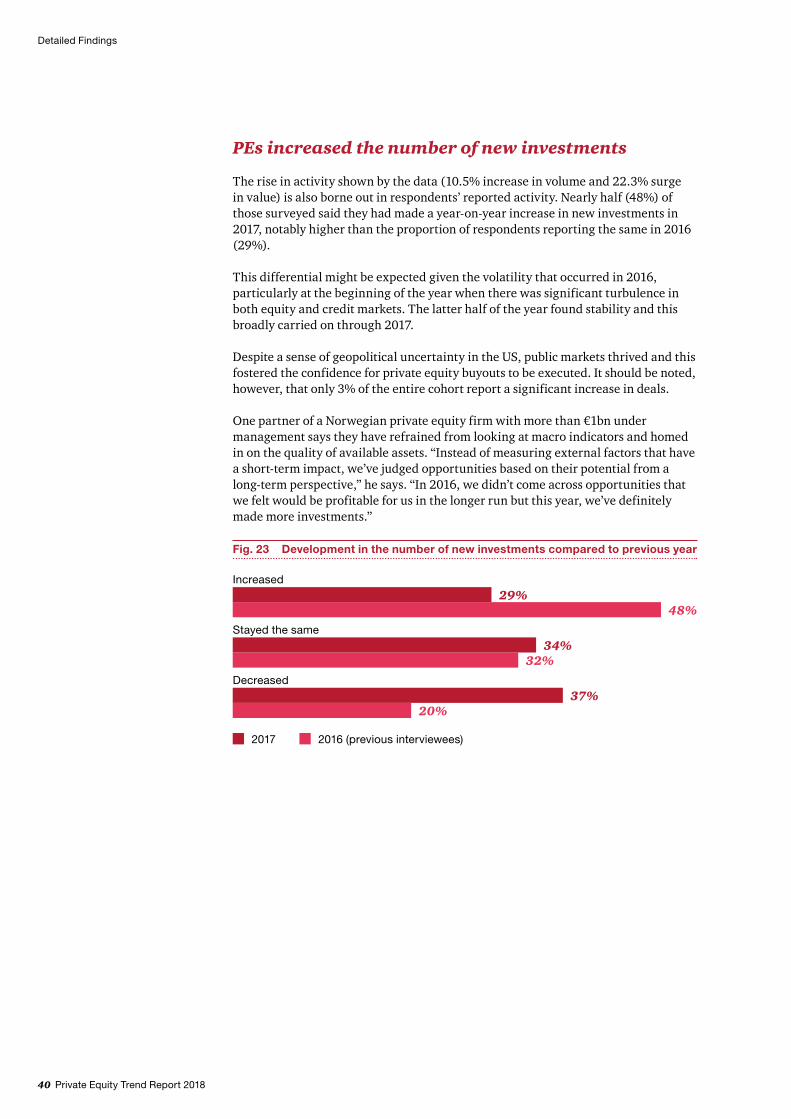
Fig. 23 Development in the number of new investments compared to previous year
2016 (previous interviewees)2017
Increased29%
48%Stayed the same
34%32%
Decreased37%
20%
Detailed Findings
PEs increased the number of new investments
The rise in activity shown by the data (10.5% increase in volume and 22.3% surge in value) is also borne out in respondents’ reported activity. Nearly half (48%) of those surveyed said they had made a year-on-year increase in new investments in 2017, notably higher than the proportion of respondents reporting the same in 2016 (29%).
This differential might be expected given the volatility that occurred in 2016, particularly at the beginning of the year when there was significant turbulence in both equity and credit markets. The latter half of the year found stability and this broadly carried on through 2017.
Despite a sense of geopolitical uncertainty in the US, public markets thrived and this fostered the confidence for private equity buyouts to be executed. It should be noted, however, that only 3% of the entire cohort report a significant increase in deals.
One partner of a Norwegian private equity firm with more than €1bn under management says they have refrained from looking at macro indicators and homed in on the quality of available assets. “Instead of measuring external factors that have a short-term impact, we’ve judged opportunities based on their potential from a long-term perspective,” he says. “In 2016, we didn’t come across opportunities that we felt would be profitable for us in the longer run but this year, we’ve definitely made more investments.”
Private Equity Trend Report 2018 41
Detailed Findings
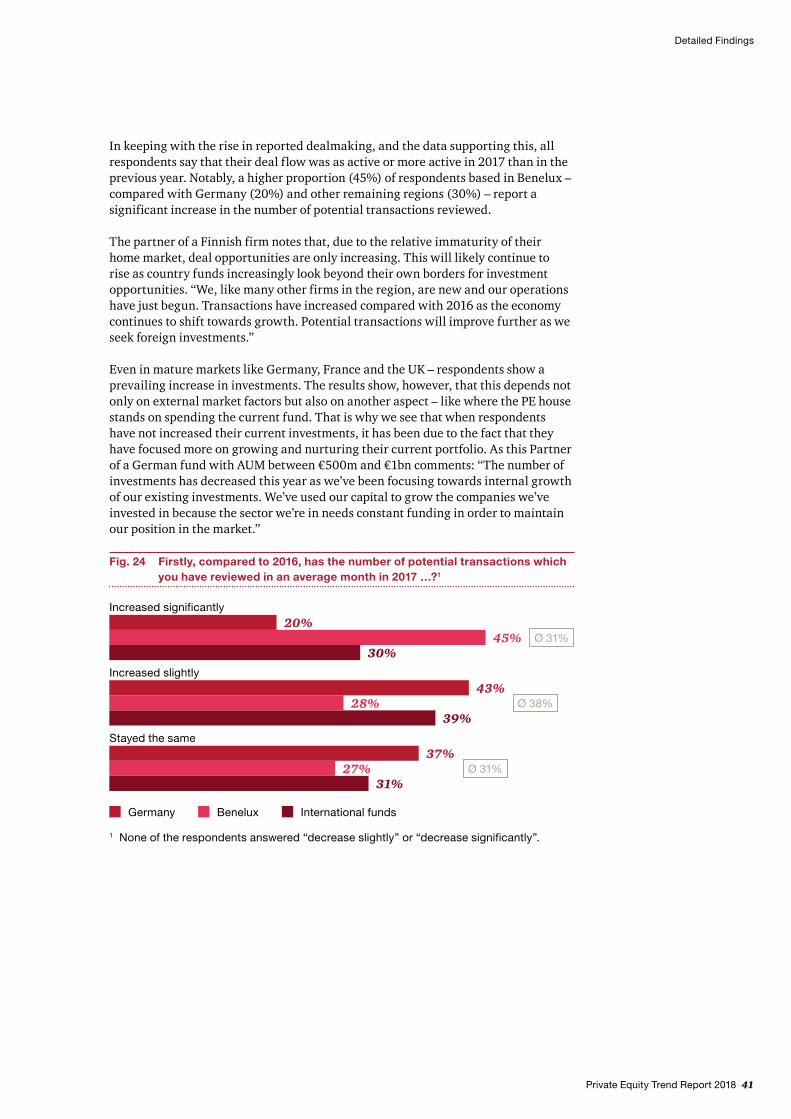
In keeping with the rise in reported dealmaking, and the data supporting this, all respondents say that their deal flow was as active or more active in 2017 than in the previous year. Notably, a higher proportion (45%) of respondents based in Benelux – compared with Germany (20%) and other remaining regions (30%) – report a significant increase in the number of potential transactions reviewed.
The partner of a Finnish firm notes that, due to the relative immaturity of their home market, deal opportunities are only increasing. This will likely continue to rise as country funds increasingly look beyond their own borders for investment opportunities. “We, like many other firms in the region, are new and our operations have just begun. Transactions have increased compared with 2016 as the economy continues to shift towards growth. Potential transactions will improve further as we seek foreign investments.”
Even in mature markets like Germany, France and the UK – respondents show a prevailing increase in investments. The results show, however, that this depends not only on external market factors but also on another aspect – like where the PE house stands on spending the current fund. That is why we see that when respondents have not increased their current investments, it has been due to the fact that they have focused more on growing and nurturing their current portfolio. As this Partner of a German fund with AUM between €500m and €1bn comments: “The number of investments has decreased this year as we’ve been focusing towards internal growth of our existing investments. We’ve used our capital to grow the companies we’ve invested in because the sector we’re in needs constant funding in order to maintain our position in the market.”
Fig. 24 Firstly, compared to 2016, has the number of potential transactions which you have reviewed in an average month in 2017 …?1
Increased significantly20%
45%30%
Increased slightly43%
28%39%
Stayed the same37%
27%31%
Ø 31%
Ø 38%
Ø 31%
International fundsGermany Benelux
1 None of the respondents answered “decrease slightly” or “decrease significantly”.
42 Private Equity Trend Report 2018
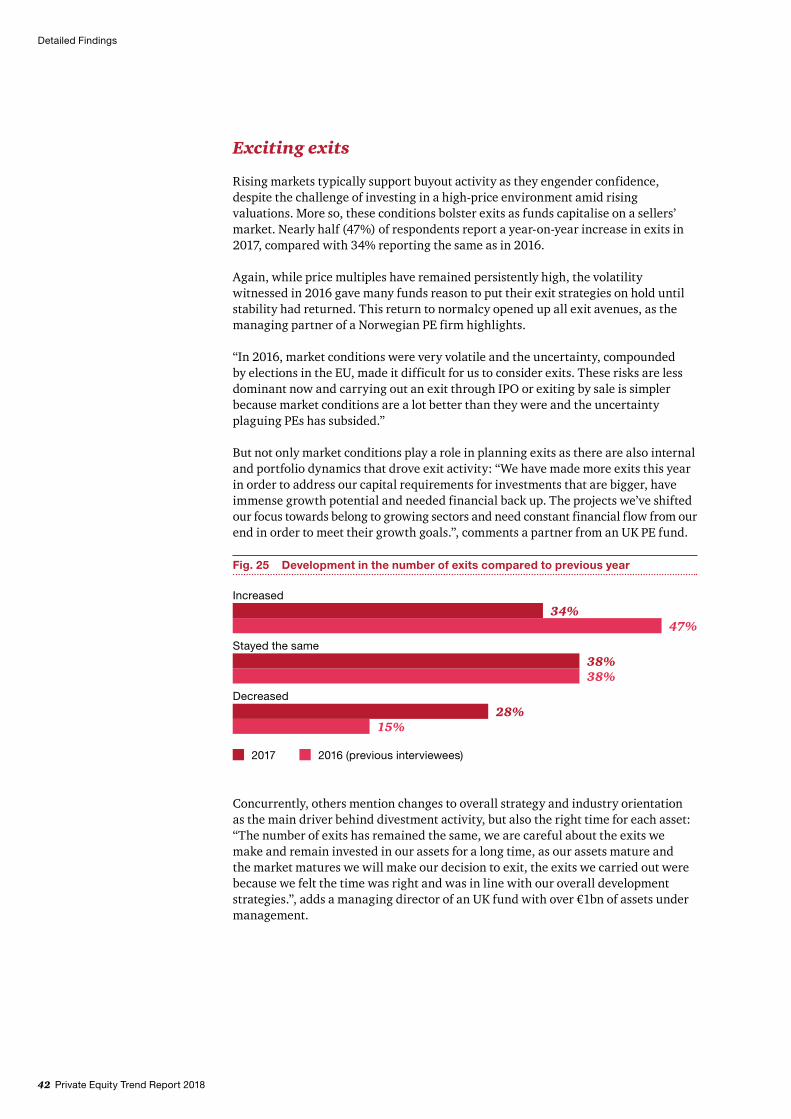
Exciting exits
Rising markets typically support buyout activity as they engender confidence, despite the challenge of investing in a high-price environment amid rising valuations. More so, these conditions bolster exits as funds capitalise on a sellers’ market. Nearly half (47%) of respondents report a year-on-year increase in exits in 2017, compared with 34% reporting the same as in 2016.
Again, while price multiples have remained persistently high, the volatility witnessed in 2016 gave many funds reason to put their exit strategies on hold until stability had returned. This return to normalcy opened up all exit avenues, as the managing partner of a Norwegian PE firm highlights.
“In 2016, market conditions were very volatile and the uncertainty, compounded by elections in the EU, made it difficult for us to consider exits. These risks are less dominant now and carrying out an exit through IPO or exiting by sale is simpler because market conditions are a lot better than they were and the uncertainty plaguing PEs has subsided.”
But not only market conditions play a role in planning exits as there are also internal and portfolio dynamics that drove exit activity: “We have made more exits this year in order to address our capital requirements for investments that are bigger, have immense growth potential and needed financial back up. The projects we’ve shifted our focus towards belong to growing sectors and need constant financial flow from our end in order to meet their growth goals.”, comments a partner from an UK PE fund.
Detailed Findings
Concurrently, others mention changes to overall strategy and industry orientation as the main driver behind divestment activity, but also the right time for each asset: “The number of exits has remained the same, we are careful about the exits we make and remain invested in our assets for a long time, as our assets mature and the market matures we will make our decision to exit, the exits we carried out were because we felt the time was right and was in line with our overall development strategies.”, adds a managing director of an UK fund with over €1bn of assets under management.
Fig. 25 Development in the number of exits compared to previous year
2016 (previous interviewees)2017
Increased34%
47%Stayed the same
38%38%
Decreased28%
15%
Private Equity Trend Report 2018 43
Detailed Findings
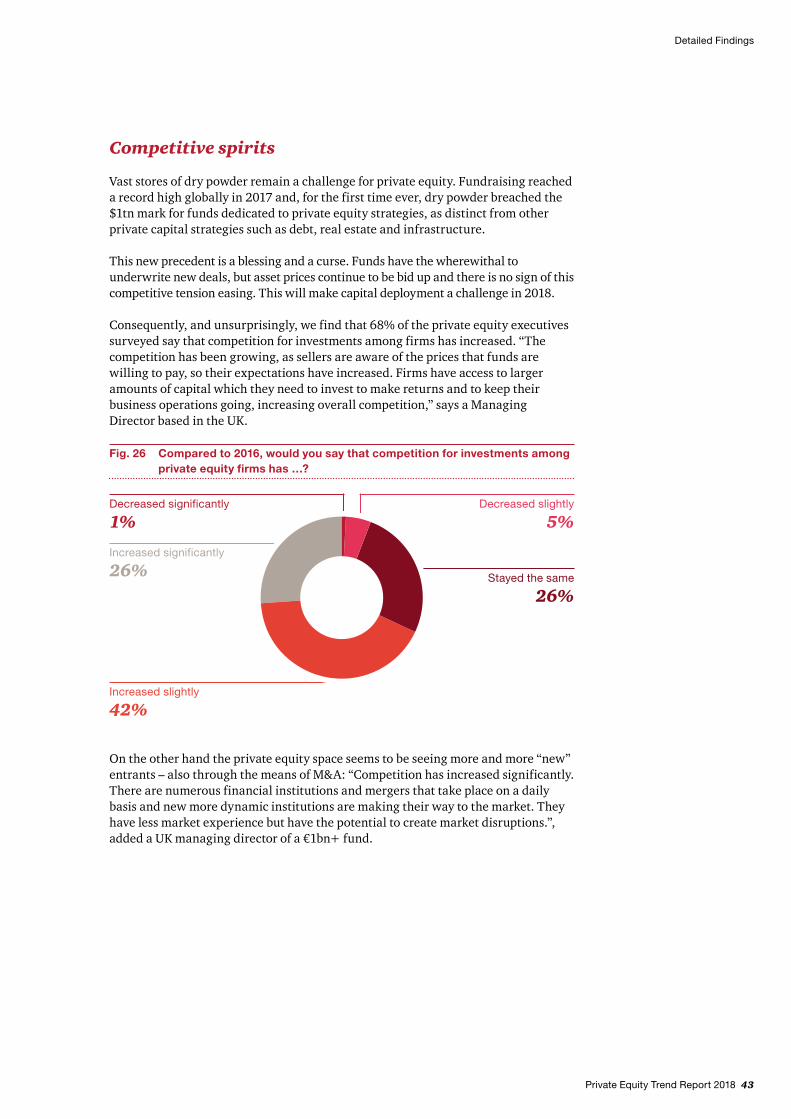
Competitive spirits
Vast stores of dry powder remain a challenge for private equity. Fundraising reached a record high globally in 2017 and, for the first time ever, dry powder breached the $1tn mark for funds dedicated to private equity strategies, as distinct from other private capital strategies such as debt, real estate and infrastructure.
This new precedent is a blessing and a curse. Funds have the wherewithal to underwrite new deals, but asset prices continue to be bid up and there is no sign of this competitive tension easing. This will make capital deployment a challenge in 2018.
Consequently, and unsurprisingly, we find that 68% of the private equity executives surveyed say that competition for investments among firms has increased. “The competition has been growing, as sellers are aware of the prices that funds are willing to pay, so their expectations have increased. Firms have access to larger amounts of capital which they need to invest to make returns and to keep their business operations going, increasing overall competition,” says a Managing Director based in the UK.
On the other hand the private equity space seems to be seeing more and more “new” entrants – also through the means of M&A: “Competition has increased significantly. There are numerous financial institutions and mergers that take place on a daily basis and new more dynamic institutions are making their way to the market. They have less market experience but have the potential to create market disruptions.”, added a UK managing director of a €1bn+ fund.
Fig. 26 Compared to 2016, would you say that competition for investments among private equity firms has …?
Increased slightly
42%
Increased significantly
26%
Decreased significantly
1%
Stayed the same
26%
Decreased slightly
5%
44 Private Equity Trend Report 2018
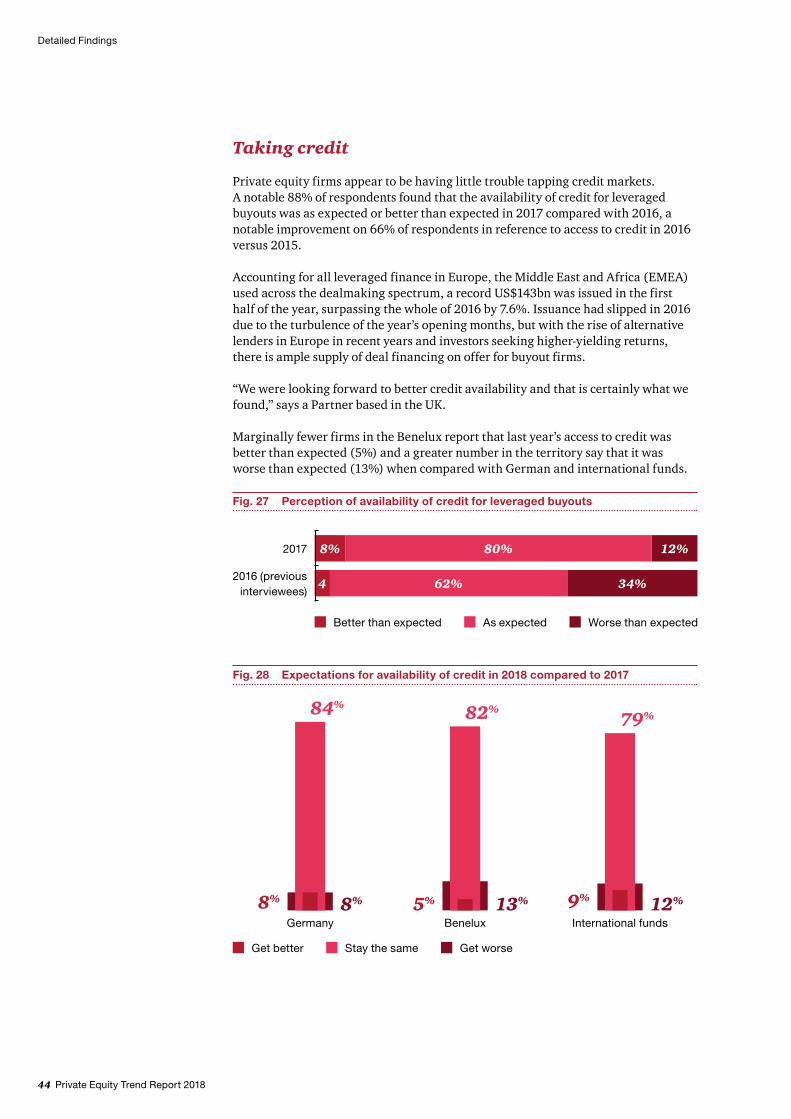
Taking credit
Private equity firms appear to be having little trouble tapping credit markets. A notable 88% of respondents found that the availability of credit for leveraged buyouts was as expected or better than expected in 2017 compared with 2016, a notable improvement on 66% of respondents in reference to access to credit in 2016 versus 2015.
Accounting for all leveraged finance in Europe, the Middle East and Africa (EMEA) used across the dealmaking spectrum, a record US$143bn was issued in the first half of the year, surpassing the whole of 2016 by 7.6%. Issuance had slipped in 2016 due to the turbulence of the year’s opening months, but with the rise of alternative lenders in Europe in recent years and investors seeking higher-yielding returns, there is ample supply of deal financing on offer for buyout firms.
“We were looking forward to better credit availability and that is certainly what we found,” says a Partner based in the UK.
Marginally fewer firms in the Benelux report that last year’s access to credit was better than expected (5%) and a greater number in the territory say that it was worse than expected (13%) when compared with German and international funds.
Detailed Findings
Fig. 27 Perception of availability of credit for leveraged buyouts
Worse than expectedAs expectedBetter than expected
2016 (previous interviewees)
62% 34%4
2017 8% 80% 12%
Fig. 28 Expectations for availability of credit in 2018 compared to 2017
Get worseStay the sameGet better
Germany Benelux International funds8% 13% 12%
84% 82%79%
8% 5% 9%
Private Equity Trend Report 2018 45
Detailed Findings
Rationalise the ratio
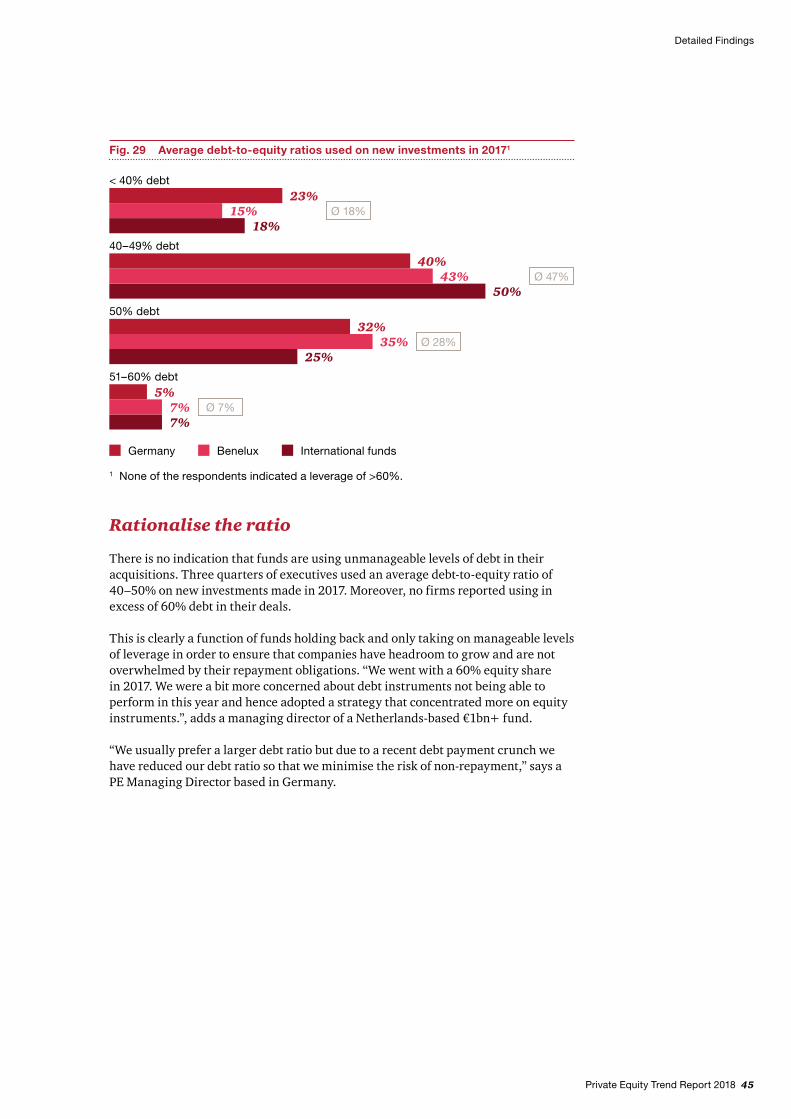
There is no indication that funds are using unmanageable levels of debt in their acquisitions. Three quarters of executives used an average debt-to-equity ratio of 40–50% on new investments made in 2017. Moreover, no firms reported using in excess of 60% debt in their deals.
This is clearly a function of funds holding back and only taking on manageable levels of leverage in order to ensure that companies have headroom to grow and are not overwhelmed by their repayment obligations. “We went with a 60% equity share in 2017. We were a bit more concerned about debt instruments not being able to perform in this year and hence adopted a strategy that concentrated more on equity instruments.”, adds a managing director of a Netherlands-based €1bn+ fund.
“We usually prefer a larger debt ratio but due to a recent debt payment crunch we have reduced our debt ratio so that we minimise the risk of non-repayment,” says a PE Managing Director based in Germany.
Fig. 29 Average debt-to-equity ratios used on new investments in 20171
International fundsGermany Benelux
< 40% debt
40–49% debt
50% debt
23%15%
18%
40%43%
50%
35%32%
25%51–60% debt
5%7%7%
Ø 18%
Ø 47%
Ø 28%
Ø 7%
1 None of the respondents indicated a leverage of >60%.
46 Private Equity Trend Report 2018
Detailed Findings
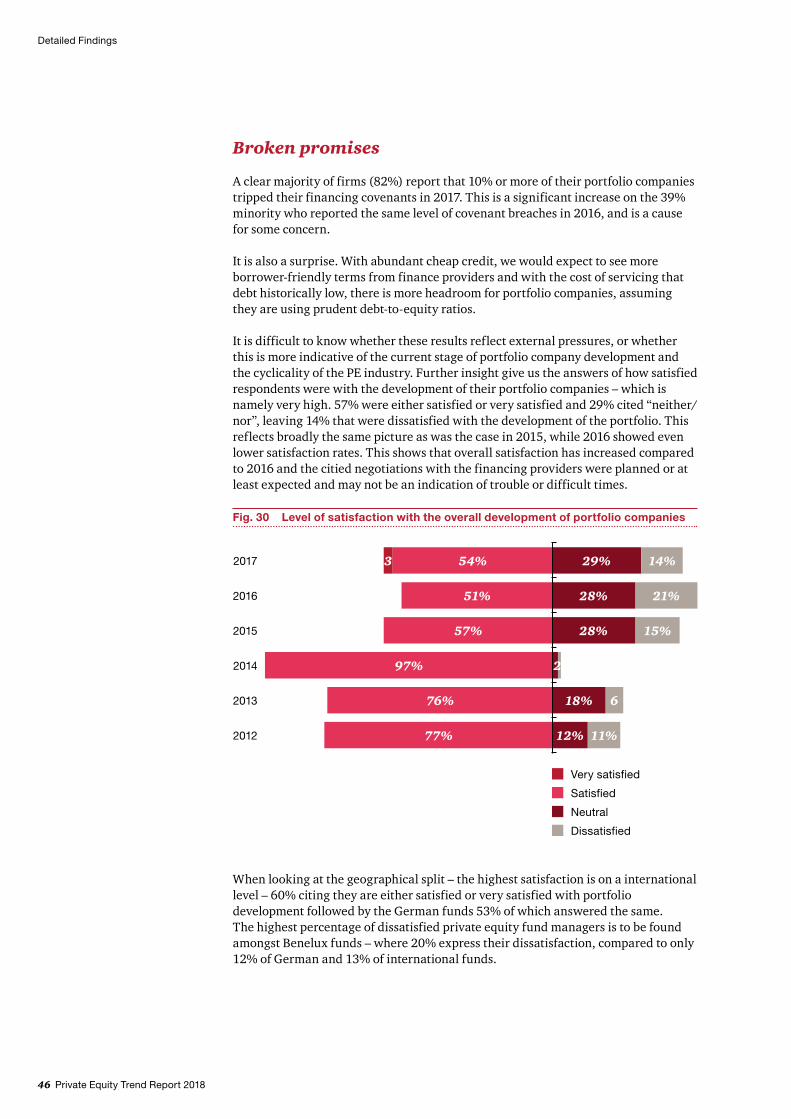
Broken promises
A clear majority of firms (82%) report that 10% or more of their portfolio companies tripped their financing covenants in 2017. This is a significant increase on the 39% minority who reported the same level of covenant breaches in 2016, and is a cause for some concern.
It is also a surprise. With abundant cheap credit, we would expect to see more borrower-friendly terms from finance providers and with the cost of servicing that debt historically low, there is more headroom for portfolio companies, assuming they are using prudent debt-to-equity ratios.
It is difficult to know whether these results reflect external pressures, or whether this is more indicative of the current stage of portfolio company development and the cyclicality of the PE industry. Further insight give us the answers of how satisfied respondents were with the development of their portfolio companies – which is namely very high. 57% were either satisfied or very satisfied and 29% cited “neither/nor”, leaving 14% that were dissatisfied with the development of the portfolio. This reflects broadly the same picture as was the case in 2015, while 2016 showed even lower satisfaction rates. This shows that overall satisfaction has increased compared to 2016 and the citied negotiations with the financing providers were planned or at least expected and may not be an indication of trouble or difficult times.
Fig. 30 Level of satisfaction with the overall development of portfolio companies
Satisfied
Neutral
Dissatisfied
Very satisfied
2014 97% 2
2015 57% 28% 15%
2016
2017
51% 28% 21%
54% 29% 14%3
2013 76% 18% 6
2012 77% 12% 11%
When looking at the geographical split – the highest satisfaction is on a international level – 60% citing they are either satisfied or very satisfied with portfolio development followed by the German funds 53% of which answered the same. The highest percentage of dissatisfied private equity fund managers is to be found amongst Benelux funds – where 20% express their dissatisfaction, compared to only 12% of German and 13% of international funds.
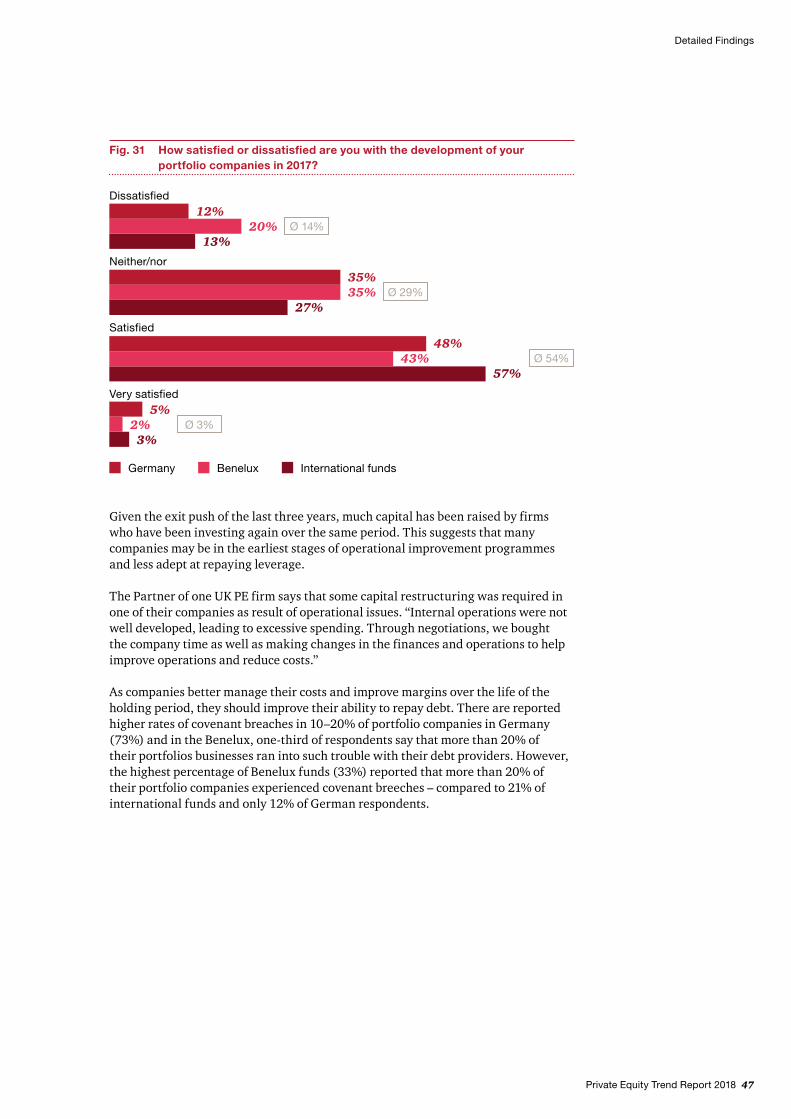
Private Equity Trend Report 2018 47
Detailed Findings
Given the exit push of the last three years, much capital has been raised by firms who have been investing again over the same period. This suggests that many companies may be in the earliest stages of operational improvement programmes and less adept at repaying leverage.
The Partner of one UK PE firm says that some capital restructuring was required in one of their companies as result of operational issues. “Internal operations were not well developed, leading to excessive spending. Through negotiations, we bought the company time as well as making changes in the finances and operations to help improve operations and reduce costs.”
As companies better manage their costs and improve margins over the life of the holding period, they should improve their ability to repay debt. There are reported higher rates of covenant breaches in 10–20% of portfolio companies in Germany (73%) and in the Benelux, one-third of respondents say that more than 20% of their portfolios businesses ran into such trouble with their debt providers. However, the highest percentage of Benelux funds (33%) reported that more than 20% of their portfolio companies experienced covenant breeches – compared to 21% of international funds and only 12% of German respondents.
Fig. 31 How satisfied or dissatisfied are you with the development of your portfolio companies in 2017?
International fundsGermany Benelux
Dissatisfied12%
20%13%
Neither/nor
35%35%
27%Satisfied
43%48%
57%
Very satisfied
2%5%
3%
Ø 14%
Ø 29%
Ø 54%
Ø 3%
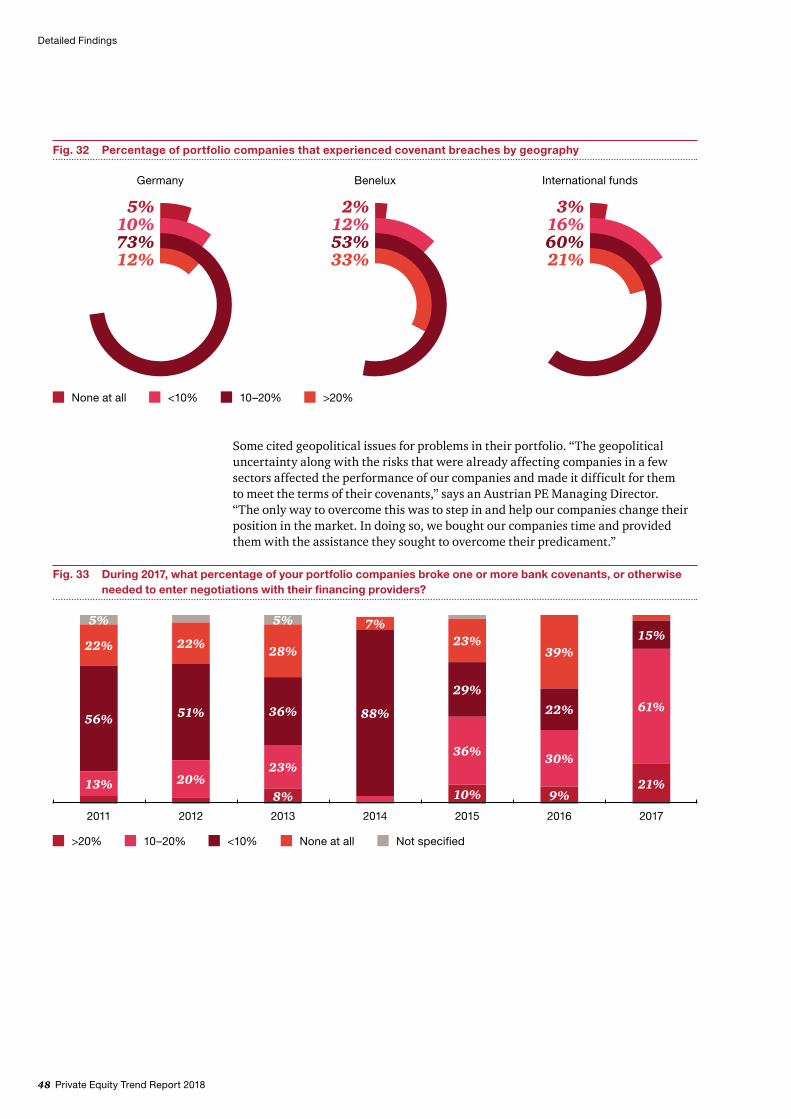
48 Private Equity Trend Report 2018
Detailed Findings
Some cited geopolitical issues for problems in their portfolio. “The geopolitical uncertainty along with the risks that were already affecting companies in a few sectors affected the performance of our companies and made it difficult for them to meet the terms of their covenants,” says an Austrian PE Managing Director. “The only way to overcome this was to step in and help our companies change their position in the market. In doing so, we bought our companies time and provided them with the assistance they sought to overcome their predicament.”
Fig. 33 During 2017, what percentage of your portfolio companies broke one or more bank covenants, or otherwise needed to enter negotiations with their financing providers?
>20% <10%10–20% None at all Not specified
20142011 20152012 20162013 2017
7%
88%
5%
22%
56%
13%
23%
36%
29%
10%
51%
22%
20%
39%
22%
30%
9%
5%
28%
36%
23%
8%
15%
61%
21%
Germany Benelux International funds
10%5%
12%73%
12%2%
33%53%
16%3%
21%60%
None at all <10% 10–20% >20%
Fig. 32 Percentage of portfolio companies that experienced covenant breaches by geography
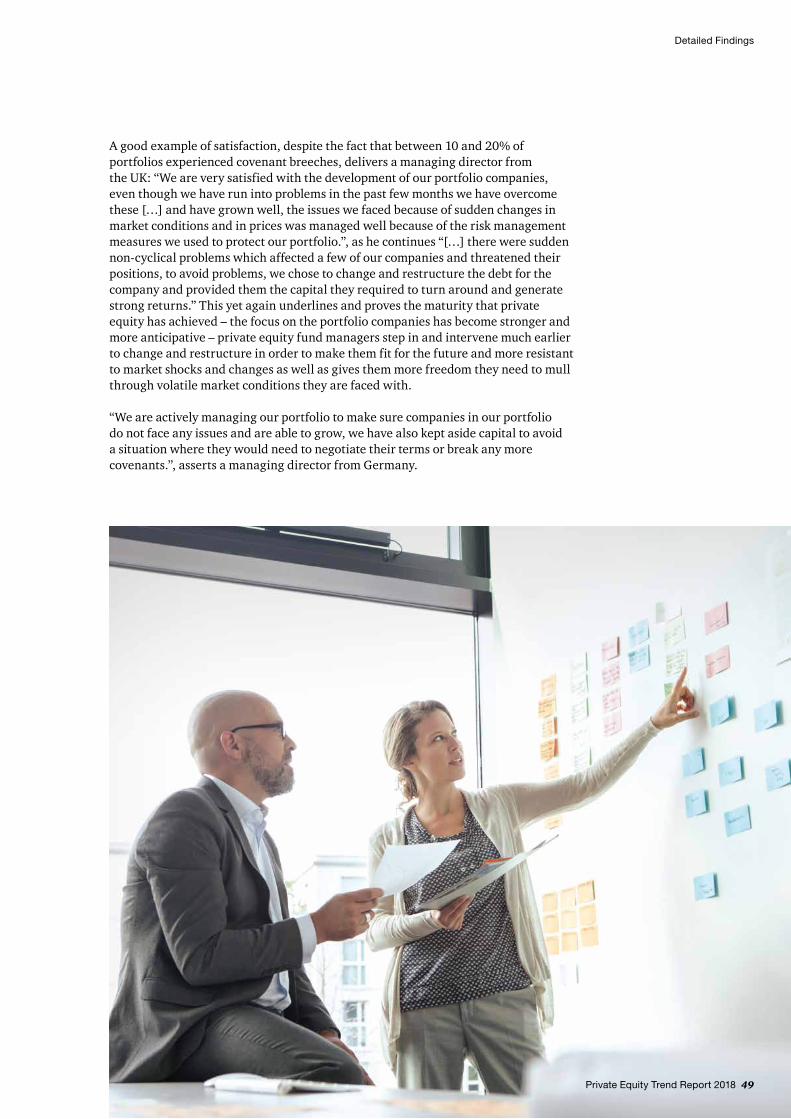
Detailed Findings
A good example of satisfaction, despite the fact that between 10 and 20% of portfolios experienced covenant breeches, delivers a managing director from the UK: “We are very satisfied with the development of our portfolio companies, even though we have run into problems in the past few months we have overcome these […] and have grown well, the issues we faced because of sudden changes in market conditions and in prices was managed well because of the risk management measures we used to protect our portfolio.”, as he continues “[…] there were sudden non-cyclical problems which affected a few of our companies and threatened their positions, to avoid problems, we chose to change and restructure the debt for the company and provided them the capital they required to turn around and generate strong returns.” This yet again underlines and proves the maturity that private equity has achieved – the focus on the portfolio companies has become stronger and more anticipative – private equity fund managers step in and intervene much earlier to change and restructure in order to make them fit for the future and more resistant to market shocks and changes as well as gives them more freedom they need to mull through volatile market conditions they are faced with.
“We are actively managing our portfolio to make sure companies in our portfolio do not face any issues and are able to grow, we have also kept aside capital to avoid a situation where they would need to negotiate their terms or break any more covenants.”, asserts a managing director from Germany.
Private Equity Trend Report 2018 49
50 Private Equity Trend Report 2018
Detailed Findings
Market consolidation focus in response to competition
The majority of firms say that market consolidation (82%) was the motivating factor for their investment decisions in 2017, with this standing out as being the overall most important factor among 40% of respondents.
The rationale for such strategies is clear: smaller assets tend to be valued at lower EBITDA multiples and today’s high-price environment means that private equity firms can achieve significant returns by consolidating and creating market leaders.
These larger, more competitive assets will ultimately sell at a higher multiple of their earnings. The partner of a French firm who cites consolidation as a motivator says that prior acquisitions made by companies are a source of deal flow for their portfolio companies. “Acquisitions are going to be influenced by industry consolidation. And there will be lot of non-core divestment from strategic corporates. Companies will try to gather as many of their competitors as they can and concentrate their business to achieve better and longer stability.”
On the other hand a German managing partner makes the case for pursuing a buy-and-build strategy: “We prefer to buy and build. It is necessary for us to keep growing from strength to strength as competition is continuously increasing and the market is shrinking with number of opportunities available as most of them are being taken by bigger organizations. As we get opportunities to purchase we will buy and then grow those assets so that we are well placed in the market.” This is also evident in the market numbers – especially in the German market the number of add-ons to current portfolios has increased substantially as a percentage of total dealmaking and we expect it to further increase. Add-ons play an important role in buy-and-build as well as market consolidation strategies. In some sectors where the market is very fragmented – private equity fund managers will be very busy signing and closing a high number of small to mid-cap deals, while one step at a time creating a market leader.
However, it is worth noting that operational improvements continue to be a major driver behind investment rationales (81%) as well. In the two previous years, this was cited as the single most important factor in investment decisions and will undoubtedly continue to be a major part of PE’s modus operandi.
“Cost synergies will be an important factor influencing our portfolios. We want to get more accurate with our costs and operating expenses so that we have more control over our expenditure and give a bigger chance of revenue generation.”, says a CEO based in France.
Financial engineering is off the table for the large majority of PE houses, however, mostly so in Benelux and Germany. International funds on the other hand still seem to focus on the lever – with almost 60% citing it as a factor in influencing investment rational of acquisitions in 2017.
Others are already steps ahead and grasping the changing dynamics of the world. “We are looking at acquisitions that will help us boost our active investments in the tech sector, based on that the main factor would be digitalization for us. The impact that digitalization has had on industries is massive and has been a game changer.”, points out a managing director based in the UK. A Luxembourg partner sees a way to use digitisation also for the operational agenda: “We want to improve operation efficiencies within our portfolio and are looking for new technologies which will bring about better performance and at the same time will help us reduce internal costs.”
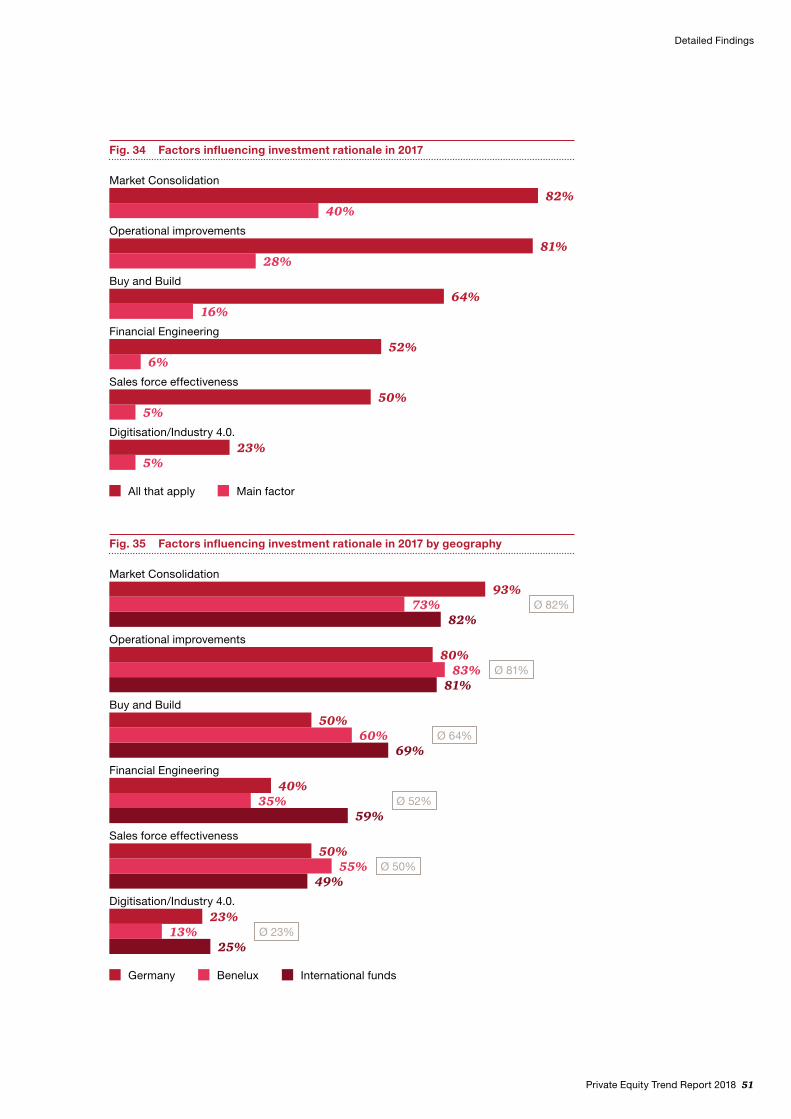
Private Equity Trend Report 2018 51
Detailed Findings
Fig. 34 Factors influencing investment rationale in 2017
All that apply Main factor
Market Consolidation82%
40%
Financial Engineering52%
6%
Operational improvements81%
28%
Sales force effectiveness50%
5%
Buy and Build
16%64%
Digitisation/Industry 4.0.
5%23%
Fig. 35 Factors influencing investment rationale in 2017 by geography
International fundsGermany Benelux
Market Consolidation
Operational improvements
Buy and Build
93%73%
82%
80%83%
81%
60%50%
69%Financial Engineering
Sales force effectiveness
Digitisation/Industry 4.0.
40%35%
59%
50%55%
49%
13%23%
25%
Ø 82%
Ø 81%
Ø 64%
Ø 52%
Ø 50%
Ø 23%
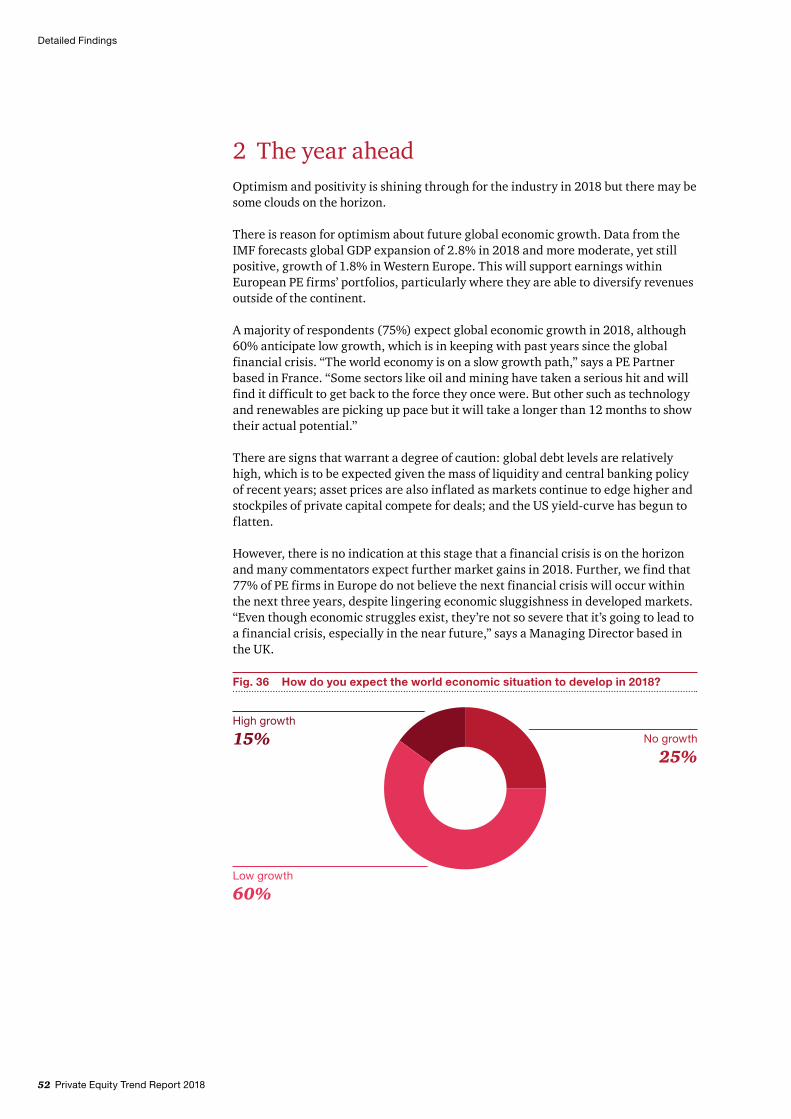
52 Private Equity Trend Report 2018
Detailed Findings
2 The year aheadOptimism and positivity is shining through for the industry in 2018 but there may be some clouds on the horizon.
There is reason for optimism about future global economic growth. Data from the IMF forecasts global GDP expansion of 2.8% in 2018 and more moderate, yet still positive, growth of 1.8% in Western Europe. This will support earnings within European PE firms’ portfolios, particularly where they are able to diversify revenues outside of the continent.
A majority of respondents (75%) expect global economic growth in 2018, although 60% anticipate low growth, which is in keeping with past years since the global financial crisis. “The world economy is on a slow growth path,” says a PE Partner based in France. “Some sectors like oil and mining have taken a serious hit and will find it difficult to get back to the force they once were. But other such as technology and renewables are picking up pace but it will take a longer than 12 months to show their actual potential.”
There are signs that warrant a degree of caution: global debt levels are relatively high, which is to be expected given the mass of liquidity and central banking policy of recent years; asset prices are also inflated as markets continue to edge higher and stockpiles of private capital compete for deals; and the US yield-curve has begun to flatten.
However, there is no indication at this stage that a financial crisis is on the horizon and many commentators expect further market gains in 2018. Further, we find that 77% of PE firms in Europe do not believe the next financial crisis will occur within the next three years, despite lingering economic sluggishness in developed markets. “Even though economic struggles exist, they’re not so severe that it’s going to lead to a financial crisis, especially in the near future,” says a Managing Director based in the UK.
Fig. 36 How do you expect the world economic situation to develop in 2018?
Low growth
60%
High growth
15% No growth
25%
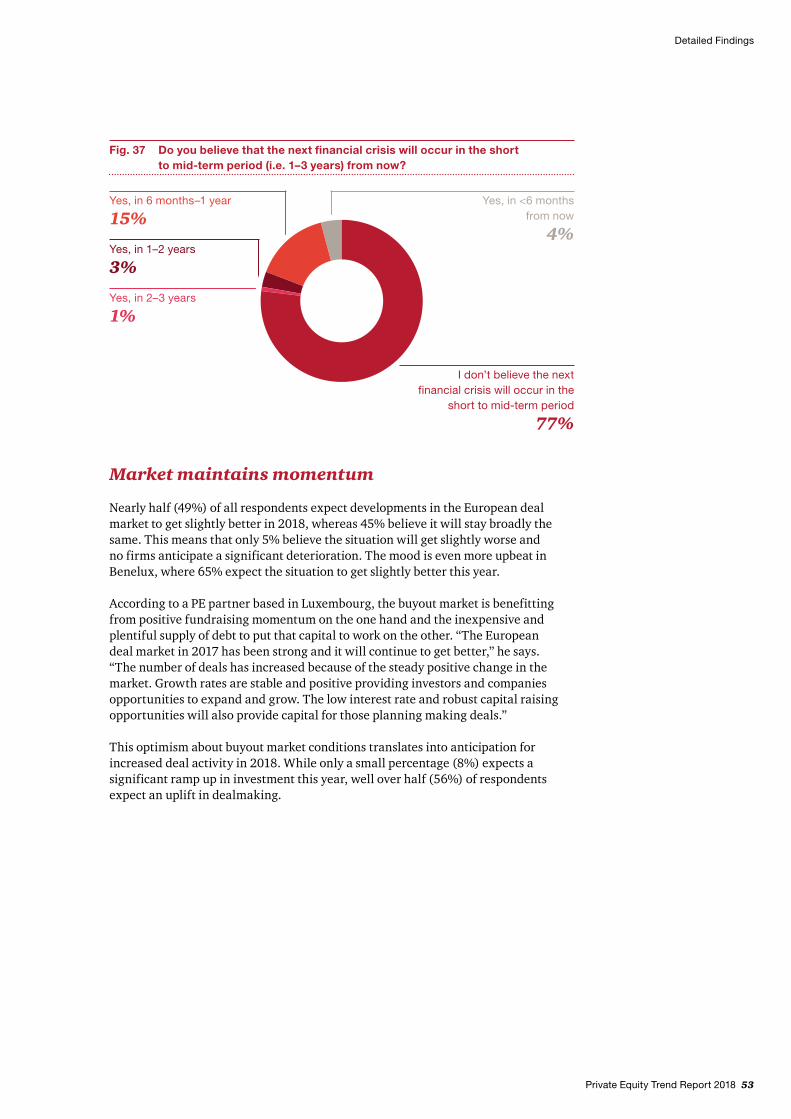
Private Equity Trend Report 2018 53
Detailed Findings
Market maintains momentum
Nearly half (49%) of all respondents expect developments in the European deal market to get slightly better in 2018, whereas 45% believe it will stay broadly the same. This means that only 5% believe the situation will get slightly worse and no firms anticipate a significant deterioration. The mood is even more upbeat in Benelux, where 65% expect the situation to get slightly better this year.
According to a PE partner based in Luxembourg, the buyout market is benefitting from positive fundraising momentum on the one hand and the inexpensive and plentiful supply of debt to put that capital to work on the other. “The European deal market in 2017 has been strong and it will continue to get better,” he says. “The number of deals has increased because of the steady positive change in the market. Growth rates are stable and positive providing investors and companies opportunities to expand and grow. The low interest rate and robust capital raising opportunities will also provide capital for those planning making deals.”
This optimism about buyout market conditions translates into anticipation for increased deal activity in 2018. While only a small percentage (8%) expects a significant ramp up in investment this year, well over half (56%) of respondents expect an uplift in dealmaking.
Fig. 37 Do you believe that the next financial crisis will occur in the short to mid-term period (i.e. 1–3 years) from now?
Yes, in 2–3 years
1%
Yes, in 1–2 years
3%
Yes, in 6 months–1 year
15%
I don’t believe the next financial crisis will occur in the
short to mid-term period
77%
Yes, in <6 months from now
4%
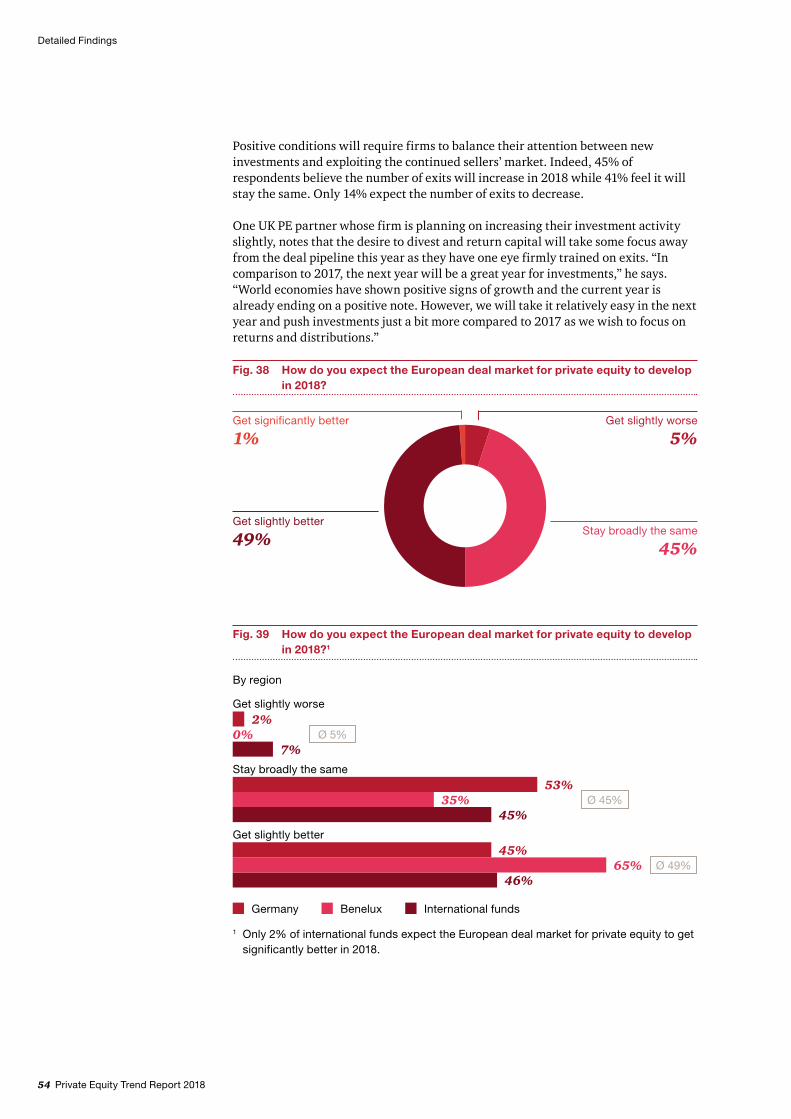
54 Private Equity Trend Report 2018
Positive conditions will require firms to balance their attention between new investments and exploiting the continued sellers’ market. Indeed, 45% of respondents believe the number of exits will increase in 2018 while 41% feel it will stay the same. Only 14% expect the number of exits to decrease.
One UK PE partner whose firm is planning on increasing their investment activity slightly, notes that the desire to divest and return capital will take some focus away from the deal pipeline this year as they have one eye firmly trained on exits. “In comparison to 2017, the next year will be a great year for investments,” he says. “World economies have shown positive signs of growth and the current year is already ending on a positive note. However, we will take it relatively easy in the next year and push investments just a bit more compared to 2017 as we wish to focus on returns and distributions.”
Detailed Findings
Fig. 38 How do you expect the European deal market for private equity to develop in 2018?
Get slightly better
49%
Get significantly better
1%
Stay broadly the same
45%
Get slightly worse
5%
Fig. 39 How do you expect the European deal market for private equity to develop in 2018?1
By region
International fundsGermany Benelux
2%0%
7%
Get slightly worse
Stay broadly the same53%
35%45%
Get slightly better45%
65%46%
Ø 5%
Ø 45%
Ø 49%
1 Only 2% of international funds expect the European deal market for private equity to get significantly better in 2018.
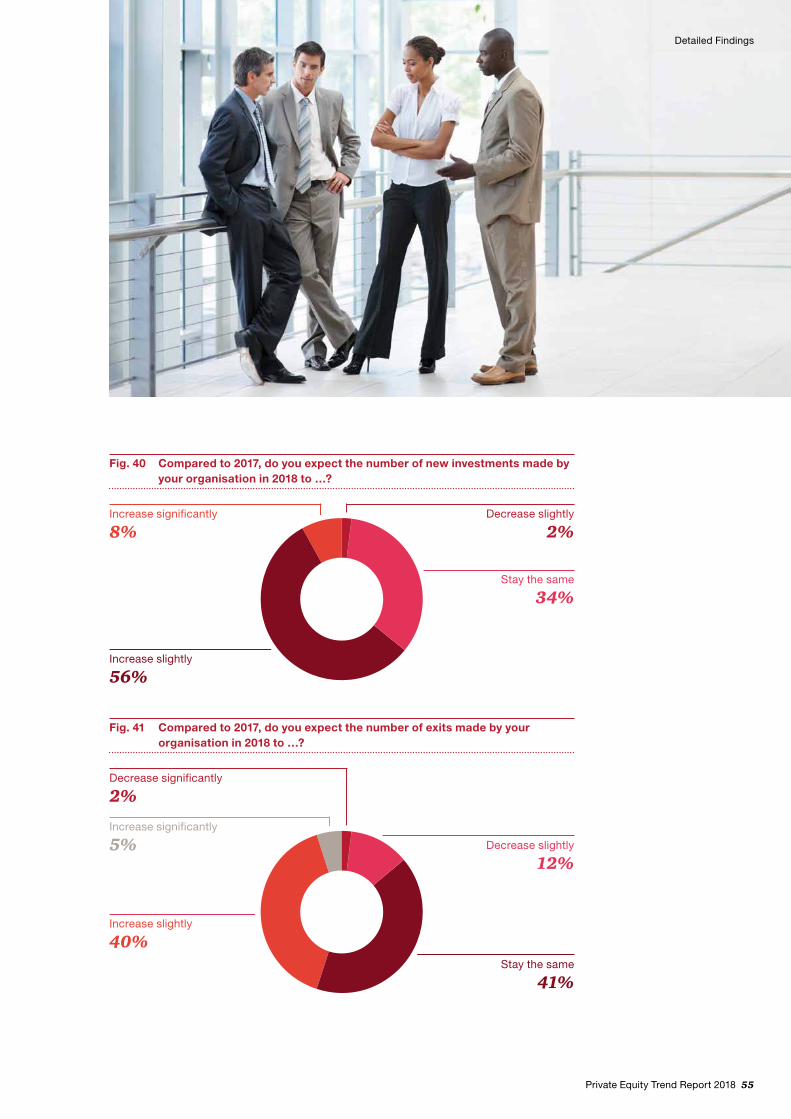
Private Equity Trend Report 2018 55
Detailed Findings
Fig. 40 Compared to 2017, do you expect the number of new investments made by your organisation in 2018 to …?
Increase slightly
56%
Increase significantly
8%
Stay the same
34%
Decrease slightly
2%
Fig. 41 Compared to 2017, do you expect the number of exits made by your organisation in 2018 to …?
Increase slightly
40%
Increase significantly
5% Decrease slightly
12%
Stay the same
41%
Decrease significantly
2%
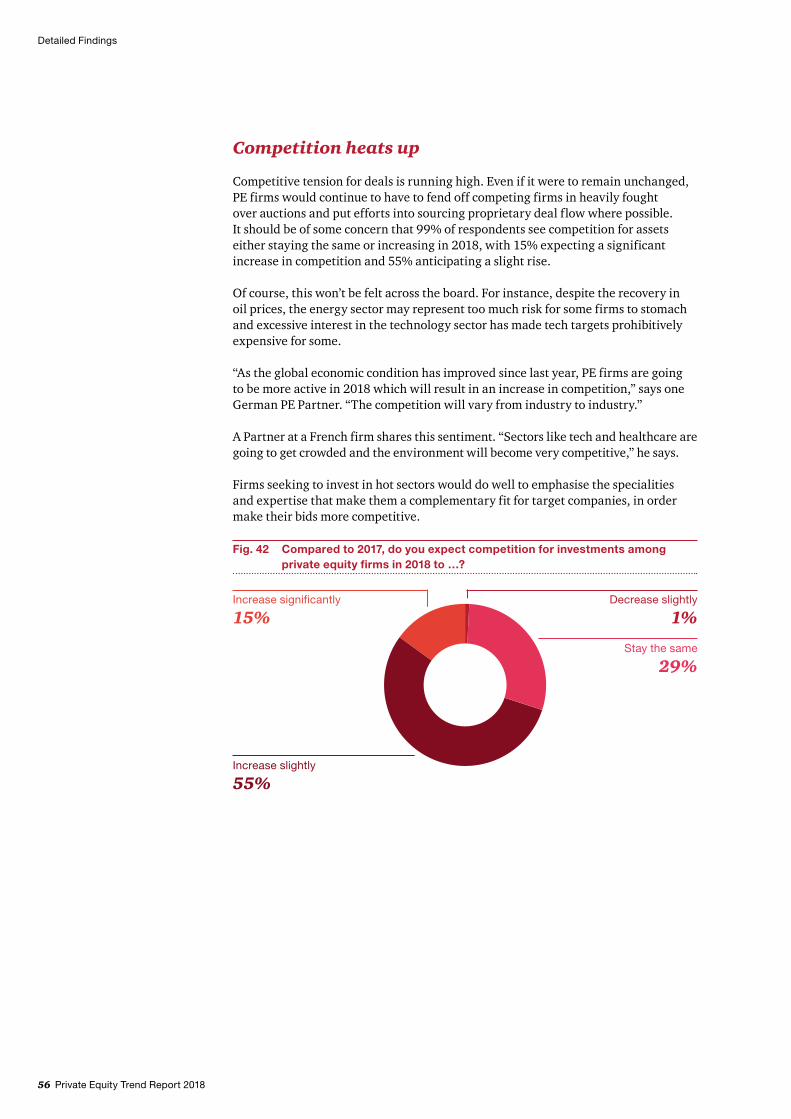
56 Private Equity Trend Report 2018
Competition heats up
Competitive tension for deals is running high. Even if it were to remain unchanged, PE firms would continue to have to fend off competing firms in heavily fought over auctions and put efforts into sourcing proprietary deal flow where possible. It should be of some concern that 99% of respondents see competition for assets either staying the same or increasing in 2018, with 15% expecting a significant increase in competition and 55% anticipating a slight rise.
Of course, this won’t be felt across the board. For instance, despite the recovery in oil prices, the energy sector may represent too much risk for some firms to stomach and excessive interest in the technology sector has made tech targets prohibitively expensive for some.
“As the global economic condition has improved since last year, PE firms are going to be more active in 2018 which will result in an increase in competition,” says one German PE Partner. “The competition will vary from industry to industry.”
A Partner at a French firm shares this sentiment. “Sectors like tech and healthcare are going to get crowded and the environment will become very competitive,” he says.
Firms seeking to invest in hot sectors would do well to emphasise the specialities and expertise that make them a complementary fit for target companies, in order make their bids more competitive.
Detailed Findings
Fig. 42 Compared to 2017, do you expect competition for investments among private equity firms in 2018 to …?
Increase slightly
55%
Increase significantly
15%
Stay the same
29%
Decrease slightly
1%
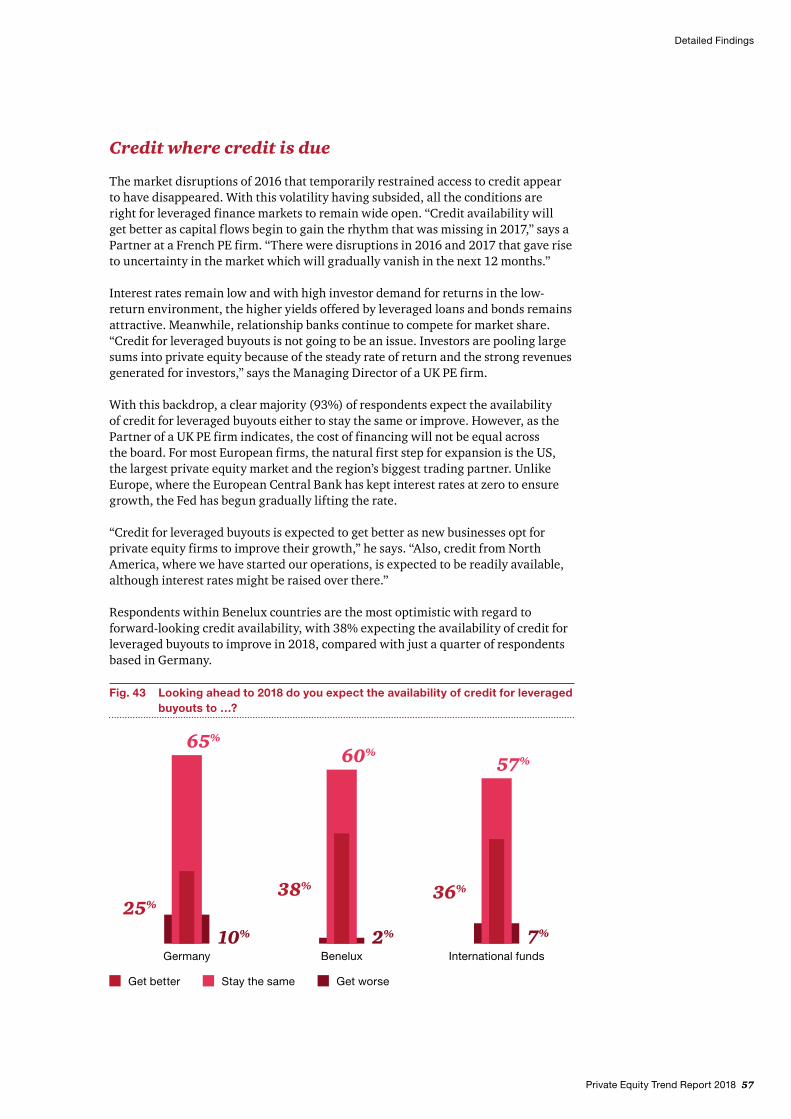
Private Equity Trend Report 2018 57
Credit where credit is due
The market disruptions of 2016 that temporarily restrained access to credit appear to have disappeared. With this volatility having subsided, all the conditions are right for leveraged finance markets to remain wide open. “Credit availability will get better as capital flows begin to gain the rhythm that was missing in 2017,” says a Partner at a French PE firm. “There were disruptions in 2016 and 2017 that gave rise to uncertainty in the market which will gradually vanish in the next 12 months.”
Interest rates remain low and with high investor demand for returns in the low-return environment, the higher yields offered by leveraged loans and bonds remains attractive. Meanwhile, relationship banks continue to compete for market share. “Credit for leveraged buyouts is not going to be an issue. Investors are pooling large sums into private equity because of the steady rate of return and the strong revenues generated for investors,” says the Managing Director of a UK PE firm.
With this backdrop, a clear majority (93%) of respondents expect the availability of credit for leveraged buyouts either to stay the same or improve. However, as the Partner of a UK PE firm indicates, the cost of financing will not be equal across the board. For most European firms, the natural first step for expansion is the US, the largest private equity market and the region’s biggest trading partner. Unlike Europe, where the European Central Bank has kept interest rates at zero to ensure growth, the Fed has begun gradually lifting the rate.
“Credit for leveraged buyouts is expected to get better as new businesses opt for private equity firms to improve their growth,” he says. “Also, credit from North America, where we have started our operations, is expected to be readily available, although interest rates might be raised over there.”
Respondents within Benelux countries are the most optimistic with regard to forward-looking credit availability, with 38% expecting the availability of credit for leveraged buyouts to improve in 2018, compared with just a quarter of respondents based in Germany.
Detailed Findings
Fig. 43 Looking ahead to 2018 do you expect the availability of credit for leveraged buyouts to …?
Get worseStay the sameGet better
Germany Benelux International funds10% 2% 7%
65%
60%57%
25%38% 36%
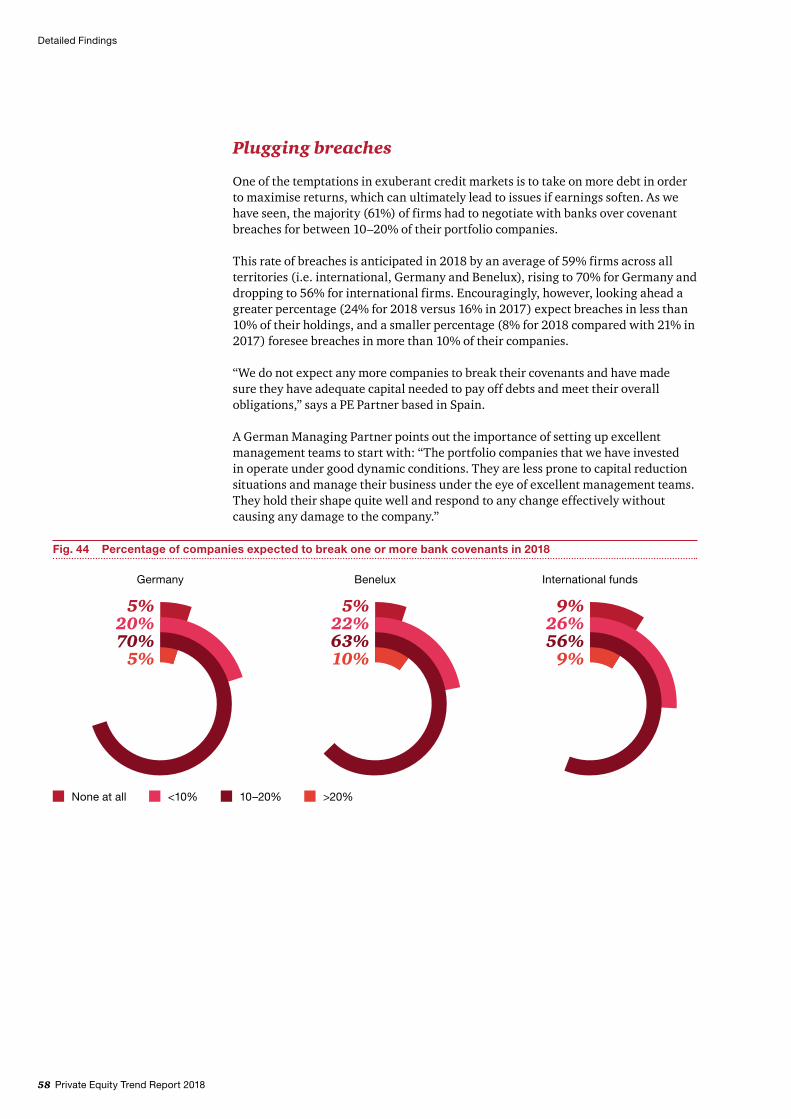
58 Private Equity Trend Report 2018
Detailed Findings
Plugging breaches
One of the temptations in exuberant credit markets is to take on more debt in order to maximise returns, which can ultimately lead to issues if earnings soften. As we have seen, the majority (61%) of firms had to negotiate with banks over covenant breaches for between 10–20% of their portfolio companies.
This rate of breaches is anticipated in 2018 by an average of 59% firms across all territories (i.e. international, Germany and Benelux), rising to 70% for Germany and dropping to 56% for international firms. Encouragingly, however, looking ahead a greater percentage (24% for 2018 versus 16% in 2017) expect breaches in less than 10% of their holdings, and a smaller percentage (8% for 2018 compared with 21% in 2017) foresee breaches in more than 10% of their companies.
“We do not expect any more companies to break their covenants and have made sure they have adequate capital needed to pay off debts and meet their overall obligations,” says a PE Partner based in Spain.
A German Managing Partner points out the importance of setting up excellent management teams to start with: “The portfolio companies that we have invested in operate under good dynamic conditions. They are less prone to capital reduction situations and manage their business under the eye of excellent management teams. They hold their shape quite well and respond to any change effectively without causing any damage to the company.”
Germany Benelux International funds
20%5%
5%70%
22%5%
10%63%
26%9%
9%56%
None at all <10% 10–20% >20%
Fig. 44 Percentage of companies expected to break one or more bank covenants in 2018
Private Equity Trend Report 2018 59
Detailed Findings
Operational improvements front of mind in 2018
Market consolidation may have been the standout investment rationale among respondents (82%) for deals made in 2017, however looking ahead to 2018, this drops to 66%. Instead, operational improvements are anticipated to be an influential factor for investments made this year, cited by 88% of respondents. This is closely followed by buy-and-build (85%).
Moreover, operational improvements stand out as being the single most important factor for 44% of all respondents. This is in keeping with past years, with 40% of respondents in last year’s survey referencing improvements to operations as a key value driver. This is likely to continue. Investors increasingly look for fund managers who can create value through the genuine transformation of companies, rather than tinkering with their capital structures and this will no doubt be a lasting expectation, rather than a short-lived response to debt-laden casualties of the financial crisis.
Further, 74% of respondents put operational improvements in the top two (out of four) factors influencing their return on investment, with only 6% considering it to be the least important factor.
“On an ongoing basis operational improvements have played a decent role in impacting the returns on investments. A few mergers in operations have helped us work more closely and efficiently in creating good returns with better focus on investments.”, explains a Germany-based managing director.
While this makes operational improvement a major returns influencer for a majority of firms, the single most-cited (33%) return driver is financial engineering.
“Financial leverage has a better impact on our returns. We have been able to balance out our debts structures to gain better income from our investments,” says a Partner based in Germany. However, there is a clear divide in opinion over the value of leverage: 35% consider it to be the least important factor in return generation. This means that no other driver is as widely seen to have both the most and the least influence on returns among the sample of PE firms.
Another Germany-based partner makes the argument for staying agile and flexible around the focus on leverage and financial engineering, “In the past 3 years we have reduced the use of financial engineering as this has been adding additional steps required in investments and strategizing. We have benefited by reducing the dependency on engineering so that we can make quick and proactive decisions for investments and exits.”
Therefore, the conclusion is that there is no black and white picture to paint. There are many factors that help PE generate the top returns for pension funds and insurance companies – and one of them is also financial engineering. A financial engineering, however, that is balanced and healthy – where portfolios are not overburdened but are given an efficient capital structure and also the financial backing to grow, expand and thrive.
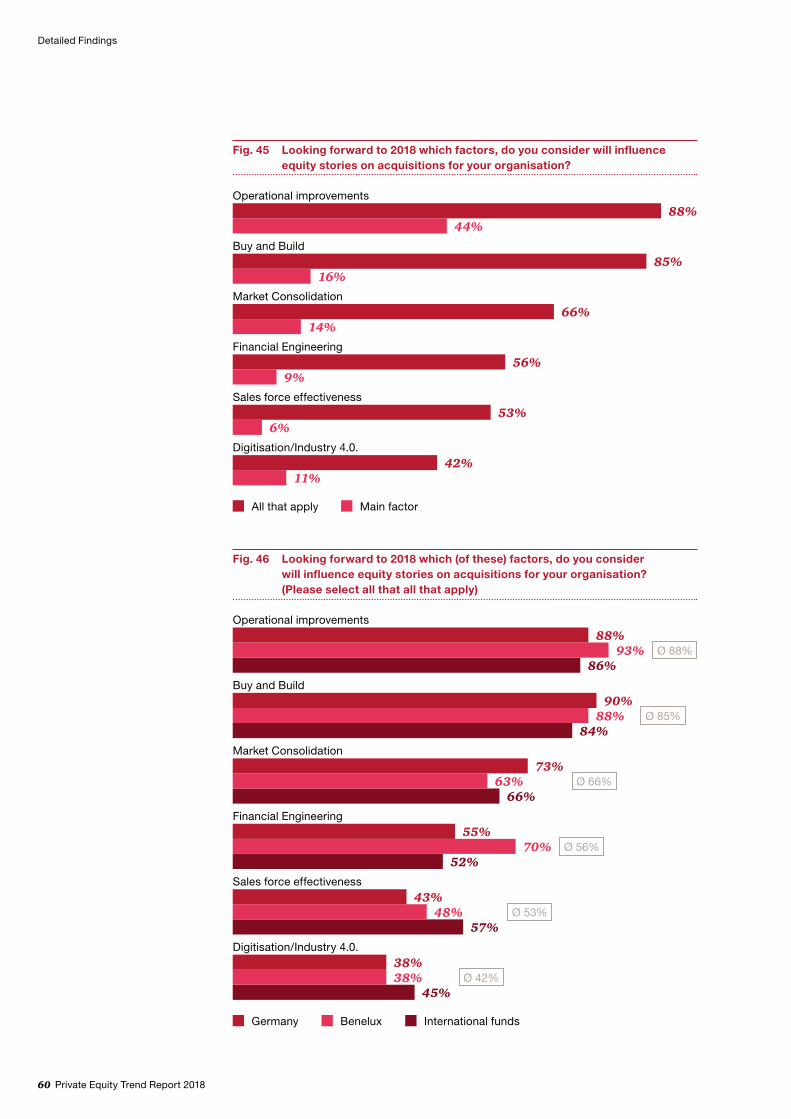
60 Private Equity Trend Report 2018
Detailed Findings
All that apply Main factor
Fig. 45 Looking forward to 2018 which factors, do you consider will influence equity stories on acquisitions for your organisation?
Operational improvements88%
44%Buy and Build
85%16%
Market Consolidation
14%66%
Financial Engineering56%
9%Sales force effectiveness
53%6%
Digitisation/Industry 4.0.
11%42%
Fig. 46 Looking forward to 2018 which (of these) factors, do you consider will influence equity stories on acquisitions for your organisation? (Please select all that all that apply)
International fundsGermany Benelux
Operational improvements88%
93%86%
Buy and Build90%
88%84%
Market Consolidation
63%73%
66%Financial Engineering
55%70%
52%Sales force effectiveness
43%48%
57%Digitisation/Industry 4.0.
38%38%
45%
Ø 88%
Ø 85%
Ø 66%
Ø 56%
Ø 53%
Ø 42%
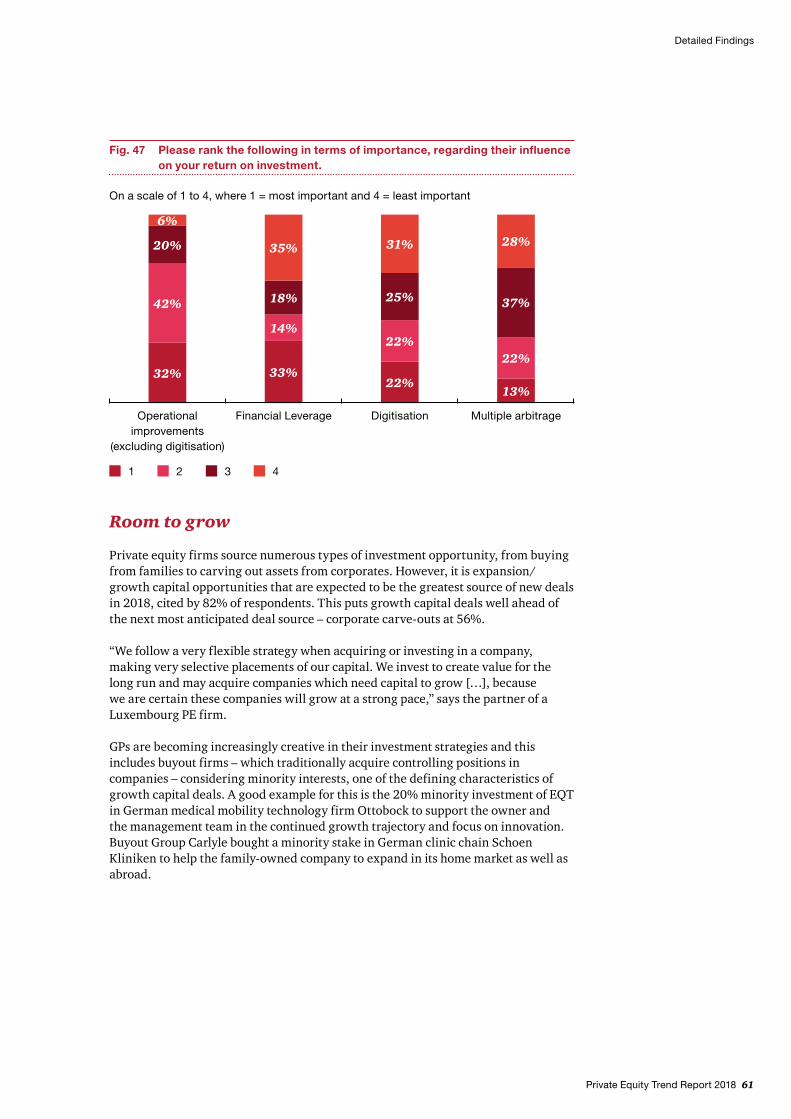
Private Equity Trend Report 2018 61
Room to grow
Private equity firms source numerous types of investment opportunity, from buying from families to carving out assets from corporates. However, it is expansion/growth capital opportunities that are expected to be the greatest source of new deals in 2018, cited by 82% of respondents. This puts growth capital deals well ahead of the next most anticipated deal source – corporate carve-outs at 56%.
“We follow a very flexible strategy when acquiring or investing in a company, making very selective placements of our capital. We invest to create value for the long run and may acquire companies which need capital to grow […], because we are certain these companies will grow at a strong pace,” says the partner of a Luxembourg PE firm.
GPs are becoming increasingly creative in their investment strategies and this includes buyout firms – which traditionally acquire controlling positions in companies – considering minority interests, one of the defining characteristics of growth capital deals. A good example for this is the 20% minority investment of EQT in German medical mobility technology firm Ottobock to support the owner and the management team in the continued growth trajectory and focus on innovation. Buyout Group Carlyle bought a minority stake in German clinic chain Schoen Kliniken to help the family-owned company to expand in its home market as well as abroad.
Detailed Findings
Fig. 47 Please rank the following in terms of importance, regarding their influence on your return on investment.
1 32 4
6%
20%
42%
32%
35%
14%
18%
33%
31%
25%
22%
22%
28%
37%
22%
13%
Operational improvements
(excluding digitisation)
Financial Leverage Digitisation Multiple arbitrage
On a scale of 1 to 4, where 1 = most important and 4 = least important
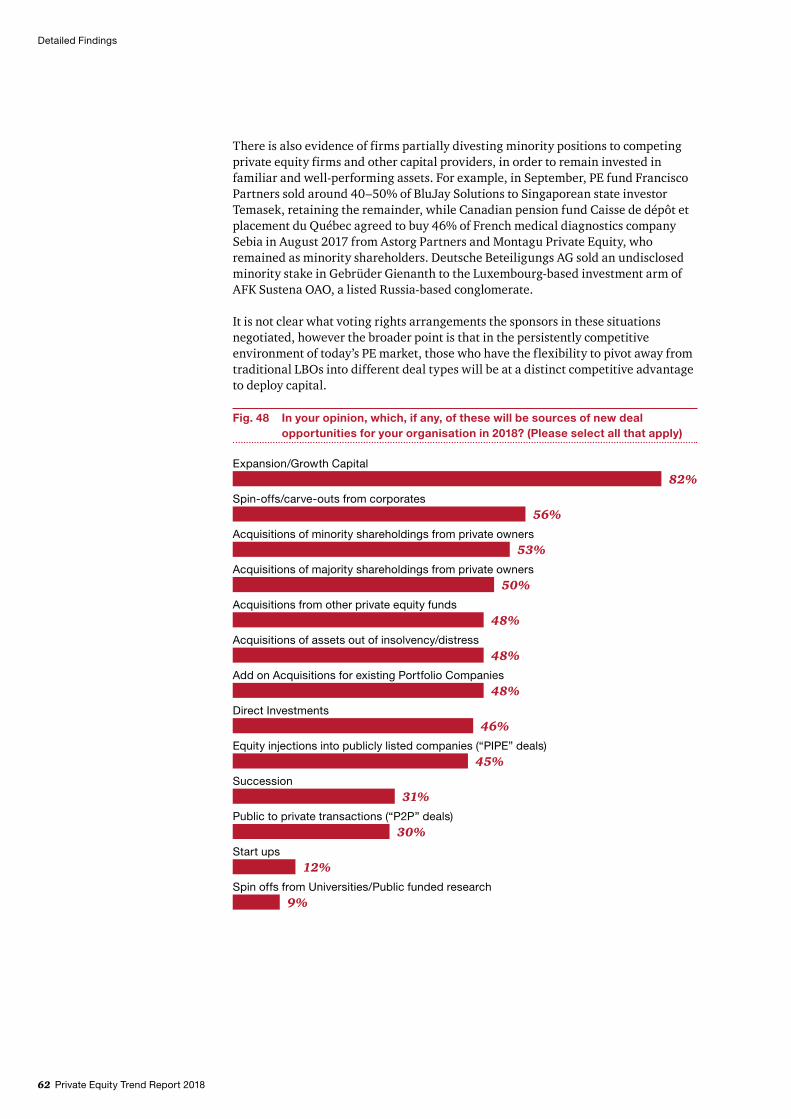
62 Private Equity Trend Report 2018
There is also evidence of firms partially divesting minority positions to competing private equity firms and other capital providers, in order to remain invested in familiar and well-performing assets. For example, in September, PE fund Francisco Partners sold around 40–50% of BluJay Solutions to Singaporean state investor Temasek, retaining the remainder, while Canadian pension fund Caisse de dépôt et placement du Québec agreed to buy 46% of French medical diagnostics company Sebia in August 2017 from Astorg Partners and Montagu Private Equity, who remained as minority shareholders. Deutsche Beteiligungs AG sold an undisclosed minority stake in Gebrüder Gienanth to the Luxembourg-based investment arm of AFK Sustena OAO, a listed Russia-based conglomerate.
It is not clear what voting rights arrangements the sponsors in these situations negotiated, however the broader point is that in the persistently competitive environment of today’s PE market, those who have the flexibility to pivot away from traditional LBOs into different deal types will be at a distinct competitive advantage to deploy capital.
Detailed Findings
Fig. 48 In your opinion, which, if any, of these will be sources of new deal opportunities for your organisation in 2018? (Please select all that apply)
82%Expansion/Growth Capital
Spin-offs/carve-outs from corporates56%
Acquisitions of minority shareholdings from private owners53%
Acquisitions of majority shareholdings from private owners50%
Acquisitions from other private equity funds48%
Acquisitions of assets out of insolvency/distress48%
Add on Acquisitions for existing Portfolio Companies48%
Direct Investments46%
Equity injections into publicly listed companies (“PIPE” deals)45%
Succession31%
Public to private transactions (“P2P” deals)30%
Start ups12%
Spin offs from Universities/Public funded research9%
Private Equity Trend Report 2018 63
Levering down
Anecdotally, private equity has become less leverage-dependent and more operationally-minded in the years following the crisis. Fund investors pay closer attention to how fund managers create returns, seeking out those skilled houses that are able to deliver profits through hands-on management and who are able to improve the strategic direction and, ultimately, increase the revenues and profits of the companies they invest in.
A France based managing partner explains: “The dependence on financial engineering has been minimal in the past 3 years. We have skilled managers who don’t seek to leverage financial engineering in their management strategies.”
In line with this, more than two-thirds (68%) of respondents say that their business model is less reliant on leverage or financial engineering in the last three years, and a similar proportion (67%) report an increased focus on active portfolio management.
“We have been very active in expanding across the globe and prime focus has been on active portfolio management,” says the partner of a US-headquartered firm with offices in Spain. “With portfolio management at the centre of our operations, we have seen a significant increase in our returns and much stronger growth projections. In the past three years, we have also seen higher co-operation with strategic investors.”
A UK-based partner explains what this change in strategy has given them: “In this fast moving market environment it is necessary to be vigilant in business. Being more active portfolio managers has given us the privilege of being very quick in decision making and deal making. We have been able to make better decisions and critical ones since the adoption of this strategy in the past 3 years.”
There are plenty of examples of PE firms thinking more broadly about what capital providers they collaborate with on deals. Pensions and other institutions that have historically been fund managers’ clients are increasingly investing directly into businesses themselves, with private equity firms sourcing opportunities for them to partner in co-investments. This also extends to corporates and other strategic investors that have historically competed against funds to acquire assets and acquired from them at exit.
For example, last September, Bain Capital led a consortium to win a successful US$18bn bid for Toshiba’s semiconductor arm, collaborating with South Korea’s SK Hynix, memory card maker Kingston Technology, data storage firm Seagate Technology plus Apple and Dell, both buyers of Toshiba’s chips.
Our survey shows that 66% of GPs report more co-operations with strategic investors over the last three years, a notable change to PE firms’ operations and how they think about making deals. For the majority of respondents, expansion to other investment areas (58%) and more minority shareholdings (51%) are also notable changes to operations.
Detailed Findings
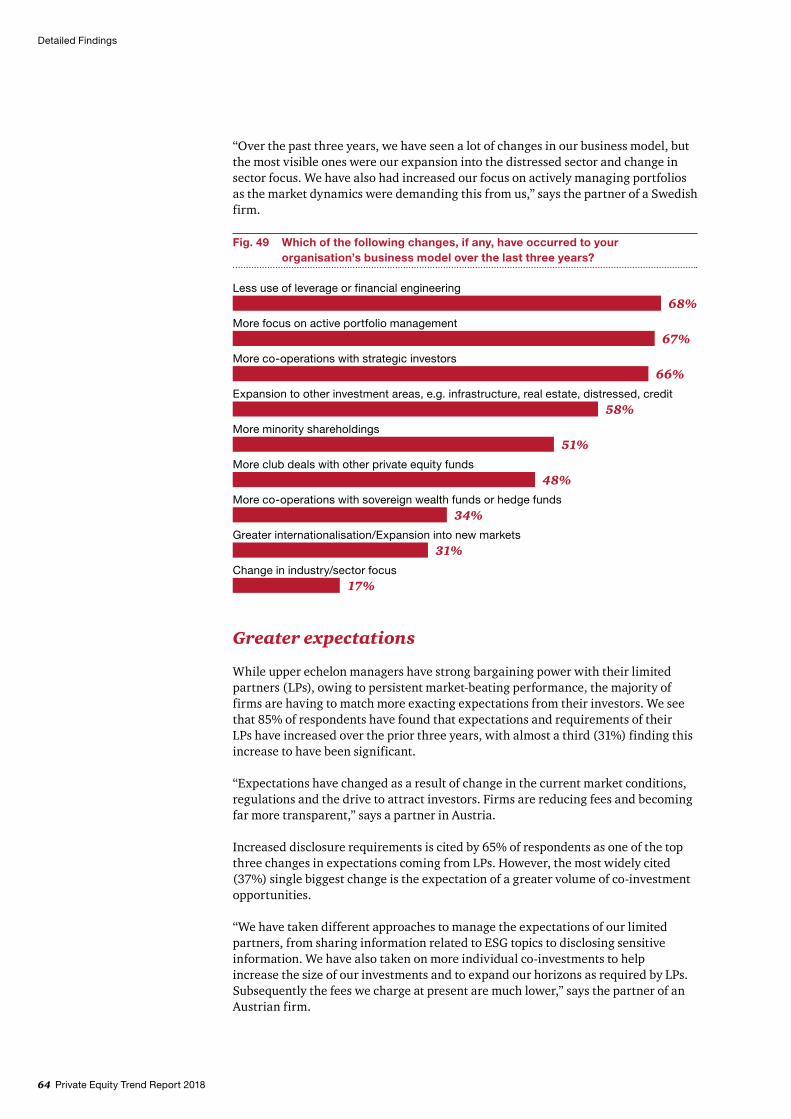
64 Private Equity Trend Report 2018
Detailed Findings
“Over the past three years, we have seen a lot of changes in our business model, but the most visible ones were our expansion into the distressed sector and change in sector focus. We have also had increased our focus on actively managing portfolios as the market dynamics were demanding this from us,” says the partner of a Swedish firm.
Greater expectations
While upper echelon managers have strong bargaining power with their limited partners (LPs), owing to persistent market-beating performance, the majority of firms are having to match more exacting expectations from their investors. We see that 85% of respondents have found that expectations and requirements of their LPs have increased over the prior three years, with almost a third (31%) finding this increase to have been significant.
“Expectations have changed as a result of change in the current market conditions, regulations and the drive to attract investors. Firms are reducing fees and becoming far more transparent,” says a partner in Austria.
Increased disclosure requirements is cited by 65% of respondents as one of the top three changes in expectations coming from LPs. However, the most widely cited (37%) single biggest change is the expectation of a greater volume of co-investment opportunities.
“We have taken different approaches to manage the expectations of our limited partners, from sharing information related to ESG topics to disclosing sensitive information. We have also taken on more individual co-investments to help increase the size of our investments and to expand our horizons as required by LPs. Subsequently the fees we charge at present are much lower,” says the partner of an Austrian firm.
Fig. 49 Which of the following changes, if any, have occurred to your organisation’s business model over the last three years?
68%Less use of leverage or financial engineering
More focus on active portfolio management67%
More co-operations with strategic investors66%
Expansion to other investment areas, e.g. infrastructure, real estate, distressed, credit58%
More minority shareholdings51%
More club deals with other private equity funds48%
More co-operations with sovereign wealth funds or hedge funds34%
Greater internationalisation/Expansion into new markets31%
Change in industry/sector focus17%
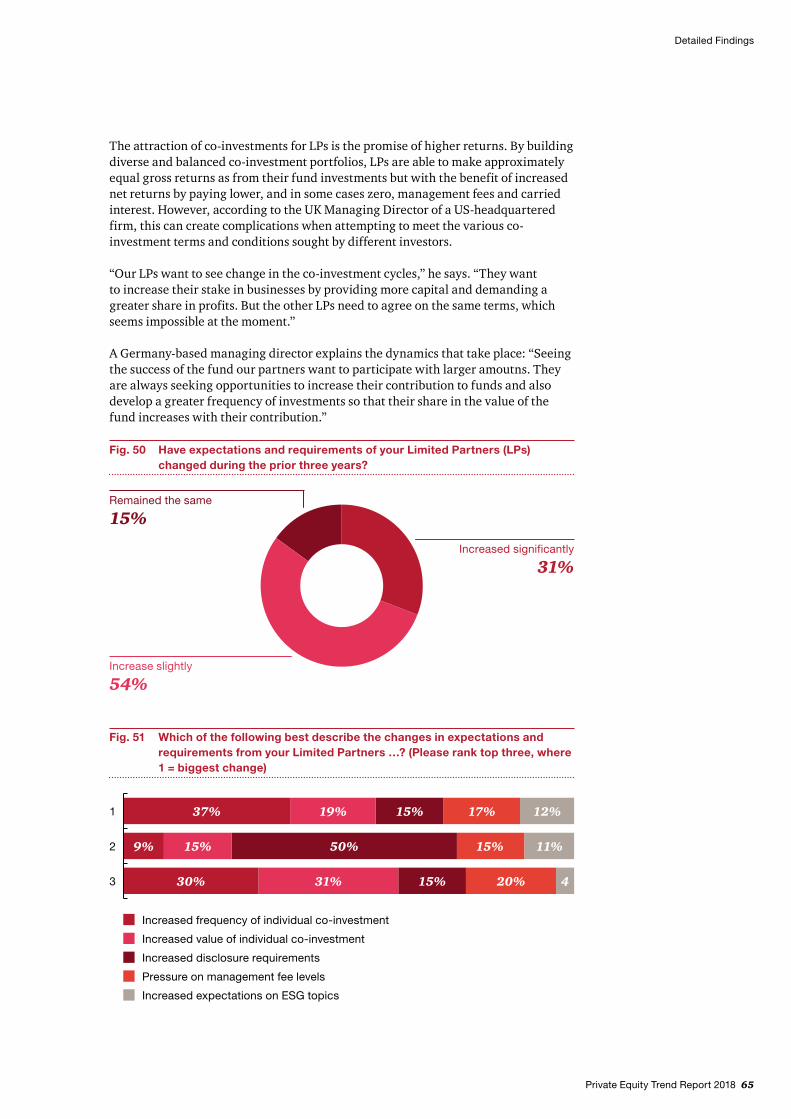
Private Equity Trend Report 2018 65
Detailed Findings
The attraction of co-investments for LPs is the promise of higher returns. By building diverse and balanced co-investment portfolios, LPs are able to make approximately equal gross returns as from their fund investments but with the benefit of increased net returns by paying lower, and in some cases zero, management fees and carried interest. However, according to the UK Managing Director of a US-headquartered firm, this can create complications when attempting to meet the various co-investment terms and conditions sought by different investors.
“Our LPs want to see change in the co-investment cycles,” he says. “They want to increase their stake in businesses by providing more capital and demanding a greater share in profits. But the other LPs need to agree on the same terms, which seems impossible at the moment.”
A Germany-based managing director explains the dynamics that take place: “Seeing the success of the fund our partners want to participate with larger amoutns. They are always seeking opportunities to increase their contribution to funds and also develop a greater frequency of investments so that their share in the value of the fund increases with their contribution.”
Fig. 50 Have expectations and requirements of your Limited Partners (LPs) changed during the prior three years?
Increase slightly
54%
Remained the same
15%
Increased significantly
31%
Fig. 51 Which of the following best describe the changes in expectations and requirements from your Limited Partners …? (Please rank top three, where 1 = biggest change)
Increased frequency of individual co-investment
Increased value of individual co-investment
Increased disclosure requirements
Pressure on management fee levels
Increased expectations on ESG topics
37% 19% 15% 17% 12%
9% 15% 50% 15% 11%
30% 31% 15% 20% 4
2
3
1
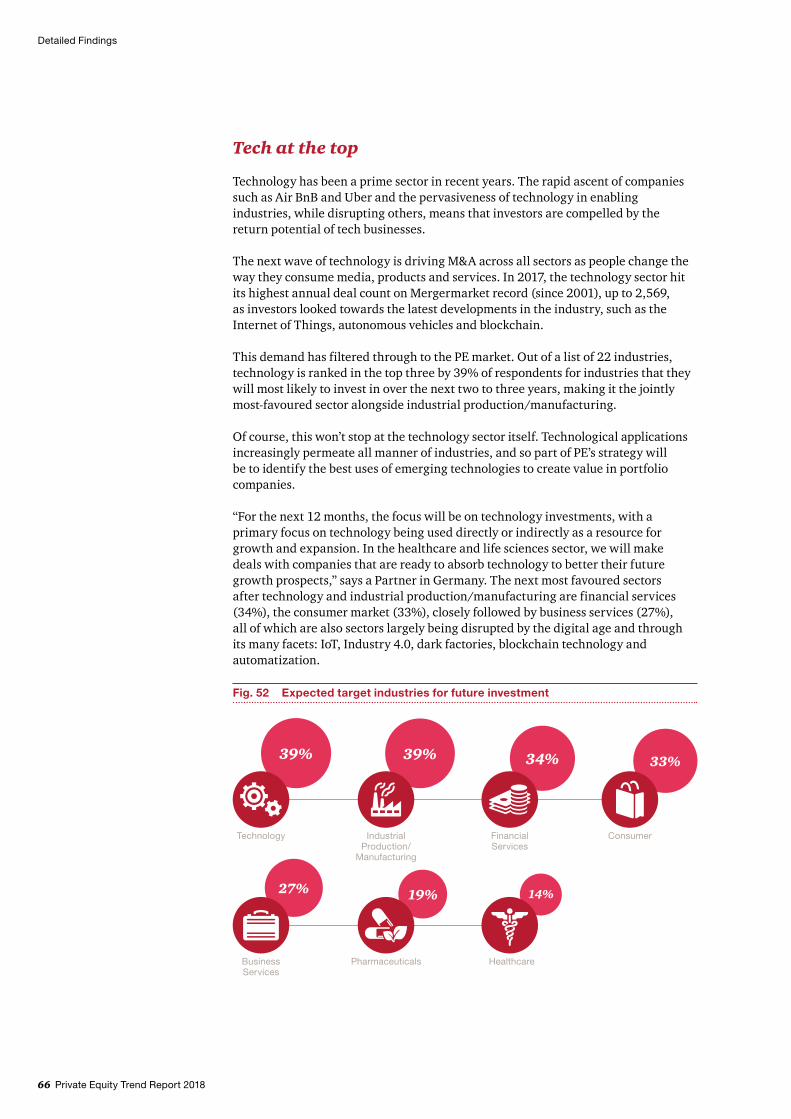
66 Private Equity Trend Report 2018
Detailed Findings
Tech at the top
Technology has been a prime sector in recent years. The rapid ascent of companies such as Air BnB and Uber and the pervasiveness of technology in enabling industries, while disrupting others, means that investors are compelled by the return potential of tech businesses.
The next wave of technology is driving M&A across all sectors as people change the way they consume media, products and services. In 2017, the technology sector hit its highest annual deal count on Mergermarket record (since 2001), up to 2,569, as investors looked towards the latest developments in the industry, such as the Internet of Things, autonomous vehicles and blockchain.
This demand has filtered through to the PE market. Out of a list of 22 industries, technology is ranked in the top three by 39% of respondents for industries that they will most likely to invest in over the next two to three years, making it the jointly most-favoured sector alongside industrial production/manufacturing.
Of course, this won’t stop at the technology sector itself. Technological applications increasingly permeate all manner of industries, and so part of PE’s strategy will be to identify the best uses of emerging technologies to create value in portfolio companies.
“For the next 12 months, the focus will be on technology investments, with a primary focus on technology being used directly or indirectly as a resource for growth and expansion. In the healthcare and life sciences sector, we will make deals with companies that are ready to absorb technology to better their future growth prospects,” says a Partner in Germany. The next most favoured sectors after technology and industrial production/manufacturing are financial services (34%), the consumer market (33%), closely followed by business services (27%), all of which are also sectors largely being disrupted by the digital age and through its many facets: IoT, Industry 4.0, dark factories, blockchain technology and automatization.
Fig. 52 Expected target industries for future investment
39%
Industrial Production/
Manufacturing
Pharmaceuticals
19%
Technology
39%
Financial Services
34%
Business Services
27%
Consumer
33%
Healthcare
14%
Private Equity Trend Report 2018 67
Detailed Findings
Regulation frustration
Our survey reveals that increasing regulation is the major issue that the European private equity industry must contend with in the next five years. Undoubtedly the most significant piece of regulation of recent times that applies directly to private equity is the Alternative Investment Fund Managers directive (AIFMD). This sweeping set of rules, which treats hedge funds and private equity funds as one and the same, will continue to dictate firms’ policies and processes.
“Regulations will increase as markets go on developing and new investment instruments and vehicles get introduced in the market. It’s going to be the same in Europe when it comes to the private equity industry,” says a UK Partner.
While not designed with private equity in mind, the Markets in Financial Instruments Directive II (MiFID II) directly affects certain firms that are structured as advisers in the EU, while others will be impacted if they engage a placement agent or other third party who is regulated by MiFID II.
The Organisation for Economic Cooperation and Development’s (OECD) action plan on Base Erosion and Profit Shifting (BEPs) is another consideration. Although aimed at the tax avoidance of multinationals, fund managers have been caught in the OECD’s crosshairs, with Action 6 in particular aimed at ending tax treaty shopping and may impact upon the industry.
A majority of respondents also point to the pressure for lower fees (69%) and a scarcity of investment opportunities (64%) as key issues the industry faces over the coming five years. “The number of players has already increased, and there is pressure on PE managers to reduce their fees,” says the managing director of an Austrian firm. “Firms are more obliging because of the competition and the pressure to outperform.”
One area for consideration is the future lay of the competitive landscape. The private equity market is incredibly competitive and this tension shows no sign of decreasing. Indeed, 75% of respondents expect the number of PE houses in Europe to increase over the next three years.
The partner of a firm in Germany says that they expect that five years from now the number of PE firms in the domestic market will have doubled. “The biggest challenge European private equity will face is the competition between funds,” adds the CEO of a French firm. “All the market operators want to launch new funds and have been successful in attracting capital, but managers could find it difficult to invest much of this oversupply of capital in a market that can be unpredictable at times.”
23% of private equity firms see the scarcity of investment opportunities as the main challenge lying ahead.
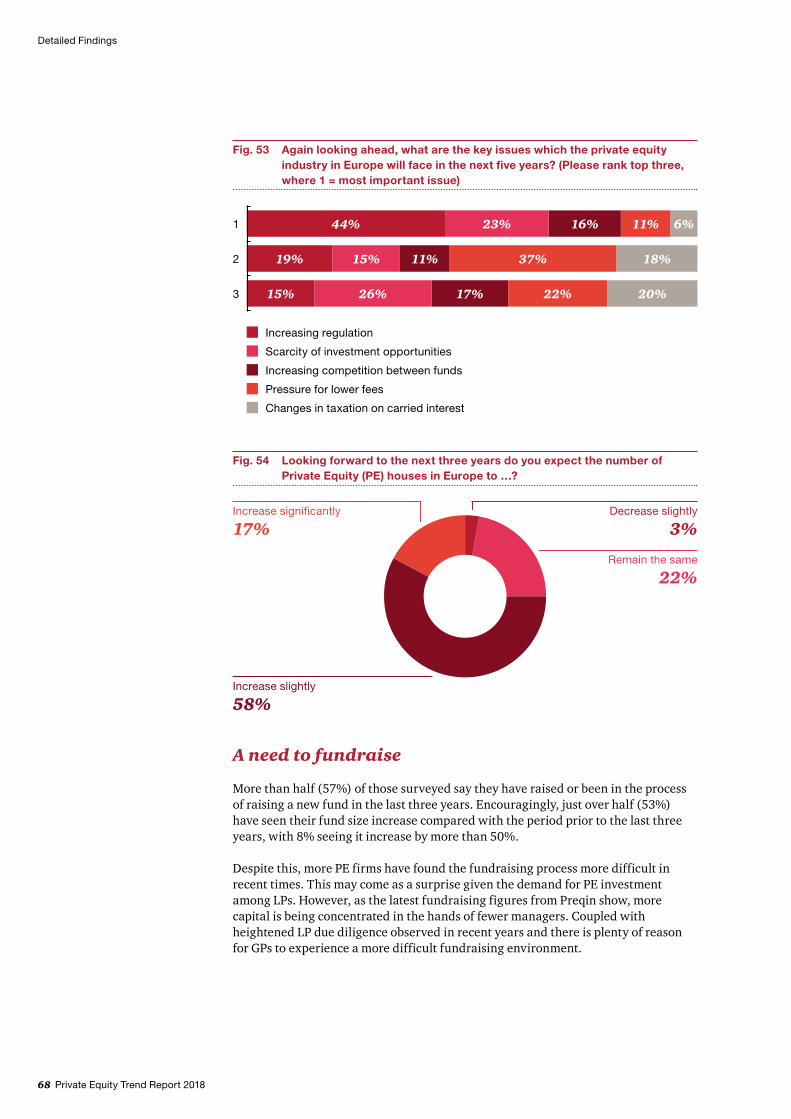
68 Private Equity Trend Report 2018
Detailed Findings
A need to fundraise
More than half (57%) of those surveyed say they have raised or been in the process of raising a new fund in the last three years. Encouragingly, just over half (53%) have seen their fund size increase compared with the period prior to the last three years, with 8% seeing it increase by more than 50%.
Despite this, more PE firms have found the fundraising process more difficult in recent times. This may come as a surprise given the demand for PE investment among LPs. However, as the latest fundraising figures from Preqin show, more capital is being concentrated in the hands of fewer managers. Coupled with heightened LP due diligence observed in recent years and there is plenty of reason for GPs to experience a more difficult fundraising environment.
Fig. 54 Looking forward to the next three years do you expect the number of Private Equity (PE) houses in Europe to …?
Increase slightly
58%
Increase significantly
17%
Remain the same
22%
Decrease slightly
3%
Fig. 53 Again looking ahead, what are the key issues which the private equity industry in Europe will face in the next five years? (Please rank top three, where 1 = most important issue)
Increasing regulation
Scarcity of investment opportunities
Increasing competition between funds
Pressure for lower fees
Changes in taxation on carried interest
44% 23% 16% 11% 6%
19% 15% 11% 37% 18%
15% 26% 17% 22% 20%
2
3
1
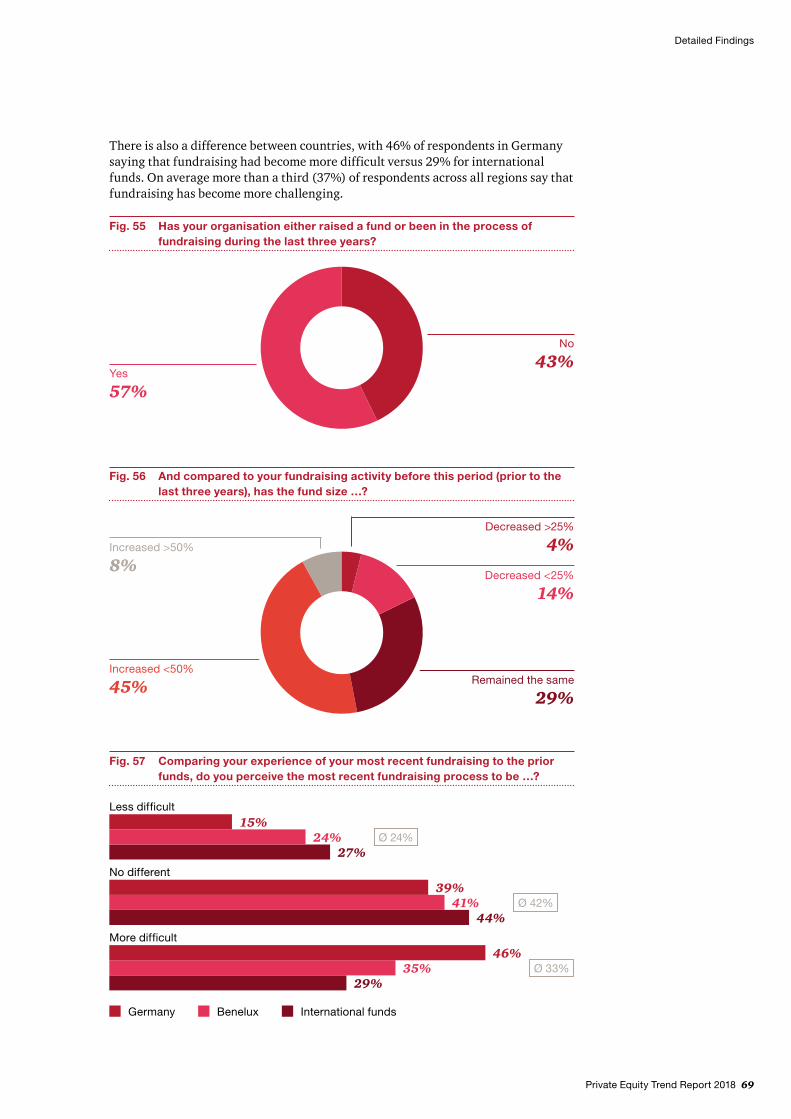
Private Equity Trend Report 2018 69
Detailed Findings
There is also a difference between countries, with 46% of respondents in Germany saying that fundraising had become more difficult versus 29% for international funds. On average more than a third (37%) of respondents across all regions say that fundraising has become more challenging.
Fig. 55 Has your organisation either raised a fund or been in the process of fundraising during the last three years?
No
43%Yes
57%
Fig. 56 And compared to your fundraising activity before this period (prior to the last three years), has the fund size …?
Increased <50%
45%
Increased >50%
8%Decreased <25%
14%
Remained the same
29%
Decreased >25%
4%
Fig. 57 Comparing your experience of your most recent fundraising to the prior funds, do you perceive the most recent fundraising process to be …?
International fundsGermany Benelux
Less difficult15%
24%27%
No different39%
41%44%
More difficult
35%46%
29%
Ø 24%
Ø 42%
Ø 33%
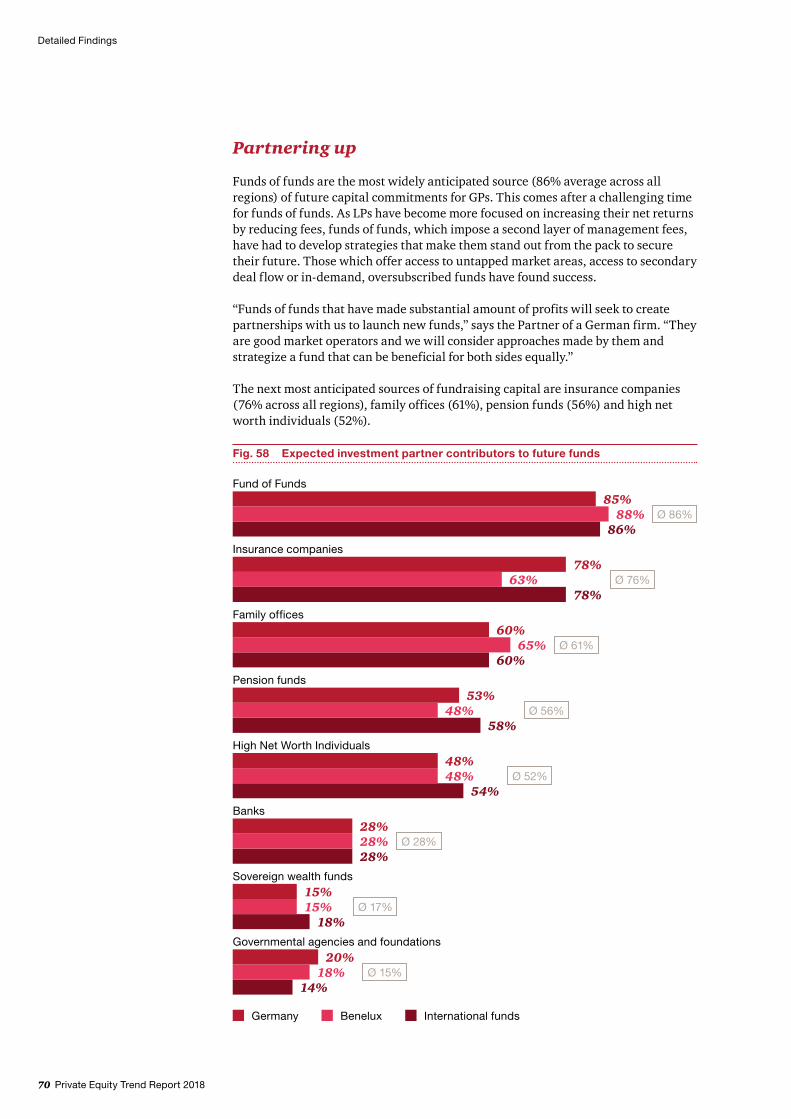
70 Private Equity Trend Report 2018
Detailed Findings
Partnering up
Funds of funds are the most widely anticipated source (86% average across all regions) of future capital commitments for GPs. This comes after a challenging time for funds of funds. As LPs have become more focused on increasing their net returns by reducing fees, funds of funds, which impose a second layer of management fees, have had to develop strategies that make them stand out from the pack to secure their future. Those which offer access to untapped market areas, access to secondary deal flow or in-demand, oversubscribed funds have found success.
“Funds of funds that have made substantial amount of profits will seek to create partnerships with us to launch new funds,” says the Partner of a German firm. “They are good market operators and we will consider approaches made by them and strategize a fund that can be beneficial for both sides equally.”
The next most anticipated sources of fundraising capital are insurance companies (76% across all regions), family offices (61%), pension funds (56%) and high net worth individuals (52%).
Fig. 58 Expected investment partner contributors to future funds
International fundsGermany Benelux
Fund of Funds85%
88%86%
Insurance companies78%
63%78%
Family offices
65%60%
60%Pension funds
48%53%
58%High Net Worth Individuals
48%48%
54%Banks
28%28%28%
Sovereign wealth funds
15%15%
18%Governmental agencies and foundations
18%20%
14%
Ø 86%
Ø 76%
Ø 61%
Ø 56%
Ø 52%
Ø 28%
Ø 17%
Ø 15%
Private Equity Trend Report 2018 71
Detailed Findings
3 Focus on value creationAs the world continues to digitise, private equity firms have to develop a brand new mindset. Encouragingly, they are prioritising this. Digitisation is regarded as the most important lever to value creation within the equity story, ahead of operational cost reduction in second place.
The potential of digital applications is almost limitless, from totally disrupting sectors such as Uber’s impact on the taxi industry or AirBnB shaking up the hotel sector, to overhauling business models. Digitisation can also help to achieve the operational improvements that private equity firms seek in virtually all their investments.
“How well a business can exploit digitisation is often what determines value creation in the investment strategy,” says a Partner based in France. “An organisation that can match advances in the digital world can generate value by not only creating an interesting investment story but also through improved operations.”
Looking back over the past three years, an overwhelming majority (91%) of respondents say that operational improvements have had an increasing impact on their return on investment; looking ahead, the same 91% majority say they expect operational improvements to increasingly boost returns. Interestingly, 61% of respondents felt that the impact of digitisation on return on investment increased over the past three years, with this rising to 81% who expect its impact will increase in the next three years. This is a clear signal that PE firms see future returns coming from digitisation and, significantly, the intersection between operational improvements and digital.
According to the partner of a UK private equity firm, operational improvements are already becoming more digital-centric. “These days, not including digitisation in operational improvements makes them worth little or no value,” he says. “Over the coming years, therefore, it will be interesting to observe how the adoption of technologies impacts upon operational gains and, in turn, how this impacts upon returns.”
A German MD points out that the approach to value creation is by no means a single sided one and that it needs to be holistic: “In our equity stories the biggest roles in creating value has been making overall changes to operations and at the same time also ensuring capital was better organised and optimised, digitisation has also played a key role in reducing our holding time. We aim to make a lot of different changes to the companies we invest in so that all operations of the company are optimised.”
A CEO based in Norway ascertains the value and importance of digitisation as a lever for value creation: “Digitisation has been everywhere and one factor that has topped most of our lists of effectiveness. Digitisation is bringing the entire organisation on one platform now that is making all the processes and operations easier. Most of our investment stories have been inspired by digitisation and its effectiveness.”
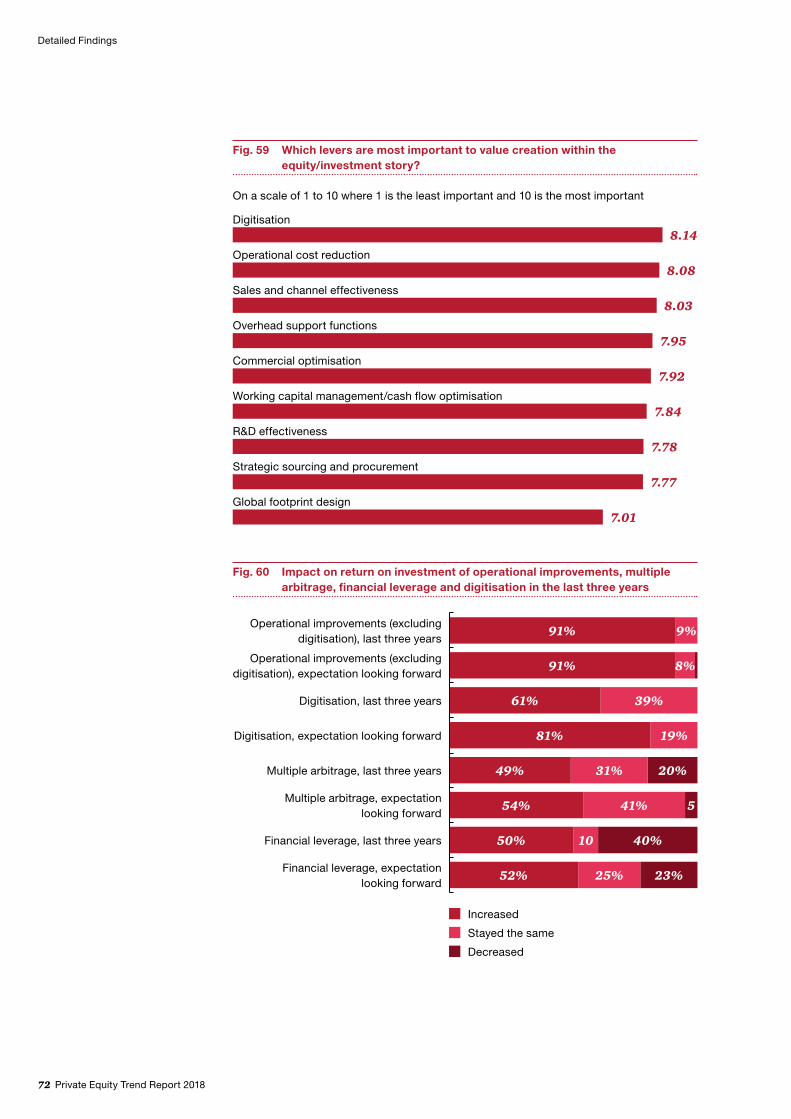
72 Private Equity Trend Report 2018
Detailed Findings
Fig. 59 Which levers are most important to value creation within the equity/investment story?
Global footprint design7.01
7.77Strategic sourcing and procurement
R&D effectiveness7.78
Working capital management/cash flow optimisation7.84
Commercial optimisation7.92
Overhead support functions7.95
Sales and channel effectiveness8.03
Operational cost reduction8.08
8.14Digitisation
On a scale of 1 to 10 where 1 is the least important and 10 is the most important
Fig. 60 Impact on return on investment of operational improvements, multiple arbitrage, financial leverage and digitisation in the last three years
Increased
Stayed the same
Decreased
Operational improvements (excluding digitisation), expectation looking forward
Multiple arbitrage, expectation looking forward
Digitisation, expectation looking forward
Financial leverage, expectation looking forward
Operational improvements (excluding digitisation), last three years
Multiple arbitrage, last three years
Digitisation, last three years
Financial leverage, last three years
91%
91%
61%
81%
49%
54%
50%
52%
9%
8%
39%
19%
31%
41%
10
25%
20%
5
40%
23%
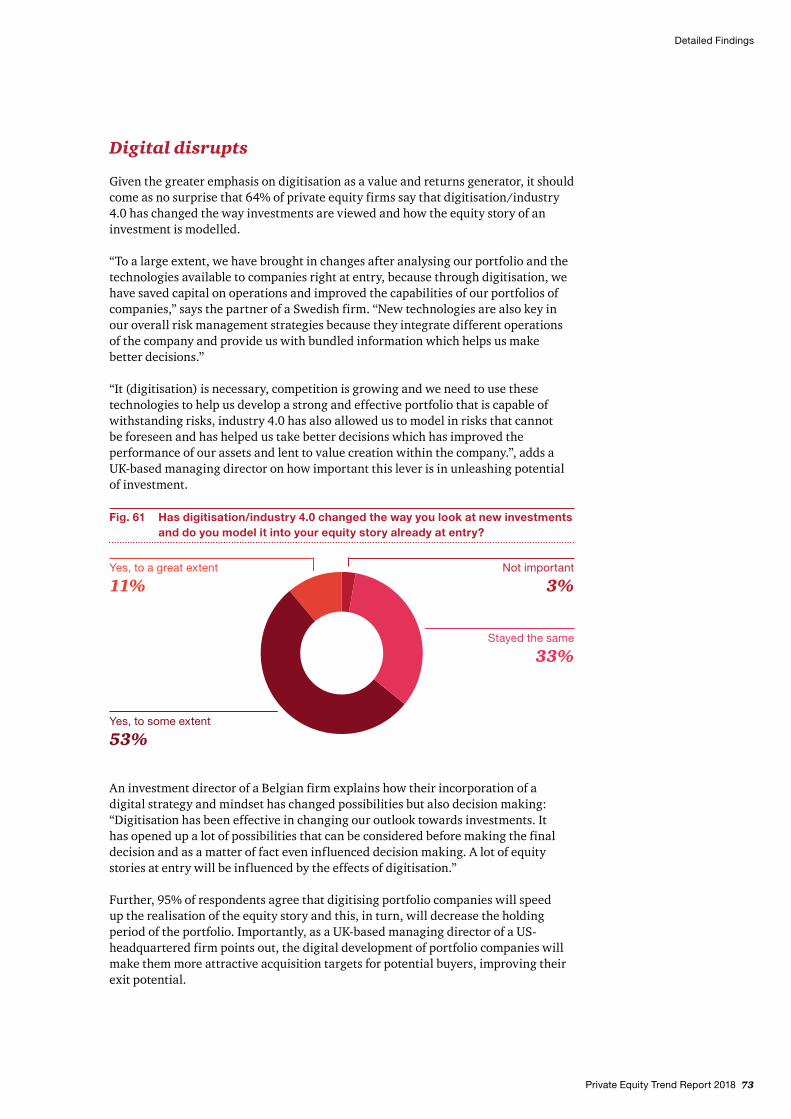
Private Equity Trend Report 2018 73
Digital disrupts
Given the greater emphasis on digitisation as a value and returns generator, it should come as no surprise that 64% of private equity firms say that digitisation/industry 4.0 has changed the way investments are viewed and how the equity story of an investment is modelled.
“To a large extent, we have brought in changes after analysing our portfolio and the technologies available to companies right at entry, because through digitisation, we have saved capital on operations and improved the capabilities of our portfolios of companies,” says the partner of a Swedish firm. “New technologies are also key in our overall risk management strategies because they integrate different operations of the company and provide us with bundled information which helps us make better decisions.”
“It (digitisation) is necessary, competition is growing and we need to use these technologies to help us develop a strong and effective portfolio that is capable of withstanding risks, industry 4.0 has also allowed us to model in risks that cannot be foreseen and has helped us take better decisions which has improved the performance of our assets and lent to value creation within the company.”, adds a UK-based managing director on how important this lever is in unleashing potential of investment.
An investment director of a Belgian firm explains how their incorporation of a digital strategy and mindset has changed possibilities but also decision making: “Digitisation has been effective in changing our outlook towards investments. It has opened up a lot of possibilities that can be considered before making the final decision and as a matter of fact even influenced decision making. A lot of equity stories at entry will be influenced by the effects of digitisation.”
Further, 95% of respondents agree that digitising portfolio companies will speed up the realisation of the equity story and this, in turn, will decrease the holding period of the portfolio. Importantly, as a UK-based managing director of a US-headquartered firm points out, the digital development of portfolio companies will make them more attractive acquisition targets for potential buyers, improving their exit potential.
Detailed Findings
Fig. 61 Has digitisation/industry 4.0 changed the way you look at new investments and do you model it into your equity story already at entry?
Yes, to some extent
53%
Yes, to a great extent
11%
Stayed the same
33%
Not important
3%
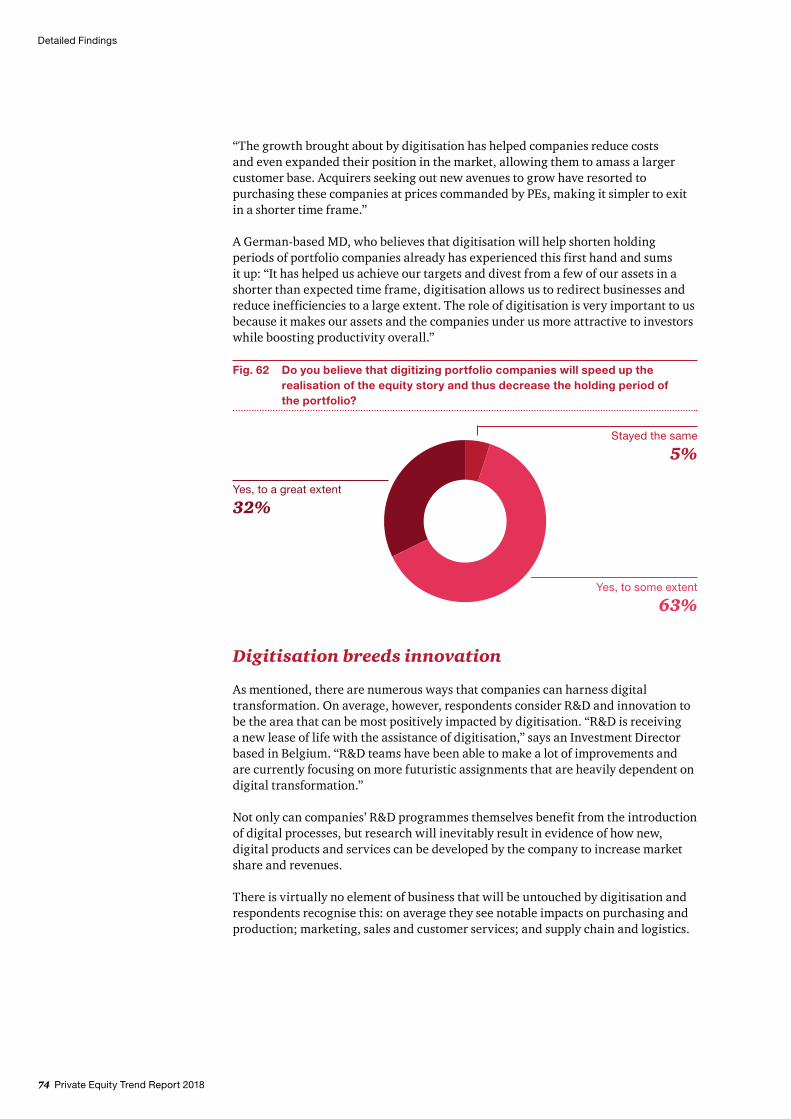
74 Private Equity Trend Report 2018
“The growth brought about by digitisation has helped companies reduce costs and even expanded their position in the market, allowing them to amass a larger customer base. Acquirers seeking out new avenues to grow have resorted to purchasing these companies at prices commanded by PEs, making it simpler to exit in a shorter time frame.”
A German-based MD, who believes that digitisation will help shorten holding periods of portfolio companies already has experienced this first hand and sums it up: “It has helped us achieve our targets and divest from a few of our assets in a shorter than expected time frame, digitisation allows us to redirect businesses and reduce inefficiencies to a large extent. The role of digitisation is very important to us because it makes our assets and the companies under us more attractive to investors while boosting productivity overall.”
Digitisation breeds innovation
As mentioned, there are numerous ways that companies can harness digital transformation. On average, however, respondents consider R&D and innovation to be the area that can be most positively impacted by digitisation. “R&D is receiving a new lease of life with the assistance of digitisation,” says an Investment Director based in Belgium. “R&D teams have been able to make a lot of improvements and are currently focusing on more futuristic assignments that are heavily dependent on digital transformation.”
Not only can companies’ R&D programmes themselves benefit from the introduction of digital processes, but research will inevitably result in evidence of how new, digital products and services can be developed by the company to increase market share and revenues.
There is virtually no element of business that will be untouched by digitisation and respondents recognise this: on average they see notable impacts on purchasing and production; marketing, sales and customer services; and supply chain and logistics.
Detailed Findings
Fig. 62 Do you believe that digitizing portfolio companies will speed up the realisation of the equity story and thus decrease the holding period of the portfolio?
Yes, to a great extent
32%
Yes, to some extent
63%
Stayed the same
5%
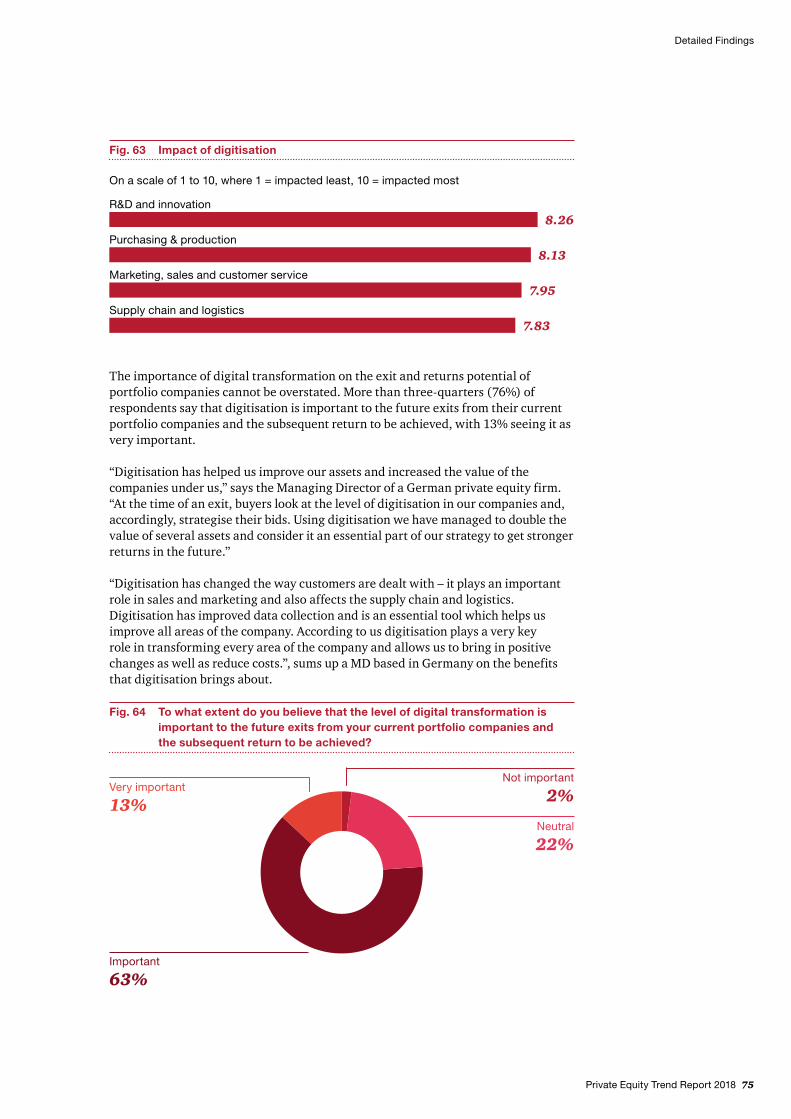
Private Equity Trend Report 2018 75
The importance of digital transformation on the exit and returns potential of portfolio companies cannot be overstated. More than three-quarters (76%) of respondents say that digitisation is important to the future exits from their current portfolio companies and the subsequent return to be achieved, with 13% seeing it as very important.
“Digitisation has helped us improve our assets and increased the value of the companies under us,” says the Managing Director of a German private equity firm. “At the time of an exit, buyers look at the level of digitisation in our companies and, accordingly, strategise their bids. Using digitisation we have managed to double the value of several assets and consider it an essential part of our strategy to get stronger returns in the future.”
“Digitisation has changed the way customers are dealt with – it plays an important role in sales and marketing and also affects the supply chain and logistics. Digitisation has improved data collection and is an essential tool which helps us improve all areas of the company. According to us digitisation plays a very key role in transforming every area of the company and allows us to bring in positive changes as well as reduce costs.”, sums up a MD based in Germany on the benefits that digitisation brings about.
Detailed Findings
Fig. 63 Impact of digitisation
Supply chain and logistics7.83
Marketing, sales and customer service7.95
Purchasing & production8.13
8.26R&D and innovation
On a scale of 1 to 10, where 1 = impacted least, 10 = impacted most
Fig. 64 To what extent do you believe that the level of digital transformation is important to the future exits from your current portfolio companies and the subsequent return to be achieved?
Very important
13%
Important
63%
Neutral
22%
Not important
2%
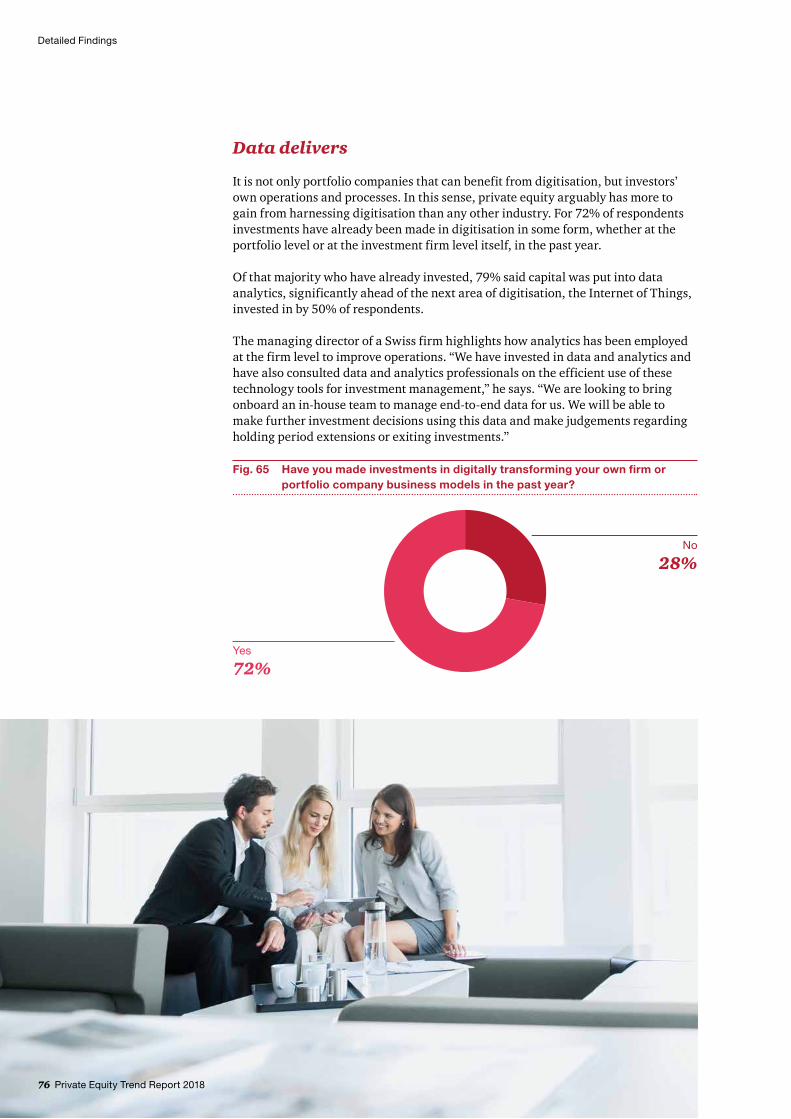
Data delivers
It is not only portfolio companies that can benefit from digitisation, but investors’ own operations and processes. In this sense, private equity arguably has more to gain from harnessing digitisation than any other industry. For 72% of respondents investments have already been made in digitisation in some form, whether at the portfolio level or at the investment firm level itself, in the past year.
Of that majority who have already invested, 79% said capital was put into data analytics, significantly ahead of the next area of digitisation, the Internet of Things, invested in by 50% of respondents.
The managing director of a Swiss firm highlights how analytics has been employed at the firm level to improve operations. “We have invested in data and analytics and have also consulted data and analytics professionals on the efficient use of these technology tools for investment management,” he says. “We are looking to bring onboard an in-house team to manage end-to-end data for us. We will be able to make further investment decisions using this data and make judgements regarding holding period extensions or exiting investments.”
Detailed Findings
76 Private Equity Trend Report 2018
Fig. 65 Have you made investments in digitally transforming your own firm or portfolio company business models in the past year?
No
28%
Yes
72%
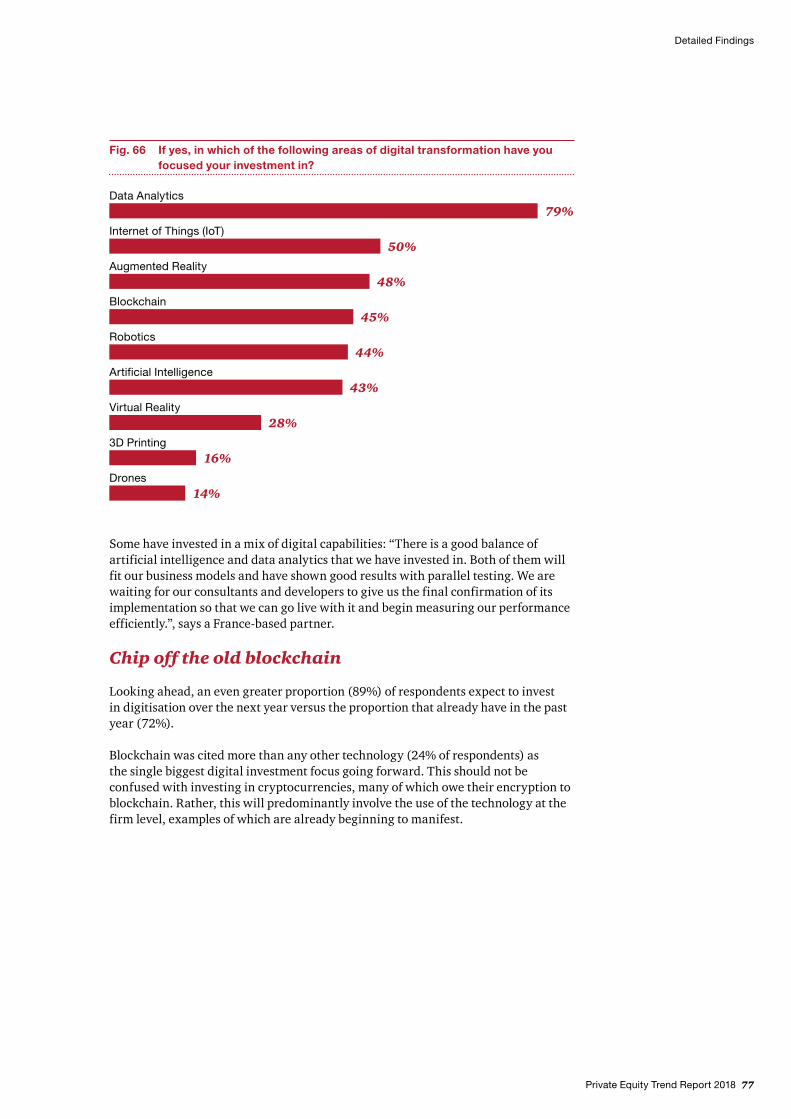
Private Equity Trend Report 2018 77
Some have invested in a mix of digital capabilities: “There is a good balance of artificial intelligence and data analytics that we have invested in. Both of them will fit our business models and have shown good results with parallel testing. We are waiting for our consultants and developers to give us the final confirmation of its implementation so that we can go live with it and begin measuring our performance efficiently.”, says a France-based partner.
Chip off the old blockchain
Looking ahead, an even greater proportion (89%) of respondents expect to invest in digitisation over the next year versus the proportion that already have in the past year (72%).
Blockchain was cited more than any other technology (24% of respondents) as the single biggest digital investment focus going forward. This should not be confused with investing in cryptocurrencies, many of which owe their encryption to blockchain. Rather, this will predominantly involve the use of the technology at the firm level, examples of which are already beginning to manifest.
Detailed Findings
Fig. 66 If yes, in which of the following areas of digital transformation have you focused your investment in?
Drones14%
3D Printing16%
Virtual Reality28%
Artificial Intelligence43%
Robotics44%
Blockchain45%
Augmented Reality48%
Internet of Things (IoT)50%
79%Data Analytics
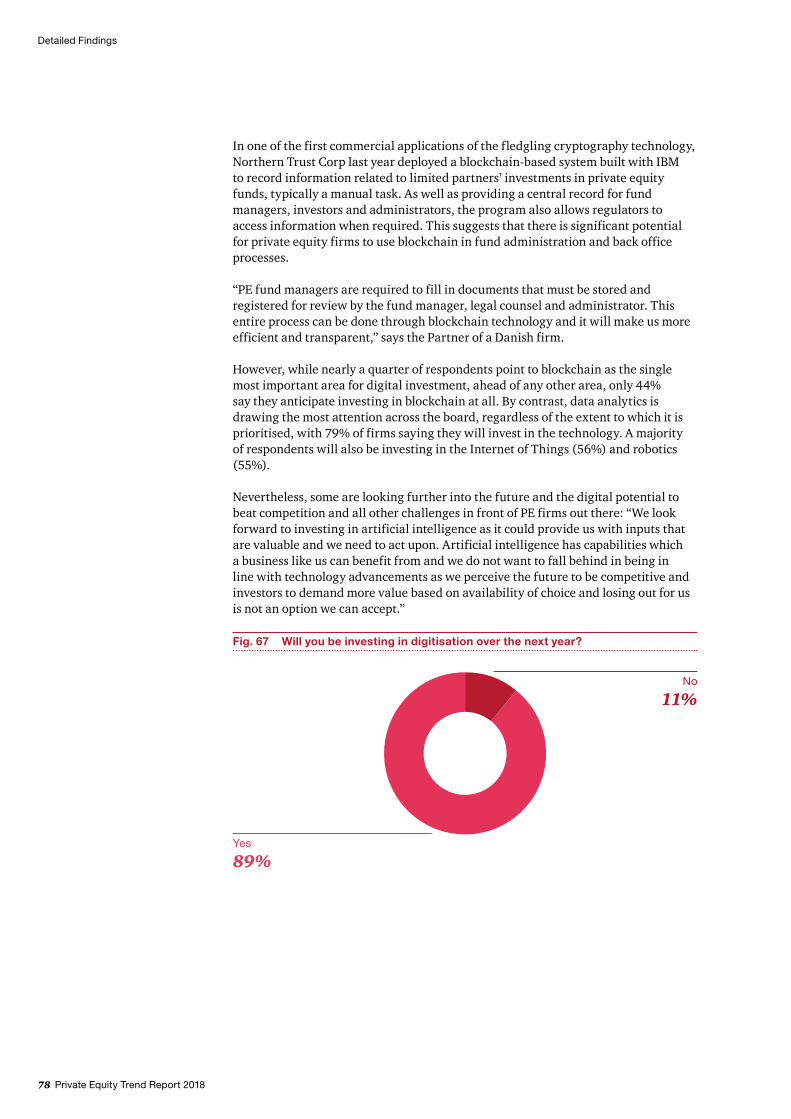
78 Private Equity Trend Report 2018
In one of the first commercial applications of the fledgling cryptography technology, Northern Trust Corp last year deployed a blockchain-based system built with IBM to record information related to limited partners’ investments in private equity funds, typically a manual task. As well as providing a central record for fund managers, investors and administrators, the program also allows regulators to access information when required. This suggests that there is significant potential for private equity firms to use blockchain in fund administration and back office processes.
“PE fund managers are required to fill in documents that must be stored and registered for review by the fund manager, legal counsel and administrator. This entire process can be done through blockchain technology and it will make us more efficient and transparent,” says the Partner of a Danish firm.
However, while nearly a quarter of respondents point to blockchain as the single most important area for digital investment, ahead of any other area, only 44% say they anticipate investing in blockchain at all. By contrast, data analytics is drawing the most attention across the board, regardless of the extent to which it is prioritised, with 79% of firms saying they will invest in the technology. A majority of respondents will also be investing in the Internet of Things (56%) and robotics (55%).
Nevertheless, some are looking further into the future and the digital potential to beat competition and all other challenges in front of PE firms out there: “We look forward to investing in artificial intelligence as it could provide us with inputs that are valuable and we need to act upon. Artificial intelligence has capabilities which a business like us can benefit from and we do not want to fall behind in being in line with technology advancements as we perceive the future to be competitive and investors to demand more value based on availability of choice and losing out for us is not an option we can accept.”
Detailed Findings
Fig. 67 Will you be investing in digitisation over the next year?
No
11%
Yes
89%
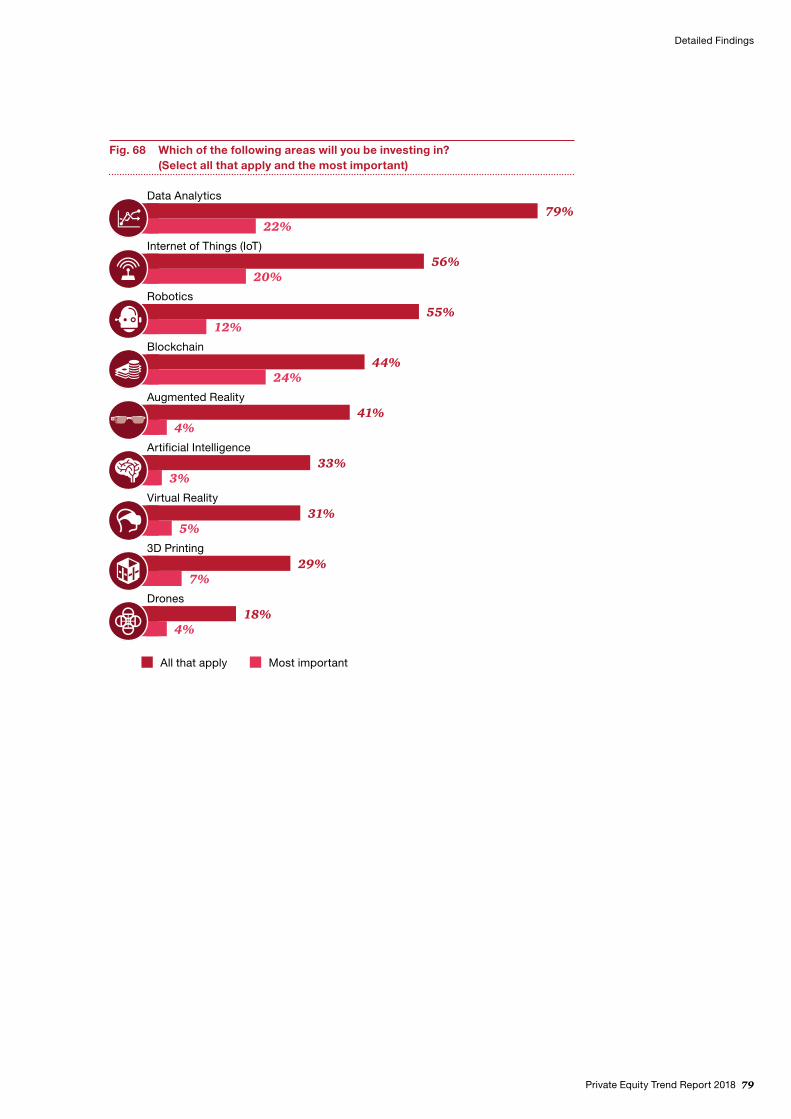
Private Equity Trend Report 2018 79
Detailed Findings
All that apply Most important
Fig. 68 Which of the following areas will you be investing in? (Select all that apply and the most important)
Data Analytics79%
22%Internet of Things (IoT)
56%20%
Robotics
12%55%
Blockchain44%
24%Augmented Reality
41%4%
Artificial Intelligence
3%33%
Virtual Reality
5%31%
3D Printing
7%29%
Drones
4%18%
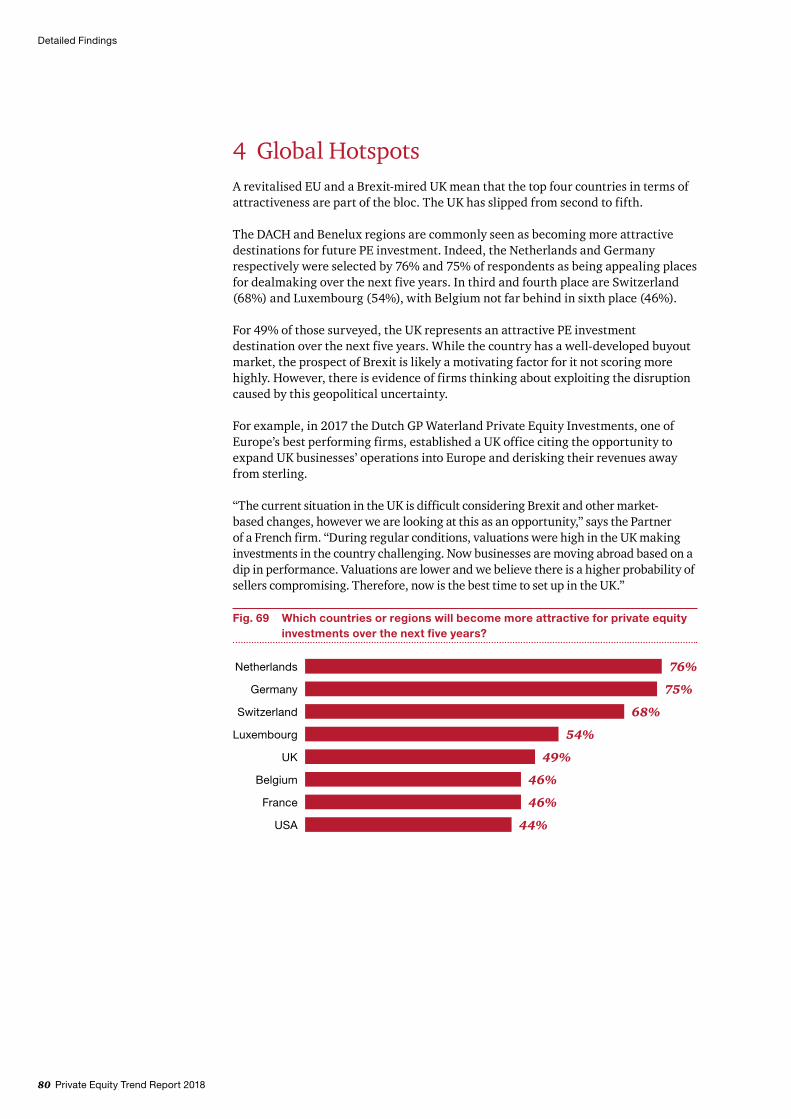
80 Private Equity Trend Report 2018
4 Global HotspotsA revitalised EU and a Brexit-mired UK mean that the top four countries in terms of attractiveness are part of the bloc. The UK has slipped from second to fifth.
The DACH and Benelux regions are commonly seen as becoming more attractive destinations for future PE investment. Indeed, the Netherlands and Germany respectively were selected by 76% and 75% of respondents as being appealing places for dealmaking over the next five years. In third and fourth place are Switzerland (68%) and Luxembourg (54%), with Belgium not far behind in sixth place (46%).
For 49% of those surveyed, the UK represents an attractive PE investment destination over the next five years. While the country has a well-developed buyout market, the prospect of Brexit is likely a motivating factor for it not scoring more highly. However, there is evidence of firms thinking about exploiting the disruption caused by this geopolitical uncertainty.
For example, in 2017 the Dutch GP Waterland Private Equity Investments, one of Europe’s best performing firms, established a UK office citing the opportunity to expand UK businesses’ operations into Europe and derisking their revenues away from sterling.
“The current situation in the UK is difficult considering Brexit and other market-based changes, however we are looking at this as an opportunity,” says the Partner of a French firm. “During regular conditions, valuations were high in the UK making investments in the country challenging. Now businesses are moving abroad based on a dip in performance. Valuations are lower and we believe there is a higher probability of sellers compromising. Therefore, now is the best time to set up in the UK.”
Detailed Findings
Fig. 69 Which countries or regions will become more attractive for private equity investments over the next five years?
USA 44%
France 46%
Belgium 46%
UK 49%
Luxembourg 54%
Switzerland 68%
Germany 75%
Netherlands 76%
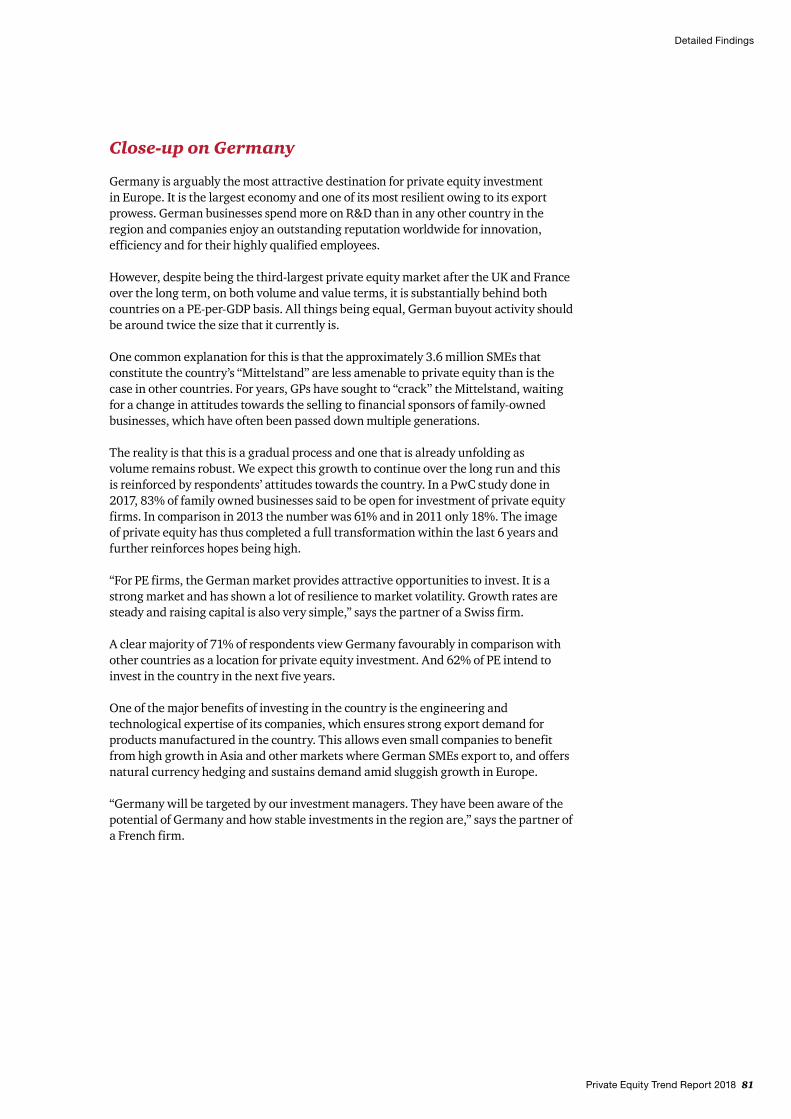
Private Equity Trend Report 2018 81
Close-up on Germany
Germany is arguably the most attractive destination for private equity investment in Europe. It is the largest economy and one of its most resilient owing to its export prowess. German businesses spend more on R&D than in any other country in the region and companies enjoy an outstanding reputation worldwide for innovation, efficiency and for their highly qualified employees.
However, despite being the third-largest private equity market after the UK and France over the long term, on both volume and value terms, it is substantially behind both countries on a PE-per-GDP basis. All things being equal, German buyout activity should be around twice the size that it currently is.
One common explanation for this is that the approximately 3.6 million SMEs that constitute the country’s “Mittelstand” are less amenable to private equity than is the case in other countries. For years, GPs have sought to “crack” the Mittelstand, waiting for a change in attitudes towards the selling to financial sponsors of family-owned businesses, which have often been passed down multiple generations.
The reality is that this is a gradual process and one that is already unfolding as volume remains robust. We expect this growth to continue over the long run and this is reinforced by respondents’ attitudes towards the country. In a PwC study done in 2017, 83% of family owned businesses said to be open for investment of private equity firms. In comparison in 2013 the number was 61% and in 2011 only 18%. The image of private equity has thus completed a full transformation within the last 6 years and further reinforces hopes being high.
“For PE firms, the German market provides attractive opportunities to invest. It is a strong market and has shown a lot of resilience to market volatility. Growth rates are steady and raising capital is also very simple,” says the partner of a Swiss firm.
A clear majority of 71% of respondents view Germany favourably in comparison with other countries as a location for private equity investment. And 62% of PE intend to invest in the country in the next five years.
One of the major benefits of investing in the country is the engineering and technological expertise of its companies, which ensures strong export demand for products manufactured in the country. This allows even small companies to benefit from high growth in Asia and other markets where German SMEs export to, and offers natural currency hedging and sustains demand amid sluggish growth in Europe.
“Germany will be targeted by our investment managers. They have been aware of the potential of Germany and how stable investments in the region are,” says the partner of a French firm.
Detailed Findings
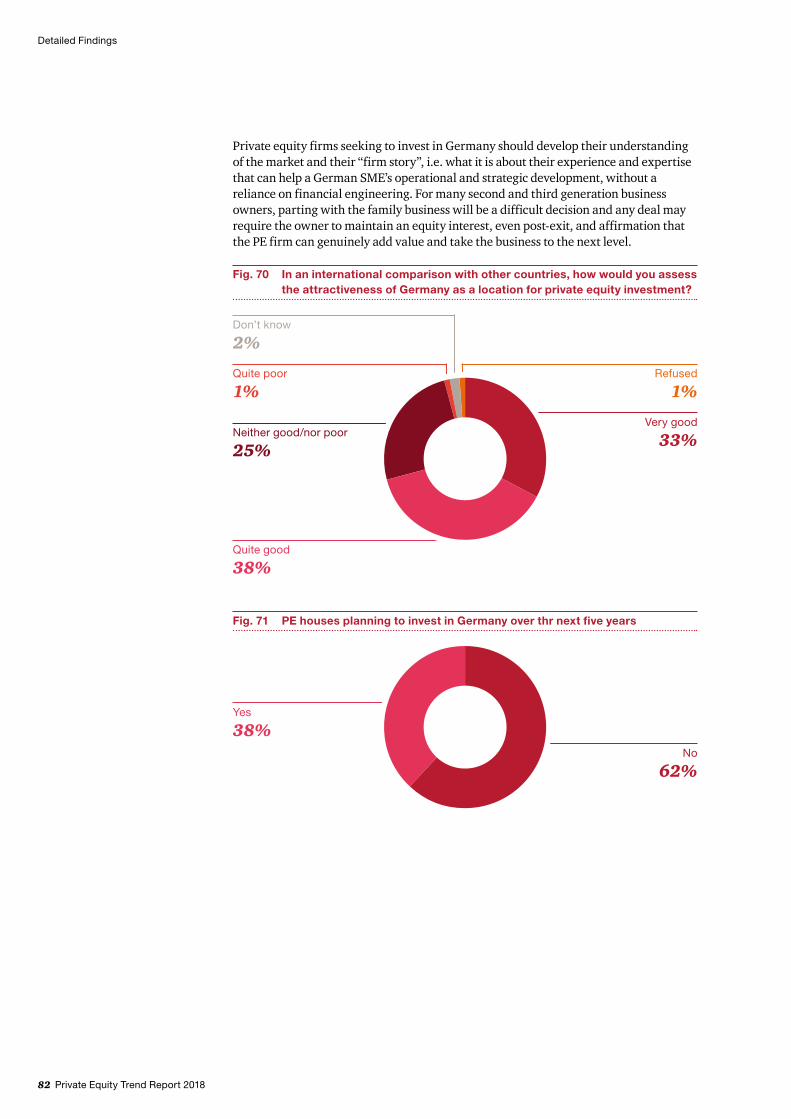
82 Private Equity Trend Report 2018
Private equity firms seeking to invest in Germany should develop their understanding of the market and their “firm story”, i.e. what it is about their experience and expertise that can help a German SME’s operational and strategic development, without a reliance on financial engineering. For many second and third generation business owners, parting with the family business will be a difficult decision and any deal may require the owner to maintain an equity interest, even post-exit, and affirmation that the PE firm can genuinely add value and take the business to the next level.
Fig. 71 PE houses planning to invest in Germany over thr next five years
No
62%
Yes
38%
Detailed Findings
Fig. 70 In an international comparison with other countries, how would you assess the attractiveness of Germany as a location for private equity investment?
Quite poor
1%
Don’t know
2%
Quite good
38%
Neither good/nor poor
25%
Very good
33%
Refused
1%
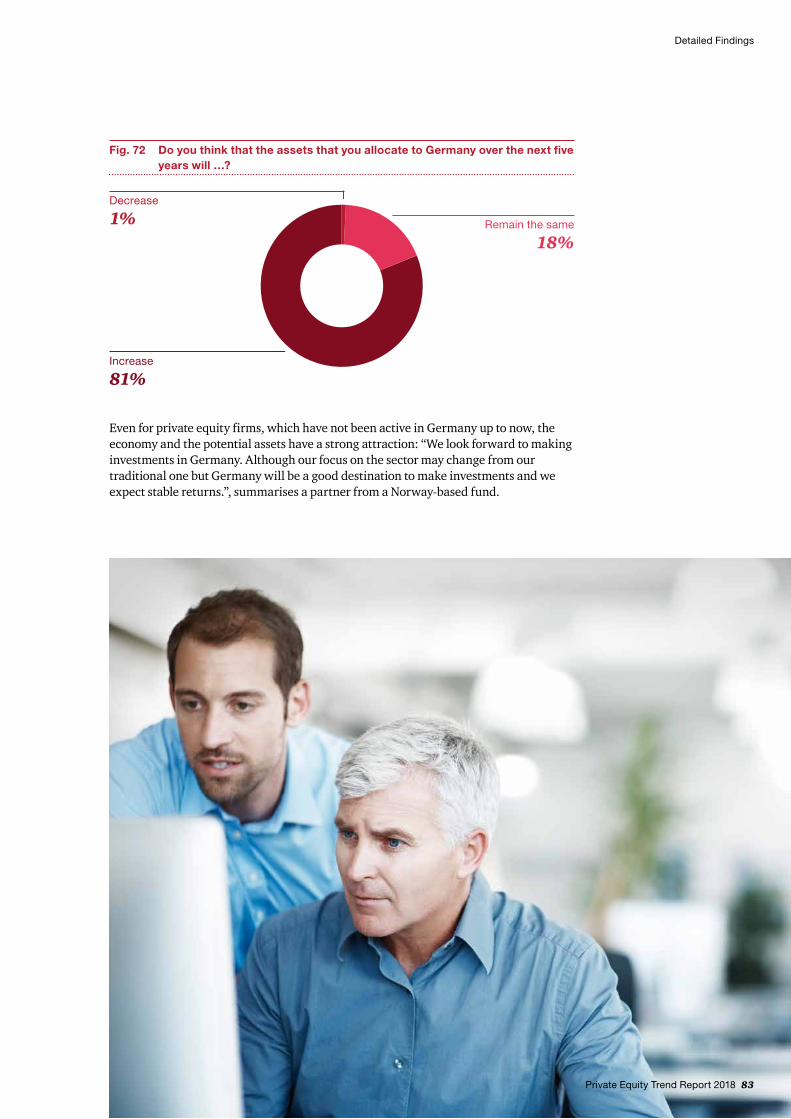
Even for private equity firms, which have not been active in Germany up to now, the economy and the potential assets have a strong attraction: “We look forward to making investments in Germany. Although our focus on the sector may change from our traditional one but Germany will be a good destination to make investments and we expect stable returns.”, summarises a partner from a Norway-based fund.
Detailed Findings
Private Equity Trend Report 2018 83
Fig. 72 Do you think that the assets that you allocate to Germany over the next five years will …?
Remain the same
18%
Decrease
1%
Increase
81%
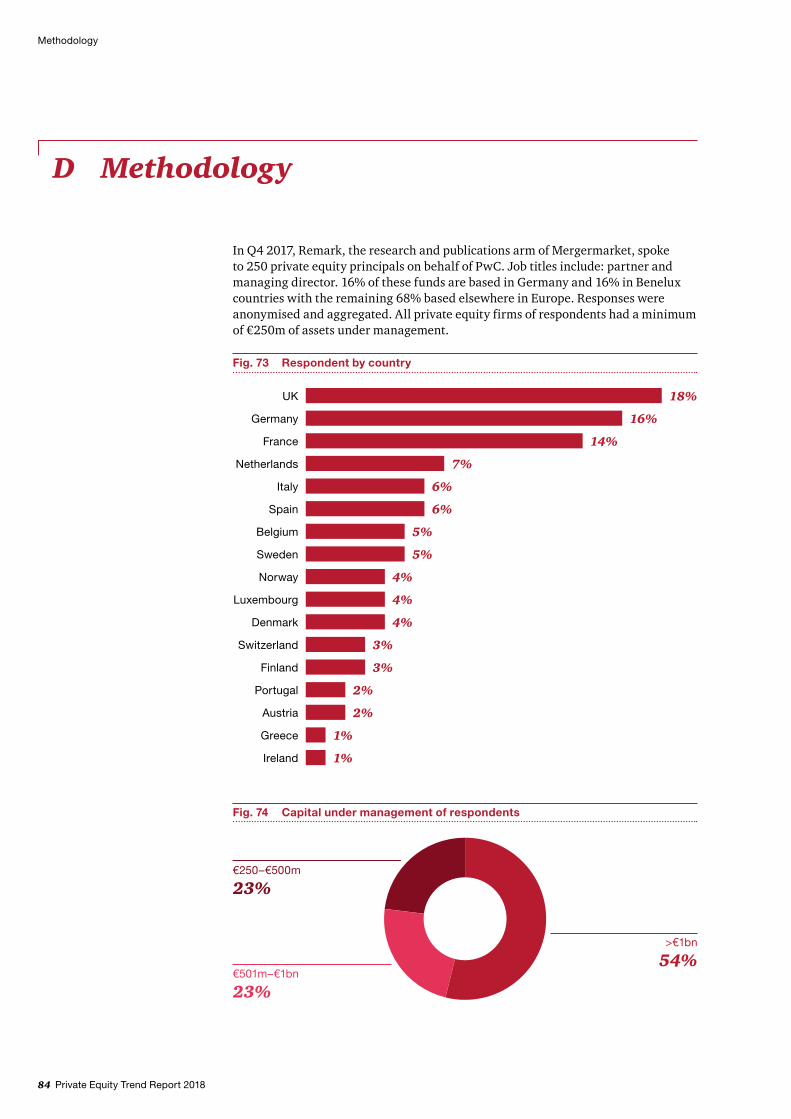
84 Private Equity Trend Report 2018
Methodology
D Methodology
In Q4 2017, Remark, the research and publications arm of Mergermarket, spoke to 250 private equity principals on behalf of PwC. Job titles include: partner and managing director. 16% of these funds are based in Germany and 16% in Benelux countries with the remaining 68% based elsewhere in Europe. Responses were anonymised and aggregated. All private equity firms of respondents had a minimum of €250m of assets under management.
Fig. 73 Respondent by country
18%UK
16%Germany
14%France
7%Netherlands
6%Italy
6%Spain
5%Belgium
5%Sweden
4%Norway
4%Luxembourg
4%Denmark
3%Switzerland
3%Finland
2%Portugal
2%Austria
1%Greece
1%Ireland
Fig. 74 Capital under management of respondents
>€1bn
54%€501m–€1bn
23%
€250–€500m
23%
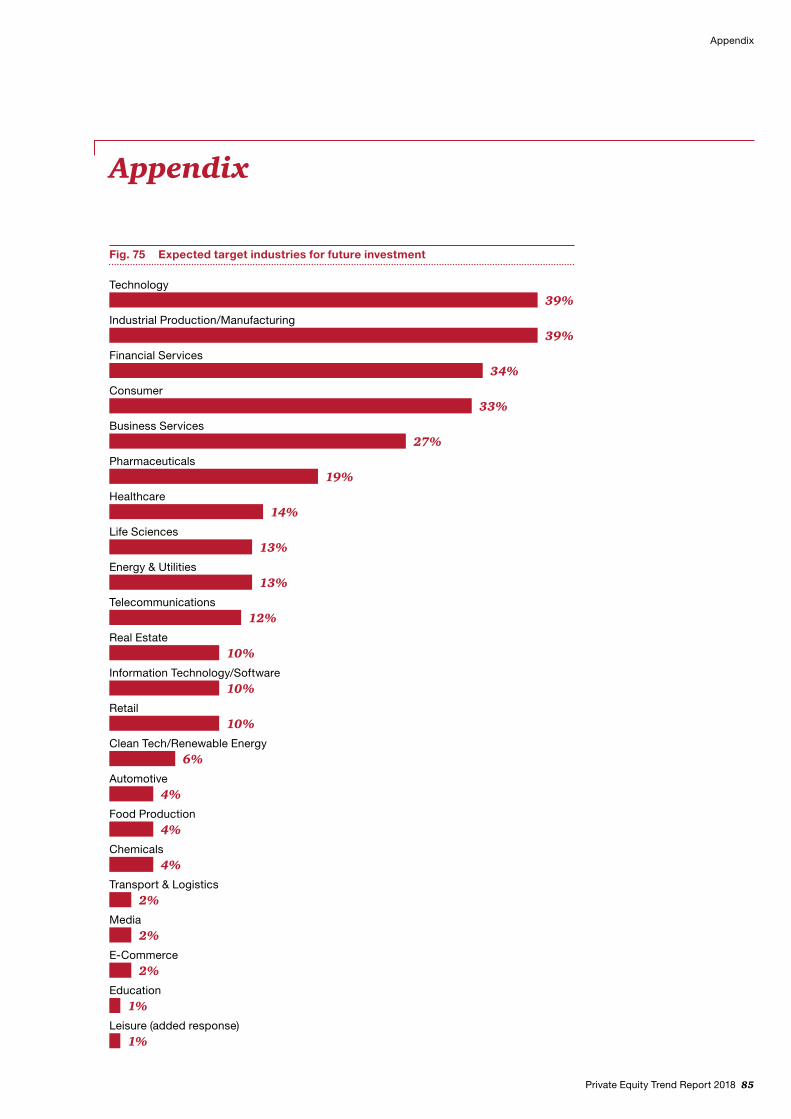
Private Equity Trend Report 2018 85
Appendix
Appendix
Fig. 75 Expected target industries for future investment
Leisure (added response)1%
Education1%
E-Commerce2%
Media2%
Transport & Logistics2%
Chemicals4%
Food Production4%
Automotive4%
Clean Tech/Renewable Energy6%
Retail10%
Information Technology/Software10%
Real Estate10%
Telecommunications12%
Energy & Utilities13%
13%Life Sciences
Healthcare14%
Pharmaceuticals19%
Business Services27%
Consumer33%
Financial Services34%
Industrial Production/Manufacturing39%
39%Technology
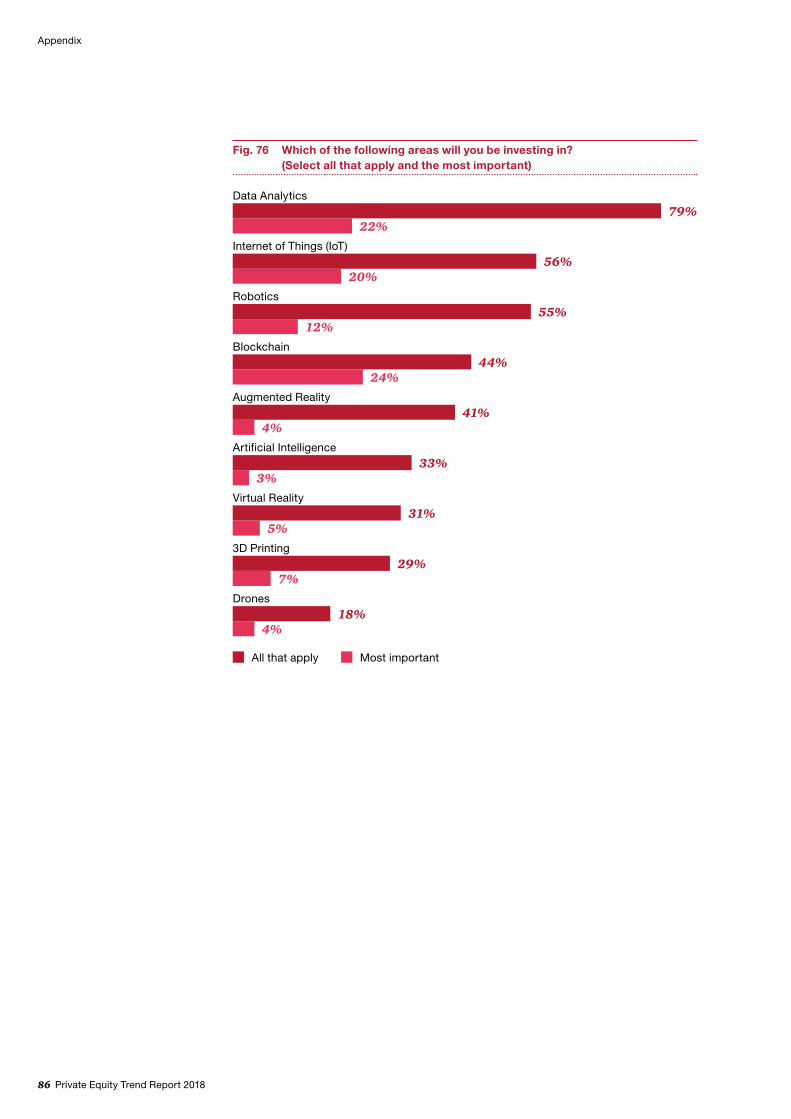
86 Private Equity Trend Report 2018
Appendix
All that apply Most important
Fig. 76 Which of the following areas will you be investing in? (Select all that apply and the most important)
Data Analytics79%
22%Internet of Things (IoT)
56%20%
Robotics
12%55%
Blockchain44%
24%Augmented Reality
41%4%
Artificial Intelligence
3%33%
Virtual Reality
5%31%
3D Printing
7%29%
Drones
4%18%
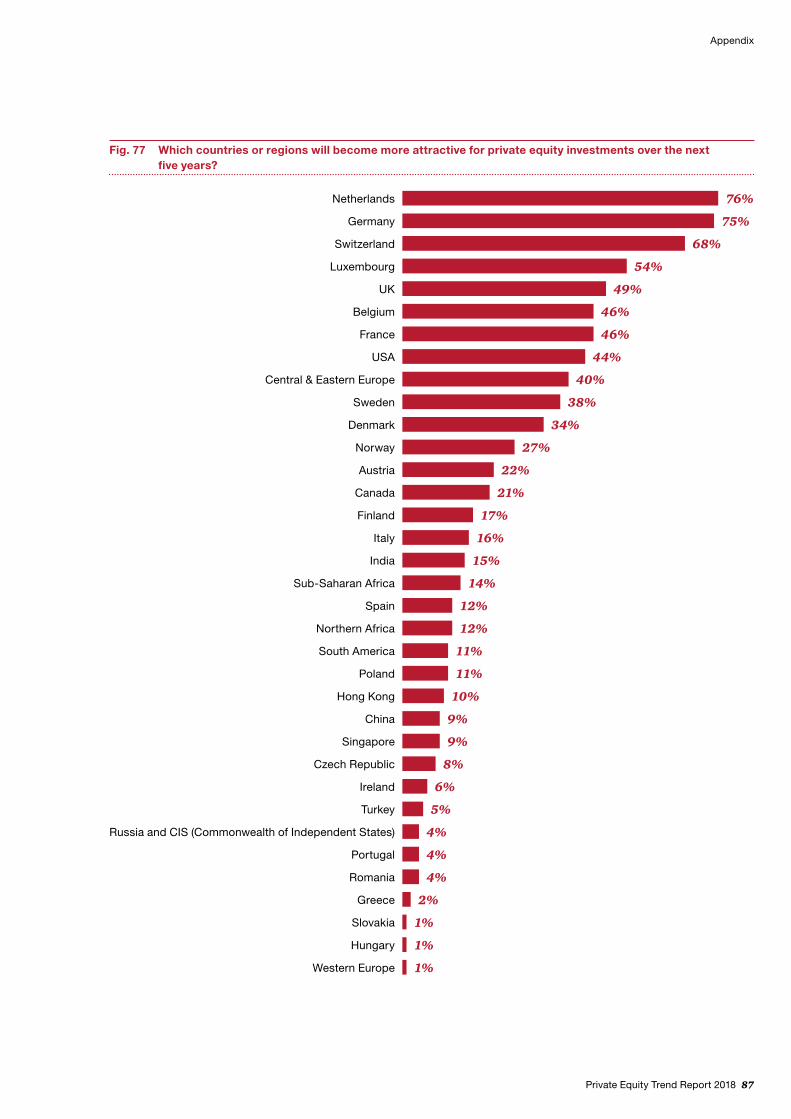
Private Equity Trend Report 2018 87
Appendix
Fig. 77 Which countries or regions will become more attractive for private equity investments over the next five years?
1%Western Europe
1%Hungary
1%Slovakia
2%Greece
4%Romania
4%Portugal
4%Russia and CIS (Commonwealth of Independent States)
5%Turkey
6%Ireland
8%Czech Republic
9%Singapore
9%China
10%Hong Kong
11%Poland
11%South America
12%Northern Africa
12%Spain
14%Sub-Saharan Africa
15%India
Italy 16%
Finland 17%
Canada 21%
Austria 22%
Norway 27%
Denmark 34%
Sweden 38%
Central & Eastern Europe 40%
USA 44%
France 46%
Belgium 46%
UK 49%
Luxembourg 54%
Switzerland 68%
Germany 75%
Netherlands 76%
88 Private Equity Trend Report 2018
List of abbreviations
List of abbreviations
AUM Assets under Management
Benelux Belgium, Netherland and Luxembourg
bn billion
CAGR Compound annual growth rate
CEE Central & Eastern Europe
CEO Chief Executive Officer
DACH Germany, Austria and Switzerland
EBITDA Earnings before Interest, Depreciation and Amortisation
ESG environmental, social and corporate governance
EU European Union
GDP gross domestic product
GP General Partner
IMF International Monetary Fund
IPO initial public offering
LBO leveraged buy-out
LP Limited Partner
m million
M&A Mergers and Acquisitions
MD managing director
PE private equity
Private Equity Trend Report 2018 89
List of abbreviations
Q2 Second Quarter of the Year
Q3 Third Quarter of the Year
Q4 Fourth Quarter of the Year
R&D Research and Development
SEE South Eastern Europe
SME small and medium-sized enterprises
TMT Technology, Media and Telecommunications
UK United Kingdom of Great Britain, Wales and Northern Ireland
US United States of America

90 Private Equity Trend Report 2018
Contacts
Contacts
About usOur clients face diverse challenges, strive to put new ideas into practice and seek expert advice. They turn to us for comprehensive support and practical solutions that deliver maximum value. Whether for a global player, a family business or a public institution, we leverage all of our assets: experience, industry knowledge, high standards of quality, commitment to innovation and the resources of our expert network in 158 countries. Building a trusting and cooperative relationship with our clients is particularly important to us – the better we know and understand our clients’ needs, the more effectively we can support them.
PwC. More than 10,600 dedicated people at 21 locations. €2.09 billion in turnover. The leading auditing and consulting firm in Germany.
Steve RobertsPrivate Equity LeaderTel: +49 69 [email protected]
Klaus SchmidtPrivate Equity Tax LeaderTel: +49 89 [email protected]
Elena NaydenovaHead of Private Equity Business DevelopmentTel: +49 69 [email protected]
Thomas TilgnerPrivate Equity Audit LeaderTel: +49 69 [email protected]
Klaus BernhardPrivate Equity Assurance LeaderTel: +49 711 [email protected]