PRIVATE CAPITAL FLOWS TO SUB-SAHARAN AFRICA
54
, PRIVATE CAPITAL FLOWS TO SUB-SAHARAN AFRICA A Supply-Side Study by External Finance for Africa Stephany Griffith-lones Nils Bhinda and Matthew Martin March 1997
Transcript of PRIVATE CAPITAL FLOWS TO SUB-SAHARAN AFRICA

,
PRIVATE CAPITAL FLOWS TO SUB-SAHARAN AFRICA
A Supply-Side Study
by External Finance for Africa
Stephany Griffith-lones Nils Bhinda
and
Matthew Martin
March 1997

'.
CONTENTS
1. Introduction
2. The Scale of Private Flows to SSA
3. FDI Flows to SSA
4. Bank Flows to SSA
5. Portfolio Flows to SSA
6. Credit Ratings and SSA
7. Conclusions and Recommendations
References
BOXES 3.1 Why Japanese FDI to Africa Remains Small 3.2 FDI in Mining and Oil 5.1 Changing Investor Perceptions of South Africa 5.2 The Role of the Commonwealth Developoment Corporation 6.1 Methodologies of the Raters
TABLES
1
3
5
17
21
33
47
51
6 15 27 31 35
2.1 Private Capital Flows to Sub-Saharan Africa 4 5.1 SSA Funds, and Exposure to Some Global Funds 23 5.2 Net Foreign Purchases of South African Equities 27 5.3 Country Distribution of Simba Fund (October 1996) 28 6.1a Institutional Investor's Sovereign Ratings and Rankings for the Project Countries 55 6.1b Euromoney's Sovereign Ratings and Rankings for the Project Countries 55 6.1 c EIU's Sovereign Ratings for the Project Countries 56
GRAPHS 6.la South Africa's Ratings 6.lb Tanzania's Ratings 6.1c Uganda's Ratings 6.1d Zambia's Ratings 6.1e Zimbabwe's Ratings 6.2a Institutional Investor Ranks (Percentile of Sample) 6.2b Euromoney Ranks (Percentile of Sample)
43 43 44 44 45 46 46

1
1. INTRODUCTION
This study is part of a larger project (Martin et al, 1996) analysing private capital flows to SubSaharan Africa, sponsored by the Swedish and Danish governments, and conducted in collaboration with five African governments (South Africa, Tanzania, Uganda, Zambia and Zimbabwe).
This project comes at an important time for African countries for three major reasons: 1. Many SSA countries are aid dependent and need to raise capital through private charmels; 2. Some SSA countries are already receiving much higher private capital flows than
international data suggest; I 3. Recent experiences in other parts of the world show that large flows of private capital can
be a major cause of macroeconomic instability.
The country teams will be focussing on analysing SSA-based or "demand" factors: o scale and composition of flows - broken down according to type; o causes and sustainability of the flows - internal and external factors, and the importance
of domestic policy reform relative to transitory changes in international interest rates; o macroeconomic impact - the effects of flows on exchange rate; imports and the current
account; consumption, savings and investment; financial market volatility, and aid flows; o policy measures to influence the scale and composition of inflows.
This study looks at the "supply" side - international factors and perceptions of trends in recipient economies, which have a major influence on the flows. It is based on interviews with many major UK-based providers of private capital, and with analysts in international institutions; and international literature.
Chapter 2 looks at the scale of private flows to SSA, and analyses international data sets. The rest of the paper deals with each type of flow in order of scale and importance. Thus Chapter 3 looks at FDI, Chapter 4 at bank lending, Chapter 5 at portfolio flows, and Chapter 6 at bonds and credit ratings agencies. Chapter 7 presents conclusions and recommendations.
This paper is intended as a preliminary draft, to which we welcome comments. The authors are responsible for any errors and omissions herein.
We are most grateful to Sida and DANIDA for funding the project, of which this study is a part.
1 Demonstrated in a recent study by Kasekende, Kitabire and Martin (1996).
EFA - Private Capital Flows to Sub-Saharan Africa: A Supply-Side Study

3
2. THE SCALE OF PRIVATE FLOWS TO SSA
Data on private capital flows to Sub-Saharan Africa are notoriously poor. This not only causes problems for analysis, it also affects decision-making on necessary economic action by government, donors, and the IFIs.
Table 2.1 shows the largest flows since 1988 have been FDI, followed by bank flows, portfolio flows, then bonds. Trends in each of these components are looked at below.
FDI2 UNCT AD shows FDI to SSA peaked at US$3 billion in 1994 after a fairly steep rise from 1990, with flows stagnating in 1995. Flows to SSA have not been rising as fast as those to other regions however. For Africa as a whole, its share of total FDI to developing countries fell from 5.8% in 1994 to 4.7% in 1995, and has been declining over time. The downward trend for SSA is even greater, as ''North African countries, which in 1980 accounted for a mere 12% of total stock in Africa, have substantially improved their position, accounting for more than 30% in 1993"3.
BANK IMF data reveals net private bank flows (ML T) peaked in 1988 and 1989, and later in 1992, but the pattern has been a downward one. However, they remain largely positive over the period.
PORTFOLIO World Bank data shows portfolio flows have not only been increasing over time, but are the fastest growing source of private capital (although 1995 Bank data showed a decline on 1994).
BONDS World Bank data shows these flows to be volatile, and largely negative over time. The largest outflow occurred in 1993, and inflow in 1994.
The final version of this paper will compare the various data sets for each type of flow to give an impression of total flows by source. It will incorporate up-to-date data from IMF's Balance of Payments Statistics, and OECD / BIS data for bank flows. Also it will include a box on the problems of the various data sets. We are already aware that international data sets disagree radically with the data provided by the countries themselves. The final version of this paper will thus also compare country data with international data. The rest of this paper deals with each type of flow in tum, in order of scale.
2 There are two main defmitions ofFDI. The Balance o/Payments Manual (1977, (993) of the IMF defines it as an investment made to gain a lasting interest, and an effective voice in the management of an enterprise operating outside the countJy of the investor. This entails a minimum equity stake of 10%. FDI flows therefore include equity capital, reinvestment of earnings, and intra-company loans. The OECD's Detailed Benchmark Definitions 0/ FDI (1992) defines it as ownership of I ()OAt or more of the ordinary shares or voting power of an enterprise by a single foreign investor. This is a guideline however: it may be more or less, provided it enables an effective voice in management (although not necessarily absolute control).
3 UNCTAD World Investment Report 1996 Overview, page 8.
EFA - Private Capital Flows to Sub-Saharan Africa: A Supply-Side Study

4
Table 2.1 PRIVATE CAPITAL FLOWS TO SUB-SAHARAN AFRICA
1988 1989 1990 1991 1992 1993 1994 1995
FDI (net) 11S2 1876 1487 1796 2988 2899
Bank (ML T net) 1500 1600 800 500 1100 -400 800 200
Portfolio (equity) 0 0 0 0 144 144 860 465
Bonds -1009 -249 -941 -462 88 -1571 795
SOURCES:
FDI data is from UNCTAD World Investment Report 1996, calculated as: SSA = Africa - North Africa + South Africa
Bank data is from IMF World Economic Outlook, Table A34.
Portfolio and bond data is from the World Bank's World Debt Tables 1996, Volume 1, p216.
EFA - Private Capital Flows to Sub-Saharan Africa: A Supply-Side Study

5
3. FDI FLOWS TO SSA "Efforts to invest in SSA have not been successful because it is going against the tide: Africa gets negative press. Why invest in Africa when you can invest in China, Taiwan, or Korea? II
Chairman of a British manufacturing association to Africa (10/96).
HAlthough several countries in Africa have an investment climate that is good, a number of potential investors lump them together with other countries, and see them as part of a continent that is considered not to he attractive for TNCs, especially if compared with competing locations in the worldwide FDI market. As one recent stud;} put it, Jor most multinational corporations, Africa is the forgotten continent '". UNCT AD, FDI in Africa (1995)
1. INTRODUCTION International data indicate that the FDI boom to developing countries has avoided Africa, in spite of far-reaching reform by several African governments to make their economies more attractive to foreign investors. However, FDI has been the largest type of flow to Africa (Table 2.1).
The bulk of FDI inflows are concentrated in a few oil exporting countries: 61 % of the average annual inflows to SSA went to Nigeria between 1993-95. However, inflows to all of Africa are not as concentrated as they once were. Southern Africa's share of Africa's inward stock declined from 64% in 1980 to less than 24% by 1995, mainly due to disinvestments from South Africa during the apartheid era, and the increased attractiveness of North Africa to European investors.
UNCTAD data shows the importance of FDI varies from country to country, according to indicator used. For example, while Nigeria is among the largest recipients in Africa, the ratio of FDI inflows to gross domestic capital formation and the ratio of Fin stock to GDP are very small. On the other hand, Equatorial Guinea, Namibia, the Gambia and Sierra Leone receive relatively small amounts in absolute terms, but the FDI flow / GFCF and FDI stock / GDP are high. At the end of the 1980s two thirds of UK equity involvements were in Kenya, Nigeria, and Zimbabwe. Thus, UK disinvestment has also been concentrated in these countries. The most significant disinvestment has been from Nigeria, when Unilever sold most of its 40% stake in the United Africa Company in 1994.
However, current data on FDI to SSA may be gross underestimates due to misrecording, miscategorisation and omission of non-OECD source countries. Also, FDI may be booked in the UK, Bennuda, or elsewhere, while the money itself flows to SSA. There is thus great scope for improving the monitoring and recording of data especially for SSA.
This section examines motivations and barriers to FDI, which can be studied on several levels:
o international: investment advice and assistance from bodies such as the IFC and the CDC; international investment treaties; global trends in firm strategies.
o regional: regional image; South African spillover effects; and the regional market. o national: non-policy issues such as market size, labour costs and productivity, and
EFA - Private Capital Flows to Sub-Saharan Africa: A Supply-Side Study

6
infrastructure; and policy issues such as foreign exchange liberalisation, exchange rate policy, privatisation, deregulation and the impact of structural adjustment.
o sector: issues include land laws for agriculture, and how strategic sectors such as oil and mining can overcome problems faced by smaller enterprises.
In each of these categories, investor perceptions of the region are critical, as it is perception rather than reality which guides decision-making. This section sheds light on their accuracy. We found that misperceptions arose from ignorance of the region, due to sensationalist press stories, sometimes including outright racial stereotypes. Such views undermine FDI to Africa, regardless of African policy-makers' successes in implementing positive reform.
2. INTERNATIONAL LEVEL
As with global FDI, FDI to Africa has recently undergone a diversification in source countries. France, Germany, Italy and the UK, traditionally the largest investors, are being joined by Belgium, while the US share has declined from 32% in 1985 to 25% in 1993. However, in contrast to Latin America and Asia, investment by Japan remains small (Box 3.1).
Box 3.1: Why Japanese FDI to Africa Remains Small Japan accounted for 11 % of global FDI stock in 1995. Yet, excluding Liberia, Africa accounted for only 0.2% of Japan's FDI stock as of March 1996, and 0.1% ofFDI outflows4
• According to the UN's World Investment Report 1996, Japan is discouraged by SSA's small populations, low purchasing power, costproductivity configurations, and economic performance. Its lack of involvement is reflected in the following features:
o only 85 of 5500 trading companies organising Japanese FDI are based in Africa, and they generally lack strong networks, knowledge, and experience.
o only 12 of 1150 Japanese banking affiliates are in Africa: Japanese TNCs tend to use their own banking affiliates in countries with underdeveloped domestic financial sectors.
o only 8 of 79 Japan External Trade Organisation offices aiding Japanese firms, are in Africa.
o linkage with ODA is weak. Africa receives 10% of Japan's ODA, but this is largely for humanitarian and human needs, and has not stimulated Japanese FDI. This is unusual as Japanese policy tends to promote links between public and private sectors. Thus, 58% of its ODA to Asia in 1993 went to loans to build economic and social infrastructure.
o Trade relations are weak: in 1990-94, Africa bought only 1.2% of Japanese exports.
o Other regions have similar resources. Cheap and relatively skilled labour is available in neighbouring Asian countries, and Japan is also familiar with Asia's business culture.
o Psychological distance with Africa remains great in spite of improved communications. Unfamiliarity is a major drawback: "cultures do not fit.together", said one investor.
o Lower transportation costs are another important incentive for Japan to favour Asia.
Source: UNCTAD World Investment Report 1996, pp48-50.
4 Liberia distorts Japanese FDI to Africa, as virtually all its investment is motivated by Liberia's status as a tax haven.
EFA - Private Capital Flows to Sub-Saharan Africa: A Supply-Side Study

7
Secondly, SSA is not an important recipient for any major OECD economy. While the UK is a major investor in SSA, its investments account for only 0.5% of UK manufacturing investment overseas. In other OECD countries, FDI to SSA does not exceed 10%.
Thirdly, due to disinvestment by many companies in the 1980s, OECD investment has until recently become more concentrated in the hands ofa few. In 1989,90 British companies had 336 equity involvements in SSA. By 1994 involvement had fallen to 65 in 233 manufacturing companies. Over this period, 70% of all manufacturing FDI was controlled by 20 companies.
Role of the International Financial Institutions aFI)s IFIs such as the Commonwelth Development Corporation (CDC), the International Finance Corporation (IFC), the European Investment Bank (EIB) and the Multilateral Investment Guarantee Agency (MIGA) are important in initiating and supporting equity investments in SSA. o The IFC's target activities in the 1990s are privatisation, capital market development,
infrastructure, large-scale projects, and lending and technical assistance to SMEs. It gives enterprises access to sophisticated financial instruments such as interest rate and currency swaps, and fund mobilisation techniques. It targets small businesses through its African Enterprise Fund, and with the UNDP and AIDB the Africa Project Development Facility, and the African Management Services Company.
o The CDC provides loan and equity capital for development projects and provides management experience. Since 1985 it has focussed more on investment in industry to the detriment of natural resources, and entering into joint ventures with UK companies.
o MIGA encourages private investment to developing countries by guaranteeing investments against currency transfer, expropriation, war, civil disturbance, and breach of contract by the host government.
Many investors see these organisations as a comfort and support to operations. But one questioned their validity on grounds of their inability to influence local infrastructure, and ensure competition on equal terms with the local business community.
International Treaties S
SSA government efforts to establish a favourable FDI environment are reflected in the number of bilateral investment treaties signed with capital exporting (mainly developed) countries, to promote and protect FDI., By June 1996, 258 such treaties had come into effect in Africa, covering general standards of treatment including national and most-favoured-nation treatment; the transfer of payments and repatriation of profits and capital; losses due to armed conflict or international disorder; nationalisation and expropriation; and dispute settlement.
Of our project countries South Africa has signed treaties with Cuba, France, Germany, India, the Republic of Korea, the Netherlands, Switzerland and the UK; Tanzania with Germany, the Netherlands, Switzerland and the UK; Uganda with Egypt, Germany, the Netherlands and Switzerland; Zambia with Germany and Switzerland, and Zimbabwe with Germany, Portugal
5 UNCTAD World Investment Report (1996) pp.61, 63; FDI in Africa (1995).
EF A - Private Capital Flows to Sub-Saharan Africa: A Supply-Side Study

8
and the UK. However, the number of treaties for SSA lags far behind other regions.
Multilateral treaties send the same signals. In particular, all project countries are members of the Multilateral Investment Guarantee Authority (MIGA), the International Convention on the Settlement of Investment Disputes (lCSID), and the Convention for the Protection of Industrial Property. Tanzania, Uganda, and Zimbabwe are members of the Convention on Recognition and Enforcement of Foreign Arbitration Awards.
Global Corporate Restructurinr Trends On a global level, for a mixture of reasons many large finns are increasingly concentrating on core activities and discarding diversified projects. This is because focussing on core areas is more profitable. Unilever is an example; its restructuring in 1994 resulted in large disinvestment from Nigeria by selling UAC's operations in textiles, timber, air conditioning, and car assembly. Similarly Anglo-American's planned restructuring will scale down non-mining interests in South Africa, which were built up during the apartheid era. But interestingly, with improving relations between South Africa and the rest of Africa, it will be expanding mining activities there, as well as in other parts of the world. Such finns stress that they are not pulling out of Africa, although according to Bennell there has been a marked withdrawal from Anglophone SSA in the case of British manufacturing. But globally, corporate restructuring means resources are to be reinvested in particular sectors, whether in SSA or elsewhere, and region is not the deciding factor.
3. REGIONAL LEVEL South Africa spillover e(fects Since its peaceful transition to democracy, South Africa is seen as a positive regional influence. All investors expect South Africa to take the lead in SSA, especially Southern Africa. It has the best infrastructure, a well developed banking system and is seen by many investors as having the sophistication of a first world economy. Potentially, it can attract significant amounts ofFDI, and many South African companies are seeking to expand into other African countries6• South Africa is rapidly taking over the sub-region in banks, brewing, food processing, textiles, and footwear.
As many larger companies feel other SSA markets are too small (see section 4) and lack the financial infrastructure and domestic savings, there may be positive spillover effects from South Africa. However, South Africa may also cause problems for smaller countries. Businesses may relocate there as cross-border trade becomes increasingly unfettered, and it can provide large scale-efficiencies that allow production for the rest of SSA. Similar factors may encourage investment in Zimbabwe. Investors are also optimistic about an East African free trade area and the Cross-Border Initiative. But again, benefits may concentrate in the economically stronger states'. However, regional cooperation will not be feasible if trade finance and export credits remain in short supply.
6 Riddell and Cockcroft (1991); UNCTAD World Investment Report 1996, pp. 96-98.
, Riddell and Cockcroft (1991) p.146
EFA - Private Capital Flows to Sub-Saharan Africa: A Supply-Side Study

9
4. NATIONAL LEVEL
1) NON-POLICY Important non-policy factors affecting FOI on a national level are:
o Low Income (GOP per capita). Many products are beyond the means of poor people but, as one soap producer pointed out, there are some goods everybody has to use. There are opportunities for investors who concentrate on goods a poor population will use.
o Market Size (GOP or population size). Many investors feel most SSA countries (except South Africa and possibly Nigeria) have domestic markets which are too small. This means high infonnation costs relative to potential sales, which reduce margins, and limits expansion. Given other economic and political problems, most doubt the worth of installing a factory unless they can achieve "critical mass" by access to regional markets.
o Poor Infrastructure. This is less frequently cited as a major problem. Though all see much room for improvement in some countries, perceptions vary. All see South Africa as having excellent infrastructure; some added Zimbabwe and Zambia to this category. Another issue raised was port traffic - congestion could cause problems through delays.
o Labour Cost and Productivity. All interviewees felt that labour productivity is low relative to other parts of the world. Though cheapness makes it "good value" for plantations, "labour is cheaper in Asia, especially China - and Asia has a longer history of education and better organised factories". Many put low productivity down to "cultural factors", expressed patronisingly by Sebastian Hobhouse of Plantation and General Investments PLC: unlike workers in the Far East who are "prepared to work long and hard, Africans are perfectly happy falling asleep under a mango tree and leading a subsistence life". Others suggested that it depended on skills training: Zimbabwe was cited as having a highly-skilled workforce.
o Expatriate Emplovment. Many UK companies overcome skills gaps by employing expatriate managerial and technical personnel in their subsidiary and associate companies. Plantation and General for example employ local managers in Zimbabwe, but expatriates in Tanzania. Of course expatriates cost more, and can be difficult to hire if legislation hinders work pennits. Yet the number of expatriates employed by UK companies in Africa actually increased between 1989 and 1993. This reflected the need for more intensive management in a rapidly deteriorating business environment, the outmigration of local managers, and the liberalisation of legislative restrictions.
o Unionisation. Strong labour unions deter investors, particularly in South Africa. Yet, while many UK investors are worried, those with greater regional experience feel this is not a problem, because unions are adopting more pragmatic and conciliatory approaches.
EF A - Private Capital Flows to Sub-Saharan Africa: A Supply-Side Study

10
2) POLICY The second group of national factors revolve around government policy. o Access to Foreign Exchange. Foreign exchange shortages due to debt, aid shortfalls,
tenns of trade shocks, and delays or restrictions on remittances, put pressure on exchange rates, leading to devaluation. This could imply low sterling rates of return to parent companies over protracted periods, which is seen as the main reason for UK disinvestment from SSA in the 1980s.
However, this may also reflect perception rather than reality. During 1985-90, rates of return improved in many sectors. According to the CSO, the share of net earnings from UK manufacturing investments in Africa remitted each year was well above the global average8
• Also, forex restrictions have largely been lifted in our project countries, including for non-residents in South Africa. Interviewees suggested that this encourages finns to invest more in those countries. Plantation and General for example, invest more in Zambia or Kenya for this reason.
Many favour removal of foreign exchange controls through a "big bang", rather than gradualism. Several however privately sympathise with gradualism in the South African case, due to insufficient foreign exchange reserves. On the other hand it seems that most parent companies want to remit a much higher proportion of their profits from SSA than from other regions, as they see fewer new manufacturing investment opportunities.
o Exchange Rates. Depreciations reduce the forex value of remittances and make imported inputs relatively more expensive. For many British subsidiaries in Anglophone SSA, the sterling value of production declined greatly between 1989 and 1994. Devaluations were therefore a major concern for all investors: "large margins are required to survive shocks such as devaluation and instability which erode the market". A major manufacturer in Anglophone SSA said that if the South African Rand continues to slide, while for example the Indonesian currency does not, his head office would invest in Indonesia.
o Privatisation. Privatisation is used by TNCs as an entry point into host country markets, to gain a foothold in a particular industry or sector. Privatisation in SSA- has been below the developing world average9
, with the exception of Ghana (due to the sale of Ashanti Goldfields in 1994), Zimbabwe and Benin. Programmes are characterised by initial sales of large utilities (telecoms, water, electricity, and sometimes transport), with a focus on foreign participation. However, outside South Africa there is not much else in manufacturing to privatise. Also, several countries are reluctant to hand certain industries over to foreigners, for strategic reasons. This denies foreign investors equal access. Other factors relate to the fact valuation of companies can take a long time, procedures are often not transparent to foreign bidders, and programmes stagnate due to lack of buyer interest.
8 Bennell, 1995; 1990.
9 UNCTAD World Investment Report 1995.
EFA - Private Capital Flows to Sub-Saharan Africa: A Supply-Side Study

11
o Dererulation. Restrictive investment codes have been revised in all our project countries, and across SSA. This has increased the speed of decision making, ended payment of commissions, and established one-stop investment centres to overcome bureaucratic delays and bottlenecks.
New codes have been wannly welcomed by all investors. However, a study suggests that some one-stop centres have become merely an extra level ofbureaucracyJo. They can delay the screening of potential investments for financial viability due to lack of expertise, or can make discretionary decisions which introduce new inefficiencies. It is vital therefore, that they demonstrate transparency and consistency.
Problems can also arise if new investment codes contradict existing legislation on FDI (often from the colonial period), or when new codes are overseen by new investment centres, while old and conflicting laws are monitored by traditional ministries. Investment may then depend on the relative influence of these agencies, and delay may give the impression of a lack of transparency. All investors interviewed continue to see government intervention as a hindrance. As one investment advisor put it, "the only advice to African policy makers is to read Adam Smith: governments should worry only about peace, low taxes, and a tolerable administration of justice".
o Investment Promotion Missions. Most interviewees supported government investment promotion missions to generate funds for particular sectors, They stressed that missions must be effectively designed to help the investor. This entails examining specific proposals and detailed preconditions for participation, and helping investors fight their way through bureaucratic and administrative headaches such as work permits or telephone lines. One crassly remarked that "all missions do is enable Africans to travel around the world first class", but this was an exception to general opinion.
Another suggested that investment promotion and advice could be run privately through the local banking system. Banks would be rewarded on the basis of demonstrated results via taxes or incentives and fees, possibly using donor financial support. Naturally this requires a well developed banking sector. It would therefore be more appropriate in South Africa and Zimbabwe and possibly Zambia and Uganda. It also entails a degree of selfregulation by the banks, as "state interference is the biggest problem". Interestingly, it was implied that banks could take a longer term view than government: "a typical minister of finance has no time for long-term thinking due to World Bank-IMF hassles".
o Overall Effeets orStruetural Adjustment. While investors often cite a programme with the IMF or World Bank as a sign of stability and intent to reform, this is not reflected in UK manufacturing FDI to Anglophone SSA. In recent years, the relationship between this and a country's economic performance as judged by the World Bank, has been negative. Investment has grown fastest to countries with a deterioration or marginal
JO UNCTAD (1995) FDJ in Africa.
EFA - Private Capital Flows to Sub-Saharan Africa: A Supply-Side Study

12
improvement from SAPs, and conversely, the level of disinvestment (measured by equity involvement) is as high among good as poor performers.
It is argued that adjustment may have hastened disinvestment I I. This could be due to the overriding short-term effects of devaluation on profits in foreign currency. Investors are concerned that this deterrent to manufacturing is so great there may be no medium to long term prospects left. Further, SSA's present level of industrialisation is a major worry: "heavy industry doesn't make sense - if you can't make a bar of soap, what can you make?" said one manufacturer.
Investors agree that some adjustment policies have done much to improve prospects. This is mainly through reducing regulation and bureaucracy through privatisation, trade reform, new investment codes, decontrol of forex and prices, and tax holidays. However, SAPs have neglected structural and social issues such as infrastructure or labour skills, and regional integration. In addition stochastic shocks can sometimes throw the reform effort into chaos. Investor confidence is undermined by bad advice from BWIs that results in bad programme design, and by hasty implementation. According to Bennell, a major reservation of UK businessmen in the manufacturing sector was that SAPs are "too simplistic and naive" I 2 , failing to take account of local conditions.
To compensate for the perceived negative effects of SAPs, major investors in a country try to directly influence the course of government policy. Thus one UK parent company claims to have forced the Zambian government to set tariffs at favourable levels, in return for buying back a subsidiary that had been seized by the government some years earlier.
Finally, investors are highly sensitive to credibility of reform, and consistent and transparent execution. Credibility is fragile: "international experience has demonstrated that credibility may be lost overnight, but is only regained very slowly" 13 • Also credibility in national policymaking is often overruled in investors' minds by regional problems.
o Corruption Most investors identify this as a major barrier, seeing it as endemic in Africa. As a British Asian banker put it, "bleeding the country is SSA's biggest problem". Zambia and Kenya are frequently cited as being particularly corrupt at high levels, the former experiencing practices such as drug smuggling by ministers. It is particularly pernicious because this infonnation spreads rapidly, severely damaging a national image. Corruption also taints the credibility of adjustment and investment reform as politicians come to be seen as untrustworthy and self-serving. Some see corruption as reflecting low pay for civil servants suggesting a review of their salary levels may be part of the answer.
II Bennell (1995) pp.200-20 I.
12 Bennell (1995) p.21O.
13 African Development Bank (1993: 173).
EFA - Private Capital Flows to Sub-Saharan Africa: A Supply-Side Study

13
Interviewees often said local businesspeople "are more familiar with the way of doing business", in the same breath as the issue of corruption. For example some suggested that locals receive preferential treatment by not paying tariffs, or by receiving tariff protection due to national or strategic interest. Many would therefore like "national treatment" on the establishment, ownership and control of enterprises, on taxes, and legal protection.
Western investors also regard non-Westerners as more corrupt. According to one TNC investor, "Western companies are disinvesting from Africa, and are being replaced by smaller Indian outfits with a mind set to endemic corruption. The British and Europeans are somewhat uptight about this, and this puts them at a competitive disadvantage".
Perhaps Western investors just have less opportunity to act corruptly. Many Western TNCs are rigidly controlled, either by their internal auditors or by government regulation. For example, the US Foreign Corrupt Practices Act (1978) prohibits illicit payments, punishing companies with fines of up to US$2 million. Some non-Western sources confirm this impression. A British-Asian businessman observes that Indian companies are buying British disinvestments in Kenya (confirming Bennell), but also suggests that they are being used as "fronts" by politicians acquiring these businesses for themselves.
Moreover, there is a large element of sour grapes by UK investors on the success and enterprise of Indian investors. Owing to ties going back over generations, particularly in East Africa, Asians are "closer to the ground" and more attuned to the business culture. They are therefore able to operate far more efficiently. As a British-Asian businessman put it, the British are more. aloof: even "if a British businessman spends 10 years in Africa, most of that time he will be at his club, mixing with expatriate friends".
o Political Instability. While paying lip service to enlightened political reforms such as those in South Africa, most investors see stability as more important than democracy. This is particularly because "democracy in Africa is apparent, not real". It is not fundamental who runs the country, so long as there is strong leadership. For example, one commercial banker commended Cote d'Ivoire for its death sentence. Another investor preferred dictatorships for their "rapid decisions". However, anti-democratic moves (such as under Chiluba in Zambia) were acknowledged to generate bad publicity.
Even in relatively stable political systems investors find longer-term worries. Particularly common is continuity. For example, although South Africa is stable, concerns exist over who will succeed President Mandela. Yet this is mainly confined to British investors. Those "closer to the ground" through work or family ties see such fears as unfounded, citing plenty of able people to replace him, and continue the direction and momentum of reform. There are similar worries over who will replace Rawlings in Ghana.
When faced with instability many companies felt it important to stay in a country for as long as possible, to "ride out the storms, take a long run view and live through it". By maintaining a presence, the enterprise is well placed to resume operations when stability
EFA - Private Capital Flows to Sub-Saharan Africa: A Supply-Side Study

14
is regained. Finns best placed to take this view are those with multi-country interests. Others will continue to leavel4
•
F or South Africa, some see tribal rivalry as a potential problem, though they acknowledge that Mandela has done a good job of keeping it in check. Those based in South Africa are more optimistic. In this context, some unreasonably melodramatic views in London, that South Africa would "go the same way as the rest of black Africa" (down) appear to reflect sensationalist press reporting rather than the realities on the ground.
o Crime is seen as more important than political instability. Most interviewees expressed a general feeling of being unsafe in Africa - and all felt this about Johannesburg. If investors could not feel personally safe, they would not go. More effective policing was acknowledged to be top priority.
5. SECTORAL LEVEL There are many different factors which impact on decisions within sectors, and are too detailed to cover in this brief study. UNCTAD has recently produced an interesting typology which demonstrates, through these sectoral factors, where Africa is "underinvested" and has scope for increased flows. For example, it identifies that limited local supply provides potential for outside involvement, but they suffer badly from local skills and capital shortages.
However, it is important to distinguish "strategic" investors, most of whom are in the mining and oil sectors. As discussed in Box 3.2, they are able to overcome most of the negative factors which deter investors in other sectors, and are therefore particularly optimistic about Africa.
CONCLUSION Many factors which influence FOI are the same as for other flows. However, because FOI is particularly difficult to reverse, and to a degree irreversible, this makes direct investors more cautious than suppliers of other flows. This has two consequences. First, investors adopt a ''waitand-see" attitude. Unfortunately this creates a vicious circle. If their caution reduces investment in a given year, the resulting decline in productive capacity will fulfil their negative expectations, resulting in a low investment equilibrium 15. Second, when they do commit themselves, the time horizon of investment is very short. As one investor put it: "The basic rule for black Africa is: get your money back in 12 to 18 months, or don't do it - who knows what's going to happen next year?". Even better informed investors have a time horizon of no more than 3 years.
Information from our country teams indicates that there has been a recent surge in FOI. The revised version of this paper will therefore try to identify these recent investors, find out why they have invested while others have not, and provide more suggestions for government action.
14 Bennell (1995).
IS African Development Bank (1993: 173).
EFA - Private Capital Flows to Sub-Saharan Africa: A Supply-Side Study

15
Box 3.2: FDI IN MINING AND OIL Mining and oil companies merit closer study as their decisions on where to invest are often used as a barometer by businesses in other sectors. A British mining entrepreneur reflected these views: "We are ... the shock troops of investment. If we can invest successfully and hannoniously then we may trigger a move to Africa by international companies which do not need to be in Africa. These companies will be watching the experiences which we have before making an investment decision"16. The mining indusny views SSA very positively, partly because many countries have been lifting restrictions on FDI. This is reflected in recent activity among the larger companies: o Ashanti has been expanding rapidly in the last decade, with mining and prospecting interests in
12 African countries including Ghana, Angola, Ethiopia and Zimbabwe. o Anglo-American's proposed restructuring will free resources for mining outside South Africa,
now one of the most geologically explored parts of the world, perceived to be in secular decline. However, while non-mining companies may look to the mining giants for ideas on where to invest, many factors enable mining companies to overcome problems faced by smaller businesses: o Size enables them to invest in their own infrastructure. For example, Anglo-American built a
water pipeline and employee accommodation at a goldmine in Mali. Infrastructural needs for extractive industries are so large that self-provision may be more efficient, while manufacturers expect infrastructure to be provided for them.
o as with larger manufacturers size and diversification can make risk-taking easier. Also extractive industries are less exposed to risk as they are not limited by small local markets, and sell almost exclusively on the international market. They are also experienced in dealing with the vagaries of commodity prices through hedging and spot and forward transactions, and better protected against exchange rate risk, as escrow accounts guarantee payment out of the export proceeds. Finally, they also reduce their exposure to risk by employing small prospecting companies (usually US, Canadian, or Australian) to perform exploration or feasibility studies. The smaller companies take all the risk as larger companies are not obliged to take over a proposed project, and are helped by major tax breaks from their home governments.
o financing is generally available as mining is usually seen as a "sure bet". The primary source is retained earnings, but if a mining company like Anglo-American needs to go to the market, it has a high credit rating and can secure loans against assets abroad, or use its parent company, Minorco's borrowing powers. Raising funds offshore through on-lending from a parent company or in a country where borrowing is cheaper leads to underestimates in FDI. Mining ventures also find it easier to attract international institutions such as CDC and IFC. In Zaire funding has dried up under conditions of extreme instability. However, there are cases where funding has dried up under less extreme circumstances: Chile's Escondida mine had difficulty accessing international capital markets in the mid to late I 980s, due to the debt crisis and a period of political instability. This was in spite of its high profitability, good infrastructure, and access to a skilled labour force. The participation of the IFC with a small share, helped in restoring confidence.
o political instability is less worrying as mining companies often use their own security forces and infrastructure maintenance. Also as the projects are strategically vital, they gain access to inside information, and influence political developments. While continued operation under instability reflects the scale of earlier investment, they are much less likely to commit new resources.
o security of tenure from strategic leverage; offthore escrow accounts; tax breaks.
J6 Algy Cluff interviewed in World BanklIMF Emerging Markets by Patrick Smith 30/9/96.
EFA - Private Capital Flows to Sub-Saharan Africa: A Supply-Side Study

17
4. BANK FLOWS TO SSA 17
As can be seen from Table 2.1 net bank lending to SSA is very low for most recent years. In the 1990's this implies that bank lending contributes little foreign exchange in net terms to fund SSA's growth and investment. Nevertheless, gross flows have remained important for some countries, and it is therefore important to examine their motivations.
In addition, an important distinction needs to be made between short-term and medium to longterm lending. There has reportedlyl8 been an important recent increase in short-term bank lending, particularly linked to trade finance. A high proportion is pre-export finance which is totally secured by the exports themselves, and it is most common for minerals, petroleum, and agricultural commodities. Banks call this "self-liquidating finance", as it rolls over automatically and is collateralised against export receipts, either via the assigning of export contracts or through escrow accounts for the export receipts.
There is also import finance to productive industries, especially mining but also agriculture. All banks interviewed confirmed that trade credit was a major part of their lending business to SSA This trade credit is very short-term, fitting trade flows, classically at 90-180 days. It is also highly volatile. For example, twice in 15 years a reduction in trade lines has been responsible for a collapse in capital flows to South Africa. Finally, it is procyclical, rushing in when commodity prices boom (as with coffee in Uganda) and out when they fall. As such it exacerbates macroeconomic instability.
As regards medium-term syndicated lending there seems unfortunately little interest among banks. Indeed the stock of medium-term bank lending has declined during the early 1990s, as maturing loans have not been replaced by new loans. In recent years commercial flows have been going mainly to Botswana, Congo, Ghana, Kenya, Mauritius, Namibia, Tanzania and Zimbabwe. It is unlikely that such lending could re-start in the near future, because even though they recognise an improvement in the economic performance of some SSA countries, banks still consider the country risk very high, and are unwilling or unable to charge sufficiently high spreads to compensate for such risks.
The perception of high country risk is reinforced, in the case of British banks, by the fact that the Bank of England's Provisioning Matrix (which guides both banks on provisioning levels and tax authorities on tax allowances for such provisioning) recommends very high provisioning levels for countries such as Tanzania, Uganda and Zambia. This makes lending to such countries very unattractive, as a high proportion of the loan would need to be provisioned against immediately. The Bank of England should take more account in its Matrix of recent favourable economic developments in several SSA countries, and reduce their suggested levels of provisioning.
17 The final version of this study will include a more comprehensive analysis of factors influencing especially shortterm bank lending. We do not have short-term bank data at present.
18 Interview material
EFA - Private Capital Flows to Sub-Saharan Africa: A Supply-Side Study

18
Virtually all medium-term lending to SSA has physical guarantees (e.g. allowing seizure of passenger and cargo aircraft or ships) or guarantees by export credit agencies: in other words, where the country risk for the lender is practically zero. It is therefore also problematic that most export credit agencies (such as the UK's ECGD) have not renewed cover for most SSA countries. It is interesting and positive that export credit agencies of some non-OECD countries, such as South Africa and India, have fairly generous policies for export cover to SSA countries. One other prospect of reduced risk to medium-term lending is for private sector infrastructure (such as the Maputo Corridor) driven by the World Bank and IFC, through schemes of BOT (build, operate, transfer). In such schemes there are typically World Bank guarantees and lenders get preferred creditor status. Another means of reducing risk is to ensure that large multinational companies are involved. This explains the focus on the energy and mining sectors, because they can be relied upon to repay.
An important question is to what extent reductions in SSA commercial debt (done for example via buy back operations) have improved those countries' creditworthiness, and their access to new bank lending. Both our interviews and those carried out by London Economics 19 show that in SSA countries unlike Latin America, commercial debt reduction has had a relatively marginal effect on creditworthiness, though it has brought other benefits. This is largely because commercial debt is a relatively small proportion of SSA external debt, so its elimination does not mean a significant reduction in total external debt.
As a result, the reduction of the commercial debt overhang argument does not lead to new flows in most SSA countries. However, it could work far more if and when SSA finally obtains sufficient relief on its overall debt to make its servicing sustainable and compatible with economic growth. Indeed, a recent study20 provides clear econometric evidence that for 1980-95, SSA countries with a lower external debt burden have attracted significantly more private lending. This is therefore a crucial step, but it should be remembered that Africa's access to bank credit was relatively limited (though improving) even before the 1980's debt crisis. Though the debt problems made the situation worse, reducing the overall debt overhang might have a less dramatic impact on access to new flows than in Latin America.
It is also worth stressing that even in the Latin American case, commercial debt reduction did not lead to a major return of bank lending. Instead, it was other flows, such as FDI and especially portfolio flows which picked up significantly, as the debt overhang was reduced and general economic prospects were seen to improve in the early 1990's. However, bank lending to Latin America resumed in the early and mid-90's, it was led mainly by European banks, which had lent relatively little in the 1970's and early 1980's, and had thus suffered far smaller losses from the debt crisis. Given the strong presence of European banks in Africa, this might augur more
19 London Economics "Costs and Benefits Associated with Commercial Debt Buy Back Operations in SSA" Mimeo. Report to ODA, July 1996.
20 Bhattacharya, Montiel and Shanna, 1996.
EFA - Private Capital Flows to Sub-Saharan Africa: A Supply-Side Study

19
positively for resumption of bank flows.
One possible way to improve the link between debt reduction and new flows for SSA may be via greater expansion of debt equity swaps, not just for commercial but also for bilateral official debt21
• This seems a particularly attractive vehicle for facilitating privatisation.
Apart from reducing the external debt overhang, bankers interviewed attributed even greater importance to clearing up domestic debt arrears. Indeed, the need to create a healthy restructured banking system was seen as a key pre-requisite for attracting new foreign bank flows.
A related important factor is that very few and increasingly fewer foreign banks have branches in SSA. Two interesting exceptions are Citibank and Equator Bank. Citibank has been expanding in SSA, and with branches in fourteen countries, is the only foreign bank involved in both Anglophone and Francophone Africa. Equator Bank, a subsidiary of Hong Kong and Shanghai Bank Corporation, specialises in SSA, and is active in thirteen countries.
However, foreign banks are in general pulling out from SSA activity. British banks have pulled out ofFrancophon~ Africa, and French banks have sold their flagship, BIAO. French banks have also reduced their presence in Anglophone Africa. In addition, most domestic banks have not been restructured. This brings a lack of competition, which may lead to poorer services and higher costs, deterring investors. It may also make it more difficult to attract bank lending and FDI from abroad, as bank branches in countries often provide an important source of updated and precise information not just on macroeconomic aspects but also on companies' performance. They also provide important services for foreign investors, notably through their lines of credit with correspondent banks.
21 See P. Mistry and S. Griffith-Jones. Debt conversion/or low-income countries. UNCTAD 1993.
EFA - Private Capital Flows to Sub-Saharan Africa: A Supply-Side Study

21
5. PORTFOLIO FLOWS TO SSA
There is little systematic and objective analysis of portfolio flows to Sub-Saharan Africa, partly because the amounts involved are relatively small by global standards, and above all the flows are fairly recent. As a consequence, this is one of the first attempts at systematically analysing portfolio flows to SSA.
This section begins by examining the scale of the flows. Then, based largely on extensive interviews of SSA and emerging market fund managers, it analyses the features, motivations and criteria with which funds are invested in this region.
1 THE SCALE OF PORTFOLIO FLOWS
This study will focus here on investment (mainly in equities but also in bonds) flows to SSA made both by specialised SSA or African funds and by global or emerging market funds. It therefore excludes purchases of shares made directly in international financial markets (e.g. of companies either traded or listed in London or Luxembourg). This latter data is particularly hard to obtain in general for developing countries, and even more for SSA ones22• The amounts issued or traded seem fairly small, but have increased recently.
Trading of large African companies' shares (e.g. Anglo, Ashanti) in London or Luxembourg widens the appeal to investors for investing in African shares more generally. If generalised, it could however slow down development of local African stock markets. For example, when Ashanti started listing its stock on the London market, a substantial transfer from Ghana to London took place. This has taken place over a period of time, taking advantage of price differentials at different points. Major transfers such as this could thus have detrimental effects on the development ofSSA's stock exchanges.
The World Bank23 estimates total net portfolio flows to SSA peaked at US$860 million in 1994, before falling to US$465 million in 1995 (Table 2.1). While the level remains relatively modest, it does show increased interest by portfolio investors. However, it compares with nearly $3 billion of foreign direct investment that flowed into SSA in 1994 and in 1995 (UNCTAD)24. The IMF2s estimate gross international bond issues for SSA at $1.8 billion in 1994 and $1.4 billion in 1995, while international equity issues reached $0.6 billion in 1994 (with $0.2 billion raised by South Africa) and $0.5 billion in 1995 (with $0.3 billion raised by South Africa).
22 Interview material. 23 World Bank World Debt Tables /996. 24 UNCTAD World Investment Report /996.
2S IMP International Capital Market Report /996.
EFA - Private Capital Flows to Sub-Saharan Africa: A Supply-Side Study

22
In Table 5.1, we have assembled the main dedicated SSA funds. It is clear that the bulk of portfolio flows to Africa are going to South Africa, while the rest, according to market estimates, totals around $710 million. The IMF (WEO, 1996) gives a slightly lower figure of $600 million. All the non-South Africa funds have been created after the beginning of 1993. In addition, a share of global or emerging market funds is invested in SSA; Table 5.1 provides estimated exposure of some such funds in SSA; however, this is for illustration purposes only, and the amounts involved are if anything larger. It is interesting that some market participants estimate that typically 4-10% of global emerging market funds are invested in SSA, much of which is invested in South Africa. This implies $1.5 billion to $3.5 billion for SSA, as the IMF (WEO, 1996) estimates net assets of global emerging market funds at $36 billion.
The table shows that most non-South African funds are small. This is due to relatively limited demand for these funds. Indeed, some (e.g. Simba) initially targeted bigger amounts but although well marketed, could not achieve this due to limited investor interest. This could reflect a slight decline in interest in SSA following the peak around the time of the South African elections. It is also interesting to see that the larger funds were mainly launched in 1994.
We can conclude that though not spectacular, portfolio flows to SSA are significant. They are rather invisible in international financial statistics, as those of the World Bank or IMF may not fully capture them in their data on capital flOWS26• This reflects a larger problem of underestimating private capital flows to SSA detected first by Kasekende, Kitabire and Martin27•
2 CRITERIA FOR PORTFOLIO INVESTMENT IN SSA
Appraisals ofSSA by portfolio investors range widely, from those who share (with FDI investors and others) an anti-Africa bias to those who see SSA as 'the final frontier' and 'the last region of opportunity' .
Regarding anti-African bias leading to under investment in the region, it seems useful to distinguish three separate levels: o the reality of unstable government and other problems in SSA (see below); o misperceptions of western investors, who often mis-read the signals and use benchmarks
that are irrelevant (several interviewees stressed the relatively greater ability of Asian investors to interpret signals in SSA);
o linked to this, is the failure to put the current situation in historical context and especially to interpret new positive trends.
26 IMF data on net portfolio flows refers to all of Africa, which is problematic for our purposes. 27 Kasekende, L., Kitabire, D. and Martin, M. (1996).
EFA - Private Capital Flows to Sub-Saharan Africa: A Supply-Side Study

",3 Table 5.1
SSA Funds, and Exposure to Some Global Funds
Funds Management Focus Size Structure Launch Company (US$m) date
1. SSA-speeifie Funds Total (exe/. South Africa) 709.05 Total (incl. South Africa) 2818.68
Africa Emerging Market Fund Emerging Markets Pan Africa 78.65 Semi-Open Nov 93 Investors Corp
ASA Limited (1) , ASA Ltd. South Africa 320.85 Closed Calvert New Africa Fund Calvert Group Pari Africa 7.60 Open Apr 95 Credit Suisse South Africa (2) Credit Suisse South Africa 9.85 Open Genbel South Africa Ltd (3) Genbell Unisen South Africa 1237.01 Closed GT Africa A Share LGT Management Pan African 19.30 Open Nov 93 GT Africa B Share LGT Management Pan African 19.30 Open Nov 93 Instrust (3) Investec South Africa 164.38 Closed Lexington Strat Investments Lexington South Africa 58.50 Open
Management Corp Mauritius Fund Lloyds & Mauritius Mauritius I 28.00 Closed Jan 93
Fund Managers Zimbabwe MS Africa Investments Morgan Stanley Pan Africa 246.44 Closed Feb 94 New South Africa Fund Flemings South Africa 89.77 Closed N/A Old Mutual South Africa (2) Old Mutual South Africa 89.26 Closed OMI Galileo South African Eq Old Mutual South Africa 3.75 Open SAGA Old Mutual South Africa 81.06 Open Simba Fund Baring Asset Pan Africa 28.00 Closed Jan 96
Management Southern Africa Fund Alliance Capital Southern Africa 117.99 Closed Feb 94 Southern Africa Investors Mercury and San lam Southern Africa 44.00 Closed Dec 95 Spes Bona Investment Co Rosenwald Roditi I South Africa 58.38 Open
Coronation AML S&P Southern Africa (2) Save & Prosper South Africa 14.95 Open Syfrets GI South Africa Mgd Syfrets Mgt South Africa 0.65 Open UBS Equity S Africa (4) UBS (Intrag) South Africa 70.98 Open West Africa Growth Fund Framlington Francophone 30.00 Closed May 96
2. Global & Emerging Market Funds Estimated Total (5) 1500 to 3500
of which: Foreign and Colonial Pan African 160 Flemings Pan African 100 Morgan Stanley Pan African 30
TOTAL FUNDS (axcl. South Africa) 2209.05 to 4209.05 (incl. South Africa) 4318.68 to 6318.68
Note: 1. Converted from Canadian Dollars at US$1 = CA$1.3541. 2. Converted from British Sterling at US$1.6424 = UK£1 3. Converted from South African Rand at US$1 = SAR4.4125. 4. Converted from Swiss Francs at US$1 = SFr1.4337
Exchange rates as at 11 February. in Financial Times 12 February 1997. 5. Market participants estimate 4-10% of global emerging market funds are invested in SSA.
This makes between US$1.5 - 3.5 bn, out of an IMF estimated total of US$36 bn.
Sources: Emerging Market Investor, June 1996; Micropal Emerging Market Fund Monitor, in Africa Financing Review Nov 1996; Interview material.
EFA - Private Capital Flows to Sub-Saharan Africa: A Supply-Side Study

24
The two last points are related not just to misconception but also to lack of information. Thus it would seem that there is an important trade-off between diversification and information for most portfolio investors28
• As a consequence it can be assumed that relatively less effort is put into obtaining accurate and up-to-date infonnation on small markets, as this is relatively more costly. So what seems like an anti-Africa bias may be at least partly an anti-small market bias.
As regards perceptions of Africa as 'the final frontier', and 'Afro-euphoria', these were particularly strong in periods when SSA stock markets performed really well. For example, between March 1995 and March 1996, the Nigerian stock exchange increased by 144 per cent in dollar terms, while in the Ivory Coast, Zimbabwe and Namibia, stock exchanges gained between 50 per cent and 60 per cent.
Another reason why SSA is potentially attractive for portfolio investors is that the performance of its stock exchanges is often uncorrelated with that of developed and other emerging markets. Several investors stressed that SSA stock exchanges had not been subject to the so-called 'tequila effect'. That is they did not fall, as so many emerging markets in different continents did, as a result of the Mexican peso crisis. Thus SSA allows not just potentially higher returns, but diversification of risks. In addition, there is low correlation of stock exchange prices among countries within SSA. This contrasts with for example Latin America, where the correlation is stronger9
• However, if and when foreign portfolio investment in SSA increases, it is likely that stock market prices will not only increase, but become more correlated amongst themselves and with other emerging markets.
That the 'tequila effect' did not occur in SSA, and more generally SSA markets seem less closely correlated with other emerging markets is mainly because there is less foreign portfolio investment in SSA. As a consequence there is less money that can leave quickly when there is a problem either in the country, in the region, in emerging markets or globally. This seems to show that there are some advantages to SSA' s limited ability to attract equity flows. Furthermore, the lessons from Latin America and Asia seem to indicate that far greater efforts need to be made by SSA governments and private actors to attract long-tenn flows (such as FDI, long-term loans and long-tenn bonds) than to attract more volatile flows, such as portfolio and short-term flows.
On the other hand, SSA flows may be inherently less volatile. The fact that most SSA markets are relatively illiquid (while very problematic for attracting portfolio flows), may imply less potential volatility by making it more difficult for foreign investors to pullout. In theory the large part of equity flows to SSA which came via closed-end funds (see Table 5.1) should reduce volatility. This is because closed end funds are relatively protected from actual and exempted redemptions by individual investors, as the claims are traded on a developed country stock exchange, and are not, like open ended funds, required to redeem claims on demand. However,
28 Calvo and Mendoza (1995). 29 Emerging Markets, June 1996.
EFA - Private Capital Flows to Sub-Saharan Africa: A Supply-Side Study

2S
the evidence from the Mexican peso crisis on this is not very strong30•
A key factor inhibiting larger portfolio flows into SSA is the perception among most investors that SSA countries lack a stable and successful track record for economic policy and perfonnance. Thus even some fund managers who have more knowledge about the region, and who are optimistic about its future long-tenn evolution, are unwilling to invest because all managers are evaluated on very short-tenn benchmarks (on average every three months), even though they are managing relatively long-tenn assets such as pension funds. Thus, though willing individually to take a long-term bet, fund managers cannot 'afford' to stray too far from the crowd (or 'the herd'), given the perceived volatility of economic performance, linked both to political instability and economic policies. As a result of this volatility, a global or emerging market fund investing far more heavily in SSA than others could perform below average if SSA markets did less well than others, and these managers would risk losing mandates from their investor clients. This conundrum makes it difficult for SSA countries to attract large portfolio flows until there is a more fundamental shift of confidence amongst a large group of investors.
Herd behaviour amongst fund managers may paradoxically also have some stabilising functions in SSA. For example, one large fund manager reported that he had not pulled out of South Africa altogether in mid-1996 (when the Rand fell, and the South African stock exchange fell in dollar tenns) mainly because the share of South African stocks in the main indexes (e.g. IFC, Morgan Stanley) was fairly large. Thus, if the South African stock market recovered, he would have performed below the average. Therefore an important element for attracting and sustaining portfolio flows seems to be inclusion of different SSA countries in key indexes, especially the IFC one.
3 THE CHOICE OF REGION AND COUNTRY
Portfolio investors first decide whether to go into emerging markets or not, and if so, in what proportion. They then decide if, and in what proportion, they will go into a particular region. Then, they decide on which country/countries in that region to invest in.
There are particular problems inhibiting greater portfolio flows to SSA. Some are practical: o many SSA countries have not yet established stock exchanges; o the small size of existing exchanges (with the clear exception of South Africa). Large
investors like to invest in larger markets, where they benefit from economies of scale. o some investors argued that price/earnings ratios in SSA are not so different from the rest
of the emerging markets, but that there is higher risk (particularly political) and lower growth expectations. However, other (more specialised) investors pointed to fantastic opportunities in companies with extremely low price/earnings ratios, and very good
30 Griffith-Jones 1996; IMF 1995.
EFA - Private Capital Flows to Sub-Saharan Africa: A Supply-Side Study

26
growth prospects, both for the company and the country, for example, banks in Mauritius.
Curiously, not many interviewees highlighted more technical factors for both equity and bonds, such as lack of good settlements procedures and clear regulations. There was, however, quite a lot of emphasis on the need to improve the soundness of the banking system. At a national level Mistry (1996) suggests the need for an efficient and well capitalised commercial banking system (with the problems of domestic bad debt sorted out) in individual SSA countries.
Surprisingly, many of the factors thought to be inhibiting portfolio flows were also inhibiting foreign direct investment. These included uncertainty of ownership, relatively slow progress of privatisation, low domestic savings, and a fragile fiscal and balance of payments situation leading to macroeconomic uncertainty. Lack of a level playing field and high corruption were also often mentioned, though some investors argued that such a large emphasis on corruption did not correspond always to reality, and could have an element of racism behind it.
Portfolio investors do focus on some features that may not be of such interest to FDI investors, notably: o the fundamental balance' in the economy, which is the current account deficit minus
foreign direct investment, as an indicators of sustainability of the Balance of Payments. On average this 'fundamental balance' is fairly highly positive for South East Asia, but more negative for Africa (both SSA and North).
o liquidity in the market. An important indicator of this is looseness of monetary policy. Thus, several portfolio investors said they would for example prefer South Africa to pursue a more expansionary monetary policy, as this would lead to greater liquidity and therefore higher prices of shares. However, an expansionary monetary policy would probably be inconsistent with other policy objectives (e.g. defending an already low level of foreign exchange reserves; low and/or stable inflation and stable exchange rate). Furthennore, it would probably contradict advice the IMF would give in the context of a stabilisation and adjustment programme. These contradictions are difficult for policymakers who are attempting sound economic management, negotiating with the IMF and seeking to attract portfolio investors.
Within SSA there is a key distinction is between South Africa and the region's other economies. As discussed in Box 5.1 South Africa has seen dramatic switches of investor sentiment.
EFA - Private Capital Flows to Sub-Saharan Africa: A Supply-Side Study

27
Box 5.1: Changing Investor Perceptions of South Africa Since Mandela became President to the point where the Rand began to fall, foreign investors showed great enthusia~m particularly of portfolio flows. Table 5.2 shows this was reflected since 1993, and particularly since 1995, in large net foreign purchases of South African equities.
Table 5.2: Net Foreign Purchases of South African Equities 1989 (868)
1990 ( 1 , 116) 1991 (1,229) 1992 (177)
1993 626
1994 26
1995 1996 (to October)
Note: Data in brackets indicates net outflow
1,310 1,114
Source: Data provided by Angela Cozzini at Cross Border Capital, based on information from the JSE.
Purchases were particularly high in 1995 and the first part of 1996. Roy Andersen, the Johannesburg Stock Exchange President, stated "rapid growth of market capitalisation that the inflows implied made the JSE the eleventh largest stock exchange in the world and the biggest emerging market" (EMI, 5/96). Over 51 % of its total trading is by foreign investors. Also, there are many dual listings: of 640 listed companies, 80 are also listed in London, and their turnover is about 50% of the JSE total.
The May 1996 issue of Emerging Markets Investor on South Africa used titles like "South Africa safe haven among emerging markets" and "Bullish expectations". The same euphoric tone was used by other specialised publications and investors, especially in 1995 and early 1996. Portfolio investors were encouraged by political developments, the large size of the South African stock market, and apparently good economic prospects. They liked the sophistication of the companies, their good accounting systems, and that "they spoke the international investors' language". A problem, even in the days of euphoria, was lack of market liquidity which made it difficult to invest. As domestic investors (especially the very large domestic institutional investors such as pension funds and insurance companies) were unable to invest abroad, they held on to domestic shares of good companies which they were relatively unwilling to sell. As is well known, the five major groups in South Africa control a large part of market capitalisation.
The mood changed quite significantly in 1996 when unfounded concerns about President Mandela's health, and speculation that exchange controls were about to be lifted contributed to the sharp fall in the Rand, as well as a fairly large loss of foreign exchange reserves. As elsewhere, the change in foreign investors' perceptions were far larger than changes in real fundamentals. Thus South Africa clearly illustrates the problem of investor fickleness discussed above. Potential investors in South Africa now stress negative elements such as low domestic savings, relatively high wages, tight monetary policy, whereas nine months ago they stressed positive developments (peaceful political change, good growth prospects, very low inflation). Naturally the fall in the South African Rand, reportedly not caused by portfolio outflows, did depress dollar value of share and bond assets. In late 1996 portfolio investors express many doubts about investing in South Africa and a clear preference for other SSA markets.
EFA - Private Capital Flows to Sub-Saharan Africa: A Supply-Side Study

28
By late 1996 portfolio investors preferred Zimbabwe, Uganda, Botswana, Ivory Coast and Mauritius. Some even felt that some SSA markets (Uganda, Ivory Coast and Mauritius) had better potential than Latin American or Asian markets. Encouragingly, several investors are beginning to differentiate clearly among SSA countries, as they already do among Latin American countries. This shows that they are gathering more knowledge, and that their perceptions are maturing. For example, Uganda was praised by institutional investors for its excellent recent growth, and macro-economic policies. Similarly, Ivory Coast is seen as pursuing very good economic policies. However, some of these countries lack a stock market, and the stock exchanges in others are perceived not to be professionally run, or "still not keen to have foreign investors". One solution suggested by several portfolio investors and bankers lies in the development of regional stock exchanges (see below).
The country distribution of one of the most recently fonned African funds, the Simba Fund, can be seen in Table 5.3. It would seem fairly typical of the country distribution of those African funds which go beyond South Africa.
Table 5.3 Country Distribution ofSimba Fund. October 1996
Country Percentage
South Africa 25 Egypt 16 Morocco 12 Mauritius 9 Zimbabwe 8 Ivory Coast 6 Ghana 5 Namibia 5 Botswana 4 Various and Cash 7 Total 100
Source: We thank Michael Power who heads the Simba Fund for providing this infonnation.
Another important fund (Morgan Stanley) had in early November 1996 investments in Egypt, Algeria and Morocco, as well as in the Ivory Coast (fixed income), Ghana (equity), Nigeria (fixed income), Kenya (equity), Mauritius (equity), Zimbabwe (equity), Botswana (equity) and South Africa (equity). Other funds interviewed showed very similar preferences. The Mauritius Fund for example has diversified some 5.4% of its total into Zimbabwe (it can invest up to 10% of its total funds outside Mauritius) and is presently looking at possibilities in Kenya31
•
31 Mauritius Fund Management Company Limited Shareholders Bulletin for December J 996.
EFA - Private Capital Flows to Sub-Saharan Africa: A Supply-Side Study

29
4 CHOICE OF INSTRUMENTS
As seen above, portfolio investors invest in SSA both in equity and in fixed income instruments. For equity instruments most prefer to invest in listed companies; indeed, several funds can only buy the shares of listed companies. However, some also invest in unlisted companies if they feel there is and will be the possibility to on-sell (see also details ofComafin Fund in Box 5.2). This is because unlisted companies often offer potentially higher returns. Technical assistance to help companies list will be valuable to broaden their access to portfolio flows, as will be expansion of institutions like ·the Comafin Fund that invest in unlisted companies.
Fixed income instruments (particularly bonds) are often dollar denominated, which implies no currency risk. These include Brady bonds and promissory notes of Paris Club and other debt. It is important to stress that these are secondary purchases, typically in London or New York. As a consequence they do not generate a net capital inflow into the country. Increased demand for this paper pushes up its price, which may help to improve the country's creditworthiness, and thus make it easier to attract other capital flows.
Portfolio investors interviewed seemed less willing to buy Treasury Bills denominated in local currency, as these carry exchange rate risk. However, some have bought short-term Treasury Bills in moments when these had very high nominal interest rates, and the exchange rate was expected to stay constant or appreciate in nominal tenns. As the Mexican peso crisis experience teaches us, large foreign holdings of short-tenn Treasury Bills creates potential vulnerability both to government finance and especially to the Balance of Payments32
• If the situation in the country deteriorates or is seen by foreign investors to deteriorate, they may not renew this short-term paper, and may withdraw foreign exchange from the country. This can put severe pressure on the exchange rate, reserves, and macro policy. It seems therefore prudent to issue more long-term Treasury Bills (even though this may imply additional interest rate cost); and discourage (e.g. via taxation) or limit the proportion of especially short-tenn Treasury Bills that can be bought by foreigners.
5 CHOICE OF SECTORS
Portfolio investors in equity naturally expressed preference for companies whose stock they consider to be under-valued, and whose price is likely to increase.
Particularly in those countries where there is a history of exchange rate depreciation, some investors concentrate on companies producing for export, as the impact of devaluation on them will be either positive or neutral. Related to this they also tend to invest in 'low-cost, volume driven' primary sectors such as mining and agriculture. These preferences coincide closely with those of foreign direct investors.
32 See for example, Griffith-Jones 1996.
EFA - Private Capital Flows to Sub-Saharan Africa: A Supply-Side Study

30
6 INVESTORS
As regards investors, detailed information was not available from the funds. However, interviewees suggested that there was a roughly even split between retail and institutional investors. Regionally, the US and the UK. were reportedly the main sources of investment, though continental European and Middle Eastern investors also playa role.
Morgan Stanley, the biggest non-South Africa specific SSA fund, estimates that around half its investors are institutional, and the other half retail. Most are from the US (the fund is domiciled in the US, though managed from London).
Greater potential volatility is implied by the fact that it is mainly Anglo-Saxon (especially US) investors that go into SSA. Preliminary evidence from other regions suggests Anglo-Saxon portfolio investors focus more on short-term returns than say those from continental Europe, and that they are therefore more volatile. On the other hand it is encouraging that institutional investors (who have more longer term liabilities and perspectives) playa fairly large role in SSA.
7 IMPORTANCE OF INTEGRATION
At two levels greater economic integration was emphasised as beneficial. One was because broader markets provide valuable economies of scale to companies, as well as other advantages. Companies may then become more profitable. There was however some mention that trade integration could generate relocation of companies: if tariff barriers are significantly lowered, it may become less profitable to produce certain goods in countries with relatively small markets.
A second desirable type of economic integration was through regional stock exchanges. The development of a 'regional bourse' in Abidjan was greatly welcomed. It was seen as relatively easy to establish a regional stock exchange in the Ivory Coast for seven French-speaking countries, given their tight monetary arrangements and very similar legal systems. However, some also suggested regional stock markets in other regions such as East Africa, to include countries like Uganda, Tanzania, Malawi and Kenya. This is similar to the more ambitious proposal for a regional stock exchange for all 12 countries of the Southern African Development Community (SAD C), which includes Angola, Botswana, Lesotho, Malawi, Mauritius, Mozambique, Namibia, South Africa, Swaziland, Tanzania, Zambia and Zimbabwe33• A regional stock exchange not only implies important economies of scale, but would also facilitate access to international capital markets for new countries.
Mistry (op. cit) also suggests regional structures for commercial banks as exists in the CF A Zone, with common rigorous supervision and regulation structures. This would not only facilitate intraregional investment and portfolio flows, but would also encourage cross-border trade.
33 Mistry 1996.
EFA - Private Capital Flows to Sub-Saharan Africa: A Supply-Side Study

31
Box 5.2
THE ROLE OF THE COMMONWEALTH DEVELOPMENT CORPORATION
The UK Commonwealth Development Corporation has traditionally been an important investor in SSA, particularly via FDI. More recently, it has also started to develop other financing activities. In this section we will focus on CDC's new portfolio-related activities. These activities are of particular interest as they are undertaken by the recently created Financial Markets Division, whose aim is to provide funding for small and medium enterprises, via both debt products and risk capital. This Division is involved in 25 country funds, of which eight are in SSA. The funds are relatively small, ranging from $6 million to $25 million. They fund small, but mainly medium companies. Funding comes from the CDC and their European equivalents including a German and Swedish Fund, as well as local SSA institutions such as pension funds and banks. There are no foreign private investors.
The decision to create a fund for a particular country is based on two criteria. First, there must be sufficient size to support management costs; and second, sufficient market opportunities within that country, over a three year horizon. The funds are run on a commercial basis, and take commercial risks.
These activities are complemented by COMAFIN (the Commonwealth Africa Investment Fund) launched in late 1995 by the Commonwealth Finance Ministers. The objective of COMAFIN is to channel investments to support expansion of privati sed or privatising companies, as well as new ventures in SSA. Investment size will range between $0.5 million to $7.5 million.
The size of this ten year fund is $62.5 million, of which $25 million is invested by CDC. There are also commitments from Malaysia (through the Employee's Provident Fund) and Singapore (via the General Investment Corporation), as well as from the Government of Brunei. South Africa will invest through the Development Bank of South Africa, while Zimbabwe and other SSA countries' institutions are also expected to invest. It is expected that developed country private investors (e.g. institutional investors) will also participate in due course.
Though the funds originate at present mainly from the public sector, it is emphasised that COMAFIN will be run on strictly commercial terms. It will not compete with CDC's country funds, as COMAFIN's investments (at over $0.5 million) are larger than those of the country funds. COMAFIN can invest in any sector, although it is expected that not more than a third will be invested in any particular sector. It hopes to invest not just in resource based sectors, but also in services, tourism, private infrastructure, etc. It can invest in any SSA country except Nigeria (due to sanctions), and does not plan to invest more than 25 per cent in a specific country.
All COMAFIN investments will have equity features, though some may take the form of quasi-equity. This will encourage private investors, as they have different options according to the companies' outcome. It will also invest in unlisted companies. COMAFIN's normal investment strategy will be to invest as a minority equity partner, and seek participation on companies' boards, so as to play an active role in the development of company business. Thus, investments will be more like venture capital rather than pure equity investments.
COMAFIN will be run from Harare. It will have a Board of Directors representing major shareholders, as well as independent Directors. It will use CDC as Fund Manager, which will allow it to draw on its
EFA - Private Capital Flows to Sub-Saharan Africa: A Supply-Side Study

32
existing network of 12 officers in SSA, as well as on their experience with development capital.
Concerns about COMAFIN's ability to operative effectively as expressed by CDC officials, related to: o the need for an appropriate and stable tax, as well as regulatory regime; and o the need to reduce bureaucracy for investors.
Some countries were not seen as problematic in these respects (e.g. South Africa with taxation, and Uganda and Zambia with bureaucracy). It was also hoped that other countries' governments would be interested in providing non-discriminatory taxation and reduction of 'red tape', as this would not only help attract COMAFIN funds, but also other portfolio investors.
It is too early to assess the impact of COMAFIN, although several private portfolio investors welcomed its creation. One investor sees it as helpful in providing "positive reinforcement" by outside investors, encouraging the region "to continue down the road of economic liberalisation". Many investors regarded the presence of the CDC and other such organisations as a comfort.
However one investor, talking in general about organisations such as the CDC saw several practical problems. First, "an emphasis on number crunching, with no real analysis of the fundamentals of the business" can cause one to "easily lose track of the rationale for a project". Second, a tendency to adopt a "lender's mentality .... trying to plug the downside at any cost" tends to cloud understanding of the concept of risk and reward. It also increases inefficiency through bureaucracy, options, and shareholder agreements, which are easy to get around anyway when things go bad. Importantly, they can also "discourage good promoters from seeking finance from these sources". As a result, they end up with the poor promoters who are willing to sign any commitment, yet also ready to circumvent them.
EFA - Private Capital Flows to Sub-Saharan Africa: A Supply-Side Study

33
6. CREDIT RATINGS AND SSA
1. INTRODUCTION Although few SSA countries have had access to bonds (South Africa, Mauritius, Angola, Congo) obtaining a credit rating is key to floating a bond. Therefore it is necessary to know what affects them. Commercially available creditworthiness indicators are seen as an important determinant of international capital flows. While they do not attempt to predict future events, they reflect snapshot perceptions of a situation, and thus have a bearing on the future.
Agencies see a very wide audience for their credit ratings among banks, professional investors, and fund managers, with many "building in ratings as a mandatory part of the decision process". However, as this information is publicly available, there is no means of telling the total coverage, let alone the degree to which ratings are taken seriously.
For our purposes credit ratings agencies fall into two categories. First the formal agencies (lBCA, Standard and Poors, Moodys) impact on bond prices, the success of a bond launch, and possibly on mutual funds through the way they rate these funds. Other agencies (EIU, Institutional Investor, Euromoney) provide information people read occasionally and sometimes factor into their investment decisions. These are general, rather than specific, relative to the formal ratings, and are not taken as seriously.
It is worth looking at how credit raters see SSA countries, and if this information is founded on objective or subjective criteria. In general we find a highly subjective element in the way ratings are compiled, in spite of a seemingly scientific methodology. Further, while there are striking similarities in SSA rankings among the agencies, and the generally perceived trend that SSA countries have been doing better over time, there are distinct biases against the region. This is reflected in problems specific to rating SSA countries such as poor country coverage (Section 2), methodological biases (Section 3), and factors relating to the actual performance of the SSA region, and our project countries (Section 4).
2. COUNTRY COVERAGE Coverage varies among and within agencies. Since March 1994 Institutional Investor (II) has rated 135 countries, growing from 119 in March 1992. Euromoney's (EM) sample has altered greatly, steady at about 170 to September 1994, rising to 187 in March 1995, then falling back to about 181 34• EIU rated 91 "developing and highly indebted countries" in September 1996.
EM and II have the widest SSA coverage with 44 and 29 countries respectively, and include all our project countries. Strangely II does not rate Namibia (a strong performer economically). The EIU rates 15 SSA countries including South Africa, Zambia and Zimbabwe. Tanzania was added in September 1996, and Uganda surprisingly, is not rated. Also, EIU does not rate Mauritius (a strong economic performer), or Congo since 1994. SSA countries are poorly represented by the
34 Euromoney's increased sample in March 1995 included three SSA countries: Swaziland, Comoros, and Burundi.
EFA - Private Capital Flows to Sub-Saharan Africa: A Supply-Side Study

34
fonnal agencies. Standard & Poors and IBCA rate only South Africa. Moodys rates South Africa and Mauritius. Thus much of the following analysis will be based on the II, EM and EIU surveys.
Several factors may explain poor coverage by fonnal agencies. First, one Africa region official pointed out that staff resources are limited. Conversely, II and EM are more likely to rate a country as the evaluation process is less rigorous, relying on the opinions of a panel of experts. The EIU meanwhile, can draw upon extensive background material from its country reports.
Second, it is highly likely that limited coverage is related to the view that few SSA countries are worthy of an investment grade. "Only Botswana could be rated on a par with South Africa" said one official. But this is inconsistent with II which consistently rates Botswana and Mauritius above, EM just below, and EIU which rates Botswana and Namibia on a par with South Africa.
Third, as the onus is generally on the country itself to approach these agencies, few see the point if they are not issuing any bonds. This rules out most SSA countries.
This raises the issue of when a country should be rated formally. An official believes anytime is appropriate, saying five years ago only countries with investment grade would approach him. Now he would recommend others to: "a single 'B' rating might be worth getting, to signal to the market that there is a certain amount of infrastructure, government policy and so on, partly as something is better than nothing, but also there is increased appetite for risk if the rewards match it". Thus, the side-effect of a rating is that "it provides an external set of guidelines for internal governments. That is, we need to be good boys to keep this rating". Conversely, it is arguable that a country should apply for a rating only when it is investment grade or above, due to the danger of attracting the wrong kinds of capital, that may be expensive and short-term in nature.
3. METHODOLOGY The methodologies of the three agencies with the widest coverage are described in Box 6.1. The following analysis will evaluate these, drawing conclusions on objectivity and technique.
Institutional Investor Given lack of clearly defined method with disaggregation and weighting of criteria, we are confined to published observations about their own survey, which have appeared in two issues3s.There are inherent and significant biases and inconsistencies in scores, as II's experts have testified. In September 1993, II state their results "must be seen as arithmetical averages and not as evidence of consensus". This is due to "widespread and interesting differences in the scores each respondent gives to various countries", which result from a complex mix of factors: o Familiarity with one's neighbours is key. In 1993, a South African banker rated Cote
d'Ivoire at 35.0 (while it received 16.2 overall), Ghana at 48.0 (26.0 overall),Botswana at 65.0 (44.7 overall), and Uganda at 30.0 (8.4 overall). Similarly, a Singapore banker rated VietNam at 80.0, compared to its total ofI9.5. And Western Europeans tend to rate Eastern European states higher than do North Americans.
3S Institutional Investor, March 1996; September 1993.
EF A - Private Capital Flows to Sub-Saharan Africa: A Supply-Side Study

Box 6.1
Methodologies of the Raters
Each uses different groups of experts, and applies different combinations of weighted criteria:
Institutional Investor (as at September 1996)
35
The survey is based on responses from 75-100 of the largest commercial banks. Responses are weighted according to worldwide exposure, and sophistication of country-analysis systems. However, criteria used by each bank, their relative importance, and weights attached to individual answers, are not specified.
Euromonev (as at September 1996)
Based on assessments of 45 political risk specialists and economists at major financial institutions, its components are transparent:
1. Economic performance (25% of total- based on Euromoney projections); 2. Political risk (25% - based on responses from risk analysts); 3. Debt indicators (10% - using debt service / export, current account / GNP, external debt
/ GNP from World Debt Tables);
4. Debt defaulted or rescheduled (10% - from WDT, and Euromoney estimates); 5. Credit ratings (10% - averaging IBCA, Moodys and S&P ratings);
6. Access to bank finance (5% - the ratio of private, long-term, and non-guaranteed debt to GNP, taken from WD1);
7. Access to short-term finance (5% - based on export credit agency surveys); 8. Access to bond and syndicated loan markets (5% - Euromoney analysis); 9. Access to and discount on forfaiting (5% - from bank data).
Economist Intelligence Unit (as at December 1996, to be changed in 1997)
Ratings are based on EIU staff assessments. Weightings are roughly broken down as follows
1. Medium-term lending risk (45%) - 2 year averages of this calendar year and the next of: total debt / GDP, debt service ratio, current account / GDP, savings / investment ratio, build-up of arrears, recourse to IMF credit, reliance on a single export (each 5%), and interest payments ratio (10%);
2. Short-term trade risk (15%) - looking at: reserves / imports, current record on foreign exchange transfers for import payments, and relations with the IMF;
3. Political and policy risk (40%) - comprising factors relating to economic policy (20%), and political and strategic factors (20%).
Points are scored in increments of 5. Totals can lie between 0-100, the higher the score, the worse the performance. Therefore, a score closer to zero indicates greater creditworthiness and less risk. Each country is assigned to one of five categories of creditworthiness (A-E), depending on its overall score.
Sources: Institutional Investor 9/96; Euromoney 9/96; "Guide to the Ratings" in EIU Country Risk Service December Handbook (1996), with thanks to Sebastian Espinoza at EIU.
EF A - Private Capital Flows to Sub-Saharan Africa: A Supply-Side Study
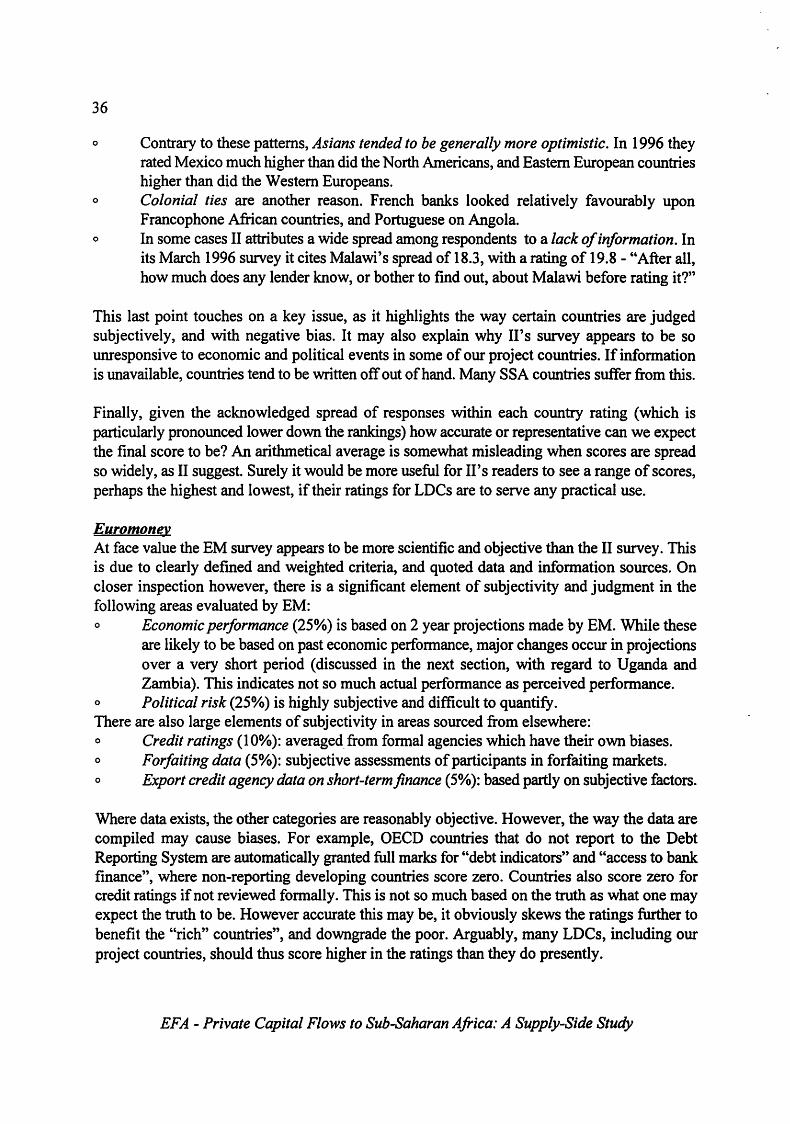
36
o Contrary to these patterns, Asians tended to be generally more optimistic. In 1996 they rated Mexico much higher than did the North Americans, and Eastern European countries higher than did the Western Europeans.
o Colonial ties are another reason. French banks looked relatively favourably upon Francophone African countries, and Portuguese on Angola.
o In some cases II attributes a wide spread among respondents to a lack of information. In its March 1996 survey it cites Malawi's spread of 18.3, with a rating of 19.8 - "After all, how much does any lender know, or bother to find out, about Malawi before rating it?"
This last point touches on a key issue, as it highlights the way certain countries are judged subjectively, and with negative bias. It may also explain why II's survey appears to be so unresponsive to economic and political events in some of our project countries. If information is unavailable, countries tend to be written off out of hand. Many SSA countries suffer from this.
Finally, given the acknowledged spread of responses within each country rating (which is particularly pronounced lower down the rankings) how accurate or representative can we expect the final score to be? An arithmetical average is somewhat misleading when scores are spread so widely, as II suggest. Surely it would be more useful for II's readers to see a range of scores, perhaps the highest and lowest, if their ratings for LDCs are to serve any practical use.
Euromonev At face value the EM survey appears to be more scientific and objective than the II survey. This is due to clearly defmed and weighted criteria, and quoted data and information sources. On closer inspection however, there is a significant element of SUbjectivity and judgment in the following areas evaluated by EM: o Economic performance (25%) is based on 2 year projections made by EM. While these
are likely to be based on past economic performance, major changes occur in projections over a very short period (discussed in the next section, with regard to Uganda and Zambia). This indicates not so much actual performance as perceived performance.
o Political risk (25%) is highly subjective and difficult to quantify. There are also large elements of SUbjectivity in areas sourced from elsewhere: o Credit ratings (10%): averaged,from formal agencies which have their own biases. o Forfaiting data (5%): subjective assessments of participants in forfaiting markets. o Export credit agency data on short-term finance (5%): based partly on subjective factors.
Where data exists, the other categories are reasonably objective. However, the way the data are compiled may cause biases. For example, OECD countries that do not report to the Debt Reporting System are automatically granted full marks for "debt indicators" and "access to bank finance", where non-reporting developing countries score zero. Countries also score zero for credit ratings if not reviewed formally. This is not so much based on the truth as what one may expect the truth to be. However accurate this may be, it obviously skews the ratings further to benefit the "rich" countries", and downgrade the poor. Arguably, many LDCs, including our project countries, should thus score higher in the ratings than they do presently.
EFA - Private Capital Flows to Sub-Saharan Africa: A Supply-Side Study

37
The analysis accompanying the EM survey results is very brief, and frequently overlooks SSA. This is a shame, as it gives the misleading impression that the survey is somewhat superficial. It also implies there is nothing new to report from Africa, which would reinforce peoples' existing negative impressions of the region. When SSA countries are mentioned, there is little or no study of factors determining their rating or rank, except mainly on South Africa, albeit briefly. For example, the extent of insight for the SSA region in a recent survey was: while "SSA countries continue to lose ground ..... South Africa can consider itself lucky to rise one place in the ranking to 48, despite the disastrous decline in the rand over the past six months"36.
Economist Intelligence Unit 37
Of the three agencies reviewed, the EIU produces the best informed and most objective results, with 60% of criteria determined objectively. The methodology is comprehensive, especially for Medium-Term Lending Risk and Short-Term Trade Risk, which are carefully disaggregated. As with EM, two year projections are used for the former. However, EIU projections appear to be more stable over time than those of EM.
Political and Policy Risk is especially difficult to measure. It comprises 40% of the EIU rating38, deliberately weighted "lower" overall as ''the model in effect emphasises the objective risks more than the subjective ones". The breakdown into economic and political factors is similar for EM and EIU. EM attach a 25% weighting to political risk, EIU 20%. EIU acknowledge the components of these as among the least easy to quantify, and thus a large element of personal judgment has to be used. Equally difficult is economic policy risk (20%), as this is in effect an assessment of "the capacity of the government in power to implement the measures necessary to stabilise the economy and meet its external commitments". However, given that EIU are basing such judgments on country reports produced regularly and comprehensively by dedicated teams of regional experts, their judgments should be better informed, and more reliable.
The scoring system may also contain inherent biases. While countries are judged on a scale of 0-100 scores are gained in increments of 5. This causes problems when criteria are disaggregated, as several, amounting to 35% of total, contribute a score of 5%each towards the total. Therefore, a country can only score full marks or no marks, failing or succeeding absolutely on each of these factors, rather like a yes or no answer. This suggests a country with moderately above average prospects on any of its ratios may be given the benefit of the doubt with top marks, whereas one with below average ones will not be credited at all. Also, in cycles of political or economic uncertainty, this system would exaggerate peaks and troughs. Countries scoring full marks on several criteria may all of a sudden score nothing, and this would be reversed with recovery.
Ironically, this may have the effect of widening and exaggerating the gap between rich and poor
36 Euromoney, September 1996. 37 Owing to our lack of accompanying analysis, we are unable at this stage to go into more detail. 38 Factors relating to economic policy (20%) include performance, growth prospects, management quality and
consistency, government attitude towards foreign investment, the ease with which structural policies can be made, the size and performance of the public sector. Political and Strategic Factors (20%) include operation of the political system, of the opposition party policies, the degree of enfranchisement, attitude towards foreign creditors, and "regional context".
EFA - Private Capital Flows to Sub-Saharan Africa: A Supply-Side Study

38
countries. Improvements in performance from a low level are not acknowledged, as for each criteria categorisation of success or failure is imposed, that is difficult to escape. This bias is worrying, as it covers such a large proportion of the overall mark.
Categorisations are further imposed depending on overall score. Countries are classified into 5 bands (A-E) with A being the most creditworthy and E the least39
• As the bands are fairly broad this adds further inflexibility in that improvements in performance, unless major or involving a minor movement across margins, will only be acknowledged in the disaggregated data.
In essence then, a rating is made up of a mixture of objectivity and perception, but largely the latter. In addition to the acknowledged subjectivity of some criteria, others which are supposed to be objective are revealed to have large subjective elements to them. The agencies would argue that subjective elements are the opinions of those likely to do the rating. But given evidence elsewhere in this study on systemic misperception of SSA, it is disappointing that many elements of the ratings are based on subjective opinions, often of those lacking sufficient knowledge about the region. These elements serve only to reinforce existing misperceptions.
4. SSA IN THE RATINGS How does SSA fare? o 26 of the 29 SSA countries II rates are well below the global average of38.9, as is the
Africa average (with North Africa) at 22. Twenty of the 30 lowest II countries are SSA. o EM and II show a degree of cross-consistency. Only 3 SSA countries are consistently
above average (South Africa, Botswana and Mauritius). The rest lag well behind, led by Zimbabwe, Ghana, and in varying orders, Gabon, Kenya, the Seychelles and Swaziland.
o EM consistently rates countries in Asia, the Middle East and Europe 10-20 points higher than Latin America and Africa. Thirty-nine of the bottom 89 are from SSA. Similarly, EIU assigns significantly positive values to Asian, then European countries, and a lower rating to African countries, according to Haque et aI.
Why? Based on the methodologies it is important to look at why SSA countries are where they are: 1. Global/regional factors o SSA countries' ratings have been reduced by their regional location due to the political,
economic, and social circumstances of their neighbours. Crises in neighbouring or economically similar countries impinge on a country's position. SSA has a reputation for political instability, and the result seems to be that all SSA countries are dragged down.
o Credit ratings have been increasing over time in both EM and II surveys. An increase in
39 Category A (0-20 points) satisfies the criteria stated in the methodology; B (25-40) means there are "no major risks with respect to international and financial transactions, but political and policy risk often needs to be watched carefully". C (45-55) means there are ..... persistent, but controllable, internal and external imbalances ..... With caution, this set of countries will often offer exciting opportunities for foreign investors". D (60-75) suffer ..... serious economic and political problems. .... Any investment or other international financial transactions should be very carefully considered and would best be postponed". E (80-100) indicates poor performance in all above criteria, and possibly danger of civil war or violent political change.
EF A - Private Capital Flows to Sub-Saharan Africa: A Supply-Side Study .

39
the SSA average is part of this trend. However, SSA countries are lagging behind, and are expected to stay there: "reflecting a generalised optimism, even Africa showed a modest gain". The trend in several recent II surveys reveals "the strong gains in other regions were echoed - but less vigorously - in Africa". According to one banker, "you know when banks are feeling better when Africa goes Up"40.
o Higher rankings are given to LDC exporters of manufactured goods in the EM and II surveys. The EIU index significantly downgrades only fuel exporters, and producers of primary products. This naturally relegates most SSA countries relative to Europe, Asia and Latin America according to Haque et al.
o Economies showing high single export dependence are downgraded, find Haque et al.
o Some factors affect regions equally. For example, Haque finds that high international interest rates (measured through the 3-month US T-Bill rate) adversely affect all countries, reducing a rating by 2 (EIU & II) and 7 (EM) points in the short-term, regardless of domestic economic developments.
o evidence from Haque et al shows agencies categorise countries in low and high inflation groups. The latter are considered "problem" countries. Once classified as such, the rating declines dramatically, and marginal changes in inflation are ignored by the agencies.
o Responsiveness to economic changes is generally slow, varying by agency. For example, economic upturn with improved creditworthiness after the debt crisis was plotted by EM in 1988, but not by II until 199041 . These lags can work against improving countries. Standard and Poors outlooks are 2-3 years ahead, with a formal review every year. According to a fonnal agency official "the idea is to come up with a stable rating, so they change very slowly". Surely though the idea should be for countries to be as stable as possible in creditworthiness, not agencies in evaluation. Ratings should reflect conditions as closely as possible. Not to do so devalues any practical significance. Any decisions made by investors on the basis of old and inaccurate information will be so affected.
2. Pro;ect Country Observations There is a degree of agreement among EIU, II at)d EM across countries in any given year. However, our project countries perform very badly. Graphs 6.1a-e, 6.2a-b, and Annex Tables 6.la-c, show how our project countries have been rated and ranked over the last 5 years42.
1. Relative positions II's and EIU's relative rankingsfor our project countries are the same and consistent over time,
40 Institutional Investor, September 1994. September 1996. and March 1994 respectively. 41 Haque et at (1996). 42 To obtain the percentile rank. the numerical rank of each country is divided by the number of countries in the
sample for each survey. This enables us to look at how our countries are moving relative to the rest, regardless of sample size.
EF A - Private Capital Flows to Sub-Saharan Africa: A Supply-Side Study

40
whereas those for EM change. South Africa is consistently rated top in all three, followed by Zimbabwe. Tanzania, Uganda and Zambia are ranked very low.
Since September 1992, II has ranked Tanzania, Zambia and Uganda in this order. Similarly, Tanzania was included for the first time in EIU's September 1996 survey, above Zambia, but Uganda was excluded. Interestingly though, Uganda's II rating has tripled over the 5 year period, with an increase for Tanzania and Zambia of 50%. However, ranking has remained fairly constant: the rating increase has been mainly part of an upward global trend. In spite of these significant changes, these countries remain very low in the ratings.
EM's relative positions have changed regularly. Since March 1996 Uganda, rising 54 places with its rating nearly doubled, has risen well above Zambia and Tanzania. Zambia itself rose by 22 places. There is however, no accompanying analysis to justify such radical shifts, although this new-found favour has taken place in the context of a general SSA decline.
South Africa and Zimbabwe's relative positions have changed little over time (Graphs 6.2a and b). However, the gap between the stronger economies of South Africa and Zimbabwe and the rest is narrower for EM than II, and appears to be closing. This is largely due to the sudden rise in the rankings and ratings of Uganda and Zambia. The corresponding gap in the II survey is much wider, and has closed only slightly, due to the initially low starting positions of Tanzania, Zambia and Uganda. In the 1992 surveys Uganda was placed last in the total sample!
2. Differences in rating level Strikingly the EM ratings for our study countries are consistently and significantly higher than in the II survey for the entire period (Graphs 6.la-e, 6.2a-b). EM rates South Africa 15-25% higher than II, and Zimbabwe 15-20%. EM has steadily ranked South Africa among the top 24-29%, but II in the top 34-40%. Zimbabwe's progress for EM has been more uneven, with highs in March 1993 and September 1995, and a low in March 1994. The gaps for Tanzania, Uganda and Zambia vary more, but this is due to the relatively smooth rising trend in the II ratings, set against the more volatile, but upward trend of the EM survey. Nevertheless, all three countries' EM ratings have risen faster than their II ratings.
The EIU ratings by comparison vary from country to country, but generally lie below those of EM and above II. Its South Africa rating has been close to EM since March 1994 however. Conversely, Zambia's rating (very constant overtime) has been diverging from EM, and moving closer to II (Graph 6.ld). Apart from a major collapse between March 1992 and March 1993, Zimbabwe's EIU rating has moved with EM, matching it between March 1995 and March 1996.
3. Country trends and ratings volatility Tanzania, Uganda and Zambia show a steady upward rise, albeit from very low levels in EM and II surveys. Uganda and Zambia have improved ratings greatly for both, particularly between September 1995 and March 1996. For EM, where disaggregated infonnation is available, it is necessary to look at the components of this rise in order to establish the causes of this volatility.
EF A - Private Capital Flows to Sub-Saharan Africa: A Supply-Side Study
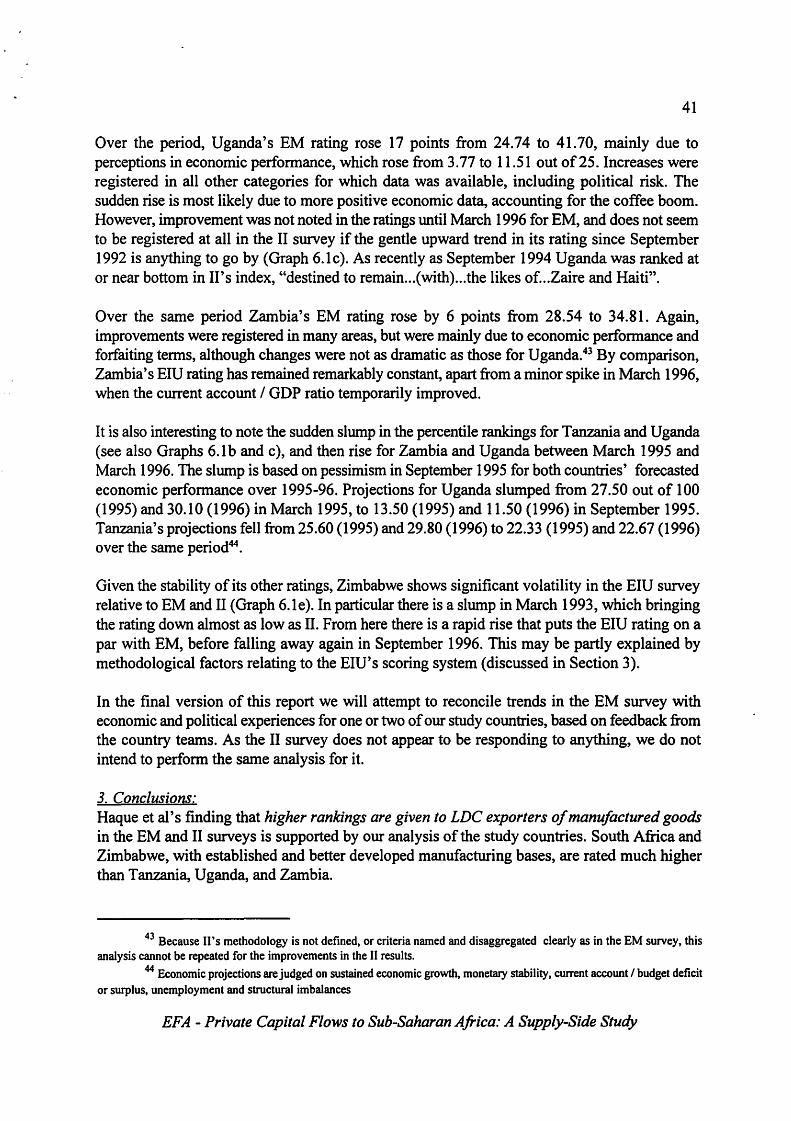
41
Over the period, Uganda's EM rating rose 17 points from 24.74 to 41.70, mainly due to perceptions in economic performance, which rose from 3.77 to 11.51 out of25. Increases were registered in all other categories for which data was available, including political risk. The sudden rise is most likely due to more positive economic data, accounting for the coffee boom. However, improvement was not noted in the ratings until March 1996 for EM, and does not seem to be registered at all in the II survey if the gentle upward trend in its rating since September 1992 is anything to go by (Graph 6.1 c). As recently as September 1994 Uganda was ranked at or near bottom in II's index, "destined to remain ... (with) ... the likes of ... Zaire and Haiti".
Over the same period Zambia's EM rating rose by 6 points from 28.54 to 34.81. Again, improvements were registered in many areas, but were mainly due to economic performance and forfaiting terms, although changes were not as dramatic as those for Uganda.43 By comparison, Zambia's EIU rating has remained remarkably constant, apart from a minor spike in March 1996, when the current account / GDP ratio temporarily improved.
It is also interesting to note the sudden slump in the percentile rankings for Tanzania and Uganda (see also Graphs 6.1b and c), and then rise for Zambia and Uganda between March 1995 and March 1996. The slump is based on pessimism in September 1995 for both countries' forecasted economic performance over 1995-96. Projections for Uganda slumped from 27.50 out of 100 (1995) and 30.10 (1996) in March 1995, to 13.50 (1995) and 11.50 (1996) in September 1995. Tanzania's projections fell from 25.60 (1995) and 29.80 (1996) to 22.33 (1995) and 22.67 (1996) over the same period44
•
Given the stability of its other ratings, Zimbabwe shows significant volatility in the EIU survey relative to EM and II (Graph 6.1e). In particular there is a slump in March 1993, which bringing the rating down almost as low as II. From here there is a rapid rise that puts the EIU rating on a par with EM, before falling away again in September 1996. This may be partly explained by methodological factors relating to the EIU's scoring system (discussed in Section 3).
In the final version of this report we will attempt to reconcile trends in the EM survey with economic and political experiences for one or two of our study countries, based on feedback from the country teams. As the II survey does not appear to be responding to anything, we do not intend to perform the same analysis for it.
3. Conclusions: Haque et al' s finding that higher rankings are given to LDC exporters of manufactured goods in the EM and II surveys is supported by our analysis of the study countries. South Africa and Zimbabwe, with established and better developed manufacturing bases, are rated much higher than Tanzania, Uganda, and Zambia.
43 Because II's methodology is not defined, or criteria named and disaggregated clearly as in the EM survey, this analysis cannot be repeated for the improvements in the II results.
44 Economic projections are judged on sustained economic growth, monetary stability, current account I budget deficit or surplus, unemployment and structural imbalances
EFA - Private Capital Flows to Sub-Saharan Africa: A Supply-Side Study

42
Also, their finding that economies showing high single export dependence are downgraded, is consistent with our study country experience. South Africa and Zimbabwe have broad export bases, whereas Uganda (coffee) and Zambia (copper) tend to be heavily reliant on one primary export. The same applies to Tanzania, but to a lesser degree. As a result, these economies are vulnerable to the volatility of a single commodity price. Thus, Uganda's sudden improvement in the ratings could be attributed mainly to the major rise in coffee prices in 1993-4.
Data quality and availability: sudden changes in results do not mean these countries have made overnight economic and political improvements. Rather, they may have gradually established a consistent track record, but EM raters have changed their perceptions suddenly. Possibly they are looking at these countries more favourably due to access to more up-to-date and positive economic data. One can speculate the same is true to a degree of respondents to the II survey, although ratings remain very low. But II results may be indicative of long-term perceptions where EM highlights more the short-term ones. However, the conclusion that EM is more responsive than II due to relatively more objective and scientific methodology, are borne out here. The EIU is perhaps best placed, with access to data accumulated via their country reports.
Subjectivity: the treatment of our project countries confirms the earlier critique that subjectivity influences changes in ratings over time. As II appears the most subjective, this may explain the lower ranking of our project countries, suggesting a negative SSA bias in the subjective elements. In the later version of this study it would be useful to check the extent of this bias, to see if it is LDC or SSA specific. This would involve looking in detail at how the ratings are broken down, and interviewing some of the raters where disaggregation is lacking.
5. CONCLUSION Given these faults, do ratings really matter? Ratings were not cited by our respondents as key to their investment decisions for any type of flow. If they are to have any bearing, it is likely to be on bond holders. Formal ratings would have an effect on price, and on the feasibility of launching a bond. As bonds apply to a few SSA countries anyway, there is no relevance as yet to most SSA countries, within which portfolios cannot be diversified in this direction. Well-informed ratings based on country-specific analysis such as EIU may well influence some investors or lenders to individual countries. However it is unlikely that the superficially assembled ratings of II, and to a lesser extent EM, serve any purpose other than to reinforce the misperceptions of those ignorant about the SSA region. There is scope therefore, for potential investors to learn more about the region. This would be aided by credit ratings whose subjective elements were based on informed opinion.
EFA - Private Capital Flows to Sub-Saharan Africa: A Supply-Side Study

Graph 6.1 a: South Africa's Rating (1992-96)
65.-----------------------------------------~~----~
60 --------------- ____ .J;+-~~'___
55 -
50 r -------{'q---~~__A_-_P'>_ - - - - - - - - - - - - - - - - - - - - - - - - - - - - - - - -
45 T --------------------------------------------
40 - - - - - - -
35~_r----r_--_r----+_--_+----+_--_+----4_--~----~~ 3/92 9/92 3/93 9/93 3/94 9/94 3/95 9/95
-e- EIU
Graph 6.1 b: Tanzania's Rating (1992-96)
3/96 9/96
35~----------------------------------------------------~
251- --------------------
20 - - - - - - - - - -
15 - - - - - - - - - - - - - - - - - - - - - - - - - - - - - - - - -
10 ---------------------------------------------------------------
4
5~~----+_----~--_+----~----+_--_4----~----4_----~~
~ Institutional Investor ~ Euromoney -e- EIU
EFA - Private Capital Flows to Sub-Saharan Africa: A Supply-Side Study

44 Graph 6.1 c: Uganda's Rating (1992-96)
50 I I 40 r : : : : : : : : : : : : : : : : : : : : : : : : : : : : : : : : : : : : : : : : : : : : : : : : : -: : -: : : : : : :I:::::::::-::::--::-:~~:::-:-:--::-:;~::::::-~~--:::-::-----:
1-- _______________________________________________ _ I
10 + -------------------------i
0~_r----+_--_+----~--~~--_r----~--_+----4_----~ 3/92 9/92 3/93 9/93 3/94 9/94 3/95
___ Institutional Investor -SQl- Euromoney
Graph 6.1d: Zambia's Rating (1992-96)
9/96
:: t ---------------------------------------------------------------:: t:--------------------
15 t ----------------------------------------10 --__ - ___
5~_r----~----+_--~~--_+----~----+_----~--~----_+~
___ Institutional Investor ---9-- Euromoney -e- EIU
EFA - Private Capital Flows to Sub-Saharan Africa: A Supply-Side Study

Graph 6.1 e: Zimbabwels Rating (1992-96)
45 t ~ -~ ~ ~ ~ ~ ~ ~ ~ ~ -~ ---:: f ~ ~ ~ ~ ~ ~ ~ ~ ~ ~ ~ ----~ ~ ~ ~ -~ ~ ~ ~ ~ ~ ~ ~ ~ ~ ~ ~ ~ ~ ~ ~ ~ ~ ~ ~ ~ ~ ~ ~ ~ ~ ~ ~ ~ ~ ~ ~ ~ ~ ~ ~ ~ ~ ~ ~ 30 1_ ------------- --------------------- -----------------------
25~~----+----+----~--~r----r----+----4----~----~~ 3/92 9/92 3/93 9/93 3/94 9/94 3/95 9/95 3/96 9/96
___ Institutional Investor -9- Euromoney -e- EIU
EFA - Private Capital Flows to Sub-Saharan Africa: A Supply-Side Study
4
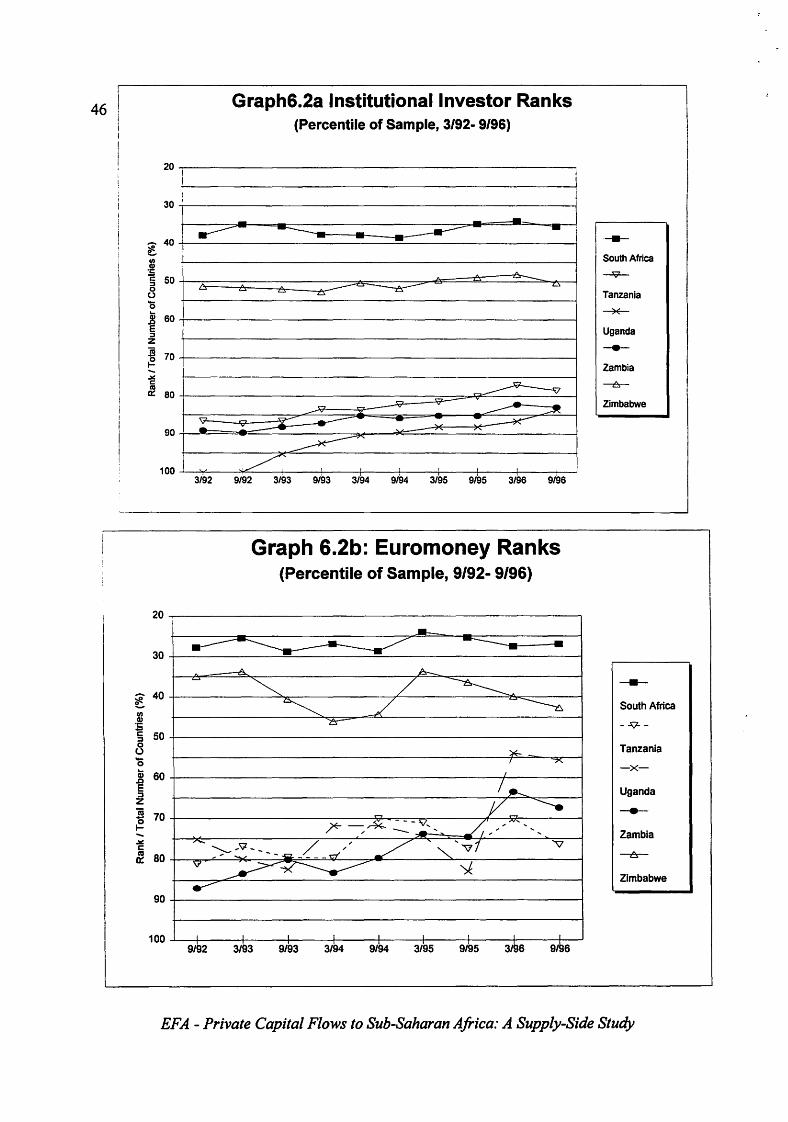
46
20
30 i
- 40 C II) Q)
:s c 50 ;:, 0 u '0 il 60 E :J Z
S 70 ~ -~ C III
" 80
90
100
20
30
- 40 ~ II) Q)
01::
C 50 :3 0 0 '0 C; 60 .a E :3 z g 70 0 ~ -~ c: co 80 0::
90
100
Graph6.2a Institutional Investor Ranks (Percentile of Sample, 3/92· 9/96)
- - --.----~ -----~ - ----- --- - ---A A -h.
--t!s:" ~
~ ~ -a-
~~ ~ a..
or> ~. "'T --- ::::JI!
'1:7-- ~ ~ --- -- ~ -- 'V" ---- ~ " ....
~ ,~
3/92 9/92 3/93 9/93 3/94 9/94 3/95 9/95 3/96 9/96
Graph 6.2b: Euromoney Ranks (Percentile of Sample, 9192- 9196)
3/95
--South Africa
-9-
Tanzania
~
Uganda
--Zambia
----6-
Zimbabwe
---South Africa
- s:::l- -
Tanzania
-x-
Uganda
---Zambia
-6-
Zimbabwe
EFA - Private Capital Flows to Sub-Saharan Africa: A Supply-Side Study

47
7. CONCLUSIONS AND RECOMMENDATIONS
This paper has looked at the factors which detennine flows to SSA based on extensive interviews with suppliers of flows and a comprehensive literature survey. It confirms Kasekende, Kitabire and Martin's (1996) finding that capital flows to SSA are small in global terms (though often larger than recorded), and that a high proportion of flows are volatile, notably short-term bank loans and portfolio flows. The most important category of long-term flows is FDI, which is concentrated in mining and energy. Mediwn-tenn bank lending is unfortunately "the dog that did not bark", as SSA has been unable to remove its debt overhang. However, it also suggests many measures which African governments (aided by donors, multilateral agencies and others) could take to encourage flows, which are analysed below:
7.1. ACTIONS ON FDI o diversify sectors and source countries of FDI. For example, there is much scope for
attracting Japanese investment. Malaysia and Indonesia are showing increasing interest in SSA, which is a positive sign that Asia-Africa economic links can be strengthened.
o target promotion efforts, based on more analysis of motivations underlying firms and sectors' investment policies, and of how to retain existing investment.
o continue to encourage the return of Asian investors, particularly to East Africa, through publicity campaigns, and legal and transparent processes for returning seized assets.
o maintain economic and political stability. This is particularly vital for FDI, because it is largely irreversible, making investors are cautious about potential future instability. In particular, governments must avoid major policy reversals, to convince the international fmancial community of policy credibility and commitment. A logical concomitant of this is gradualism in policy reforms, particularly in lifting foreign exchange restrictions, to ensure policy sustainability and economic stability.
o enhance forex availability by reducing the debt overhang.
o accelerate investment in infrastructure - look into co financing projects with the international private sector, and the IFC.
o invest in training in education, to improve skill and productivity levels, and give Africans scope to be promoted to senior managerial or engineering posts. State-run training programmes closely collaborating with private investors should be considered.
o conduct privatisation freely and transparently, and publicise it fully in the international press, to ensure that foreign investors are full informed.
o reinforce investment promotion centres. They need to be more proactive, not only involve travelling to sell ideas to potential investors, but also hand-holding investors through
EFA - Private Capital Flows to Sub-Saharan Africa: A Supply-Side Study

48
bureaucratic and administrative headaches. Governments also need to ensure that there is no duplication of bureaucracy with ministries. There may be scope for sub-contracting functions to local private banks (if they are well-developed) on a results fee basis.
o accelerate anti-corruption measures, particularly upward reviews of civil service salaries.
7.2. ACTIONS ON BANK LENDING o monitor short-term lending to encourage less volatile and counter-cyclical flows.
o reduce total external debt dramatically to facilitate creditworthiness. This will depend on action by official creditors, especially on multilateral debt;
o encourage selective debt-equity conversions, both for commercial and official bilateral debt, to create marketable financial instruments and '~ump start" FDI in privatisations and in "greenfield" investments. Foreign banks' involvement could, as in several Latin American countries, encourage them to lend to improving SSA countries;
o strengthen domestic banks, for example by cleaning their overhang of bad debts - though this is an extremely complex task (Njinkeu 1997; Soyibo 1997);
o attract foreign banks to open or re-open branches, possibly through privatisation of stateowned banks;
o encourage cofinancing and guarantees of private bank loans by donors and international institutions (such as CDC, IFC and MIGA), especially on BOT schemes;
o supply regular information to the Bank of England and other OECD Central Banks on positive developments in SSA economies, and encourage them to modify their risk assessment to reduce provisioning requirements of commercial banks making new loans;
o provide additional information to OECD export credit agencies, and encourage them to change their cover policies as an incentive for medium-term lending.
7.3. ACTIONS ON PORTFOLIO FLOWS Several priority steps to encourage portfolio flows are the same as for FDI - rapid progress in privatisation, clarification of property rights, and reducing corruption. However, there are more specific measures which relate more directly to portfolio equity flows: o create national or regional stock exchanges, and encourage companies in countries
without exchanges to list on regional or larger exchanges.
o improve procedures in stock markets, especially on regulation, settlement and custody, in order to reduce delivery time and comply with US Securities' Exchange Commission regulations which require securities and cash held by US investors have to be held either
EFA - Private Capital Flows to Sub-Saharan Africa: A Supply-Side Study

49
by US banks or by "eligible custodians" (see also Emenuga 1997; and N'Guessan 1997).
o increase the number of (especially local) companies listed. Even state-owned companies not targeted for privatisation can sell a small percentage of shares to the public
o improve information on company performance by tightening accounting and auditing standards, and promoting local brokers, if necessary with capacity building programmes;
o maximise stability of flows by encouraging the growth of closed-end funds, and the participation of non-Anglo Saxon and institutional investors;
o improve the tlfundamental balance" (current account deficit minus net FDI flows);
o improve coverage of international indices. The IFC could be active here, including more SSA countries in its index, and encouraging commercial analysts to expand their indices.
7.4. ACTIONS ON CREDIT RATINGS As only South Africa is rated by formal agencies, the quality of evaluation by informal agencies needs to be high. Ratings must be consistent, transparent, objective and credible, by: o extending country coverage to all SSA countries with prospects of creditworthiness;
o clear and well-explained methodology, with weightings specified for each component;
o objective data compilation, for example citing ranges rather than averages of expert opinions, and giving estimated scores rather than zeros where data is missing.
o up-to-date and complete data, ensuring a maximum 6-month time lag, which would increase the responsiveness and accuracy of the rating;
o giving minimum weight to subjective opinion, basing tlopinion" on the widest possible range of views of experts who are well-informed about SSA, and minimising subjective elements within categories that are supposed to be objective.
7.5. OVERALL ACTIONS This study has shown that there is much scope for Africa to improve its efforts to attract specific types of foreign private capital flows. However, four wider caveats should direct such efforts:
o it is more valuable to encourage long-term flows (FDI, long-term bank lending, longterm bonds) to finance long-term investment. FDI can have added benefits of technology and skills transfer. Potentially volatile flows, like foreign purchases of short-term Treasury Bills, or short-term bank loans, are far less valuable for development - with the possible exception of trade finance. There is always the danger that large short-term flows will leave rapidly, causing balance of payments problems in countries with unstable and fragile economies. Far greater priority should be given to long-term flows.
EFA - Private Capital Flows to Sub-Saharan Africa: A Supply-Side Study

50
o though flow-specific policies are sometimes important, the crucial factor influencing all flows is a good macroeconomic record (including high growth, low inflation, relative stability in real exchange rates and high investment rates). Countries which score highly on these (such as Chile and South East Asia) attract large and predominantly long-term foreign capital flows without necessarily having flow-specific incentives. A recent study (Bhattacharya, Montiel and Sharma 1996) finds that SSA countries with higher growth, greater openness, greater stability in real exchange rates, low debt and high investment rates have attracted more capital. The first three were particularly important for FDI, and the last two for private loans. This impli~s not only that African governments need to persist with policy reform, but also that structural adjustment programmes should modify . their focus, to improve growth in GDP and consumer demand, exchange rate stability, financial sector development, domestic savings and investment, and protection against external shocks. These issues will be the focus of the country case studies in this project.
o there has been too much focus on individual SSA economies attracting flows from individual OECD economies. SSA governments and companies need also to overcome their small markets by accelerating regional cooperation. Progress in trade integration will make the region more attractive to FDI, though the benefits may be unevenly spread. Regional bourses will enhance portfolio flows, and regional banks, bank supervision and macro policy harmonisation will help in the longer term. Similarly, in all types of flows, non-western sources are growing fast. This is particularly true for Asian investors who are returning to East Africa: but new investors from Asia are joining them in showing greater flexibility and lower-risk aversion than OECD counterparts. Special efforts to encourage "South-South" investors are likely to bear most fruit.
o for all types offlow, some barriers are not objectively measurable. As important are the subjective misperceptions and prejudices of investors and lenders, which highlight problems, and understate positive trends such as recent rapid growth in several countries. This stems partly from lack of information. Suppliers of private capital, particularly portfolio investors, make less effort to get up-to-date information on small markets, because such information is expensive in proportion to potential profits. It is therefore difficult for investors, lenders and other influential bodies (export credit agencies, credit rating agencies and bank supervisors) to overcome a historical image of poor economic performance and political instability, and give due attention to recent improvements.
Those wishing to encourage private flows to SSA therefore have four tasks. First, they need to encourage removal of flow-specific barriers, especially for long-term flows. Second, they need to press for modification of structural adjustment programmes. Third, they need to encourage regional integration and South-South cooperation. Fourth, they must emphasise actions that will "spread the good news" to overcome Africa's image of poor economic performance and political instability, by presenting the recent improvements in many countries objectively and forcefully to potential sources of private capital. Only such a four-pronged strategy can allow Sub-Saharan Africa to attract and sustain desirable foreign private capital flows in the next decade.
EFA - Private Capital Flows to Sub-Saharan Africa: A Supply-Side Study

51
REFERENCES
Africa Financing Review, various issues, especially November 1996.
African Development Bank (1993) Economic .Integration in Southern Africa Vol 2.
Anglo American Corporation of South Africa Limited (1996) Annual Report and Chairman's Statement.
Bhattacharya, A.; Montiel, P. and Sharma, S. (1996) "Private Capital Flows to Sub-Saharan Africa: An Overview of Trends and Determinants", draft, 5 December.
Bennell, P. (1995) "British Manufacturing Investment in Sub-Saharan Africa: Corporate Responses During Structural Adjustment", Journal of Development Studies, Vo1.32, No.2, December, pp.195-217.
Calvo, G. and Mendoza, E. (1995) "Reflections on Mexico's Balance of Payments Crisis", mimeo, October, University of Maryland.
EIU Country Risk Service, December Handbook 1996.
EIU Country Risk Service, Risk Ratings Review, quarterly reports 1992-1996.
Emenuga, C. (1997) "Development of Stock Markets in Sub-Saharan Africa", paper prepared for the second AERC Senior Policy Seminar, Abidjan.
Emerging Market Investor, various issues, particularly June 1996.
Euromoney (March and September issues, 1992-96)
Griffith-Jones, S. (1996) "Study of Movement of Funds on the Global Market", prepared for Grupo de Analise e Pesquisa, Presidencia de Republica, Brazil. IDS.
Haque, N.U., Kumar, M.S., Mark, N., and Mathieson 0.1 (1996) "The Economic Content of Indicators of Developing Country Creditworthiness", IMF Working Paper WP/96/9. IBCA Ratings September J 996.
IBCA Ratings, various issues, particularly September 1996.
IMF (1996) World Economic Outlook.
IMF (1996) International Capital Market Report.
EF A - Private Capital Flows to Sub-Saharan Africa: A Supply-Side Study

52
IMF Balance of Payments Manuals (1977, 1993).
Institutional Investor (March and September issues, 1992-96)
Kasekende, L.; Kitabire, D. and Martin, M. (1996) "Capital Inflows and Macroeconomic Policy in Sub-Saharan Africa", paper prepared for the G24, March.
London Economics (1996) Costs and Benefits Associated with Commercial Debt Buy Back Operations in SSA, Mimeo. Report to ODA, July.
Martin, M.; Griffith-Jones, S.; Kasekende, L. and Kitabire, D. (1995), Capital Flows and Macroeconomic Policy in Eastern and Southern Africa, Project Document to Sida and Danish Foreign Ministry, External Finance for Africa, December.
Mauritius Fund Management Company Limited Shareholders Bulletin for December 1996.
Micropal Emerging Market Fund Monitor (various issues)
Mistry, P. (1996) "Regional Dimensions of Structural Adjustment in Southern Africa", paper prepared for a F ondad Conference on Regional Integration in Africa, 5-7 February.
Mistry, P. and Griffith-Jones, S. (1993) Debt Conversionfor Low-Income Countries, UNCTAD.
Moodys, various press releases and publications.
N'Guessan, T. (1997) "Refonne des Institutions Financieres Non-Bancaires, Mobilisation et Allocation des Resources Domestiques: Le Cas de la BVA", paper prepared for the second AERC Senior Policy Seminar, Abidjan.
Njinkeu, D. (1997) "Impact of Banking Sector Reforms in Francophone Africa", paper prepared for the second AERC Senior Policy Seminar, Abidjan.
OECD, Detailed Benchmark Definitions of FDI (1992)
Riddell, R. and Cockcroft, L. (1991) "Foreign Direct Investment", in African External Finance in the 1990s: A World Bank Symposium, Husain, I. and Underwood, 1., eds., World Bank.
Soyibo, A. (1997) "Banking Sector Reforms in Africa: Effects on Savings, Investment and Financial Development", paper prepared for the second AERC Senior Policy Seminar.
Standard and Poors, various press releases and publications.
UNCTAD World Investment Report 1996.
EFA - Private Capital Flows to Sub-Saharan Africa: A Supply-Side Study

53
UNCTAD World Investment Report 1995.
UNCTAD (1995) FDI in Africa.
Van Hulten, M. and Schuennan, M. (1996) "Country Credit Ratings from Sub-Saharan Africa, or Perceptions on the Creditworthiness of a Poor Continent", Global Coalition for Africa.
World Bank, World Debt Tables 1996, Volume 1.
World Bank/lMF Emerging Markets, issue of 30/9/96 (article by Patrick Smith).
EFA - Private Capital Flows to Sub-Saharan Africa: A Supply-Side Study

'. ~ "
ss
ANNEX TABLES
Table 6.1a: INSTITUTIONAL INVESTOR'S SOVEREIGN RATINGS AND RANKING FOR THE PROJECT COUNTRIES (1992-96)
3/92 9/92 3/93 9/93 3/94 9/94 3/95 9/95 3/96 9/96
South Africa 39.3 39.8 39.8 38.2 38.9 40.0 42.5 45.2 46.3 46.3 (45) (44) (45) (50) (51) (52) (50) (47) (46) (48)
Tanzania 12.5 11.8 12.9 14.0 13.9 15.2 15.5 16.7 17.7 18.1 (103) (110) (110) (111) (I 13) (111) (I 10) (108) (104) (106)
Uganda 5.5 5.2 7.3 8.4 10.1 11.6 12.9 13.1 14.5 16.1 (119) (126) (121) (123) (122) (121) (119) (119) (117) (113)
Zambia 9.8 9.5 11.7 12.4 13.1 13.9 14.6 15.1 15.7 16.5 (106) (113) (112) (116) (115) (116) (115) (115) (111) (I 12)
Zimbabwe 28.3 26.1 27.7 26.9 27.9 29.0 30.7 31.0 32.2 32.5 (61) (65) (66) (70) (68) (70) (67) (66) (65) (68)
/i..OTES: Bracketed information denotes global rank. Institutional Investor grades country risk on a scale of 1-100: 100 being entirely risk free, 0 being the worst.
Table 6.1b: EUROMONEY'S SOVEREIGN RATINGS AND RANKING FOR THE PROJECT COUNTRIES (1992-96)*
9/92 3/93 9/93 3/94 9/94 3/95 9/95 3/96 9/96
South Africa 53.90 59.04 60.04 60.25 58.96 62.86 63.56 64.86 62.30 (47) (43) (49) (45) (48) (45) (46) (49) (48)
Tanzania 19.31 22.68 25.15 27.47 31.89 29.58 27.57 32.34 29.52 (137) (130) (135) (133) (117) (133) (140) (125) (136)
Uganda 22.34 21.06 24.22 31.14 31.39 28.40 24.74 41.70 37.65 (127) (135) (140) (120) (120) (139) (150) (96) (99)
Zambia 17.68 20.29 24.91 25.96 26.23 28.56 28.54 34.81 32.76 (147) (141) (136) (139) (133) (138) (135) (I 13) (120)
Zimbabwe 42.67 44.78 45.02 42.69 44.95 50.13 49.41 50.49 46.14 (59) (57) (69) (77) (74) (63) (66) (71) (76)
NOTES: * No survey was conducted in March 1992. Bracketed information denotes global rank. Euromoney grades country risk on a scale of 1-100: 100 being entirely risk free, 0 being the worst.
EFA - Private Capital Flows to Sub-Saharan Africa: A Supply-Side Study

, ."
56
Table 6.1c: ECONOMIST INTELLIGENCE UNIT'S SOVEREIGN RATINGS FOR THE PROJECT COUNTRIES (1992-96)*
3/92 9/92 3/93 9/93 3/94 9/94 3/95 9/95 3/96 9/96
South Africa 55 50 50 50 50 55 60 60 60 60 (C) (C) (C) (C) (C) (B) (B) (B) (B) (B)
Tanzania N/A N/A N/A N/A N/A N/A N/A N/A N/A 30 (D)
Zambia 20 20 20 20 20 20 20 20 25 20 (E) (E) (E) (E) (E) (E) (E) (E) (D) (E)
Zimbabwe 40 35 30 35 40 40 50 50 50 50 (D) (D) (D) (D) (D). (D) (C) (C) (C) (C)
NOTES: * EIU publishes ratings quarterly, but for ease of comparison with other raters, and as they are highly stable over time, we use only the March and September surveys. Bracketed information denotes global category, as dermed in the methodology. No information is as yet available to us on EIU's global rankings. EIU grades country risk on a scale of 1-100: 0 being entirely risk free, 100 being the worst. For sake of comparison with the other raters, we have reversed this scale, by subtracting EIU's rating from 100.
EFA - Private Capital Flows to Sub-Saharan Africa: A Supply-Side Study