PRISM Program Evaluation - Federal Motor Carrier Safety ... Program Evaluation . 5. Report Date...
94
PRISM Performance & Registration Information Systems Management Program Evaluation August 2007 FINAL REPORT Prepared For: Prepared By: Federal Motor Carrier Safety Administration Strategic Planning and Program Evaluation Division MC-PRS 1200 New Jersey Avenue SE Washington, DC 20590 John A. Volpe National Transportation Systems Center Motor Carrier Safety Division RTV-3E 55 Broadway Cambridge, MA 02142 This document is prepared as part of the Federal Motor Carrier Safety Administration (FMCSA) predecisional process and contains opinions and evaluations by the Agency prepared in connection with an evaluation and review of Agency programs. This document contains summaries and Agency evaluations of data. This document is not intended for public disclosure and is protected from disclosure by the deliberative process privilege. Re- dissemination of this document without the prior written permission of the authors is expressly prohibited. FOR INTERNAL FMCSA USE ONLY. None of the contents of this report, in whole or in part, should be released to an external individual or entity without the specific and express approval of the Director, Office of Policy, Plans & Regulation.
Transcript of PRISM Program Evaluation - Federal Motor Carrier Safety ... Program Evaluation . 5. Report Date...

PRISM Performance & Registration Information Systems Management
P r o g r a m E v a l u a t i o n
August 2007 FINAL REPORT Prepared For: Prepared By: Federal Motor Carrier Safety Administration Strategic Planning and Program Evaluation Division MC-PRS 1200 New Jersey Avenue SE Washington, DC 20590
John A. Volpe National Transportation Systems Center Motor Carrier Safety Division RTV-3E 55 Broadway Cambridge, MA 02142
This document is prepared as part of the Federal Motor Carrier Safety Administration (FMCSA) predecisional
process and contains opinions and evaluations by the Agency prepared in connection with an evaluation and review of Agency programs. This document contains summaries and Agency evaluations of data. This document is not intended for public disclosure and is protected from disclosure by the deliberative process privilege. Re-dissemination of this document without the prior written permission of the authors is expressly prohibited. FOR INTERNAL FMCSA USE ONLY. None of the contents of this report, in whole or in part, should be released to an external individual or entity without the specific and express approval of the Director, Office of Policy, Plans & Regulation.

PRISM Program Evaluation
August 16, 2007 i

Technical Report Documentation Page 1. Report No.
2. Government Accession No.
3. Recipient’s Catalog No.
4. Title and Subtitle PRISM Program Evaluation
5. Report Date August 2007
6. Performing Organization Code
7. Author(s)
8. Performing Organization Report No.
9. Performing Organization Name and Address U.S. Department of Transportation Research and Innovative Technology Administration John A. Volpe National Transportation Systems Center Motor Carrier Safety Division (RTV-3E) 55 Broadway Cambridge, MA 02142-1093
10. Work Unit No. (TRAIS)
11. Contract or Grant No.
12. Sponsoring Agency Name and Address U.S. Department of Transportation Federal Motor Carrier Safety Administration
13. Type of Report and Period Covered Final Report
Strategic Planning and Program Evaluation Division (MC-PRS) 1200 New Jersey Avenue SE Washington, DC 20590
14. Sponsoring Agency Code
15. Supplementary Notes: Project Manager at the FMCSA: Eugene Johnson, Strategic Planning and Program Evaluation Division (MC-PRS) Project Manager at the Volpe Center: Eran Segev, Motor Carrier Safety Division (RTV-3E)
16. Abstract This report documents measures developed for evaluating the performance of the Federal Motor Carrier Safety Administration (FMCSA) voluntary Performance and Registration Information Systems Management (PRISM) program through a combination of time-series analyses and comparisons among States that have achieved varying levels of implementation. The evaluation consists of two major components: (1) Program Design and Implementation, and (2) Program Impacts. Even though the evaluation team found no major flaws in Program Design and Implementation, it identified several areas for potential improvements. It also identified observable improvements in CMV safety (crash rates) and data quality and efficiency attributable to State PRISM implementation status. There were no observable improvements in driver or vehicle out-of-service violation rates.
17. Key Words Performance and Registration Information Systems Management, PRISM, Federal Motor Carrier Safety Administration, FMCSA, program evaluation, International Registration Plan, IRP, registration sanctions, commercial motor carrier safety, data quality
18. Distribution Statement
19. Security Classif. (of this report) Unclassified
20. Security Classif. (of this page) Unclassified
21. No. of Pages 146
22. Price
Form DOT F 1700.7 (8-72) Reproduction of completed page authorized
PRISM Program Evaluation
August 2007 ii

PRISM Program Evaluation
PREFACE
This report documents a comprehensive review of the implementation and effectiveness of the Federal Motor Carrier Safety Administration (FMCSA) Performance and Registration Information Systems Management (PRISM) program.
Eugene Johnson of the FMCSA Strategic Planning and Program Evaluation Division served as project manager for the FMCSA evaluation team. The team (consisting of FMCSA members from across the agency) included Scott Poyer and Scott Valentine, also of the Strategic Planning and Program Evaluation Division; Tom Lawler and Bryan Price, Office of Enforcement and Compliance; and Richard Bates, FMCSA Massachusetts Division.
Robert Armstrong of the Volpe Center Motor Carrier Safety Division was the program manager. Eran Segev, also of the Motor Carrier Safety Division, served as technical project manager. Technical staff contributing to this report included Ingrid Bartinique, Kevin Berry, Charity Coleman, Alla Ilchenko, Cana McCoy, and Dennis Piccolo of Chenega Advanced Solutions and Engineering (CASE), under contract to the Volpe Center, and Shruti Mahajan of Cambridge Systematics, also under contract to the Volpe Center. Kathy Blythe of CASE was the technical editor, supported by Bob Marville, Cassandra Oxley, and Allison Stieber. Leopold Wetula of the Volpe Center Service and Operations Planning Division and Susan Dresley of Automated Research Management Associates, Inc. (ARMA), under contract to the Volpe Center Technical Reference Center, performed legal research.
Finally, Gary DeRusha, Timothy Gonsalves, and Edmund Roman of Labblee Corporation, under contract to the Volpe Center Transportation Information Systems Division, which supports the FMCSA PRISM team, and Linley Oberman and Dick Spring, under contract to the FMCSA PRISM program, provided valuable input throughout the evaluation.
August 2007 iii

PRISM Program Evaluation
August 2007 iv

PRISM Program Evaluation
TABLE OF CONTENTS
Acronyms and Abbreviations .......................................................................................................................................ix Executive Summary .................................................................................................................................................... xii 1 INTRODUCTION .......................................................................................................................................... 1-1
1.1 FMCSA EVALUATIONS ........................................................................................................................... 1-3 1.2 PROGRAM EVALUATION .......................................................................................................................... 1-3 1.3 PURPOSE OF THE PRISM PROGRAM EVALUATION .................................................................................. 1-4
2 SCOPE OF EVALUATION .......................................................................................................................... 2-1 2.1 ANALYSIS ................................................................................................................................................ 2-1 2.2 STATES INCLUDED................................................................................................................................... 2-3
2.2.1 State of Domicile Challenge .............................................................................................................. 2-3 2.3 ANALYSIS TIMEFRAME ............................................................................................................................ 2-3
3 PRISM IMPLEMENTATION: BASELINE ANALYSIS .......................................................................... 3-1 3.1 PRISM PROGRAM ENVIRONMENT .......................................................................................................... 3-1 3.2 PROGRAM DESIGN REVIEW ..................................................................................................................... 3-4
3.2.1 Introduction ....................................................................................................................................... 3-4 3.2.2 Program Design Elements ................................................................................................................. 3-4 3.2.3 Conclusion ......................................................................................................................................... 3-9
3.3 PRISM MILESTONE IMPLEMENTATION ................................................................................................. 3-10 3.3.1 Approach ......................................................................................................................................... 3-10 3.3.2 Milestone Implementation Data Collection ..................................................................................... 3-11 3.3.3 Additional PRISM Implementation Information .............................................................................. 3-11 3.3.4 PRISM Implementation Milestones .................................................................................................. 3-12 3.3.5 Next Steps......................................................................................................................................... 3-17
3.4 FINANCIAL REVIEW ............................................................................................................................... 3-17 3.4.1 PRISM Grant Allocations and Expenditures ................................................................................... 3-17 3.4.2 Additional Financial Information from FMCSA Divisions and State DMVs ................................... 3-23 3.4.3 Findings (Financial Review)............................................................................................................ 3-23
4 PRISM IMPACTS: IMPROVEMENTS IN SAFETY ................................................................................ 4-1 4.1 REGISTRATION DENIALS ......................................................................................................................... 4-1
4.1.1 Analysis Approach ............................................................................................................................. 4-1 4.1.2 Definition of a PRISM State (Registration Denial Analysis) ............................................................. 4-2 4.1.3 Results ................................................................................................................................................ 4-2 4.1.4 Conclusion ......................................................................................................................................... 4-4
4.2 CRASH RATES ......................................................................................................................................... 4-4 4.2.1 Relationship Between PRISM and Crash Rates ................................................................................. 4-5 4.2.2 Analysis Approach ............................................................................................................................. 4-6
August 2007 v

PRISM Program Evaluation
4.2.3 Definition of a PRISM State ............................................................................................................... 4-6 4.2.4 Results ................................................................................................................................................ 4-7 4.2.5 Conclusion ....................................................................................................................................... 4-11
4.3 DRIVER AND VEHICLE OOS VIOLATION RATES .................................................................................... 4-12 4.3.1 Relationship Between PRISM and OOS Violation Rates ................................................................. 4-12 4.3.2 Analysis Approach ........................................................................................................................... 4-13 4.3.3 Definition of a PRISM State (VOOS Rate Analysis) ........................................................................ 4-13 4.3.4 Results .............................................................................................................................................. 4-14 4.3.5 Conclusion ....................................................................................................................................... 4-20
5 PRISM IMPACTS: IMPROVEMENTS IN EFFICIENCY ....................................................................... 5-1 5.1 BAR-CODE READER EFFICIENCY ANALYSIS ............................................................................................ 5-1
5.1.1 Analysis Sample ................................................................................................................................. 5-1 5.1.2 Results ................................................................................................................................................ 5-1 5.1.3 Conclusion ......................................................................................................................................... 5-2
6 PRISM IMPACTS: IMPROVEMENTS IN DATA QUALITY/ EFFECTIVENESS .............................. 6-1 6.1 NON-MATCH CRASH AND INSPECTION RECORDS .................................................................................... 6-1
6.1.1 Approach ........................................................................................................................................... 6-1 6.1.2 Definition of a PRISM State (Data Quality) ...................................................................................... 6-2 6.1.3 Results ................................................................................................................................................ 6-3 6.1.4 Conclusion ......................................................................................................................................... 6-5
6.2 MCS-150 UPDATE ANALYSIS ................................................................................................................. 6-5 6.2.1 Approach ........................................................................................................................................... 6-6 6.2.2 Definition of a PRISM State (Bar-code Analysis) .............................................................................. 6-7 6.2.3 Results ................................................................................................................................................ 6-7 6.2.4 Conclusion ....................................................................................................................................... 6-11
6.3 BAR-CODE READER DATA QUALITY ..................................................................................................... 6-12 6.3.1 Approach ......................................................................................................................................... 6-12 6.3.2 Definition of a PRISM State ............................................................................................................. 6-13 6.3.3 Results .............................................................................................................................................. 6-14 6.3.4 Conclusion ....................................................................................................................................... 6-18
7 CONCLUSIONS AND NEXT STEPS .......................................................................................................... 7-1 7.1 PROGRAM ENVIRONMENT AND IMPLEMENTATION .................................................................................. 7-1 7.2 PROGRAM IMPACTS ON PRISM GOALS ................................................................................................... 7-1 7.3 RECOMMENDED NEXT STEPS .................................................................................................................. 7-2
August 2007 vi

PRISM Program Evaluation
LIST OF FIGURES
FIGURE 1-1. PRISM PILOT STATES AND GRANT STATES AS OF JULY 2006 ................................................................ 1-1 FIGURE 1-2. PRISM STATES THAT HAVE INVOKED REGISTRATION SANCTIONS FOR OUT-OF-SERVICE CARRIERS ...... 1-2 FIGURE 3-1. EXAMPLE OF TRACKING REGISTRATION DENIALS IN PRISM .................................................................. 3-6
FIGURE 3-2. IMPACT OF ADDITIONAL PRISM FUNDING ON PRISM IMPLEMENTATION .............................................. 3-6
FIGURE 3-3. IMPACT OF MAINTENANCE FUNDING ON CONTINUED PRISM IMPLEMENTATION.................................... 3-6
FIGURE 4-1. FULL PRISM IMPLEMENTATION DATES, BY STATE ................................................................................ 4-9 FIGURE 6-1: IMPLEMENTATION OF IRP SYSTEM SAFETY-STATUS CHECK AS PART OF PRISM, BY STATE .................. 6-3 FIGURE 6-2. STATES MEETING THE MS-150 UPDATE REQUIREMENT .......................................................................... 6-8 FIGURE 6-3. FULL BAR-CODE READER IMPLEMENTATION, BY STATE ....................................................................... 6-15 FIGURE 6-4. STATE CMV CAB CARDS WITH TWO-DIMENSIONAL BAR CODES........................................................... 6-16
August 2007 vii
PRISM Program Evaluation
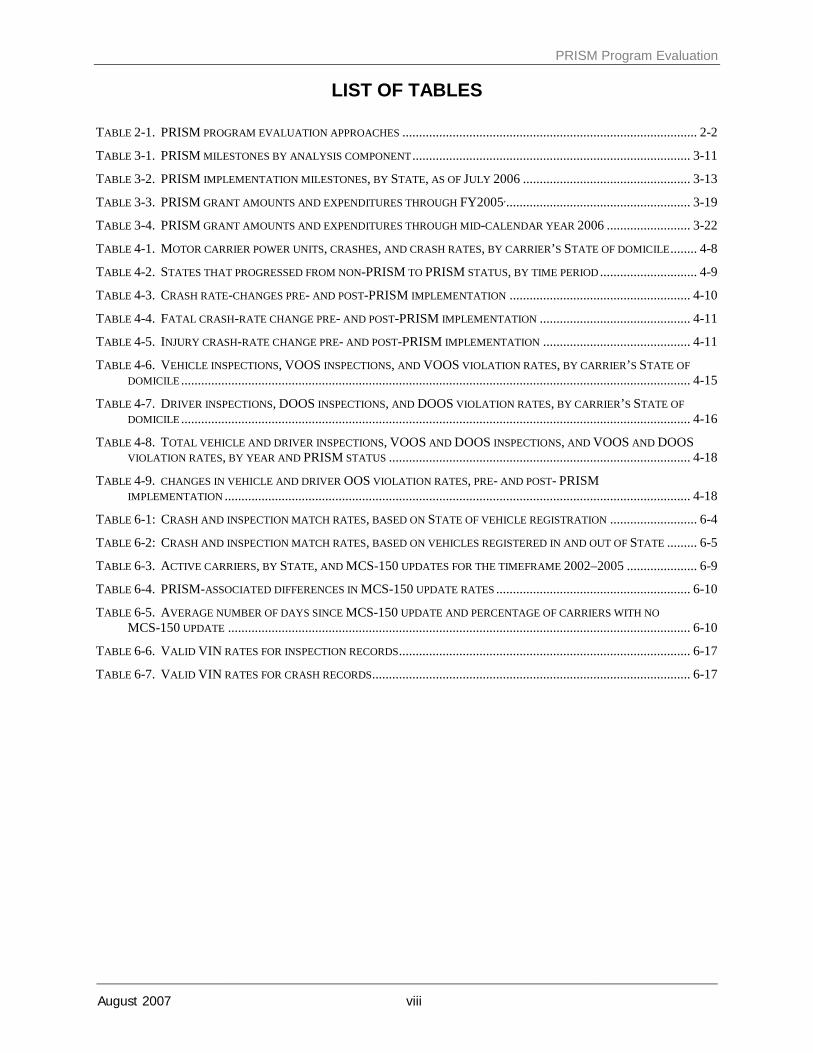
LIST OF TABLES
TABLE 2-1. PRISM PROGRAM EVALUATION APPROACHES ........................................................................................ 2-2 TABLE 3-1. PRISM MILESTONES BY ANALYSIS COMPONENT ................................................................................... 3-11 TABLE 3-2. PRISM IMPLEMENTATION MILESTONES, BY STATE, AS OF JULY 2006 .................................................. 3-13 TABLE 3-3. PRISM GRANT AMOUNTS AND EXPENDITURES THROUGH FY2005, ....................................................... 3-19 TABLE 3-4. PRISM GRANT AMOUNTS AND EXPENDITURES THROUGH MID-CALENDAR YEAR 2006 ......................... 3-22 TABLE 4-1. MOTOR CARRIER POWER UNITS, CRASHES, AND CRASH RATES, BY CARRIER’S STATE OF DOMICILE ........ 4-8 TABLE 4-2. STATES THAT PROGRESSED FROM NON-PRISM TO PRISM STATUS, BY TIME PERIOD ............................. 4-9 TABLE 4-3. CRASH RATE-CHANGES PRE- AND POST-PRISM IMPLEMENTATION ...................................................... 4-10 TABLE 4-4. FATAL CRASH-RATE CHANGE PRE- AND POST-PRISM IMPLEMENTATION ............................................. 4-11 TABLE 4-5. INJURY CRASH-RATE CHANGE PRE- AND POST-PRISM IMPLEMENTATION ............................................ 4-11 TABLE 4-6. VEHICLE INSPECTIONS, VOOS INSPECTIONS, AND VOOS VIOLATION RATES, BY CARRIER’S STATE OF
DOMICILE ........................................................................................................................................................ 4-15 TABLE 4-7. DRIVER INSPECTIONS, DOOS INSPECTIONS, AND DOOS VIOLATION RATES, BY CARRIER’S STATE OF
DOMICILE ........................................................................................................................................................ 4-16 TABLE 4-8. TOTAL VEHICLE AND DRIVER INSPECTIONS, VOOS AND DOOS INSPECTIONS, AND VOOS AND DOOS
VIOLATION RATES, BY YEAR AND PRISM STATUS .......................................................................................... 4-18
TABLE 4-9. CHANGES IN VEHICLE AND DRIVER OOS VIOLATION RATES, PRE- AND POST- PRISM IMPLEMENTATION ........................................................................................................................................... 4-18
TABLE 6-1: CRASH AND INSPECTION MATCH RATES, BASED ON STATE OF VEHICLE REGISTRATION .......................... 6-4 TABLE 6-2: CRASH AND INSPECTION MATCH RATES, BASED ON VEHICLES REGISTERED IN AND OUT OF STATE ......... 6-5 TABLE 6-3. ACTIVE CARRIERS, BY STATE, AND MCS-150 UPDATES FOR THE TIMEFRAME 2002–2005 ..................... 6-9 TABLE 6-4. PRISM-ASSOCIATED DIFFERENCES IN MCS-150 UPDATE RATES .......................................................... 6-10 TABLE 6-5. AVERAGE NUMBER OF DAYS SINCE MCS-150 UPDATE AND PERCENTAGE OF CARRIERS WITH NO
MCS-150 UPDATE .......................................................................................................................................... 6-10 TABLE 6-6. VALID VIN RATES FOR INSPECTION RECORDS ....................................................................................... 6-17 TABLE 6-7. VALID VIN RATES FOR CRASH RECORDS ............................................................................................... 6-17
August 2007 viii

PRISM Program Evaluation
ACRONYMS AND ABBREVIATIONS
AAMVA American Association of Motor Vehicle Administrators
CMV Commercial Motor Vehicle
CSA comprehensive safety analysis
DA Division Administrator
DMV Department of Motor Vehicles
DOOS Driver Out of Service
DOT Department of Transportation
DPS Department of Public Safety
EMIS Enforcement Management Information System
FMCSA Federal Motor Carrier Safety Administration
IFTA International Fuel Tax Association
IRP International Registration Plan
ISTEA Intermodal Surface Transportation Efficiency Act of 1991
IT Information Technology
MCMIS Motor Carrier Management Information System
MCSIP Motor Carrier Safety Improvement Process
MVA Motor Vehicle Administration
NLETS National Law Enforcement Telecommunication System
OMC Office of Motor Carriers
OOS Out of Service
PM Preventive Maintenance
PRISM Performance and Registration Information Systems Management
RI Roadside Inspection
SAFER Safety and Fitness Electronic Records
SafeStat Safety Status Measurement System
August 2007 ix

PRISM Program Evaluation
SAFETEA-LU Safe, Accountable, Flexible, Efficient Transportation Equity Act: A Legacy for Users
SEA Safety Evaluation Area
TEA-21 Transportation Equity Act for the 21st Century
USDOT United States Department of Transportation
VIN Vehicle Identification Number
VMT Vehicle Miles Traveled
VOOS Vehicle Out of Service
August 2007 x
PRISM Program Evaluation
August 2007 xi

PRISM Program Evaluation
EXECUTIVE SUMMARY
Under Section 4003 of the Intermodal Surface Transportation Efficiency Act of 1991 (ISTEA), Congress mandated the PRISM pilot demonstration project to evaluate the potential benefits of using State commercial motor vehicle (CMV) registration sanctions as an incentive to improve motor carrier safety. The Federal Motor Carrier Safety Administration (FMCSA), heavily dependent on the State of Iowa, developed the pilot project. In addition to Iowa, the States of Colorado, Indiana, Minnesota, and Oregon also participated in the pilot, which ended in 1997.
In a report to Congress documenting the PRISM pilot project, the FMCSA concluded that State commercial vehicle registration sanctions could be a powerful enforcement tool in Federal and State motor carrier safety improvement efforts. Subsequent reauthorizations provided funding for expanding PRISM on a voluntary State-by-State basis. By late 2006, 45 States had developed PRISM implementation plans and received PRISM grants.
The evaluation team concluded that fully implemented PRISM States show improved safety over time compared with other States, indicating PRISM could have contributed to lower crash rates. PRISM States achieve greater success in matching crash and inspection records to DOT numbers. Carriers domiciled in PRISM States with at least some vehicles registered in PRISM States have higher data quality than carriers domiciled in other States as reflected by more up-to-date MCS-150 reports. Furthermore, PRISM States that use bar-code readers in roadside inspections have 20 percent to 30 percent higher valid vehicle identification number (VIN) rates than other States. Bar-code readers also reduce the time required to conduct roadside inspections by about one-third the duration of an average inspection. These successes help the States and the US DOT to accurately identify and remove high-risk carriers from our nation’s highways.
Despite the program’s successes, it has many challenges to overcome, including widespread misconceptions at the State-level concerning program funding and costs. Secondly, the program suffers from the fact that it is voluntary and in some cases must overcome local State politics prior to implementation. The time required for this political acceptance process is one of the reasons that only 20 States have fully implemented the program as of July 2006.
During the data collection for this evaluation, the evaluation team discovered that PRISM States had only been reporting registration denial information for a short time and had not compiled enough performance data from which to fully analyze the States’ ability and willingness to deny registration and/or remove license plates. The PRISM program operates as a network, which captures out-of-service (OOS) carriers at the point of registration. Unfortunately, only approximately one fifth of the States have legal authority to deny registration and/or remove license plates, and consequently, to avoid sanctions carriers are able to register vehicles in adjacent non-PRISM States or in other PRISM States that do not yet have this legal authority. However, in those States that have such legal authority, the evaluation team has observed that PRISM’s architecture has proven effective in denying, revoking, and suspending the registrations of OOS motor carriers. This same capability addresses the problem of identifying and denying registrations to OOS carriers who attempt to reinvent themselves (referred to as “chameleon” carriers) and attempt to register vehicles with a different carrier name, USDOT number, and/or Taxpayer Identification Number (TIN).
The evaluation team discovered an exceptional “Best Practice” in the way the PRISM team performs State PRISM Implementation Reviews. The PRISM review team is extremely experienced in all aspects of PRISM implementation, PRISM operations, and system integration/development. As part of a State PRISM Implementation Review, the PRISM team
August 2007 xii

PRISM Program Evaluation
takes two to three days to verify that a State has properly implemented PRISM at the Department of Motor Vehicles (DMV) in the State, at State enforcement organizations (e.g. State police), and in terms of data systems integration. The PRISM team provides “real-time” training, feedback on deficiencies and strengths, and tests the system to verify that States can actually perform the primary objective of identifying OOS carriers using live data. Despite this best practice, the evaluation team believes that the PRISM program will struggle to achieve its full potential until the majority (perhaps 90 percent) of the continental States are actively employing all facets of the program. A key recommendation is to perform another future evaluation study of the PRISM program once a sufficient number of States have accumulated one to two years of experience in identifying OOS carriers and having the ability to deny registrations. Such a future evaluation would likely provide a more complete measure of the full impact of the PRISM program, given that there would be fewer non-PRISM States providing potential loopholes to program effectiveness.
SCOPE The FMCSA tasked the Volpe National Transportation Systems Center (Volpe Center) to develop performance measures for evaluating the success of the PRISM program and to evaluate the program on the basis of these performance measures. Using time-series analyses and comparisons between performance measures in States at various levels of PRISM implementation, the evaluation team determined the effectiveness of the PRISM program in two areas: (1) Program Design and Implementation and (2) Program Impacts on PRISM Goals. Program Design and Implementation is the extent to which the program is adequately designed to achieve its stated oversight and mission objectives, the extent to which the program has been implemented nationwide, and the financial measures associated with implementing the program and meeting its financial goals.
Program Impacts on PRISM Goals measure how strongly PRISM is associated with improvements in the following program performance goals: (1) improved CMV safety, measured by safety-driven registration denials and crash and violation rates; (2) improved efficiency, measured by bar-code reader impacts on the duration of roadside inspections; and (3) improved data quality, measured by crash- and inspection-record match rates, timeliness of MCS-150 filings, and quality of recorded vehicle identification numbers (VINs).
PROGRAM MILESTONES To compare data from States at various stages of PRISM program implementation, the evaluation team defined four key program milestones:
Implementing the MCS-150 update requirement for carriers. Updating the Safety and Fitness Electronic Records (SAFER) system with
international registration plan (IRP) vehicle data. Performing automated safety status checks (United States Department of
Transportation [USDOT] number and VIN) using the IRP system. Invoking registration sanctions when the carrier is under an out-of-service
(OOS) order.
FINDINGS: PROGRAM DESIGN AND IMPLEMENTATION
August 2007 xiii

PRISM Program Evaluation
The PRISM evaluation team findings regarding program design and implementation focus on the following four areas:
Program environment. The analysis identifies a number of hindrances to program implementation across the States. For example, States report concerns about the heavy workload imposed by PRISM, conflicting priorities associated with time-consuming validation requirements, and internal State political issues where multiple State agencies are involved in issuing CMV registrations and providing oversight. Although some of these issues are valid, others are based on misconceptions.
Program design. No major flaws limit PRISM’s effectiveness, but the program’s annual and long-term performance measures are not outcome-focused and do not meaningfully reflect its purpose. Improvements in overseeing grantee activities are needed. Some States indicated that the lack of follow-on program maintenance funding could hinder States contemplating PRISM.
Milestone implementation: - Grants. As of July 2006, 40 States had received PRISM grants. Of these, 18 had
fully implemented all key milestones, three had partially implemented them, and 19 had yet to achieve any of the key milestones.
- State not joining PRISM. Reasons cited for States not joining PRISM included no supporting State legislation, the need for supporting lobbying, additional requirements of technology interfaces, a lack of information technology (IT) resources, and a perception of insufficient funding.
- States not fully implementing PRISM. Reasons cited include additional workload, lack of maintenance funding, and institutional issues such as management turnover.
- FMCSA division feedback in non-PRISM States. Reasons cited for States not joining PRISM included limited human resources, a perception of insufficient funding, and internal management politics.
Financial review. The FMCSA allocated $15.5 million in PRISM grants to 33 States through the end of fiscal year (FY) 2005, excluding pilot States. State expenditures to date have been one-third of total grant allocations; average expenditure in States that have implemented all PRISM milestones is $279,133, roughly half the $470,000 in 1998 dollars estimated in the PRISM Pilot Demonstration Project Report to Congress. One-third of FMCSA divisions reported that larger PRISM grants would increase State implementation, while two-thirds believed guaranteeing long-term post-implementation maintenance funding could make PRISM more appealing.
FINDINGS: PROGRAM IMPACTS ON PRISM GOALS The PRISM evaluation team findings regarding program impacts are focused in three areas:
Impacts on CMV safety: − The PRISM program cannot succeed alone, as it works in conjunction with
other FMCSA and State programs – New Entrants, Compliance Reviews,
August 2007 xiv

PRISM Program Evaluation
Roadside Inspections, Commercial Drivers Licensing, Medical Standards, etc. – to reduce crashes and improve violation rates.
− PRISM States appear to have erroneously issued registrations to a small number of out-of-service (OOS) carriers, based on a number of registration dates that fall during periods of carrier OOS status.
− A December 2006 snapshot of the PRISM target file found a 5 percent error in identifying targeted OOS vehicles. The PRISM team identified the source of the problem as a computer problem and has issued a patch to correct the problem during the course of the evaluation.
− State offices reported no deficiency in the ability of PRISM States to correctly identify carriers in OOS status.
− An analysis of driver and vehicle OOS violation rates did not reveal a conclusive relationship between such violation rates and PRISM.
Impacts on efficiency: − Seven States use bar-code readers extensively, and eight States have begun to
test and deploy bar-code readers on a limited basis. − Not all cab cards from different States are compatible with bar-code readers. − Full deployment of two-dimensional American Association of Motor Vehicle
Administrators (AAMVA)-compliant bar codes across the U.S. or implementation of an appropriate national bar-code standard would improve bar-code reader integration.
− Wireless technology would make bar-code readers easier to use.
August 2007 xv

PRISM Program Evaluation
1 INTRODUCTION The Performance and Registration Information Systems Management (PRISM) program is a Federal/State partnership that identifies high-risk motor carriers and uses State commercial motor vehicle (CMV) registration sanctions as a tool to motivate motor carriers to improve CMV safety.
Congress mandated the PRISM pilot demonstration project under Section 4003 of the Intermodal Surface Transportation Efficiency Act of 1991 (ISTEA) to evaluate the potential benefits of using State CMV registration sanctions as an incentive to improve motor carrier safety. The Federal Motor Carrier Safety Administration (FMCSA) and the State of Iowa developed the pilot project. In addition to Iowa, the States of Colorado, Indiana, Minnesota, and Oregon participated in the pilot, which ended in 1997. The pilot demonstrated that State commercial vehicle registration sanctions could be a powerful enforcement tool in Federal and State motor carrier safety improvement efforts.
In 1998, under the Transportation Equity Act for the 21st Century (TEA-21), Congress authorized additional funding to implement the PRISM program nationwide. The Safe, Accountable, Flexible, Efficient Transportation Equity Act: A Legacy for Users (SAFETEA-LU) of 2005 further defines the design and scope of the PRISM program. Under Section 4101 of SAFETEA-LU, $5 million annually is authorized for PRISM from FY2006 through FY2009. Of the $5 million annual budget, $1 million funds the FMCSA PRISM team’s operations and $4 million funds PRISM grants to participating States. As of July 2006, a total of 40 States had developed a PRISM implementation plan and received a PRISM grant, as shown in Figure 1-1.1
Figure 1-1. PRISM pilot States and grant States as of July 2006
1 As of September 2006, a total of 45 States have reportedly signed PRISM grant agreements; however, the analyses performed here are based on State PRISM status as of July 2006.
PRISM Summary Federal/State partnership to improve
CMV safety, the efficiency of CMV safety activities and efforts, and the quality of CMV safety data.
State CMV registration sanctions used as incentive to improve carrier safety.
Program history: - Five-State pilot program, 1992–
1997 (ISTEA funding). - Pilot findings: registration
sanctions could be a powerful enforcement tool in Federal and State motor carrier safety improvement efforts.
- Additional funding reauthorized in 1998 (TEA-21).
- $5 million annual budget, FY2006–2009 (SAFETEA-LU 2005).
- By July 2006, a total of 40 States had developed PRISM implementation plans and received PRISM grants (18 States fully implemented, 3 partially implemented, and 19 yet to implement any program milestones other than having received a grant allocation).
Program evaluation goals: - Develop program performance
metrics to measure PRISM effectiveness.
- Determine PRISM effectiveness in achieving program goals of improvements in safety, efficiency, and data quality.
August 2007 1-1

PRISM Program Evaluation
Figure 1-2. PRISM States that have invoked registration sanctions for out-of-service carriers
Of these 40 States, 18 had fully implemented PRISM on the basis of all key program milestones defined in this evaluation, three had implemented PRISM on the basis of some of the program milestones, and the remaining 19 had yet to implement any program milestones other than having received a grant allocation.
Figure 1-2 shows the 20 States that have implemented the final PRISM milestone, which is invoking registration sanctions for OOS carriers.
August 2007 1-2
PRISM Program Evaluation
The PRISM program allows the FMCSA to leverage the resources of State government partners to improve motor carrier safety through a comprehensive system of identification, education, awareness, safety monitoring, and treatment. In turn, an efficient and effective PRISM program contributes significantly to achieving the FMCSA mission of reducing the number and severity of CMV crashes and enhancing the efficiency of CMV operations. This report evaluates the effectiveness of the PRISM program.
1.1 FMCSA EVALUATIONS The FMCSA performs three types of evaluations:
Program Evaluation. Program evaluation is the application of valid methods to assess the design, implementation, effectiveness, objectives, intended audience, outcomes, and improvement of a specific program. It includes the careful collection of information concerning a program or some aspect of it in order to make appropriate and actionable decisions about the program.
Quality Assurance review. Quality assurance refers to a self-imposed inspection process aimed at ensuring that optimal internal procedures and policies are in place and that they are working effectively, efficiently, and consistently. Quality assurance reviews ensure that agency practices are standardized where appropriate and are being applied uniformly throughout FMCSA programs.
Regulatory Effectiveness review. Regulatory effectiveness reviews are the systematic assessment of the actual safety and economic impacts of existing regulations. These reviews are separate from the predictive regulatory evaluations that project the impact of proposed regulations before they are published as a final rule. Post-implementation regulatory effectiveness reviews assess the actual effectiveness of regulations once they are implemented, and they assist the FMCSA in writing more effective rules and in reducing any unnecessary regulatory burden on the public.
1.2 PROGRAM EVALUATION The purpose of a program evaluation may be one or all of the following: to demonstrate the program’s effectiveness to stakeholders, to improve the program’s implementation and effectiveness, to improve management of limited resources, to justify program funding, to provide justifiable reasons for increased funding, and to document program development in order to ensure successful replication in future programs.
An evaluation can help stakeholders to understand, verify, or increase a program’s effectiveness for customers and clients; improve the methods for delivering products and services, enabling them to be more efficient and less costly; and help identify strengths and weaknesses, which will improve program activities in the long run. It helps stakeholders to verify that their program is functioning as it should, that intended objectives are being met, and that the correct audience is being reached. An evaluation can verify if a program is running as originally planned. It can also spur management to think critically about program goals, how the program is designed to meet its goals, and how to determine if those goals are being met or not (using pre-established benchmarks), enabling stakeholders to decide which aspects of a program should be retained and which should not.
August 2007 1-3

PRISM Program Evaluation
1.3 PURPOSE OF THE PRISM PROGRAM EVALUATION The FMCSA has committed to evaluating the PRISM program beginning in FY2005. The program evaluation goals are to (1) develop program performance metrics to measure the effectiveness of PRISM and (2) determine the effectiveness of PRISM in achieving the program goals of improvements in safety, efficiency, and data quality.
August 2007 1-4

PRISM Program Evaluation
2 SCOPE OF EVALUATION
2.1 ANALYSIS The FMCSA tasked the Volpe National Transportation Systems Center (Volpe Center) to participate in an evaluation team and develop performance measures for evaluating the success of the PRISM program. The evaluation team used these measures to evaluate the success of the PRISM program through a combination of time-series analyses and comparisons of States at various levels of PRISM implementation. Analyses are based on both quantitative and qualitative information on 40 States that had signed PRISM grant agreements as of July 2006.2
The evaluation is broken down into two major components: Program Design and Implementation
Design: Extent to which the program is adequately designed to achieve stated oversight and mission objectives.
Implementation: Extent to which the program has been implemented nationwide.
Financial review: Measures associated with program implementation and success in meeting the program’s financial goals.
Program Impacts on PRISM Goals
Improvements in CMV safety: Measured using safety-driven registration denials and crash and violation rates.
Improvements in efficiency: Measured using time efficiencies introduced through the use of bar-code readers during roadside inspections.
2 As of September 2006, five additional States signed PRISM grant agreements, bringing the total to 45 States. At the time of this evaluation, several PRISM States had only recently implemented initial portions of the program and consequently had not been operating long enough to conduct a meaningful historical trend analysis for several components of this evaluation. Despite these data deficiencies, the team is confident that the conclusions presented in this evaluation are valid. Cases in which the conclusions are not robust are noted. Program performance measures that were developed and used here will serve as a baseline for conducting future evaluations of PRISM after States’ experience with the program is more substantial. Such evaluations will provide a consistent basis for tracking the program’s impacts over time.
Overview Analysis of program design and
implementation. Analysis of program impacts on
PRISM goals: - CMV safety improvements. - Efficiency improvements. - Data-quality improvements.
40 States signed PRISM grant agreements (as of July 2006).
Non-PRISM State carriers were included as controls to measure PRISM impacts.
Evaluation based on data collected 2000–2006.
August 2007
2-1

PRISM Program Evaluation
Improvements in data quality: Measured using crash- and inspection-record match rates, timeliness of MCS-150 filings, and quality of recorded vehicle identification numbers (VINs).
Table 2-1 lists the PRISM program evaluation approaches selected by the evaluation team.
Table 2-1. PRISM program evaluation approaches
EVALUATION COMPONENT EVALUATION APPROACH
SECTION IN PRISM PROGRAM
EVALUATION REPORT
Program Design and Implementation
PRISM program environment: Document impediments, both practical and political, as well as support encountered by PRISM at State level.
3.1
Design: Assess program design limitations, consistency of program performance measures with program purpose, program oversight practices, and program cost accountability.
3.2
Implementation: Describe current status of all PRISM States; list dates of implementation of PRISM milestones.
3.3
Financial review: Assess grant allocations, expenditures by State, and PRISM program financial goals.
3.4
Program Impacts Improvements in CMV Safety
Success of registration denial efforts: Review States’ success in denying registrations to OOS carriers.
4.1
Crash rates in PRISM vs. non-PRISM States and pre-PRISM vs. post-PRISM States: Compare rates.
4.2
Violation rates in PRISM vs. non-PRISM States and pre-PRISM vs. post-PRISM States: Compare rates.
4.3
Improvements in Efficiency
Bar-code reader efficiency analysis: Make qualitative assessment of improvements in efficiency achieved through bar-code readers.
5.1 Improvements in Data Quality/ Effectiveness
Non-match crash and inspection records: Compare match rates for crash and inspection records in PRISM and non-PRISM States.
6.1
MCS-150 update analysis: Compare MCS-150 update rates in PRISM and non-PRISM States.
6.2
Bar-code reader data-quality analysis: Evaluate impact of bar-code reader use on quality of VINs.
6.3
August 2007
2-2

PRISM Program Evaluation
Qualitative and quantitative analyses were based on available CMV data in addition to data collected during this program evaluation. Interviews with FMCSA division and State personnel were part of the data collection process. Initial interviews focused on PRISM milestone implementation dates. Follow-up interviews addressed a wider scope of issues tailored to the level of PRISM implementation in each State.
2.2 STATES INCLUDED As of July 2006, a total of 40 States had signed a PRISM grant agreement. By September 2006, the number of States involved in PRISM grew to 45, but we had completed the data gathering phase of the review by that date. Carriers in non-PRISM States were used as control groups for measuring PRISM program impacts. Carriers in all 50 States were considered, although not all motor carriers domiciled in every State were included in the analysis of every program component. Carriers and States were selected based on the number of applicable PRISM implementation milestones they had completed during the timeframe of each analysis.
2.2.1 State of Domicile Challenge The evaluation team recognizes an inherent problem of performing components of this analysis based on carriers’ State of domicile. Current data sources do not allow for isolating State of vehicle registration, nor do they allow for a pure evaluation of PRISM’s contribution to safety. It would be more appropriate to use vehicles registered in a given State since PRISM primarily employs sanctions at the point of vehicle registration. The team identified carriers domiciled in PRISM States, recognizing that such carriers may have vehicles registered in non-PRISM States. Similarly, carriers domiciled in non-PRISM States may have vehicles registered in PRISM States. The problem with basing the analyses on carrier State of domicile is that carriers domiciled in PRISM States may have vehicles registered in non-PRISM States where the State being evaluated has no authority. Consequently, the program effectiveness attributed to a State is potentially skewed by the presence of domiciled carriers, which the State has no registration or other safety management authority over.
The evaluation team accepts this margin of error because the problem is partially offset in a given State by the fact that some of the States’ appropriately registered vehicles will be domiciled in other States and thus not counted against the State of registration; crashes or injuries that should be counted for such States would in effect be missed. Secondly, the evaluation team hypothesized that a “PRISM” State will perform better than a non-PRISM State in relative terms– the analysis should yield results which would give an indication as to whether the PRISM program actually improved performance in a given State even though the data set included vehicles such States do not control. The assumption is that States implementing PRISM via their registered, but not domiciled, vehicles would have improved safety relative to non-PRISM States. Since the analysis could not isolate the impact of PRISM directly, it focused on computing the relative contribution that the PRISM program has on safety when compared to a State that does not benefit from PRISM.
2.3 ANALYSIS TIMEFRAME This evaluation is based on data collected from 2000 through 2006. The precise timeframe for each program component analysis depended on the quality of relevant data and the specific nature of the analysis. For example, comparisons of motor carrier safety
August 2007
2-3

PRISM Program Evaluation
performance of PRISM States versus non-PRISM States relied on data collected during comparable time periods from the various States at yearly intervals. In contrast, comparisons of motor carrier safety performance before and after implementation of key PRISM milestones in a State or group of States relied on data collected before and after PRISM implementation, resulting in the analysis of trends over multiple years. Relevant timeframes are noted in each analysis.
August 2007
2-4
PRISM Program Evaluation
3 PRISM IMPLEMENTATION: BASELINE ANALYSIS
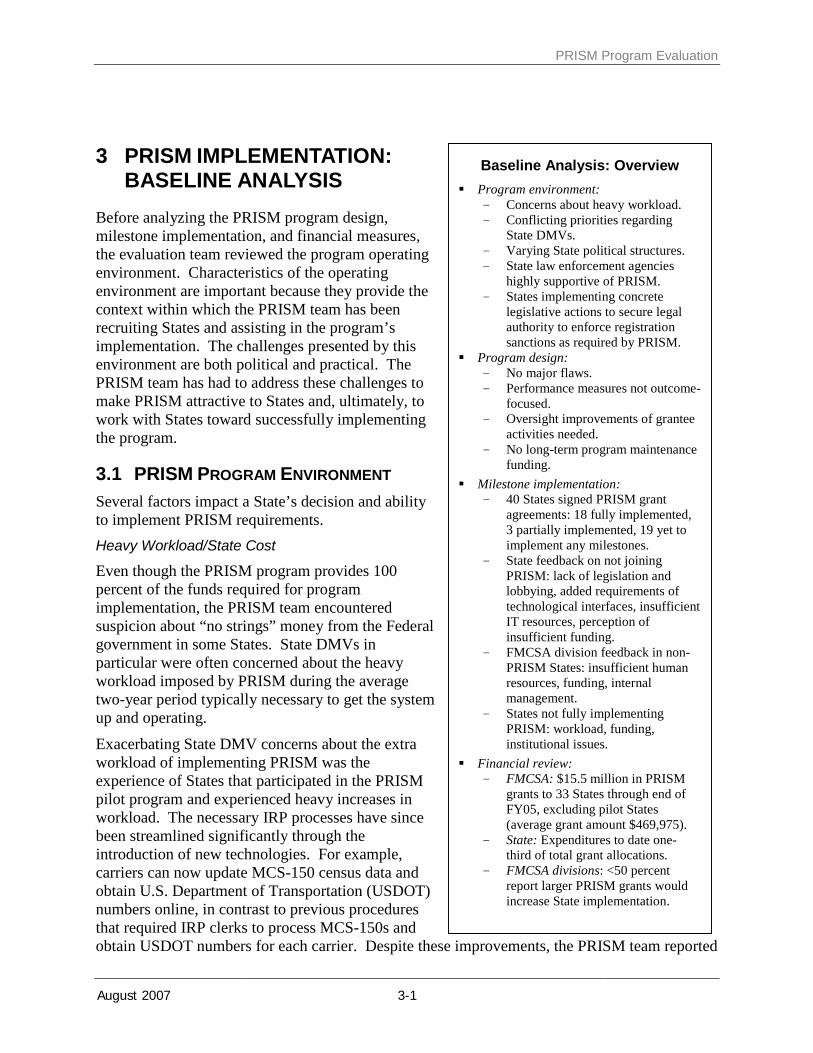
Before analyzing the PRISM program design, milestone implementation, and financial measures, the evaluation team reviewed the program operating environment. Characteristics of the operating environment are important because they provide the context within which the PRISM team has been recruiting States and assisting in the program’s implementation. The challenges presented by this environment are both political and practical. The PRISM team has had to address these challenges to make PRISM attractive to States and, ultimately, to work with States toward successfully implementing the program.
3.1 PRISM PROGRAM ENVIRONMENT Several factors impact a State’s decision and ability to implement PRISM requirements. Heavy Workload/State Cost
Even though the PRISM program provides 100 percent of the funds required for program implementation, the PRISM team encountered suspicion about “no strings” money from the Federal government in some States. State DMVs in particular were often concerned about the heavy workload imposed by PRISM during the average two-year period typically necessary to get the system up and operating.
Exacerbating State DMV concerns about the extra workload of implementing PRISM was the experience of States that participated in the PRISM pilot program and experienced heavy increases in workload. The necessary IRP processes have since been streamlined significantly through the introduction of new technologies. For example, carriers can now update MCS-150 census data and obtain U.S. Department of Transportation (USDOT) numbers online, in contrast to previous procedures that required IRP clerks to process MCS-150s and obtain USDOT numbers for each carrier. Despite these improvements, the PRISM team reported
Baseline Analysis: Overview Program environment:
- Concerns about heavy workload. - Conflicting priorities regarding
State DMVs. - Varying State political structures. - State law enforcement agencies
highly supportive of PRISM. - States implementing concrete
legislative actions to secure legal authority to enforce registration sanctions as required by PRISM.
Program design: - No major flaws. - Performance measures not outcome-
focused. - Oversight improvements of grantee
activities needed. - No long-term program maintenance
funding. Milestone implementation:
- 40 States signed PRISM grant agreements: 18 fully implemented, 3 partially implemented, 19 yet to implement any milestones.
- State feedback on not joining PRISM: lack of legislation and lobbying, added requirements of technological interfaces, insufficient IT resources, perception of insufficient funding.
- FMCSA division feedback in non-PRISM States: insufficient human resources, funding, internal management.
- States not fully implementing PRISM: workload, funding, institutional issues.
Financial review: - FMCSA: $15.5 million in PRISM
grants to 33 States through end of FY05, excluding pilot States (average grant amount $469,975).
- State: Expenditures to date one-third of total grant allocations.
- FMCSA divisions: <50 percent report larger PRISM grants would increase State implementation.
August 2007 3-1

PRISM Program Evaluation
that several State DMVs remained concerned about past impressions of the workload imposed on States by PRISM.
Finally, implementation of diverse mandatory Federal legislation has imposed additional workloads on State DMVs, which in some instances has adversely impacted PRISM implementation. Conflicting Priorities
Another factor in a State’s decision to implement PRISM is a form of “conflicting priorities.” The standard DMV focus or measure of effectiveness is timely and efficient customer satisfaction. This translates into processing customers in and out of the DMV as quickly as possible. In contrast, PRISM imposes a number of time-consuming requirements, such as checks of VINs, USDOT numbers, and motor carrier safety, which slow down the registration process. Such delays operate counter to the State’s customer-service agenda and for some Sates may constitute an insurmountable issue without further persuasion. Political Structure
A State’s political structure may also present a challenge. In many States more than two agencies issue CMV registrations and provide oversight. In Oklahoma, for example, the Departments of Revenue, Public Safety, and Transportation as well as the Corporation Commission are all involved in PRISM implementation. In addition, State agency administrators in Oklahoma are elected, making one suspect that they may be susceptible to being politically focused as opposed to being purely safety motivated.
The PRISM team’s experience shows that State trucking associations can often stall or even block PRISM-supporting legislation to revoke, deny, and/or suspend registrations of OOS carriers. Each year, the PRISM team works to convince non-government State trucking agencies that it is in their interest to support PRISM legislation in their State. State Law Enforcement Agencies
The PRISM team has found State law enforcement agencies to be highly supportive of the program. While State DMVs can be indecisive or unsupportive of PRISM implementation, the PRISM team reported that law enforcement agencies have often been instrumental in addressing the concerns of DMVs and elected legislators. This positive attitude among State law enforcement agencies was confirmed by feedback obtained by the evaluation team directly from agency personnel. Of ten (10) law enforcement agencies contacted in PRISM States, all except one were highly supportive of PRISM implementation. PRISM benefits that were cited included:
Improved access to information/streamlined communication. Enforcement actions based on solid data/worst violators held accountable. Improved data accuracy when using bar-code readers. Time savings when using bar-code readers.
The most common complaints by law enforcement personnel were related to PRISM not yet being fully implemented nationwide, leaving a gap between currently realized PRISM benefits and the program’s full potential. Enforcement agencies indicated they were concerned that
August 2007 3-2

PRISM Program Evaluation
carriers were evading sanctions by registering in non-PRISM States and frustrated with delays in implementing a national two-dimensional bar-code standard. PRISM Program—Legal Scan
States participating in the PRISM program require legal authority to enforce registration sanctions against motor carriers prohibited from operating in interstate commerce. As a requirement of their grant agreements, PRISM States are required to seek and implement the authority to suspend, revoke, or deny registration for a vehicle if the motor carrier responsible for the safety of the vehicle is prohibited from interstate operations. PRISM States are also required to implement the authority to retrieve license plates from carriers whose registration has been suspended, revoked, or denied based on PRISM sanctions. States may implement such authority in different ways, depending on political conditions and the legal framework within the particular State. In general, States either implement PRISM requirements through legislation or, where enabling legislation already exists, though administrative rules.3
The evaluation team conducted a scan of statutory and administrative codes of States participating in PRISM, using computerized legal databases to determine which States had implemented legal authority to enforce PRISM registration sanctions. The team surveyed 21 States at advanced PRISM implementation status. Of these States, 11 had implemented authority, either through statute or regulation, to suspend, revoke, or deny a CMV registration if the motor carrier responsible for the safety of the vehicle was prohibited from operating in interstate commerce. Several States also had implemented laws requiring motor carriers to return suspended or revoked license plates and/or registration certificates or to surrender them on demand. In addition, the evaluation team found that Illinois, Missouri, and Texas, all States in early stages of PRISM implementation, had PRISM-required legislative authority.
Of the eleven States that implemented authority, statutes, and/or regulations, Alabama, Nebraska, and South Carolina specifically referenced PRISM in the text of the statute or regulation. In the remaining eight States, legislation and regulations allow the State to deny, suspend, and/or revoke the registration of a vehicle if the vehicle is assigned to a motor carrier prohibited from operating in interstate commerce by a Federal agency with the authority to do so under Federal law. Statutes in three of these States specify that the Federal agency must be the FMCSA. Legislation in at least one State specifies that the State can suspend or revoke a vehicle’s registration, title, or permit when the vehicle’s owner is not authorized by USDOT to operate the vehicle because of safety violations. Appendix A lists survey results, including citations to State statutory and administrative codes.
3 Motor vehicle licensing and registration requirements are primarily regulatory measures and do not confer property rights on their holders. See 60 Corpus Juris Secundum (C.J.S.) Motor Vehicles § 157. A motor vehicle registration, license, or permit represents a license to operate the registered vehicle in accordance with conditions established by State statute or regulation. Id. Where a statute or regulation establishes the causes for which a license or registration may be denied, suspended, or revoked, such a license or registration generally cannot be denied, suspended, or revoked for any reason not specified. See 60 C.J.S. Motor Vehicles § 237-8.
August 2007 3-3

PRISM Program Evaluation
3.2 PROGRAM DESIGN REVIEW
3.2.1 Introduction Section 4109 of the SAFETEA-LU of 2005 defines the design and scope of the PRISM program. SAFETEA-LU calls for linking Federal motor carrier safety information systems with State commercial vehicle registration and licensing systems, allowing States to determine the safety fitness of motor vehicle registrants. SAFETEA-LU further calls for States to have the ability to deny, suspend, or revoke vehicle registrations for carriers that have been issued a Federal OOS order.
To implement the goals of the PRISM pilot program, the FMCSA developed the Safety Status Measurement System (SafeStat) and the Motor Carrier Safety Improvement Process (MCSIP). SafeStat measures the relative (peer-to-peer) safety fitness of interstate commercial motor carriers and intrastate commercial motor carriers that transport hazardous materials. MCSIP uses current safety event information, such as accidents, inspections, driver violations, and compliance review data, to assess and monitor motor carrier safety performance. Carriers identified as high risk by SafeStat must enter MCSIP. MCSIP prescribes an appropriate set of treatments to improve safety performance for these carriers, ranging in severity from a warning letter to a Federal OOS order and revocation of vehicle registration privileges. After initial success with both SafeStat and MCSIP, the FMCSA expanded the use of both programs nation-wide.
This section evaluates the PRISM program design in relation to its effectiveness in achieving program goals based on the following four questions:
1. Is the program design free of major flaws that would limit its effectiveness? 2. Are the annual and long-term performance measures outcome-focused and do
they meaningfully reflect the program purpose? 3. Does the program have oversight practices that provide sufficient knowledge of
grantee activities? 4. Does the program give adequate incentive for potential grantees and does it hold
them accountable for the incurred costs?
Section 3.3 and Section 3.4 report the status of PRISM implementation and associated financial data, by State.
3.2.2 Program Design Elements The PRISM design elements that were analyzed included:
Registration Enforcement Financial design Program management and oversight
− Quarterly reports − Implementation reviews
August 2007 3-4

PRISM Program Evaluation
The following subsections discuss strengths and weaknesses in achieving PRISM program goals for each of these elements.
3.2.2.1 Registration The International Registration Plan (IRP) commercial vehicle registration process is the structural framework for the PRISM program. IRP is a reciprocity agreement among the U.S. and Canadian provinces, facilitating payment of registration fees by motor carriers that operate CMVs with a gross vehicle weight of over 26,000 pounds at the interstate level, based on vehicle miles traveled (VMT) in each jurisdiction.
PRISM requires that States identify all interstate commerce carriers applying for IRP-apportioned plates through a unique USDOT number when they register their vehicles. States following this procedure can check the safety status of a carrier before issuing a vehicle registration. Vehicles subjected to IRP status checks during registration can be linked to the motor carrier responsible for their safety during the registration year.
While PRISM States have the authority to deny vehicle registration to OOS motor carriers, until approximately February 2006 such registration denials, along with the reason for denial, were not recorded. Having recognized the importance of tracking denials, in February 2006 the PRISM program requested States to include registration denial data in their quarterly program reporting. The evaluation team confirmed that several States maintain an informal record of such denials, although it was not able to verify that this record was complete. These efforts also began too recently to be included in this evaluation.
Given that denying registrations to OOS carriers is the most tangible way in which PRISM can provide motor carriers with the incentive to improve safety, a complete record of denials would be an invaluable tool for measuring the program’s effectiveness in the future. The evaluation team recommends that the PRISM program continue to work with PRISM States to keep comprehensive, accurate historical records of registration denials.
The PRISM team recognized that tracking denials is crucial for measuring the effectiveness of PRISM. In 2006 the team directed the States to report denials and related information as part of their quarterly status reports to the PRISM team. Unfortunately, at the time of this analysis sufficient information had not been accumulated for meaningful analysis.
Figure 3-1 is a screen shot of Vermont’s automatic tracking system of PRISM denials to help illustrate a working procedure that captures the reason for a denial and the user ID of the industry entity that attempted an IRP transaction while under a Federal OOS order.
Recommendation 1: The evaluation team recommends that the PRISM program continue to work with PRISM States to keep comprehensive, accurate historical records of registration denials.
Program Design: Registration Major flaws: None. Performance measures: Some
(incomplete record of registration denials), but requires improvement.
Implementation oversight: Requires improvement.
August 2007 3-5

PRISM Program Evaluation
Figure 3-1. Example of tracking registration denials in PRISM
3.2.2.2 Enforcement
The enforcement process ensures improvements in unsafe carrier performance through a process of identification, education, awareness, data gathering, safety monitoring and treatment. The enforcement component of PRISM is MCSIP.
The goal of MCSIP is to improve the safety of motor carriers by helping the FMCSA and its State partners to identify and correct safety problems. Implemented nationally, MCSIP is used to monitor the safety of all carriers and is not limited to carriers either domiciled or registering vehicles in PRISM States. However, PRISM enables States to use MCSIP as an enforcement resource in the registration process, since only PRISM States routinely identify the motor carrier responsible for CMV safety at the time of registration. In effect, the partnership with State DMVs provides the extra registration sanction tool that makes MCSIP more effective in PRISM States.
Program Design: Enforcement Major flaws: None. Performance measures: N/A. Implementation oversight: Record-
keeping of all registration denials by reason should be conducted by all States implementing registration sanctions.
Recommendation: PRISM team continues to work with PRISM States to keep comprehensive, accurate historical records of registration denials.
August 2007 3-6

PRISM Program Evaluation
3.2.2.3 Financial Design This section summarizes the PRISM program financial design and includes information obtained from interviews with FMCSA division and State DMV personnel. (See Section 3.4 for an in-depth financial review of PRISM.)
The evaluation team found that average PRISM grant allocations were consistent with the average grant allocation of $470,000 (in 1998 U.S. dollars) for the PRISM pilot demonstration project. Actual State expenditures to date are roughly one-third of total grant allocations. While this average calculation includes States in early States of PRISM implementation, even States that have implemented all key PRISM milestones have expenditures substantially below $470,000. This observation is consistent with the opinion expressed by most FMCSA divisions, with only 21 of 50 reporting that larger PRISM grant allocations would increase the feasibility of implementing PRISM.
A separate cost category is ongoing maintenance funding that could be made available to States after PRISM is initially implemented. Of 50 FMCSA division offices that provided feedback, 39 indicated that their States would benefit from a source of regular funding to keep all components of the PRISM program implemented over time. Among the 20 State DMVs that replied to this question, 17 agreed that maintenance funding would be beneficial. The additional funding would be spent on technological improvements, system maintenance, training staff in new and changing technologies, and purchasing relevant information technology (IT) and other equipment.
3.2.2.4 Program Management and Oversight
The PRISM grant agreement often lists the following requirements for mandated State feedback to the FMCSA:
Evidence that the State is carrying out the requirements of the agreement in a manner acceptable to the FMCSA.
Quarterly reporting on State progress in implementing PRISM. Maintenance of accurate and auditable financial records.
To assess if a State is carrying out requirements in a manner acceptable to the FMCSA, systematic feedback is necessary. Currently, State quarterly reporting partially meets these requirements, while more in-depth PRISM implementation reviews are conducted by the FMCSA for States at advanced PRISM implementation status.
Program Design: Financial Design
Major flaws: None. Performance measures: None
identified. Implementation oversight: Weak
financial oversight observed. Financial incentives/accountability:
More than sufficient start-up funding despite States’ concern.
August 2007 3-7

PRISM Program Evaluation
Quarterly Reports
The current report format allows States to choose the items they report. The evaluation team review of the quarterly report summaries identified several deficiencies in format. Numerous States had incomplete data fields with no justification entered for blank responses. The reports do not consistently require States to enter dates of implementation, resulting in open-ended interpretation of State capabilities. Finally, each quarter, a number of States do not provide completed reports.
Appendix B lists suggested questions for inclusion in a supplemental once-a-year quarterly report. These questions were included for the first time in the 2006 third-quarter report sent to PRISM States. During the course of the evaluation, the PRISM team has begun implementing components of these recommendations.
Recommendation 2: Enhance the look and ease of use of the quarterly
reports, allowing users to choose from pre-set responses. Include fields for comments in case the responses require further explanation.
Include fields to report relevant implementation dates. Make the quarterly reporting a required, high-priority
item for all States participating in PRISM.
Implementation Reviews (Best Practice)
The PRISM team developed an excellent guide for conducting implementation reviews at the State level. The review guide describes how States should implement the program and what they must do to meet the commitments specified in their PRISM grant agreements. The PRISM review team provides outstanding hands-on, face-to-face leadership and support to the State partner ensuring they will succeed. As part of the review process, the PRISM team provides State-specific feedback, exchanges best practices, identifies findings, and prepares a written set of recommendations on areas to improve. The evaluation is extremely thorough, and culminates with the team testing live data against the State’s system to verify that the system can actually “catch” OOS carriers enabling it to deny registrations to unsafe carriers.
The PRISM team conducted implementation reviews for States at advanced PRISM implementation status. Through February 2007, Maine, Georgia, Nebraska, Ohio, Vermont, Washington, and Minnesota had received implementation reviews.
Recommendation 3: To the extent possible, accelerate the schedule of future implementation reviews so that problems can be identified before they are repeated by other States.
Recommendation 4:
Program Design: Management and Oversight
Major flaws: None. Performance measures: No formal
accountability criteria for States’ progress in implementing PRISM.
Implementation oversight: Weak quarterly reporting mechanism. Excellent program implementation review process for States in advanced PRISM status.
Financial incentives/accountability: N/A.
Recommendations: Quarterly Reports – Enhance, add milestone implementation dates, and raise report priority. (Note: The PRISM team has begun implementing this recommendation). Implementation Reviews – Accelerate schedule if possible and incorporate review of financial records. Communication – Increase communication with States and other stakeholders to enhance their understanding of how PRISM works.
August 2007 3-8

PRISM Program Evaluation
Incorporate a review of financial records into the implementation reviews. Alternatively, conduct financial status reviews separate from technical implementation reviews for each State. This review should verify that documentation for authorized transactions are in place, and that the actual available funds reconcile at all levels.
Performance Measures Currently the PRISM program has no known “measurable” standards or targeted objectives which should result from implementing the program. This means the program management does not know what constitutes success beyond the vague concept of improved safety due to a reduction in OOS carriers operating on interstate highways. As a component of the FMCSA Commercial Motor Vehicle Safety goal, PRISM is presented as a performance element which supports the strategy of increased compliance with FMCSA requirements. This strategy is a subset of the outcome/objective of “save lives and reduce injuries by preventing and minimizing the severity of truck and bus crashes4.” According to the Budget,5 the FMCSA tracks the number of States allocated grants, and the number of States invoking various components of the program to include enforcing census updates and revoking licenses of OOS carriers. Though a very important metric, it does not convey success. Isolating the impact of the program is difficult because of the many internal and external factors which affect safety as measured as a reduction in crashes, fatalities, and injuries involving large trucks. We would contend that the desired outcome is not more participation, but instead an improvement in safety. We agree that monitoring the number of States is a crucial first step prior to focusing on the development of outcome measures which in the short term will lack any viable meaning. Recommendation 5: Consider measuring the degree to which known OOS carriers are actively denied registration, been removed from the highways by the State or similar outcome which reduces safety-related risk. A metric might aspire to remove 95 percent of all 1,200 OOS carriers in 2006 from the road.
3.2.3 Conclusion Although there are no major design flaws that demonstrably limit PRISM effectiveness, the program lacks annual and long-term outcome-focused6 performance measures which would provide complete information about the program’s success in meeting its stated goals. For example, very few records list verified PRISM implementation by State and by date achieved or provide detailed cost breakdowns by State. In addition, while the FMCSA appears to provide
4 Federal Motor Carrier Safety Administration (US DOT) Budget Estimates FY 2008, page 4A-4. 5 Federal Motor Carrier Safety Administration (US DOT) Budget Estimates FY 2008, page 4A-33. 6 Outcome-Focused Performance Measures are measurable data sets which facilitate management’s ability to discern whether the process is actually achieving the desired result. In this case the desired result might be improving safety by denying registration to 100 percent of all OOS carriers within a registration cycle.
August 2007 3-9

PRISM Program Evaluation
sufficient financial incentives for most States to implement PRISM, the lack of a post-implementation mechanism for funding follow-on long-term program support could discourage some States from joining the program. The PRISM team has recently begun to address this issue with individual States.
3.3 PRISM MILESTONE IMPLEMENTATION This PRISM program evaluation assesses the implementation of the PRISM program and its impact on motor carrier safety, data quality, and efficiency. As a first step toward examining program effectiveness, this section reviews the status of PRISM program implementation in all States, establishing a history of PRISM status by State. The implementation history also provides a baseline for examining PRISM program impacts through comparisons among States with different PRISM status.
3.3.1 Approach The PRISM program begins with a “Letter of Intent” signifying that a State wishes to participate in the program. During this step, the FMCSA reserves an allocation of funding for the State. But for the purposes of this study, implementation begins to take shape when a State signs a PRISM grant agreement with the FMCSA. This is followed by several key implementation milestones:
Allocating the program grant. Implementing the MCS-150 update requirement for carriers. Updating the Safety and Fitness Electronic Records (SAFER) system with
IRP vehicle data. Performing automated safety status checks (USDOT number and VIN) using
the IRP system. Invoking registration sanctions when the carrier is under an OOS order.
The evaluation team used these milestones as a baseline for conducting the following analyses:
Success of denying registrations Crash rates Violation rates Bar-code reader efficiency Non-match crash and inspection records MCS-150 update Bar-code reader data quality
For each analysis, the evaluation team grouped States according to their PRISM implementation status, milestone implementation dates, and specific PRISM program element evaluated. Table 3-1 lists the PRISM milestones that a given State must have completed in order for the evaluation team to include that State in any of the specific analytical components of the evaluation listed in left column of the table. Each analytical component represents an aspect of the safety environment that the team hopes to evaluate regarding PRISM efficiency and
August 2007 3-10

PRISM Program Evaluation
effectiveness, while taking into consideration the fact that States are operating at different levels of PRISM implementation.
Table 3-1. PRISM milestones by analysis component
ANALYSIS COMPONENT
PRISM MILESTONE
GRANT ALLOCATION
MCS-150 UPDATE
REQUIREMENT
IRP VEHICLE DATA TO SAFER
IRP AUTOMATED
SAFETY STATUS CHECKS
REGISTRATION SANCTIONS FOR OOS CARRIERS
Success of Denying Registrations
–
Crash Rates
Violation Rates
Bar-code reader Efficiency
This analysis examines the impacts of bar-code reader use independent of the implementation of any other PRISM milestone.
Non-Match Crash and Inspection Records
– –
MCS-150 Update – – –
Bar-code reader Data Quality
This analysis examines the impacts of bar-code reader use independent of the implementation of any other PRISM milestone.
3.3.2 Milestone Implementation Data Collection The evaluation team obtained PRISM milestone implementation dates from the PRISM program team at the FMCSA. The team also looked at the seven PRISM implementation reviews completed to date in Georgia, Maine, Minnesota, Nebraska, Ohio, Vermont, and Washington and contacted IRP representatives in all States that had signed a PRISM grant agreement as of May 2006. This information was used to independently confirm the milestone dates in each State.
The evaluation team identified some discrepancies between dates provided by the PRISM program team compared with those provided by individual States. After conferring with the FMCSA Office of Policy and Program Development, the team proceeded to evaluate the program using the PRISM implementation dates provided by the PRISM program team.
3.3.3 Additional PRISM Implementation Information In each State where PRISM had been implemented or where a grant agreement had been signed, the evaluation team contacted FMCSA division and State personnel to obtain further information about the PRISM experience. The team also contacted personnel in States that are not currently part of the PRISM Program. Offices contacted included:
FMCSA divisions (in most cases, the Division Administrator):
August 2007 3-11

PRISM Program Evaluation
− In States that had begun implementing PRISM. − In States that had signed a PRISM grant agreement but had not yet, to the
knowledge of the PRISM program team, begun to implement the program. − In States that had not signed a PRISM grant agreement.
State DMVs (in most cases, the IRP representative) or a similar office: − In States that had signed a PRISM grant agreement but had not yet, to the
knowledge of the PRISM program team, begun to implement the program. − In States that had not signed a PRISM grant agreement.
The evaluation team reviewed quarterly status reports prepared by the PRISM States. Several program management oversight questions recommended by the evaluation team were approved and added by the PRISM team to the quarterly reports during 2006.
3.3.4 PRISM Implementation Milestones Table 3-2 lists PRISM milestone implementation dates, by State, as reported by the PRISM program team in July 2006. These dates were used as the basis for determining State PRISM implementation status throughout the evaluation.
Appendix C lists PRISM implementation dates reported by the State DMV offices. Several dates differ from those reported by the PRISM program team in Table 3-2. Since there is no safety impact we decided to accept the dates provided by the Headquarters, but the Evaluation Team is concerned that the discrepancy may be a symptom of other weaknesses in recordkeeping.
Table 3-2 identifies 40 States that have received a PRISM grant. Of these 40 States, 18 have fully implemented PRISM based on all of the program milestones (listed in Table 3-1), three have implemented PRISM based on some of the milestones, and the remaining 19 have yet to implement any program milestones other than having received a grant allocation.
The milestone implementation dates in Table 3-2 represent each State’s initial implementation of each milestone. Note that motor vehicle registrations are submitted throughout the year. Since PRISM impacts motor carriers most directly at the time of vehicle registration, it normally takes a full 12-month registration cycle for the milestone to impact all relevant CMVs and motor carriers in a State. The analyses incorporate a 12-month registration cycle for all relevant PRISM milestones unless otherwise specified; some States achieved certain milestones in less than 12 months.
August 2007 3-12

PRISM Program Evaluation
Table 3-2. PRISM implementation milestones, by State, as of July 2006
State NameState Code
PRISM Implementation
Review Completed by PRISM Team
Milestone
Grant Allocation Date
Institution of MCS-150 Update
Requirement
Sending of IRP Vehicle Data to SAFER to Allow
PRISM to Populate Target File
IRP System to Perform Automated
Safety Status Checks (DOT &
Vehicle)
Invoking of Registration
Sanctions When Carrier is Under
OOSO
Alaska AK - 8/13/2004 - - - -
Alabama AL - 6/16/03 7/04 2/05 7/04 3/21/05
Arkansas AR - 9/2003 1/06 1/06 1/06 3/04
Arizona AZ - 7/28/00 8/02 1/03 4/03 (1)
California CA - 8/27/2004 - - - -
Colorado CO Insufficient information at this time. Left out of analyses.
Connecticut CT - 4/19/01 12/04 10/03 11/03 11/03
District of Columbia DC n/a Non-PRISM State
Delaware DE - 8/10/2004 (2) (2) (2) (2)
Florida FL - 9/2005 - - - -
Georgia GA Yes 3/8/99 12/00 3/01 12/01 1/02
Hawaii HI - 9/2005 - - - -
Iowa IA Fully implemented by 1995
Idaho ID - 9/2005 - - - -
Illinois IL - 8/27/2004 - - - -
Indiana IN - 11/6/02 n/a n/a n/a 1/04
Kansas KS - 9/2005 - - - -
Kentucky KY - 3/29/99 - - - -
Louisiana LA - 8/29/01 1/05 (1) (1) (1)
Massachusetts MA - 9/9/03 - - - -
Maryland MD n/a Non-PRISM State
Maine ME Yes 9/21/98 1/01 12/01 2/02 2/02
Michigan MI n/a Non-PRISM State
Minnesota MN - 9/17/02 12/04 11/03 2/05 6/05
Missouri MO - 9/11/03 - - - -
Mississippi MS n/a Non-PRISM State
Montana MT n/a Non-PRISM State
North Carolina NC - 7/25/02 1/03 3/03 11/02 2/03
North Dakota ND n/a Non-PRISM State
Nebraska NE Yes 9/3/03 9/04 9/04 9/04 4/04
Nevada NV n/a Non-PRISM State
New Hampshire NH - 9/18/02 10/03 8/04 - 8/04
New Jersey NJ - 9/30/01 - - - -
New Mexico NM - 8/18/00 10/02 4/03 12/03 7/03
New York NY n/a Non-PRISM State
Ohio OH Yes 5/03/02 2/03 9/03 3/03 3/03
Oklahoma OK - 8/26/02 - - - -
Oregon OR - Non-PRISM State (Was fully implemented 1997 to 2000, PRISM Pilot Program)
Pennsylvania PA - 7/1/98 - - - -
Rhode Island RI - 6/8/99 - - - -
South Carolina SC - 8/21/00 6/04 6/04 6/04 6/04
South Dakota SD - 9/25/00 10/04 10/04 10/04 7/02
Tennessee TN - 12/21/98 5/04 6/03 11/03 6/04
Texas TX - 9/2005 - - - -
Utah UT - 7/28/00 3/04 5/04 5/04 5/04
Virginia VA - 9/9/03 - - - -
Vermont VT Yes 9/25/00 1/04 7/04 1/05 1/05
Washington WA - 5/03/02 7/03 7/03 7/03 7/03
Wisconsin WI n/a Non-PRISM State
West Virginia WV - 9/11/03 4/01/05 4/01/05 4/01/05 4/01/05
Wyoming WY - 9/13/2004 - - - -
Notes:(1) State needs legislation to implement PRISM(2) Not Yet Scheduled: PRISM Implementation Plan is approved but no implementation activities are scheduled by the state yet
August 2007 3-13

PRISM Program Evaluation
Pilot States
The Office of Motor Carriers (OMC) report7 on the 1992–1997 PRISM Pilot Demonstration Project listed the pilot States as follows: Iowa, Colorado, Indiana, Oregon, and Minnesota. The following list summarizes the status of the five PRISM pilot States in the various evaluation analyses.
Minnesota: Minnesota was an original pilot State but did not implement any PRISM components during the pilot program. The evaluation team identified PRISM implementation dates, all of which occurred after the pilot program ended. These dates were used for the analysis.
Iowa: Iowa was an original pilot State and had implemented all PRISM components by the end of 1995. It was considered a fully implemented PRISM State throughout the analysis.
Oregon: Oregon was a fully implemented PRISM State but terminated participation in 2000. It was considered a fully implemented PRISM State from June 1997 to June 2000 and a non-PRISM State from July 2000 to date.
Colorado: As of this writing, Colorado had not implemented the last milestone, Invoking registration sanctions when carrier is under OOS order. The PRISM program team reported that Colorado can be considered a non-PRISM State since it never fully implemented PRISM. The evaluation team does not have any milestone implementation dates. Colorado may have implemented the milestone Institution of MCS-150 as a Requirement. Due to the lack of consistent data, Colorado was not included in any analyses.
Indiana: Indiana was an original pilot State but had not successfully implemented PRISM as of this writing. According to the PRISM program team, Indiana began implementing PRISM during 2002–2003 and to date had only achieved the milestones that call for sending IRP data to SAFER and for registration sanctions for OOS carriers. For the MCS-150 analysis and analyses requiring a fully implemented PRISM State, Indiana was considered a non-PRISM State. For analyses focusing on registration sanctions, it was considered a PRISM State as of January 2004.
3.3.4.1 State DMV and FMCSA Division Feedback
The evaluation team contacted State DMV and FMCSA division personnel for information about each State’s experience with PRISM beyond the milestone implementation dates. The following sections summarize feedback from State DMVs and FMCSA divisions. Inclusion of these responses does not necessarily reflect the views of the evaluation team; rather, it reflects the evaluation team’s appreciation of feedback from the field. Appendix D contains an overview of the results from all of the questionnaire responses received by the evaluation team and used throughout this evaluation.
7 Office of Motor Carriers, Federal Highway Administration. PRISM Pilot Demonstration Project. 1998.
August 2007 3-14
PRISM Program Evaluation
State DMV Feedback
DMV personnel in States currently not participating in the PRISM program cited the following as primary reasons for not having joined PRISM:
Lack of enabling State legislation. Need for support and lobbying by concerned industries. Additional requirements of technological interfaces. Overall lack of available IT resources.
Oregon is unique in that it was a PRISM pilot State that later dropped out of the program since it no longer regarded PRISM as beneficial. Oregon DMV personnel also mentioned that the State’s motor carrier industry had raised concerns and that addressing these concerns would be important for gaining industry support for PRISM and for any necessary legislative efforts in the State.
On a positive note, New York DMV personnel stated that grant funding provided by the FMCSA for implementing PRISM had increased the program’s appeal.
DMV personnel in seven partially implemented PRISM States reported that if additional PRISM funding were available they would spend it on further implementation and system maintenance, training staff in new and related technologies, and purchasing relevant IT and other equipment. No DMV personnel stated that they could not complete the implementation of PRISM without additional funding; rather, they said that additional funding would make it easier to continue implementation more effectively. FMCSA Division Feedback
FMCSA division staff, in most cases Division Administrators (DAs), had different responses about the effectiveness of PRISM according to whether or not their State was part of the program.
FMCSA personnel in non-PRISM States were neutral when asked about the program’s potential to successfully deny registrations to carriers under an OOS order. Two of the three that addressed PRISM’s success in encouraging motor carriers to update the MCS-150 forms regularly felt there was no impact, while the third was neutral. In contrast, about 80 percent of DAs in PRISM States felt strongly that the program was effective in helping carriers to achieve both of these goals. Seventy percent reported that carriers who were denied registration either ceased operation or took corrective action with 40 percent believing such carriers ended up limiting their operations to intrastate or merging with a healthy carrier. However, half said that some of these carriers simply continued operations under a different identity by changing their name and registering elsewhere.
FMCSA personnel in non-PRISM States cited the following primary reasons for those States not having joined PRISM:
August 2007 3-15

PRISM Program Evaluation
Lack of human resources, making it difficult to take on additional work. Perception of insufficient funding.8 Internal management politics.
In Nevada, the FMCSA reported that none of the potential State agencies (DMV, Department of Public Safety [DPS], State DOT) were interested in being the lead agency for the program or its grant administration.
Several States believed they had achieved some of PRISM’s safety goals through programs other than PRISM and did not consider it necessary to join. Maryland, for example, enacted the Preventive Maintenance (PM) program in 1988 to ensure that CMVs were in a safe operating condition when traveling on the State’s highways.9
Many States reported that they did not understand the unique benefits of the PRISM program. For some States, the perception was of a program in which they were responsible for ensuring that carriers complete an updated MCS-150 as an FMCSA requirement. Many States also understood that PRISM would prevent an existing OOS carrier from obtaining plates.
Some States that previously had not viewed PRISM as a viable program were just beginning to appreciate the program benefits and were interested in joining. New York is one such example, having signed a PRISM grant agreement in late 2006. Prior concerns related to PRISM’s failure to address issues involving intrastate carriers and the perception that few carriers were impacted by the program had since been resolved.
Recommendation 6: Increase efforts to communicate how PRISM works to the States and other stakeholders, via the FMCSA division offices.
PRISM States that had not fully implemented all PRISM components cited the following reasons for the delay:
Stakeholders’ resistance to the additional workload. Lack of continued funding. Institutional issues, including management turnover and delayed decisions.
8 The evaluation team is aware that PRISM is a 100 percent funded program. However, as noted in Section 3.1 (PRISM Program Environment), State DMV offices are often suspicious of Federal funding that is ostensibly offered with no strings attached and fear that the State will need to provide some of the funding. In either case, there appears to be a need to reinforce the DAs’ and State partners’ understanding of the PRISM program. 9 According to the PM program, owners of specific types of CMVs are required to have all vehicles inspected, maintained, and repaired at least every 25,000 miles or every 12 months, whichever occurs first. Vehicle owners must ensure that their vehicles meet or exceed CMV rules and regulations. All Maryland-registered commercial vehicles subject to this rule must be included in an approved PM program, and vehicle owners must certify this when registering a new vehicle or renewing an existing registration. Violation of these requirements is a misdemeanor and subjects the owner to fines and other penalties, including suspension of vehicle registration by the Maryland Motor Vehicle Administration (MVA).
August 2007 3-16

PRISM Program Evaluation
Hawaii was unsure how PRISM would be implemented since the State does not participate in the International Fuel Tax Association (IFTA) or IRP and, except for household goods carriers, is exempt from operating authority requirements.
While FMCSA staff in PRISM States generally thought that their States were proceeding well with PRISM implementation, personnel in several States indicated that additional funding would be required to address:
Adding personnel for system maintenance and enhancements and program management support.
Adding in-house personnel to support program operations. Training staff in the use of enhanced technology. Enhancing maintenance operations to make equipment more efficient. Improving the IT infrastructure, including system upgrades and support and
software and hardware enhancements. Identifying and building better deployment strategies. Improving data integration.
In Vermont, roadside inspectors are using satellite communications to run National Law Enforcement Telecommunication System (NLETS) queries. The State is exploring funding sources for other potential wireless communications methods to improve real-time connectivity, in addition to funding modifications, to comply with changing PRISM specifications.
3.3.5 Next Steps A historical record of PRISM status and implementation can help the FMCSA to evaluate the success of the program in achieving its goals to date and to refine a strategy for continuing efforts to advance PRISM implementation nationally. Historical PRISM milestone implementation dates can also serve as a baseline to further evaluate the program. States’ experience with PRISM implementation can support analyses of the program’s finances and design and serve as the basis for estimating the impact of implementation to date.
3.4 FINANCIAL REVIEW This financial review documents PRISM grant allocations to date, reported expenditures by State, and financial indicators for the PRISM program as a whole.
Since PRISM is a federally funded grant program, participation requires each State to submit an implementation plan and a grant request. If a State plan is accepted and signed, the FMCSA provides 100 percent of the funds to implement PRISM in the State; no matching State funding is required.
3.4.1 PRISM Grant Allocations and Expenditures When a State is interested in joining the PRISM program, State personnel develop a PRISM implementation plan. The plan is designed to enable the State to implement all components of
August 2007 3-17
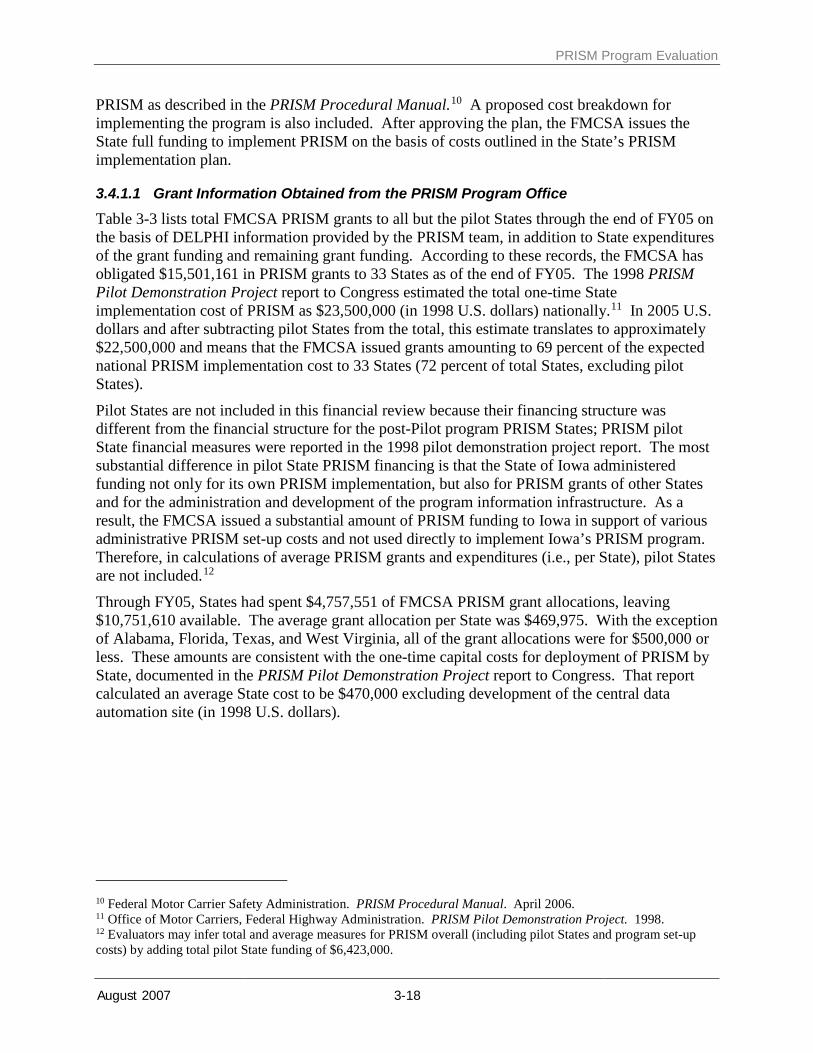
PRISM Program Evaluation
PRISM as described in the PRISM Procedural Manual.10 A proposed cost breakdown for implementing the program is also included. After approving the plan, the FMCSA issues the State full funding to implement PRISM on the basis of costs outlined in the State’s PRISM implementation plan.
3.4.1.1 Grant Information Obtained from the PRISM Program Office Table 3-3 lists total FMCSA PRISM grants to all but the pilot States through the end of FY05 on the basis of DELPHI information provided by the PRISM team, in addition to State expenditures of the grant funding and remaining grant funding. According to these records, the FMCSA has obligated $15,501,161 in PRISM grants to 33 States as of the end of FY05. The 1998 PRISM Pilot Demonstration Project report to Congress estimated the total one-time State implementation cost of PRISM as $23,500,000 (in 1998 U.S. dollars) nationally.11 In 2005 U.S. dollars and after subtracting pilot States from the total, this estimate translates to approximately $22,500,000 and means that the FMCSA issued grants amounting to 69 percent of the expected national PRISM implementation cost to 33 States (72 percent of total States, excluding pilot States).
Pilot States are not included in this financial review because their financing structure was different from the financial structure for the post-Pilot program PRISM States; PRISM pilot State financial measures were reported in the 1998 pilot demonstration project report. The most substantial difference in pilot State PRISM financing is that the State of Iowa administered funding not only for its own PRISM implementation, but also for PRISM grants of other States and for the administration and development of the program information infrastructure. As a result, the FMCSA issued a substantial amount of PRISM funding to Iowa in support of various administrative PRISM set-up costs and not used directly to implement Iowa’s PRISM program. Therefore, in calculations of average PRISM grants and expenditures (i.e., per State), pilot States are not included.12
Through FY05, States had spent $4,757,551 of FMCSA PRISM grant allocations, leaving $10,751,610 available. The average grant allocation per State was $469,975. With the exception of Alabama, Florida, Texas, and West Virginia, all of the grant allocations were for $500,000 or less. These amounts are consistent with the one-time capital costs for deployment of PRISM by State, documented in the PRISM Pilot Demonstration Project report to Congress. That report calculated an average State cost to be $470,000 excluding development of the central data automation site (in 1998 U.S. dollars).
10 Federal Motor Carrier Safety Administration. PRISM Procedural Manual. April 2006. 11 Office of Motor Carriers, Federal Highway Administration. PRISM Pilot Demonstration Project. 1998. 12 Evaluators may infer total and average measures for PRISM overall (including pilot States and program set-up costs) by adding total pilot State funding of $6,423,000.
August 2007 3-18

PRISM Program Evaluation
Table 3-3. PRISM grant amounts and expenditures through FY200513,14
13 Excluding PRISM pilot States (CO, IN, IA, MN, and OR). 14 Source: DELPHI, provided by PRISM team.
State
State Postal Code Grant Year Grant Amount Total to Date
Average per Year
Grant Funding Available
Alabama AL 2003 $513,605 $454,957 $151,652 $58,648Alaska AK 2004 $500,000 $32,398 $16,199 $467,602Arizona AZ 2000 $450,000 $443,074 $73,846 $6,926Arkansas AR 2003 $456,500 $3,308 $1,103 $453,192California CA 2004 $500,000 $0 $0 $500,000Colorado* CO ─ ─ ─ ─ ─Connecticut CT 1998 $452,200 $383,499 $47,937 $68,701Delaware DE 2004 $500,000 $0 $0 $500,000District Of Columbia DC ─ ─ ─ ─ ─Florida FL 2005 $750,000 $0 $0 $750,000Georgia GA ─ ─ ─ ─ ─Hawaii HI 2005 $500,000 $0 $0 $500,000Idaho ID 2005 $500,000 $0 $0 $500,000Illinois IL 2004 $500,000 $0 $0 $500,000Indiana* IN ─ ─ ─ ─ ─Iowa* IA ─ ─ ─ ─ ─Kansas KS 2005 $500,000 $0 $0 $500,000Kentucky KY 1999 $450,000 $95,780 $13,683 $354,220Louisiana LA 2000 $355,336 $335,827 $55,971 $19,509Maine ME 1998 $484,761 $467,130 $58,391 $17,631Maryland MD ─ ─ ─ ─ ─Massachusetts MA 2003 $500,000 $0 $0 $500,000Michigan MI ─ ─ ─ ─ ─Minnesota* MN ─ ─ ─ ─ ─Mississippi MS ─ ─ ─ ─ ─Missouri MO 2003 $261,630 $5,997 $1,999 $255,633Montana MT ─ ─ ─ ─ ─Nebraska NE 2003 $290,500 $143,208 $47,736 $147,292Nevada NV ─ ─ ─ ─ ─New Hampshire NH 2002 $475,255 $157,821 $39,455 $317,434New Jersey NJ 2000 $459,572 $0 $0 $459,572New Mexico NM 2000 $450,000 $358,164 $59,694 $91,836
New Mexico NM 2000 $359,450 $274,164 $45,694 $85,286New Mexico NM 2000 $90,550 $84,000 $14,000 $6,550
New York NY ─ ─ ─ ─ ─North Carolina NC ─ ─ ─ ─ ─North Dakota ND ─ ─ ─ ─ ─Ohio OH 2002 $427,296 $303,986 $75,996 $123,310Oklahoma OK 2002 $499,700 $0 $0 $499,700Oregon* OR ─ ─ ─ ─ ─Pennsylvania PA ─ ─ ─ ─ ─Rhode Island RI 1999 $450,000 $524 $75 $449,476South Carolina SC 2000 $180,706 $58,128 $9,688 $122,578South Dakota SD ─ ─ ─ ─ ─Tennessee TN 2000 $400,000 $127,538 $21,256 $272,462Texas TX 2005 $750,000 $0 $0 $750,000Utah UT 2000 $500,000 $489,660 $81,610 $10,340
Utah UT 2000 $50,000 $48,644 $8,107 $1,356Utah UT 2000 $450,000 $441,016 $73,503 $8,984
Vermont VT 2000 $500,000 $378,950 $63,158 $121,050Virginia VA 2003 $500,000 $0 $0 $500,000Washington WA 2002 $450,000 $336,533 $84,133 $113,467West Virginia WV 2003 $502,100 $181,066 $60,355 $321,034Wisconsin WI ─ ─ ─ ─ ─Wyoming WY 2004 $500,000 $0 $0 $500,000
US TOTAL $15,509,161 $4,757,551 $10,751,610
Expenditures
* PRISM pilot states.
August 2007 3-19

PRISM Program Evaluation
The average State expenditure for PRISM is currently $144,168. Excluding from this calculation the 13 States that had not begun to spend their PRISM grants, the average expenditure is $237,878. Among the 13 States that had not spent any of their PRISM grants, five received funding in 2005; four in 2004; two in 2003; and one each in 2002 and 2000. Average annual spending is $29,210 per State. Excluding States that had not spent any of their grants, average annual spending is $48,197.
Average expenditures were also calculated for fully implemented PRISM States on the basis of implementation of all key PRISM milestones reported in Section 3.3.4. The average expenditure for these States is $279,133, just 17 percent higher than the average for all States implementing PRISM ($237,878). This amount is roughly half the average cost of PRISM implementation documented in the PRISM Pilot Demonstration Project report ($470,000 in 1998 U.S. dollars).
There are at least two possible interpretations for these findings. First, fully implemented PRISM States may not have reported their total PRISM implementation expenditures. Second, States may have been implementing PRISM at a lower cost than during the PRISM pilot demonstration project. For example, the PRISM program introduced several efficiencies to reduce implementation costs in recent years, including automation of MCS-150 updates and elimination of the requirement for each State to automate the reporting of out-of-State vehicles for the target file. According to the PRISM team, the latter measure has reduced each State’s implementation costs by $20,000.
3.4.1.2 Grant Information Obtained from FMCSA Divisions The evaluation team also contacted FMCSA division and State DMV offices to help it better understand each State’s experience with PRISM. In addition to reporting qualitatively about this experience, most FMCSA divisions in States that signed a PRISM grant agreement provided the team with data on PRISM grants and expenditures, in some cases including estimates of future grants and expenditures. Table 3-4 lists grants and expenditures based on data provided by the FMCSA divisions; a gray background is used to highlight entries that differ from amounts reported in Table 3-3.
In most cases, discrepancies between amounts in Table 3-3 and Table 3-4 can be attributed to the different reporting timeframes. Table 3-3 reports totals through the end of FY05, whereas Table 3-4 is based on data from the FMCSA divisions in each State that were provided on a rolling basis over several weeks in 2006. Discrepancies that stand out in particular are:
Expenditures recorded for Alabama in Table 3-3 but not in Table 3-4. A grant recorded for Illinois in Table 3-3 but not in Table 3-4. No grant recorded for Georgia in Table 3-3 but both grants and expenditures
recorded in Table 3-4. No grant recorded for Mississippi or Montana in Table 3-3 but a grant
recorded in Table 3-4, indicating that both States signed a PRISM grant agreement recently.
Expenditures of $6,000 to date recorded for Missouri in Table 3-3 but an entire grant expenditure of $244,367 in Table 3-4.
No amounts recorded for Mississippi, Montana, North Carolina, or South Dakota in Table 3-3 but a grant amount reported for all of these States in
August 2007 3-20

PRISM Program Evaluation
Table 3-4. While a discrepancy could arise if these States had signed a PRISM grant agreement recently, both North Carolina and South Dakota received their PRISM grants several years ago and are now fully implemented PRISM States on the basis of having implemented key PRISM milestones. Table 3-4 reports that both North Carolina and South Dakota spent their entire grant allocations.
No grant amount for Pennsylvania in Table 3-3 but an initial grant allocation of $300,000 that was later returned in full to FMCSA recorded in Table 3-4.
Table 3-4 reports FMCSA PRISM obligations through 2005 as $15,202,745 and total expenditures by the States as $5,343,952. The former is just two percent lower than the PRISM grant total reported in Table 3-3, while the latter is 12 percent higher than expenditures listed in Table 3-4. Table 3-4 lists total PRISM grant amounts in 2006 as $4,250,000 and State expenditures as $286,031. Total expected FMCSA PRISM grant amounts during 2007–2008 will be $1,186,000, while total expected State expenditures during that period will be $4,905,189.
Table 3-4 also reports the PRISM status of each State on the basis of PRISM implementation milestone dates reported in the section on PRISM program implementation. While PRISM status can be expected to be related to reported grant allocations and expenditures, a one-to-one relationship is not necessary. There are intermediary steps to PRISM implementation that are not included in the key PRISM milestones defined for this evaluation. All of the discrepancies between State PRISM status and PRISM grant allocations or expenditures can be attributed to differences in reporting time or in PRISM implementation steps. Note that Pennsylvania returned its PRISM grant in 2005.15
Recommendation 7: The PRISM team should work through the FMCSA division administrators to verify the actual accounting status for every grant on a recurring basis (quarterly) and provide advanced training on how to properly extract data from the Delphi system.
15 Pennsylvania is in the process of implementing a new IRP system that will prepare it for future PRISM implementation.
August 2007 3-21

PRISM Program Evaluation
Table 3-4. PRISM grant amounts and expenditures through mid-calendar year 200616
16 Source: FMCSA divisions.
PRISM Funds Received PRISM Funds Spent
Amount of PRISM Funds
Received through 2005
Amount of PRISM Funds Received in
2006
Amount of PRISM Funds Expected to be Received
in 2007
Amount of PRISM Funds Expected to be Received
in 2008
Amount of PRISM Funds
Spent through 2005
Amount of PRISM Funds Spent in 2006
Amount of PRISM Funds Expected to be Spent in
2007
Amount of PRISM Funds Expected to be Spent in
2008Alabama AL Implementing PRISM $513,605 $0 $0 $0 $0 $0 $0 $0Alaska AK Grant-Only $500,000 $0 $0 $0 $127,446 $0 $250,000 $0Arizona AZ Implementing PRISM $450,000 $0 $0 $0 $443,074 $820 $0 $0Arkansas AR Implementing PRISM (1) $0 $0 $0 (1) $0 $0 $0California CA Grant-Only $500,000 $750,000 $0 $0 $0 $0 $500,000 $750,000Colorado CO Non-PRISM(2)
Connecticut CT Implementing PRISM $452,200 $0 $0 $0 $383,499 $0 $0 $0Delaware DE Grant-Only $500,000 $500,000 $500,000 $500,000 $0 $0 $251,000 $250,000District of Columbia DC Non-PRISM n/a n/a n/a n/a n/a n/a n/a n/aFlorida FL Grant-Only $750,000 $0 $0 $0 $0 $0 $750,000 $0Georgia GA Implementing PRISM $481,247 $881,000 $0 $0 $481,247 $0 $0 $0Hawaii HI Grant-Only $500,000 $0 $0 $0 $0 $0 $0 $0Idaho ID Grant-Only $500,000 $0 $0 $0 $0 $0 $0 $0Illinois IL Grant-Only $0 $0 $0 $0 $0 $0 $0 $0Indiana IN Implementing PRISMIowa IA Implementing PRISMKansas KS Grant-Only $500,000 $482,069 $0 $0 $0 $0 $0 $0Kentucky KY Implementing PRISM $450,000 $136,931 $0 $0 $95,780 $100,000 $195,150 $195,150Louisiana LA Implementing PRISM $355,336 $0 $0 $0 $352,220 $0 $0 $0Maine ME Implementing PRISM $484,761 $0 $0 $0 $484,735 $0 $0 $0Maryland MD Non-PRISM n/a n/a n/a n/a n/a n/a n/a n/aMassachusetts MA Grant-Only $500,000 $0 $0 $0 $0 $0 $0 $0Michigan MI Non-PRISM n/a n/a n/a n/a n/a n/a n/a n/aMinnesota MN Implementing PRISMMississippi MS Non-PRISM $0 $500,000 $0 $0 $0 $0 $0 $0Missouri MO Implementing PRISM $244,367 $0 $0 $0 $244,367 $0 $0 $0Montana MT Grant-Only $0 $500,000 unknown unknown $0 $0 $250,000 $250,000Nebraska NE Implementing PRISM $290,500 $0 $0 $0 $97,797 $63,105 $129,600 $0Nevada NV Non-PRISM n/a n/a n/a n/a n/a n/a n/a n/aNew Hampshire NH Implementing PRISM $475,255 $0 $0 $0 $149,245 $21,906 $0 $0New Jersey NJ Grant-Only $459,572 $0 $0 $0 (2) $0 $0 $0New Mexico NM Implementing PRISM (1) (1) (1) (1) (1) (1) (1) (1)New York NY Non-PRISM n/a n/a n/a n/a n/a n/a n/a n/aNorth Carolina NC Implementing PRISM $189,819 $0 $86,000 $100,000 $189,819 $0 $86,000 $100,000North Dakota ND Non-PRISM n/a n/a n/a n/a n/a n/a n/a n/aOhio OH Implementing PRISM $427,296 $0 (3) (3) $303,986 $0 unknown unknownOklahoma OK Grant-Only $499,700 $0 $0 $0 $0 $0 $0 $0Oregon OR Implementing PRISM
Pennsylvania PA Grant-Only $300,000 $0 $0 $0($300,000 not
spent, returned)
$0 $0 $0
Rhode Island RI Grant-Only $450,000 $0 $0 $0 $525 $1,188 $448,289 $0South Carolina SC Implementing PRISM (1) (1) (1) (1) (1) (1) (1) (1)South Dakota SD Implementing PRISM $500,000 $0 $0 $0 $500,000 $0 $0 $0Tennessee TN Implementing PRISM $400,000 $0 $0 $0 $127,538 $0 $0 $0Texas TX Grant-Only (1) (1) (1) (1) (1) (1) (1) (1)Utah UT Implementing PRISM $500,000 $0 $0 $0 $440,000 $60,000 unknown unknownVermont VT Implementing PRISM $500,000 $0 $0 $0 $379,428 $0 $0 $0Virginia VA Grant-Only $500,000 $0 $0 $0 $0 $0 $0 $0Washington WA Implementing PRISM $450,000 $0 unknown unknown $380,533 $0 unknown unknown
West Virginia WV Implementing PRISM $502,100 $0 $0 $0
$162,712 spent from inception through FY2005
$39,012 spent to date in FY2006
$0 $0
Wisconsin WI Non-PRISM n/a n/a n/a n/a n/a n/a n/a n/aWyoming WY Grant-Only $500,000 $0 $0 $0 $0 $0 $500,000 $0TOTALS $15,202,745 $4,250,000 $586,000 $600,000 $5,343,952 $286,031 $3,360,039 $1,545,150Notes:
Pilot State
Pilot State
(3) The FMCSA Division in Ohio indicated that the state will most likely need additional funding to address findings identified during the FY2005 PRISM Implementation Review.
State
State Postal Code
PRISM Program Status based on Key
PRISM Milestones
(1) No data provided.(2) NJ has incurred state cost, but Federal funds have not been authorized yet because the vendor has not been secured.
Pilot State
Pilot State
Pilot State
August 2007 3-22

PRISM Program Evaluation
3.4.2 Additional Financial Information from FMCSA Divisions and State DMVs The evaluation team requested qualitative information related to PRISM program financing both from FMCSA divisions and State DMVs. This section reports qualitative and anecdotal responses. Additional Funding
The team asked the FMCSA divisions and State DMVs the following question: Would additional funding as part of the original PRISM grant have enhanced the State’s ability to implement PRISM? Figure 3-2 displays the responses to this question from all FMCSA divisions and from DMVs in States implementing PRISM. Among 45 FMCSA divisions that responded to this question, 36 percent reported that they were neutral about the potential of additional initial funding to improve the State’s ability to implement PRISM, 46 percent agreed or strongly agreed, and 18 percent disagreed or strongly disagreed. Among the 21 DMVs in States implementing PRISM that responded to this question, 29 percent were neutral, 52 percent agreed or strongly agreed, and 19 percent disagreed. Maintenance Funding
The FMCSA divisions and State DMVs were also asked: Would maintenance funding from the PRISM program enhance the State’s ability to continue implementing PRISM program components over time?
Figure 3-3 displays the responses to this question from the FMCSA divisions and from DMVs in States implementing PRISM. Among 44 FMCSA divisions that responded to this question, 52 percent strongly agreed that ongoing PRISM funding for maintenance might improve the State’s ability to implement PRISM over time and 36 percent agreed. Only 7 percent disagreed or strongly disagreed, while 5 percent were neutral. Among the 20 DMVs that responded to this question, 40 percent strongly agreed and an additional 45 percent agreed. Only 15 percent were neutral, and none disagreed.
If the FMCSA were to estimate the annual costs of implementing PRISM in each State, a starting point could be the PRISM Pilot Demonstration Project report to Congress, in which this cost was calculated as $16,000.
3.4.3 Findings (Financial Review) The post-pilot cost of the PRISM program to the FMCSA of $15.5M through the end of FY05 is consistent with the total cost predicted in the PRISM Pilot Demonstration Project report to Congress issued in 1998. The average grant allocation of $469,975 is also consistent with the average one-time capital cost per State noted in the PRISM Pilot Demonstration Project report for the five pilot States ($470,000 in 1998 dollars). State expenditures to date are roughly one-third of total grant allocations. Expenditures in States that have implemented the complete set of key PRISM milestones defined in this program evaluation are $279,133, about half of the anticipated $470,000 in real dollar terms. This observation is consistent with the opinion of most FMCSA divisions, only 46 percent of which believed that larger PRISM grant allocations would increase States’ ability to implement PRISM. The 52 percent of DMVs in States implementing
August 2007 3-23

PRISM Program Evaluation
PRISM that believed such funding was essential is only slightly higher, but it still does not represent an overwhelming majority.
An overwhelming belief that ongoing funding for PRISM program maintenance and enhancements could make the program more appealing to States was reported by 88 percent of the FMCSA divisions and 85 percent of State DMVs. The PRISM team recently authorized the expenditure of unused implementation funds to satisfy lingering “maintenance-like” implementation matters in several States that validated that they had such a need.
Recommendation 8: The FMCSA should address the concern that some States have regarding the perceived lack of post-implementation funding for PRISM. The agency should first determine whether they need to seek PRISM unique authority under reauthorization to fund States after PRISM implementation is complete, or otherwise educate the State partners that long-term funding is available through other existing safety grant programs like CVISN and MCSAP.
August 2007 3-24

PRISM Program Evaluation
Figure 3-2. Impact of additional PRISM funding on PRISM implementation
Responses to the question “Would additional funding as part of the original PRISM grant have enhanced the State’s ability to implement PRISM?”
Figure 3-3. Impact of maintenance funding on continued PRISM implementation
Responses to the question “Would maintenance funding from the PRISM program enhance the State’s ability to continue implementing PRISM program components over time?”
0
5
10
15
20
25
30
35
40
Strongly Agree Agree Neutral Disagree StronglyDisagree
Perc
ent o
f Tot
al
FMCSA (Total: 45) DMVs (Total: 21; PRISM-implementing states only)
0
10
20
30
40
50
60
Strongly Agree Agree Neutral Disagree StronglyDisagree
Perc
ent o
f Tot
al
FMCSA (Total: 44) DMVs (Total: 20; PRISM-implementing states only)
August 2007 3-25

PRISM Program Evaluation
4 PRISM IMPACTS: IMPROVEMENTS IN SAFETY
4.1 REGISTRATION DENIALS The single, most tangible impact that PRISM can have on motor carrier safety is denying vehicle registrations to carriers subject to Federal OOS orders. Prior to 2000, orders denying registrations were rarely issued and were limited to situations where a carrier had been declared an “imminent hazard.” Since late 2000, the U.S. Congress has granted numerous new authorities to the FMCSA, resulting in thousands of carriers being issued OOS orders annually. Non-PRISM States do not have a mechanism for applying registration sanctions to motor carriers facing such orders.
To fully and accurately measure the extent of vehicle registration denials in PRISM States and their impact on safety, historical data of attempted vehicle registrations denied due to carrier OOS status is required. This is difficult since PRISM has only recently required that States keep a historical record of OOS-related registration denials. In addition, because there are no registration denials in non-PRISM States, there can be no basis for comparing registration denials in States of varying PRISM status. In lieu of directly measuring the number and type of registration denials, the evaluation team developed several alternative approaches for determining the success of such denials. These approaches represent a defensible assessment of the success of registration denial efforts in PRISM States.
4.1.1 Analysis Approach Although a reliable, complete record of registration denials is not available, there are records of successful CMV registrations in all States. In addition, the FMCSA maintains a historical record of carrier OOS status. The evaluation team examined both sets of information to identify whether and to what extent CMV registrations were issued to OOS carriers in PRISM States. Since attempted registrations by OOS carriers should be identified and prevented in PRISM States, there should be few or no registrations issued to such carriers in those States. The evaluation team realizes that failure to observe registrations issued
Research Findings: Registration Denials
Challenges: - PRISM requirement for states
to keep record of OOS registration denial is only recent.
- No registration denials in non-PRISM States means no direct comparisons with PRISM States possible.
Solutions: - Download MCMIS and EMIS
OOS status data and record registrations from 2002 to 2006.
- State registration offices report carrier OOS status.
- Examine PRISM program target file.
Findings: - PRISM States enabled
registrations to small number of OOS carriers (EMIS: 76 registrations/21 carriers; MCMIS: 50 registrations/25 carriers).
- State vehicle registration offices correctly identified 100 percent of OOS and non-OOS carriers in unannounced questioning carried out by the evaluation team.
- PRISM target file: 5 percent of relevant vehicles missed initially due to an identified computer error. After addressing the error, the rate of missed vehicles was reduced to 2.5 percent.
August 2007 4-1

PRISM Program Evaluation
to OOS carriers does not necessarily mean that PRISM is responsible. However, evidence that such registrations take place would be an indication that efforts to prevent them are not fully successful.
The evaluation team also contacted vehicle registration offices in PRISM States to test the accuracy of information related to the OOS status of a mix of motor carriers domiciled in several States. This method is not perfect. First, correctly identifying carrier OOS status is only one of the steps that a State must take to deny registration. In order for PRISM to be properly implemented, this must be followed by an actual registration denial. Second, vehicle registration offices may treat inquiries from the evaluation team differently than actual registration applications by motor carriers. Despite these concerns, this approach provides a defensible method of determining the quality of carrier safety data available to PRISM States.
The PRISM program compiles a real-time file of the safety status of carriers responsible for CMV safety and the vehicles affiliated with these carriers on the basis of data received from each State. The file contains a field identifying vehicles targeted for carrier OOS status and is used by PRISM States as the basis for approval and denial of vehicle registrations. As part of this analysis, the evaluation team reviewed a snapshot of this vehicle target file for consistency with carrier OOS status.
Finally, the team studied completed PRISM implementation review reports to identify findings relevant to this analysis. One element of these reports is an evaluation of a State’s registration denial procedures.
4.1.2 Definition of a PRISM State (Registration Denial Analysis) In this analysis, a PRISM State was defined as a State that has implemented all major milestones of the PRISM program with the exception of the MCS-150 update requirement, since that milestone is not necessary for enforcing registration denials based on carrier safety status. Where relevant additional information on a State was available, it was also used to draw conclusions. For example, not all States that implemented all key PRISM program milestones have been fully certified by the PRISM program for having appropriate procedures and frameworks in place to generate PRISM target files.
It was not necessary to complete a full 12-month registration cycle in this analysis since comparisons of annual rates cannot be calculated. Instead, this evaluation was based on observations of snapshots in time and straightforward counts.
The PRISM team developed a meaningful way to categorize the various stages of PRISM State implementation into three comprehensive “Levels of Implementation.” Unfortunately, the PRISM team had not presented this information in time for the evaluation team to incorporate it into the analysis. The evaluation team agrees that the new categorization is logical and it is explained further in Appendix E.
4.1.3 Results Results are reported separately for the following approaches:
Successful registrations by OOS carriers. Carrier OOS status reported directly by State registration offices. Examination of PRISM target files and PRISM implementation reviews.
August 2007 4-2

PRISM Program Evaluation
4.1.3.1 Successful Registrations by OOS Carriers The evaluation team downloaded carrier OOS status data from 2002 to 2006 separately from the Motor Carrier Management Information System (MCMIS) and the Enforcement Management Information System (EMIS), along with all recorded CMV registrations associated with these carriers. Vehicle registration dates and effective OOS dates were evaluated to identify registrations with a start date occurring during the relevant carrier’s OOS period. Using EMIS data, the team identified 76 registrations allocated to 21 OOS carriers from a total of 639,223 registrations during the analysis timeframe. Using MCMIS OOS data, 50 registrations allocated to 25 OOS carriers were identified in eight States.
These findings indicate that PRISM States can be effective in denying vehicle registrations to OOS carriers. Even those registrations that appear to have been issued to OOS carriers do not necessarily mean the program failed. Some or all of those registrations may have actually been issued prior to the OOS period, because many States allow registrations to be issued during the month before they take effect. A carrier could thus register a vehicle in advance while in good safety standing and later enter OOS status prior to the effective date of the registration, resulting in a registration start date that falls during the OOS period. This scenario could explain a number of the OOS registrations that were identified since several had a start date that fell on the first of the month and several days after the issuance of an OOS order. Another explanation is the backdating of a registration to the date following the expiration of a vehicle’s previous registration (i.e., the date that the registration would have been approved had the carrier not been in OOS status).
4.1.3.2 Carrier OOS Status Reported Directly by State Registration Offices
The evaluation team created a list of 15 motor carrier USDOT numbers. Ten carriers were listed in EMIS as being under a Federal OOS order while the remaining five were not.17 The team then randomly selected five fully implemented PRISM States (Maine, Minnesota, South Dakota, Utah, and Washington) and, without prior notification, questioned CMV registration offices in these States on the safety status of the 15 selected carriers.18 State personnel were asked to follow the same procedures for determining carrier safety status that they would follow in the event of a real-life application for an interstate CMV registration.
All five States had a standard procedure for looking up carrier safety status quickly and efficiently, yielding the following results:
100 percent of active, non-OOS carriers were identified as such. 100 percent of OOS carriers were identified as being OOS, inactive, or both.
The evaluation team confirmed the inactive status of all carriers identified as such by the State offices. Each State indicated that, under standard procedures, finding a carrier in OOS or inactive status would halt a vehicle registration attempt until the applicant resolved the issue to meet State requirements
17 The five non-OOS carriers were considered active during the past three years on the basis of having a current driver safety evaluation area (SEA) score in SafeStat. 18 Carrier safety status was verified on each day that the State offices were contacted.
August 2007 4-3

PRISM Program Evaluation
4.1.3.3 Examination of PRISM Program Data The evaluation team confirmed the overall success of PRISM States’ ability to deny registration to OOS carriers by reviewing the well documented PRISM implementation review reports. Of the seven States reviewed to date, five—Minnesota, Nebraska, Ohio, Vermont, and Washington—have successfully met this responsibility, with only minor modifications needed. The PRISM team found several deficiencies in Georgia and Maine, and recommendations to meet the prescribed standards were made, accepted, and implemented.
In the course of the analysis, the evaluation team discovered a problem with the data from the PRISM program. The team took a December 8, 2006 snapshot of the PRISM target file, which identified 1,043 vehicles assigned to carriers currently in Federal OOS status. Of these vehicles, 992 were targeted vehicles and 51 were not, implying a 5 percent overall error rate in identifying targeted (OOS) vehicles. The PRISM Technical Support staff identified part of the reason for this problem during routine data integrity monitoring and traced the source of the error to a program unit inadvertently activated on the SAFER system by the database. The PRISM technical team then scheduled the implementation of a data system patch to correct the problem.
Following the PRISM team’s efforts to correct the above-mentioned error, the evaluation team examined another snapshot of the PRISM target file from May 9, 2007. On that date, 863 vehicles were properly targeted and 21 were not, yielding a 2.5 percent error rate. This was half the error rate discovered in the December 8, 2006, snapshot. The PRISM team assured the evaluation team that data integrity issues such as this one are now being programmatically monitored, with PRISM personnel having been assigned the task to make it a priority to remediate any problems. The PRISM team’s ability to do so is indicated by the marked improvement reported here in the success of targeting vehicles correctly.
4.1.4 Conclusion Although there was no major deficiency in the ability of PRISM States to determine whether or not a carrier was under a Federal OOS order, there were several minor deficiencies. First, a small number of registrations were issued to OOS carriers, and second, a small number of targeted vehicles were not identified as being under an OOS order in a snapshot of the PRISM target file. PRISM implementation reviews conducted by the PRISM team documented similar findings, with five of seven States having successfully used the registration sanctions required by PRISM.
4.2 CRASH RATES By preventing OOS carriers from registering vehicles, the PRISM program helps to keep potentially unsafe vehicles off the road. PRISM can also help to prevent CMV crashes through its contributions toward improved data quality and efficiency. This section evaluates whether PRISM implementation by a State has an observable association with State CMV crash rates.
This crash-rate analysis is imperfect because current data sources do not allow for isolating State of vehicle registration for all CMVs, nor do they allow for a pure evaluation of PRISM’s contribution to safety. The evaluation team counted carriers domiciled in PRISM States, which may include assets registered in non-PRISM States; conversely, carriers domiciled in non-PRISM States may include assets registered in PRISM States. Consequently, the program effectiveness attributed to a State is potentially skewed by analysis based on carrier State of
August 2007 4-4

PRISM Program Evaluation
domicile. Although the evaluation team does not have sufficient information to determine if the error is normally distributed, the team decided to accept this margin of error that may skew the results slightly in an undetermined direction (i.e., may produce either lower or higher estimates of PRISM impacts).
4.2.1 Relationship Between PRISM and Crash Rates Several components of PRISM may influence motor carrier crash occurrence, resulting in lower crash rates among carriers impacted by PRISM than among those not impacted. Improved motor carrier data quality, motor carrier safety accountability, and efficiency across relevant government agencies provide the FMCSA with stronger tools for combating motor carrier crashes. However, while all FMCSA safety programs and efforts, including PRISM, ultimately aim at lowering motor carrier crash rates, isolating the impact of any particular program or effort on crash rates is not a straightforward undertaking. The environment in which CMVs operate is affected not only by FMCSA programs but also by a multitude of other factors, including efforts by other government agencies; geographic, economic, and timing conditions; and the behavior of non-CMV drivers on the road.
The focus of this evaluation was limited to components of the PRISM program that differ across States. Initial analysis showed very few safety-related registration denials to date, primarily due to the limited number of participating States and the very recent introduction of guidelines for documenting and recording such data. Without further analysis, it is not possible to draw conclusions regarding causal relationships between PRISM and CMV safety. Another problem with the use of registration denials as a measure of effectiveness is the difficulty of establishing what constitutes a positive finding in this regard. For example, finding a decrease in the number of denials may imply either that PRISM is not doing a good job, or that PRISM has had a substantial positive impact by functioning as a deterrent that discourages carriers from even attempting to register vehicles without meeting program requirements.
Carriers with a poor history of updating their data with the FMCSA and carriers with a very poor safety history ultimately could be forced out of business as a result of vehicle registration denials under PRISM unless they improve their records. However, the vast majority of carriers are not in danger of having their vehicle registrations denied as a result of poor safety. The influence of PRISM on the safety of very unsafe carriers, which are a small minority of all carriers, thus may not be discernible at the State or multistate level.
For PRISM in particular, an additional factor complicating the development of appropriate crash-rate measures is the distinction between a carrier’s State of domicile and the State or States in which that carrier registers its vehicles. While PRISM deals most directly with carriers, the
Research Findings: Crash Rates
Key question: Do carriers in PRISM
States have lower CMV crash rates than carriers in non-PRISM States?
Challenge: Isolating the impact of any particular program or effort on crash rates.
Approach: - Calculate CMV crash rates. - Review crash rate differences
linked to state PRISM implementation.
Rationale: PRISM lowers crash occurrence through improved data quality, efficiency, and safety accountability.
Conclusion: States achieving full PRISM status show improved safety over time compared with other States, indicating that PRISM could moderate crash rates.
August 2007 4-5

PRISM Program Evaluation
program’s total impact on any individual carrier depends on the distribution of the carrier’s CMV registrations across States that may be in different stages of PRISM implementation.
Despite these complexities, crash rates are an important element of the motor carrier safety environment and a key potential measure of FMCSA program impacts. The current analysis constructed a meaningful measure of motor carrier crash rates to isolate any observable association between crash rates and PRISM program implementation. This measure was developed on the basis of available data. An ideal crash-rate measure would incorporate both motor carrier crash occurrence and motor vehicle activity as measured by VMT. However, available motor carrier VMT data are not sufficiently reliable for this purpose. VMT data recorded in compliance reviews of carriers targeted for safety problems represent a statistically biased sample, while VMT data submitted by carriers on MCS-150 forms are largely out of date and unreliable. As a result, the FMCSA does not generally use VMT data in State- or national-level studies of motor carrier safety as a measure of motor carrier activity. In lieu of valid VMT data and consistent with procedures established in previous FMCSA safety analyses performed at the Volpe Center, the evaluation team used total carrier power units as a measure of motor carrier activity and exposure in its crash-rate analyses.
4.2.2 Analysis Approach The evaluation team used the following approach for its analysis of the relationship between PRISM and crash rates:
Calculate motor carrier crash rates. Review differences in motor carrier crash rates that can be linked to State
PRISM implementation status.
Crash rates are calculated by State and by year as follows:
For all power units owned by interstate carriers and intrastate hazmat carriers domiciled in a State:
Crash rate = number of crashes/number of power units, in 1,000s Crash rateFatal = number of fatal crashes/number of power units, in 1,000s
Crash rateInjury = number of injury crashes/number of power units, in 1,000s Table 4-1 lists numbers of motor carrier power units, crashes, and crash rates, by carrier’s State of domicile, for the years 2000 through 2005, on the basis of MCMIS data. To reduce the influence of erroneous or missing data, outliers were filtered out of the sample, using an algorithm developed at the Volpe Center as part of the FMCSA Compliance Evaluation Project, the predecessor to the agency’s Comprehensive Safety Analysis (CSA) 2010. The criteria used in the filtering procedure are defined in Appendix F, along with the number of carriers affected each year.
4.2.3 Definition of a PRISM State In this analysis, a PRISM State was defined as a State that had implemented all major milestones of the PRISM program for a minimum of 12 months. This definition accounts for the potential impact of all PRISM components on motor carrier safety and crash rates. It also allows all
August 2007 4-6
PRISM Program Evaluation
PRISM program requirements, such as MCS-150 updating and vehicle registration sanctions, to be fully implemented across all carriers domiciled in a given State during a 12-month period.
Figure 4-1 lists States that met the relevant PRISM-State definition prior to 2005, the latest year included in this analysis, along with the dates that they achieved full PRISM implementation status. Data for 2006 were incomplete at the time of this analysis.
4.2.4 Results Because only nine States had achieved and maintained full PRISM status, with five of these States having only met the required criteria in 2004, just prior to the final year of the analysis period, the potential for measuring the possible impacts of PRISM on crash rates was limited. The evaluation team used two measures:
Crash rates between PRISM and non-PRISM States, by year. Changes in crash rates over time between States that had achieved full PRISM
status and those that had not.
August 2007 4-7

PRISM Program Evaluation
Table 4-1. Motor carrier power units, crashes, and crash rates, by carrier’s State of domicile19
19 Source: MCMIS, June 23, 2006, snapshot (for crashes); SafeStat, final table for each year (for power units).
August 2007 4-8

PRISM Program Evaluation
Figure 4-1. Full PRISM implementation dates, by State
4.2.4.1 PRISM versus Non-PRISM Crash Rates
Comparisons between PRISM State and non-PRISM State crash rates by year were inconclusive. The raw data reviewed by the evaluation team observed higher crash rates in PRISM States (see Appendix G). This observation is not statistically robust since it does not account for potential crash-rate determinants other than the PRISM status of the carrier’s State of domicile. Such factors would have less overall influence as more PRISM States are added, consistent with the observation that, in 2005, when there were nine PRISM States, a much lower positive association between State PRISM status and crash rates was observed than in most previous years. These findings confirm the difficulty of isolating the influence of a program like PRISM on crash rates.
4.2.4.2 Crash-Rate Changes Over Time: Pre- and Post-PRISM
Several non-PRISM factors influencing motor carrier crash occurrence, such as climate, the amount and quality of highway infrastructure, traffic conditions, population density, and characteristics of State government, could be State-specific. An effective control method for these types of factors is to observe the impact of PRISM implementation one State at a time, comparing pre- and post-PRISM crash rates within the same States over time. While this approach does not completely eliminate the problem of confounding factors, it provides a degree of control not possible in simple comparisons of crash rates between PRISM and non-PRISM States.
Table 4-2 lists States that progressed from non-PRISM to PRISM status between 2000 and 2005. Pre- and post-PRISM crash rates for these States make it possible to observe any changes that may have occurred during the period of transition from non-PRISM to PRISM status. These changes can then be compared individually or in combination with any change in crash rates that may have occurred in States that did not progress to PRISM status over the same time period. This comparison would add a second control for confounding factors, eliminating the influence of relevant trends in crash rates that that may have occurred at the national level.
Table 4-2. States that progressed from non-PRISM to PRISM status, by time period
Date of Full PRISM
Implementation
Iowa December, 1995
Georgia January, 2002
Maine February, 2002
South Dakota July, 2002
North Carolina February, 2003
Ohio March, 2003
New Mexico July, 2003
Washington July, 2003
Connecticut November, 2003
one year registration cycle full PRISM implementation
20062002 2003 2004 20051998 1999 2000 2001State 1995 1996 1997
August 2007 4-9

PRISM Program Evaluation
2000 to 2003 2001 to 2004 2002 to 2005
Georgia Maine Connecticut
South Dakota North Carolina
New Mexico
Ohio
Washington
Table 4-3 presents both individual and combined crash-rate changes for States that transitioned from non-PRISM to PRISM status during the three periods listed in Table 4-2. Table 4-3 shows crash-rate changes for all other States during the same time periods for comparison.
Table 4-3. Crash-rate changes pre- and post-PRISM implementation
While almost all State groupings had rising crash rates over time, the increase was lower for those with a pre- to post-PRISM transition. During the first period, 2000 to 2003, Georgia was the only State to make this transition, experiencing a 16.9 percent drop in crash rates compared with an overall 0.3 percent rise in all other States. During the second period, 2001 to 2004, States going through the transition to full PRISM status experienced a 14.3 percent rise in crash rates compared with a 14.8 percent rise in other States. From 2002 to 2005, States transitioning to full PRISM status experienced a 6.7 percent rise in crash rates which compares favorably to a 13.7 percent rise in other States.
The results in Table 4-3 represent an observable potential downward influence on CMV crash rates attributable to the PRISM status of the carrier’s State of domicile. Table 4-4 and Table 4-5 reveal similar associations between State PRISM status and fatal and injury CMV crash rates for most of the timeframes considered. The only exception was for fatal crashes during the third time period, 2002 to 2005.
2000 to 2003 2001 to 2004 2002 to 2005
States2000
Crash Rate2003
Crash RateAbs.
ChangePercent Change
2001Crash Rate
2004Crash Rate
Abs. Change
Percent Change
2002Crash Rate
2005Crash Rate
Abs. Change
Percent Change
Georgia 25.78 21.42 -4.36 -16.9% - - - - - - - -Maine - - - - 15.64 22.07 6.43 41.1% - - - -South Dakota - - - - 22.09 19.81 -2.28 -10.3% - - - -Connecticut - - - - - - - - 9.26 10.42 1.16 12.5%North Carolina - - - - - - - - 23.8 21.35 -2.45 -10.3%New Mexico - - - - - - - - 10.19 12.89 2.70 26.5%Ohio - - - - - - - - 22.42 25.86 3.44 15.3%Washington - - - - - - - - 17.37 20.43 3.06 17.6%PRISM-Transitioned States
25.78 21.42 -4.36 -16.9% 18.4 21.03 2.63 14.3% 20.08 21.42 1.34 6.7%
All Other States 22.91 22.99 0.08 0.3% 20.54 23.59 3.05 14.8% 20.84 23.7 2.86 13.7%
August 2007 4-10

PRISM Program Evaluation
Table 4-4. Fatal crash-rate change pre- and post-PRISM implementation
Table 4-5. Injury crash-rate change pre- and post-PRISM implementation
4.2.5 Conclusion Due to innumerable confounding factors, it is extremely difficult to try to isolate the effect of any single motor carrier safety program on crash rates. PRISM only impacts carrier safety indirectly, through improved accountability, data quality and efficiency. Despite these challenges, analysis of crash-rate changes over time, using pre- and post-PRISM crash rates for States that had implemented PRISM fully by 2005, revealed a relationship between State PRISM status and lower CMV crash rates for all three crash-rate definitions. This finding was likely possible because a time-series analysis controls for some of the confounding factors that otherwise impact the data. Nationwide trends such as overall improved crash-data reporting or changing economic conditions are controlled for in such a comparison.
As expected, cross-sectional analysis (i.e., a snapshot at one point in time) of State PRISM status and crash rates, which does not include the controls present in time-series analysis, were not able to isolate PRISM’s impact. Instead, the cross-sectional analysis yielded a non-robust positive association between State PRISM status and crash rates, which notably declined substantially in 2005 following a more than doubling of the number of PRISM States. This observation suggests that as more States achieve full PRISM status the uncertainty caused by confounding factors may become less relevant, if in fact PRISM contributes to lower crash rates.
2000 to 2003 2001 to 2004 2002 to 2005
States2000 FatalCrash Rate
2003 FatalCrash Rate
Abs. Change
Percent Change
2001 FatalCrash Rate
2004 FatalCrash Rate
Abs. Change
Percent Change
2002 FatalCrash Rate
2005 FatalCrash Rate
Abs. Change
Percent Change
Georgia 1.72 0.76 -0.96 -55.7% - - - - - - - -Maine - - - - 0.19 0.41 0.22 115.1% - - - -South Dakota - - - - 1.20 0.80 -0.40 -33.0% - - - -Connecticut - - - - - - - - 0.44 0.31 -0.13 -29.9%North Carolina - - - - - - - - 0.84 0.87 0.03 3.5%New Mexico - - - - - - - - 0.67 0.78 0.11 15.8%Ohio - - - - - - - - 0.96 1.00 0.04 4.1%Washington - - - - - - - - 0.69 0.85 0.16 23.3%PRISM-Transitioned States
1.72 0.76 -0.96 -55.7% 0.62 0.59 -0.03 -5.4% 0.81 0.85 0.04 5.5%
All Other States 1.05 0.86 -0.18 -17.3% 0.90 0.87 -0.03 -3.0% 0.84 0.84 0.01 0.7%
2000 to 2003 2001 to 2004 2002 to 2005
States
2000 InjuryCrash Rate
2003 InjuryCrash Rate
Abs. Change
Percent Change
2001 InjuryCrash Rate
2004 InjuryCrash Rate
Abs. Change
Percent Change
2002 InjuryCrash Rate
2005 InjuryCrash Rate
Abs. Change
Percent Change
Georgia 14.21 11.39 -2.82 -19.8% - - - - - - - -Maine - - - - 10.17 9.86 -0.31 -3.1% - - - -South Dakota - - - - 8.39 6.94 -1.45 -17.3% - - - -Connecticut - - - - - - - - 3.83 4.17 0.34 8.8%North Carolina - - - - - - - - 12.18 10.03 -2.15 -17.7%New Mexico - - - - - - - - 4.33 6.22 1.89 43.5%Ohio - - - - - - - - 12.72 12.56 -0.16 -1.2%Washington - - - - - - - - 5.20 5.53 0.33 6.4%PRISM-Transitioned States
14.21 11.39 -2.82 -19.8% 9.73 8.53 -1.20 -12.3% 9.96 9.55 -0.41 -4.1%
All Other States 11.06 10.77 -0.29 -2.6% 9.78 10.64 0.86 8.8% 10.10 10.38 0.29 2.8%
August 2007 4-11

PRISM Program Evaluation
4.3 DRIVER AND VEHICLE OOS VIOLATION RATES This section evaluates roadside inspection (RI) OOS violation rates to determine the extent to which they may be impacted by PRISM. Use of OOS violation rates is an alternative to the use of crash rates in measuring the overall safety environment of CMVs.
4.3.1 Relationship Between PRISM and OOS Violation Rates
Several components of PRISM may influence motor carrier RI violation rates. First, improved reporting of motor carrier data and motor carrier safety accountability and greater efficiency across relevant government agencies provide the FMCSA with stronger tools for analyzing both crashes and violations. As in the crash-rate analysis in Section 4.2, it may not be feasible to try to isolate the impact of any particular program or effort on violation rates.
The most significant challenge is the presence of confounding factors. As in the crash-rate analysis, motor carrier behavior and, therefore, RI violation rates, can be influenced by other FMCSA programs and activities; efforts by other government agencies; geographic, economic, and time-period distinctions; and the behavior of non-CMV drivers on the road. If the impact of external factors is not effectively controlled, it is not possible to isolate the influence of a particular program.
Another challenge is that RIs are conducted for a variety of reasons. Some take place when a vehicle is pulled over by a police patrol because of an observed moving violation, others are conducted on vehicles registered with carriers targeted for inspections, and still others are performed on vehicles chosen randomly. Even after controlling for inspection level (1 through 5), the expectation is that citations generated by random inspections will yield different results than those generated by targeted inspections or due to moving violations such as speeding. Inspections of vehicles pulled over due to moving violations can be expected to yield higher rates of certain types of violations compared with random inspections; inspections of vehicles registered to a targeted carrier can be expected to yield higher violation rates if the carrier has not yet tried to improve and can be expected to yield lower violation rates if it has. While the evaluation team anticipated variation within these three categories of inspections, the available data were insufficient to allow effective differentiation among them. This makes it difficult to construct motor carrier violation rates that meaningfully reflect State-level motor carrier safety.
The vast majority of carriers are not regularly subject to PRISM-invoked sanctions, and any influence that the program may have on carrier behavior may not be discernible at the State or multistate level.
Despite these challenges, OOS violation rates are an important measure of motor carrier safety behavior and a potential measure of FMCSA program impacts. This analysis included several
Research Findings: Driver and Vehicle OOS Violation Rates Key question: Do carriers in PRISM
states have lower RI OOS violation rates than carriers in non-PRISM states?
Challenge: Isolating the impact of any particular program or effort on violation rates.
Approach: - Calculate RI driver and vehicle
OOS violation rates. - Review RI OOS violation-rate
differences linked to state PRISM implementation.
Rationale: PRISM improves compliance with FMCSA safety regulations by employing sanctions against unsafe carriers.
Conclusion: Unable to demonstrate definitive relationship between PRISM and OOS violation rates.
August 2007 4-12

PRISM Program Evaluation
measures of motor carrier violation rates and attempted to identify associations between violation rates and PRISM implementation.
4.3.2 Analysis Approach The evaluation team used the following approach:
Calculate RI violation rates. Examine differences in RI violation rates that can be linked to State PRISM
implementation status.
Two types of violation rates were used:
Vehicle out-of-service (VOOS) rate:
For all vehicle RIs (levels 1, 2, and 5) recorded in MCMIS, by year, for vehicles whose carriers are domiciled in a given State:
VOOS rate = number of OOS inspections/total number of inspections where an OOS inspection is any inspection during which a vehicle OOS violation citation is recorded.
Driver out-of-service (DOOS) rate:
For all driver RIs (levels 1, 2, and 3) recorded in MCMIS, by year, for vehicles whose carriers are domiciled in a given State:
DOOS rate = number of OOS inspections/total number of inspections where an OOS inspection is any inspection during which a driver OOS violation citation is recorded.
Table 4-6 presents the numbers of vehicle inspections, VOOS inspections, and VOOS violation rates by carrier’s State of domicile for the years 2000 through 2005 on the basis of MCMIS data. Table 4-7 presents the numbers of driver inspections, DOOS inspections, and DOOS violation rates by carrier’s State of domicile for the same timeframe, also on the basis of MCMIS data.
4.3.3 Definition of a PRISM State (VOOS Rate Analysis) In this analysis, the definition of a PRISM State was the same as that used in the crash-rate analysis: a State that had implemented all major milestones of the PRISM program for a minimum of 12 months. This definition accounts for the potential impact on motor carrier safety and RI violation rates of all components of PRISM. It also allows for all PRISM program requirements, such as MCS-150 updating and vehicle registration sanctions, to be fully implemented across all carriers domiciled in a given State, which takes 12 months.
Figure 4-1 lists States that met the relevant PRISM State definition prior to 2005, the latest year included in the analysis, along with the dates that each State achieved full PRISM implementation status.
August 2007 4-13
PRISM Program Evaluation
4.3.4 Results Because only nine States had achieved and maintained full PRISM status, with five of these States having only met the required criteria in 2004, just prior to the final year of the analysis period, the potential for measuring the possible impacts of PRISM on RI violation rates was limited. The evaluation team compared two measures:
Violation rates between PRISM and non-PRISM States, by year. Changes in violation rates over time between States that have achieved full
PRISM status and those that had not.
Both types of comparisons were based on vehicle and driver RI violation rates.
August 2007 4-14

PRISM Program Evaluation
Table 4-6. Vehicle inspections, VOOS inspections, and VOOS violation rates, by carrier’s State of domicile20
20 Source: MCMIS, June 23, 2006, snapshot.
August 2007 4-15

PRISM Program Evaluation
Table 4-7. Driver inspections, DOOS inspections, and DOOS violation rates, by carrier’s State of domicile21
August 2007 4-16

P
21 Source: MCMIS, June 23, 2006, snapshot.
August 2007 4-17

PRISM Program Evaluation
4.3.4.1 PRISM versus Non-PRISM Violation Rates On the basis of the information presented in Table 4-6, Table 4-7, and Figure 4-1, Table 4-8 presents data on total vehicle and driver inspections, numbers of VOOS and DOOS inspections, and VOOS and DOOS violation rates for PRISM and non-PRISM States, by year. In any given year, States in transition—those that have implemented all key PRISM milestones but have not met these criteria for at least 12 months during the entire year—are excluded from both PRISM and non-PRISM groupings. Note that due to the rolling basis on which States achieve full PRISM implementation status, the States in the PRISM and non-PRISM groupings differ for each year, as reflected in Figure 4-1.
As shown in Table 4-8, from 2000 through 2002 both vehicle and driver OOS violation rates were lower each year for carriers domiciled in PRISM States than for those domiciled in non-PRISM States. Vehicle OOS violation rates for carriers domiciled in PRISM States were lower by 5.1, 3.9, and 9.1 percent, while driver violation rates were lower by 5.9, 7.2, and 4.6 percent. From 2003 through 2005, both vehicle and driver OOS violation rates were higher for carriers domiciled in PRISM States than for those domiciled in non-PRISM States. Vehicle OOS violation rates were higher by 6.5, 7.8, and 3.7 percent, while driver OOS violation rates were higher by 17.8, 13.3, and 1.6 percent.
Table 4-8. Total vehicle and driver inspections, VOOS and DOOS inspections, and VOOS and DOOS violation rates, by year and PRISM status
These findings do not suggest causality—that is, higher or lower PRISM-induced OOS violation rates. As noted in the crash-rate analysis in Section 4.2, PRISM is unlikely to have a negative impact on safety, and none of the findings suggesting a positive safety impact can be interpreted as implying a direct causal relationship. Rather, the findings identify observable associations
August 2007 4-18

PRISM Program Evaluation
between State PRISM status and OOS violation rates without accounting for other potential determinants.
In summary, the findings confirm the difficulty of measuring the impact of a program like PRISM on driver and vehicle OOS violation rates, as the program is related to RI violation rates only indirectly and in a different manner across States and across segments of the motor carrier industry. The conflicting findings for the early and later years in the analysis timeframe are inconclusive.
4.3.4.2 OOS Violation Rate Changes Over Time: Pre- and Post-PRISM Several non-PRISM factors that may influence motor carrier safety and RI violation rates could be specific to individual States. Examples include characteristics of State government and the relative size of the FMCSA division office in a State. One way to control for non-PRISM factors is to observe the impact of PRISM implementation on a State-by-State basis, comparing pre- and post-PRISM safety measures. This approach was used in Section 4.2 in relation to motor carrier crash rates. While it does not completely eliminate the problem of confounding factors, it provides a degree of control not possible in simple comparisons of violation rates between PRISM and non-PRISM States.
Figure 4-1 lists States that progressed from non-PRISM to PRISM status between 2000 and 2005. Pre- and post-PRISM violation rates for carriers domiciled in these States make it possible to observe changes that occurred during the period of transition from non-PRISM to PRISM status. These changes can then be compared, individually or in combination, with changes that may have occurred in States that did not have a change in PRISM status over the same time period. In addition to controlling for State-specific factors, a comparison of States that transitioned to full PRISM status with those that did not would add a second element of control for confounding factors and would eliminate the influence of relevant trends, such as economic growth or nationally implemented policies, which may have occurred at the national level.
Despite the benefits of measuring these changes over time in order to control for non-PRISM factors, limitations related to the ability to isolate PRISM’s impact on carrier safety are still highly relevant. These limitations are arguably more difficult to overcome for violation rates than for crash rates. There are no major questions of consistency in relation to what constitutes a crash. In contrast, RI violations are ultimately determined on the basis of human judgment despite FMCSA guidelines for conducting all roadside inspections consistently.
Table 4-9 confirms the magnitude of vehicle and driver OOS violation rates. In all pre- and post-PRISM comparisons, States that transitioned to full PRISM implementation had a higher increase in vehicle OOS violation rates than States that did not, suggesting that factors much more significant than the PRISM program affected these rates. Driver OOS violation rates yielded similarly inconclusive results. From 2000 to 2003, the change in the driver OOS violation rate for carriers domiciled in States that transitioned to full PRISM implementation was slightly lower than the change for carriers domiciled in the control group of States, dropping by 15.7 compared with 16.3 percent. From 2001 to 2004, the change in the driver OOS violation rate for carriers in the pre- to post-PRISM States was substantially greater than the change for carriers in the control group, with a reduction of 18.4 versus 12 percent. In the third period, 2002 to 2005, carriers in States transitioning to full PRISM implementation again had a smaller reduction in the driver OOS violation rate compared with the control group, dropping by 4.5 compared with 5.6 percent.
August 2007 4-19

PRISM Program Evaluation
Table 4-9. Changes in vehicle and driver OOS violation rates, pre- and post-PRISM implementation
4.3.5 Conclusion Due to the presence of confounding factors, the evaluation team was unable to isolate the individual effect of any one safety program on OOS violation rates and was also unable to state that there is a causal relationship between the OOS violation rates of carriers domiciled in PRISM and non-PRISM States. A year-by-year comparison of driver and vehicle OOS violation rates between carriers domiciled in PRISM and non-PRISM States detected an inconsistent relationship between State PRISM status and OOS violation rates.
An analysis of the same violation rates over time, using pre- and post-PRISM violation rates for carriers in States that had fully implemented PRISM by 2005, introduced a level of control for several confounding factors that was not possible in year-by-year comparisons across multiple States. The findings from this time-series analysis of individual States were inconclusive, failing to identify a credible and consistent association between State PRISM implementation and RI OOS violation rates.
2000 VOOS Rate
2003VOOS Rate
Abs. Change
Percent Change
2001VOOS Rate
2004VOOS Rate
Abs. Change
Percent Change
2002VOOS Rate
2005VOOS Rate
Abs. Change
Percent Change
Georgia 21.4 24.4 3 14.0% - - - - - - - -Maine - - - - 24.5 24.9 0.4 1.6% - - - -South Dakota - - - - 21.2 23.3 2.1 9.9% - - - -Connecticut - - - - - - - - 27.4 27.9 0.50 1.8%North Carolina - - - - - - - - 17.9 21.4 3.50 19.6%New Mexico - - - - - - - - 23.3 24.8 1.50 6.4%Ohio - - - - - - - - 21.1 22.7 1.60 7.6%Washington - - - - - - - - 21.3 20.1 -1.20 -5.6%
PRISM-Transitioned States 21.4 24.4 3 14.0% 22.3 24 1.7 7.6% 20.8 22.1 1.30 6.3%
All Other States 21.4 21 -0.4 -1.9% 21.4 21.8 0.4 1.9% 21.2 21.5 0.30 1.4%
2000 DOOS Rate
2003DOOS Rate
Abs. Change
Percent Change
2001DOOS Rate
2004DOOS Rate
Abs. Change
Percent Change
2002DOOS Rate
2005DOOS Rate
Abs. Change
Percent Change
Georgia 10.8 9.1 -1.7 -15.7% - - - - - - - -Maine - - - - 11.4 9.3 -2.1 -18.4% - - - -South Dakota - - - - 7.6 5.9 -1.7 -22.4% - - - -Connecticut - - - - - - - - 6.3 6 -0.30 -4.8%North Carolina - - - - - - - - 8.5 7.8 -0.70 -8.2%New Mexico - - - - - - - - 9.1 8.1 -1.00 -11.0%Ohio - - - - - - - - 7.4 6.5 -0.90 -12.2%Washington - - - - - - - - 3.7 4.5 0.80 21.6%
PRISM-Transitioned States 10.8 9.1 -1.7 -15.7% 8.7 7.1 -1.6 -18.4% 6.6 6.3 -0.30 -4.5%
All Other States 8 6.7 -1.3 -16.3% 7.5 6.6 -0.9 -12.0% 7.2 6.8 -0.40 -5.6%
2001 to 2004 Driver OOS Violations 2002 to 2005Driver Roadside Inspections (Level 1, 2, and 3)
Driver OOS Violations 2000 to 2003 Driver OOS Violations
Driver Roadside Inspections (Level 1, 2, and 3)
2000 to 2003 2001 to 2004 2002 to 2005Vehicle OOS
ViolationsVehicle OOS
ViolationsVehicle OOS
Violations
August 2007 4-20

PRISM Program Evaluation
5 PRISM IMPACTS: IMPROVEMENTS IN EFFICIENCY
5.1 BAR-CODE READER EFFICIENCY ANALYSIS PRISM assists States that are participating in the PRISM program with funding, obtaining and integrating bar-code readers into their CMV RIs. PRISM also provides guidance on placing two-dimensional AAMVA-compliant bar codes on CMV cab cards. This section evaluates the potential efficiencies gained through the use of bar-code readers to record data during CMV RIs.22
Identifying improvements in RI efficiencies attributed to a single factor is complicated by the presence of multiple confounding factors, such as the type of inspection, time of day, weather, and the nature and extent of any violations identified during the RI. All of these factors have the potential to impact the duration of RIs much more than does the use of bar-code readers. In lieu of an effective quantitative method to measure the time efficiencies of using bar-code readers, the evaluation team examined time efficiency qualitatively through interviews with State enforcement supervisory personnel.
5.1.1 Analysis Sample At the time of this analysis, seven States have implemented bar-code reader use extensively and eight have begun to test and deploy bar-code readers on a limited basis. For this analysis, the team obtained feedback from seven States at various levels of bar-code reader use: Arkansas, Iowa, Maine, Ohio, Utah, South Dakota, and Washington. Four of these States used PRISM funding to cover at least part of the bar-code reader costs. In one State, the initial batch of bar-code readers was not successfully integrated into use and non-PRISM funding was used to purchase a different model of reader.
All seven States trained their inspection personnel in the use and integration of bar-code readers into the RI inspection process and in the interfacing of bar-code readers with RI software. The training was conducted either independently or as part of regularly scheduled enforcement personnel training.
5.1.2 Results Five States successfully interfaced bar-code readers with RI software. Of these States, four reported an observable improvement in RI efficiency attributed to bar-code reader use. One State reported a time savings of under one minute per inspection, while the remaining three
22 Section 6.3 examines the relationship between bar-code readers and data quality.
Research Findings: Bar-Code-Reader Efficiency
Bar-code readers can reduce RI inspection time by up to 33 percent.
Seven States use bar-code readers extensively.
Technical issues: Bar codes not scanning, hardware/software malfunctions, wires/cables cumbersome in the field.
Key issue: Cab cards from different States are not all compatible with bar-code readers.
Solution: Two-dimensional AAMVA-compliant bar codes in all States or a national bar-code standard.
August 2007 5-1

PRISM Program Evaluation
States estimated savings of up to five minutes per inspection, reducing the duration of an average inspection by 33 percent, or about one-third.
Three States reported substantial technical problems with bar-code reader use. In one of these States, an estimated 75 percent of inspection personnel who had been provided with bar-code readers cited technical problems as the reason for not using the readers. Technical problems reported by these three States and several others included:
Cab cards and licenses from many States did not have a bar code that could be scanned correctly by the readers.
Software integration problems caused partial or missing data entry. Software and/or computers shut down when bar-code readers were used. Wires and cables made bar-code readers cumbersome to use during RIs.
There are opportunities for improving bar-code reader integration. Full deployment of two-dimensional AAMVA-compliant bar codes across the U.S. or implementation of an appropriate national bar-code standard would overcome this most widely cited limitation to bar-code reader use. Wireless technology would make bar-code readers easier to use, eliminating cumbersome cables that limit inspectors’ movements. Short-range wireless capability is one solution, allowing inspection personnel to move away from their vehicle and laptop to collect data and then return to the laptop for wireless data downloads from the bar-code reader.
Finally, the PRISM team should work closely with States on a case-by-case basis to resolve additional deployment and implementation problems with bar-code readers. Successful resolution of these issues would enhance the positive impact of the readers and improve their acceptance among State enforcement personnel.
5.1.3 Conclusion Based on feedback from State enforcement personnel contacted by the evaluation team, bar-code reader use increased the efficiency of conducting RIs. A few States experienced recurring problems that have yet to be resolved but most of these problems can be addressed. The one limitation reported across all States that were reviewed was that not all cab cards and licenses were compatible with the bar-code readers. This issue can be addressed by working with more States to implement the use of two-dimensional bar codes based on the national bar code standard developed jointly by the PRISM team and AAMVA.
Recommendation 9: Improve bar-code usability by ensuring a standard bar-code system is deployed nationwide.
August 2007 5-2

PRISM Program Evaluation
6 PRISM IMPACTS: IMPROVEMENTS IN DATA QUALITY/ EFFECTIVENESS
6.1 NON-MATCH CRASH AND INSPECTION RECORDS
This section examines the extent to which PRISM initiatives support improvements in data quality, which is essential in order to identify problem carriers and thus to further reduce large truck crashes.
The analysis in this section examines whether the PRISM program has an observable relationship with the quality of motor carrier identity information found in crash and inspection records. These records in MCMIS were assessed with regard to whether they could be successfully matched to a commercial motor carrier. Correctly matching records to a carrier enhances data quality by properly grouping records to their respective carriers. Unmatched records constitute a problem in that the information they contain gets lost from carrier-level analyses of MCMIS data.
6.1.1 Approach CMV crash and inspection records for vehicles operated by interstate carriers and intrastate hazmat carriers were downloaded from MCMIS by the evaluation team on March 31, 2006. In each record, the data field representing whether or not the record had been successfully matched to a carrier was examined.
The team used two approaches to evaluate the relationship between this field’s value and State PRISM status. First, a comparison was made between crash and inspection records that originated in PRISM and non-PRISM States, with a further breakdown according to whether or not each vehicle was registered in a PRISM State. Second, a comparison was made between PRISM State crash and inspection records associated with vehicles registered in the same State where the crash or inspection record originated, and crash and inspection records originating in non-PRISM States that were associated with vehicles registered in the same State. This allowed the team to determine not only the State in which a crash or inspection occurred but also whether the PRISM program had played a role in the registration of the vehicle. This distinction is important because PRISM impacts CMVs largely through sanctions triggered during vehicle registration.
6.1.1.1 PRISM versus Non-PRISM Status Using Vehicle’s State of Registration The vehicle’s State of registration was ascertained by information present in the crash and inspection records. The evaluation team grouped crash and inspection records as follows:
Crash and inspection records originating in PRISM States associated with vehicles registered in any PRISM State.
Research Findings: Non-Match Crash and Inspection Records PRISM improves success of
matching crash and violation records to USDOT numbers.
Crash- and inspection-record match rates based on state of vehicle registration from 2003 to 2005 are consistently higher for vehicles registered in PRISM States.
August 2007 6-1
PRISM Program Evaluation
Crash and inspection records originating in non-PRISM States associated with vehicles registered in any non-PRISM State.
This grouping ensured that crash and inspection records were distinguished not only by the PRISM status of the State in which they originated, but also by the PRISM status of the State in which the affected vehicle was registered.
For both types of comparisons, the percentage of crash and inspection records successfully matched to a carrier USDOT number was calculated as follows:
Number of records with CI_Status_Code field equal to “C” (complete) in a State, divided by total number of crash and inspection records in same State.
This rate was calculated separately for crashes and for inspections. The successful match rates for PRISM and non-PRISM States were then compared by year.
6.1.1.2 PRISM versus Non-PRISM Status Using Vehicles Registered in and out of State
The evaluation team grouped crash and inspection records as follows:
Records in PRISM States associated with vehicles registered in the same State in which the crash or inspection occurred.
Records in non-PRISM States associated with vehicles registered in the same State in which the crash or inspection occurred.
Similar to the approach in Section 6.1.1.1, this grouping ensured that records were identified not only by the PRISM status of the State in which the crash or inspection occurred, but also by the PRISM status of the State in which the associated vehicle was registered. Furthermore, this grouping removed confounding factors that may be introduced when the numbers of vehicles registered in multiple States are combined in the calculation of record match rates.
For both types of comparisons, the percentage of successfully matched records was calculated as follows:
Number of records with CI_Status_Code field equal to “C” (complete) in a State, divided by total number of crash and inspection records in same State.
This rate was calculated separately for crashes and for inspections. The rates for PRISM and non-PRISM States were then compared by year.
6.1.2 Definition of a PRISM State (Data Quality) For this analysis, a PRISM State was defined as a State that had been implementing the PRISM program-sanctioned IRP system safety-status check for at least 12 months. The 12-month criterion was added to ensure that all vehicles registered in a PRISM State had been subjected to the requirement since vehicles are registered annually. Figure 6-1 shows the timeframes in which PRISM-implementing States achieved this 12-month criterion. These dates were used to compare crash and inspection records in PRISM and non-PRISM States.
August 2007 6-2

PRISM Program Evaluation
Figure 6-1. Implementation of IRP system safety-status check as part of PRISM, by State
6.1.3 Results State of Vehicle Registration (Approach 1)
Table 6-1 shows match rates for crashes and inspections based on the vehicle’s State of registration. States are grouped as PRISM and non-PRISM States during 2003, 2004, and 2005,
Alabama
Arkansas
Arizona
Connecticut
Georgia
Iowa*
Maine
Minnesota
Nebraska
New Mexico
North Carolina
Ohio
South Carolina
South Dakota
Tennessee
Utah
Vermont
Washington
West Virginia
One year registration cycle Safety-status check fully implemented
* Iowa achieved full PRISM status in 1995.
20052002 2006State 2001 2003 2004
August 2007 6-3

PRISM Program Evaluation
allowing a full 12-month registration cycle to be completed before a State is categorized as a PRISM State. As shown in Table 6-1, most crashes and inspections were successfully matched to a valid motor carrier between 2003 and 2005. The crash match rates are higher by a difference of 7.16, 5.29, and 0.47 percentage points in PRISM States than in non-PRISM States for 2003, 2004 and 2005, respectively. Similarly, match rates for inspections are higher by 1.66, 1.42, and 0.96 percentage points in PRISM States during the same years. While these differences appear small, they represent a substantial proportion of the unmatched crash and inspection records in each year. Thus, for example, for the crash records match rate for 2003, the difference of 7.16 percent shown between the PRISM States and non-PRISM States represents about 41.1 percent of the 17.41 percent of all crash records in the non-PRISM States that could not be matched with a valid USDOT number for that year. Appendix H lists crash and inspection match rates, by State, using this approach.
Table 6-1. Crash and inspection match rates, based on State of vehicle registration
Vehicles Registered in and out of State (Approach 2)
Table 6-2 shows match rates for crashes and inspections according to whether vehicles were registered in or out of State. Similar to Approach 1, States are grouped as PRISM or non-PRISM States during 2003, 2004, and 2005, allowing a full 12-month registration cycle to be completed in each PRISM State. Also similar to Approach 1, the vast majority of both crashes and inspections were successfully matched to a valid motor carrier during the analysis timeframe. Also consistent with the results in Approach 1, both crash and inspection match rates were higher in PRISM States than in non-PRISM States during the same years. The match rates for crashes are higher by a difference of 10.82, 7.14, and 2.66 percentage points in PRISM States than in non-PRISM States for 2003, 2004, and 2005, respectively. The match rates for inspections are higher by a difference of 4.25, 2.78, and 2.46 percentage points in PRISM States during the same years. Appendix I lists crash and inspection match rates, by State, using this approach.
2003 2004 2005Crashes
PRISM States 89.76% 90.37% 88.28%Non-PRISM States 82.59% 85.09% 87.80%Difference 7.16% 5.29% 0.47%
InspectionsPRISM States 98.55% 97.96% 97.84%Non-PRISM States 96.89% 96.54% 96.89%Difference 1.66% 1.42% 0.96%
August 2007 6-4

PRISM Program Evaluation
Table 6-2. Crash and inspection match rates, based on vehicles registered in and out of State
6.1.4 Conclusion Between 2003 and 2005, most crash and inspection records were successfully matched to a motor carrier and there was an overall improvement in match rates. The evaluation team compared match rates impacted by PRISM between 2003 and 2005 with use of two approaches. In Approach 1, match rates of crash and inspection records originating in PRISM States for vehicles registered in PRISM States were compared with those of crash and inspection records originating in non-PRISM States for vehicles registered in non-PRISM States. In Approach 2, match rates of crash and inspection records originating in PRISM States for vehicles registered in the same State were compared with those of records originating in non-PRISM States for vehicles registered in the same State.
Both approaches showed a consistently higher match rate for crash and violation records originating in PRISM States, demonstrating a positive association between PRISM implementation and the successful matching of crash and violation records to motor carriers.
6.2 MCS-150 UPDATE ANALYSIS The MCS-150 Motor Carrier Identification Report identifies motor carriers that are subject to the Federal Motor Carrier Safety Regulations and the Hazardous Materials Regulations. The mandatory form is required by 49 CFR Part 385 and authorized by 49 USC 504 (1982) and Supplement III (1985). Carriers are required to file an MCS-150 form to obtain a USDOT number and to update the form when they cease to operate as a motor carrier. If a carrier’s USDOT number is revoked, it must file an MCS-150 form as part of the reapplication process for a new number.
Section 217, Periodic Re-filing of Motor Carrier Identification Reports of the Motor Carrier Safety Improvement Act of 1999, specifies, through 49 CFR Part 385.21, that carriers must update MCS-150 forms regularly. To comply with the Act, the FMCSA instituted a biennial update requirement for MCS-150 reports on January 1, 2001.
The PRISM program requires PRISM States to verify the current status of a carrier’s MCS-150 filing date prior to issuing an IRP vehicle registration renewal. The FMCSA considers an MCS-150 form current if it has been updated in MCMIS within the last 24 months. Inherent in the
2003 2004 2005Crashes
PRISM States 91.69% 91.56% 89.15%Non-PRISM States 80.88% 84.42% 86.48%Difference 10.82% 7.14% 2.66%
InspectionsPRISM States 97.39% 97.52% 97.76%Non-PRISM States 93.13% 94.74% 95.30%Difference 4.25% 2.78% 2.46%
Research Findings: MCS-150 Update Requirements
PRISM associated with more current MCS-150 reports.
Percentage of CMVs with no MCS-150 updates in MCMIS 16.9 percent lower in PRISM States than in non-PRISM States.
MCS-150 update rate higher in PRISM States than in non-PRISM States: 29.5 percent higher in 2003, 39.5 percent higher in 2004, 43 percent higher in 2005, and 42.8 percent higher in 2006.
Average number of days since last MCS-150 update 17.5 percent lower in PRISM States than in non-PRISM States: 543 vs. 658 days.
August 2007 6-5

PRISM Program Evaluation
PRISM program is the fact that carriers are charged with updating the MCS-150 form during the twelve months prior to the beginning of the new IRP registration year.
The purpose of this analysis was to determine whether there is a relationship between MCS-150 filing dates and State PRISM status.
6.2.1 Approach The evaluation team used two approaches. First, for each year from 2002 to 2006, the team compared the percentage of carriers in PRISM and non-PRISM States who had updated their MCS-150 forms in the past 12 months. Using a second approach, the evaluation team also compared the average length of time since the most recent updates in PRISM and non-PRISM States.
Both approaches are complicated by the fact that carriers are domiciled in a single State but may register their vehicles in other States in order to conduct business in a more efficient manner. PRISM States require motor carriers operating certain classes of CMVs to verify compliance with MCS-150 update guidelines when registering any vehicle, even if the carrier responsible for safety is domiciled in a non-PRISM State. Thus, the issue of where a motor carrier is domiciled versus where its vehicles are registered, first introduced in Section 2.2, may conceivably have an even greater impact on how the potential impacts of PRISM on MCS-150 are measured. However, due to the complexity of analyzing motor carriers vehicle by vehicle, this analysis uses carrier-level data aggregated at the State-of-domicile level.
The evaluation team realized that the requirement for updating the MCS-150 is 24 months, but in order to complete a meaningful analysis the team chose a12-month criteria, which accomplishes two goals: 1) provision of enough time to complete an entire registration period, and 2) increases the number of PRISM States with registration denial sanction authority for the purposes of the analysis. The analysis compares relative performance on a given date and does not attempt to analyze the number of carriers with outdated MCS-150s. Instead, the analysis attempts to determine if the MCS-150 forms of carriers domiciled in PRISM States are relatively more current than those in non-PRISM States. Due to the limitations of the data, the analysis essentially compares the relative status of PRISM and non-PRISM States, making no attempt to compute an “effectiveness score” or assign a value to PRISM’s contribution to safety in any given State.
Recommendation 10: The FMCSA should ensure that vehicle registration data are captured, in order to improve future analysis and enhance the Federal Government’s ability to determine the effectiveness of safety programs that impact the registration process.
6.2.1.1 Method 1: Percentage of Carriers Updating MCS-150 in Past Year This approach compared the percentage of carriers that had updated their MCS-150 forms in the past 12 months in States that met the definition of a PRISM State for the purpose of this analysis (discussed below) with the corresponding percentage in States that did not meet this definition. The evaluation team determined the number of active U.S. carriers for the analysis timeframe of January 2002 to June 2006 by using the December (i.e., last quarterly) snapshot of the MCMIS database for each year, except for 2006 for which the June snapshot was used. The evaluation
August 2007 6-6

PRISM Program Evaluation
team grouped carriers by State of domicile and calculated the percentage of carriers in each State that had updated their MCS-150 form during the 12 months prior to each year.23
New carriers who began operations less than 12 months prior to each year were excluded from the analysis because they must submit an MCS-150 form to become an active carrier. Because these carriers had already filed their MCS-150 information during the previous year, their inclusion might have biased the analysis.
6.2.1.2 Method 2: Average Time Since Last MCS-150 Update This approach compared carrier MCS-150 updates in PRISM and non-PRISM States on the basis of the average number of days since the most recent update. First, the team determined the number of active carriers by State of domicile, using the June 23, 2006 census table in the MCMIS database. It then calculated the number of days between the most recent MCS-150 update and June 23, 2006 for all carriers domiciled in a State. Finally, it compared the average number of days since the last MCS-150 update for PRISM and non-PRISM States.
A number of carriers in each State had no MCS-150 update date recorded. Although the team did not include these carriers in the calculation of MCS-150 average age, it evaluated them separately by determining their prevalence in each State and comparing PRISM and non-PRISM States.
6.2.2 Definition of a PRISM State (Bar-code Analysis) For this analysis, a PRISM State was defined as a State that had been implementing the PRISM program MCS-150 update requirement for at least 12 months. The 12-month criterion was added to ensure that all vehicles registered in a PRISM State had been subjected to the requirement. Figure 6-2 shows States that had introduced the PRISM MCS-150 update requirement 12 months before the end of calendar years 2002, 2003, 2004, and 2005 and before June 1, 2006. States that reached this PRISM milestone less than twelve months prior to the start of each year would still be expected to have authorized vehicle registrations to carriers without current MCS-150 data because some of these carriers would not yet have been exposed to the new annual requirement.
New carriers who began operations less than 12 months prior to each year were excluded from the analysis since they had already filed their MCS-150 information during the previous year and their inclusion might have biased the analysis.
6.2.3 Results Table 6-3 lists the total number of active carriers by State, number of MCS-150 updates during the previous 12-month period, and percentage of carriers who updated their MCS-150 forms during the previous 12-month period as of December 2002 through December 2005.
On the basis of information in Figure 6-2 and Table 6-3, Table 6-4 summarizes the total number of carriers and MCS-150 updates in PRISM and non-PRISM States and the percentage of carriers who updated their MCS-150 information during the 12-month period prior to December
23 MCMIS includes a reason code for each MCS-150 update. More than 95 percent of these updates are attributed to reason number 2, “Motor Carrier Identification Report (MCS-150).” Another PRISM-related reason is number 87, “PRISM Data Entry,” although further research by the evaluation team determined that this reason was rarely used, appearing in MCMIS only between September 3 and November 25, 2002. On the basis of these findings, the team included only MCS-150 updates associated with reasons 2 and 87.
August 2007 6-7

PRISM Program Evaluation
31 of each year (for 2006, the cutoff date was June 23). States that had been implementing this PRISM milestone for less than 12 months were not included in the calculations. PRISM States increased their MCS-150 update rate between 2002 and 2005, reaching 36 percent in 2005 and 2006.
As shown in Table 6-4, PRISM States had a higher MCS-150 update rate compared with non-PRISM States, with one exception. In 2002, only three States had been implementing the PRISM MCS-150 update requirement for at least 12 months; these States had a 45.5 percent lower MCS-150 update rate than did non-PRISM States. In the following three and a half years, with more States having implemented the MCS-150 update requirement under PRISM, the MCS-150 update rate was higher in PRISM States than in non-PRISM States: 29.5 percent higher in 2003, 39.5 percent higher in 2004, 43.0 percent higher in 2005, and 42.8 percent higher in June 2006.
Figure 6-2. States meeting the MS-150 update requirement
Alabama
Arizona
Connecticut
Georgia
Iowa
Louisiana
Maine
Minnesota
Nebraska
New Hampshire
New Mexico
North Carolina
Ohio
South Carolina
South Dakota
Tennessee
Utah
Vermont
Washington
West Virginia
2006
TOTAL STATES 3 6 10
State
19 20
2002 2003 2004 2005
August 2007 6-8

PRISM Program Evaluation
Table 6-3. Active carriers, by State, and MCS-150 updates for the timeframe 2002–2005
STATE
Total Active
Carriers
Carriers with
MCS150 Updates
% of Carriers Updated
Total Active
Carriers
Carriers with
MCS150 Updates
% of Carriers Updated
Total Active
Carriers
Carriers with
MCS150 Updates
% of Carriers Updated
Total Active
Carriers
Carriers with
MCS150 Updates
% of Carriers Updated
AK 717 93 12.97% 771 117 15.18% 801 150 18.73% 787 158 20.08%AL 11,392 1,088 9.55% 12,436 2,425 19.50% 12,521 3,188 25.46% 12,397 4,449 35.89%AR 9,668 881 9.11% 10,408 1,922 18.47% 10,452 2,072 19.82% 10,163 2,216 21.80%AZ 4,757 644 13.54% 5,525 1,124 20.34% 5,129 1,371 26.73% 5,547 1,495 26.95%CA 23,902 2,228 9.32% 28,132 4,997 17.76% 30,092 5,799 19.27% 31,632 6,792 21.47%CT 7,329 1,525 20.81% 8,040 1,975 24.56% 8,233 2,177 26.44% 8,301 2,938 35.39%DC 701 32 4.56% 711 86 12.10% 723 107 14.80% 738 112 15.18%DE 3,224 291 9.03% 3,436 646 18.80% 3,469 671 19.34% 3,551 771 21.71%FL 18,288 1,513 8.27% 21,002 3,416 16.27% 21,650 3,539 16.35% 22,165 3,972 17.92%GA 17,163 1,272 7.41% 19,186 4,462 23.26% 19,724 5,577 28.28% 20,309 6,424 31.63%HI 375 42 11.20% 398 103 25.88% 408 80 19.61% 394 105 26.65%IA 13,747 256 1.86% 14,320 4,919 34.35% 13,926 4,659 33.46% 13,670 6,738 49.29%ID 5,460 600 10.99% 5,806 1,242 21.39% 5,866 1,403 23.92% 5,824 1,503 25.81%IL 20,184 2,078 10.30% 21,646 5,225 24.14% 21,969 5,388 24.53% 22,453 6,386 28.44%IN 18,253 116 0.64% 19,199 4,414 22.99% 18,721 4,649 24.83% 18,501 5,510 29.78%KS 8,052 1,122 13.93% 8,996 2,160 24.01% 9,038 2,394 26.49% 9,002 2,689 29.87%KY 11,738 385 3.28% 13,288 4,333 32.61% 13,178 4,034 30.61% 12,899 4,722 36.61%LA 8,775 744 8.48% 9,435 1,621 17.18% 9,545 2,452 25.69% 9,549 2,472 25.89%MA 16,763 1,531 9.13% 17,611 3,534 20.07% 17,787 3,731 20.98% 17,870 3,968 22.20%MD 14,651 1,342 9.16% 16,375 3,476 21.23% 17,253 4,078 23.64% 18,267 4,549 24.90%ME 6,417 380 5.92% 6,715 2,274 33.86% 6,251 1,741 27.85% 5,972 2,391 40.04%MI 13,379 1,251 9.35% 14,043 3,100 22.08% 14,103 3,316 23.51% 14,124 3,698 26.18%MN 12,123 189 1.56% 13,268 3,313 24.97% 14,253 4,187 29.38% 14,854 5,921 39.86%MO 14,655 1,840 12.56% 15,507 3,817 24.61% 15,618 4,224 27.05% 15,760 5,399 34.26%MS 10,207 856 8.39% 11,078 1,925 17.38% 11,259 2,051 18.22% 11,425 2,228 19.50%MT 3,461 468 13.52% 3,986 1,011 25.36% 4,112 1,176 28.60% 4,156 1,279 30.77%NC 18,317 1,937 10.57% 20,482 6,366 31.08% 21,058 6,105 28.99% 21,100 8,051 38.16%ND 4,120 426 10.34% 4,408 1,181 26.79% 4,488 1,320 29.41% 4,530 1,482 32.72%NE 9,557 1,165 12.19% 10,489 2,801 26.70% 10,663 4,432 41.56% 10,763 4,871 45.26%NH 7,121 694 9.75% 7,446 1,606 21.57% 7,559 1,676 22.17% 7,631 1,858 24.35%NJ 20,338 1,791 8.81% 22,744 4,844 21.30% 23,048 4,351 18.88% 23,165 4,633 20.00%NM 3,590 371 10.33% 4,006 1,151 28.73% 4,185 1,532 36.61% 4,303 1,677 38.97%NV 2,852 287 10.06% 3,285 653 19.88% 3,457 788 22.79% 3,604 899 24.94%NY 19,732 1,782 9.03% 21,774 5,198 23.87% 23,063 4,722 20.47% 23,349 5,241 22.45%OH 15,281 1,926 12.60% 16,541 4,287 25.92% 16,809 6,163 36.66% 17,038 7,557 44.35%OK 8,284 856 10.33% 9,053 1,827 20.18% 9,111 1,947 21.37% 9,207 2,124 23.07%OR 8,793 1,102 12.53% 9,280 1,967 21.20% 9,394 2,067 22.00% 9,403 2,455 26.11%PA 27,796 162 0.58% 29,647 7,249 24.45% 29,626 6,840 23.09% 29,518 8,048 27.26%RI 4,910 405 8.25% 5,165 1,327 25.69% 5,212 1,233 23.66% 5,216 1,205 23.10%SC 8,617 907 10.53% 9,517 1,808 19.00% 9,566 2,072 21.66% 9,544 2,267 23.75%SD 4,611 1,765 38.28% 5,165 1,936 37.48% 5,255 2,590 49.29% 5,368 1,970 36.70%TN 16,176 2,200 13.60% 17,546 4,900 27.93% 17,390 4,510 25.93% 17,279 4,601 26.63%TX 24,186 2,287 9.46% 26,794 4,680 17.47% 27,534 5,105 18.54% 28,206 5,948 21.09%UT 4,736 532 11.23% 5,289 1,116 21.10% 5,533 1,631 29.48% 5,826 1,543 26.48%VA 13,426 1,302 9.70% 14,421 2,991 20.74% 14,689 3,206 21.83% 14,817 3,527 23.80%VT 3,049 360 11.81% 3,196 946 29.60% 3,187 1,077 33.79% 3,204 1,513 47.22%WA 9,862 1,068 10.83% 10,117 2,885 28.52% 9,241 3,537 38.28% 9,313 4,030 43.27%WI 10,345 1,300 12.57% 11,648 3,515 30.18% 11,927 3,711 31.11% 11,874 4,635 39.03%WV 7,107 700 9.85% 7,360 1,559 21.18% 7,289 1,669 22.90% 7,416 2,584 34.84%WY 2,914 374 12.83% 3,151 779 24.72% 3,140 840 26.75% 3,124 918 29.39%
Total 531,101 48,466 9.13% 579,842 135,209 23.32% 588,505 147,338 25.04% 595,108 172,522 28.99%
2002 2003 2004 2005
August 2007 6-9

PRISM Program Evaluation
Table 6-4. PRISM-associated differences in MCS-150 update rates
Note: This analytical snapshot compares how the rate of MCS-150 updates in PRISM States over 12 months compared to the rate in non-PRISM States. Thus, the 25.2 percent update for non-PRISM States in 2006 does not suggest that non-PRISM States are in violation of the FMCSA biennial MCS-150 update requirement 75 percent of the time. Rather, this rate says that on June 23, 2006, 25.2 percent of MCS-150 forms were less than 12 months old compared with 36 percent in PRISM States.
Table 6-5. Average number of days since MCS-150 update and percentage of carriers with no MCS-150 update
Total Carriers
MCS-150 Updates
MCS-150 Update Rate
Total Carriers
MCS-150 Updates
Update Rate
2002 3 37,327 1,908 5.1% 485,427 45,543 9.4% -45.5%2003 6 70,234 20,296 28.9% 475,504 106,135 22.3% 29.5%2004 10 107,069 33,438 31.2% 398,022 89,113 22.4% 39.5%2005 19 201,968 72,766 36.0% 385,724 97,172 25.2% 43.0%6/23/2006 20 209,384 75,350 36.0% 385,724 97,172 25.2% 42.8%
PRISM-Associated Difference in MCS-150 Update Rate
Number of PRISM States
PRISM States Non-PRISM States
August 2007 6-10

PRISM Program Evaluation
Table 6-5 lists the average number of days, by State, for all carriers since the last MCS-150 update as of June 23, 2006. Grouped by PRISM status, PRISM States exhibited a lower average number of days since the last MCS-150 update than did non-PRISM States: 543 compared with 658. Thus, the average number of days since the last MCS-150 update for PRISM States was 17.5 percent lower than that for non-PRISM States. Table 6-5 also lists the percentage of carriers in each State with no MCS-150 update date recorded in MCMIS as of June 23, 2006. Grouped by PRISM status, 17.2 percent of motor carriers in PRISM States had no MCS-150 update recorded compared with 20.7 percent in non-PRISM States. This finding does not indicate that PRISM States failed to enforce the requirement for 17.2 percent of motor carriers. Carriers without an MCS-150 update date could be in any one of three categories: (1) non-hazmat intrastate carriers who for some reason had a USDOT number, (2) carriers who did not register vehicles over 26,000 pounds in PRISM States since those vehicles are not subject to IRP registration, or (3) carriers domiciled in PRISM States who nevertheless did not register any vehicles in a PRISM State. Nonetheless, consistent with the rest of the results in this analysis, the PRISM-State rate for this measure was 16.9 percent lower than the non-PRISM-State rate, indicating that PRISM is associated with more up-to-date MCS-150 reports.
6.2.4 Conclusion The evaluation team found the PRISM MCS-150 update requirement to be having a positive impact on the timeliness of carrier MCS-150 form updates. Implementation of the PRISM MCS-150 update requirement was associated with more up-to-date MCS-150 reports based on the carrier’s State of domicile. This finding was consistent for both evaluation approaches – the percentage of carriers with current updates, and the average number of days since the most recent update.
August 2007 6-11
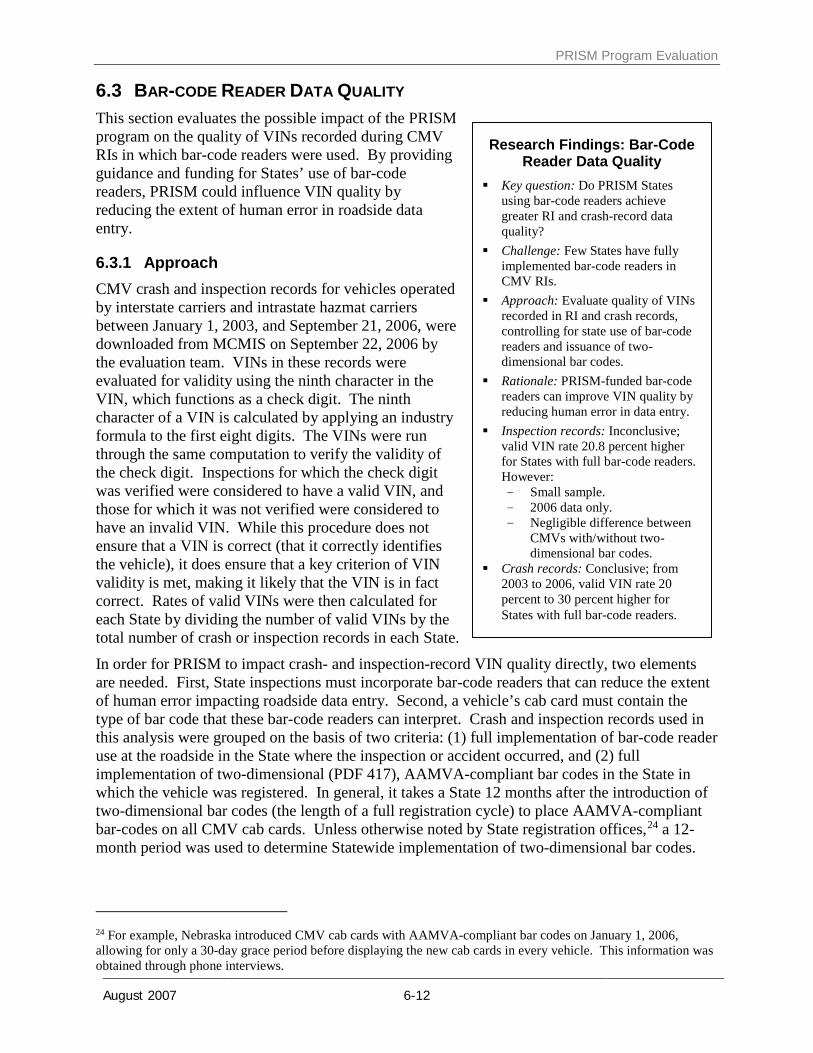
PRISM Program Evaluation
6.3 BAR-CODE READER DATA QUALITY This section evaluates the possible impact of the PRISM program on the quality of VINs recorded during CMV RIs in which bar-code readers were used. By providing guidance and funding for States’ use of bar-code readers, PRISM could influence VIN quality by reducing the extent of human error in roadside data entry.
6.3.1 Approach CMV crash and inspection records for vehicles operated by interstate carriers and intrastate hazmat carriers between January 1, 2003, and September 21, 2006, were downloaded from MCMIS on September 22, 2006 by the evaluation team. VINs in these records were evaluated for validity using the ninth character in the VIN, which functions as a check digit. The ninth character of a VIN is calculated by applying an industry formula to the first eight digits. The VINs were run through the same computation to verify the validity of the check digit. Inspections for which the check digit was verified were considered to have a valid VIN, and those for which it was not verified were considered to have an invalid VIN. While this procedure does not ensure that a VIN is correct (that it correctly identifies the vehicle), it does ensure that a key criterion of VIN validity is met, making it likely that the VIN is in fact correct. Rates of valid VINs were then calculated for each State by dividing the number of valid VINs by the total number of crash or inspection records in each State.
In order for PRISM to impact crash- and inspection-record VIN quality directly, two elements are needed. First, State inspections must incorporate bar-code readers that can reduce the extent of human error impacting roadside data entry. Second, a vehicle’s cab card must contain the type of bar code that these bar-code readers can interpret. Crash and inspection records used in this analysis were grouped on the basis of two criteria: (1) full implementation of bar-code reader use at the roadside in the State where the inspection or accident occurred, and (2) full implementation of two-dimensional (PDF 417), AAMVA-compliant bar codes in the State in which the vehicle was registered. In general, it takes a State 12 months after the introduction of two-dimensional bar codes (the length of a full registration cycle) to place AAMVA-compliant bar-codes on all CMV cab cards. Unless otherwise noted by State registration offices,24 a 12-month period was used to determine Statewide implementation of two-dimensional bar codes.
24 For example, Nebraska introduced CMV cab cards with AAMVA-compliant bar codes on January 1, 2006, allowing for only a 30-day grace period before displaying the new cab cards in every vehicle. This information was obtained through phone interviews.
Research Findings: Bar-Code Reader Data Quality
Key question: Do PRISM States using bar-code readers achieve greater RI and crash-record data quality?
Challenge: Few States have fully implemented bar-code readers in CMV RIs.
Approach: Evaluate quality of VINs recorded in RI and crash records, controlling for state use of bar-code readers and issuance of two-dimensional bar codes.
Rationale: PRISM-funded bar-code readers can improve VIN quality by reducing human error in data entry.
Inspection records: Inconclusive; valid VIN rate 20.8 percent higher for States with full bar-code readers. However: - Small sample. - 2006 data only. - Negligible difference between
CMVs with/without two-dimensional bar codes.
Crash records: Conclusive; from 2003 to 2006, valid VIN rate 20 percent to 30 percent higher for States with full bar-code readers.
August 2007 6-12

PRISM Program Evaluation
During the early stages of this evaluation, it became evident that very few States had fully implemented the use of bar-code readers in CMV RIs to date. Furthermore, several States had implemented bar-code readers with use of funding and guidance from programs other than PRISM. To incorporate as much of the data as possible into the evaluation, the team included States with bar-code readers introduced through both PRISM and other programs. Not only can the impact of PRISM-funded bar-code readers be evaluated in relation to the absence of bar-code reader use, it can also be assessed in relation to bar-code readers funded through these alternative programs.
The rate of valid VINs in States using bar-code readers was calculated as follows, by State:
Number of records with valid VINs for vehicles with two-dimensional bar codes, divided by total number of records for vehicles with two-dimensional bar codes.
The rate of valid VINs in States not using bar-code readers was calculated as follows, by State:
Number of records with valid VINs for vehicles without two-dimensional bar codes, divided by total number of records for vehicles without two-dimensional bar codes.
These rates were calculated separately for crashes and inspections. All CMVs registered in States that had fully implemented two-dimensional bar codes and had completed a full registration cycle or transition period were assumed to have such a bar code on their cab card.
6.3.2 Definition of a PRISM State For this analysis, a PRISM State was defined as a State that had fully implemented bar-code readers in CMV RIs and crash data entry. The evaluation team obtained dates when bar-code readers had been fully implemented in PRISM States through interviews with State enforcement personnel. It then compared VIN quality in crash and inspection records from these States with data in records from States that had not introduced bar-code readers. Crash and inspection records from States with partial use of bar-code readers to date were analyzed separately.25
Figure 6-3 lists States that attained full bar-code reader use, along with the date of implementation. Apart from the four States mentioned earlier as having only partial use of bar-code readers, States not listed in Figure 6-3 do not use bar-code readers to record VINs at the roadside.26
In addition to PRISM status in terms of bar-code reader use, the placement of two-dimensional bar codes on CMV cab cards is also central to this evaluation. Without such bar codes, bar-code readers do not have an advantage over alternative forms of data entry. Figure 6-4 lists States that have introduced AAMVA-compliant two-dimensional bar codes on their CMV cab cards. As noted in the legend, the gray bars represent a transition period, during which the new cab cards were introduced into the fleet of CMVs registered in each State. The black bars represent the period during which all CMVs registered in a State are assumed to have had the appropriate bar
25 States excluded from the analysis on this basis were Arkansas, Kentucky, Louisiana, Minnesota, North Dakota, Ohio, South Carolina, and Washington, all of which had begun but had not completed the introduction of bar-code readers for roadside data entry. 26 Since information on bar-code reader implementation was not available for Tennessee, that State was not included in this analysis.
August 2007 6-13

PRISM Program Evaluation
codes. States not listed in Figure 6-4 either do not issue cab cards with two-dimensional bar codes or their status could not be determined at the time of this analysis.
6.3.3 Results At the time of this evaluation, 2006 was the only year in which a handful of States had fully implemented use of bar-code readers for CMV roadside data collection. In prior years, Connecticut, Iowa, and Washington, D.C. all reported full bar-code reader implementation, but only Connecticut was using readers consistently to record VINs at the roadside. Data for Iowa, Washington, D.C., and Nebraska were not included in this analysis. State enforcement personnel in Iowa reported inconsistent procedures in recording VINs at the roadside, while in Washington, D.C., bar-code reader implementation was incomplete. Nebraska fully implemented bar-code readers in January 2006 but has not consistently recorded VINs since that time. With data from only one State, the sample was considered too small for conducting meaningful comparisons prior to 2006.
August 2007 6-14

PRISM Program Evaluation
Figure 6-3. Full bar-code reader implementation, by State
Source of funding for bar code readers: PRISM
Arkansas(1)
Kentucky
Louisiana(2)
Maine
Nebraska
Ohio(3)
South Carolina(4)
Utah
Washington(5)
Source of funding for bar code readers: Non-PRISM
Connecticut
Iowa(6)
Minnesota
North Dakota(7)
South Dakota
Source of funding for bar code readers: Currently Unknown
District of Columbia
Figure Legend: bar code readers fully implemented
Notes:(1) Arkansas had approximately 25% deployment as of October 2006, with plans to have full deployment by November 2007.(2) Louisiana has had 35% deployment since June 2005.(3) Ohio has had 50% deployment since May 2004.(4) South Carolina has had 85% deployment since July 2006.(5) Washington has had 60% deployment since approximately November 2003.(6) Iowa does not collect complete and consistent VIN data at the roadside.(7) North Dakota has had 35% deployment since February 2006, with plans to have full deployment by June 2007.
20052002 2006State 2000 2003 20042001
August 2007 6-15

PRISM Program Evaluation
Figure 6-4. State CMV cab cards with two-dimensional bar codes
Arkansas
Arizona
Connecticut
Georgia
Iowa(1)
Louisiana
Maine
Missouri
Nebraska(2)
New Hampshire
New Mexico
Ohio
South Carolina
South Dakota
Tennessee
Texas
Utah
Vermont(3)
Washington
West Virginia
Figure Legend: Registration Cycle / Transition Period Full implementation of compliant bar codes on cab cards
Notes:(1) Iowa implemented bar codes on cab cards beginning in December 1996.(2) In Nebraska, all vehicles issued cab cards with AAMVA-compliant bar codes in February 2006.(3) Vermont does issue AAMVA-compliant cab cards, however the date when these first started to be issued is unknown.
20052002 2006State 2003 20042001
August 2007 6-16

PRISM Program Evaluation
Table 6-6 lists valid VIN rates for inspection records in States with and without full use of bar-code readers in 2006, the only year for which the present data support such a comparison. The difference between the rates for States with and without bar-code readers represents the observed association between bar-code reader use in 2006 and VIN quality. In 2006, States using bar-code readers had a valid VIN rate 20.8 percent higher than States not using bar-code readers.
Table 6-6. Valid VIN rates for inspection records
Year
States with Bar-Code Readers (More Than 6
Months)* States with No
Bar-Code Readers
Difference Associated with Bar-code Reader
Use
2006 81.4% 67.4% 20.8%
* Excluding Connecticut, Washington, D.C., and Iowa.
These results should be interpreted with caution. First, only three States fully implemented bar-code readers prior to the start of the study period. Second, of those States, only Maine had substantially lower valid VIN rates prior to 2006. Finally, in 2006, this three-State group exhibited a negligible distinction between valid VIN rates for vehicles registered in States with and without two-dimensional bar codes: 81.4 versus 81.9 percent. In fact, the valid VIN rate was slightly higher for inspection records from States that did not place two-dimensional bar codes on cab cards.
Table 6-7 lists valid VIN rates for crash records in States with and without full use of bar-code readers from 2003 to 2006. Unlike States that enter VINs in inspection records, Iowa and Washington, D.C., record VINs in crash records, making it possible to compare data as far back as 2003. In the 2003 to 2005 time period, States with full bar-code reader use were Connecticut, Iowa, and Washington, D.C. The valid VIN rate in States with full use of bar-code readers was consistently between 20 and 30 percent higher than in States not using bar-code readers. Further investigation of the data supported this finding. First, States that had not fully implemented bar-code readers until 2006 had lower valid VIN rates in prior years (2003 through 2005). Second, States that had partially implemented bar-code readers by 2006 had a combined valid VIN rate of 73.5 percent, in between the rates for States with and without bar-code readers. While the direction of the relationship is consistent and robust, the magnitude of this finding should be interpreted with caution. For States using bar-code readers, the difference in valid VIN rates between vehicles registered in States that issue cab cards with two-dimensional bar codes and States that do not is much lower, between 3 and 7 percent.
Table 6-7. Valid VIN rates for crash records
Year
States with Bar-Code Readers (More Than 6
Months) States with No Bar-
Code Readers
Difference Associated with Bar-
code Reader Use 2003 76.7% 60.0% 27.7% 2004 81.0% 62.7% 29.3% 2005 78.7% 64.5% 22.0% 2006 83.0% 68.9% 20.5%
August 2007 6-17

PRISM Program Evaluation
6.3.4 Conclusion A review of inspection records did not provide a conclusive finding about the relationship between bar-code reader use and VIN data quality. A direct 2006 comparison revealed a valid VIN rate for States with full bar-code reader implementation that was 20.8 percent higher than that for States with no bar-code reader use. However, this observation was not supported by the remainder of available data and was based on a small sample of three States that were consistently using bar-code readers to record VINs in inspection records that year.
A review of crash records was more conclusive. VIN data quality was consistently between 20 and 30 percent higher for States with full bar-code reader implementation than for States with no bar-code readers from 2003 through 2006, and further trends in the data supported this finding. There was a positive and conclusive association between bar-code reader use and crash-record VIN data quality.
August 2007 6-18

PRISM Program Evaluation
7 CONCLUSIONS AND NEXT STEPS
7.1 PROGRAM ENVIRONMENT AND IMPLEMENTATION The PRISM program operates in a complex environment in which success depends on winning the trust of numerous agencies in every participating State. Although the program is 100 percent funded by the FMCSA, State transportation and CMV registration agencies have concerns about the heavy workload imposed by PRISM and conflicting priorities over time-consuming validation requirements. In States where multiple agencies issue CMV registrations and provide oversight, it is also challenging to balance political ramifications and complexities.
The FMCSA has signed PRISM grant agreements with more than 40 States by June 2006. At that time, 18 States had fully implemented all key PRISM milestones and at least three more were in the early stages of program implementation. Reasons cited by State agencies for not joining PRISM included difficulties in securing required State legislation and lobbying support, additional requirements related to technological interfaces introduced by PRISM, lack of IT resources, and a perception of insufficient funding. States in early stages of PRISM implementation also had concerns about long-term funding for program maintenance and enhancements.
The FMCSA issued $15.5 million in PRISM grants to 33 States through the end of fiscal year 2005, excluding pilot States. The total and average grant amounts are consistent with planned funding levels documented in the PRISM Pilot Project Demonstration report to Congress. States that have completely implemented all key PRISM milestones were able to do so without spending their entire grant amount.
Given these findings, the evaluation team does not believe there are any major flaws that limit PRISM implementation or effectiveness. The team did identify areas that could benefit from improvement, including a need for more regularly maintained program performance measures, better oversight of grantee activities, and more established procedures for States to secure long-term program maintenance and enhancement funding.
7.2 PROGRAM IMPACTS ON PRISM GOALS Using fatal, injury, and total CMV crash data to calculate annual motor carrier crash rates by State of domicile, the evaluation team identified a positive relationship between State PRISM status and CMV safety. This relationship was consistent in all time-series analyses based on State crash rates prior to and following full PRISM implementation.
A simpler comparison of crash rates between PRISM and non-PRISM States by year did not have the same controls for non-PRISM factors as the time-series comparisons. As expected, the evaluation team did not identify a positive relationship between State PRISM status and CMV
Major Recommendations and Next Steps
Acceleration of PRISM implementation.
Mandating PRISM in next department reauthorization.
Strengthen emphasis on technological advances, in particular adoption of two-dimensional bar codes and use of more effective and convenient bar-code readers.
Expand PRISM to all large trucks weighing more than 10,000 lbs.
Conduct periodic evaluations of PRISM program implementation and effectiveness based on the measures developed in this evaluation.
August 2007 7-1

PRISM Program Evaluation
safety using such a comparison. The team also found no evidence associating PRISM with improved driver or vehicle violation rates.
PRISM States have standard and efficient procedures for conducting safety checks on motor carriers at the time of vehicle registration. In a random check performed by the PRISM evaluation team, States correctly identified the safety status of 100 percent of carriers from a list presented by the evaluation team. However, the team also identified areas for improvement in registration denial efforts by examining the accuracy of PRISM target files and noting that a small number of vehicle registrations appeared to have been issued to OOS carriers in fully implemented PRISM States when they probably should not have been.
The evaluation team looked at potential improvements in safety program efficiency that can be attributed to roadside use of bar-code readers, a technology that PRISM supports and funds. Seven States use bar-code readers extensively, and eight other States have begun to test and deploy these devices on a limited basis. Bar-code readers reduce the time needed to conduct roadside inspections by one to five minutes, or about one-third the duration of an average inspection. The main impediment is that not all States’ cab cards are compatible with the readers. Full deployment of two-dimensional AAMVA-compliant bar codes across the U.S. or implementation of an appropriate national bar-code standard would improve bar-code reader integration. Wireless technology would also make bar-code readers easier to use.
PRISM has had a positive impact on motor carrier safety data quality in three important ways. First, PRISM States have achieved greater success in matching crash and inspection records to USDOT numbers than have non-PRISM States. Second, carriers domiciled in PRISM States have more up-to-date MCS-150 reports. Third, PRISM States using bar-code readers at the roadside have higher valid VIN rates than other States. Between 2003 and 2006, PRISM States had crash-record valid VIN rates 20 to 30 percent higher than those in non-PRISM States, and the valid VIN rate derived from 2006 roadside inspection data was 20.8 percent higher. While the magnitude of the latter finding may be overstated due to underlying data limitations, it appears statistically robust in nature.
7.3 RECOMMENDED NEXT STEPS PRISM’s positive association with motor carrier safety, safety program efficiency, and data quality is further enhanced by the program’s having stayed within budget. The evaluation team recommends that the FMCSA focus on accelerating PRISM implementation in remaining States. Within the confines of PRISM program authority, the PRISM team has spent considerable resources addressing many of the concerns of State agencies and other stakeholders. Continuing to address these concerns will facilitate further PRISM program implementation. Concurrently, The FMCSA should explore the potential for transforming PRISM into a mandated program as part of the next department reauthorization. Significant progress has been made in terms of program awareness throughout the country that, together with the findings of this evaluation that reveal measurable program benefits, would help secure remaining States’ support for and compliance with mandated PRISM implementation.
To maximize the effectiveness of PRISM, it is essential that the FMCSA provide improved oversight of grantee activities and further attention to long-term maintenance funding. In addition, expanding the use of innovative technologies, especially two-dimensional bar codes and next-generation bar-code readers, also has high potential to strengthen the program’s impacts. Finally, the FMCSA should consider expanding the PRISM program to all large trucks with a gross vehicle weight greater than 10,000 pounds that are regulated by the agency.
August 2007 7-2
PRISM Program Evaluation
Looking ahead, the evaluation team believes that many of the program’s benefits will be more apparent as PRISM implementation reaches more advanced stages across the U.S. As such progress is made, the PRISM program measures developed in this evaluation can be used to consistently track program impacts.
August 2007 7-3
PRISM Program Evaluation
August 2007 7-4