

Priori Data State of the (App) Union - July 2015
38
JULY 2015 STATE OF THE (APP) UNION www.prioridata.com @prioridata Patrick Kane Founder & CEO @pdkane
-
Upload
patrick-kane -
Category
Internet
-
view
565 -
download
1
Transcript of Priori Data State of the (App) Union - July 2015

JULY 2015
STATE OF THE (APP) UNION
www.prioridata.com@prioridata
Patrick KaneFounder & CEO@pdkane

Agenda1. Introduction2. Macro Trends in the App Store3. State-of-the-Top Charts4. A Rallying Cry for Berlin!5. Q&A

1.AN INTRODUCTION
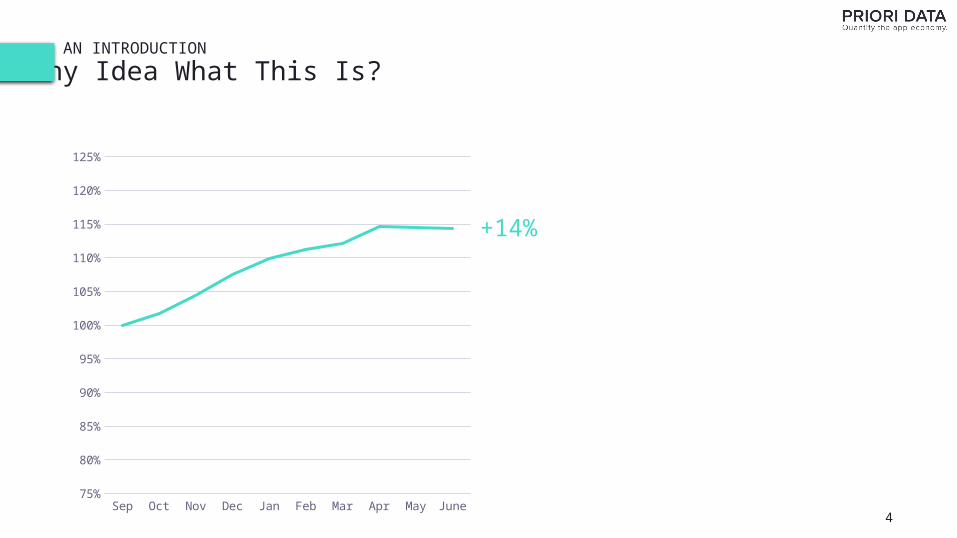
AN INTRODUCTION
Any Idea What This Is?
4
+14%
Sep Oct Nov Dec Jan Feb Mar Apr May June75%
80%
85%
90%
95%
100%
105%
110%
115%
120%
125%
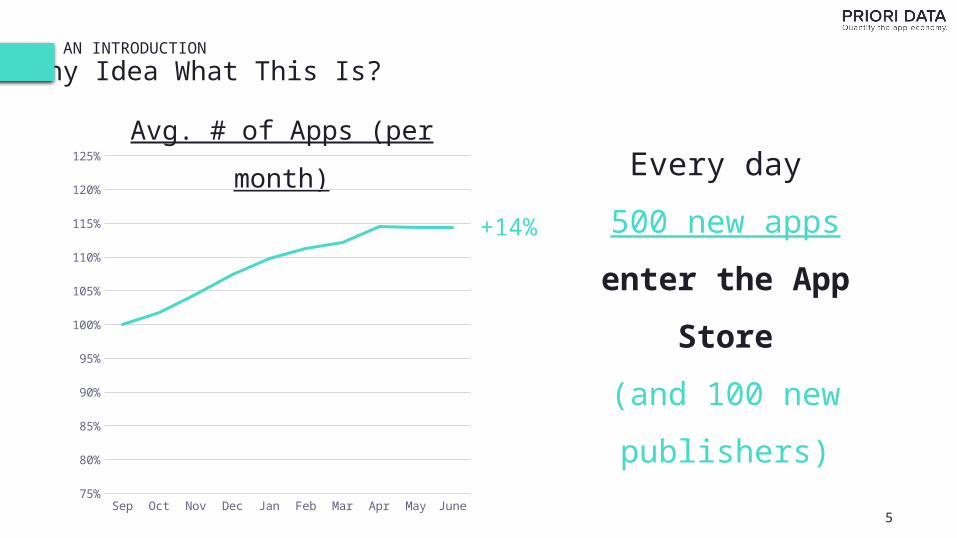
AN INTRODUCTION
Any Idea What This Is?
5
Every day
500 new apps
enter the App
Store
(and 100 new
publishers)
Avg. # of Apps (per month)
+14%
Sep Oct Nov Dec Jan Feb Mar Apr May June75%
80%
85%
90%
95%
100%
105%
110%
115%
120%
125%
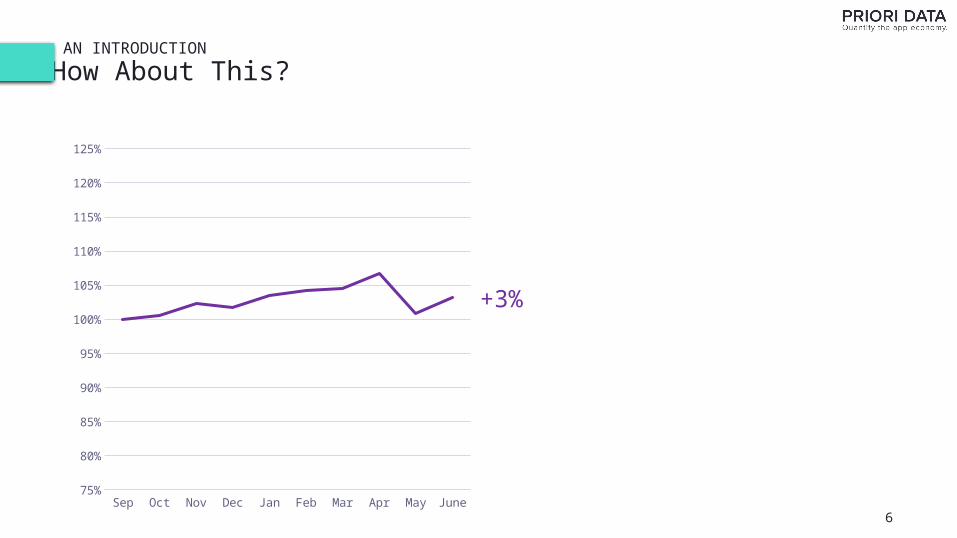
AN INTRODUCTION
How About This?
6Sep Oct Nov Dec Jan Feb Mar Apr May June
75%
80%
85%
90%
95%
100%
105%
110%
115%
120%
125%
+3%

AN INTRODUCTION
How About This?
7
Average Monthly
Downloads
are flat
Since Sep. 2014
Sep Oct Nov Dec Jan Feb Mar Apr May June75%
80%
85%
90%
95%
100%
105%
110%
115%
120%
125%
Avg. Monthly Downloads
+3%

AN INTRODUCTION
The Result is More Competition
8
+14%
More
(and higher quality)
Companies are
Fighting for the
Same Users
Increased Supply, Flat
Demand
+3%
Sep Oct Nov Dec Jan Feb Mar Apr May June75%
80%
85%
90%
95%
100%
105%
110%
115%
120%
125%
Avg. Monthly Downloads Avg. # of Apps

9
If there was ever a traditional App Store narrative of bright fluffy clouds…

…it is most definitely a thing of the past.
(except for about ~300 companies, more on that later)

2.WHAT WE ARE SEEING AT A MACRO LEVEL
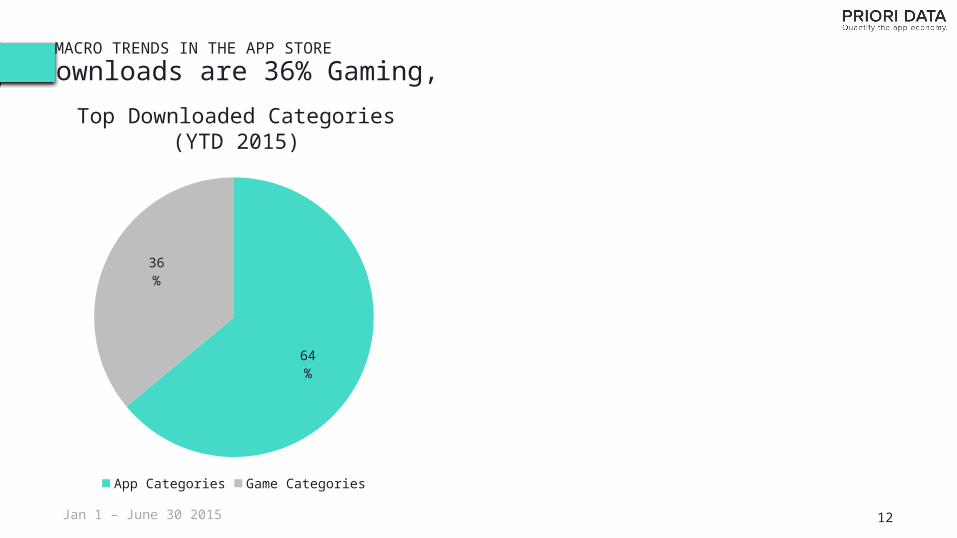
MACRO TRENDS IN THE APP STORE
Downloads are 36% Gaming,
12
Top Downloaded Categories(YTD 2015)
Jan 1 – June 30 2015
64%
36%
App Categories Game Categories

MACRO TRENDS IN THE APP STORE
Downloads are 36% Gaming, but Gaming most Volatile Growth
13
Top Downloaded Categories(YTD 2015)
Quarterly Download Growth by Category
(Q2 2015 vs. Q1 2015)
Jan 1 – June 30 2015
Top 5 Categories +12%
Bottom 5 Categories -8%
64%
36%
App Categories Game Categories
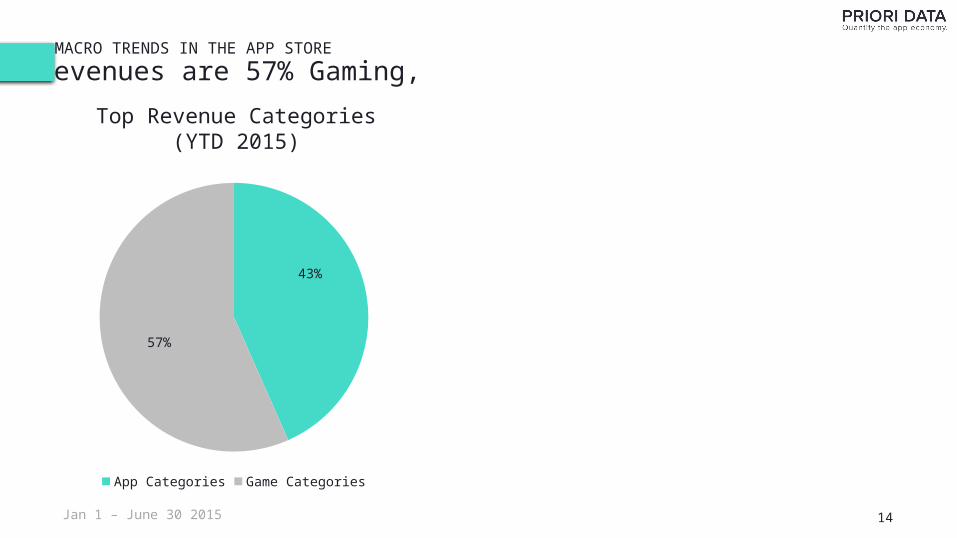
MACRO TRENDS IN THE APP STORE
Revenues are 57% Gaming,
14
Top Revenue Categories(YTD 2015)
43%
57%
App Categories Game Categories
Jan 1 – June 30 2015
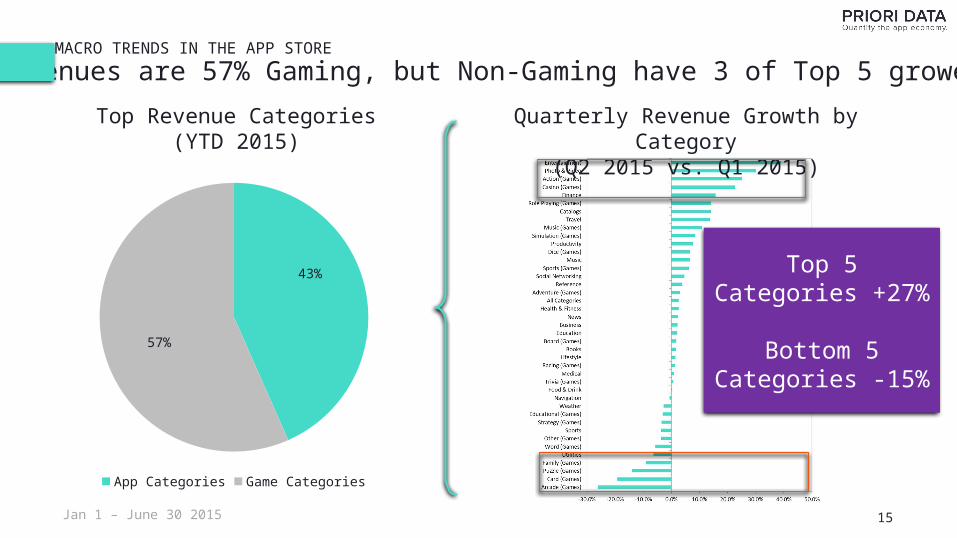
MACRO TRENDS IN THE APP STORE
Revenues are 57% Gaming, but Non-Gaming have 3 of Top 5 growers
15
Top Revenue Categories(YTD 2015)
Quarterly Revenue Growth by Category
(Q2 2015 vs. Q1 2015)
Top 5 Categories +27%
Bottom 5 Categories -15%
43%
57%
App Categories Game Categories
Jan 1 – June 30 2015
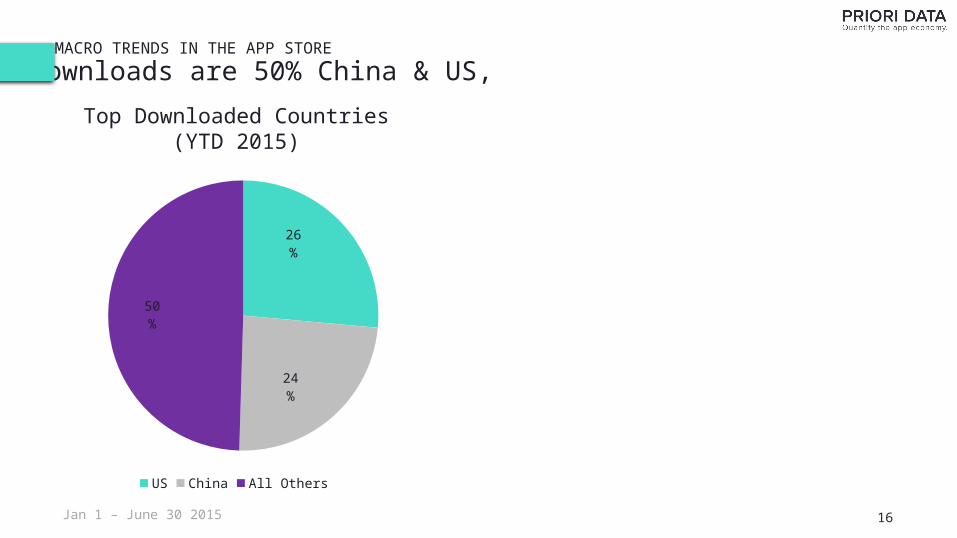
MACRO TRENDS IN THE APP STORE
Downloads are 50% China & US,
16
Top Downloaded Countries(YTD 2015)
Jan 1 – June 30 2015
26%
24%
50%
US China All Others

MACRO TRENDS IN THE APP STORE
Downloads are 50% China & US, but no country is growing >4%
17
Top Downloaded Countries(YTD 2015)
Quarterly Downloads by Country(Q2 2015 vs. Q1 2015)
Jan 1 – June 30 2015
Top 5 Countries
+3%
Bottom 5 Countries
-5%
26%
24%
50%
US China All Others
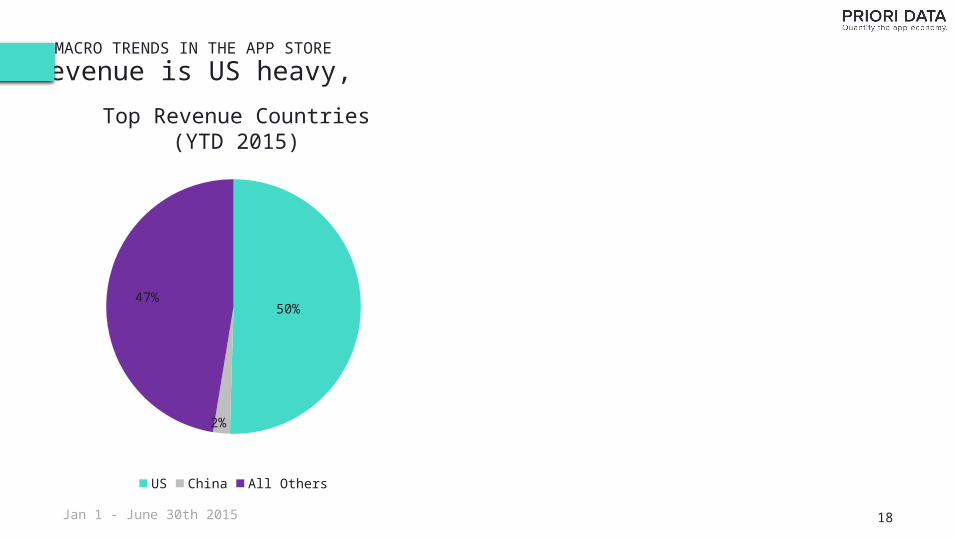
MACRO TRENDS IN THE APP STORE
Revenue is US heavy,
18
Top Revenue Countries(YTD 2015)
Jan 1 - June 30th 2015
50%
2%
47%
US China All Others

MACRO TRENDS IN THE APP STORE
Revenue is US heavy, Growth is Mixed Across Emerging/Developed
19
Top Revenue Countries(YTD 2015)
Quarterly Revenue by Country(Q2 2015 vs. Q1 2015)
Jan 1 - June 30th 2015
Top 5 Countries
+5%
Bottom 5 Countries
-3%
50%
2%
47%
US China All Others

MACRO TRENDS IN THE APP STORE
Some Things Change, Some Things Stay The Same...
20
• Revenue is growing faster than downloads in most categories, suggesting better monetization strategies and/or more consumer willingness to pay
• The United States is still the largest revenue market (by a factor of 4x), and Japan and the UK are both larger than China by revenue
• Demand growth (downloads and revenues) is no longer just geography specific. It is rather defined by consumer trends for certain types of apps in local geographic markets

And how does this distill to the individual publisher level?
MACRO TRENDS IN THE APP STORE
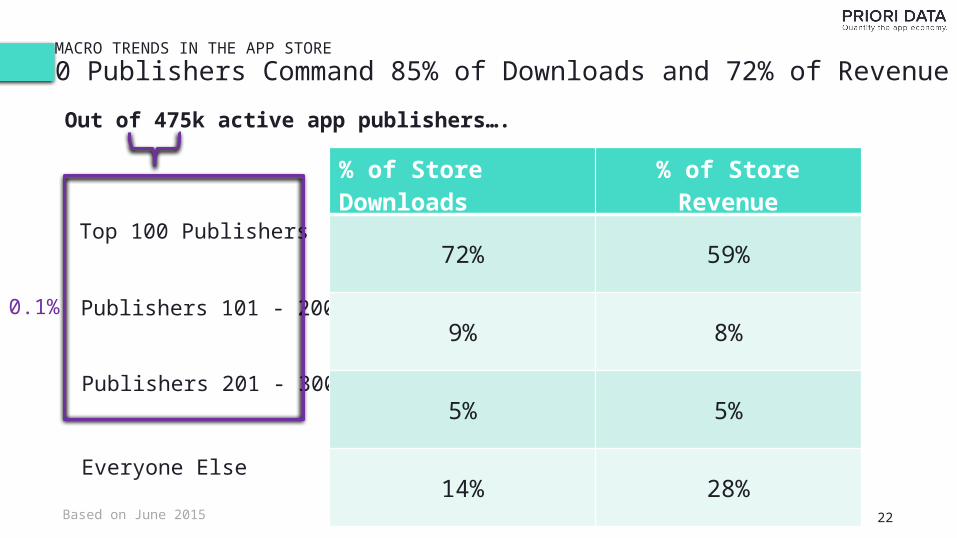
300 Publishers Command 85% of Downloads and 72% of Revenue
22
Top 100 Publishers
Publishers 101 - 200
Publishers 201 - 300
Everyone Else
% of Store Downloads
% of Store Revenue
72% 59%
9% 8%
5% 5%
14% 28%
Out of 475k active app publishers….
Based on June 2015
0.1%

3.STATE-OF-THE-TOP CHARTS

So we‘ve seen demand is flattening while app supply continues to
increase.
What‘s key to breaking through?

And how does this distill to the individual publisher level?
Visibility

26
STATE-OF-THE-TOP CHARTS
The PRIORI DATA Top Chart Framework
The three questions we ask to measure visibility (and success) of an app in the App Store Top Charts:
"Who gets in?""Where do they land?""How long do they stay?"

STATE-OF-THE-TOP CHARTS
Part 1: Who Gets In?
27
DE US GB0
50
100
150
200
250
300
350
400
186
97
180
115
194
123
301 291303
Series1 Free Charts Paid Charts
Daily # of New Apps in Top 200~300 New Apps
Achieve a Top 200 Category Position
Every Day.
Top 50 positions command ~85% of
all Category downloads.

STATE-OF-THE-TOP CHARTS
Part 2: Where do They Land?
28
Landing Ranks for New Apps
>150 [100,150] [50,100] [20,50)] <20
0%
10%
20%
30%
40%
50%
60%
51%
25%
14%
6%4%
27%24%
26%
16%
7%
Average Free App Average Paid App
Only 4% of free apps arrive in a Top
20 position
Paid apps are 2x as likely to appear in a Top 100 position vs.
free apps

STATE-OF-THE-TOP CHARTS
Part 3: How Long Do They Stay?
29
Average Length of Stay per New App
>2 weeks 1-2 weeks <1 week one day
0%
10%
20%
30%
40%
50%
60%
70%
80%
3%7%
41%
49%
1%3%
71%
25%
Average Free App Average Paid App
50% of new free apps are in and out of the charts within
1 day, and 90% within 1 week.
Only 4% of new apps last more
than 2 weeks in the charts. That’s 350 a month, globally.
STATE-OF-THE-TOP CHARTS
Implications for App Publishers
30
• Yes, new apps can claim space in the precious Top Charts.
• The core question is not whether you can get in, but rather how long you can last.
• Failure is expensive: UA costs continue to go up - FIKSU: $3 per install for free to play games.
• Do the research, set expectations right: There is no reason to be taken by surprise. Data can give you an indication as to your entry costs and ultimate market size.
• Data alone won’t do it. You need people who can phrase the right questions: What is our optimal rank, where is local demand for our niche app on the rise? What is the necessary budget to reach our goal?

So that‘s it? Pretty bleak outlook…

So that‘s it? Pretty bleak outlook…
Not entirely!
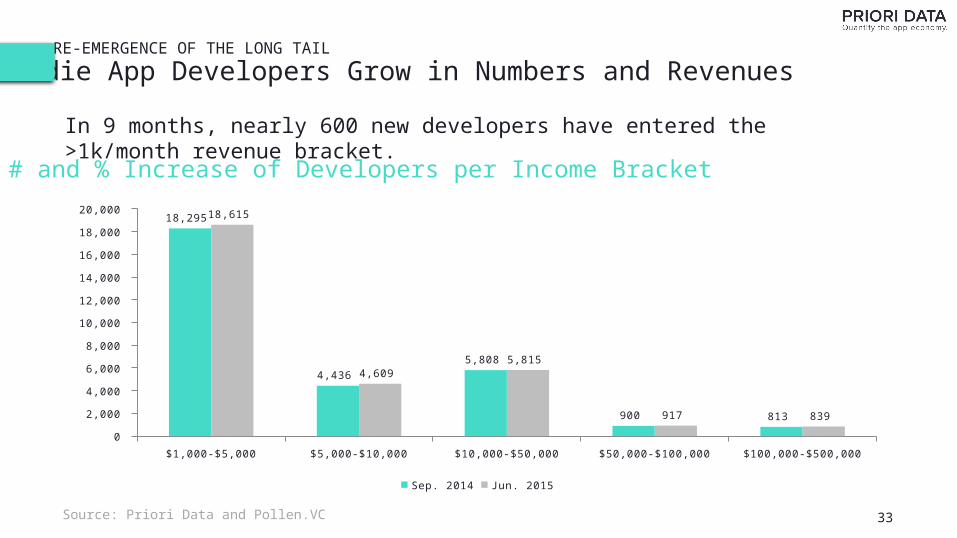
RE-EMERGENCE OF THE LONG TAIL
Indie App Developers Grow in Numbers and Revenues
33
In 9 months, nearly 600 new developers have entered the >1k/month revenue bracket.
# and % Increase of Developers per Income Bracket
Source: Priori Data and Pollen.VC
$1,000-$5,000 $5,000-$10,000 $10,000-$50,000 $50,000-$100,000 $100,000-$500,000
0
2,000
4,000
6,000
8,000
10,000
12,000
14,000
16,000
18,000
20,000 18,295
4,436
5,808
900 813
18,615
4,609 5,815
917 839
Sep. 2014 Jun. 2015

4.A RALLYING CRY FOR BERLIN!
A RALLYING CRY FOR BERLIN!
What We Believe
35
• The market imbalances we see are the consequence of flaws in the industry
• Lack of access to competitive benchmarking and market data perpetuates these imbalances
• Data itself is a commodity, but access to the data is unequal. Only companies with $$$$$$ can get access in today’s app economy
A RALLYING CRY FOR BERLIN!
We Are Changing The Status Quo
36
• We want to play a transformational role in breaking the barriers of exclusivity and “pay-to-play” models that are plaguing our industry.
• In the era of big data and the sharing economy, it is time for a new approach. We want to define it together with the leading mobile minds in Berlin.

5.Q&A